a bubble sheet report of student credit hours (sch) per
TRANSCRIPT

A "Bubble Sheet" Report of
Student Credit Hours (SCH) Per Faculty FTE
Cost ($) Per Student Credit Hour (SCH)
Research Expenditure ($) Per Tenure/Tenure Track (TTT) Faculty FTE
Compared to Delaware Instructional Cost Study Norms of:
1) highest degree awarded in the program of study, colored by
2) UNCG's self selected peers, official + Delaware participants, colored by
3) Research 2 Universities (R2), colored by
Office of Institutional Research & Analytics
University of North Carolina at Greensboro
October 2020
Oct. 2020 1 UNCG-IRA

UNCG_Average Delaware Ratio
Fall15-Fall19 Fall16-18 Ave UNCG_SCH /
CIP School Dept Name Dept SCH/FacFTE Norm_50Pct Delaware Norm
5.0201 AS African American and African Diaspora Studies AAD 407 224 182%
5.0207 AS Women and Gender Studies WGS 289 193 149%
9.0101 AS Communication Studies CST 237 225 105%
9.0102 AS Media Studies MST 284 225 126%
11.07 AS Computer Science CMP 199 230 87%
16.09 AS Languages, Literatures, and Cultures LLC 235 194 121%
16.12 AS Classical Studies CLA 482 205 236%
23.01 AS English ENG 208 175 119%
26.01 AS Biology BIO 326 255 128%
27.01 AS Mathematics and Statistics MTH 309 297 104%
38.01 AS Philosophy PHI 432 263 164%
38.02 AS Religious Studies REL 372 213 175%
40.05 AS Chemistry & Biochemistry CHE 353 265 133%
40.08 AS Physics & Astronomy PHY 261 201 130%
42.01 AS Psychology PSY 350 264 132%
45.02 AS Anthropology ATY 408 282 145%
45.07 AS Geography GEO 252 198 127%
45.1 AS Political Science PSC 218 223 98%
45.11 AS Sociology SOC 340 282 121%
50.041 AS Interior Architecture IAR 177 181 98%
54.01 AS History HIS 254 207 122%
11.09 BE Information Syst & Supply Chain Mgmt(Info_DLNM) IMS 386 299 129%
19.09 BE Consumer, Apparel, and Retail Studies (App_DLNM) CRS 329 235 140%
52.01 BE Management MNT 464 268 173%
52.03 BE Accounting and Finance (Acc_DLNM) ACF 440 284 155%
52.06 BE Economics ECO 418 277 151%
52.02 BE Mkting, Entre, Hosp, & Tourism(Mkt_DLNM) MRK 383 273 140%
13.03 ED Teacher Ed and Higher Ed HED 116 138 84%
13.04 ED Ed Ldrshp & Cult Found ELC 118 111 107%
13.06 ED Ed Research Methodology ERM 95 111 86%
UNCG Average Student Credit Hours (SCH) Per Faculty FTE Compared to Delaware Cost Study Norm ***
Oct. 2020 2 UNCG-IRA

UNCG_Average Delaware Ratio
Fall15-Fall19 Fall16-18 Ave UNCG_SCH /
CIP School Dept Name Dept SCH/FacFTE Norm_50Pct Delaware Norm
UNCG Average Student Credit Hours (SCH) Per Faculty FTE Compared to Delaware Cost Study Norm ***
13.1 ED Specialized Edu Services SES 134 119 113%
13.11 ED Counsel & Ed Development CED 160 137 116%
25.01 ED Library & Information Studies LIS 159 151 105%
19.07 HH Human Development & Family Studies HDF 257 209 123%
30.05 HH Peace and Conflict Studies PCS 193 198 97%
30.11 HH Gerontology GRO 45 198 23%
30.19 HH Nutrition NTR 285 172 165%
31.03 HH Community and Therapeutic Recreation CTR 287 201 143%
31.05 HH Kinesiology KIN 294 227 130%
44.07 HH Social Work SWK 206 177 117%
51.02 HH Communication Science & Disorders CSD 202 164 123%
51.02 HH Genetic Counseling GEN 84 159 53%
51.22 HH Public Health Education PHE 238 151 158%
40.99 NN Nanoscience/Nanoengineering JNN 61 201 31%
51.38 NU Nursing NUR 161 153 105%
50.03 VP Dance DCE 184 149 123%
50.05 VP Theatre THE 176 138 128%
50.07 VP Art ART 233 153 152%
50.09 VP Music MUS 135 114 118%
*** The norms are based on Delaware Study participating institutions that award the same level of degree.
Oct. 2020 3 UNCG-IRA

UNCG_Average Delaware Ratio
Fall15-Fall19 SelfSelectedPeers UNCG_SCH /
CIP School Dept Name Dept SCH/FacFTE Mean_StudyYr19 Delaware Norm
5.0201 AS African American and African Diaspora Studies AAD 407 239 170%5.0207 AS Women and Gender Studies WGS 289 239 121%9.0101 AS Communication Studies CST 237 234 101%
9.0102 AS Media Studies MST 284 234 122%11.07 AS Computer Science CMP 199 246 81%
16.09 AS Languages, Literatures, and Cultures LLC 235 191 123%16.12 AS Classical Studies CLA 482 191 252%
23.01 AS English ENG 208 198 105%26.01 AS Biology BIO 326 258 126%27.01 AS Mathematics and Statistics MTH 309 323 96%
38.01 AS Philosophy PHI 432 274 158%38.02 AS Religious Studies REL 372 274 136%
40.05 AS Chemistry & Biochemistry CHE 353 265 133%40.08 AS Physics & Astronomy PHY 261 246 106%42.01 AS Psychology PSY 350 293 119%
45.02 AS Anthropology ATY 408 282 145%45.07 AS Geography GEO 252 213 118%
45.1 AS Political Science PSC 218 218 100%
45.11 AS Sociology SOC 340 271 125%50.041 AS Interior Architecture IAR 177 164 108%54.01 AS History HIS 254 216 117%11.09 BE Information Syst & Supply Chain Mgmt(Info_DLNM) IMS 386 246 157%
19.09 BE Consumer, Apparel, and Retail Studies (App_DLNM) CRS 329 243 135%
52.01 BE Management MNT 464 300 155%
52.03 BE Accounting and Finance (Acc_DLNM) ACF 440 303 145%
52.06 BE Economics ECO 418 322 130%
52.02 BE Mkting, Entre, Hosp, & Tourism(Mkt_DLNM) MRK 383 312 123%13.03 ED Teacher Ed and Higher Ed HED 116 111 104%13.04 ED Ed Ldrshp & Cult Found ELC 118 121 98%13.06 ED Ed Research Methodology ERM 95 121 78%13.1 ED Specialized Edu Services SES 134 177 76%
UNCG Average Student Credit Hours (SCH) Per Faculty FTE Compared to Self-Selected Peers' Mean
Oct. 2020 4 UNCG-IRA

UNCG_Average Delaware Ratio
Fall15-Fall19 SelfSelectedPeers UNCG_SCH /
CIP School Dept Name Dept SCH/FacFTE Mean_StudyYr19 Delaware Norm
UNCG Average Student Credit Hours (SCH) Per Faculty FTE Compared to Self-Selected Peers' Mean
13.11 ED Counsel & Ed Development CED 160 130 123%25.01 ED Library & Information Studies LIS 159 151 105%
19.07 HH Human Development & Family Studies HDF 257 243 106%30.05 HH Peace and Conflict Studies PCS 193 198 97%
30.11 HH Gerontology GRO 45 198 23%
30.19 HH Nutrition NTR 285 172 165%31.03 HH Community and Therapeutic Recreation CTR 287 256 112%
31.05 HH Kinesiology KIN 294 256 115%44.07 HH Social Work SWK 206 194 106%
51.02 HH Communication Science & Disorders CSD 202 161 125%51.02 HH Genetic Counseling GEN 84 161 52%51.22 HH Public Health Education PHE 238 227 105%
40.99 NN Nanoscience/Nanoengineering JNN 61 201 31%51.38 NU Nursing NUR 161 165 98%
50.03 VP Dance DCE 184 164 112%
50.05 VP Theatre THE 176 164 107%
50.07 VP Art ART 233 167 140%50.09 VP Music MUS 135 116 116%
The self-selected peers were based on UNCG's official peers and the 2019 Delaware Instructional Cost Study participation:
Appalachian State University University of Missouri - Kansas City
Ball State University University of Missouri - St. Louis
Central Michigan University University of North Carolina at Charlotte
East Carolina University University of North Carolina at Wilmington
Florida Atlantic University University of North Florida
Kent State University University of Southern Mississippi
Middle Tennessee State University University of Toledo
Mississippi State University Wichita State University
North Carolina A&T State University Wright State University - Main Campus
Northern Illinois University
Oct. 2020 5 UNCG-IRA

UNCG_Average Delaware RatioFall15-Fall19 Reseaerch 2 UNCG_SCH /
CIP School Dept Name Dept SCH/FacFTE Norm_StudyYr19 Delaware R2 Norm
5.0201 AS African American and African Diaspora Studies AAD 407 248 164%5.0207 AS Women and Gender Studies WGS 289 248 116%9.0101 AS Communication Studies CST 237 227 105%9.0102 AS Media Studies MST 284 227 125%11.07 AS Computer Science CMP 199 248 80%16.09 AS Languages, Literatures, and Cultures LLC 235 184 128%16.12 AS Classical Studies CLA 482 220 219%23.01 AS English ENG 208 182 114%26.01 AS Biology BIO 326 250 130%27.01 AS Mathematics and Statistics MTH 309 323 96%38.01 AS Philosophy PHI 432 253 171%38.02 AS Religious Studies REL 372 221 168%40.05 AS Chemistry & Biochemistry CHE 353 251 141%40.08 AS Physics & Astronomy PHY 261 231 113%42.01 AS Psychology PSY 350 271 129%45.02 AS Anthropology ATY 408 233 175%45.07 AS Geography GEO 252 197 128%45.1 AS Political Science PSC 218 199 110%45.11 AS Sociology SOC 340 260 131%50.041 AS Interior Architecture IAR 177 155 114%54.01 AS History HIS 254 204 124%11.09 BE Information Syst & Supply Chain Mgmt(Info_DLNM) IMS 386 248 156%19.09 BE Consumer, Apparel, and Retail Studies (App_DLNM) CRS 329 234 140%52.01 BE Management MNT 464 284 163%52.03 BE Accounting and Finance (Acc_DLNM) ACF 440 269 164%52.06 BE Economics ECO 418 374 112%52.02 BE Mkting, Entre, Hosp, & Tourism(Mkt_DLNM) MRK 383 284 135%13.03 ED Teacher Ed and Higher Ed HED 116 131 89%13.04 ED Ed Ldrshp & Cult Found ELC 118 117 101%13.06 ED Ed Research Methodology ERM 95 117 81%13.1 ED Specialized Edu Services SES 134 177 76%13.11 ED Counsel & Ed Development CED 160 151 106%25.01 ED Library & Information Studies LIS 159 151 105%19.07 HH Human Development & Family Studies HDF 257 234 110%
UNCG Average Student Credit Hours (SCH) Per Faculty FTE Compared to Research 2 Institutions
Oct. 2020 6 UNCG-IRA

UNCG_Average Delaware RatioFall15-Fall19 Reseaerch 2 UNCG_SCH /
CIP School Dept Name Dept SCH/FacFTE Norm_StudyYr19 Delaware R2 Norm
UNCG Average Student Credit Hours (SCH) Per Faculty FTE Compared to Research 2 Institutions
30.05 HH Peace and Conflict Studies PCS 193 198 97%30.11 HH Gerontology GRO 45 198 23%30.19 HH Nutrition NTR 285 172 165%31.03 HH Community and Therapeutic Recreation CTR 287 237 121%31.05 HH Kinesiology KIN 294 237 124%44.07 HH Social Work SWK 206 175 118%51.02 HH Communication Science & Disorders CSD 202 155 130%51.02 HH Genetic Counseling GEN 84 155 54%51.22 HH Public Health Education PHE 238 198 120%40.99 NN Nanoscience/Nanoengineering JNN 61 201 31%51.38 NU Nursing NUR 161 161 100%50.03 VP Dance DCE 184 155 119%50.05 VP Theatre THE 176 155 114%50.07 VP Art ART 233 166 140%50.09 VP Music MUS 135 121 112%
The norms in the above table were based on the Research 2 institutions that participated in Delaware Instructional Cost Study in 2019:
Ball State University R2 Tennessee Technological University R2Boise State University R2 University of Alabama in Huntsville R2Central Michigan University R2 University of Idaho R2Clarkson University R2 University of Massachusetts - Dartmouth R2College of William & Mary R2 University of Missouri - Kansas City R2Colorado School of Mines R2 University of Missouri - St. Louis R2East Carolina University R2 University of Montana, The R2Florida Atlantic University R2 University of Nebraska at Omaha R2Kent State University R2 University of North Carolina at Charlotte R2Loyola University Chicago R2 University of North Carolina at Wilmington R2Miami University - Ohio R2 University of Rhode Island R2Missouri University of Science and Technology R2 University of Toledo R2Morgan State University R2 University of Vermont R2New Mexico State University - Main Campus R2 Wichita State University R2North Carolina A&T State University R2 Worcester Polytechnic Institute R2Northern Illinois University R2 Wright State University - Main Campus R2Rutgers University - Camden R2
Oct. 2020 7 UNCG-IRA

AS Dept Fall 2015-19 Average Student Credit Hours Per Faculty FTE Compared to Delaware 50 Percentile Norm (1)
CIP School Dept Name Dept UNCG_SCH/FacFTE Delaware_Norm UNCG_SCH / Norm Bub Size
5.0201 AS African American and African Diaspora Studies AAD 407 224 182% 407
5.0207 AS Women and Gender Studies WGS 289 193 149% 289
9.0101 AS Communication Studies CST 237 225 105% 237
9.0102 AS Media Studies MST 284 225 126% 284
11.07 AS Computer Science CMP 199 230 87% 199
16.09 AS Languages, Literatures, and Cultures LLC 235 194 121% 235
16.12 AS Classical Studies CLA 482 205 236% 482
Data Source: Delaware norms by highest degree and UNCG's Delaware Instructional Cost Analysis.
AAD, 407, 182%
WGS, 289, 149%
CST, 237, 105%
MST, 284, 126%
CMP,199, 87%
LLC, 235, 121%
CLA, 482, 236%
50%
100%
150%
200%
250%
300%
100 150 200 250 300 350 400 450 500 550
Per
cen
t o
f U
NC
G S
CH
s P
er F
acu
lty
as o
f D
elaw
are
No
rm
Fall 2015 - Fall 2019 Average SCHs Per Faculty FTE
AS Dept Fall 2015-19 Average Student Credit Hours Per Faculty FTE Compared to Delaware 50 Percentile Norm (1)
Oct. 2020 8 UNCG-IRA

AS Dept Fall 2015-19 Average Student Credit Hours Per Faculty FTE Compared to Self-Selected Peers' Mean (1)
CIP School Dept Name Dept UNCG_SCH/FacFTE SS_Peer_Mean UNCG_SCH/PMean Bub Size
5.0201 AS African American and African Diaspora Studies AAD 407 239 170% 407
5.0207 AS Women and Gender Studies WGS 289 239 121% 289
9.0101 AS Communication Studies CST 237 234 101% 237
9.0102 AS Media Studies MST 284 234 122% 284
11.07 AS Computer Science CMP 199 246 81% 199
16.09 AS Languages, Literatures, and Cultures LLC 235 191 123% 235
16.12 AS Classical Studies CLA 482 191 252% 482
Data Source: Delaware Cost Study and UNCG's Delaware Instructional Cost Analysis.
AAD, 407, 170%
WGS, 289, 121%
CST, 237, 101%
MST, 284, 122%
CMP,199, 81%
LLC, 235, 123%
CLA, 482, 252%
50%
100%
150%
200%
250%
300%
100 150 200 250 300 350 400 450 500 550
Per
cen
t o
f U
NC
G S
CH
s P
er F
acu
lty
as o
f Se
lf-S
elec
ted
Pee
rs' M
ean
Fall 2015 - Fall 2019 Average SCHs Per Faculty FTE
AS Dept Fall 2015-19 Average Student Credit Hours Per Faculty FTE Compared to Self-Selected Peers' Mean (1)
Oct. 2020 9 UNCG-IRA

AS Dept Fall 2015-19 Average Student Credit Hours Per Faculty FTE Compared to Research 2 Norms (1)
CIP School Dept Name Dept UNCG_SCH/FacFTE R2_Norm UNCG_SCH/R2Norm Bub Size
5.0201 AS African American and African Diaspora Studies AAD 407 248 164% 407
5.0207 AS Women and Gender Studies WGS 289 248 116% 289
9.0101 AS Communication Studies CST 237 227 105% 237
9.0102 AS Media Studies MST 284 227 125% 284
11.07 AS Computer Science CMP 199 248 80% 199
16.09 AS Languages, Literatures, and Cultures LLC 235 184 128% 235
16.12 AS Classical Studies CLA 482 220 219% 482
Data Source: Delaware Cost Study and UNCG's Delaware Instructional Cost Analysis.
AAD, 407, 164%
WGS, 289, 116%
CST, 237, 105%
MST, 284, 125%
CMP,199, 80%
LLC, 235, 128%
CLA, 482, 219%
50%
70%
90%
110%
130%
150%
170%
190%
210%
230%
250%
100 150 200 250 300 350 400 450 500 550
Per
cen
t o
f U
NC
G S
CH
s P
er F
acu
lty
as o
f R
2 N
orm
Fall 2015 - Fall 2019 Average SCHs Per Faculty FTE
AS Dept Fall 2015-19 Average Student Credit Hours Per Faculty FTE Compared to Research 2 Norms (1)
Oct. 2020 10 UNCG-IRA

AS Dept Fall 2015-19 Average Student Credit Hours Per Faculty FTE Compared to Delaware 50 Percentile Norm (2)
CIP School Dept Name Dept UNCG_SCH/FacFTE Delaware_Norm UNCG_SCH / Norm Bub Size
23.01 AS English ENG 208 175 119% 208
26.01 AS Biology BIO 326 255 128% 326
27.01 AS Mathematics and Statistics MTH 309 297 104% 309
38.01 AS Philosophy PHI 432 263 164% 432
38.02 AS Religious Studies REL 372 213 175% 372
40.05 AS Chemistry & Biochemistry CHE 353 265 133% 353
40.08 AS Physics & Astronomy PHY 261 201 130% 261
Data Source: Delaware norms by highest degree and UNCG's Delaware Instructional Cost Analysis.
ENG, 208, 119%
BIO, 326, 128%
MTH, 309, 104%
PHI, 432, 164%
REL,372, 175%
CHE, 353, 133%PHY, 261, 130%
50%
70%
90%
110%
130%
150%
170%
190%
210%
100 150 200 250 300 350 400 450 500
Per
cen
t o
f U
NC
G S
CH
s P
er F
acu
lty
as o
f D
elaw
are
No
rm
Fall 2015 - Fall 2019 Average SCHs Per Faculty FTE
AS Dept Fall 2015-19 Average Student Credit Hours Per Faculty FTE Compared to Delaware 50 Percentile Norm (2)
Oct. 2020 11 UNCG-IRA
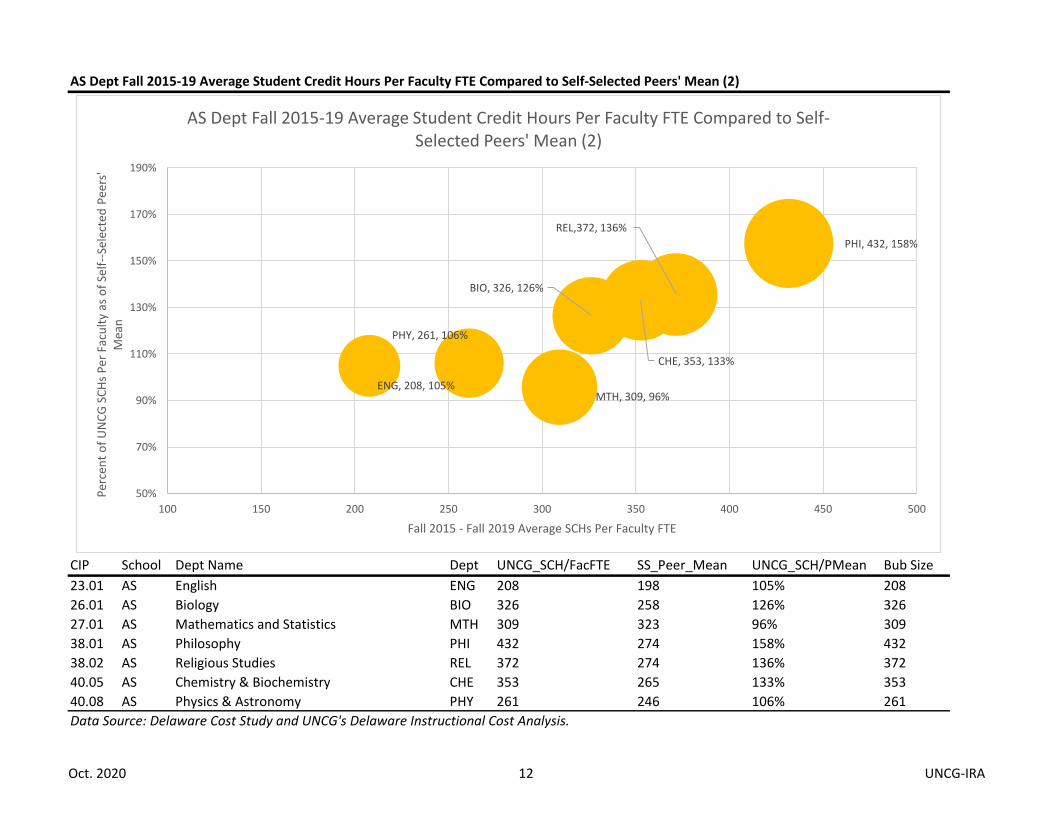
AS Dept Fall 2015-19 Average Student Credit Hours Per Faculty FTE Compared to Self-Selected Peers' Mean (2)
CIP School Dept Name Dept UNCG_SCH/FacFTE SS_Peer_Mean UNCG_SCH/PMean Bub Size
23.01 AS English ENG 208 198 105% 208
26.01 AS Biology BIO 326 258 126% 326
27.01 AS Mathematics and Statistics MTH 309 323 96% 309
38.01 AS Philosophy PHI 432 274 158% 432
38.02 AS Religious Studies REL 372 274 136% 372
40.05 AS Chemistry & Biochemistry CHE 353 265 133% 353
40.08 AS Physics & Astronomy PHY 261 246 106% 261
Data Source: Delaware Cost Study and UNCG's Delaware Instructional Cost Analysis.
ENG, 208, 105%
BIO, 326, 126%
MTH, 309, 96%
PHI, 432, 158%
REL,372, 136%
CHE, 353, 133%
PHY, 261, 106%
50%
70%
90%
110%
130%
150%
170%
190%
100 150 200 250 300 350 400 450 500
Per
cen
t o
f U
NC
G S
CH
s P
er F
acu
lty
as o
f Se
lf--
Sele
cted
Pee
rs'
Mea
n
Fall 2015 - Fall 2019 Average SCHs Per Faculty FTE
AS Dept Fall 2015-19 Average Student Credit Hours Per Faculty FTE Compared to Self-Selected Peers' Mean (2)
Oct. 2020 12 UNCG-IRA

AS Dept Fall 2015-19 Average Student Credit Hours Per Faculty FTE Compared to Research 2 Norms (2)
CIP School Dept Name Dept UNCG_SCH/FacFTE R2_Norm UNCG_SCH/R2Norm Bub Size
23.01 AS English ENG 208 182 114% 208
26.01 AS Biology BIO 326 250 130% 326
27.01 AS Mathematics and Statistics MTH 309 323 96% 309
38.01 AS Philosophy PHI 432 253 171% 432
38.02 AS Religious Studies REL 372 221 168% 372
40.05 AS Chemistry & Biochemistry CHE 353 251 141% 353
40.08 AS Physics & Astronomy PHY 261 231 113% 261
Data Source: Delaware Cost Study and UNCG's Delaware Instructional Cost Analysis.
ENG, 208, 114%
BIO, 326, 130%
MTH, 309, 96%
PHI, 432, 171%
REL,372, 168%
CHE, 353, 141%
PHY, 261, 113%
50%
70%
90%
110%
130%
150%
170%
190%
210%
100 150 200 250 300 350 400 450 500
Per
cen
t o
f U
NC
G S
CH
s P
er F
acu
lty
as o
f R
2 N
orm
Fall 2015 - Fall 2019 Average SCHs Per Faculty FTE
AS Dept Fall 2015-19 Average Student Credit Hours Per Faculty FTE Compared to Research 2 Norms (2)
Oct. 2020 13 UNCG-IRA

AS Dept Fall 2015-19 Average Student Credit Hours Per Faculty FTE Compared to Delaware 50 Percentile Norm (3)
CIP School Dept Name Dept UNCG_SCH/FacFTE Delaware_Norm UNCG_SCH / Norm Bub Size
42.01 AS Psychology PSY 350 264 132% 350
45.02 AS Anthropology ATY 408 282 145% 408
45.07 AS Geography GEO 252 198 127% 252
45.1 AS Political Science PSC 218 223 98% 218
45.11 AS Sociology SOC 340 282 121% 340
50.041 AS Interior Architecture IAR 177 181 98% 177
54.01 AS History HIS 254 207 122% 254
Data Source: Delaware norms by highest degree and UNCG's Delaware Instructional Cost Analysis.
PSY, 350, 132%
ATY, 408, 145%
GEO, 252, 127%
PSC, 218, 98%
SOC,340, 121%
IAR, 177, 98%
HIS, 254, 122%
50%
70%
90%
110%
130%
150%
170%
100 150 200 250 300 350 400 450 500
Per
cen
t o
f U
NC
G S
CH
s P
er F
acu
lty
as o
f D
elaw
are
No
rm
Fall 2015 - Fall 2019 Average SCHs Per Faculty FTE
AS Dept Fall 2015-19 Average Student Credit Hours Per Faculty FTE Compared to Delaware 50 Percentile Norm (3)
Oct. 2020 14 UNCG-IRA

AS Dept Fall 2015-19 Average Student Credit Hours Per Faculty FTE Compared to Self-Selected Peers' Mean (3)
CIP School Dept Name Dept UNCG_SCH/FacFTE SS_Peer_Mean UNCG_SCH/PMean Bub Size
42.01 AS Psychology PSY 350 293 119% 350
45.02 AS Anthropology ATY 408 282 145% 408
45.07 AS Geography GEO 252 213 118% 252
45.1 AS Political Science PSC 218 218 100% 218
45.11 AS Sociology SOC 340 271 125% 340
50.041 AS Interior Architecture IAR 177 164 108% 177
54.01 AS History HIS 254 216 117% 254
Data Source: Delaware Cost Study and UNCG's Delaware Instructional Cost Analysis.
PSY, 350, 119%
ATY, 408, 145%
GEO, 252, 118%
PSC, 218, 100%
SOC,340, 125%
IAR, 177, 108%
HIS, 254, 117%
50%
70%
90%
110%
130%
150%
170%
100 150 200 250 300 350 400 450 500
Per
cen
t o
f U
NC
G S
CH
s P
er F
acu
lty
as o
f Se
lf-S
elec
ted
Pee
rs' M
ean
Fall 2015 - Fall 2019 Average SCHs Per Faculty FTE
AS Dept Fall 2015-19 Average Student Credit Hours Per Faculty FTE Compared to Self-Selected Peers' Mean (3)
Oct. 2020 15 UNCG-IRA

AS Dept Fall 2015-19 Average Student Credit Hours Per Faculty FTE Compared to Research 2 Norms (3)
CIP School Dept Name Dept UNCG_SCH/FacFTE R2_Norm UNCG_SCH/R2Norm Bub Size
42.01 AS Psychology PSY 350 271 129% 350
45.02 AS Anthropology ATY 408 233 175% 408
45.07 AS Geography GEO 252 197 128% 252
45.1 AS Political Science PSC 218 199 110% 218
45.11 AS Sociology SOC 340 260 131% 340
50.041 AS Interior Architecture IAR 177 155 114% 177
54.01 AS History HIS 254 204 124% 254
Data Source: Delaware Cost Study and UNCG's Delaware Instructional Cost Analysis.
PSY, 350, 129%
ATY, 408, 175%
GEO, 252, 128%
PSC, 218, 110%
SOC,340, 131%
IAR, 177, 114%
HIS, 254, 124%
50%
70%
90%
110%
130%
150%
170%
190%
210%
100 150 200 250 300 350 400 450 500
Per
cen
t o
f U
NC
G S
CH
s P
er F
acu
lty
as o
f R
2 N
orm
Fall 2015 - Fall 2019 Average SCHs Per Faculty FTE
AS Dept Fall 2015-19 Average Student Credit Hours Per Faculty FTE Compared to Research 2 Norms (3)
Oct. 2020 16 UNCG-IRA
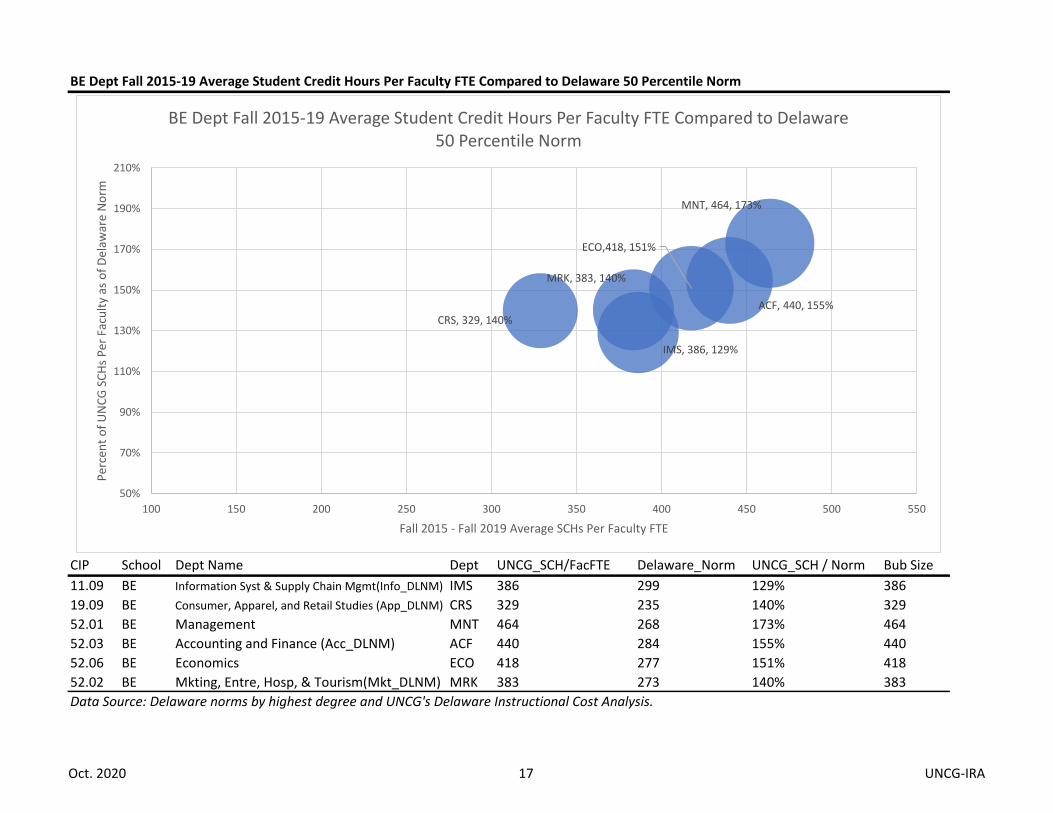
BE Dept Fall 2015-19 Average Student Credit Hours Per Faculty FTE Compared to Delaware 50 Percentile Norm
CIP School Dept Name Dept UNCG_SCH/FacFTE Delaware_Norm UNCG_SCH / Norm Bub Size
11.09 BE Information Syst & Supply Chain Mgmt(Info_DLNM) IMS 386 299 129% 386
19.09 BE Consumer, Apparel, and Retail Studies (App_DLNM) CRS 329 235 140% 329
52.01 BE Management MNT 464 268 173% 464
52.03 BE Accounting and Finance (Acc_DLNM) ACF 440 284 155% 440
52.06 BE Economics ECO 418 277 151% 418
52.02 BE Mkting, Entre, Hosp, & Tourism(Mkt_DLNM) MRK 383 273 140% 383
Data Source: Delaware norms by highest degree and UNCG's Delaware Instructional Cost Analysis.
IMS, 386, 129%
CRS, 329, 140%
MNT, 464, 173%
ACF, 440, 155%
ECO,418, 151%
MRK, 383, 140%
50%
70%
90%
110%
130%
150%
170%
190%
210%
100 150 200 250 300 350 400 450 500 550
Per
cen
t o
f U
NC
G S
CH
s P
er F
acu
lty
as o
f D
elaw
are
No
rm
Fall 2015 - Fall 2019 Average SCHs Per Faculty FTE
BE Dept Fall 2015-19 Average Student Credit Hours Per Faculty FTE Compared to Delaware 50 Percentile Norm
Oct. 2020 17 UNCG-IRA
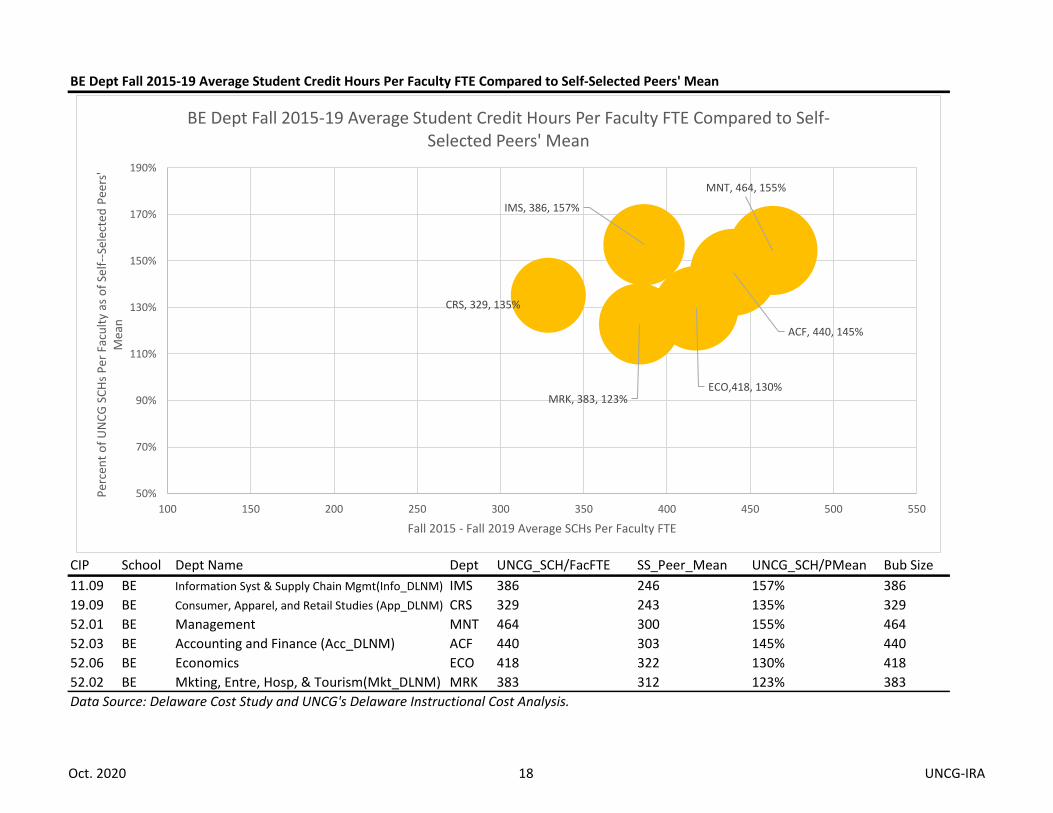
BE Dept Fall 2015-19 Average Student Credit Hours Per Faculty FTE Compared to Self-Selected Peers' Mean
CIP School Dept Name Dept UNCG_SCH/FacFTE SS_Peer_Mean UNCG_SCH/PMean Bub Size
11.09 BE Information Syst & Supply Chain Mgmt(Info_DLNM) IMS 386 246 157% 386
19.09 BE Consumer, Apparel, and Retail Studies (App_DLNM) CRS 329 243 135% 329
52.01 BE Management MNT 464 300 155% 464
52.03 BE Accounting and Finance (Acc_DLNM) ACF 440 303 145% 440
52.06 BE Economics ECO 418 322 130% 418
52.02 BE Mkting, Entre, Hosp, & Tourism(Mkt_DLNM) MRK 383 312 123% 383
Data Source: Delaware Cost Study and UNCG's Delaware Instructional Cost Analysis.
IMS, 386, 157%
CRS, 329, 135%
MNT, 464, 155%
ACF, 440, 145%
ECO,418, 130%MRK, 383, 123%
50%
70%
90%
110%
130%
150%
170%
190%
100 150 200 250 300 350 400 450 500 550
Per
cen
t o
f U
NC
G S
CH
s P
er F
acu
lty
as o
f Se
lf--
Sele
cted
Pee
rs'
Mea
n
Fall 2015 - Fall 2019 Average SCHs Per Faculty FTE
BE Dept Fall 2015-19 Average Student Credit Hours Per Faculty FTE Compared to Self-Selected Peers' Mean
Oct. 2020 18 UNCG-IRA

BE Dept Fall 2015-19 Average Student Credit Hours Per Faculty FTE Compared to Research 2 Norms
CIP School Dept Name Dept UNCG_SCH/FacFTE R2_Norm UNCG_SCH/R2Norm Bub Size
11.09 BE Information Syst & Supply Chain Mgmt(Info_DLNM) IMS 386 248 156% 386
19.09 BE Consumer, Apparel, and Retail Studies (App_DLNM) CRS 329 234 140% 329
52.01 BE Management MNT 464 284 163% 464
52.03 BE Accounting and Finance (Acc_DLNM) ACF 440 269 164% 440
52.06 BE Economics ECO 418 374 112% 418
52.02 BE Mkting, Entre, Hosp, & Tourism(Mkt_DLNM) MRK 383 284 135% 383
Data Source: Delaware Cost Study and UNCG's Delaware Instructional Cost Analysis.
IMS, 386, 156%
CRS, 329, 140%
MNT, 464, 163%
ACF, 440, 164%
ECO,418, 112%
MRK, 383, 135%
50%
70%
90%
110%
130%
150%
170%
190%
100 150 200 250 300 350 400 450 500 550
Per
cen
t o
f U
NC
G S
CH
s P
er F
acu
lty
as o
f R
2 N
orm
Fall 2015 - Fall 2019 Average SCHs Per Faculty FTE
BE Dept Fall 2015-19 Average Student Credit Hours Per Faculty FTE Compared to Research 2 Norms
Oct. 2020 19 UNCG-IRA

ED Dept Fall 2015-19 Average Student Credit Hours Per Faculty FTE Compared to Delaware 50 Percentile Norm
CIP School Dept Name Dept UNCG_SCH/FacFTE Delaware_Norm UNCG_SCH / Norm Bub Size
13.03 ED Teacher Ed and Higher Ed HED 116 138 84% 116
13.04 ED Ed Ldrshp & Cult Found ELC 118 111 107% 118
13.06 ED Ed Research Methodology ERM 95 111 86% 95
13.1 ED Specialized Edu Services SES 134 119 113% 134
13.11 ED Counsel & Ed Development CED 160 137 116% 160
25.01 ED Library & Information Studies LIS 159 151 105% 159
Data Source: Delaware norms by highest degree and UNCG's Delaware Instructional Cost Analysis.
HED, 116, 84%
ELC, 118, 107%
ERM, 95, 86%
SES, 134, 113%
CED,160, 116%
LIS, 159, 105%
50%
60%
70%
80%
90%
100%
110%
120%
130%
90 100 110 120 130 140 150 160 170 180
Per
cen
t o
f U
NC
G S
CH
s P
er F
acu
lty
as o
f D
elaw
are
No
rm
Fall 2015 - Fall 2019 Average SCHs Per Faculty FTE
ED Dept Fall 2015-19 Average Student Credit Hours Per Faculty FTE Compared to Delaware 50 Percentile Norm
Oct. 2020 20 UNCG-IRA

ED Dept Fall 2015-19 Average Student Credit Hours Per Faculty FTE Compared to Self-Selected Peers' Mean
CIP School Dept Name Dept UNCG_SCH/FacFTE SS_Peer_Mean UNCG_SCH/PMean Bub Size
13.03 ED Teacher Ed and Higher Ed HED 116 111 104% 116
13.04 ED Ed Ldrshp & Cult Found ELC 118 121 98% 118
13.06 ED Ed Research Methodology ERM 95 121 78% 95
13.1 ED Specialized Edu Services SES 134 177 76% 134
13.11 ED Counsel & Ed Development CED 160 130 123% 160
25.01 ED Library & Information Studies LIS 159 151 105% 159
Data Source: Delaware Cost Study and UNCG's Delaware Instructional Cost Analysis.
HED, 116, 104%
ELC, 118, 98%
ERM, 95, 78%
SES, 134, 76%
CED,160, 123%
LIS, 159, 105%
50%
60%
70%
80%
90%
100%
110%
120%
130%
140%
90 100 110 120 130 140 150 160 170 180
Per
cen
t o
f U
NC
G S
CH
s P
er F
acu
lty
as o
f Se
lf-S
elec
ted
Pee
rs' M
ean
Fall 2015 - Fall 2019 Average SCHs Per Faculty FTE
ED Dept Fall 2015-19 Average Student Credit Hours Per Faculty FTE Compared to Self-Selected Peers' Mean
Oct. 2020 21 UNCG-IRA

ED Dept Fall 2015-19 Average Student Credit Hours Per Faculty FTE Compared to Research 2 Norms
CIP School Dept Name Dept UNCG_SCH/FacFTE R2_Norm UNCG_SCH/R2Norm Bub Size
13.03 ED Teacher Ed and Higher Ed HED 116 131 89% 116
13.04 ED Ed Ldrshp & Cult Found ELC 118 117 101% 118
13.06 ED Ed Research Methodology ERM 95 117 81% 95
13.1 ED Specialized Edu Services SES 134 177 76% 134
13.11 ED Counsel & Ed Development CED 160 151 106% 160
25.01 ED Library & Information Studies LIS 159 151 105% 159
Data Source: Delaware Cost Study and UNCG's Delaware Instructional Cost Analysis.
HED, 116, 89%
ELC, 118, 101%
ERM, 95, 81%
SES, 134, 76%
CED,160, 106%
LIS, 159, 105%
50%
60%
70%
80%
90%
100%
110%
120%
90 100 110 120 130 140 150 160 170 180
Per
cen
t o
f U
NC
G S
CH
s P
er F
acu
lty
as o
f R
2 N
orm
Fall 2015 - Fall 2019 Average SCHs Per Faculty FTE
ED Dept Fall 2015-19 Average Student Credit Hours Per Faculty FTE Compared to Research 2 Norms
Oct. 2020 22 UNCG-IRA

HH Dept Fall 2015-19 Average Student Credit Hours Per Faculty FTE Compared to Delaware 50 Percentile Norm
CIP School Dept Name Dept UNCG_SCH/FacFTE Delaware_Norm UNCG_SCH / Norm Bub Size
19.07 HH Human Development & Family Studies HDF 257 209 123% 257
30.05 HH Peace and Conflict Studies PCS 193 198 97% 193
30.19 HH Nutrition NTR 285 172 165% 285
31.03 HH Community and Therapeutic Recreation CTR 287 201 143% 287
31.05 HH Kinesiology KIN 294 227 130% 294
44.07 HH Social Work SWK 206 177 117% 206
51.02 HH Communication Science & Disorders CSD 202 164 123% 202
51.02 HH Genetic Counseling GEN 84 159 53% 84
51.22 HH Public Health Education PHE 238 151 158% 238
Data Source: Delaware norms by highest degree and UNCG's Delaware Instructional Cost Analysis.
HDF, 257, 123%
PCS, 193, 97%
NTR, 285, 165%
CTR, 287, 143%
KIN, 294, 130%
SWK, 206, 117%
CSD, 202, 123%
GEN,84, 53%
PHE, 238, 158%
20%
40%
60%
80%
100%
120%
140%
160%
180%
200%
40 90 140 190 240 290 340Per
cen
t o
f U
NC
G S
CH
s P
er F
acu
lty
as o
f D
elaw
are
No
rm
Fall 2015 - Fall 2019 Average SCHs Per Faculty FTE
HH Dept Fall 2015-19 Average Student Credit Hours Per Faculty FTE Compared to Delaware 50 Percentile Norm
Oct. 2020 23 UNCG-IRA

HH Dept Fall 2015-19 Average Student Credit Hours Per Faculty FTE Compared to Self-Selected Peers' Mean
CIP School Dept Name Dept UNCG_SCH/FacFTE SS_Peer_Mean UNCG_SCH/PMean Bub Size
19.07 HH Human Development & Family Studies HDF 257 243 106% 257
30.0501 HH Peace and Conflict Studies PCS 193 198 97% 193
30.19 HH Nutrition NTR 285 172 165% 285
31.03 HH Community and Therapeutic Recreation CTR 287 256 112% 287
31.05 HH Kinesiology KIN 294 256 115% 294
44.07 HH Social Work SWK 206 194 106% 206
51.02 HH Communication Science & Disorders CSD 202 161 125% 202
51.0204 HH Genetic Counseling GEN 84 161 52% 84
51.22 HH Public Health Education PHE 238 227 105% 238
Data Source: Delaware Cost Study and UNCG's Delaware Instructional Cost Analysis.
HDF, 257, 106%
PCS, 193, 97%
NTR, 285, 165%
CTR, 287, 112%
KIN, 294, 115%
SWK, 206, 106%
CSD, 202, 125%
GEN,84, 52%
PHE, 238, 105%
20%
40%
60%
80%
100%
120%
140%
160%
180%
200%
40 90 140 190 240 290 340Per
cen
t o
f U
NC
G S
CH
s P
er F
acu
lty
as o
f Se
lf-S
elec
ted
Pee
rs'
Mea
n
Fall 2015 - Fall 2019 Average SCHs Per Faculty FTE
HH Dept Fall 2015-19 Average Student Credit Hours Per Faculty FTE Compared to Self-Selected Peers' Mean
Oct. 2020 24 UNCG-IRA
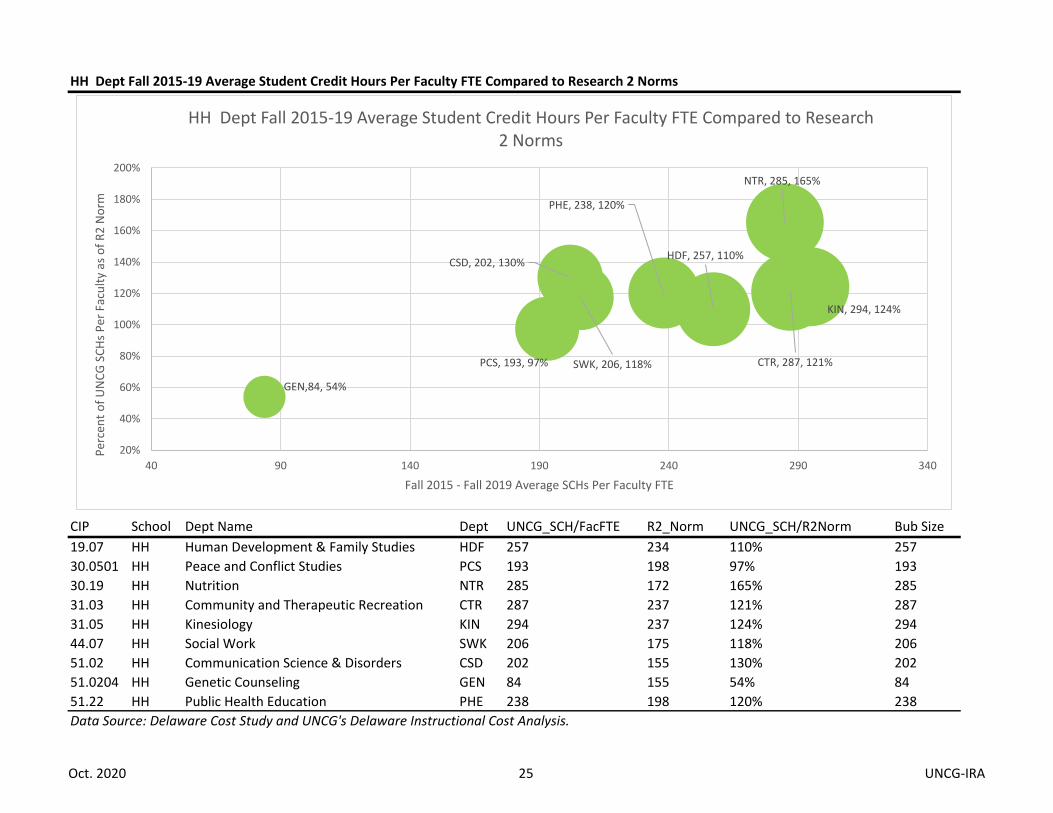
HH Dept Fall 2015-19 Average Student Credit Hours Per Faculty FTE Compared to Research 2 Norms
CIP School Dept Name Dept UNCG_SCH/FacFTE R2_Norm UNCG_SCH/R2Norm Bub Size
19.07 HH Human Development & Family Studies HDF 257 234 110% 257
30.0501 HH Peace and Conflict Studies PCS 193 198 97% 193
30.19 HH Nutrition NTR 285 172 165% 285
31.03 HH Community and Therapeutic Recreation CTR 287 237 121% 287
31.05 HH Kinesiology KIN 294 237 124% 294
44.07 HH Social Work SWK 206 175 118% 206
51.02 HH Communication Science & Disorders CSD 202 155 130% 202
51.0204 HH Genetic Counseling GEN 84 155 54% 84
51.22 HH Public Health Education PHE 238 198 120% 238
Data Source: Delaware Cost Study and UNCG's Delaware Instructional Cost Analysis.
HDF, 257, 110%
PCS, 193, 97%
NTR, 285, 165%
CTR, 287, 121%
KIN, 294, 124%
SWK, 206, 118%
CSD, 202, 130%
GEN,84, 54%
PHE, 238, 120%
20%
40%
60%
80%
100%
120%
140%
160%
180%
200%
40 90 140 190 240 290 340
Per
cen
t o
f U
NC
G S
CH
s P
er F
acu
lty
as o
f R
2 N
orm
Fall 2015 - Fall 2019 Average SCHs Per Faculty FTE
HH Dept Fall 2015-19 Average Student Credit Hours Per Faculty FTE Compared to Research 2 Norms
Oct. 2020 25 UNCG-IRA

VP Dept Fall 2015-19 Average Student Credit Hours Per Faculty FTE Compared to Delaware 50 Percentile Norm
CIP School Dept Name Dept UNCG_SCH/FacFTE Delaware_Norm UNCG_SCH / Norm Bub Size
50.03 VP Dance DCE 184 149 123% 184
50.05 VP Theatre THE 176 138 128% 176
50.07 VP Art ART 233 153 152% 233
50.09 VP Music MUS 135 114 118% 135
Data Source: Delaware norms by highest degree and UNCG's Delaware Instructional Cost Analysis.
DCE, 184, 123%
THE, 176, 128%
ART, 233, 152%
MUS, 135, 118%
50%
70%
90%
110%
130%
150%
170%
100 120 140 160 180 200 220 240 260
Per
cen
t o
f U
NC
G S
CH
s P
er F
acu
lty
as o
f D
elaw
are
No
rm
Fall 2015 - Fall 2019 Average SCHs Per Faculty FTE
VP Dept Fall 2015-19 Average Student Credit Hours Per Faculty FTE Compared to Delaware 50 Percentile Norm
Oct. 2020 26 UNCG-IRA
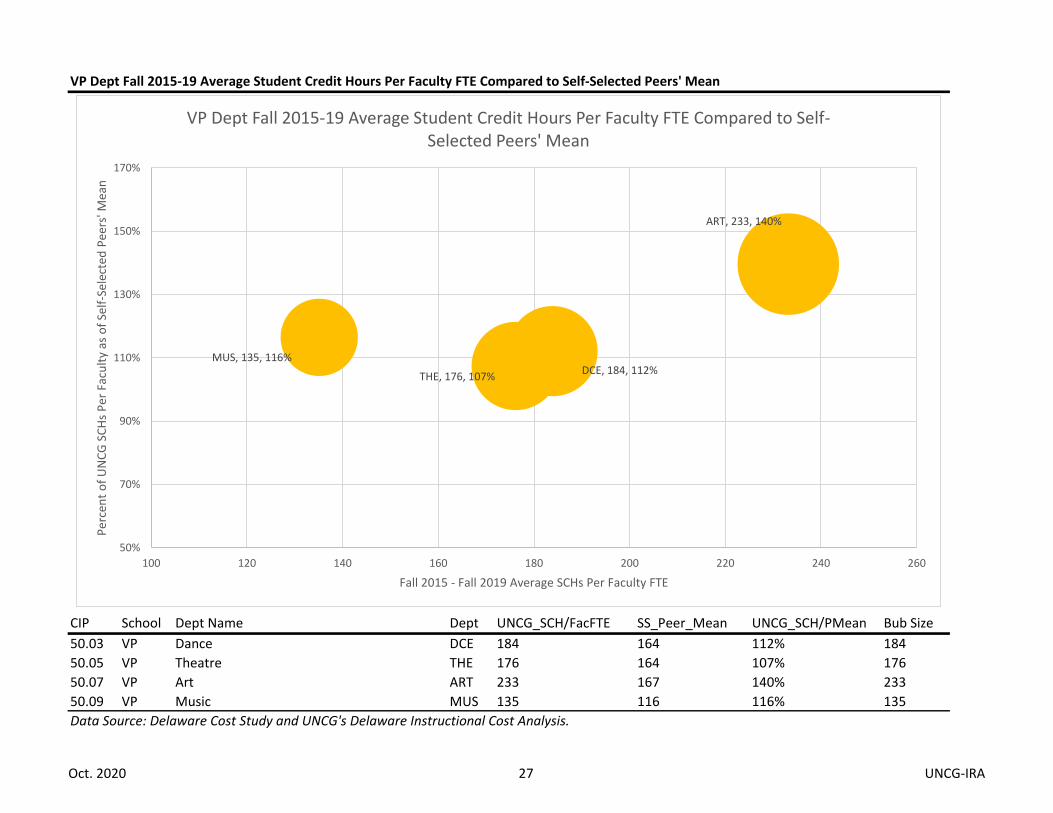
VP Dept Fall 2015-19 Average Student Credit Hours Per Faculty FTE Compared to Self-Selected Peers' Mean
CIP School Dept Name Dept UNCG_SCH/FacFTE SS_Peer_Mean UNCG_SCH/PMean Bub Size
50.03 VP Dance DCE 184 164 112% 184
50.05 VP Theatre THE 176 164 107% 176
50.07 VP Art ART 233 167 140% 233
50.09 VP Music MUS 135 116 116% 135
Data Source: Delaware Cost Study and UNCG's Delaware Instructional Cost Analysis.
DCE, 184, 112%THE, 176, 107%
ART, 233, 140%
MUS, 135, 116%
50%
70%
90%
110%
130%
150%
170%
100 120 140 160 180 200 220 240 260
Per
cen
t o
f U
NC
G S
CH
s P
er F
acu
lty
as o
f Se
lf-S
elec
ted
Pee
rs' M
ean
Fall 2015 - Fall 2019 Average SCHs Per Faculty FTE
VP Dept Fall 2015-19 Average Student Credit Hours Per Faculty FTE Compared to Self-Selected Peers' Mean
Oct. 2020 27 UNCG-IRA

VP Dept Fall 2015-19 Average Student Credit Hours Per Faculty FTE Compared to Research 2 Norms
CIP School Dept Name Dept UNCG_SCH/FacFTE R2_Norm UNCG_SCH/R2Norm Bub Size
50.03 VP Dance DCE 184 155 119% 184
50.05 VP Theatre THE 176 155 114% 176
50.07 VP Art ART 233 166 140% 233
50.09 VP Music MUS 135 121 112% 135
Data Source: Delaware Cost Study and UNCG's Delaware Instructional Cost Analysis.
DCE, 184, 119%THE, 176, 114%
ART, 233, 140%
MUS, 135, 112%
50%
70%
90%
110%
130%
150%
170%
100 120 140 160 180 200 220 240 260
Per
cen
t o
f U
NC
G S
CH
s P
er F
acu
lty
as o
f R
2 N
orm
Fall 2015 - Fall 2019 Average SCHs Per Faculty FTE
VP Dept Fall 2015-19 Average Student Credit Hours Per Faculty FTE Compared to Research 2 Norms
Oct. 2020 28 UNCG-IRA

NU Dept Fall 2015-19 Average Student Credit Hours Per Faculty FTE Compared to Delaware 50 Percentile Norm
CIP School Dept Name Dept UNCG_SCH/FacFTE Delaware_Norm UNCG_SCH / Norm Bub Size
51.38 NU Nursing NUR 161 153 105% 161
Data Source: Delaware norms by highest degree and UNCG's Delaware Instructional Cost Analysis.
NUR, 161, 105%
50%
60%
70%
80%
90%
100%
110%
120%
100 110 120 130 140 150 160 170 180
Per
cen
t o
f U
NC
G S
CH
s P
er F
acu
lty
as o
f D
elaw
are
No
rm
Fall 2015 - Fall 2019 Average SCHs Per Faculty FTE
NU Dept Fall 2015-19 Average Student Credit Hours Per Faculty FTE Compared to Delaware 50 Percentile Norm
Oct. 2020 29 UNCG-IRA

NU Dept Fall 2015-19 Average Student Credit Hours Per Faculty FTE Compared to Self-Selected Peers' Mean
CIP School Dept Name Dept UNCG_SCH/FacFTE SS_Peer_Mean UNCG_SCH/PMean Bub Size
51.38 NU Nursing NUR 161 165 98% 161
Data Source: Delaware Cost Study and UNCG's Delaware Instructional Cost Analysis.
NUR, 161, 98%
50%
60%
70%
80%
90%
100%
110%
100 110 120 130 140 150 160 170 180
Per
cen
t o
f U
NC
G S
CH
s P
er F
acu
lty
as o
f Se
lf-S
elec
ted
Pee
rs' M
ean
Fall 2015 - Fall 2019 Average SCHs Per Faculty FTE
NU Dept Fall 2015-19 Average Student Credit Hours Per Faculty FTE Compared to Self-Selected Peers' Mean
Oct. 2020 30 UNCG-IRA

NU Dept Fall 2015-19 Average Student Credit Hours Per Faculty FTE Compared to Research 2 Norms
CIP School Dept Name Dept UNCG_SCH/FacFTE R2_Norm UNCG_SCH/R2Norm Bub Size
51.38 NU Nursing NUR 161 161 100% 161
Data Source: Delaware Cost Study and UNCG's Delaware Instructional Cost Analysis.
NUR, 161, 100%
50%
60%
70%
80%
90%
100%
110%
100 110 120 130 140 150 160 170 180
Per
cen
t o
f U
NC
G S
CH
s P
er F
acu
lty
as o
f R
2 N
orm
Fall 2015 - Fall 2019 Average SCHs Per Faculty FTE
NU Dept Fall 2015-19 Average Student Credit Hours Per Faculty FTE Compared to Research 2 Norms
Oct. 2020 31 UNCG-IRA

NN Dept Fall 2015-19 Average Student Credit Hours Per Faculty FTE Compared to Delaware 50 Percentile Norm
CIP School Dept Name Dept UNCG_SCH/FacFTE Delaware_Norm UNCG_SCH / Norm Bub Size
40.99 NN Nanoscience/Nanoengineering JNN 61 201 31% 61
Data Source: Delaware norms by highest degree and UNCG's Delaware Instructional Cost Analysis.
JNN, 61, 31%
0%
5%
10%
15%
20%
25%
30%
35%
40%
0 10 20 30 40 50 60 70 80
Per
cen
t o
f U
NC
G S
CH
s P
er F
acu
lty
as o
f D
elaw
are
No
rm
Fall 2015 - Fall 2019 Average SCHs Per Faculty FTE
NN Dept Fall 2015-19 Average Student Credit Hours Per Faculty FTE Compared to Delaware 50 Percentile Norm
Oct. 2020 32 UNCG-IRA

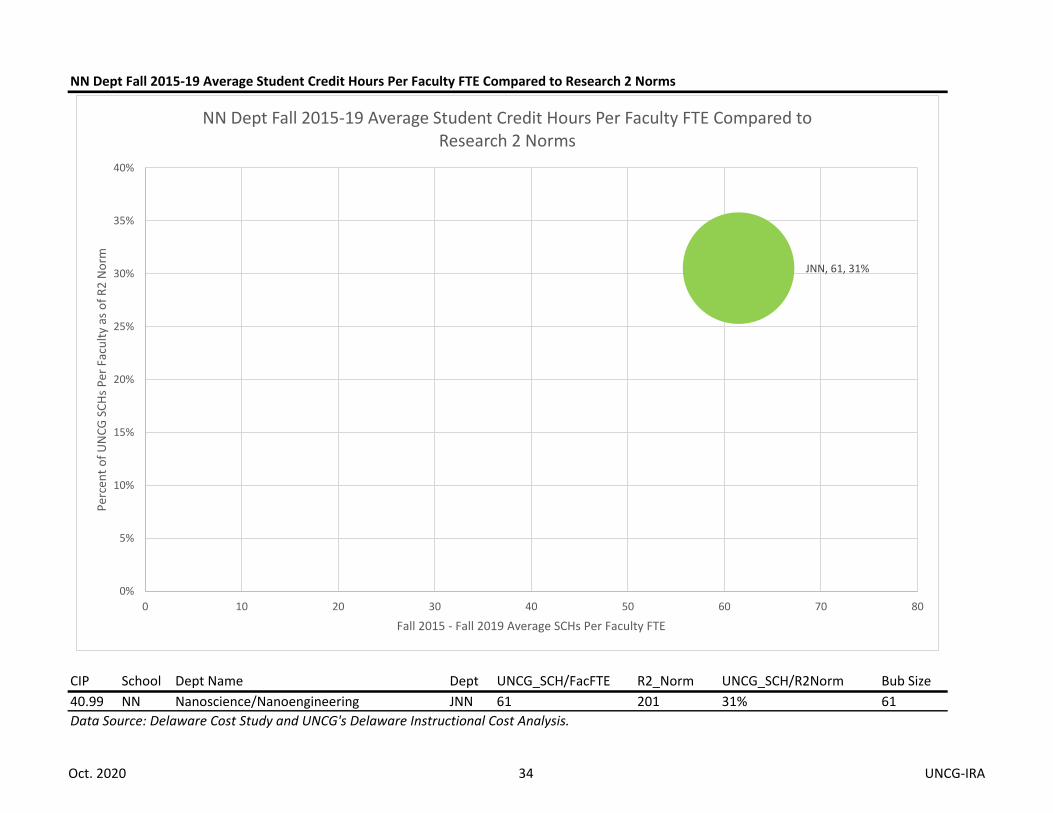
NN Dept Fall 2015-19 Average Student Credit Hours Per Faculty FTE Compared to Self-Selected Peers' Mean
CIP School Dept Name Dept UNCG_SCH/FacFTE SS_Peer_Mean UNCG_SCH/PMean Bub Size
40.99 NN Nanoscience/Nanoengineering JNN 61 201 31% 61
Data Source: Delaware Cost Study and UNCG's Delaware Instructional Cost Analysis.
JNN, 61, 31%
0%
5%
10%
15%
20%
25%
30%
35%
40%
0 10 20 30 40 50 60 70 80
Per
cen
t o
f U
NC
G S
CH
s P
er F
acu
lty
as o
f Se
lf-S
elec
ted
Pee
rs' M
ean
Fall 2015 - Fall 2019 Average SCHs Per Faculty FTE
NN Dept Fall 2015-19 Average Student Credit Hours Per Faculty FTE Compared to Self-Selected Peers' Mean
Oct. 2020 33 UNCG-IRA
NN Dept Fall 2015-19 Average Student Credit Hours Per Faculty FTE Compared to Research 2 Norms
CIP School Dept Name Dept UNCG_SCH/FacFTE R2_Norm UNCG_SCH/R2Norm Bub Size
40.99 NN Nanoscience/Nanoengineering JNN 61 201 31% 61
Data Source: Delaware Cost Study and UNCG's Delaware Instructional Cost Analysis.
JNN, 61, 31%
0%
5%
10%
15%
20%
25%
30%
35%
40%
0 10 20 30 40 50 60 70 80
Per
cen
t o
f U
NC
G S
CH
s P
er F
acu
lty
as o
f R
2 N
orm
Fall 2015 - Fall 2019 Average SCHs Per Faculty FTE
NN Dept Fall 2015-19 Average Student Credit Hours Per Faculty FTE Compared to Research 2 Norms
Oct. 2020 34 UNCG-IRA

UNCG_Direct Delaware Cost Study Ratio Fall2018
Instructional Norm Mean_Instruct UNCG Exp. ($)/ Dept Total
CIP School Program Name Dept Exp./SCH ($) Exp/SCH($) Norm ($) SCHs
5.0201 AS African American and African Diaspora Studies AAD 96 250 38% 2,511
5.0207 AS Women's and Gender Studies WGS 261 269 97% 837
9.0101 AS Communication Studies CST 139 204 68% 6,950
9.0102 AS Media Studies MST 154 204 75% 3,945
11.07 AS Computer Science CMP 344 279 123% 2,489
16.09 AS Languages, Literatures, and Cultures LLC 156 238 66% 11,747
16.12 AS Classical Studies CLA 125 299 42% 3,677
23.01 AS English ENG 192 286 67% 13,017
26.01 AS Biology BIO 171 287 60% 14,334
27.01 AS Mathematics and Statistics MTH 143 194 74% 9,977
38.01 AS Philosophy PHI 100 188 53% 4,314
38.02 AS Religious Studies REL 144 247 58% 3,653
40.05 AS Chemistry & Biochemistry CHE 170 300 57% 7,828
40.08 AS Physics PHY 291 284 102% 1,776
42.01 AS Psychology PSY 201 214 94% 9,647
45.02 AS Anthropology ATY 151 194 78% 3,620
45.1 AS Political Science PSC 252 226 112% 3,456
45.11 AS Sociology SOC 121 165 73% 7,361
50.0408 AS Interior Architecture IAR 251 362 69% 2,143
54.01 AS History HIS 172 301 57% 6,840
11.09 BE Information Systems and Supply Chain ManagementIMS 218 296 74% 7,666
19.09 BE Consumer, Apparel and Retail Studies CRS 156 299 52% 3,236
52.02 BE Marketing MRK 254 251 101% 7,288
52.02 BE Management MNT 159 251 63% 7,288
52.03 BE Accounting and Finance ACF 251 294 85% 6,010
52.06 BE Economics ECO 192 250 77% 7,770
13.03 ED Teacher Ed Higher Ed HED 430 321 134% 3,550
13.04 ED Ed Leadership and Cultural Foundations ELC 445 504 88% 1,599
13.06 ED Ed Research Methodology ERM 733 570 129% 793
13.1 ED Specialized Education Services SES 302 327 92% 3,504
UNCG Direct Instructional Expenditure Per Student Credit Hour (SCH) Compared to Delaware Study Norm for 2018***
Oct. 2020 35 UNCG-IRA

UNCG_Direct Delaware Cost Study Ratio Fall2018
Instructional Norm Mean_Instruct UNCG Exp. ($)/ Dept Total
CIP School Program Name Dept Exp./SCH ($) Exp/SCH($) Norm ($) SCHs
UNCG Direct Instructional Expenditure Per Student Credit Hour (SCH) Compared to Delaware Study Norm for 2018***
13.11 ED Counseling and Educational Development CED 292 373 78% 2,356
25.01 ED Library and Information Systems LIS 359 337 107% 2,379
19.07 HH Human Development and Family Studies HDF 285 299 95% 6,084
30.19 HH Nutrition NTR 222 435 51% 3,796
31.03 HH Community Therapeutic Recreation CTR 204 210 97% 1,846
31.05 HH Kinesiology KIN 216 191 113% 9,069
30.0501 HH Peace and Conflict Studies PCS 181 335 54% 1,553
44.07 HH Social Work SWK 210 269 78% 3,952
51.02 HH Communication Sciences and Disorders CSD 386 423 91% 2,375
51.0204 HH Genetic Counseling GEN 822 409 201% 184
51.22 HH Public Health Education PHE 234 499 47% 4,196
51.3801 NU Nursing NUR 442 399 111% 7,918
50.03 VP Dance DCE 242 384 63% 2,576
50.05 VP Theatre THE 299 411 73% 3,381
50.07 VP Art ART 164 355 46% 6,070
50.09 VP Music MUS 384 446 86% 8,686
99.9999 Z_Univ Total Institution total 221
*** The norms are based on Delaware Study participating institutions that award the same level of degree.
Oct. 2020 36 UNCG-IRA

UNCG_Direct Self-Selected Peers' Ratio Fall2018
Instructional Mean_Instruct UNCG Exp. ($)/ Dept Total CIP School Program Name Dept Exp./SCH ($) Exp($)/SCH Mean ($) SCHs
5.0201 AS African American and African Diaspora Studies AAD 96 250 38% 2,5115.0207 AS Women's and Gender Studies WGS 261 269 97% 837
9.0101 AS Communication Studies CST 139 171 81% 6,9509.0102 AS Media Studies MST 154 171 90% 3,945
11.07 AS Computer Science CMP 344 329 105% 2,48916.09 AS Languages, Literatures, and Cultures LLC 156 197 79% 11,747
16.12 AS Classical Studies CLA 125 197 63% 3,677
23.01 AS English ENG 192 195 98% 13,01726.01 AS Biology BIO 171 224 76% 14,334
27.01 AS Mathematics and Statistics MTH 143 147 97% 9,97738.01 AS Philosophy PHI 100 167 60% 4,31438.02 AS Religious Studies REL 144 167 86% 3,653
40.05 AS Chemistry & Biochemistry CHE 170 217 78% 7,82840.08 AS Physics PHY 291 252 115% 1,776
42.01 AS Psychology PSY 201 179 112% 9,647
45.02 AS Anthropology ATY 151 167 90% 3,620
45.1 AS Political Science PSC 252 228 111% 3,45645.11 AS Sociology SOC 121 176 69% 7,36150.0408 AS Interior Architecture IAR 251 296 85% 2,143
54.01 AS History HIS 172 217 79% 6,840
11.09 BE Information Systems and Supply Chain ManagementIMS 218 234 93% 7,66619.09 BE Consumer, Apparel and Retail Studies CRS 156 191 82% 3,23652.02 BE Marketing MRK 254 234 109% 7,28852.02 BE Management MNT 159 234 68% 7,288
52.03 BE Accounting and Finance ACF 251 274 92% 6,01052.06 BE Economics ECO 192 241 80% 7,770
13.03 ED Teacher Ed Higher Ed HED 430 440 98% 3,55013.04 ED Ed Leadership and Cultural Foundations ELC 445 440 101% 1,599
13.06 ED Ed Research Methodology ERM 733 440 167% 79313.1 ED Specialized Education Services SES 302 255 118% 3,504
13.11 ED Counseling and Educational Development CED 292 416 70% 2,35625.01 ED Library and Information Systems LIS 359 337 107% 2,379
UNCG Direct Instructional Expenditure Per Student Credit Hour (SCH) Compared to Self-Selected Peers' Mean
Oct. 2020 37 UNCG-IRA

UNCG_Direct Self-Selected Peers' Ratio Fall2018
Instructional Mean_Instruct UNCG Exp. ($)/ Dept Total CIP School Program Name Dept Exp./SCH ($) Exp($)/SCH Mean ($) SCHs
UNCG Direct Instructional Expenditure Per Student Credit Hour (SCH) Compared to Self-Selected Peers' Mean
19.07 HH Human Development and Family Studies HDF 285 191 149% 6,084
30.19 HH Nutrition NTR 222 435 51% 3,79631.03 HH Community Therapeutic Recreation CTR 204 176 116% 1,84631.05 HH Kinesiology KIN 216 176 123% 9,069
30.0501 HH Peace and Conflict Studies PCS 181 335 54% 1,55344.07 HH Social Work SWK 210 253 83% 3,952
51.02 HH Communication Sciences and Disorders CSD 386 407 95% 2,37551.0204 HH Genetic Counseling GEN 822 407 202% 18451.22 HH Public Health Education PHE 234 199 118% 4,196
51.3801 NU Nursing NUR 442 361 122% 7,91850.03 VP Dance DCE 242 296 82% 2,576
50.05 VP Theatre THE 299 296 101% 3,38150.07 VP Art ART 164 284 58% 6,07050.09 VP Music MUS 384 413 93% 8,686
99.9999 Z_Univ Total Institution total 221
The self-selected peers were based on UNCG's official peers and the 2019 Delaware Instructional Cost Study participation:
Appalachian State University University of Missouri - Kansas City
Ball State University University of Missouri - St. Louis
Central Michigan University University of North Carolina at Charlotte
East Carolina University University of North Carolina at Wilmington
Florida Atlantic University University of North Florida
Kent State University University of Southern Mississippi
Middle Tennessee State University University of Toledo
Mississippi State University Wichita State University
North Carolina A&T State University Wright State University - Main Campus
Northern Illinois University
The programs below did not have the self-selected peers mean and had to use the "by-degree norms" on the prior page:
5.0201 African American and African Diaspora Studies, 5.0207 Women's and Gender Studies, 25.01 Library and Information Sys,
30.19 Nutrition, 44.0201 Peace and Conflict Studies
Oct. 2020 38 UNCG-IRA

UNCG_Direct R2_Norm_ Ratio Fall2018
Instructional Instruct UNCG Exp. ($)/ Dept Total CIP School Program Name Dept Exp./SCH ($) Exp($)/SCH R2 Norm ($) SCHs5.0201 AS African American and African Diaspora Studies AAD 96 252 38% 2,5115.0207 AS Women's and Gender Studies WGS 261 252 104% 8379.0101 AS Communication Studies CST 139 186 75% 6,9509.0102 AS Media Studies MST 154 186 83% 3,94511.07 AS Computer Science CMP 344 310 111% 2,48916.09 AS Languages, Literatures, and Cultures LLC 156 305 51% 11,74716.12 AS Classical Studies CLA 125 305 41% 3,67723.01 AS English ENG 192 217 88% 13,01726.01 AS Biology BIO 171 291 59% 14,33427.01 AS Mathematics and Statistics MTH 143 171 84% 9,97738.01 AS Philosophy PHI 100 207 48% 4,31438.02 AS Religious Studies REL 144 268 54% 3,65340.05 AS Chemistry & Biochemistry CHE 170 276 62% 7,82840.08 AS Physics PHY 291 283 103% 1,77642.01 AS Psychology PSY 201 208 97% 9,64745.02 AS Anthropology ATY 151 204 74% 3,62045.1 AS Political Science PSC 252 268 94% 3,45645.11 AS Sociology SOC 121 204 59% 7,36150.0408 AS Interior Architecture IAR 251 361 70% 2,14354.01 AS History HIS 172 238 72% 6,84011.09 BE Information Systems and Supply Chain ManagementIMS 218 310 70% 7,66619.09 BE Consumer, Apparel and Retail Studies CRS 156 208 75% 3,23652.02 BE Marketing MRK 254 253 100% 7,28852.02 BE Management MNT 159 253 63% 7,28852.03 BE Accounting and Finance ACF 251 292 86% 6,01052.06 BE Economics ECO 192 220 87% 7,77013.03 ED Teacher Ed Higher Ed HED 430 471 91% 3,55013.04 ED Ed Leadership and Cultural Foundations ELC 445 471 94% 1,59913.06 ED Ed Research Methodology ERM 733 471 156% 79313.1 ED Specialized Education Services SES 302 270 112% 3,50413.11 ED Counseling and Educational Development CED 292 372 78% 2,35625.01 ED Library and Information Systems LIS 359 337 107% 2,37919.07 HH Human Development and Family Studies HDF 285 208 137% 6,08430.19 HH Nutrition NTR 222 435 51% 3,79631.03 HH Community Therapeutic Recreation CTR 204 183 111% 1,84631.05 HH Kinesiology KIN 216 183 118% 9,06930.0501 HH Peace and Conflict Studies PCS 181 335 54% 1,55344.07 HH Social Work SWK 210 284 74% 3,952
UNCG Direct Instructional Expenditure Per Student Credit Hour (SCH) Compared to Research 2 (R2) Norms
Oct. 2020 39 UNCG-IRA

UNCG_Direct R2_Norm_ Ratio Fall2018
Instructional Instruct UNCG Exp. ($)/ Dept Total CIP School Program Name Dept Exp./SCH ($) Exp($)/SCH R2 Norm ($) SCHs
UNCG Direct Instructional Expenditure Per Student Credit Hour (SCH) Compared to Research 2 (R2) Norms
51.02 HH Communication Sciences and Disorders CSD 386 405 95% 2,37551.0204 HH Genetic Counseling GEN 822 405 203% 18451.22 HH Public Health Education PHE 234 313 75% 4,19651.3801 NU Nursing NUR 442 391 113% 7,91850.03 VP Dance DCE 242 361 67% 2,57650.05 VP Theatre THE 299 361 83% 3,38150.07 VP Art ART 164 311 53% 6,07050.09 VP Music MUS 384 397 97% 8,68699.9999 Z_Univ Total Institution total 221
The norms in the above table were based on the Research 2 institutions that participated in Delaware Study in 2019:
Ball State University R2 Tennessee Technological University R2
Boise State University R2 University of Alabama in Huntsville R2
Central Michigan University R2 University of Idaho R2
Clarkson University R2 University of Massachusetts - Dartmouth R2
College of William & Mary R2 University of Missouri - Kansas City R2
Colorado School of Mines R2 University of Missouri - St. Louis R2
East Carolina University R2 University of Montana, The R2
Florida Atlantic University R2 University of Nebraska at Omaha R2
Kent State University R2 University of North Carolina at Charlotte R2
Loyola University Chicago R2 University of North Carolina at Wilmington R2
Miami University - Ohio R2 University of Rhode Island R2
Missouri University of Science and Technology R2 University of Toledo R2
Morgan State University R2 University of Vermont R2
New Mexico State University - Main Campus R2 Wichita State University R2
North Carolina A&T State University R2 Worcester Polytechnic Institute R2
Northern Illinois University R2 Wright State University - Main Campus R2
Rutgers University - Camden R2
The programs below did not have the R2 norms and had to use the self-selected peers' norms on the prior page:
25.01 Library and Information Sys, 30.19 Nutrition, 30.0501 Peace and Conflict Studies
Oct. 2020 40 UNCG-IRA

AS Dept 2018-19 Instructional Exp ($)Per Student Credit Hour Compared to Delaware Mean Norm (1)
CIP School Dept Name Dept UNCG_Exp($)/SCH DelawareNorm ($) UNCG($) / Norm ($) Fa18_SCH
5.0201 AS African American and African Diaspora Studies AAD 96 250 38% 2,511
5.0207 AS Womens and Gender Studies WGS 261 269 97% 837
9.0101 AS Communication Studies CST 139 204 68% 6,950
9.0102 AS Media Studies MST 154 204 75% 3,945
11.07 AS Computer Science CMP 344 279 123% 2,489
16.09 AS Languages, Literatures, and Cultures LLC 156 238 66% 11,747
16.12 AS Classical Studies CLA 125 299 42% 3,677
Data Source: Delaware Instructional Cost Study.
AAD, 96, 38%
WGS, 261, 97%
CST, 139, 68%MST, 154, 75%
CMP,344, 123%
LLC, 156, 66%
CLA, 125, 42%
20%
40%
60%
80%
100%
120%
140%
160%
50 100 150 200 250 300 350 400
Per
cen
t o
f U
NC
G C
ost
($
) P
er S
CH
as
of
Del
awar
e N
orm
UNCG Instructional Cost ($) Per SCH
AS Dept 2018-19 Instructional Exp ($) Per SCH Compared to Delaware Mean Norm (1)(Bubble Size Based on Fall 2018 Dept Total SCHs)
Oct. 2020 41 UNCG-IRA

AS Dept 2018-19 Instructional Exp ($)Per Student Credit Hour Compared to Self-Selected Peers' Mean (1)
CIP School Dept Name Dept UNCG_Exp($)/SCH Peer_Mean($) UNCG($) / Peer($) Fa18_SCH
5.0201 AS African American and African Diaspora Studies AAD 96 250 38% 2,511
5.0207 AS Women's and Gender Studies WGS 261 269 97% 837
9.0101 AS Communication Studies CST 139 171 81% 6,950
9.0102 AS Media Studies MST 154 171 90% 3,945
11.07 AS Computer Science CMP 344 329 105% 2,489
16.09 AS Languages, Literatures, and Cultures LLC 156 197 79% 11,747
16.12 AS Classical Studies CLA 125 197 63% 3,677
Data Source: Delaware Instructional Cost Study.
AAD, 96, 38%
WGS, 261, 97%
CST, 139, 81%
MST, 154, 90%
CMP,344, 105%
LLC, 156, 79%
CLA, 125, 63%
20%
30%
40%
50%
60%
70%
80%
90%
100%
110%
120%
50 100 150 200 250 300 350 400
Per
cen
t o
f U
NC
G C
ost
($
) P
er S
CH
as
of
Sel
f-Se
lect
ed P
eers
' Mea
n
UNCG Instructional Cost ($) Per SCH
AS Dept 2018-19 Instructional Exp ($) Per SCH Compared to Self-Selected Peers' Mean (1)(Bubble Size Based on Fall 2018 Dept Total SCHs)
Oct. 2020 42 UNCG-IRA

AS Dept 2018-19 Instructional Exp ($)Per Student Credit Hour Compared to R2 Norm (1)
CIP School Dept Name Dept UNCG_Exp($)/SCH R2_Norm ($) UNCG($) / R2_Norm ($) Fa18_SCH
5.0201 AS African American and African Diaspora Studies AAD 96 252 38% 2,511
5.0207 AS Women's and Gender Studies WGS 261 252 104% 837
9.0101 AS Communication Studies CST 139 186 75% 6,950
9.0102 AS Media Studies MST 154 186 83% 3,945
11.07 AS Computer Science CMP 344 310 111% 2,489
16.09 AS Languages, Literatures, and Cultures LLC 156 305 51% 11,747
16.12 AS Classical Studies CLA 125 305 41% 3,677
Data Source: Delaware Instructional Cost Study.
AAD, 96, 38%
WGS, 261, 104%
CST, 139, 75%
MST, 154, 83%CMP,344, 111%
LLC, 156, 51%
CLA, 125, 41%
20%
40%
60%
80%
100%
120%
140%
50 100 150 200 250 300 350 400
Per
cen
t o
f U
NC
G C
ost
($
) P
er S
CH
as
of
R2
No
rm
UNCG Instructional Cost ($) Per SCH
AS Dept 2018-19 Instructional Exp ($) Per SCH Compared to R2 Norm (1)(Bubble Size Based on Fall 2018 Dept Total SCHs)
Oct. 2020 43 UNCG-IRA
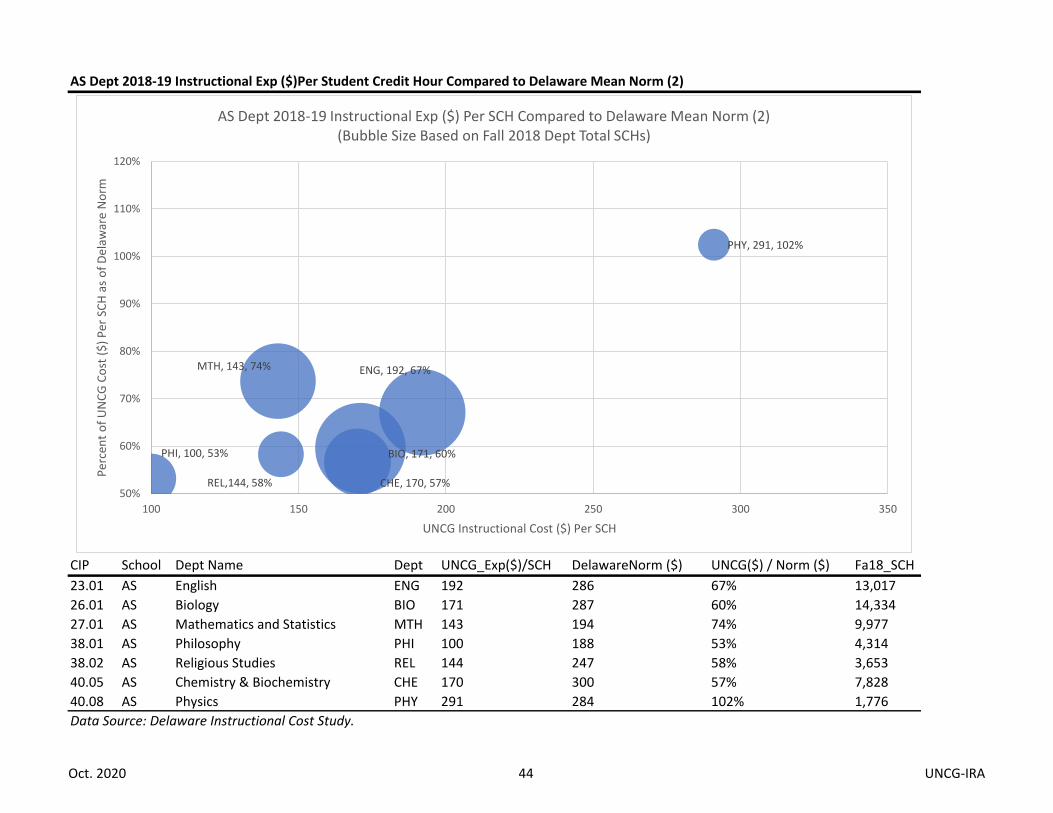
AS Dept 2018-19 Instructional Exp ($)Per Student Credit Hour Compared to Delaware Mean Norm (2)
CIP School Dept Name Dept UNCG_Exp($)/SCH DelawareNorm ($) UNCG($) / Norm ($) Fa18_SCH
23.01 AS English ENG 192 286 67% 13,017
26.01 AS Biology BIO 171 287 60% 14,334
27.01 AS Mathematics and Statistics MTH 143 194 74% 9,977
38.01 AS Philosophy PHI 100 188 53% 4,314
38.02 AS Religious Studies REL 144 247 58% 3,653
40.05 AS Chemistry & Biochemistry CHE 170 300 57% 7,828
40.08 AS Physics PHY 291 284 102% 1,776
Data Source: Delaware Instructional Cost Study.
ENG, 192, 67%
BIO, 171, 60%
MTH, 143, 74%
PHI, 100, 53%
REL,144, 58% CHE, 170, 57%
PHY, 291, 102%
50%
60%
70%
80%
90%
100%
110%
120%
100 150 200 250 300 350
Per
cen
t o
f U
NC
G C
ost
($
) P
er S
CH
as
of
Del
awar
e N
orm
UNCG Instructional Cost ($) Per SCH
AS Dept 2018-19 Instructional Exp ($) Per SCH Compared to Delaware Mean Norm (2)(Bubble Size Based on Fall 2018 Dept Total SCHs)
Oct. 2020 44 UNCG-IRA

AS Dept 2018-19 Instructional Exp ($)Per Student Credit Hour Compared to Self-Selected Peers' Mean (2)
CIP School Dept Name Dept UNCG_Exp($)/SCH Peer_Mean($) UNCG($) / Peer($) Fa18_SCH
23.01 AS English ENG 192 195 98% 13,017
26.01 AS Biology BIO 171 224 76% 14,334
27.01 AS Mathematics and Statistics MTH 143 147 97% 9,977
38.01 AS Philosophy PHI 100 167 60% 4,314
38.02 AS Religious Studies REL 144 167 86% 3,653
40.05 AS Chemistry & Biochemistry CHE 170 217 78% 7,828
40.08 AS Physics PHY 291 252 115% 1,776
Data Source: Delaware Instructional Cost Study.
ENG, 192, 98%
BIO, 171, 76%
MTH, 143, 97%
PHI, 100, 60%
REL,144, 86% CHE, 170, 78%
PHY, 291, 115%
50%
60%
70%
80%
90%
100%
110%
120%
130%
100 150 200 250 300 350Per
cen
t o
f U
NC
G C
ost
($
) P
er S
CH
as
of
Self
-Sel
ecte
d P
eers
' Mea
n
UNCG Instructional Cost ($) Per SCH
AS Dept 2018-19 Instructional Exp ($) Per SCH Compared to Self-Selected Peers' Mean (2)(Bubble Size Based on Fall 2018 Dept Total SCHs)
Oct. 2020 45 UNCG-IRA

AS Dept 2018-19 Instructional Exp ($)Per Student Credit Hour Compared to R2 Norm (2)
CIP School Dept Name Dept UNCG_Exp($)/SCH R2_Norm ($) UNCG($) / R2_Norm ($) Fa18_SCH
23.01 AS English ENG 192 217 88% 13,017
26.01 AS Biology BIO 171 291 59% 14,334
27.01 AS Mathematics and Statistics MTH 143 171 84% 9,977
38.01 AS Philosophy PHI 100 207 48% 4,314
38.02 AS Religious Studies REL 144 268 54% 3,653
40.05 AS Chemistry & Biochemistry CHE 170 276 62% 7,828
40.08 AS Physics PHY 291 283 103% 1,776
Data Source: Delaware Instructional Cost Study.
ENG, 192, 88%
BIO, 171, 59%
MTH, 143, 84%
PHI, 100, 48%
REL,144, 54%
CHE, 170, 62%
PHY, 291, 103%
40%
50%
60%
70%
80%
90%
100%
110%
120%
100 150 200 250 300 350
Per
cen
t o
f U
NC
G C
ost
($
) P
er S
CH
as
of
R2
No
rm
UNCG Instructional Cost ($) Per SCH
AS Dept 2018-19 Instructional Exp ($) Per Student Credit Hour Compared to R2 Norm (2)(Bubble Size Based on Fall 2018 Dept Total SCHs)
Oct. 2020 46 UNCG-IRA

AS Dept 2018-19 Instructional Exp ($)Per Student Credit Hour Compared to Delaware Mean Norm (3)
CIP School Dept Name Dept UNCG_Exp($)/SCH DelawareNorm ($) UNCG($) / Norm ($) Fa18_SCH
42.01 AS Psychology PSY 201 214 94% 9,647
45.02 AS Anthropology ATY 151 194 78% 3,620
45.1 AS Political Science PSC 252 226 112% 3,456
45.11 AS Sociology SOC 121 165 73% 7,361
50.041 AS Interior Architecture IAR 251 362 69% 2,143
54.01 AS History HIS 172 301 57% 6,840
Data Source: Delaware Instructional Cost Study.
PSY, 201, 94%
ATY, 151, 78%
PSC, 252, 112%
SOC, 121, 73%
IAR,251, 69%
HIS, 172, 57%50%
60%
70%
80%
90%
100%
110%
120%
130%
100 120 140 160 180 200 220 240 260 280
Per
cen
t o
f U
NC
G C
ost
($
) P
er S
CH
as
of
Del
awar
e N
orm
UNCG Instructional Cost ($) Per SCH
AS Dept 2018-19 Instructional Exp ($) Per SCH Compared to Delaware Mean Norm (3)(Bubble Size Based on Fall 2018 Dept Total SCHs)
Oct. 2020 47 UNCG-IRA

AS Dept 2018-19 Instructional Exp ($)Per Student Credit Hour Compared to Self-Selected Peers' Mean (3)
CIP School Dept Name Dept UNCG_Exp($)/SCH Peer_Mean($) UNCG($) / Peer($) Fa18_SCH
42.01 AS Psychology PSY 201 179 112% 9,647
45.02 AS Anthropology ATY 151 167 90% 3,620
45.1 AS Political Science PSC 252 228 111% 3,456
45.11 AS Sociology SOC 121 176 69% 7,361
50.041 AS Interior Architecture IAR 251 296 85% 2,143
54.01 AS History HIS 172 217 79% 6,840
Data Source: Delaware Instructional Cost Study.
PSY, 201, 112%
ATY, 151, 90%
PSC, 252, 111%
SOC, 121, 69%IAR,251, 85%
HIS, 172, 79%
50%
60%
70%
80%
90%
100%
110%
120%
130%
100 120 140 160 180 200 220 240 260 280
Per
cen
t o
f U
NC
G C
ost
($
) P
er S
CH
as
of
Self
-Sel
ecte
d P
eers
' Mea
n
No
rm
UNCG Instructional Cost ($) Per SCH
AS Dept 2018-19 Instructional Exp ($) Per SCH Compared to Self-Selected Peers' Mean (3)(Bubble Size Based on Fall 2018 Dept Total SCHs)
Oct. 2020 48 UNCG-IRA

AS Dept 2018-19 Instructional Exp ($)Per Student Credit Hour Compared to R2 Norm (3)
CIP School Dept Name Dept UNCG_Exp($)/SCH R2_Norm ($) UNCG($) / R2_Norm ($) Fa18_SCH
42.01 AS Psychology PSY 201 208 97% 9,647
45.02 AS Anthropology ATY 151 204 74% 3,620
45.1 AS Political Science PSC 252 268 94% 3,456
45.11 AS Sociology SOC 121 204 59% 7,361
50.041 AS Interior Architecture IAR 251 361 70% 2,143
54.01 AS History HIS 172 238 72% 6,840
Data Source: Delaware Instructional Cost Study.
PSY, 201, 97%
ATY, 151, 74%
PSC, 252, 94%
SOC, 121, 59% IAR,251, 70%
HIS, 172, 72%
50%
60%
70%
80%
90%
100%
110%
100 120 140 160 180 200 220 240 260 280
Per
cen
t o
f U
NC
G C
ost
($
) P
er S
CH
as
of
R2
No
rm
UNCG Instructional Cost ($) Per SCH
AS Dept 2018-19 Instructional Exp ($) Per SCH Compared to R2 Norm (3)(Bubble Size Based on Fall 2018 Dept Total SCHs)
Oct. 2020 49 UNCG-IRA

BE Dept 2018-19 Instructional Exp ($) Per Student Credit Hour Compared to Delaware Mean Norm
CIP School Dept Name Dept UNCG_Exp($)/SCH DelawareNorm ($) UNCG($) / Norm ($) Fa18_SCHs
11.09 BE Information Systems and Supply Chain Management IMS 218 296 74% 7,666
19.09 BE Consumer, Apparel and Retail Studies CRS 156 299 52% 3,236
52.02 BE Marketing MRK 254 251 101% 7,288
52.02 BE Management MNT 159 251 63% 7,288
52.03 BE Accounting and Finance ACF 251 294 85% 6,010
52.06 BE Economics ECO 192 250 77% 7,770
Data Source: Delaware Instructional Cost Study.
IMS, 218, 74%
CRS, 156, 52%
MRK, 254, 101%
MNT, 159, 63%
ACF,251, 85%ECO, 192, 77%
20%
30%
40%
50%
60%
70%
80%
90%
100%
110%
120%
50 100 150 200 250 300
Per
cen
t o
f U
NC
G C
ost
($
) P
er S
CH
as
of
Del
awar
e N
orm
UNCG Instructional Cost ($) Per SCH
BE Dept 2018-19 Instructional Exp ($) Per SCH Compared to Delaware Mean Norm(Bubble Size Based on Fall 2018 Dept Total SCHs)
Oct. 2020 50 UNCG-IRA

BE Dept 2018-19 Instructional Exp ($) Per Student Credit Hour Compared to Self-Selected Peers' Mean
CIP School Dept Name Dept UNCG_Exp($)/SCH Peer_Mean($) UNCG($) / Peer($) Fa18_SCH
11.09 BE Information Systems and Supply Chain Management IMS 218 234 93% 7,666
19.09 BE Consumer, Apparel and Retail Studies CRS 156 191 82% 3,236
52.02 BE Marketing MRK 254 234 109% 7,288
52.02 BE Management MNT 159 234 68% 7,288
52.03 BE Accounting and Finance ACF 251 274 92% 6,010
52.06 BE Economics ECO 192 241 80% 7,770
Data Source: Delaware Instructional Cost Study.
IMS, 218, 93%
CRS, 156, 82%
MRK, 254, 109%
MNT, 159, 68%
ACF,251, 92%
ECO, 192, 80%
20%
40%
60%
80%
100%
120%
140%
50 100 150 200 250 300
Per
cen
t o
f U
NC
G C
ost
($
) P
er S
CH
as
of
Self
-Sel
ecte
d P
eers
' Mea
n
No
rm
UNCG Instructional Cost ($) Per SCH
BE Dept 2018-19 Instructional Exp ($) Per SCH Compared to Self-Selected Peers' Mean(Bubble Size Based on Fall 2018 Dept Total SCHs)
Oct. 2020 51 UNCG-IRA

BE Dept 2018-19 Instructional Exp ($) Per Student Credit Hour Compared to R2 Norm
CIP School Dept Name Dept UNCG_Exp($)/SCH R2_Norm ($) UNCG($) / R2_Norm ($) Fa18_SCH
11.09 BE Information Systems and Supply Chain Management IMS 218 310 70% 7,666
19.09 BE Consumer, Apparel and Retail Studies CRS 156 208 75% 3,236
52.02 BE Marketing MRK 254 253 100% 7,288
52.02 BE Management MNT 159 253 63% 7,288
52.03 BE Accounting and Finance ACF 251 292 86% 6,010
52.06 BE Economics ECO 192 220 87% 7,770
Data Source: Delaware Instructional Cost Study.
IMS, 218, 70%
CRS, 156, 75%
MRK, 254, 100%
MNT, 159, 63%
ACF,251, 86%
ECO, 192, 87%
20%
30%
40%
50%
60%
70%
80%
90%
100%
110%
120%
50 100 150 200 250 300
Per
cen
t o
f U
NC
G C
ost
($
) P
er S
CH
as
of
R2
No
rm
UNCG Instructional Cost ($) Per SCH
BE Dept 2018-19 Instructional Exp ($) Per SCH Compared to R2 Norm(Bubble Size Based on Fall 2018 Dept Total SCHs)
Oct. 2020 52 UNCG-IRA

ED Dept 2018-19 Instructional Exp ($)Per Student Credit Hour Compared to Delaware Mean Norm
CIP School Dept Name Dept UNCG_Exp($)/SCH DelawareNorm ($) UNCG($) / Norm ($) Fa18_SCH
13.03 ED Teacher Ed Higher Ed HED 430 321 134% 3,550
13.04 ED Ed Leadership and Cultural Foundations ELC 445 504 88% 1,599
13.06 ED Ed Research Methodology ERM 733 570 129% 793
13.1 ED Specialized Education Services SES 302 327 92% 3,504
13.11 ED Counseling and Educational Development CED 292 373 78% 2,356
25.01 ED Library and Information Systems LIS 359 337 107% 2,379
Data Source: Delaware Instructional Cost Study.
HED, 430, 134%
ELC, 445, 88%
ERM, 733, 129%
SES, 302, 92%
CED,292, 78%
LIS, 359, 107%
20%
40%
60%
80%
100%
120%
140%
160%
50 150 250 350 450 550 650 750 850
Per
cen
t o
f U
NC
G C
ost
($
) P
er S
CH
as
of
Del
awar
e N
orm
UNCG Instructional Cost ($) Per SCH
ED Dept 2018-19 Instructional Exp ($) Per SCH Compared to Delaware Mean Norm(Bubble Size Based on Fall 2018 Dept Total SCHs)
Oct. 2020 53 UNCG-IRA

ED Dept 2018-19 Instructional Exp ($)Per Student Credit Hour Compared to Self-Selected Peers' Mean
CIP School Dept Name Dept UNCG_Exp($)/SCH Peer_Mean($) UNCG($) / Peer($) Fa18_SCH
13.03 ED Teacher Ed Higher Ed HED 430 440 98% 3,550
13.04 ED Ed Leadership and Cultural Foundations ELC 445 440 101% 1,599
13.06 ED Ed Research Methodology ERM 733 440 167% 793
13.1 ED Specialized Education Services SES 302 255 118% 3,504
13.11 ED Counseling and Educational Development CED 292 416 70% 2,356
25.01 ED Library and Information Systems LIS 359 337 107% 2,379
Data Source: Delaware Instructional Cost Study.
HED, 430, 98%
ELC, 445, 101%
ERM, 733, 167%
SES, 302, 118%
CED,292, 70%
LIS, 359, 107%
20%
40%
60%
80%
100%
120%
140%
160%
180%
200%
50 150 250 350 450 550 650 750 850
Per
cen
t o
f U
NC
G C
ost
($
) P
er S
CH
as
of
Self
-Sel
ecte
d P
eers
' Mea
n
UNCG Instructional Cost ($) Per SCH
ED Dept 2018-19 Instructional Exp ($) Per SCH Compared to Self-Selected Peers' Mean(Bubble Size Based on Fall 2018 Dept Total SCHs)
Oct. 2020 54 UNCG-IRA

ED Dept 2018-19 Instructional Exp ($)Per Student Credit Hour Compared to R2 Norm
CIP School Dept Name Dept UNCG_Exp($)/SCH R2_Norm ($) UNCG($) / R2_Norm ($) Fa18_SCH
13.03 ED Teacher Ed Higher Ed HED 430 471 91% 3,550
13.04 ED Ed Leadership and Cultural Foundations ELC 445 471 94% 1,599
13.06 ED Ed Research Methodology ERM 733 471 156% 793
13.1 ED Specialized Education Services SES 302 270 112% 3,504
13.11 ED Counseling and Educational Development CED 292 372 78% 2,356
25.01 ED Library and Information Systems LIS 359 337 107% 2,379
Data Source: Delaware Instructional Cost Study.
HED, 430, 91%
ELC, 445, 94%
ERM, 733, 156%
SES, 302, 112%
CED,292, 78%
LIS, 359, 107%
20%
40%
60%
80%
100%
120%
140%
160%
180%
50 150 250 350 450 550 650 750 850
Per
cen
t o
f U
NC
G C
ost
($
) P
er S
CH
as
of
R2
No
rm
UNCG Instructional Cost ($) Per SCH
ED Dept 2018-19 Instructional Exp ($) Per SCH Compared to R2 Norm(Bubble Size Based on Fall 2018 Dept Total SCHs)
Oct. 2020 55 UNCG-IRA

HH Dept 2018-19 Instructional Exp ($)Per Student Credit Hour Compared to Delaware Mean Norm
CIP School Dept Name Dept UNCG_Exp($)/SCH DelawareNorm ($) UNCG($) / Norm ($) Fa18_SCH
19.07 HH Human Development and Family Studies HDF 285 299 95% 6,084
30.19 HH Nutrition *** NTR 222 435 51% 3,796
31.03 HH Community Therapeutic Recreation CTR 204 210 97% 1,846
31.05 HH Kinesiology KIN 216 191 113% 9,069
30.05 HH Peace and Conflict Studies PCS 181 335 54% 1,553
Data Source: Delaware Instructional Cost Study. *** Delaware norm for Nutrition (30.19) in 2018-19 is missing, so 2017-18 norm is used.
HDF, 285, 95%
NTR, 222, 51%
CTR, 204, 97%
KIN, 216, 113%
PCS, 181, 54%
0%
20%
40%
60%
80%
100%
120%
140%
0 50 100 150 200 250 300 350
Per
cen
t o
f U
NC
G S
CH
s P
er F
acu
lty
as o
f D
elaw
are
No
rm
UNCG Instructional Cost ($) Per SCH
HH Dept 2018-19 Instructional Exp ($) Per Student Credit Hour Compared to Delaware Mean Norm (1) (Bubble Size Based on Fall 2018 Dept Total SCHs)
Oct. 2020 56 UNCG-IRA

HH Dept 2018-19 Instructional Exp ($)Per Student Credit Hour Compared to Self-Selected Peers' Mean
CIP School Dept Name Dept UNCG_Exp($)/SCH Peer_Mean($) UNCG($) / Peer($) Fa18_SCH
19.07 HH Human Development and Family Studies HDF 285 191 149% 6,084
30.19 HH Nutrition NTR 222 435 51% 3,796
31.03 HH Community Therapeutic Recreation CTR 204 176 116% 1,846
31.05 HH Kinesiology KIN 216 176 123% 9,069
30.05 HH Peace and Conflict Studies PCS 181 335 54% 1,553
Data Source: Delaware Instructional Cost Study. *** Delaware norm for Nutrition (30.19) in 2018-19 is missing, so 2017-18 norm is used.
HDF, 285, 149%
NTR, 222, 51%
CTR, 204, 116%
KIN, 216, 123%
PCS, 181, 54%
0%
20%
40%
60%
80%
100%
120%
140%
160%
180%
0 50 100 150 200 250 300 350
Per
cen
t o
f U
NC
G S
CH
s P
er F
acu
lty
as o
f Se
lf-S
elec
ted
Pee
rs' M
ean
UNCG Instructional Cost ($) Per SCH
HH Dept 2018-19 Instructional Exp ($) Per Student Credit Hour Compared to Self-Selected Peers' Mean (1) (Bubble Size Based on Fall 2018 Dept Total SCHs)
Oct. 2020 57 UNCG-IRA

HH Dept 2018-19 Instructional Exp ($)Per Student Credit Hour Compared to R2 Norm (1)
CIP School Dept Name Dept UNCG_Exp($)/SCH R2_Norm ($) UNCG($) / R2_Norm ($) Fa18_SCH
19.07 HH Human Development and Family Studies HDF 285 208 137% 6,084
30.19 HH Nutrition NTR 222 435 51% 3,796
31.03 HH Community Therapeutic Recreation CTR 204 183 111% 1,846
31.05 HH Kinesiology KIN 216 183 118% 9,069
30.05 HH Peace and Conflict Studies PCS 181 335 54% 1,553
Data Source: Delaware Instructional Cost Study. *** Delaware norm for Nutrition (30.19) in 2018-19 is missing, so 2017-18 norm is used.
HDF, 285, 137%
NTR, 222, 51%
CTR, 204, 111%KIN, 216, 118%
PCS, 181, 54%
0%
20%
40%
60%
80%
100%
120%
140%
160%
0 50 100 150 200 250 300 350
Per
cen
t o
f U
NC
G S
CH
s P
er F
acu
lty
as o
f R
2 N
orm
UNCG Instructional Cost ($) Per SCH
HH Dept 2018-19 Instructional Exp ($) Per Student Credit Hour Compared to R2 Norm (1) (Bubble Size Based on Fall 2018 Dept Total SCHs)
Oct. 2020 58 UNCG-IRA

HH Dept 2018-19 Instructional Exp ($) Per Student Credit Hour Compared to Delaware Mean Norm
CIP School Dept Name Dept UNCG_Exp($)/SCH DelawareNorm ($) UNCG($) / Norm ($) Fa18_SCH
44.07 HH Social Work SWK 210 269 78% 3,952
51.02 HH Communication Sciences and Disorders CSD 386 423 91% 2,375
51.0204 HH Genetic Counseling GEN 822 409 201% 184
51.22 HH Public Health Education PHE 234 499 47% 4,196
Data Source: Delaware Instructional Cost Study.
SWK, 210, 78%CSD, 386, 91%
GEN,822, 201%
PHE, 234, 47%
0%
50%
100%
150%
200%
250%
0 100 200 300 400 500 600 700 800 900 1000
Per
cen
t o
f U
NC
G S
CH
s P
er F
acu
lty
as o
f D
elaw
are
No
rm
UNCG Instructional Cost ($) Per SCH
HH Dept 2018-19 Instructional Exp ($) Per Student Credit Hour Compared to Delaware Mean Norm (2) (Bubble Size Based on Fall 2018 Dept Total SCHs)
Oct. 2020 59 UNCG-IRA

HH Dept 2018-19 Instructional Exp ($) Per Student Credit Hour Compared to Self-Selected Peers' Mean (2)
CIP School Dept Name Dept UNCG_Exp($)/SCH Peer_Mean($) UNCG($) / Peer($) Fa18_SCH
44.07 HH Social Work SWK 210 253 83% 3,952
51.02 HH Communication Sciences and Disorders CSD 386 407 95% 2,375
51.0204 HH Genetic Counseling GEN 822 407 202% 184
51.22 HH Public Health Education PHE 234 199 118% 4,196
Data Source: Delaware Instructional Cost Study.
SWK, 210, 83%
CSD, 386, 95%
GEN,822, 202%
PHE, 234, 118%
0%
50%
100%
150%
200%
250%
0 100 200 300 400 500 600 700 800 900 1000
Per
cen
t o
f U
NC
G S
CH
s P
er F
acu
lty
as o
f Se
lf-S
elec
ted
Pee
rs' M
ean
UNCG Instructional Cost ($) Per SCH
HH Dept 2018-19 Instructional Exp ($) Per Student Credit Hour Compared to Self-Selected Peers' Mean (2) (Bubble Size Based on Fall 2018 Dept Total SCHs)
Oct. 2020 60 UNCG-IRA

HH Dept 2018-19 Instructional Exp ($) Per Student Credit Hour Compared to R2 Norm (2)
CIP School Dept Name Dept UNCG_Exp($)/SCH R2_Norm ($) UNCG($) / R2_Norm ($) Fa18_SCH
44.07 HH Social Work SWK 210 284 74% 3,952
51.02 HH Communication Sciences and Disorders CSD 386 405 95% 2,375
51.0204 HH Genetic Counseling GEN 822 405 203% 184
51.22 HH Public Health Education PHE 234 313 75% 4,196
Data Source: Delaware Instructional Cost Study.
SWK, 210, 74%
CSD, 386, 95%
GEN,822, 203%
PHE, 234, 75%
0%
50%
100%
150%
200%
250%
0 100 200 300 400 500 600 700 800 900 1000
Per
cen
t o
f U
NC
G S
CH
s P
er F
acu
lty
as o
f R
2 N
orm
UNCG Instructional Cost ($) Per SCH
HH Dept 2018-19 Instructional Exp ($) Per Student Credit Hour Compared to R2 Norm (2) (Bubble Size Based on Fall 2018 Dept Total SCHs)
Oct. 2020 61 UNCG-IRA

VP Dept 2018-19 Instructional Exp ($) Per Student Credit Hour Compared to Delaware Mean Norm
CIP School Dept Name Dept UNCG_Exp($)/SCH DelawareNorm ($) UNCG($) / Norm ($) Fa18_SCH
50.03 VP Dance DCE 242 384 63% 2,576
50.05 VP Theatre THE 299 411 73% 3,381
50.07 VP Art ART 164 355 46% 6,070
50.09 VP Music MUS 384 446 86% 8,686
Data Source: Delaware Instructional Cost Study.
DCE, 242, 63%
THE, 299, 73%
ART, 164, 46%
MUS, 384, 86%
30%
40%
50%
60%
70%
80%
90%
100%
100 150 200 250 300 350 400 450
Per
cen
t o
f U
NC
G S
CH
s P
er F
acu
lty
as o
f D
elaw
are
No
rm
UNCG Instructional Cost ($) Per SCH
VP Dept 2018-19 Instructional Exp ($) Per Student Credit Hour Compared to Delaware Mean Norm (Bubble Size Based on Fall 2018 Dept Total SCHs)
Oct. 2020 62 UNCG-IRA

VP Dept 2018-19 Instructional Exp ($) Per Student Credit Hour Compared to Self-Selected Peers' Mean
CIP School Dept Name Dept UNCG_Exp($)/SCH Peer_Mean($) UNCG($) / Peer($) Fa18_SCH
50.03 VP Dance DCE 242 296 82% 2,576
50.05 VP Theatre THE 299 296 101% 3,381
50.07 VP Art ART 164 284 58% 6,070
50.09 VP Music MUS 384 413 93% 8,686
Data Source: Delaware Instructional Cost Study.
DCE, 242, 82%
THE, 299, 101%
ART, 164, 58%
MUS, 384, 93%
30%
40%
50%
60%
70%
80%
90%
100%
110%
120%
100 150 200 250 300 350 400 450
Per
cen
t o
f U
NC
G S
CH
s P
er F
acu
lty
as o
f Se
lf-S
elec
ted
Pee
rs' M
ean
UNCG Instructional Cost ($) Per SCH
VP Dept 2018-19 Instructional Exp ($) Per Student Credit Hour Compared to Self-Selected Peers' Mean (Bubble Size Based on Fall 2018 Dept Total SCHs)
Oct. 2020 63 UNCG-IRA

VP Dept 2018-19 Instructional Exp ($) Per Student Credit Hour Compared to R2 Norm
CIP School Dept Name Dept UNCG_Exp($)/SCH R2_Norm ($) UNCG($) / R2_Norm ($) Fa18_SCH
50.03 VP Dance DCE 242 361 67% 2,576
50.05 VP Theatre THE 299 361 83% 3,381
50.07 VP Art ART 164 311 53% 6,070
50.09 VP Music MUS 384 397 97% 8,686
Data Source: Delaware Instructional Cost Study.
DCE, 242, 67%
THE, 299, 83%
ART, 164, 53%
MUS, 384, 97%
30%
40%
50%
60%
70%
80%
90%
100%
110%
100 150 200 250 300 350 400 450
Per
cen
t o
f U
NC
G S
CH
s P
er F
acu
lty
as o
f R
2 N
orm
UNCG Instructional Cost ($) Per SCH
VP Dept 2018-19 Instructional Exp ($) Per Student Credit Hour Compared to R2 Norm (Bubble Size Based on Fall 2018 Dept Total SCHs)
Oct. 2020 64 UNCG-IRA

NU Dept 2018-19 Instructional Exp ($) Per Student Credit Hour Compared to Delaware Mean Norm
CIP School Dept Name Dept UNCG_Exp($)/SCH DelawareNorm ($) UNCG($) / Norm ($) Fa18_SCH
51.38 NU Nursing NUR 442 399 111% 7,918
Data Source: Delaware Instructional Cost Study.
NUR, 442, 111%
30%
40%
50%
60%
70%
80%
90%
100%
110%
120%
130%
100 150 200 250 300 350 400 450 500
Per
cen
t o
f U
NC
G S
CH
s P
er F
acu
lty
as o
f D
elaw
are
No
rm
UNCG Instructional Cost ($) Per SCH
NU Dept 2018-19 Instructional Exp ($) Per Student Credit Hour Compared to Delaware Mean Norm (Bubble Size Based on Fall 2018 Dept Total SCHs)
Oct. 2020 65 UNCG-IRA

NU Dept 2018-19 Instructional Exp ($) Per Student Credit Hour Compared to Self-Selected Peers' Mean
CIP School Dept Name Dept UNCG_Exp($)/SCH Peer_Mean($) UNCG($) / Peer($) Fa18_SCH
51.38 NU Nursing NUR 442 361 122% 7,918
Data Source: Delaware Instructional Cost Study.
NUR, 442, 122%
30%
50%
70%
90%
110%
130%
150%
100 150 200 250 300 350 400 450 500
Per
cen
t o
f U
NC
G S
CH
s P
er F
acu
lty
as o
f Se
lf-S
elec
ted
Pee
rs' M
ean
UNCG Instructional Cost ($) Per SCH
NU Dept 2018-19 Instructional Exp ($) Per Student Credit Hour Compared to Self-Selected Peers' Mean (Bubble Size Based on Fall 2018 Dept Total SCHs)
Oct. 2020 66 UNCG-IRA

NU Dept 2018-19 Instructional Exp ($) Per Student Credit Hour Compared to R2 Norm
CIP School Dept Name Dept UNCG_Exp($)/SCH R2_Norm ($) UNCG($) / R2_Norm ($) Fa18_SCH
51.38 NU Nursing NUR 442 391 113% 7,918
Data Source: Delaware Instructional Cost Study.
NUR, 442, 113%
30%
40%
50%
60%
70%
80%
90%
100%
110%
120%
130%
100 150 200 250 300 350 400 450 500
Per
cen
t o
f U
NC
G S
CH
s P
er F
acu
lty
as o
f R
2 N
orm
UNCG Instructional Cost ($) Per SCH
NU Dept 2018-19 Instructional Exp ($) Per Student Credit Hour Compared to R2 Norm (Bubble Size Based on Fall 2018 Dept Total SCHs)
Oct. 2020 67 UNCG-IRA

UNCG_Rsch Exp. Delaware Study Ratio of
per FTE T/TT Fac MeanNorm_Rsch$ UNCG_Rsch Exp /CIP School Program Name Dept FY 2018-19 per FTE T/TT Faculty Delaware Norm
5.0201 AS African American and African Diaspora Studies AAD 0 2762 0%
5.0207 AS Womens and Gender Studies WGS 0 2675 0%
9.0101 AS Communication Studies CST 11500 2294 501%
9.0102 AS Media Studies MST 0 2294 0%
11.07 AS Computer Science CMP 10708 19797 54%
16.09 AS Languages, Literatures, and Cultures LLC 4761 na #VALUE!
16.12 AS Classical Studies CLA 37357 82 45557%
23.01 AS English ENG 0 1665 0%
26.01 AS Biology BIO 45126 115347 39%
27.01 AS Mathematics and Statistics MTH 12662 28622 44%
38.01 AS Philosophy PHI 0 707 0%
38.02 AS Religious Studies REL 0 6699 0%
40.05 AS Chemistry & Biochemistry CHE 206206 155825 132%
40.08 AS Physics PHY 0 4824 0%
42.01 AS Psychology PSY 43412 57456 76%
45.02 AS Anthropology ATY 112763 1760 6407%
45.1 AS Political Science PSC 0 2916 0%
45.11 AS Sociology SOC 0 7038 0%
50.041 AS Interior Architecture IAR 47400 264 17955%
54.01 AS History HIS 2182 5586 39%
11.09 BE Information Systems and Supply Chain Management IMS 0 150565 0%
19.09 BE Consumer, Apparel and Retail Studies CRS 0 67126 0%
52.02 BE Marketing MRK 6732 8708 77%
52.02 BE Management MNT - 445 #VALUE!
52.03 BE Accounting and Finance ACF 0 1467 0%
52.06 BE Economics ECO 59690 na #VALUE!
13.03 ED Teacher Ed Higher Ed HED 34331 18902 182%
13.04 ED Ed Leadership and Cultural Foundations ELC 921 8002 12%
13.06 ED Ed Research Methodology ERM 120595 43119 280%
13.1 ED Specialized Education Services SES 140700 39726 354%
UNCG Research Expenditures ($) Per Tenure Tenure Track Faculty FTE Compared to Delaware Study Norm for FY 2018-19***
Oct. 2020 68 UNCG-IRA

UNCG_Rsch Exp. Delaware Study Ratio of
per FTE T/TT Fac MeanNorm_Rsch$ UNCG_Rsch Exp /CIP School Program Name Dept FY 2018-19 per FTE T/TT Faculty Delaware Norm
UNCG Research Expenditures ($) Per Tenure Tenure Track Faculty FTE Compared to Delaware Study Norm for FY 2018-19***
13.11 ED Counseling and Educational Development CED 0 9240 0%
25.01 ED Library and Information Systems LIS 0 4034 0%
19.07 HH Human Development and Family Studies HDF 325093 67126 484%
30.19 HH Nutrition NTR 63339 173532 36%
31.03 HH Community Therapeutic Recreation CTR 6061 9426 64%
31.05 HH Kinesiology KIN 88772 54673 162%
30.05 HH Peace and Conflict Studies PCS 0 9633 0%
44.07 HH Social Work SWK 169934 10378 1637%
51.02 HH Communication Sciences and Disorders CSD 57869 46626 124%
51.02 HH Genetic Counseling GEN - 11717 #VALUE!
51.22 HH Public Health Education PHE 130972 214053 61%
51.38 NU Nursing NUR 10541 34589 30%
50.03 VP Dance DCE 0 na #VALUE!
50.05 VP Theatre THE 0 2543 0%
50.07 VP Art ART 0 787 0%
50.09 VP Music MUS 0 4343 0%
99.99 U total Institution total 42408
*** The norms are based on Delaware Study participating institutions that award the same level of degree.
Oct. 2020 69 UNCG-IRA

UNCG_Rsch Exp.$ Self-Selected Peers' Ratio of
per FTE T/TT Fac Mean_Rsch$ UNCG_Rsch Exp /CIP School Program Name Dept FY 2018-19 per FTE T/TT Faculty Peer_Mean
5.0201 AS African American and African Diaspora Studies AAD 0 2762 0%5.0207 AS Womens and Gender Studies WGS 0 2675 0%9.0101 AS Communication Studies CST 11,500 490 2347%9.0102 AS Media Studies MST 0 490 0%11.07 AS Computer Science CMP 10,708 60,136 18%16.09 AS Languages, Literatures, and Cultures LLC 4,761 583 817%16.12 AS Classical Studies CLA 37,357 583 6408%23.01 AS English ENG 0 2,067 0%26.01 AS Biology BIO 45,126 90,691 50%27.01 AS Mathematics and Statistics MTH 12,662 7,059 179%38.01 AS Philosophy PHI 0 2,376 0%38.02 AS Religious Studies REL 0 2,376 0%40.05 AS Chemistry & Biochemistry CHE 206,206 63,034 327%40.08 AS Physics PHY 0 56,994 0%42.01 AS Psychology PSY 43,412 19,344 224%45.02 AS Anthropology ATY 112,763 6,714 1680%45.1 AS Political Science PSC 0 2,086 0%45.11 AS Sociology SOC 0 5,927 0%50.041 AS Interior Architecture IAR 47,400 610 7770%54.01 AS History HIS 2,182 3,602 61%11.09 BE Information Systems and Supply Chain Management IMS 0 74,400 0%19.09 BE Consumer, Apparel and Retail Studies CRS 0 67126 0%52.02 BE Marketing MRK 6,732 895 752%52.02 BE Management MNT - 895 #VALUE!52.03 BE Accounting and Finance ACF 0 62 0%52.06 BE Economics ECO 59,690 626 9535%13.03 ED Teacher Ed Higher Ed HED 34,331 16,491 208%13.04 ED Ed Leadership and Cultural Foundations ELC 921 16,491 6%13.06 ED Ed Research Methodology ERM 120,595 16,491 731%13.1 ED Specialized Education Services SES 140,700 18,347 767%13.11 ED Counseling and Educational Development CED 0 11,088 0%25.01 ED Library and Information Systems LIS 0 4034 0%19.07 HH Human Development and Family Studies HDF 325,093 67126 484%
UNCG Research Expenditures ($) Per Tenure Tenure Track Faculty FTE Compared to Delaware Study Norm for FY 2018-19
Oct. 2020 70 UNCG-IRA
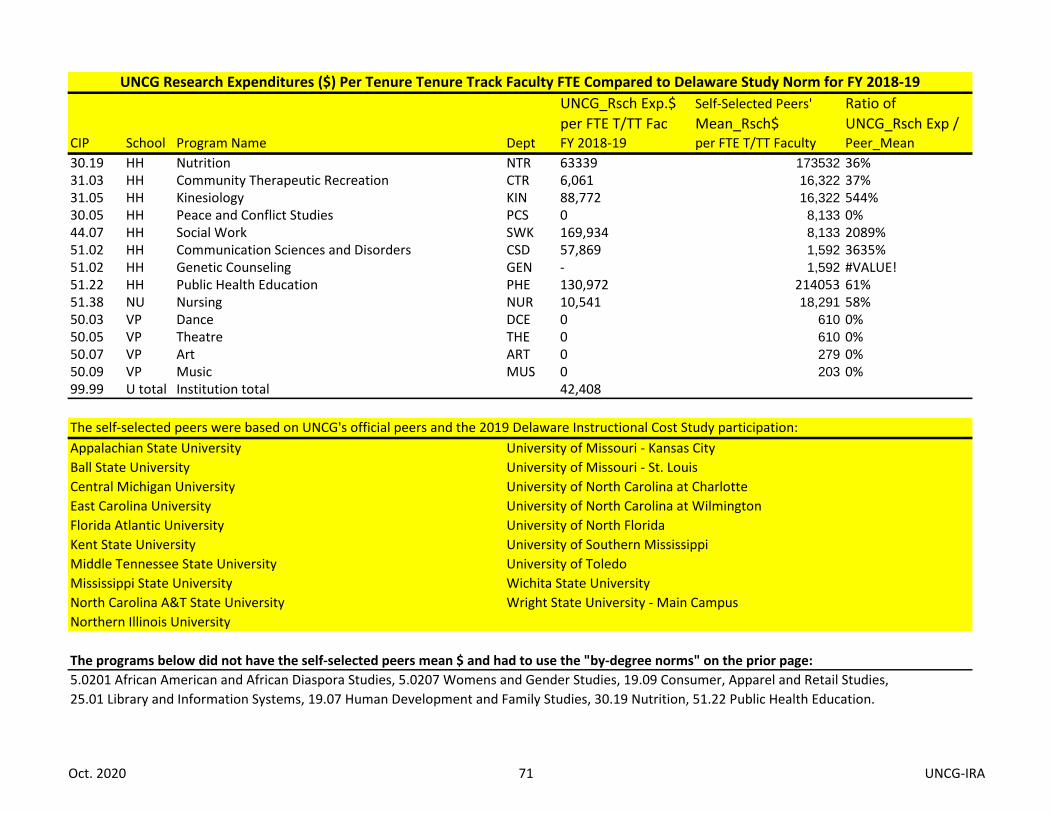
UNCG_Rsch Exp.$ Self-Selected Peers' Ratio of
per FTE T/TT Fac Mean_Rsch$ UNCG_Rsch Exp /CIP School Program Name Dept FY 2018-19 per FTE T/TT Faculty Peer_Mean
UNCG Research Expenditures ($) Per Tenure Tenure Track Faculty FTE Compared to Delaware Study Norm for FY 2018-19
30.19 HH Nutrition NTR 63339 173532 36%31.03 HH Community Therapeutic Recreation CTR 6,061 16,322 37%31.05 HH Kinesiology KIN 88,772 16,322 544%30.05 HH Peace and Conflict Studies PCS 0 8,133 0%44.07 HH Social Work SWK 169,934 8,133 2089%51.02 HH Communication Sciences and Disorders CSD 57,869 1,592 3635%51.02 HH Genetic Counseling GEN - 1,592 #VALUE!51.22 HH Public Health Education PHE 130,972 214053 61%51.38 NU Nursing NUR 10,541 18,291 58%50.03 VP Dance DCE 0 610 0%50.05 VP Theatre THE 0 610 0%50.07 VP Art ART 0 279 0%50.09 VP Music MUS 0 203 0%99.99 U total Institution total 42,408
The self-selected peers were based on UNCG's official peers and the 2019 Delaware Instructional Cost Study participation:
Appalachian State University University of Missouri - Kansas City
Ball State University University of Missouri - St. Louis
Central Michigan University University of North Carolina at Charlotte
East Carolina University University of North Carolina at Wilmington
Florida Atlantic University University of North Florida
Kent State University University of Southern Mississippi
Middle Tennessee State University University of Toledo
Mississippi State University Wichita State University
North Carolina A&T State University Wright State University - Main Campus
Northern Illinois University
The programs below did not have the self-selected peers mean $ and had to use the "by-degree norms" on the prior page:
5.0201 African American and African Diaspora Studies, 5.0207 Womens and Gender Studies, 19.09 Consumer, Apparel and Retail Studies,
25.01 Library and Information Systems, 19.07 Human Development and Family Studies, 30.19 Nutrition, 51.22 Public Health Education.
Oct. 2020 71 UNCG-IRA

UNCG_Rsch Exp.$ Resrch Univ 2 (R2) Ratio ofper FTE T/TT Fac Norm_Rsch$ UNCG_Rsch Exp /
CIP School Program Name Dept FY 2018-19 per FTE T/TT Faculty R2_Norm
5.0201 AS African American and African Diaspora Studies AAD 0 383 0%5.0207 AS Womens and Gender Studies WGS 0 383 0%9.0101 AS Communication Studies CST 11,500 357 3221%9.0102 AS Media Studies MST 0 357 0%11.07 AS Computer Science CMP 10,708 90,001 12%16.09 AS Languages, Literatures, and Cultures LLC 4,761 583 817%16.12 AS Classical Studies CLA 37,357 583 6408%23.01 AS English ENG 0 944 0%26.01 AS Biology BIO 45,126 79,744 57%27.01 AS Mathematics and Statistics MTH 12,662 17,497 72%38.01 AS Philosophy PHI 0 411 0%38.02 AS Religious Studies REL 0 86 0%40.05 AS Chemistry & Biochemistry CHE 206,206 78,733 262%40.08 AS Physics PHY 0 66,725 0%42.01 AS Psychology PSY 43,412 21,445 202%45.02 AS Anthropology ATY 112,763 8,075 1396%45.1 AS Political Science PSC 0 3,669 0%45.11 AS Sociology SOC 0 3,491 0%50.041 AS Interior Architecture IAR 47,400 419 11313%54.01 AS History HIS 2,182 2,729 80%11.09 BE Information Systems and Supply Chain Management IMS 0 90,001 0%19.09 BE Consumer, Apparel and Retail Studies CRS 0 47,874 0%52.02 BE Marketing MRK 6,732 1,535 439%52.02 BE Management MNT - 1,535 #VALUE!52.03 BE Accounting and Finance ACF 0 9 0%52.06 BE Economics ECO 59,690 5,806 1028%13.03 ED Teacher Ed Higher Ed HED 34,331 1,498 2292%13.04 ED Ed Leadership and Cultural Foundations ELC 921 1,498 61%13.06 ED Ed Research Methodology ERM 120,595 1,498 8050%13.1 ED Specialized Education Services SES 140,700 15,573 903%13.11 ED Counseling and Educational Development CED 0 9,288 0%25.01 ED Library and Information Systems LIS 0 4034 0%19.07 HH Human Development and Family Studies HDF 325,093 47,874 679%30.19 HH Nutrition NTR 63,339 173532 36%
UNCG Research Expenditures ($) Per Tenure Tenure Track Faculty FTE Compared to Delaware R2 Norms for FY 2018-19
Oct. 2020 72 UNCG-IRA

UNCG_Rsch Exp.$ Resrch Univ 2 (R2) Ratio ofper FTE T/TT Fac Norm_Rsch$ UNCG_Rsch Exp /
CIP School Program Name Dept FY 2018-19 per FTE T/TT Faculty R2_Norm
UNCG Research Expenditures ($) Per Tenure Tenure Track Faculty FTE Compared to Delaware R2 Norms for FY 2018-19
31.03 HH Community Therapeutic Recreation CTR 6,061 15,499 39%31.05 HH Kinesiology KIN 88,772 15,499 573%30.05 HH Peace and Conflict Studies PCS 0 9,297 0%44.07 HH Social Work SWK 169,934 9,297 1828%51.02 HH Communication Sciences and Disorders CSD 57,869 10,325 560%51.02 HH Genetic Counseling GEN - 10,325 #VALUE!51.22 HH Public Health Education PHE 130,972 143,678 91%51.38 NU Nursing NUR 10,541 16,409 64%50.03 VP Dance DCE 0 419 0%50.05 VP Theatre THE 0 419 0%50.07 VP Art ART 0 172 0%50.09 VP Music MUS 0 138 0%99.99 U total Institution total 42,408
The norms in the above table were based on the Research 2 institutions that participated in Delaware Study in 2019:Ball State University R2 Tennessee Technological University R2Boise State University R2 University of Alabama in Huntsville R2Central Michigan University R2 University of Idaho R2Clarkson University R2 University of Massachusetts - Dartmouth R2College of William & Mary R2 University of Missouri - Kansas City R2Colorado School of Mines R2 University of Missouri - St. Louis R2East Carolina University R2 University of Montana, The R2Florida Atlantic University R2 University of Nebraska at Omaha R2Kent State University R2 University of North Carolina at Charlotte R2Loyola University Chicago R2 University of North Carolina at Wilmington R2Miami University - Ohio R2 University of Rhode Island R2Missouri University of Science and Technology R2 University of Toledo R2Morgan State University R2 University of Vermont R2New Mexico State University - Main Campus R2 Wichita State University R2North Carolina A&T State University R2 Worcester Polytechnic Institute R2Northern Illinois University R2 Wright State University - Main Campus R2Rutgers University - Camden R2
The programs below did not have the R2 norms and had to use the "self-selected peer norms" on the prior page:16.09 Lang, 16.12 Classsical Studies, 25.01 Lib & Infor, 30.19 Nutrition.
Oct. 2020 73 UNCG-IRA

AS Dept 2018-19 Research Exp ($) Per T/TT Faculty FTE Compared to Delaware Mean Norm (1)
CIP School Dept Name Dept UNCG_R_Exp($)/TTT Delaware_Norm ($) UNCG($) / Norm ($) Bub Size
9.0101 AS Communication Studies CST 11500 2294 501% 11500
11.07 AS Computer Science CMP 10708 19797 54% 10708
54.01 AS History HIS 2182 5586 39% 2182
26.01 AS Biology BIO 45126 115347 39% 45126
27.01 AS Mathematics and Statistics MTH 12662 28622 44% 12662
40.05 AS Chemistry & Biochemistry CHE 206206 155825 132% 206206
42.01 AS Psychology PSY 43412 57456 76% 43412
Data Source: Delaware Instructional Cost Study.
CST, 11500, 501%
CMP,10708, 54%
HIS,2182, 39%
BIO, 45126, 39%
MTH, 12662, 44%
CHE, 206206, 132%
PSY, 43412, 76%
0%
100%
200%
300%
400%
500%
600%
0 50000 100000 150000 200000 250000
Per
cen
t o
f U
NC
G R
sch
($
) /T
TT F
ac F
TE a
s o
f D
elaw
are
No
rm
FY 2018-19 UNCG Research ($) Per TTT Fac FTE
AS Dept 2018-19 Research Exp ($) Per T/TT Faculty FTE Compared to Delaware Mean Norm (1)
Oct. 2020 74 UNCG-IRA

AS Dept 2018-19 Research Exp ($) Per T/TT Faculty FTE Compared to Self-selected Peers' Mean (1)
CIP School Dept Name Dept UNCG_R_Exp($)/TTT Peer_Mean($) UNCG($) / Peer($) Bub Size
11.07 AS Computer Science CMP 10708 60136 18% 10708
16.09 AS Languages, Literatures, and Cultures LLC 4761 583 817% 4761
26.01 AS Biology BIO 45126 90691 50% 45126
27.01 AS Mathematics and Statistics MTH 12662 7059 179% 12662
40.05 AS Chemistry & Biochemistry CHE 206206 63034 327% 206206
42.01 AS Psychology PSY 43412 19344 224% 43412
54.01 AS History HIS 2182 3602 61% 2182
Data Source: Delaware Instructional Cost Study.
CMP, 10708, 18%
LLC,4761, 817%
BIO,45126, 50%
MTH, 12662, 179%
CHE, 206206, 327%PSY, 43412, 224%
HIS, 2182, 61%
0%
100%
200%
300%
400%
500%
600%
700%
800%
900%
1000%
0 50000 100000 150000 200000 250000
Per
cen
t o
f U
NC
G R
sch
($
) /T
TT F
ac F
TE a
s o
f Se
lf-S
elec
ted
Pee
rs'
Mea
n
FY 2018-19 UNCG Research ($) Per TTT Fac FTE
AS Dept 2018-19 Research Exp ($) Per T/TT Faculty FTE Compared to Self-Selected Peers' Mean (1)
Oct. 2020 75 UNCG-IRA

AS Dept 2018-19 Research Exp ($) Per T/TT Faculty FTE Compared to R2 Norm (1)
CIP School Dept Name Dept UNCG_R_Exp($)/TTT R2_Norm($) UNCG($)/R2Norm($) Bub Size
11.07 AS Computer Science CMP 10708 90001 12% 10708
16.09 AS Languages, Literatures, and Cultures LLC 4761 583 817% 4761
26.01 AS Biology BIO 45126 79744 57% 45126
27.01 AS Mathematics and Statistics MTH 12662 17497 72% 12662
40.05 AS Chemistry & Biochemistry CHE 206206 78733 262% 206206
42.01 AS Psychology PSY 43412 21445 202% 43412
54.01 AS History HIS 2182 2729 80% 2182
Data Source: Delaware Instructional Cost Study.
CMP, 10708, 12%
LLC,4761, 817%
BIO,45126, 57%
MTH, 12662, 72%
CHE, 206206, 262%
PSY, 43412, 202%HIS, 2182, 80%
0%
100%
200%
300%
400%
500%
600%
700%
800%
900%
1000%
0 50000 100000 150000 200000 250000
Per
cen
t o
f U
NC
G R
sch
($
) /T
TT F
ac F
TE a
s o
f R
2 N
orm
FY 2018-19 UNCG Research ($) Per TTT Fac FTE
AS Dept 2018-19 Research Exp ($) Per T/TT Faculty FTE Compared to R2 Norm (1)
Oct. 2020 76 UNCG-IRA

AS Dept 2018-19 Research Exp ($) Per T/TT Faculty FTE Compared to Delaware Mean Norm (2)
CIP School Dept Name Dept UNCG_R_Exp($)/TTT Delaware_Norm ($) UNCG($) / Norm ($) Bub Size
45.02 AS Anthropology ATY 112763 1760 6407% 112763
50.041 AS Interior Architecture IAR 47400 264 17955% 47400
16.12 AS Classical Studies CLA 37357 82 45557% 37357
Data Source: Delaware Instructional Cost Study.
ATY, 112763, 6407%
IAR,47400, 17955%
CLA,37357, 45557%
0%
10000%
20000%
30000%
40000%
50000%
60000%
0 20000 40000 60000 80000 100000 120000 140000
Per
cen
t o
f U
NC
G R
sch
($
) /T
TT F
ac F
TE a
s o
f D
elaw
are
No
rm
FY 2018-19 UNCG Research ($) Per TTT Fac FTE
AS Dept 2018-19 Research Exp ($) Per T/TT Faculty FTE Compared to Delaware Mean Norm (2)
Oct. 2020 77 UNCG-IRA

AS Dept 2018-19 Research Exp ($) Per T/TT Faculty FTE Compared to Self-Selected Peers' Mean (2)
CIP School Dept Name Dept UNCG_R_Exp($)/TTT Peer_Mean($) UNCG($) / Peer($) Bub Size
9.0101 AS Communication Studies CST 11500 490 2347% 11500
16.12 AS Classical Studies CLA 37357 583 6408% 37357
45.02 AS Anthropology ATY 112763 6714 1680% 112763
50.041 AS Interior Architecture IAR 47400 610 7770% 47400
Data Source: Delaware Instructional Cost Study.
CST, 11500, 2347%
CLA,37357, 6408%
ATY,112763, 1680%
IAR, 47400, 7770%
0%
1000%
2000%
3000%
4000%
5000%
6000%
7000%
8000%
9000%
10000%
0 20000 40000 60000 80000 100000 120000 140000
Per
cen
t o
f U
NC
G R
sch
($
) /T
TT F
ac F
TE a
s o
f Se
lf-S
elec
ted
Pee
rs' M
ean
FY 2018-19 UNCG Research ($) Per TTT Fac FTE
AS Dept 2018-19 Research Exp ($) Per T/TT Faculty FTE Compared to Self-Selected Peers' Mean (2)
Oct. 2020 78 UNCG-IRA
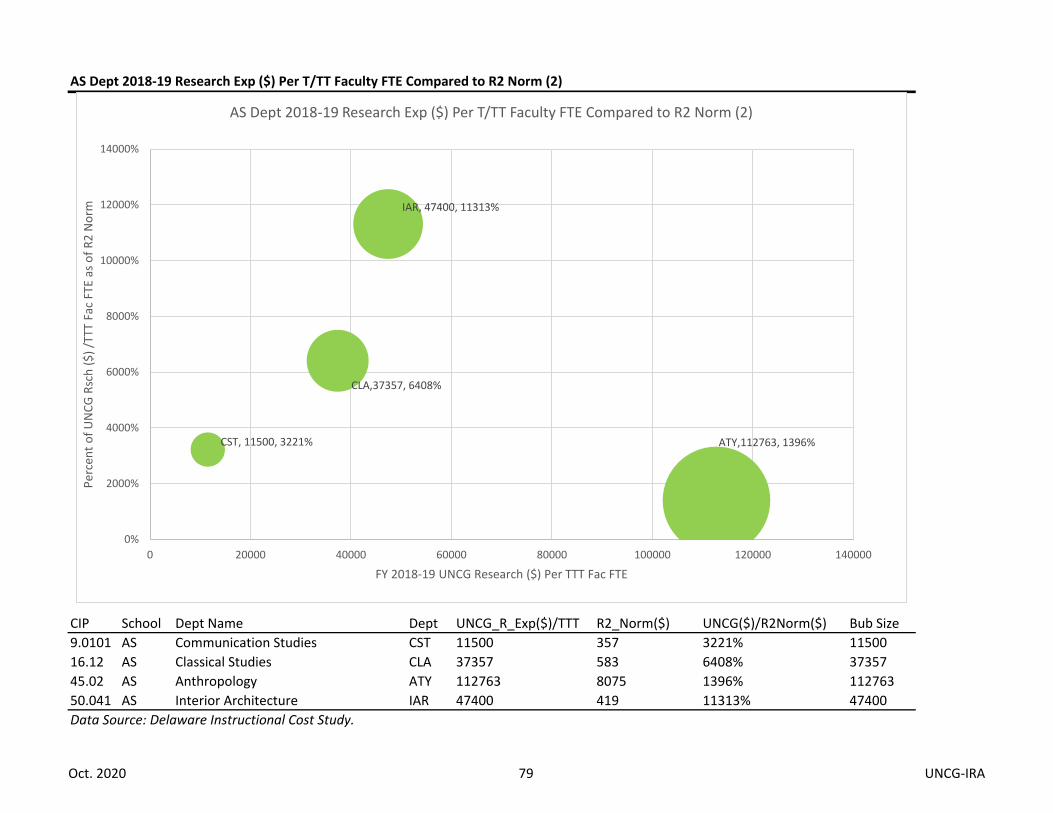
AS Dept 2018-19 Research Exp ($) Per T/TT Faculty FTE Compared to R2 Norm (2)
CIP School Dept Name Dept UNCG_R_Exp($)/TTT R2_Norm($) UNCG($)/R2Norm($) Bub Size
9.0101 AS Communication Studies CST 11500 357 3221% 11500
16.12 AS Classical Studies CLA 37357 583 6408% 37357
45.02 AS Anthropology ATY 112763 8075 1396% 112763
50.041 AS Interior Architecture IAR 47400 419 11313% 47400
Data Source: Delaware Instructional Cost Study.
CST, 11500, 3221%
CLA,37357, 6408%
ATY,112763, 1396%
IAR, 47400, 11313%
0%
2000%
4000%
6000%
8000%
10000%
12000%
14000%
0 20000 40000 60000 80000 100000 120000 140000
Per
cen
t o
f U
NC
G R
sch
($
) /T
TT F
ac F
TE a
s o
f R
2 N
orm
FY 2018-19 UNCG Research ($) Per TTT Fac FTE
AS Dept 2018-19 Research Exp ($) Per T/TT Faculty FTE Compared to R2 Norm (2)
Oct. 2020 79 UNCG-IRA

BE Dept 2018-19 Research Exp ($) Per T/TT Faculty FTE Compared to Delaware Mean Norm
CIP School Dept Name Dept UNCG_R_Exp($)/TTT Delaware_Norm ($) UNCG($) / Norm ($) Bub Size
52.02 BE Marketing MRK 6732 8708 77% 11500
Data Source: Delaware Instructional Cost Study.
MRK, 6732, 77%
0%
10%
20%
30%
40%
50%
60%
70%
80%
90%
100%
0 1000 2000 3000 4000 5000 6000 7000 8000
Per
cen
t o
f U
NC
G R
sch
($
) /T
TT F
ac F
TE a
s o
f D
elaw
are
No
rm
FY 2018-19 UNCG Research ($) Per TTT Fac FTE
BE Dept 2018-19 Research Exp ($) Per T/TT Faculty FTE Compared to Delaware Mean Norm
Oct. 2020 80 UNCG-IRA

BE Dept 2018-19 Research Exp ($) Per T/TT Faculty FTE Compared to Self-Selected Peers' Mean
CIP School Dept Name Dept UNCG_R_Exp($)/TTT Peer_Mean($) UNCG($) / Peer($) Bub Size
52.02 BE Marketing MRK 6732 895 752% 6732
52.06 BE Economics ECO 59690 626 9535% 59690
Data Source: Delaware Instructional Cost Study.
MRK, 6732, 752%
ECO, 59690, 9535%
0%
2000%
4000%
6000%
8000%
10000%
12000%
0 10000 20000 30000 40000 50000 60000 70000
Per
cen
t o
f U
NC
G R
sch
($
) /T
TT F
ac F
TE a
s o
f Se
lf-S
elec
ted
Pee
rs' M
ean
FY 2018-19 UNCG Research ($) Per TTT Fac FTE
BE Dept 2018-19 Research Exp ($) Per T/TT Faculty FTE Compared to Self-Selected Peers' Mean
Oct. 2020 81 UNCG-IRA

BE Dept 2018-19 Research Exp ($) Per T/TT Faculty FTE Compared to R2 Norm
CIP School Dept Name Dept UNCG_R_Exp($)/TTT R2_Norm($) UNCG($)/R2Norm($) Bub Size
52.02 BE Marketing MRK 6732 1535 439% 6732
52.06 BE Economics ECO 59690 5806 1028% 59690
Data Source: Delaware Instructional Cost Study.
MRK, 6732, 439%
ECO, 59690, 1028%
0%
200%
400%
600%
800%
1000%
1200%
0 10000 20000 30000 40000 50000 60000 70000
Per
cen
t o
f U
NC
G R
sch
($
) /T
TT F
ac F
TE a
s o
f R
2 N
orm
FY 2018-19 UNCG Research ($) Per TTT Fac FTE
BE Dept 2018-19 Research Exp ($) Per T/TT Faculty FTE Compared to R2 Norm
Oct. 2020 82 UNCG-IRA

ED Dept 2018-19 Research Exp ($) Per T/TT Faculty FTE Compared to Delaware Mean Norm
CIP School Dept Name Dept UNCG_R_Exp($)/TTT Delaware_Norm ($) UNCG($) / Norm ($) Bub Size
13.03 ED Teacher Ed Higher Ed HED 34331 18902 182% 11500
13.04 ED Ed Leadership and Cultural Foundations ELC 921 8002 12% 10708
13.06 ED Ed Research Methodology ERM 120595 43119 280% 37357
13.1 ED Specialized Education Services SES 140700 39726 354% 45126
Data Source: Delaware Instructional Cost Study.
HED, 34331, 182%
ELC,921, 12%
ERM,120595, 280%
SES, 140700, 354%
0%
50%
100%
150%
200%
250%
300%
350%
400%
450%
0 20000 40000 60000 80000 100000 120000 140000 160000 180000
Per
cen
t o
f U
NC
G R
sch
($
) /T
TT F
ac F
TE a
s o
f D
elaw
are
No
rm
FY 2018-19 UNCG Research ($) Per TTT Fac FTE
ED Dept 2018-19 Research Exp ($) Per T/TT Faculty FTE Compared to Delaware Mean Norm
Oct. 2020 83 UNCG-IRA

ED Dept 2018-19 Research Exp ($) Per T/TT Faculty FTE Compared to Self-Selected Peers' Mean
CIP School Dept Name Dept UNCG_R_Exp($)/TTT Peer_Mean($) UNCG($) / Peer($) Bub Size
13.03 ED Teacher Ed Higher Ed HED 34331 16491 208% 34331
13.04 ED Ed Leadership and Cultural Foundations ELC 921 16491 6% 921
13.06 ED Ed Research Methodology ERM 120595 16491 731% 120595
13.1 ED Specialized Education Services SES 140700 18347 767% 140700
Data Source: Delaware Instructional Cost Study.
HED, 34331, 208%
ELC,921, 6%
ERM,120595, 731%
SES, 140700, 767%
0%
100%
200%
300%
400%
500%
600%
700%
800%
900%
0 20000 40000 60000 80000 100000 120000 140000 160000 180000
Per
cen
t o
f U
NC
G R
sch
($
) /T
TT F
ac F
TE a
s o
f Se
lf-S
elec
ted
Pee
rs' M
ean
FY 2018-19 UNCG Research ($) Per TTT Fac FTE
ED Dept 2018-19 Research Exp ($) Per T/TT Faculty FTE Compared to Self-Selected Peers' Mean
Oct. 2020 84 UNCG-IRA

ED Dept 2018-19 Research Exp ($) Per T/TT Faculty FTE Compared to R2 Norm
CIP School Dept Name Dept UNCG_R_Exp($)/TTT R2_Norm($) UNCG($)/R2Norm($) Bub Size
13.03 ED Teacher Ed Higher Ed HED 34331 1498 2292% 34331
13.04 ED Ed Leadership and Cultural Foundations ELC 921 1498 61% 921
13.06 ED Ed Research Methodology ERM 120595 1498 8050% 120595
13.1 ED Specialized Education Services SES 140700 15573 903% 140700
Data Source: Delaware Instructional Cost Study.
HED, 34331, 2292%
ELC,921, 61%
ERM,120595, 8050%
SES, 140700, 903%
0%
1000%
2000%
3000%
4000%
5000%
6000%
7000%
8000%
9000%
10000%
0 20000 40000 60000 80000 100000 120000 140000 160000 180000
Per
cen
t o
f U
NC
G R
sch
($
) /T
TT F
ac F
TE a
s o
f R
2 N
orm
FY 2018-19 UNCG Research ($) Per TTT Fac FTE
ED Dept 2018-19 Research Exp ($) Per T/TT Faculty FTE Compared to R2 Norm
Oct. 2020 85 UNCG-IRA

HH Dept 2018-19 Research Exp ($) Per T/TT Faculty FTE Compared to Delaware Mean Norm
CIP School Dept Name Dept UNCG_R_Exp($)/TTT Delaware_Norm ($)UNCG($) / Norm ($) Bub Size
19.07 HH Human Development and Family Studies HDF 325093 67126 484% 325093
30.19 HH Nutrition NTR 63339 173532 36% 63339
31.03 HH Community Therapeutic Recreation CTR 6061 9426 64% 6061
31.05 HH Kinesiology KIN 88772 54673 162% 88772
44.07 HH Social Work SWK 169934 10378 1637% 169934
51.02 HH Communication Sciences and Disorders CSD 57869 46626 124% 57869
51.22 HH Public Health Education PHE 130972 214053 61% 130972
Data Source: Delaware Instructional Cost Study.
HDF, 325093, 484%
NTR,63339, 36%
CTR,6061, 64%
KIN, 88772, 162%
SWK, 169934, 1637%
CSD, 57869, 124%
PHE, 130972, 61%
0%
200%
400%
600%
800%
1000%
1200%
1400%
1600%
1800%
2000%
0 50000 100000 150000 200000 250000 300000 350000 400000
Per
cen
t o
f U
NC
G R
sch
($
) /T
TT F
ac F
TE a
s o
f D
elaw
are
No
rm
FY 2018-19 UNCG Research ($) Per TTT Fac FTE
HH Dept 2018-19 Research Exp ($) Per T/TT Faculty FTE Compared to Delaware Mean Norm
Oct. 2020 86 UNCG-IRA

HH Dept 2018-19 Research Exp ($) Per T/TT Faculty FTE Compared to Self-Selected Peers' Mean
CIP School Dept Name Dept UNCG_R_Exp($)/TTT Peer_Mean($) UNCG($) / Peer($) Bub Size
19.07 HH Human Development and Family Studies HDF 325093 67126 484% 325093
30.19 HH Nutrition NTR 63339 173532 36% 63339
31.03 HH Community Therapeutic Recreation CTR 6061 16322 37% 6061
31.05 HH Kinesiology KIN 88772 16322 544% 88772
44.07 HH Social Work SWK 169934 8133 2089% 169934
51.02 HH Communication Sciences and Disorders CSD 57869 1592 3635% 57869
51.22 HH Public Health Education PHE 130972 214053 61% 130972
Data Source: Delaware Instructional Cost Study.
HDF, 325093, 484%NTR,63339, 36%
CTR,6061, 37%
KIN, 88772, 544%
SWK, 169934, 2089%
CSD, 57869, 3635%
PHE, 130972, 61%
0%
500%
1000%
1500%
2000%
2500%
3000%
3500%
4000%
4500%
0 50000 100000 150000 200000 250000 300000 350000 400000
Per
cen
t o
f U
NC
G R
sch
($
) /T
TT F
ac F
TE a
s o
f Se
lf-S
elec
ted
Pee
rs'
Mea
n
FY 2018-19 UNCG Research ($) Per TTT Fac FTE
HH Dept 2018-19 Research Exp ($) Per T/TT Faculty FTE Compared to Self-Selected Peers' Mean
Oct. 2020 87 UNCG-IRA
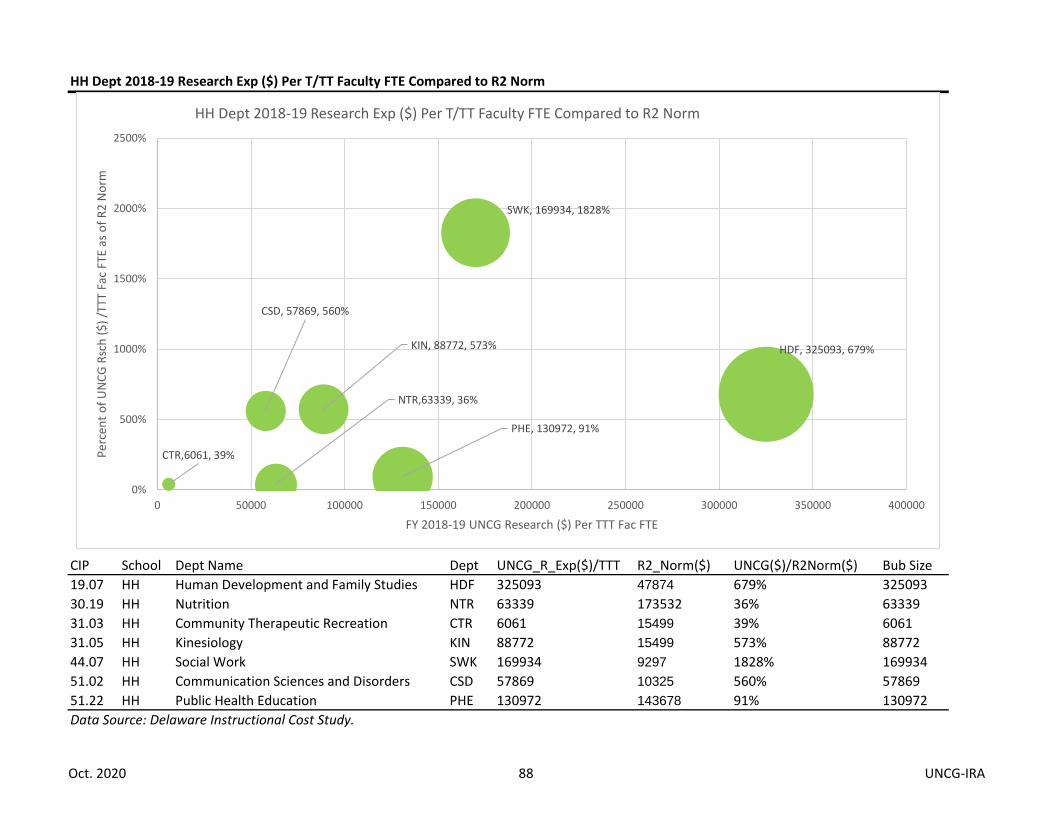
HH Dept 2018-19 Research Exp ($) Per T/TT Faculty FTE Compared to R2 Norm
CIP School Dept Name Dept UNCG_R_Exp($)/TTT R2_Norm($) UNCG($)/R2Norm($) Bub Size
19.07 HH Human Development and Family Studies HDF 325093 47874 679% 325093
30.19 HH Nutrition NTR 63339 173532 36% 63339
31.03 HH Community Therapeutic Recreation CTR 6061 15499 39% 6061
31.05 HH Kinesiology KIN 88772 15499 573% 88772
44.07 HH Social Work SWK 169934 9297 1828% 169934
51.02 HH Communication Sciences and Disorders CSD 57869 10325 560% 57869
51.22 HH Public Health Education PHE 130972 143678 91% 130972
Data Source: Delaware Instructional Cost Study.
HDF, 325093, 679%
NTR,63339, 36%
CTR,6061, 39%
KIN, 88772, 573%
SWK, 169934, 1828%
CSD, 57869, 560%
PHE, 130972, 91%
0%
500%
1000%
1500%
2000%
2500%
0 50000 100000 150000 200000 250000 300000 350000 400000
Per
cen
t o
f U
NC
G R
sch
($
) /T
TT F
ac F
TE a
s o
f R
2 N
orm
FY 2018-19 UNCG Research ($) Per TTT Fac FTE
HH Dept 2018-19 Research Exp ($) Per T/TT Faculty FTE Compared to R2 Norm
Oct. 2020 88 UNCG-IRA
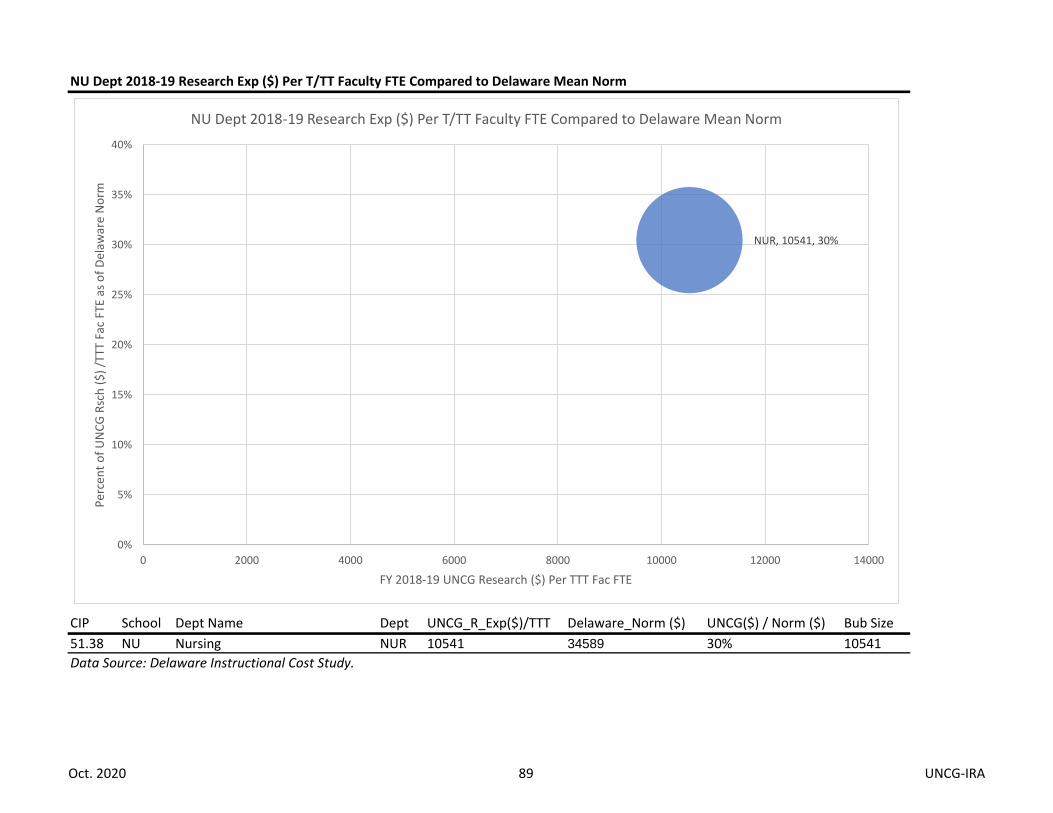
NU Dept 2018-19 Research Exp ($) Per T/TT Faculty FTE Compared to Delaware Mean Norm
CIP School Dept Name Dept UNCG_R_Exp($)/TTT Delaware_Norm ($) UNCG($) / Norm ($) Bub Size
51.38 NU Nursing NUR 10541 34589 30% 10541
Data Source: Delaware Instructional Cost Study.
NUR, 10541, 30%
0%
5%
10%
15%
20%
25%
30%
35%
40%
0 2000 4000 6000 8000 10000 12000 14000
Per
cen
t o
f U
NC
G R
sch
($
) /T
TT F
ac F
TE a
s o
f D
elaw
are
No
rm
FY 2018-19 UNCG Research ($) Per TTT Fac FTE
NU Dept 2018-19 Research Exp ($) Per T/TT Faculty FTE Compared to Delaware Mean Norm
Oct. 2020 89 UNCG-IRA

NU Dept 2018-19 Research Exp ($) Per T/TT Faculty FTE Compared to Self-Selected Peers' Mean
CIP School Dept Name Dept UNCG_R_Exp($)/TTT Peer_Mean($) UNCG($) / Peer($) Bub Size
51.38 NU Nursing NUR 10541 18291 58% 10541
Data Source: Delaware Instructional Cost Study.
NUR, 10541, 58%
0%
10%
20%
30%
40%
50%
60%
70%
0 2000 4000 6000 8000 10000 12000 14000
Per
cen
t o
f U
NC
G R
sch
($
) /T
TT F
ac F
TE a
s o
f Se
lf-S
elec
ted
Pee
rs' M
ean
FY 2018-19 UNCG Research ($) Per TTT Fac FTE
NU Dept 2018-19 Research Exp ($) Per T/TT Faculty FTE Compared to Self-Selected Peers' Mean
Oct. 2020 90 UNCG-IRA

NU Dept 2018-19 Research Exp ($) Per T/TT Faculty FTE Compared to R2 Norm
CIP School Dept Name Dept UNCG_R_Exp($)/TTT R2_Norm($) UNCG($)/R2Norm($) Bub Size
51.38 NU Nursing NUR 10541 16409 64% 10541
Data Source: Delaware Instructional Cost Study.
NUR, 10541, 64%
0%
10%
20%
30%
40%
50%
60%
70%
80%
0 2000 4000 6000 8000 10000 12000 14000
Per
cen
t o
f U
NC
G R
sch
($
) /T
TT F
ac F
TE a
s o
f R
2 N
orm
FY 2018-19 UNCG Research ($) Per TTT Fac FTE
NU Dept 2018-19 Research Exp ($) Per T/TT Faculty FTE Compared to R2 Norm
Oct. 2020 91 UNCG-IRA