a case study of potential reasons of increased soil
TRANSCRIPT

agronomy
Review
A Case Study of Potential Reasons of Increased SoilPhosphorus Levels in the Northeast United States
Lakesh K Sharma Sukhwinder K Bali and Ahmed A Zaeen
Department of Cooperative Extension University of Maine 57 Houlton Rd Presque Isle ME 04769 USAahmedzaeenmaineedu Correspondence lakeshsharmamaineedu (LKS) Sukhwinderbalimaineedu (SKB)
Received 17 November 2017 Accepted 14 December 2017 Published 18 December 2017
Abstract Recent phosphorus (P) pollution in the United States mainly in Maine has raised somesevere concerns over the use of P fertilizer application rates in agriculture Phosphorus is the secondmost limiting nutrient after nitrogen and has damaging impacts on crop yield if found to be deficientTherefore farmers tend to apply more P than is required to satisfy any P loss after its application atplanting Several important questions were raised in this study to improve P efficiency and reduceits pollution The objective of this study was to find potential reasons for P pollution in waterbodies despite a decrease in potato acreage Historically the potato was found to be responsiblefor P water contamination due to its high P sensitivity and low P removal (25ndash30 kg haminus1) fromthe soil Despite University of Maine recommended rate of 56 kg haminus1 P if soil tests reveal that Pis below 50 kg haminus1 growers tend to apply P fertilizer at the rate of 182 kg haminus1 to compensate forany loss The second key reason for excessive P application is its tendency to get fixed by aluminum(Al) in the soil Soil sampling data from UMaine Soil Testing Laboratory confirmed that in Mainereactive Al levels have remained high over the last ten years and are increasing further LikewiseP application to non-responsive sites soil variability pH change and soil testing methods were foundto be other possible reasons that might have led to increases in soil P levels resulting in P erosion towater streams
Keywords phosphorus use efficiency environmental pollution agriculture potato
1 Introduction
Following the green revolution the use of chemical fertilizer has increased (Figure 1) inagricultural crop production The fertilizer consumption has not only increased crop yield butalso deteriorated environmental conditions [1] Phosphorus (P) efficiency was calculated by thesimple calculation of total fertilizer P uptake by potato per hectare divided by total fertilizer appliedTotal mineralized P per hectare was also added to the total P applied The efficiency of P in Maineis only ~17 However the efficiency of applied P fertilizer was found to be 16 Since its use as afertilizer P pollution in United States water streams has been a challenge However not many effortsare carried out to stop its erosion from agriculture fields to nearby water bodies Due to a lack ofknowledge about the impact of soil P erosion into the water bodies P pollution has created a gravedanger to our wildlife The P pollution in the Northeast United States has been reported by severalstudies carried out by the Environmental Protection Agency (EPA) [2]
In the United States the application rates of the primary fertilizers containing nitrogen (N)phosphorus (P) and potassium (K) has increased (Figure 1) [3] The P consumption grew at thebeginning of 1960 near the green revolution and then fell after 1980 following reports of P erosionto lakes and rivers in the United States [4ndash6] However it again started increasing after 2010 despiteseveral government regulations in place In the past potato cultivation was found to be responsible
Agronomy 2017 7 85 doi103390agronomy7040085 wwwmdpicomjournalagronomy
Agronomy 2017 7 85 2 of 15
for P pollution among Northeast lakes due to unnecessary P fertilizer application Currently Pconcentrations have been found to be increasing in northeast lakes and rivers [2] raising legitimatequestions regarding the amounts of P applied in agriculture production
Figure 1 The trend of nitrogen phosphorus and potassium consumption in the United States underall agriculture crops since 1960 (a) represents all the fertilizer together However (b) representsonly phosphorus use in the whole United States The horizontal axis represents the years and thevertical axis shows the consumption rate Source United States Department of Agriculture NationalAgricultural Statistics Service
State-wise P consumption was compared under potato cultivation from crucial potato growingregions It was found that P use has declined (Figure 2) which could be due to a decrease in the areaunder potato cultivation but the question remains as to why P pollution is high Therefore average Pwas analyzed where Minnesota and North Dakota states were found to exhibit an increasing trend(Figure 3) However the P application rate was found to be decreasing in Maine but the decrease wasfound to be insignificant (Figure 3) which suggested that there is sufficient P available or a buildup inthe soil to support optimal potato yield
Agronomy 2017 7 85 3 of 15
Figure 2 The trend of total phosphorus use for potato cultivation in the significant potato-growingstates since 1990 The polynomial regression analysis was utilized to investigate a potential relationshipbetween years and phosphorus use Idaho yield is represented on secondary due to the high matrixSource USDA National Agricultural Statistics Service and New England Ag Statistics
Figure 3 The trend of average phosphorus (kg haminus1) for potato cultivation in the significantpotato-growing states since 1990 The polynomial regression analysis was utilized to investigatea potential relationship between years and phosphorus use Source USDA National AgriculturalStatistics Service and New England Ag Statistics
Potato growers tend to apply more P than recommended to compensate for any P loss tounavailable forms (Figure 3) (eg in Minnesota and North Dakota) [3] In Maine 58000 tons of
Agronomy 2017 7 85 4 of 15
chemical fertilizer were applied on more than 101171 ha of land which mostly includes crops suchas potatoes apples blueberries and forage [3] Presently potato cultivation is again under scrutinyas a result of increased P pollution recently found in Mainersquos lakes and rivers because of historicalassociation that potato cultivation is responsible for P pollution In Florida potato cultivation hasbeen found to be responsible for P loss to St Johns River [7] A study by the United States GeologicalSurvey (USGS) confirmed that nearly 300 million acres representing ~71 of United States croplandhas at least one of four contaminants (dissolved nitrate total phosphorus fecal coliform bacteriaand suspended sediment) creating water quality issues [8] In Maine Environmental Protection Agency(EPA) has raised concerns over the non-point source of phosphorus (P) eg agricultural practices thatled to increasing the concentration of P in nearby water bodies [9] The total impaired hectares due toP pollution were found to be 14407 [9] In 2014 the total P applied in potatoes in Maine was 3550 twith average 182 kg haminus1 [3] The P uptake in potato is very low with an average of ~28 kg haminus1 [10]and since only 10 [11] of applied P is available for potatoes its efficiency becomes dramatically lowresulting in P erosion to water streams
The three basic ways that P can enter water resources are run-in runoff and leaching P wasfound to be the primary cause of poor water quality in freshwater sources [12] It is estimated that10ndash40 of the P movement to water bodies from agricultural land occurs through soil runoff andleaching [13] A concentration of P more than 002 parts per million (ppm) in water creates a severeproblem of eutrophication [14] High P levels have been recorded in Mainersquos lakes and rivers resultingin a need to manage P levels to reduce eutrophication [15] Soil testing is a vital tool that allowsfarmers to know the nutrient status of their farm soil but despite recommendations from every stateP pollution is increasing which indicates that there is an over application of P fertilizer Several studieshave been conducted since the 1940s [16ndash24] but so far answers regarding P requirements especiallyfor potatoes have not been clear
Several reasonable questions arise with high P levels in Mainersquos water bodies
1 Do Mainersquos soils have sufficient P to support optimum crop yield2 Were P recommendations developed from responsive sites3 Is there any gap between average P removal by the crop and application as fertilizer4 Are appropriate soil testing methods used for P
2 Sufficient Soil P and Soil Variability
UMaine Soil Testing Laboratory data from 2006ndash2015 was analyzed and ~85 of soil samples inMaine were found to have sufficient P (Figure 4a) ie in the range of between 24ndash56 kg haminus1 Since 2006significant P has been applied to Maine agriculture systems irrespective of the recommendation fromUMaine Soil Testing Laboratory and this may be responsible for the P pollution in Mainersquos lakes andrivers Among all the samples 5 exhibited more than 56 kg haminus1 of P and 10 of soil samples wereP deficient The steady application of P over an extended period may have resulted in massive soilP buildup [25ndash27] The question is that if the soil has sufficient P then why is it that growers tend toapply more P
One reason is that growers apply P to protect themselves from any P deficiency due to P soilerosion They apply P to ensure a sufficient supply to the crops and to follow the philosophy of soilnutrient buildup and maintenance The low price of P supports its excessive application The secondimportant reason is a high level of soil reactive aluminum (Al) especially when pH is low 5ndash6 [28]Soil reactive Al may fix applied P and leave limited P for crop plants Currently the typical pH rangein Maine is between 49ndash6 The Al a dominant cation at low pH reacts with P and forms aluminumphosphate a crystalline structure which further converts itself to amorphous aluminum phosphate [28]A regression line was used to predict the trend The Al shows a gradual increase in its level over timein Aroostook County soils (Figure 4b) This trend indicates a high possibility that P might be fixed inhigh amounts in Mainersquos soil
Agronomy 2017 7 85 5 of 15
Figure 4 The soil phosphorus and aluminum levels in Aroostook County Maine UMaine SoilTesting Laboratory received soil samples from 2006ndash2015 (a) Change in phosphorus levels with time(b) change in aluminum levels with time The trend is positive and shows the significant relationshipof soil phosphorus buildup with successive years
In another study in Maine by Sharma et al [23] no P was applied and the maximum yield wasobtained as 59 t haminus1 (Figure 5) when the average Maine potato yield was 44 t haminus1 [3] and farmeryield was ~53 t haminus1 from the same field with a P rate of 182 kg haminus1 This confirmed that manybut not all farms in Maine might have enough P for maximum optimal potato yield
Soils in Maine have improved their fertility levels due to crop and livestock production andhigh fertilizer applications [24] Manure application and organic agriculture are other reasons forthe improvement in soil fertility The P concentration in the Northeast United States soil samplesexcluding Ohio was found to be more than 50 parts per million (ppm) with Bray P-1 [24] In theNortheast States over 50 of annual soil test results showed high levels of plant-available P [21]This indicates vast P soil reserves build up from unnecessary P applications because many of thesestates have determined soil P recommendations from non-responsive P sites Consequently they didnot find an ideal P rate for optimal yield The amount of work required increased by the need todevelop recommendations for multiple regions that consider the effects of different soil types climatescrop growth habits and crop requirements
Agronomy 2017 7 85 6 of 15
Figure 5 Representing potato yield response with CAN (calcium ammonium nitrate) rates when nophosphorus was applied in 2016
Several studies documented that soil type variation could have a significant impact on P responsetowards crop yield [29ndash33] as demonstrated in the introduction A study at University of Kentucky onP showed the differences that occurred from testing soil P (Mehlich III solution) using different soilswith the same rate of P application [33] Therefore it was necessary to study the soil types in Maineand Aroostook County Maine There are 21 soil mapping units in Maine and out 21 15 mapping unitsare present in Aroostook County a major potato growing area in Maine (Tables 1 and 2) Soils behavedifferently towards P response crop yield P supplying ability and P retention They may further varyin their P distribution within the landscape (Table 1) Table 2 shows that there are soils containinggravel or stone with apparent good drainage which may move P to groundwater and near streamsHowever silt loam soils could retain more P The soil order in Maine with significant distributionis Spodosols which is susceptible to P deficiency with the third minimum distribution of P among12 orders (after Andisols and Vertisols) [34]
Table 1 Parent material and mapping unit present in Maine under all crops in 1917
Parent Material Mapping Unit
Soils in Basal Till
Monson-Elliottsville-Ricker-TelosTelos-Monarda-Monson-Elliottsville
Aurelie-Daigle-Perham-BurnhamPlaisted-Penquis-Thorndike-Howland
Dixfield-Colonel-Lyman-BraytonSkerry-Hermon-Monadnock-Colonel
Lyman-Tunbridge-Dixfield
Soils in Loose Till
Danforth-Masardis-ShirleyDixmont-Thorndike-Monarda-Burnham
Caribou-Mapleton-ConantHermon-Brayton-Dixfield
Enchanted-Saddleback-Ricker
Agronomy 2017 7 85 7 of 15
Table 1 Cont
Parent Material Mapping Unit
Soils in Glaciofluvial MaterialsColton-Adams-Sebago
Adams-Croghan-NaumburgMasardis-Stetson-Adams
Soils in Glaciolacustrine or Glaciomarine MaterialsSwanville-Boothbay-Biddeford
Scantic-Lamoine-Buxton-LymanNicholville-Buxton-Dixfield-Scantic
Soils in Recent Alluvium Cornish-Fryeburg-Podunk-Ondawa
Soils in Organic Materials Vassalboro-Sebago-Wonsqueak
Soils in Organic Materials and Sandy Materials Sulfihemist-Beaches-Adams-Dune land
Source The United States Department of Agriculture Soil Survey of Aroostook County Area Maine by Hurst et al(1917) [35]
Table 2 Type of soils in Aroostook County a major potato growing area in Maine in 1917
County Name Soil Type
Aroostook County
Caribou stony teamCaribou shale loam
Caribou gravelly loamCaribou fine sandy loam
Caribou loamCaribou silt loamWashburn loamChapman loam
Easton loamLinneus silt loam
Van Buren sandy loamVan Buren silt loam
Keegan silt loamAroostook silt loam
Muck
Source The United States Department of Agriculture Soil Survey of Aroostook County Area Maine by Hurst et al(1917) [35]
3 P Recommendations and Soil pH
The change in pH was examined because of the high influence of soil pH on soil P availabilityThe UMaine Soil Testing Laboratory data from 2006ndash2015 was used to determine the change in pHover the time
The soil pH in Maine has improved since the past ten years (Figure 6) mostly after the Precommendations were developed The pH of Maine potato soils has increased due to a switchfrom round white varieties to scab resistant Russet Burbank potato variety and because farmersare interested in growing grains and other rotation crops that require higher soil pH HoweverP recommendations in Maine were developed when the average pH was around 5 (20 years ago)the soil pH has since improved to ~6 (at the present time) and is expected to improve further due tomore emphasis on growing grains Figure 6a is an average of ~1000 soil samples from Maine eachyear The distribution and correlation value (r2 = 044) confirm that the increase in soil pH was gradualSimilarly the increase in levels of calcium (Figure 6b) with a significant coefficient of correlation(r2 = 070) also confirmed that farmers applied lime to improve their soil pH
Agronomy 2017 7 85 8 of 15
Figure 6 The trend of change in soil pH and calcium level over time (2006ndash2015) in Aroostook County(a) Change in pH (b) a shift in calcium level with time
A study by Fitzgerald et al [23] to develop P recommendations proved that there was sufficientP available in Maine soils Only one site (r2 = 066) out of 12 showed a positive P response It wasimportant that the sites with no P response had high to too high P availability Since there was notsufficient data to develop P recommendations in Maine researchers recommended a minimum of~56 kg haminus1 of P application when the P value found between 22ndash56 kg haminus1 Although the minimumapplication rate of 56 kg haminus1 is not too high then again it could lead to excessive P erosion to Mainersquoswater resources Besides given that the average P rate application in Maine is ~182 kg haminus1 [3] it isclear that farmers are over fertilizing their soil unnecessarily when ~85 of the soil samples from thelast ten years were found with high P levels
The critical P concentration is the minimum P for maximum yield Soil testing is a standard methodto determine the soil P level and required level of additional P application if the soil P level is foundless than the threshold value The threshold value is specific to each soil P test [36ndash38] These specificP values for the individual test were developed after calibration and experimentation used to calculateoptimum P rate with the maximum economic return In-season P application is an approach to correctany P deficiency [39] However this approach was questioned since there was no consistent relationshipbetween what was reported between petiole P and potato yield [40] The other important method toimprove P recommendations is to identify and quantify the critical P value for potatoes The approach ofcritical P value in potatoes was first used by Zamuner et al [41] in Argentina
In early 1945 potato production was believed to be responsible for increasing plant-availableP levels in the eastern United States [16] when modified Truog method was in frequent useThe amount of available P in soil samples from cultivated land in Alabama Virginia and New Yorkwas found to be ~68 times more than the nearby virgin soils [16] During the same period the availableP levels in Maine showed a positive linear relationship with estimated P applied to the soils from thelast 20 years [17] However the elevated P levels in the soils were attributed to the low tuber P removalcompared to the amount of P applied for example in 1947 only 11 of the P that was applied toMaine potato cultivation was removed from the field within harvested tubers
Hawkins et al [17] studied Maine potato soils in 1947 to evaluate the fertility status of the soils inrelation to fertilizer application and crop rotation They found that 5 of 11 sites showed no yield response
Agronomy 2017 7 85 9 of 15
to P fertilizer Modified Truog P levels at the sites ranged from 49 to 328 kg P haminus1 with most containingmore than 121 kg P haminus1 The unresponsive sites included the four soils testing highest in plant-availableP Soils requiring the higher P applications for optimal yield tend to have lower plant-available P levelsand no yield responses to the addition of the highest rate of P fertilizer seen at any sites The lowest-testingsoil not only was unresponsive to P fertilizer additions but it also showed the highest yield Althoughfour different varieties (cultivars Green Mountain Katahdin Irish Cobbler and Chippewa) were grownin this experiment no site contained more than one variety and so it was impossible to examine varietaldifferences in response These results demonstrate that it was possible to produce an optimum yield of apotato crop without the addition of P fertilizer However it is also evident that the modified Truog testcould not consistently identify the responsive sites which could be due to the limiting factors eg soil withsame plant-available P level perform differently depending upon other parameters such as climate [17]
4 Gap in Fertilizer Application and P Removal
The crop response to applied P fertilizer depends on the soil P availability and crop uptake abilityThe available P can slowly be replenished but depends upon the uptake speed and behavior of the crop [42]Once the crop absorbs the available P from the soil solution it can slowly be replenished by the unavailableor stable form of P The plantrsquos ability to take up available soil P from soil solution further dependson its root distribution [42ndash44] In potatoes P is applied as a banded application for direct contact ofpotato roots to P fertilizer but the amount of rainfall (Figure 7a) after planting and before potato P uptakecreates a window for P fertilizer to move deeper or to be fixed in unavailable or marginally availableforms In contrast lack of P movement in some instances could lead to less P availability under bandedapplication treatments compared to broadcast application Figure 7b demonstrates that the maximumamount of total rainfall in Maine occurs after potato planting in June (40) The potato planting in Mainehappens in late May and early June especially in the high potato growing area that is northern Mainetherefore most of the P applied to potatoes or cultivated after the potato season is highly prone to erosion
Figure 7 (a) The bar graph shows the variation in rainfall across different towns in Maine from the south(Portland Augusta and Bangor) to the north (Millinocket Houlton and Caribou) (b) The pie graphrepresents the variation in rainfall within the months (c) The scatter plot represents the relationshipbetween the yearly sum of rainfall and potato yield of the last 21 years
Agronomy 2017 7 85 10 of 15
There is evidence that the P available from the soil may be sufficient to allow the reduction orelimination of P fertilizer applications to potatoes [23] Maier et al [19] studied potato crop responseto P fertilizer at 33 sites in South Australia using Kennebec Coliban Exton Sebago and RussetBurbank varieties When sites were grouped according to the soil textures relative yield (100 times yieldat 0 P rate)maximum yield) approached 100 on the soils with the highest initial plant-availableP level This pattern held true for measurements made using all of the seven plant-available Pextraction methods examined (Colwell Olsen Bray I Bray II Lactate Mehlich I and fluoride methods)Several studies have reported low potato P uptake or removal from the soil (Table 3) It was alsofound that the P uptake numbers varied substantiallyand that could be due to the differences inpotato varieties
Table 3 List of studies reported potato phosphorus uptake in different regions
Researcher Name Year Amount of P Removed Potato Variety
Porter and McBurnie [22] 1999 12 kg haminus1 cv Superior and AtlanticFitzgerald et al [23] 1995 11ndash19 kg haminus1 cv AtlanticFitzgerald et al [23] 1996 12ndash22 kg haminus1 cv Atlantic
Carpenter and Murphy [29] 1965 144 kg haminus1 cv KatahdinMurphy and Carpenter [30] 1967 20 kg haminus1 cv Kennebec
Stark et al [10] 2004 28 kg haminus1 cv Russet Burbank
5 Discrepancies in Soil P Testing
Water could be used to extract P from the soil However due to the lack of significant leftoverundissolved P and analysis difficulties of water as an extractant several extractants have been proposedto extract forms of P in soils The Truog method [45] uses dilute H2SO4 buffered to pH 30 The Braymethod which uses a combination of HCl and NH4F was used to extract acid soluble P forms mostlyAl and Fe-bound P [46] in the North Central states In 1953 another combination (Mehlich 1) HCland H2SO4 acids were introduced to extract the P and other nutrients in southeastern soils [47]In 1984 Mehlich further modified earlier extractants to Mehlich 3 a combination of acetic acid (HOAc)and nitric (HNO3) acid salts (ammonium fluoride (NH4F) and ammonium nitrate (NH4NO3))The chelating agent ethylenediaminetetraacetic acid (EDTA) is suitable for both acidic and neutralsoils In alkaline soils 05 M sodium bicarbonate (NaHCO3) solution at a pH of 85 is used to extractP [48] In 2000 anion exchange resin (AER) [14] and Fe-oxide impregnated paper (IIP) methods wereintroduced In those methods the thought of P sink was used to imitate plant root systems andmeasure the amount soil P available for absorption by the plants but due to its high labor requirementand longer time requirement this test was found to be impractical to follow However with recentdevelopments in filter paper and FeO precipitates this test could be used as an alternative to otherstandard P tests [49ndash52]
The typical soil test for P is modified Morgan in Northeast states due to the regionrsquos acidic soilsand low (less than 20) cation exchange capacity (CEC) Modified Morgan uses 062 M NH4OAc +125 M CH3COOH at pH 48 Soil tests from the last ten years in Maine showed increases in soil Pwith an average value of ~32 kg haminus1 The optimum range of P in soils for potatoes as recommendedby UMaine Soil Testing Laboratory is between 20ndash50 kg haminus1 but farmers still apply P on their soilwhich means the excess P that is being applied to soil results in P erosion to Mainersquos water sourcesThe optimum range (20ndash50 kg haminus1) which is quite broad with a range of 30 kg haminus1 reflects theoverall uncertainty in potato P response Few P research studies were found in the literature that wereperformed in New England However P recommendation studies and their results have never beenpublished making it difficult for growers and researchers to amend their cultural practices or scientificresearch for better P guidelines
Unfortunately none of these results including Maine can be used to refine current recommendationsfrom the University of Maine The UMaine Soil Testing Laboratory stopped using the modified Truog
Agronomy 2017 7 85 11 of 15
plant-available P method and adopted the modified Morgan method (NH4-acetate) in the 1960s initiallyat pH 30 but later standardized to pH 48 With some modifications Cornell Universityrsquos fertilizerrecommendation scheme was adopted for use with the original Morgan extract However little calibrationwork has been performed in Maine to support these recommendations Experiments on the Universityof Maine Agricultural and Forest Experiment Stationrsquos Aroostook Research Farm indicate that therecommendations for soils testing around 22 kg P haminus1 (modified Morgan extract) are adequate (G Porterunpublished data) Until now no study had been conducted to test the quality of these recommendationsfor Aroostook County potato soils testing above 22 kg P haminus1
The P recommendation study was done in 1999 in Maine where only one site out of 12 wasfound to exhibit a significant P response towards potato yield [23] The study was published as athesis There were 12 sites where pre-planting soil tests were conducted using Modified Morgan andMehlich III P tests The data was analyzed after doing a linear correlation between the P numbersfrom two tests (Figure 8) A weak correlation was found (R2 = 027) indicating a weak relationshipbetween the two methods Although there was some relationship between Mehlich III extractant andpotato yield it was weak with small r2 value which means it may not explain yield variability Alsothe relationship between the P value from Mehlich III and yield was inconsistent Therefore use ofMehlich III for P recommendations is questionable In contrast leaf and tuber P concentration wasreported to increase with P rates using both Mehlich II and Modified Morgan This inconsistencyindicates the need to revise the recommendations using low P sites in Maine
Figure 8 The correlation between the two phosphorus tests The two tests were used on the same soilsamples from 12 sites over the two years
6 Conclusions
It is clear that soils in Maine are highly variable and may have sufficient P to support the maximumcrop yield Therefore it is necessary to recalibrate the recommendation equation using low mediumand high P sites Also while developing P recommendations it is essential to differentiate betweensoil types and regions because of differences in soil variability and soil moisture both of which mayact as significant driving forces for plant growth and nutrient movement in plant roots The studyfound that P recommendations need to be revised in order to consider soil variability and recalibrationof soil P test The average results from soil P tests have increased and that is a clear signal of P buildupin Mainersquos soils which have a history of excessive P application Improvement in soil pH after thedevelopment and implementation of P recommendations raises questions about the credibility ofthe recommendations The study recommends more detailed recommendations which considerisoil types climate variables and cultivation system (number of crop rotation) using multiyear datafrom low medium high and above optimum P level sites The study also found it to be crucial toconsider the type of potato growers eg table stock growers seed growers and processing growerswhile developing P recommendations We suggest that while developing P recommendations it maybe essential to differentiate between soil types and regions For example in North Dakota United
Agronomy 2017 7 85 12 of 15
States for N in corn sunflower and wheat [53ndash61] recommendations were developed consideringsoil variability the price of the commodity cultivation system yield potential and soil moistureIt was found that there is a need to examine banded application according to the crop root systemdevelopment because banded application P stays where it is applied However roots grow beyondthe P fertilizer band An outreach program from the University of Maine is required to guide anddemonstrate to the growers the details of P response under high and low P soil sites More educationand training among growers may help in lessening P pollution because the growers are generallythe ones responsible for making the decisions on P rates in their fields An explanatory extensionpublication on P recommendation procedure and its accompanying equation could help growers tounderstand how P rates are calculated and decided for a specific area
Acknowledgments We are thankful to University of Maine and University of Kentucky for allowing us to usetheir data for the best representation of this article
Author Contributions Sharma and Bali contacted the UMaine Soil Laboratory for data processing Both wrotethis article in collaboration Ahemd Zaeen refined the language and held in collection of review literature
Conflicts of Interest There is no conflict of interest Also any data used in the article was done so after obtainingpermission from the concerned person(s)
References
1 IOM (Institute of Medicine) NRC (National Research Council) A Framework for Assessing Effects of the FoodSystem The National Academies Press Washington DC USA 2015
2 EPA 2015 Available online httpswwwepagovaboutepaepa-region-1-new-england (accessed on17 December 2017)
3 USDA-NASS 2016 Available online https (accessed on 1 April 2017)4 Almazan JA Pickett RL Water temperature In IFYGL Atlas Lake Ontario Summary Data Jenkins CF Ed
Great Lakes Environmental Research Laboratory Ann Arbor MI USA 1980 pp 200ndash2445 Assel RA Boyce DE DeWitt BH Wartha JH Keyes FA Summary of Great Lakes Weather and Ice
Conditions Winter 1977ndash78 NOAA Technical Memorandum ERL GLERL-26 Great Lakes EnvironmentalResearch Laboratory Ann Arbor MI USA 1979
6 Bell GL Lake Erie Chemical and Physical Characteristics Data for 1967 NOAA Data Report ERL GLERL-4Great Lakes Environmental Research Laboratory Ann Arbor MI USA 1980 p 9
7 Pack JE Hutchinson CM Simonne EH Evaluation of Controlled-Release Fertilizers for NortheastFlorida Chip Potato Production J Plant Nutr 2006 29 1301ndash1313 [CrossRef]
8 Smith VH Tilman GD Nekola JC Eutrophication Impacts of excess nutrient inputs on freshwatermarine and terrestrial ecosystems Environ Pollut 1999 100 179ndash196 [CrossRef]
9 Maine Department of Environmental Protection (Maine DEP) Integrated Water Quality Monitoring andAssessment Report Bureau of Land and Water Quality Augusta ME USA 2012
10 Stark JC Westermann DT Hopkins BG Nutrient Management Guidelines for Russet Burbank PotatoesUniversity of Idaho Moscow ID USA 2004
11 Van der Zaag P Soil Fertility Requirements for Potato Production Technical Information Bulletin 14International Potato Center (CIP) Lima Peru 1981
12 Flanagan SM Nielsen MG Robinson KW Coles JF Water-Quality Assessment of the New England CoastalBasins in Maine Massachusetts New Hampshire and Rhode Island Environmental Settings and Implications forWater Quality and Aquatic Biota Water-Resources Investigations Report 98ndash4249 US Geological SurveyPembroke NH USA 1999
13 Sharpley AN Smith SJ Jones OR Berg WA Coleman GA The transport of bioavailable phosphorusin agricultural runoff J Environ Qual 1992 21 30ndash35 [CrossRef]
14 Sharpley AN Bioavailable phosphorus in soil In Methods for Phosphorus Analysis for Soils Sediments Residualsand Water Pierzynski GM Ed Southern Cooperative Series Bulletin North Carolina State UniversityRaleigh NC USA 2000 pp 38ndash43
15 McGuire P Analysis Belgrade Lakersquos water quality down Portland Press Herald 27 July 2015
Agronomy 2017 7 85 13 of 15
16 Peech M Nutrient Status of Soils in Commercial Potato-Producing Areas of the Atlantic and Gulf CoastPart II Chemical Data on the Soils1 Soil Sci Soc Am J 1946 10 245 [CrossRef]
17 Pizzeghello D Berti A Nardi S Morari F Relationship between soil test phosphorus and phosphorusrelease to solution in three soils after long-term mineral and manure application Agric Ecosyst Environ2016 233 214ndash223 [CrossRef]
18 Rhue RD Hensel DR Yuan TL Robertson WK Response of potatoes to soil and fertilizer phosphorusin northeast Florida Soil Crop Sci Soc Fla Proc 1981 40 58ndash61
19 Maier NA Potocky-Pacay KA Dahlenburg AP William CMJ Effect of phosphorus on the specificgravity of potato tubers (Solanum tuberosum L) of the cultivars Kennebec and Coliban Aust J Exp Agric1989 29 869ndash874 [CrossRef]
20 Pierzynski GM Logan TI Crop soil and management effects on phosphorus soil test levels J Prod Agric1993 6 513ndash520 [CrossRef]
21 Sharpley AN Dependence of runoff phosphorus on extractable soil phosphorus J Environ Qual 1995 24920ndash926 [CrossRef]
22 Porter GA McBurnic JC Crop and soil research In The Ecology Economics and Management of PotatoCropping Systems A Report of the First Four Years of the Maine Potato Ecosystem Project Alford ARDrummond FA Gallandt ER Groden E Lambert DA Liebman M Marra MC McBurnie JCPorter GA Salas B Eds Maine Agricultural and Forest Experiment Station Orono ME USA 1996
23 Sharma L Bali S Dwyer J Plant A Bhowmik A A case study of improving yield prediction and sulfurdeficiency detection using optical sensors and relationship of historical potato yield with weather data inmaine Sensors 2017 17 1095 [CrossRef] [PubMed]
24 Fitzgerald C Soil phosphorus in Aroostook County (Maine) Potato Cropping Systems Organic Matter Effectsand Residual Phosphorus Contributions Masterrsquos Thesis University of Maine Orono ME USA 1998
25 Bruulsema BTW Soil Fertility in the Northeast Region Better Crops 2006 90 8ndash1026 Hochmuth G Weingartner P Hutchinson C Tilton A Jesseman D Potato yield and tuber quality did
not respond to phosphorus fertilization of soils testing high in phosphorus content HortTechnology 2002 12420ndash423
27 Campbell CA Zentner RP Selles F Jefferson PG McConkey BG Lemke R Blomert BG Long-termeffect of cropping system and nitrogen and phosphorus fertilizer on production and nitrogen economy ofgrain crops in a Brown Chernozem Can J Plant Sci 2005 85 81ndash93 [CrossRef]
28 McKenzie RH Roberts TL Soil and fertilizer phosphorus update Alberta Soil Sci In Proceedings of theWorkshop Coast Terrace Edmonton AB Canada 20ndash22 February 1990
29 Carpenter PN Murphy HI Effects of AccullIulaLecl Fertilizer Nutrients in a Maine Soil upon the Yield Qualityand Nutrient Content or Potato Plants Maine Agricultural Experiment Station Orono ME USA 1965
30 Murphy HI Carpenter PN Effect of Differential Rates of Phosphorus Potassium and Lime on Yield SpecificGravity and Nutrient Uptake of the Katahdin and Russet Burbank Maine Agricultural Experiment StationOrono ME USA 1967
31 Locascio SJ Breland HL Irish potato yield and leaf composition as affected by dolomite and phosphorusSoil Crop Sci Soc Fla Proc 1963 23 95ndash99
32 Hochmuth G Maynard D Vavrina C Hanlon E Plant Tissue Analysis and Interpretation for VegetableCrops in Florida 1991 Available online httpedisifasufleduep081 (accessed on 17 December 2017)
33 Schultz EE DeSutter T Sharma LK Enders G Ashley R Bu H Markell S Kraklau A Franzen DWResponse of sunflower to nitrogen and phosphorus in North Dakota Agron J 2017 in press
34 Baligar VC Fageria NK He ZL Nutrient use efficiency in plants Commun Soil Sci Plant Anal 2001 32921ndash950 [CrossRef]
35 Thom WO Dollarhide JE Phosphorus Soil Test Change Following the Addition of Phosphorus Fertilizerto 16 Kentucky Soils Agron Notes 2002 34 1ndash4
36 Reddy A Phosphorus Transport and Distribution in Kentucky Soils Prepared Using Various Biochar TypesMasterrsquos Thesis Western Kentucky University Bowling Green KY USA 2012 pp 1ndash49
37 Hurst LA Knobel EW Hendrickson BH Soil Survey of Aroostook Area Maine United States Departmentof Agriculture Washington DC USA 1917
38 Johnston AE Poulton PR White RP Plant-available soil phosphorus Part II The response of arablecrops to Olsen P on a sandy clay loam and a silty clay loam Soil Use Manag 2013 29 12ndash21 [CrossRef]
Agronomy 2017 7 85 14 of 15
39 Rosen CJ Kelling KA Stark JC Porter GA Optimizing phosphorus fertilizer management in potatoproduction Am J Potato Res 2014 91 145ndash160 [CrossRef]
40 Echeverriacutea HE Giletto CM Papa In Soil Fertility and Crop Fertilization Echeverriacutea HE Garciacutea FO EdsEditorial INTA Buenos Aires Argentina 2015 pp 585ndash608
41 Hegney MA McPharlin IR Jeffery RC Using soil testing and petiole analysis to determine phosphorusfertiliser requirements of potatoes (Solanum tuberosum L cv Delaware) in the Manjimup-Pemberton regionof Western Australia Aust J Exp Agric 2000 40 107 [CrossRef]
42 Mac Kerron DKL Young MW Davies HV A critical assessment of the value of petiole sap analysis inoptimizing the nitrogen nutrition of potato crop Plant Soil 1995 172 247ndash260 [CrossRef]
43 Zamuner EC Lloveras J Echeverria H Comparison of Phosphorus Fertilization Diagnostic Methods ofPotato in Mollisols Agron J 2016 108 1237ndash1245 [CrossRef]
44 Beegle D Durst PT Managing phosphorus for crop production Penn State Ext Agron Facts 2014 13 1ndash645 Payton FV Rhue RD Hensel DR MitscherlichndashBray equation used to correlate soil phosphorus and
potato yields Agron J 1989 81 571ndash576 [CrossRef]46 Truog E The determination of readily available phosphorus in soils I Am Soc Agron 1930 22 874ndash88247 Jenkins PD Ali H Phosphorus supply and progeny tuber numbers in potato crops Ann App Biol 2000
136 41ndash46 [CrossRef]48 Ali H Khan MA Shakeel A Randhawa A Interactive Effect of Seed Inoculation and Phosphorus
Application on Growth and Yield of Chickpea (Cicer arietinum L) Int J Agric Biol 2004 6 110ndash11249 Bray RH Kurtz LT Determination of total organic and available phosphorus in Soil Soil Sci 1945 59
39ndash45 [CrossRef]50 Mehlich A Mehlich 3 soil test extractant A modification of Mehlich 2 extractant Commun Soil Sci
Plant Anal 1984 15 1409ndash1416 [CrossRef]51 Olsen SR Cole CV Watanabe FS Dean LA Circular In Estimation of Available Phosphorus in Soils by
Extraction with Sodium Bicarbonate US Department of Agriculture Washington DC USA 1954 Volume 939p 19
52 McIntosh JL Bray and Morgan soil test extractants modified for testing acid soils from different parentmaterials Agron J 1969 61 259ndash265 [CrossRef]
53 Sharma LK Franzen DW Use of Corn Height to Improve the Relationship between Active Optical SensorReadings and Yield Estimates Precis Agric 2014 15 331ndash345 [CrossRef]
54 Franzen DW Sharma LK Bu H Dentond A Evidence for the ability of active-optical sensors to detectsulfur deficiency in corn Agron J 2016 108 2158ndash2162 [CrossRef]
55 Sharma LK Bu HG Denton A Franzen DW Active-Optical Sensors Using Red NDVI Compared toRed Edge NDVI for Prediction of Corn Grain Yield in North Dakota USA Sensors 2015 15 27832ndash27853[CrossRef] [PubMed]
56 Bu H Sharma LK Denton A Franzen DW Sugarbeet root yield and quality prediction at multipleharvest dates using active-optical sensors Agron J 2016 108 273ndash284 [CrossRef]
57 Bu H Sharma LK Denton A Franzen DW Comparison of Satellite Imagery and Ground-Based ActiveOptical Sensors as Yield Predictors in Sugar Beet Spring Wheat Corn and Sunflower Agron J 2017 109299ndash308 [CrossRef]
58 Franzen DW Sharma LK Bu H Active Optical Sensor Algorithms for Corn Yield Prediction and a CornSide-Dress Nitrogen Rate Aid North Dakota State University Extension Service Fargo ND USA 2014
59 Sharma LK Evaluation of Active Optical Ground-Based Sensors to Detect Early Nitrogen Deficiencies inCorn PhD Thesis North Dakota State University Fargo ND USA 2014
60 Sharma LK Bu H Franzen DW Comparison of two ground-based active-optical sensors for in-seasonestimation of corn (Zea mays L) yield J Plant Nutr 2016 39 957ndash966 [CrossRef]
61 Sharma LK Bu H Franzen DW Denton A Use of corn height measured with an acoustic sensorimproves yield estimation with ground based active optical sensors Comput Electron Agric 2016 124254ndash262 [CrossRef]
copy 2017 by the authors Licensee MDPI Basel Switzerland This article is an open accessarticle distributed under the terms and conditions of the Creative Commons Attribution(CC BY) license (httpcreativecommonsorglicensesby40)
- Introduction
- Sufficient Soil P and Soil Variability
- P Recommendations and Soil pH
- Gap in Fertilizer Application and P Removal
- Discrepancies in Soil P Testing
- Conclusions
-
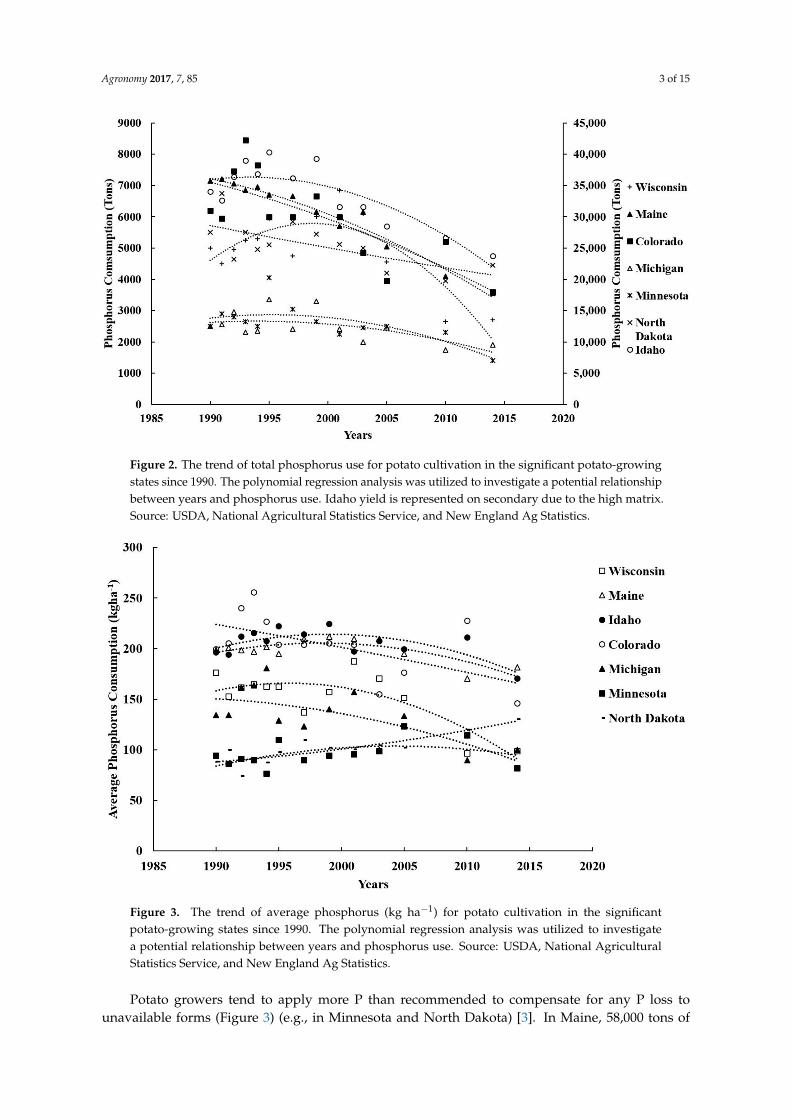
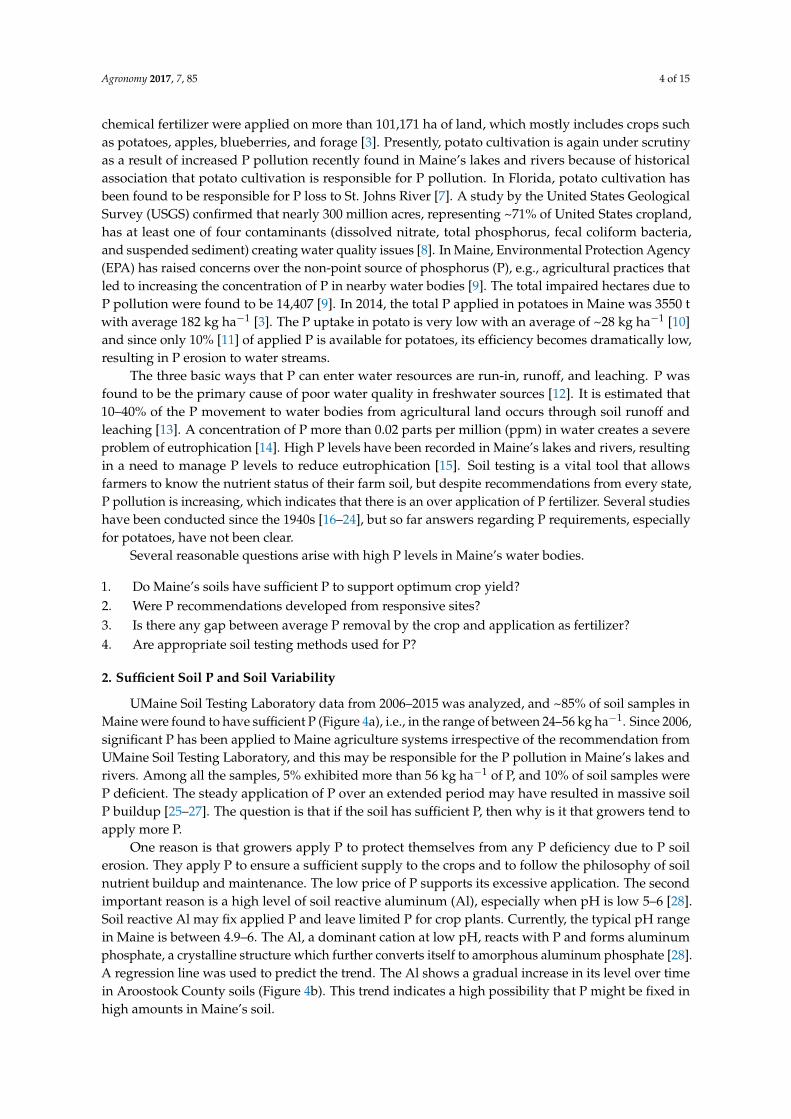