a case study of working capital and its impact
TRANSCRIPT

1
CHAPTER - I
INTRODUCTION
1.1 Background of the Study
For growth and development of Nepal industrialization plays the vital role. Nepal with
diminutive per capital income of $210, has been designated the last developed country.
Its predominantly agricultural economy employ more than 80% of the economically
active Population in only 18% total arable land, without using any modern technology
there is no Specialization agriculture. Therefore regional and rural development Potential
of Agriculture. Therefore regional and rural development potential of an agricultural
Country such as Nepal may not be fully realized without a well – designed and well –
financed industrialization Strategy.
Industrialization Plays crucial role in the process of economic development and its
important reason for embarking in performance of industrialization is to increase the
rational income. Hence, it is must to increase overall national economy of the country.
Commercial banks plays vital role for the development of such industries by providing
financial services. We can say that commercial banks are those banks, which Pool
together the savings of the community and arrange for their productive use .They supply
the financial needs of modern business by various means. They accept deposits form the
public on the condition that they are repayable on demand or on Short notice.
Working capital management is an important aspect of the commercial banks among
available Option. Proper management of working capital is the best possible option to
improve their operational Viability. Working Capital is the crucial aspect of financial
management practice in commercial bank. Thus, the success or Failure of any
organization is heavily dependent upon efficiency in its working capital management.
1.2 Meaning of Working Capital Management
There are two kinds of assets: Fixed assets and Current assets. That kind of assets which
can’t be converted into cash with in the year is fixed assets and those assets which can be

2
converted into the cash with in the year is current assets. The term working capital
refers to the current assets of the firm.
Working capital refers to the resources of the firm that are used to conduct operations of
day– to–day work that makes the business successful. Without cash, bills cannot be paid,
without receivable the firm cannot allow timing between delivering goods to services and
collecting the money to pay for them. Without inventories the firm cannot engage in
Production nor can it stock goods to Provide immediate deliveries. As a result of the
critical nature of current assets the management of working capital is one of the most
important areas in determining whether a firm will be successful.
The term net working capital refers to the difference between current assets and current
liabilities. Current assets are the assets, which can be converted into cash with in
accounting year, including cash, short – term securities, debtors, bill receivable and
stocks. Current liabilities are those claims of outsiders, which are expected to mature for
payment within an accounting year, including creditors, bills payable and outstanding
expenses. Net working Capital can be positive or Negative. A positive net working
capital will arise when current assets exceed current liabilities and a negative net working
capital occurs when current liabilities and the interrelationships that exist between them .
1.3 Meaning of Commercial Banks
Commercial Banks play an important part for economic development of a country as they
provide capital for the development of industry, trade and business by investing the
savings collected as deposits from public. It also venders numerous services to its
customers in view of vacillating their economic and social life so that integrated and
speedy development of a country is only possible when competitive , reliable banking
services are reached and carried to every corner of the country.
Earlier banks were different form modern commercial banks in many respects. The banks
that operated in the past combined central banking functions, such as issues of currency
with commercial banking functions like accepting deposits and financing business .In
3
course of time this practice was abandoned and Specialized institutions for the central
banking functions were created .Now a central bank cab be easily distinguished from a
commercial bank due to their objectives and unique functions.
Modern commercial banks can be identified by different names such as Business Banks,
Retail Banks, Clearing Banks, Joint venture Banks and Merchant Banks etc. No matter
what names we give to banks, they all perform the same basic functions i.e.. They
provide a link between the lenders and the borrowers. Basically by charging a rare of
interest to the borrowers slightly higher than they pay to the lenders, the banks make their
profit. This is known as financial intermediations.
1.4 Focus of the Study
Commercial banks are the heart of the financial system. They hold the deposits of many
persons, government establishment and business units. They make funds available
through their lending and investing activities to borrowers, individuals, business firms
and government establishments. In doing so, they assist both the flow of goods and
services form the producers to consumers and the financial activities of the government.
They provide a large portion of medium of exchange and they are the media through
which monetary policy is affected. These facts show that the commercial banking system
of the nation is important to the functioning of the economy. Bank is a business
organization where monetary transaction occurs. It creates funds from its clients’ saving
and lends the same to needy person or business companies in term of loans, advances and
investment. so proper financial decision – making is more important in banking
transaction for its efficiency and profitability . Most of the financial decisions of a bank
are concerned with current assets and current liabilities. The working capital management
of the bank is different form other type of business enterprises. A bank plays a significant
role to fulfill the requirement of working capital of any other type of business enterprises.
It also part of current assets of bank’s working capital and we can consider deposits and
short – term borrowings as a part of current liabilities. so the focus of the study is a
reference regarding the working Capital Management.
4
1.5 Statement of the Problem
There are many commercial banks in our country. These banks play important role in the
economic development of the country. Wrong decisions on working capital management
of commercial banks not only affect the liquidity and profitability of the bank but also
economic condition of the country.
Working capital Management on bank is difficult that of other manufacturing and non –
manufacturing business organization. Commercial banks are great monetary institutions,
which are playing important role to general welfare of the economy. The responsibility of
commercial banks is more than any other financial institutions. They must be ready to
pay on demand without warning or notice, a good share of their liabilities. Banks collect
funds from different types of deposits for providing loan and advances to different sector.
To get higher return, banks must try to increase funds from deposits as well as their
needy People. But commercial banks always face the problem for utilizing more deposits
and disbursement of loans cash balance also decrease profitability of banks. Increase the
cash balance on bank, which require paying its large amount of liabilities on its demand
without depositors’ notice. But large amount of idle
There are many Problems but some of the major problems that have been identified for
the Purpose of this study are as follows:
Which of the current assets are more Problematic in commercial bank?
Does current assets management plays significant role in working capital
management of Nepalese commercial banks?
Does working capital promotes the financial image of commercial bank?
What is the size of investment in each types of current assets management?
What are the components of working capital, which affect the operating income of
commercial bank?

5
1.6 Objective of the Study
The main objective of this study is to examine the impact of working capital on
profitability positions of Nepalese commercial banks. The specific objectives of the study
are as follows:
To analyze the liquidity, assets utilization, long term solvency and profitability
position of banks.
To study the current assets and current liabilities and their impact on liquidity and
profitability.
To provide appropriate recommendation and suggestion for the improvement of the
working capital Management and enhancing the profitability scenario of Nepalese
Commercial Banks.
1.7 Tools for Analysis
There are different types of tools. For the analysis of the data, all tools are taken as
appropriate as possible the related analytical tools are as follows:
Financial tools
Statistical tools
Ratio Analysis
Trend analysis
1.8 Significance of the Study
Certainly, there is an importance of any research work to various fields. The study is a
conclusion-oriented study. The research would be helpful to all who are interested to
have knowledge in this field any especially to the working capital management of
concerned banks as well as other interested parties. The study will be helpful to go seep
into the matters as to working capita management of their banks is better (or worse) than
their competitors. It may pattern of loan and advances and other investment of those big
commercial banks.
There are many commercial banks in Nepal; all of them are operating in the competitive
environment. To exist in this competitive environment these banks should have to adopt
6
suitable strategies. The success and the failure of any organization depend on its strategy,
which is affected by working capital management. Therefore, working capital
management is the crux of problem to prepare the proper strategy on its favors. The study
of working capital management of commercial bank would be beneficial to the banking
professionals, investors, teachers, and students of researcher.
1.9 Limitation of the Study
Limitation exists everywhere and this study is also not an exception of it. Following are
some limitations:
This study will be based on secondary data.
This study will do for the partial fulfillment of MBS.
It covers only the five financial years. So the conclusions drawn are based on the
data.
The study is mainly focus over the working capital are of the bank; it doesn't cover
other parts of banks.
1.10 Organization of the Study
This study will consist of five chapters:
Chapter – I Introduction
Chapter – II Review of literature
Chapter – III Research Methodology
Chapter – IV Data presentation and Analysis
Chapter – V Summary, Conclusion and Recommendation
The first chapter begins with the background and introduction; it includes focus of the
study, statement of problem, objectives of the study, significance of the study, limitation
of the study and its organization.
The second chapter focuses on review of literature.
The third chapter will be the research methodology to be adopted for the study.
The forth chapter will be the data presentation and analysis for the study.
The fifth chapter includes summary, conclusion and recommendation.

7
CHAPTER - II
REVIEW OF LITERATURE
This chapter highlights upon the literature that is available in this relative topic. This
chapter is divided into two parts. First part deals with the conceptual framework of
commercial banks and working capital management. Second part deals with relating of
some available literature including review of books, journals, articles and dissertation.
2.1 Conceptual Framework
2.1.1 Meaning of Commercial Bank
It is difficult to give concise and accurate definition of bank. It is so because a modern
bank performs various functions. It is difficult to include all these functions in a single
and concise definition. Even though it can be said that a bank is an institution whose
business is to trade in money. “Banks are financial intermediaries, similar to credit
unions, savings and loans associations and other institutions selling financial services.
Banks are those financial institutions that offer the widest range of financial services and
perform the widest range of financial functions of any business firm in the economy. It is
a institution, which accepts deposits from the public and in turn advances loans by
creating credit .Therefore, it should be differentiated from other institutions as they
cannot create credit though they accept deposits.”
Today is the age of specialization. The modern economy demands different types of
financial services. A single institution cannot fulfill all the services demanded by the
customers. Therefore, different types of banks also emerged in the banking industry
specializing in different functional areas. Types of banks are:
1. Commercial bank
2. Development bank
3. Central bank
4. Exchange bank
5. Saving bank
6. Industrial bank
8
7. Co – Operative bank
8. Merchant bank
9. Mutual fund etc.
The commercial banks are those banks are those banks that pool together the savings of
the community and arrange for their productive use . They supply the financial needs of
modern business by various means. They accept deposits from the public on the condition
that they are repayable on demand or on short notice. Commercial banks are restricted to
invest their funds in corporate securities. Their business is confined to financing, the
short term needs of trade and industry such as working capital financing. They cannot
finance in fixed assets. They grant loans in the form of cash credits and overdrafts. Apart
from financing, they also render services like collection of bills and cheques, safe
keeping of valuables, financial advising etc to their customers.
American Institution of banking defines commercial bank as commercial bank is
corporation which accept demand deposits subject to cheque and makes short term loans
to business enterprises regardless of the scope of its other four function of commercial
bank as receiving and handling deposits (Deposit Function), handling payments of money
(payment Function), making loans and investment (Loan Function) and creating money
by extension of credit (Money Function).
In today’s concern the operating function of the commercial bank are (a) to collect
working capital (b)to utilized the working capital in various Purposes (c) by utilizing the
working capital , it earns profit and (d) part of the profit is distributed as dividend and
part of the profit is retained for the expansion of banking transaction. Specialized
financial institution supplies credit for the purchase of customer goods and services by
purchasing the time-sales contracts of merchants or by granting small loans directly to
consumers is termed finance company . Specialized consumer finance agencies are now
operating throughout Western Europe, Canada, Australia, Japan, USA and some Latin
American Countries. Although they existed in the early 90’s their greatest development,
come after World War II (www.study finance .com).
9
2.1.2 Working Capital Management
The term working capital is originated with the old Yankee Peddler ,who would load up
his wagon with goods and then go off on his route to Peddler his wares .The merchandise
was called working capital because it was what he actually sold or ‘turned over’ to
produce his profit .The wagon and horse were his fixed assets . He generally owned the
horses and wagon, so they were financed with ‘equity’ capital but he borrowed the funds
to buy the merchandise. These borrowings were called working capital loans, and they
had to be repaid after each trip to demonstrate to the bank that the credit was sound
(Weston & Brigham, 1984: 333).
The management of funds of business can be described as financial management.
Financial management is mainly concerned with two aspects. Firstly, fixed assets and
fixed liabilities in other word long - term investment and sources of Funds .Secondly,
current assets and current liabilities or short term financing. Short term financial
management also term working capital management, which is typically viewed as the
management of the current assets and current liabilities of a firm. A firm’s working
capital is the money it has available to meet current obligations (those due in less than a
year). A firm with a great deal of working capital is in little danger of failing in the near
future, but enormous working capital over a prolonged period could also imply
excessively conservative management. Working capital, after all, is short-term in nature
and hasn’t been put to in work in the company’s profit-making business operations. As
with most measures of corporate well being, this is one varies by industry and even by
season. Firm’s fails value cannot be maximized in the long run unless it survives the short
run. Firm fails most often because they are unable to meet their working needs;
consequently, sound working capital management is a requisite for firm survival.
There are two concepts of working capital (i) gross concept and (ii) net concept. The
gross working capital, simply called as working capital, refers to the firm’s investment in
current assets. Current assets are the assets which can be converted into cash within
accounting year (or operating cycle) and include cash, short-term securities, debtors, bills
receivable and stocks. The term net working capital refers to the difference between

10
current assets and current liabilities. The current liabilities are those claims of outsiders,
which are expected to mature for payment within an accounting year and include
creditors, bill payable and outstanding expenses (Pandey, I.P., 1992: 144).
By analyzing the above concept about working capital, we can conclude that, all the firm,
whether public or private, manufacturing or non-manufacturing have just adequate
working capital to serve in competitive market. Because excessive investment on
working capital affects a firm’s profitability just as idle investment, earn nothing in other
hand, inadequate investment on working capital affects the liquidity position of the firm
and leads to financial embarrassment and failure of the firm. So, immature decision made
in management of working capital can lead to adverse effects in business and reduce the
liquidity, turnover and profitability and increases the cost of financing of the enterprises.
Various study works have been done in different aspects of working capital of different
organization. In this sub chapter related some available study work are reviewed. And
other available literatures are also reviewed for the purpose of justifying the study Radhe
Shyam Pradhan (1986) has published a book on management of working capital in
‘Nepalese Public Entrepreneurs’. This book is based on the study of nine manufacturing
public enterprises of Nepal for the duration of ten years from 1973-1982 A.D. In this
study , he has dealt with various issues viz- type of working capital policy followed by
those public entrepreneurs – liquidity position , structure of working capital , nature of
working capital , utilization and demand of working capital and its various components
with changes volume of sales in those public entrepreneurs. In the study he reveals that
most of the selected enterprises achieved a trade off between risk and return there – by
following neither an aggressive nor a positive net working capital and much of the
growth in net working capital at deflated prices has been much lower. The liquidity
measures showed a poor liquidity position in majority of MPEs. It has been noticed that
the enterprises had either negative cash flows or earning before tax, or they had excessive
net current debts, which could not be paid within a year. Of the current assets, which is,
on an average, half of the total assets in public entrepreneurs? The share of inventories is
the larges followed by receivables and cash. There had been an improvement in
11
utilization of current assets in the majority of public entrepreneurs. He also noticed that
the adjustment speed of actual to desire balance had been observed as highest for cash
followed by inventories .However the speed of adjustment was slower in all these cases.
The results were, therefore, surprising, as the adjustment was slower in all these cases.
The results were, therefore, surprising, as the adjustment of even cash holding was not
immediate. Further more, the inclusion of capacity utilization in the models did not seem
to have contributed much to the demand functions of working capital and its various
components. Thus, capacity utilization as a significant variable affecting these demand
functions was doubtful. This book, thus provides and extensive account for a small
portion of the total assets.
At last he added that analysis of financial statements could give a good insight into
financial health and performance of bank.
Pandey has described some conceptual ingredients, based on his various research studies
.He has explained various aspects of working capital management. He has divided his
study into five chapters. First chapter deals with the concepts, needs and determinants of
working, dimensions of working capital management, optimum level of current assets
and working capital trends in India as well. In the second chapter, he has written about
the management of cash and marketable securities. He has described about cash flows,
determining the optimum cash balance, investment in marketable securities in the
chapter. He has described the management of receivable in chapter third, in which he has
dealt with goals of credit management, optimum credit policy, aspects of credit policy,
and credit producers for individual accounts. In the fourth chapter, he has written on
inventory management techniques, Selective inventory control technique and financial
manager’s role in inventory management (Pandey, 1992: 280).
Van Horne has categorized the various components of working capital i.e. liquidity,
receivable and inventory and current liabilities and grouping them according to the way
they affect valuation. He has also described the different methods for efficient
management of cash and marketable securities. For the management of receivable,

12
different credit and collection policies have been described and various principles of
inventory have been examined for inventory management and control (Van Horne, 1994:
190).
Weston and Brigham have given some theoretical insights into working capital
management on the basis of various researches they had done on it. The conceptual
findings of their study provide sound knowledge and guidance for the further study on the
field of working capital management. In the beginning, they have explained about on am
importance of working capital, concept of working capital, financing of working capital,
the use of short term versus long – term debt relationship of current assets to fixed assets.
Then next, they have dealt with the various components of working capital (Cash,
marketable securities, receivable and inventory) and their effective management
techniques. For the efficient management of cash, they have explained the different cash
management models. In their study, they have also described the major sources and forms
of short – term financing, such as trade credit, loans from commercial banks and
commercial paper (Weston and Brigham, 1984: 386).
2.1.3 Types of Working Capital
There are two type of working capital finding in manufacturing company. Those two
types of working capital are Permanent Working Capital and Variable Working Capital
2.1.3.1 Permanent Working Capital
The amount of working capital required for the business to maintain a minimum level of
current assets for the whole period is called permanent working capital. Permanent
working capital is also known as fixed working capital. It is comprises of minimum cash
balance, minimum level of inventory etc. The nature of this capital is similar to the
capital invested in the fixed assets. Both these capital cannot be withdraws from the
business. Financing of this working capital by using short- term sources needs to renew
the loan respectively. If the suppliers of fund of disagree to renew the loans, firm has to
go for fresh loan to repay the exiting short-term debt. The compulsion of taking loan
within a short period may cause an increase in the rate of interest. Much of the time of

13
financial manager will spent on the renewal and management of loan. Therefore, it is
desirable to finance the permanent working capital by using long- term sources like long
–term debt or equity. Requirement of permanent working capital may increase due to
inflation or growth in sales. This incremental requirement of permanent working capital
can be financed by using internal sources.
2.1.3.2 Variable Working Capital
In most business the required of working capital may be high during a particular season
and it comes down during other periods. This additional portion of working capital,
which is required during peak business season, is known as variable or temporary or
seasonal working capital. Variable working capital is required during peak season only.
This portion of working capital can withdraw from the business after end of such season.
Therefore, it is desirable to finance the temporary working capital from short- term
external sources like trade credit, commercial paper, arrangement of other short term loan
from the bank. Because such short- term loans can easily repaid after the peak business
season. If this portion of this working capital is financed through permanent or long- term
sources, this fund will either remain idle or invested in marketable securities earning at a
lower rate. As a result the earning of the company will be adversely affected.
2.1.4 Sources of Working Capital
The required of the working capital depends upon the organization objectives, time
situation and time period. This suggests that dependence on only one or specific sources
of capital may create obstacles and problems. Therefore, the enterprise has to use
combination of one or more sources of capital in management of working capital. After
ascertaining the amount of working capital needed to the enterprises, permanent capital
can be collected from capital market where as working capital collected from money
market. According to nature of working capital, following different sources may be
available (Kuchhal, 1998: 42).
2.1.4.1 Sources of Permanent or Fixed Working Capital
Long term sources are used to meet the requirement for permanent or fixed working
capital. Main sources are described as follows:

14
i. Issues of Shares
The enterprises can issues ordinary and preference share taking consideration on capital
structure of enterprises for the collection of permanent working capital. Issues of
preference share is better than to issues ordinary share to collect working capital because
a redeemable preference share can be returned when firm does not need it.
ii. Issue of Debenture
When the working capital requirement is permanent and non seasonal, the corporation
can issues debenture, being a fixed burden on corporate earning. The managerial board
will be free from debenture-holders who have no any right on management and control of
enterprises.
iii. Public Deposit
The reputed enterprises accept deposit from public for several years. On these deposits
certain predetermined interest should be paid in certain time.
iv. Plouging Back of Profit
These important sources of permanent working capital are generated from the business
operation in profit. Required permanent working capitals are fulfilled from the retained
earning which is the same portion of profit without distributing to shareholders.
v. Special Financial Institution
The reliable sources of permanent working Capitals are commercial banks, financial
institution and other organized institution. They provide short term or mid-term loan
facilities.
2.1.4.2 Sources of Temporary or Variable Working Capital
The short term sources are used to meet the requirement of working capital. Some special
variable working capital sources are as follows:

15
i. Private Loans
Taking loans from personal or private sources fulfills the working capital need of the
organization. Firm takes short loans from personal investor, businessmen, landlords,
friends and relatives.
ii. Commercial Banks
Commercial bank collects small scattered saving fromvarious people and firms, which
are invested in industries and business. They provide short term loans in the form of cash
credit, overdraft facilities, discounting of bills of exchange, etc.
iii. Ploughing Back of Profit
It can be the source of seasonal working capital in addition to permanent working capital.
It is very popular and quick source of working capital financing.
iv. Public deposit
Public deposit can also be the sources of variable working capital by collecting small
scattered saving for operating business.
v. Financial Institution
Financial institutions are established with certain objectives, such as NIDB, ADB, RDB,
etc. which provides short term, mid term and long term loans as per required for the
enterprises.
vi. Trade Credit
The trade credit is the most popular sources of working capital. Sellers provide credit to
buyers for short period without any mortgage, which is termed as trade credit. “The trade
credit means providing credit by one business to another business. The supply of goods
or services by producers to other firms like retail traders for some time without making
immediate payment is an example to trade credit”(Joshi and Dongol, 2056:126).
16
2.1.5 Issue of Working Capital Management
The management spends time and resources on working capital management. But some
enterprises are successful to earn more profit through balance working capital policy.
Generally, working capital management faces the following issues ( Pradhan, 1992:173).
Size of working capital to maintain-size of each type of current assets.
Source of financing-short or long term, and debt or equity financing.
Cost of financing- cost of short term Vs long term financing.
Risk associated with types of financing trade off between cost and risk.
Maintain of current ratio, minimizing the risk of cash flow problem.
2.1.6 Goals of Working Capital Policies
Working capital policies are the basis guidelines or strategies to achieve target financial
performance in relation to working capital. Following are the firm’s goals of working
capital (Hampton, 1998: 219).
2.1.6.1 Adequate Liquidity
The most important goal of working capital policy is to achieve adequate liquidity for the
conduct of day-today operation .With the lack of sufficient cash to pay their bills when
due, they will experience continuing problems.
2.1.6.2 Minimization of Risk
Relatively current liabilities are the source of financing which may involve low costs.
The firm must ensure that these near term obligations (current liabilities) do not become
excessive compared to the current asset on hand to pay them. The matching of assets and
liabilities among current is a task of minimizing the risk.
2.1.6.3 Contribute to Maximum Firm’s Value
The firm retains working capital for the some purpose as it holds any other assets to
maximize the present value of common stock and value of the firm. The investment of
excess cash, minimization of inventories, speedy collection of receivables, and
elimination of unnecessary and costly short-term financing all contribute to maximizing
the value of the firm.

17
2.1.7 Needs for Working Capital
Most of firms aim at maximizing the wealth of shareholders. The firms should earn
sufficient return from its operation. The extent to which profit can be earned naturally
depends upon the magnitude of sales among the other thins. Specially, working capital
required to spend on raw materials, salary, wages, rent, electricity, advertisement and
other sales related expenses. The need for working capital can be categorized into the
following ways.
2.1.7.1 Transaction Motive
A business firms holds cash for smooth running of business. The conduct its ordinary
business and making purchases and sales, working capital is needed. In the business,
where billings are predictable cash inflows, can be scheduled and synchronized with the
need for the cash outflow. In a seasonal business more cash may be needed and if firms
want to operate transaction smoothly, they have to keep inventory of raw materials and
finished goods. Generally, a business firm invests on marketable securities that can be
converted into cash in a short time. It is temporary investment. So, to run business
smoothly in an uninterrupted basis, a business firm has to manage working capital for
transaction motive.
2.1.7.2 Compensation Balance Motive
The commercial bank performs many functions for business firms. Sometimes, firm pays
service charge by direct fee and sometimes by maintaining compensation balance.
Compensation balance is the advance deduction bank on loan. It represents that the firm
agrees to maintain in its checking account with the bank. With this assurance, the bank
can provide such funds as long-term loan.
2.1.7.3 The Precautionary Motive
Precautionary motive is the need to hold cash and inventories to guard against the risk of
unpredictable change in demand and supply forces and other factors such as strike, failure
of important customers, unexpected slow down in collection of account receivable,
cancellation of some order for goods and some other unexpected emergency. Thus, the
firm needs the working capital to meet any contingencies in future.

18
2.1.7.4 The Speculative Motive
The working capital is needed to meet the speculative motive, which refers to the desires
of a firm to take advantage of the following opportunities.
a. Opportunities of profit making investment.
b. An opportunity to purchase raw material at a reduced price on payment of
immediate cash.
c. To speculate on interest rate and
d. To purchase at favorable price, etc.
To grab these opportunities, the business enterprises have to manage cash and marketable
securities. It also represents ‘war chest’ or pool of funds which a firm may draw quickly
to meet a short term opportunity, including acquisition.
2.1.8 Approaches to Estimating Working Capital Needs
To determine working capital needs, some useful methods are applied in practices. Some
appropriate methods of calculating working capital needs of a firm are as follows
(Pandey, 1999: 372).
2.1.8.1 Current Assets Holding Period
It is to estimate working capital requirement on the basis of average holding period of
current assets and relating them to costs based on the company’s experience in the
previous years. This method is essential based on the operating cycle concept.
2.1.8.2 Ratio of Sales
It is to estimate working capital requirement as a ratio of sales on the assumption that
current asset with sales.
2.1.8.3 Ratio of Fixed Investment
It is to estimate working capital requirement as a percentage of fixed investment
19
2.1.9 Liquidity Vs Profitability: Risk-Return Trade Off
The firm may follow a conservative or an aggressive policy, which involves risk-return
trade off. Determination of the appropriate level of investment in the different
components of current assets and the size of current liabilities involves decision
concerning the trade off between liquidity, profitability and risks (Gopal, 1996: 121).
The objective of conducting risk-return analysis is to know whether the firms are
following an aggressive, a conservative or a moderate approach. When a firm has
followed an aggressive approach, the current liabilities are used to finance a position of
fixed asset. In the conservative approach the firm uses only long-term funds to finance all
kind of current assets and fixed assets without making use of any of the current liabilities
.On the moderate approach firm uses long-term funds to finance a portion of current
assets. When current assets holding at the minimum level would mean interrupted
production, sales and solvency. Its current assets holding will depend on its working
capital policy. These policies involve risk return trade-offs (Pandey, 1999: 163).
2.1.10 The Cost of Trade-off
Working capital management involves decision upon the amount and composition of
current assets and how to finance these assets. This decision involves trade-off between
risk and reputability, cost of maintaining a particular level of current assets. These costs
are: the cost of liquidity and the cost of illiquidity. “The cost of liquidity increased with
the level of current assets. The cost of illiquidity is the cost of holding insufficient current
asset” (Pandey, 1992:169).
The greater the relative proportion of liquid assets, the lesser the risk of running out of
cash if all thing s are equal, result will be less profitability. In determining the optimum
level of current assets, the firm should balance the profitability solvency tangent by
minimizing total cost –cost of liquidity and cost of illiquidity (Pandey, 1999: 163).

20
2.1.11 Working Capital Cycle
The working capital cycle can be defined as the period of time, which chapters between
the points at which, cash begins to be expended on the production of a product and the
collection of from customers. Cash flows with cycle into, around out of business. It is the
business life blood, every manager’s primary task is to help keep it flowing, and to use
the cash flow to generate profits. If a business is operating profitability, then it should, in
theory, generate cash surpluses. If it does not generate surpluses, the business will
eventually run out of cash and expire.
The faster a business expends the more cash it will need for working capital and
Investment. The cheapest and best sources of cash exist as working capital right within
business. Good management of working capital will generate cash will help improve
profits and reduce risks. Bear in mind that the cost of providing credit to customers and
holding stocks can represent a substantial proportion of a firm’s total profits. There are
two elements in the business cycle that absorb cash-inventory (stocks and working
progress) and receivables (debtors owing money). The main sources of cash are payables
(our creditors) and equity loans.
Each component of working capital (namely inventory, receivables and payables) has two
dimensions TIME… and MONEY…When it comes to managing working capital TIME
IS MONEY .If you get money to move faster around the cycle (e.g. collect monies due
from debtors more quickly) or reduce the amount of money tied up (e.g. reduce inventory
levels relative to sales),the business will generate more cash or it will need to borrow less
money to fund working capital .Consequently ,you could reduce the cost of bank interest
or you have additional free money available to support additional sales growth or
investment .Similarly ,if you can negotiate improved terms with suppliers e.g. .get longer
credit or an increased credit limit; you effectively create free finance to help fund future
sales. Capital Therefore, if cash is tight, consider other ways of financing capital
investment, loans, equity, leasing, etc. Similarly, if you pay dividends or increase
21
drawings, these are cash outflows and, like water flowing downs a plughole, they remove
liquidity from the business.
2.1.12 Working Capital Policy
The component of the working capital constitutes the current assets and their way of
financing i.e. current liability .In an enterprise, the level and the quality of the current
assets and current liabilities is guided by the working capital policy and management
adopted by it. Working capital management involves all aspects of the administration of
current assets and current liabilities .In other word, “Working capital management is
concerned with the problem that arise in attempting to manage the current assets and
current liabilities, and the interrelationship that exit between them” (Smith, 1974: 241).
Working capital policy refers to decision relating to the target level investment and the
financing mix of current assets working capital policy concern with two basic issues
among firms balance sheet item. These two policies are regarding; a) What is the
approximate level of current assets, both in the total and by specific accounts, and b) how
the required level of current assets should be financed? (Weston, Basley and Brigham,
1996: 192).
The issues, in the WCM, are that firm has to determine how much fund s should be
invested in working capital in gross concept. Every firm adopts different financing policy
according to the financial manager’s attitude toward the risk-return trade-off. One of the
most important decisions of financial manager how much current liabilities should be
used to finance current assets .So working capital policy is related to the level of each
category of current assets and financing of current liabilities on it.
2.1.12.1 Current Asset Investment Policy
Current asset investment policy refers to the policy regarding the total amount of current
assets to be carried to support the given level of sales. There are three alternative current
assets investment policy which are follows (Weston, Basley and Brigham, 1996: 192).
i. Fat-Cat or Relaxed Working Capital Policy

22
In this policy, the firm holder relatively large amount of cash, marketable securities,
inventory and receivables to support a given level of sales. This policy creates longer
inventory and cash conversion cycle .It also create the longer receivables collection
period due to the liberal credit policy. Thus, this policy provides the lowest expected
return on investment with lower risk.
ii. Lean and Mean Policy or Restricted Current Asset Investment Policy
In this WC investment policy, a firm holds the minimum amount of cash, marketable
securities, inventory and receivable to support a given level of sales. This policy trends to
reduce the conversion cycle. Under this policy, firm follows to tight credit policy and
bears risk of losing sales.
iii. Moderate Current Assets Investment Policy
In this policy, a firm holds the amount of current assets in between the relaxed and
restrictive policy. Both risk and return are moderate in this policy.
2.1.12.2 Current Assets Financing Policy
Financing the long term or short-term funds to current assets has significant impact on an
enterprises risk or return, liquidity and profitability. Deciding how should current
liabilities be used to finance current assets is one of the most important decisions
concerning working capital management (Pradhan, 1986: 152).
Long term as well as short term funds involves cost and cost of financing is a deciding
factor in the use of different type of funds. Financing policy deals with the optimum
financing mix of short term and long-term liabilities. Depending upon attitude towards
risk, liquidity and profitability, the management can follow following three alternative
working capital financing approaches.
i. Aggressive or Tight Working Capital Financing Approach
In this policy, the firm finances not only temporary current assets but also a part of the
permanent current assets with short-term financing sources and rest with long term
23
financing sources. In other word, the firm finances not only temporary current asset but
also a portion of permanent current asset with short term financing. Some aggressive
firms may even finance a part of their fixed asset with short-term financing. Hence, this
sort of mix financing increases the profitability and expense toward risk by financing
relatively larger position of its assets through lower cost short term borrowing. Under this
policy, higher the risk, higher the return and low liquidity position.
ii. Conservative Policy
Conservative approach refers to a financing mix which is less risky leading to low
profitability and high liquidity, the approach would be to finance all funds required from
long term funds (Pradhan, 1986:126). The financing policy of firm is said to conservative
when it depend more on long term funds for financing needs. Under this financing policy,
the firm finances its permanent assets and a part of temporary current assets with long
term financing (Pandey, 1999: 164). This policy leads to high level of current assets, with
long-term conversion cycle, low level of current liabilities and higher interest cost. The
risk and return are lower than that of aggressive one. The risk adverse management
follows this policy.
iii. Maturity Matching/Hedging/Self Liquidity/Moderate Approach
This approach of working capital policy entails moderate risk with moderate returns. This
firm can adopt a financial plan which involves the matching of the expected life of assets
with the expected life of the sources of funds raised to finance assets. When the firm
follows matching approach, long term financing will be used to finance fixed assets and
permanent current assets and short-term financing to finance temporary or variable
current assets this approach tries to achieve trade off between profitability and liquidity
with neither too risky nor least risky by financing mix. “It lies in between a low-liquidity,
high profitability case and a high –liquidity low profitability case” (Pradhan , 1986:126).
In conclusion, conservative or loose working capital policy refers to that policy under
which a firm keeps high level of investment in working capital variables like high level
of receivable throughout liberal policy, high inventory and cash/bank balance while
24
aggressive or tight working capital policy just follows the reverse policy that of former
policy. But moderate policy follows the medium way between aggressive and
conservative working capital policy.
2.1.13 Determinants of Working Capital
The importance of efficient working capital management is an aspect of over all financial
management. Thus a firm plans its operation with adequate working capital requirement
or it should neither too excess nor too inadequate working capital. But there are no sets of
rules or formulae to determine the working capital requirements of the firm. It’s because
of a large number of factors that influence the working capital requirement of the firm. A
number of factors affect different firm in different ways. Internal policies and
environment change also affect the working capital. Generally, the following factors
affect the working capital requirements of the firm.
i. Nature & Size of Business
The working capital requirement of a firm is basically related to size and nature of the
business. If the size of the firm is larger, then it requires more working capital. While
small firm needs less working capital .Trading and financial require larger amount of
working capital relatively to public utilizes.
ii. Manufacturing Cycle
Working capital requirement of an enterprise is also influenced by the manufacturing or
production cycle .It refers to the time involved to make the finished goods from the raw
materials. During the process of manufacturing cycle funds are tied-up. The longer the
manufacturing cycle, the larger will be the working capital requirement and vice-versa.
iii. Production Policy
Working capital requirement is also determined by its production policy. If a firm
produces seasonal goods, then its production and sales volume fluctuates with different
seasons. This type of fluctuating production policy affects the working capital policy of
the firm.
25
iv. Credit Policy
Credit policy also affects the working capital of a firm. Working capital requirement
depends on term of sales. Different term may be followed to different customers
according to their credit worthiness. If the firm follows the liberal credit policy, then it
requires more working capital .Conversely, if a firm follows the stringent credit policy, it
requires less working capital.
v. Availability of Credit
Availability of credit facility is another factor that affects the working capital
requirements. If the creditors avail a liberal credit terms, then the firm will need less
working capital and vice-versa. In other words, the firm can get credit facility easily on
favorable conditions. Thus, it requires less working capital to run the firm otherwise more
working capital is required to operate the firm smoothly.
vi. Growth and Expansion
Growth and expansion also affect the working capital requirement of a firm. However, it
is difficult to precisely determine the relationship between the growth and expansion of
the firm and working capital needs. But the other things being the same growing firm
needs more working capital than those static ones.
vii. Price-level Change
Price-level change also affects the working capital requirement of a firm. Generally, a
firm requires maintaining the higher amount of working capital if the price level rises.
Because the same level of current assets needs more funds due to the increasing price. In
conclusion, the implications of changing price level on working capital position will vary
from firm to firm depending on the nature and other relevant consideration of the
operation of the concerned firms.
viii. Operating Efficiency
26
Operating efficiency is also important factor, which influences the working capital
requirement of the firm. It refers to the efficient utilization of available resources at
minimum cost. Thus, financial manager can contribute to strong working capital position
through operating efficiency. If a firm has strong operating efficiency then it needs fewer
amounts of working capital and vice-versa.
ix. Profit Margin
The level of profit margin differs from firm to firm .It depends upon the nature and
quality of products, marketing management and monopoly power in the market .If the
firm deals with the high quality product and has a sound marketing management and
enjoyed the monopoly power in the market then it earns quite high profit & vice-versa.
Profit is the source of working capital, because it contributes towards the working capital
as a pool by generating more internal funds.
x. Level of Taxes
The level of taxes also influences working capital requirement. The amount of taxes to be
paid in advance is determined by the prevailing tax regulations. But the firm’s profit is
not constant, or can’t be predetermined .Tax liability in a sense of short-term liquidity is
payable in cash. Therefore, the provision for tax amount is one of the important aspects
of working capital planning .If tax liability increases; it needs to increase the working
capital & vice-versa.
xi. Cash Requirements
Cash is one of the current assets, which is essential for the successful operations of the
production cycle. Cash should be adequate and properly utilized. Adequate cash is also
required to maintain good credit relation.
xii. Business Fluctuations
This situation whether an organization operating is boom or recession or depression
period also determine the working capital needs of the organization.
xiii. Change in Technology

27
Technology developments related to the production process have a sharp impact on the
need for working capital. Change in technology will need additional amount of working
capital due to fresh investment in new fixed assets.
2.2 Reviews of Journals/Articles
This section is also important for literature review of working capital. For the study of
this section many latest information can be derived about related field. This part is mainly
focused on the review of journals and research studies published by different
management experts about working capital management. Joseph (1962) has presented the
article on “Working Capital Concept”. This article looks a fresh at the problem of
determining working capital, and purposes a simple yet comprehensive restatement of
principle with respect to current assets and current liabilities. The working capital
measures the liquidity, the fluidity of capital and serves as an indicator of balance sheet in
the assets and liability structure of the company. Bank and the other short-term creditor
are vitally interested in the amount of working capital from the stand point of evaluating
the prospect of repayment of their claim against the company .Why firms have different
level of working capital. The paper dealt with the strategic determinant of working capital
(cash, short-term securities, account receivable and inventory) on a product line basis.
The factors analysis is to test 1666 variables against the working capital policies of over
1700 business, or product lines, from 1971 to 1978 .his final multiple regression models
contained 19 variables pertaining to productions, sales, accounting, competitive position
and industry factors.
Working Capital Model= Sales + Production + Accounting + Competitive Position
+Industry factors. This model was used to explain why working capital levels differ
between firms both within and across industries.
Working Capital Management in Public Enterprises and Study the Financial Results and
Constraints has considered ten-selected public enterprises and studied the working capital
management of those public enterprises. The study states the managers often lack basis
knowledge of working capital and its overall impact on the operative efficiency and
financial viability of public enterprises. This study has focused on liquidity, turnover and

28
profitability position of sampled enterprise. Based on those factors, the study has brought
certain policy issues of Nepalese public enterprise.
Such as lack of suitable financial planning, negligence toward working capital
management, deviation liquidity and turnover of assets and inability to show positive
relationship between turnover and return on net working capital. This study has suggested
the measures to overcome such policy issues like identifications of needed funds, regular
checks and development of management information system, positive attitude towards
risk and profit and determination of right combination of short-term and long-term
sources to finance working capital requirements.
Radhe S. Pradhan and K.D Koirala (1983) had jointly published an article on “Some
Reflections of Working Capital Management in Nepalese Corporations”. This article
aims to find out the difficulty, problems and importance of current assets management
and also aims to find out the motive for holding cash and inventory. The study use only
primary data to find out the basic constraints and distributed 200 questionnaires.
For the purpose of study, they use both manufacturing public corporation as a sample
companies. After analyzing the collected data the major findings of this study are as
follows:
To provide a reserve for routine net outflows of cash is the major motive for
holding cash in Nepalese corporation.
The major reason for holding inventories is to facilitate smooth operation of
production and sales.
The major factor affecting the large investment in receivable is found to be the
liberal credit policy followed by Nepalese corporation. The large paying practice of
customer is also responsible for larger investment in receivable. However,
corporations are reluctant to take inefficient collection of trade credit as one of the
major factor affecting receivables.

29
K. Acharya (1985) has published an article on “Problems and Impediment in The
Management of Working Capital in Nepalese Enterprises”. This article has presented that
working capital management; especially in public sector, has been a relatively weak area.
The study has described operational problems as well as organizational problems faced
by the Nepalese public enterprises regarding the working capital management. Some of
these problems are:
The operational problems are as follows
Public enterprises has slow inventory turnover.
Change in working capital has low impact on profitability.
Current liabilities are increasing largely than current assets.
They have not followed the conventional proportion of debt and equity as 1:1.
Absent and apathetic information management system.
The performance evolution tools and techniques like break even analysis, fund
flow analysis, ratio analysis, are either undone or inefficient in most public
enterprises.
Monitoring the proper functioning of working capital management has never
considered as managerial job.
Secondly, the organizational problems are:
Lack of regular evaluation of financial as well as regular internal and external
audit system.
Most of public enterprises being unable to present their capital requirements with
proper justifications.
Functioning of finance department was not satisfactory.
Some of public enterprises are facing the problem of under utilization of capital.
This study is not satisfied with the performance of enterprises. To make an efficient use
of funds for minimizing the risk of loss. To make an efficient use of funds for minimizing
the risk of loss to attain the profit objectives. This study has made some suggestion and
recommendation.

30
Public enterprises should take care of negatively affecting policies directives from
HMG Nepal itself.
Public enterprises should avoid fictitious holding of assets immediately.
Finance staff must be adequate with the modern scientific tools used for the
presentation and analysis of data.
Lastly, this study has suggested optimizing its level of investment because both of
these situations will erode the efficiency of concern.
Weinurb, Visscher (1998) have carried out a study on industry practice relating to
aggressive, conservative working capital policies. This study looked at ten diverse
industry groups over an extend time period to examine the relative relationship between
aggressive and conservative working capital practices. Results of strongly show that the
industries had significantly different current assets management policies. Additionally the
relative industry ranking of the aggressive /conservative liability management was also
significantly different. Interestingly, it is used where there is a high and significant
negative correlation between industry current assets and liability policies. Relatively
aggressive working capital management seems balanced by conservative working capital
financial management. An empirical study on the working capital channel and cross-
sector movement. The paper studied cross-sector co-movement, one of the defining
characteristics of business cycle, in a monetary framework. The study argues that
monetary factors might be important for understanding this phenomenon through a
working capital channel. The study showed that in a strictly portfolio adjustment model
where firm borrow to finance working capital, appositive money supply shock drives the
nominal interest rate down, thereby stimulating firm’s borrowing and causing
employment to rise in different sectors. A positive aggressive technology shock can also
drive the nominal interest rate down upon impact and reduce co-movement when the
elasticity of labor supply is large.
L.D. Mahat (2004) has published article relating to “Spontaneous Resources Working
Capital Management”. The article has defined the three major sources of working capital
i.e. equity financing, debt financing and Spontaneous sources of financing, regarding the
31
working capital management. Debt financing includes short term, bank financing such as
bank overdraft, cash credit, bills purchase and discounting, letter of credit etc. where as
spontaneous sources of working capital include trade credit, provisions and accursed
expenses.
The articles has defined that working capital management is one of the important pillars
of corporate finance. However, Nepalese industries are facing difficulty in their survival
by the cause of recession, which can bring best and worst in corporate finance such as
environment should be enough to cope with the possible worst happening in future for
working capital management.
The study has said that managing the working capital resources for a profit making
industries are routine affairs of just making payment and arranging collection of debtors.
In contrast, the company in debt trouble, it is rather difficult to meet its working capital
gap by the way of debt financing, the company should have to bear interest, which may
cause to increase in the percentage of operating expenses to the turnover and depletion in
the profit. Therefore, spontaneous sources of working capital will better to working
capital in order to improve its performance.
Consequently in a changed economic scenario, ever company should realize that inability
to manage working capital might land them in a vicious circle that can be hard to get out
form. It is indeed essential for industries to tighten their belts and check their financial
stability to face and stand in forth coming competitive day.
2.3 Review of Thesis
Besides the review of available books and research studies, a number of studies have
been made by student of MBA and MBS relating to working capital management in
different PEs and private companies of Nepal. This section will review some of those
dissertations.

32
Shiva Pathak (2005) has done a research on “An Evaluation of Working Capital
Management of Nepal Lube Oil Limited”. The objectives of this study are to appraise the
working capital management of NLO Ltd. and to study the relationship between sales and
different variables of working capital. To achieve these objectives, this study has taken
five year period and applied the secondary data.
The major findings of the study are:
The growing tendency of investment over current assets could have adverse effects
in NLO Ltd’s wealth maximization goals in long run. The study has suggested that
NLO Ltd should determine certain rate of return on investment and sales target
should be set.
The company should always concern about the current assets and current liabilities
and regular check should made. It will control the excess and shortage of working
capital of the company.
The company should give attention to manpower planning and should avoid both
under staffing and over staffing.
Dependra Raj Sharma (2006) has done a research on “A Study on Working Capital
Management of Nepal Battery Co. Limited”. Considering five years financial statement
(i.e. balance sheet, profit and loss A/C and income statements, etc.) from 1994 to1998.
This study has used ratio analysis as tools for the purpose of analyze working capital
management in NBC Ltd. The major objectives of this study are to analysis the liquidity
composition of working capital, assets utilizations and profitability position of NBC Ltd.
This study also focuses on relationship between sales and different variables of working
capital of NBC Ltd.
The findings of this study are as follows:
The major component of working capital of NBC Ltd are cash and bank balance,
account receivable, inventory, miscellaneous current assets and inventory holds
large portion of current assets. The proportion of current assets on total assets and

33
fixed assets is increasing, it indicates that inventory in current assets is high with
respect to its total assets and fixed assets.
Inventory to total assets ratio shows fluctuating trend and receivable to total asset
position show increasing trend. The turnover position is in fluctuating trend and
receivable conversion period and inventory conversation period is long which is
unfavorable for the company.
Values of current and quick ratios are found nearly equal to standard inefficiency in
operation can be seen through wide different between gross profit margin and net
profit margin and high level of operating ratio. This study has suggested the
company to reduce the inventory level. This study recommends about receivable
conversion period, which is necessary to reduce with concerning sales volume
because reduction of this period may affect on sales volume. Lastly, this study
mentions about operating cost, which must be reduced in proper way so that can
maximize its profitability and shareholders return.
Prabin Kunwar (2005) has carried out a research on “Working Capital Management of
Pharmaceutical Industry of Nepal with Reference to Royal Drugs Limited”. The study
has used statistical as well as financial tools to analyze the statement of 2049/50 to
2054/2055. The main objective of this study is to analyze empirical testing affecting
working capital of Royal Drugs Limited as well as to know whether adequacy of working
capital depends upon the nature of financing current assets or not.
The major findings of this study are:
It has used more long term sources of financing than short term sources and
followed conservative working capital policy.
The major components of current assets in Royal Drugs Limited are cash and bank
balance, receivable, inventory. Among these current assets inventory holds largest
portion of current assets.
Company can not efficiency utilize current assets and there is also inefficient
management of receivable policy.
34
Liquidity position is satisfactory where as return position is not satisfactory due to
negative return. This study has suggested that the company should determine
appropriate financing sources. Company should reduce inventory and receivable
level for adjusting with sales and production level. To balance them company
should improve marketing and credit policy.
Bishnu Prasad Aryal (2002) has done a research on “A Study on Working Capital
Management of Nepal Telecommunication Corporation”. The specific objectives of this
study are to know how far NTC is able to utilize its current assets properly. This study
has calculated various financial ratios by taking five years secondary data of NTC.
The major findings of the study are;
There is high liquidity in NTC.
Cash and bank balance holds large amount of current assets
It has followed conservative financing policy.
Turnover ratios of company are not satisfied, profitability position is not satisfied
but liquidity condition of NTC is favorable.
Ram Babu Ghimire (2003) has done a research on “Working Capital Management of
Selected Manufacturing Company-Listed in Nepal Stock Exchange”. The study covers
five years historical data from 1997 to 2001 of seven manufacturing companies. This
study has focused on the issue of working capital management in relation to selected
manufacturing companies. The main objectives of this study are to study working capital
practices of listed Nepalese manufacturing companies, to analysis the variable affecting
working capital management in Nepalese manufacturing companies and to determine the
issue and gaps in working capital management of these companies. For finding the
solution to above problem, the study has employed quantitative and qualitative methods.
In quantitative method, this study has used financial tools (ratio analysis, cash conversion
cycle, predicting power of ratio of success/failure and DU point) and statistical tool (Karl
Pearson’s correlation coefficient and simple linear regression). In the qualitative method,
this study has used opinion survey method.

35
The major findings of the study are;
Out of seven, five companies have followed a moderate working capital policy.
The overall average inventory, receivable, payable and cash conversion period are
high.
Correlation coefficients between various components of working capital with sales
are moderate.
Overall profitability of these selected manufacturing companies is positive, on other
hand he has found some issues and gaps i.e. inefficient current assets management,
missing working capital policy, high level cost, excessive borrowing, weak liquidity
position, high conversion cycle and management inefficiencies. At last the study
has suggested that manufacturing companies should make a quarterly working
capital plan with effective working capital management. Further they should
improve liquidity position, adopt appropriate financing policy, prepare effective
sales plan, develop efficiency of personal and staff, and develop appropriate
information system.
Purushottam Gautam (2004) has conducted the research on “Working Capital
Management of Soaltee Crowne Plaza”. This study has covered the period of five years
(1998/99 -2002/2003). For the analysis of working capital this study has used different
financial and statistical tools like ratio analysis, trend analysis, standard deviation and
regression analysis. The main objective of this study is to examine working capital
practices and profitability position of Soaltee Crowne Plaza.
The major findings of this study are as given below:
The current ratio of Soaltee Crowne Plaza is in very poor condition because the
current asset is than the current liabilities in each year of the study period.
Comparing with standard ratio the calculated current ratio become too small.
Therefore, the liquidity position of the company is not satisfactory. Quick assets are
pure liquid in nature, but the calculated ratio shows the liquid is insufficient to pay
its current payable as its ratio is below standard.

36
Company is loosing its ability in respect with investment policy because in the
proceeding year it has positive return whereas in the later year it has negative
return.
The fluctuation cash turnover implies that the Soaltee Crowne Plaza is in efficient
in cash management.
The proportion of current assets to total assets is nearly consistent. The company
has low investment in current assets.
Company has followed conservative policy of financing. The receivable turnover is
more consistent. The utilization of current assets becomes unsatisfactory. The study
has suggested that the company should make the effective plan, which helps for
immediate marketability and certainly decrease the problem of overstocking.
Basu Yadav (2006) has conducted the research on “Working Capital Management of
Listed in Nepal Stock Exchange”. The study has used financial as well as statistical tools
to analysis the financial data of 2000 to 2005. The study has also used primary and
secondary sources of data. The main objective of this study is to apprise the working
capital management of listed hotels and to find out the relationship between the different
variables of working capital.
The major findings of this study are:
Yak and Yeti, Oriental and Soaltee Crowne Plaza are suffering from excess of
current assets over the current liabilities.
Yak and Yeti has followed conservative financing policy whereas Soaltee and
Oriented have followed aggressive financing policy.
The relationship between current assets and current liabilities, current assets and net
sales, and net working capital, are found negative and receivables and net sales are
positive of all selected hotels.
From the primary information, it has also found that Oriental and Yak and Yeti are
not implying any credit standard policy and credit payable policy.
The liquidity and profitability position of all selected hotels is satisfactory.
37
2.4 Research Gap
All the above studies are conducted with the research title “Working Capital
Management”. Some researchers have selected various manufacturing companies for the
research and some have concentrated in only one or two companies. As to research gap is
concerned, there are many changes taken place in the working capital environment and
production process as compared to the last few years. So, fresh study related to working
capital management of ULN Ltd has been done in this research. During the period of gap,
the company has renamed to Uni-Lever Nepal Ltd .from Nepal Lever Limited .The most
of the studies has been considered many more objectives which made their study more
complicated but in this research report only four objectives are taken into study. Some
researcher uses both primary and secondary data but only secondary data are considered
in this research. Both financial as well as statistical tools like ratio analysis, turnover,
cash conversion cycle, mean, standard deviation, coefficient of correlation and probable
error are used in this research. Almost all the ratios have been applied to cover the
analytical part and fulfill the objective of this study. It involves more recent data of ULN
Ltd. for five years (2059/060-2063/064).

38
CHAPTER - III
RESEARCH METHODOLOGY
3.1 Introduction
According to Oxford Dictionary, research has been defined as the systematic
investigation and study of materials, sources, etc. in order to establish facts and research
conclusion. Research refers to various sequential steps to be adopted by a researcher in
studying a problem with certain objective in the process of activities to the solution of the
problem through planned and systematic dealing with the collection analysis and
interpretation of facts and figures. It consists of research design, population and sample
study, sources of data, data processing procedure and technique of analysis of data. This
chapter describes the methodology employed in this study. The main objective of this
study is to analyze, examine, highlight and interpret the working capital management and
it’s impact in financial performance of two commercial banks. i.e. NABIL and NIC. The
justification on the present study cannot be obtained without help of proper research
methodology.
This study has used financial analysis techniques as well as statistical tools. It is more
analytical and empirical. It is mainly based on secondary data gathered from respective
annual reports of concerned organization and other publication made by them.
3.2 Research Design
Research design is a plan structure and strategy of investigation conceived so as to obtain
answer to research question and to control variances. It is the arrangement of conditions
for collection and analysis of data that aims to combine relevance to the research purpose
with economy in procedure. It means an overall framework or plan for the collection and
analysis of data. The study aims to portraying accurately upon the working capital and
it’s impact on overall financial performance of these two banks. The research design
followed for this study is basically a historical, empirical and descriptive cum analytical
research method is followed.

39
3.3 Population and Sample
Currently there are 26 commercial banks and 58 finance companies which form the
population for this study. All those financial institutions are also handling working capital
management on their own way. Among them NABIL and NIC commercial banks have
been taken as sample for the study. Financial statements of latest 5 years from 2003 to
2008 have been taken as the study period of the comparative study of working capital
management. These companies are chosen as they account for the considerable market
share of the banking sector.
3.4 Nature and Sources of Data
Data collection is considered as an integral part of the research activity. The sources of
information are generally classified as primary and secondary.
a. Primary Data: Data collected by researcher or through agent for the first time from
related field and processing original character are known as primary data. In
preparing this thesis, primary data are lesser used due to time factor and nature of
availability.
b. Secondary Data: Data collected by some one else, used already and are made
available to others in the form of published statistics are known as secondary data.
Different types of data from several sources are necessary for this study. Therefore, both
quantitative and qualitative data have been collected. Qualitative data have been collected
through office visit and informal interviewing with some staff and Quantitative data are
collected through reports etc. published by relevant banks.
3.5 Data Processing Procedure
The obtained data are presented in various tables, diagrams and charts with supporting
interpretation. These detail calculations that cannot be shown in the body part of the
report are presented in appendices at the end.
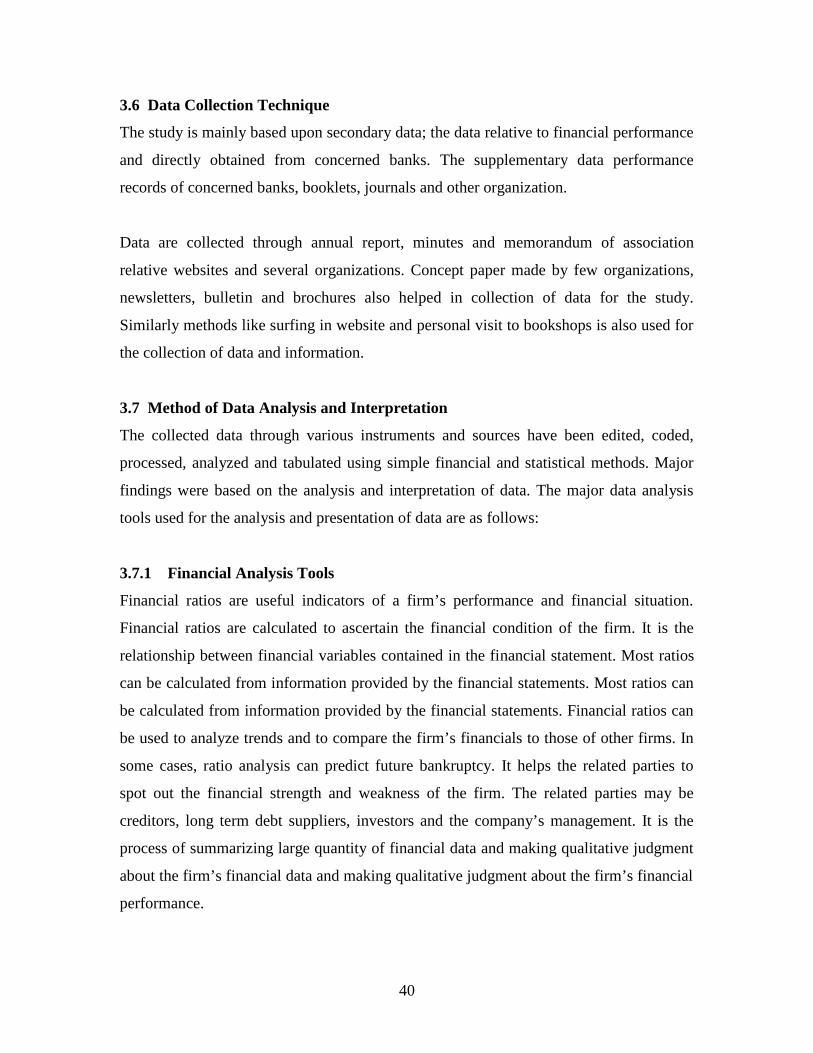
40
3.6 Data Collection Technique
The study is mainly based upon secondary data; the data relative to financial performance
and directly obtained from concerned banks. The supplementary data performance
records of concerned banks, booklets, journals and other organization.
Data are collected through annual report, minutes and memorandum of association
relative websites and several organizations. Concept paper made by few organizations,
newsletters, bulletin and brochures also helped in collection of data for the study.
Similarly methods like surfing in website and personal visit to bookshops is also used for
the collection of data and information.
3.7 Method of Data Analysis and Interpretation
The collected data through various instruments and sources have been edited, coded,
processed, analyzed and tabulated using simple financial and statistical methods. Major
findings were based on the analysis and interpretation of data. The major data analysis
tools used for the analysis and presentation of data are as follows:
3.7.1 Financial Analysis Tools
Financial ratios are useful indicators of a firm’s performance and financial situation.
Financial ratios are calculated to ascertain the financial condition of the firm. It is the
relationship between financial variables contained in the financial statement. Most ratios
can be calculated from information provided by the financial statements. Most ratios can
be calculated from information provided by the financial statements. Financial ratios can
be used to analyze trends and to compare the firm’s financials to those of other firms. In
some cases, ratio analysis can predict future bankruptcy. It helps the related parties to
spot out the financial strength and weakness of the firm. The related parties may be
creditors, long term debt suppliers, investors and the company’s management. It is the
process of summarizing large quantity of financial data and making qualitative judgment
about the firm’s financial data and making qualitative judgment about the firm’s financial
performance.

41
In the research study various financial tools are employed for the analysis. There are
various ratios but in this study some selected ratios among them are used.
A. Liquidity Ratio
Liquid Assets are those that can be easily converted into cash without significant loss of
it’s original value. Converting assets, especially current assets such as inventory and
receivables, to cash in the primary means by which a firm obtains the funds needed to
pay it’s current bills. Therefore, a firm’s liquid position deals with the question of how
well the firm is able to meet it’s current obligations. Short-term assets or current assets
are most easily converted to cash than long-term assets. So, in general, one firm would be
considered more liquid than other firm if it has a greater proportion of it’s total assets in
the form of current assets. Liquidity ratio measures the short-term solvency position of
the firm. Liquidity ratio is ratio that shows the relationship of a firm’s cash and other
current assets to it’s current liabilities. Under this, there are two types of ratios.
a. Current Ratio
Current assets divided by current liabilities from the most recent quarter. The current
ratio is a measure of the firm’s immediate financial health and it’s ability to meet current
obligations. Generally, the current ratio should be 2:1 or higher; the higher the current
ratio, the more conservative the firm, although a high current ratio can mean less
profitability than a competing firm with a leaner current ratio. Also, like so many ratios,
this one can vary by industry. Restaurant companies, for example, often have current
ratios of less than 1:1, but since there is usually a delay between payment for services
(which is immediate) and payments to vendors, who typically grant credit, this low ratio
raises few eyebrows.
b. Quick Ratio

42
The sum of cash and receivables from the most recent quarter divided by the total current
liabilities from the most recent quarter. This assessment of a company’s ability to meet
short-term obligations is also known as the acid test. In general, the quick ratio should be
1 or better. A high quick ratio is usually a sign of a solid, conservatively run company in
no danger if imminent demise even if for some awful reason sales immediately ceased. A
firm’s quick ratio might be of special interest to investors anticipating some kind of
downturn in the firm’s business or the economy at large.
c. Cash and Bank Balance to current, margin and
other deposit ratio (Without fixed deposit).
This ratio is employed to measure whether the bank and cash balance is sufficient to
cover its call margin including deposit. It is calculated by dividing cash and bank balance
by saving margin and current deposit (excluding fixed deposit). It can be expressed as:
B. Activity Ratio (Turnover Ratio)
Activity ratio is intended to measure the effectiveness to employment of the resources in
a business concern. Activity ratio measure efficiency of the firm. Through these ratios, it
is known whether the funds employed have been used effectively in the business activity
or not. The following are the ratios, employed to analyze the activeness of the concerned
joint venture.
a. Loan and Advances to total Deposit Ratio
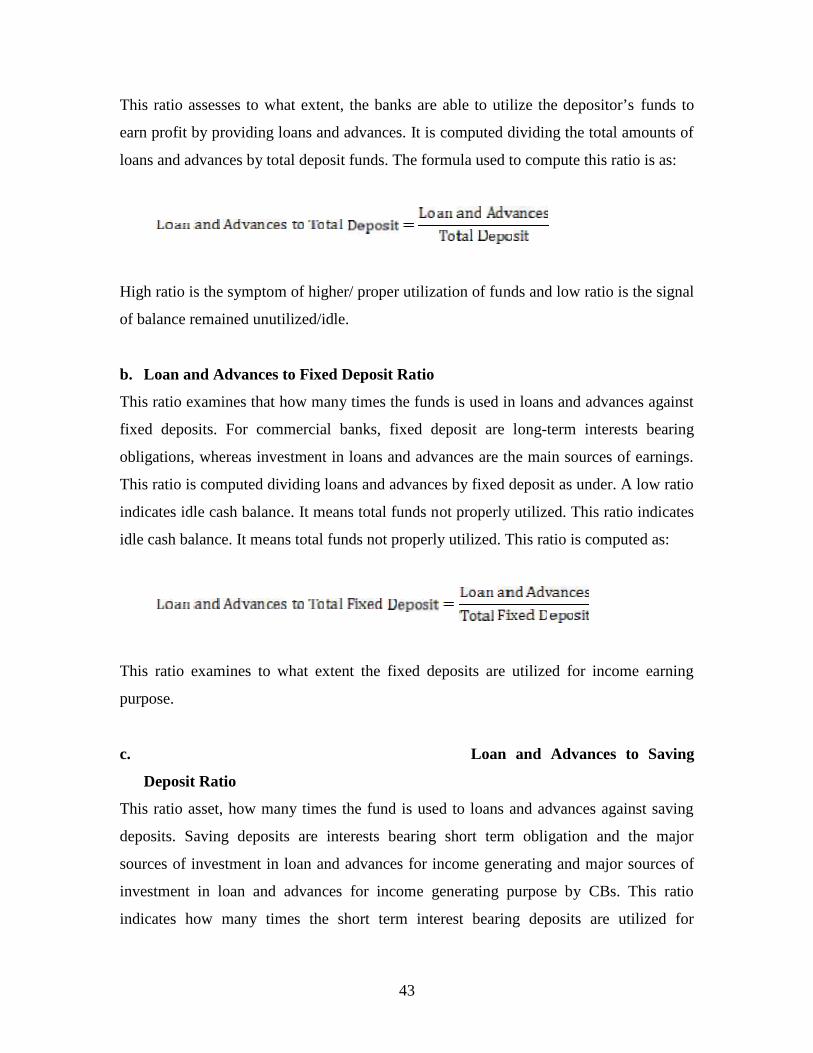
43
This ratio assesses to what extent, the banks are able to utilize the depositor’s funds to
earn profit by providing loans and advances. It is computed dividing the total amounts of
loans and advances by total deposit funds. The formula used to compute this ratio is as:
High ratio is the symptom of higher/ proper utilization of funds and low ratio is the signal
of balance remained unutilized/idle.
b. Loan and Advances to Fixed Deposit Ratio
This ratio examines that how many times the funds is used in loans and advances against
fixed deposits. For commercial banks, fixed deposit are long-term interests bearing
obligations, whereas investment in loans and advances are the main sources of earnings.
This ratio is computed dividing loans and advances by fixed deposit as under. A low ratio
indicates idle cash balance. It means total funds not properly utilized. This ratio indicates
idle cash balance. It means total funds not properly utilized. This ratio is computed as:
This ratio examines to what extent the fixed deposits are utilized for income earning
purpose.
c. Loan and Advances to Saving
Deposit Ratio
This ratio asset, how many times the fund is used to loans and advances against saving
deposits. Saving deposits are interests bearing short term obligation and the major
sources of investment in loan and advances for income generating and major sources of
investment in loan and advances for income generating purpose by CBs. This ratio
indicates how many times the short term interest bearing deposits are utilized for
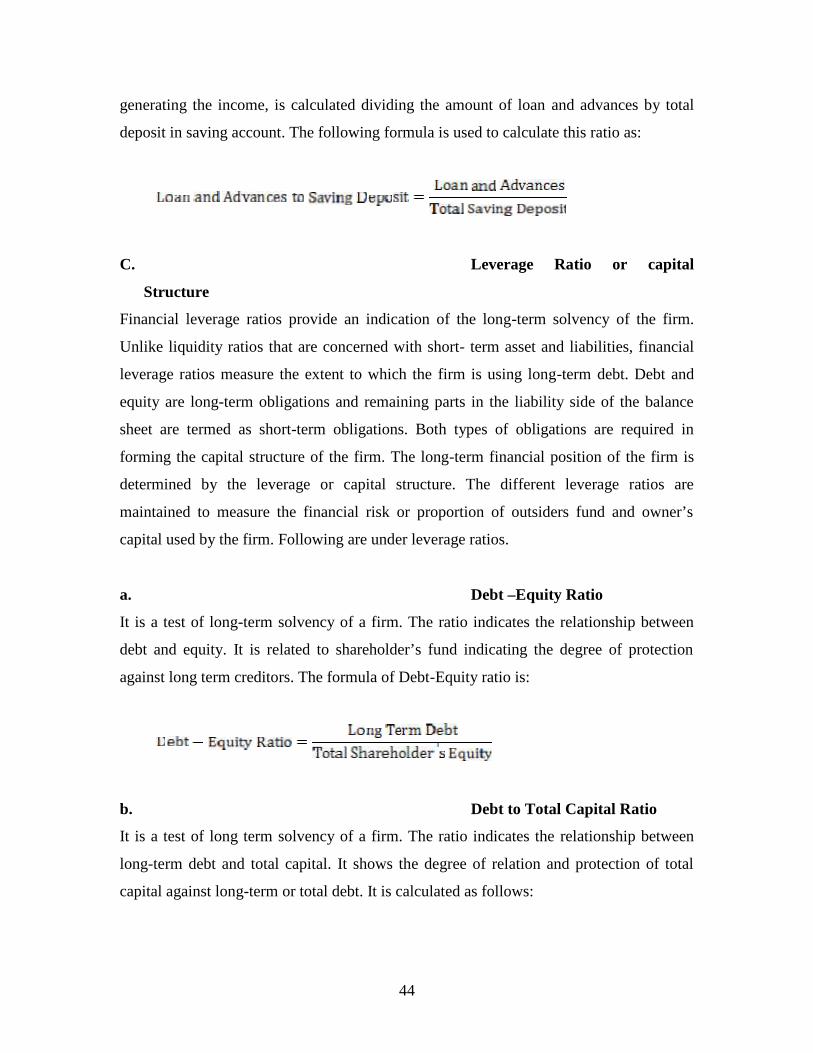
44
generating the income, is calculated dividing the amount of loan and advances by total
deposit in saving account. The following formula is used to calculate this ratio as:
C. Leverage Ratio or capital
Structure
Financial leverage ratios provide an indication of the long-term solvency of the firm.
Unlike liquidity ratios that are concerned with short- term asset and liabilities, financial
leverage ratios measure the extent to which the firm is using long-term debt. Debt and
equity are long-term obligations and remaining parts in the liability side of the balance
sheet are termed as short-term obligations. Both types of obligations are required in
forming the capital structure of the firm. The long-term financial position of the firm is
determined by the leverage or capital structure. The different leverage ratios are
maintained to measure the financial risk or proportion of outsiders fund and owner’s
capital used by the firm. Following are under leverage ratios.
a. Debt –Equity Ratio
It is a test of long-term solvency of a firm. The ratio indicates the relationship between
debt and equity. It is related to shareholder’s fund indicating the degree of protection
against long term creditors. The formula of Debt-Equity ratio is:
b. Debt to Total Capital Ratio
It is a test of long term solvency of a firm. The ratio indicates the relationship between
long-term debt and total capital. It shows the degree of relation and protection of total
capital against long-term or total debt. It is calculated as follows:

45
D. Profitability Ratio
Profitability ratios offer several different measures of the success of the firm at
generating profits. It indicates of success in achieving desired profit. Various profitability
ratios are calculated to measure the operating efficiency of business enterprises. Through
profitability ratios the lender and investors want to decide whether to invest in a
particular business or not. Some of the important profitability ratios used is as follows:
a. Interest Earned to Total Assets
Ratio
Interest Earned to Total Assets Ratio formed to find out the percentage of the interest
earned investing total assets. This ratio can be calculated by dividing the amount of
interest earned by the total assets of the firms. It can be expressed as:
b. Net Profit to Total Assets Ratio
This ratio is very much crucial for measuring the profitability of funds invested in the
bank’s assets. It measures the return on assets. It can be calculated by dividing the net
profit after tax by total assets. It can be expressed as:
c. Net Profit to Total Deposit ratio
This ratio is used for measuring the internal rate of return from deposits. It is computed
by dividing the net profit by total deposits. This can be expressed as:

46
Higher ratio indicates the return from investment on loans and advances are desirable and
lower ratio indicates the funds are not properly mobilizing.
d. Composition of Working
Capital
Cash and Bank Balance percentage
Loan and advances percentage
Government securities percentage
Miscellaneous current assets percentage.
3.7.2 Statistical Tool Used
Statistical methods are the mathematical techniques used to facilitate the analysis and
interpretation of numerical data secured from groups of individuals or groups of
observations from a single individual. In this research study some statistical tools are also
used for analysis. Those tools are as follows:
A. Trend Analysis
Different variants change according to change of time. Variation of such variants with
time can be systematically studied and analyzed. The tools that are used to show grandly
increase or decrease of variables over a period of time is known as trend analysis. The
financial statement may be analyzed computing trends of series of information. This
method determines the action upwards or downwards and involves the computation of the
percentage relationship that each statement item has been extracted from the same item in
the base year. The information for a number of years is taken upward first year, generally
the first year is taken as a base year. With the help of trend analysis the tendency of
variables over the period can be seen clearly. The trend percentage analysis interprets that
either increase or decrease in trend percentage may give misleading results. This section
expresses the trend of same related items, which have effect in working capital.
B. Correlation
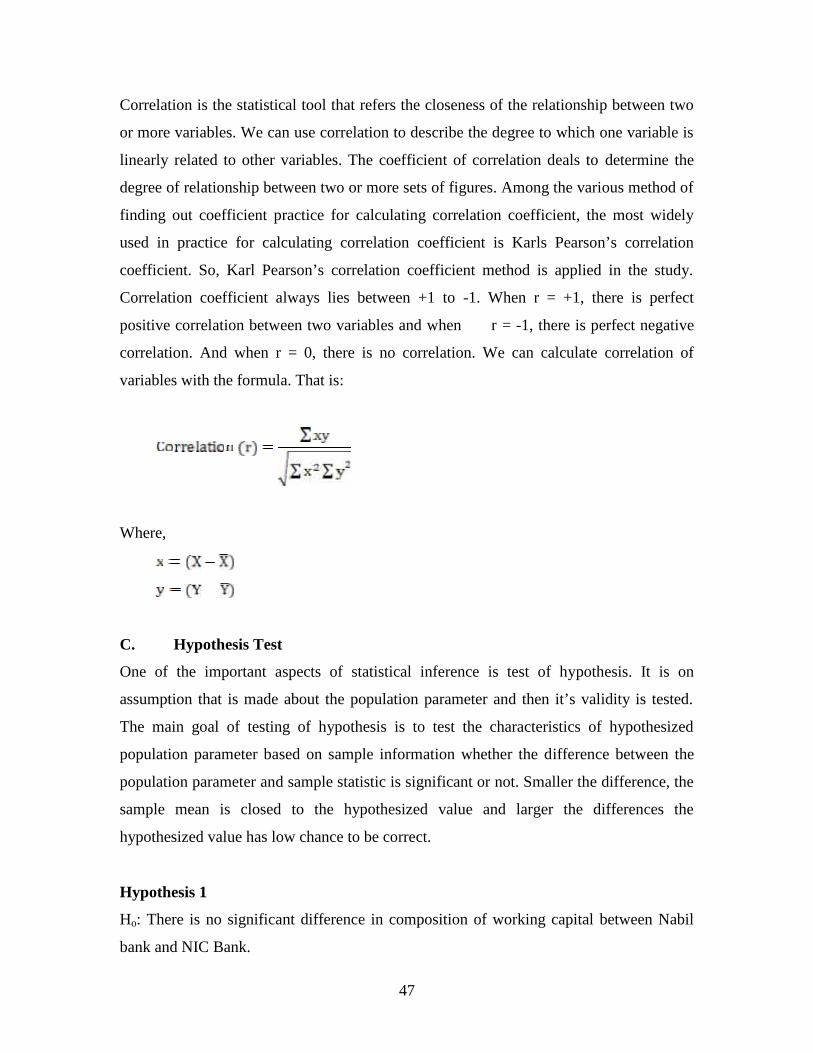
47
Correlation is the statistical tool that refers the closeness of the relationship between two
or more variables. We can use correlation to describe the degree to which one variable is
linearly related to other variables. The coefficient of correlation deals to determine the
degree of relationship between two or more sets of figures. Among the various method of
finding out coefficient practice for calculating correlation coefficient, the most widely
used in practice for calculating correlation coefficient is Karls Pearson’s correlation
coefficient. So, Karl Pearson’s correlation coefficient method is applied in the study.
Correlation coefficient always lies between +1 to -1. When r = +1, there is perfect
positive correlation between two variables and when r = -1, there is perfect negative
correlation. And when r = 0, there is no correlation. We can calculate correlation of
variables with the formula. That is:
Where,
C. Hypothesis Test
One of the important aspects of statistical inference is test of hypothesis. It is on
assumption that is made about the population parameter and then it’s validity is tested.
The main goal of testing of hypothesis is to test the characteristics of hypothesized
population parameter based on sample information whether the difference between the
population parameter and sample statistic is significant or not. Smaller the difference, the
sample mean is closed to the hypothesized value and larger the differences the
hypothesized value has low chance to be correct.
Hypothesis 1
Ho: There is no significant difference in composition of working capital between Nabil
bank and NIC Bank.
48
H1: There is significant difference in composition of working capital between Nabil bank
and NIC Bank.
Hypothesis 2
Ho: There is no significant difference in liquidity position between Nabil Bank and NIC
Bank.
H1: There is significant difference in liquidity position between Nabil Bank and NIC
Bank.
Hypothesis 3
Ho: There is no significant difference in profitability position between Nabil Bank and
NIC Bank.
H1: There is significant difference in profitability position between Nabil Bank and NIC
Bank.

49
CHAPTER – IV
DATA PRESENTATION AND ANALYSIS
The data collected from the various sources have been presented and analyzed in this
chapter. Since the conclusions to be drawn and the recommendations to be made from
this study are based on the presentation and interpretation of data analyzed here. This
chapter constitutes the main part of this study. The presentation and analysis of data
measures the various dimensions of the problems of the study.
The entire figure presented here are Rs. in million. The data presented herein are
pertained to mid July of each year and the data presented herein are based on the amount
mentioned in the annual report of respective years of concerned banks and journals of
NRB.
4.1 Introduction
The major objective of the study is a comparative study of working capital management
of NABIL and NIC commercial Banks. The major variables of the study are cash and
bank balance, loans and advances and investment in government securities. In this
chapter, relevant data and information of working capital as well as financial
performance of NABIL and NIC commercial banks are presented, compared and
analyzed accordingly. It covers to analyze the ratio as well as trend (the least square
method) and composition of current assets. Liquidity turnover, leverages and profitability
of these banks. It also uses correlation analysis and hypothesis test.
4.2 Composition of Current Assets
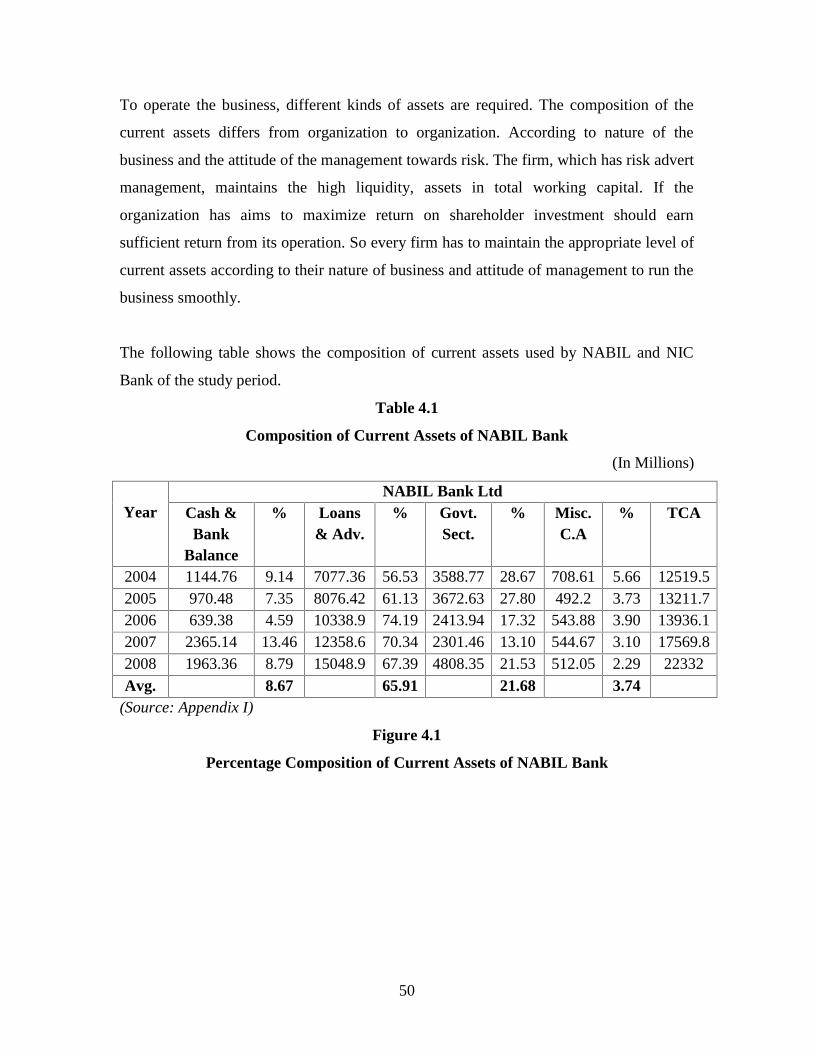
50
To operate the business, different kinds of assets are required. The composition of the
current assets differs from organization to organization. According to nature of the
business and the attitude of the management towards risk. The firm, which has risk advert
management, maintains the high liquidity, assets in total working capital. If the
organization has aims to maximize return on shareholder investment should earn
sufficient return from its operation. So every firm has to maintain the appropriate level of
current assets according to their nature of business and attitude of management to run the
business smoothly.
The following table shows the composition of current assets used by NABIL and NIC
Bank of the study period.
Table 4.1
Composition of Current Assets of NABIL Bank
(In Millions)
YearNABIL Bank Ltd
Cash &Bank
Balance
% Loans& Adv.
% Govt.Sect.
% Misc.C.A
% TCA
2004 1144.76 9.14 7077.36 56.53 3588.77 28.67 708.61 5.66 12519.52005 970.48 7.35 8076.42 61.13 3672.63 27.80 492.2 3.73 13211.72006 639.38 4.59 10338.9 74.19 2413.94 17.32 543.88 3.90 13936.12007 2365.14 13.46 12358.6 70.34 2301.46 13.10 544.67 3.10 17569.82008 1963.36 8.79 15048.9 67.39 4808.35 21.53 512.05 2.29 22332Avg. 8.67 65.91 21.68 3.74
(Source: Appendix I)
Figure 4.1
Percentage Composition of Current Assets of NABIL Bank

51
In the above table, we can see the total amount of current assets components of NABIL
Bank. Total amount of current assets components of NABIL Bank has increased from
second to last year of the study period, in forth and fifth year it has increased largely.
Table 4.2
Composition of Current Assets of NIC Bank
(In Millions)
(Source: Appendix I)
Figure 4.2
Percentage Composition of Current Assets of NIC Bank
YearNIC Bank Ltd
Cash &Bank
Balance
% Loans& Adv.
% Govt.Sect.
% Misc.C.A
% TCA
2004 347.96 8.90 2419.52 61.89 1075.19 27.50 66.56 1.70 3909.232005 448.96 8.37 3561.41 66.42 1235.28 23.04 115.95 2.16 5361.602006 1005.54 14.41 4711.71 67.50 1194.31 17.11 68.53 0.98 6980.092007 749.14 8.09 6655.96 71.85 1756.58 18.96 102.56 1.11 9264.242008 599.76 5.54 8902.53 82.22 1104.06 10.20 221.51 2.05 10827.8Avg. 9.06 69.98 19.36 1.60

52
In the above table, we can see the total amount of current assets components of NIC
Bank. Total amount of current assets components of NIC Bank has increased from
second to last year of the study period but in second and forth year it has increased
largely. The percentage composition of current assets to total current assets i.e., cash
and bank balance, loans and advances, investment in government securities and
miscellaneous current assets to total current assets of banks are presented in following
chart.
4.2.1 Cash and Bank Balance Percentage
Cash and Bank Balance Percentage of NABIL Bank is fluctuating over the study period.
First three year, it is in decreasing trend and then it is increasing in forth year but again it
is in decreasing trend in fifth year. It is highest in the forth year, i.e., 13.46 % and lowest
in the third year of the study period, i.e., 4.59 %. The average cash and bank balance
percentage of NABIL Bank is 8.67 %.
The yearly cash and bank balance of NIC Bank is also in fluctuating over the study
period. It has decreased in second year, increased in third year and again in decreasing
trend in forth and last year of the study period. It is highest in the year 2006 where it is
53
14.41 % and lowest in the last year of the study period i.e., 5.54 %. The average cash and
bank balance percentage of NIC Bank higher than NABIL Bank.
4.2.2 Loan and Advance Percentage
In the case of NABIL Bank, loans and advances percentage are increasing till third year
and decreasing till last year of the study period. It is highest in the year 2006 i.e., 74.19 %
and lowest in the year 2004 i.e., 56.53 %. The average loans and advances percentage is
65.91 %. The yearly loans and advances percentage of NABIL in the year 2004 and 2005
are less than the average i.e., 56.63 % and 61.13 %. But in the year 2006, 2007 and 2008
the loans and advances percentage are higher than the average i.e., 74.19 %, 70.34 % and
67.39 %.
In the case of NIC Bank, loan and advances percentage are increasing till last year of the
study period. It is highest in the year 2008, i.e. 82.22% and lowest in the year 2004, i.e.
61.89%. The average loan and advances percentage of NIC Bank is 69.98%. In the first
three years, i.e. 2004, 2005, & 2006, the yearly loan and advances percentage is lesser
than the average loan and advances percentage. They are 61.89%, 66.42% and 67.50%
respectively. But in the last two years of the study, the yearly loan and advances
percentage is higher than the average loan and advance percentage, i.e. 71.85% &
82.22%.
4.2.3. Government Securities Percentage
The percentage of Government Securities percentage of NABIL Bank is in decreasing
trend. It is decreasing till fourth year, i.e. 2007. But, the amount of percentage has
increased in the last year of the study period, i.e. 2008. It is higher in the year 2004, i.e.
28.67% and lower in the year 2007, i.e. 13.10%. The average percentage of government
securities of the bank is 21.68%. It is higher than its yearly government securities
percentage of last three years of the study period, i.e. 17.32%, 13.10% & 21.53%, and it
is lower than its yearly government securities percentage of first two years of the study
period, i.e. 28.67% & 27.80%.

54
Government securities percentage of NIC Bank is fluctuating over the study period. It is
highest in the year 2004, i.e. 27.50% and the lowest government securities percentage is
in the year 2008, i.e. 10.20%. The average government securities percentage is 19.36%.
The yearly percentage of government securities percentage of the bank is higher than its
average percentage in first two years of the study period, i.e. 27.50% & 23.04% and it is
lower in last three years of the study period, i.e. 17.11%, 18.96% & 10.20%.
4.2.4. Miscellaneous Current Assets Percentage
From the table 4.1, we know that NABIL Bank is investing lesser amount in
miscellaneous current assets in comparison to other components of current assets over the
study period. It is in range between 2.29% and 5.66%. The average miscellaneous current
asset is 3.74%. The yearly percentage of miscellaneous current assets percentage is
higher than its average percentage in the year 2004 & 2006, i.e. 5.66% & 3.90% and it is
lower than its average percentage in the year 2005, 2007 &2008, i.e. 3.73%, 3.10% &
2.29%. The investment in miscellaneous current asset is stable in comparison to other
components of current assets.
Miscellaneous current assets percentage of NIC is also more stable than its other
components of current assets just like NABIL. It is in the range between 0.98% & 2.10%.
The average miscellaneous current asset of the bank is 1.60%. It is highest in the year
2005, i.e. 2.16% and lowest in the year 2006, i.e. 0.98%. The yearly percentage of
miscellaneous current assets percentage of the bank is higher than its average percentage
in the year 2004, 2005 & 2008, i.e. 1.70%, 2.16% & 2.05% whereas in the year 2006 &
2007, the yearly percentage is lower than its average percentage, i.e. 0.98% & 1.11%.
Miscellaneous current assets percentage of NIC is always lesser than NABIL and its
average miscellaneous current assets percentage is lesser than NABIL as well. From the
above analysis, we can conclude that NABIL is investing higher amount in miscellaneous
current assets than NIC. It may be good for liquidation position of the bank but may harm
for the profitability position of the bank because it is keeping higher idle amount in
comparison to NIC.
55
4.3. Composition of Current Liabilities
Current liabilities are those liabilities that the firm should pay within short time period.
Current liabilities include loan and advances, sundry creditors, provision for taxation,
miscellaneous current liabilities, etc. A firm should maintain an optimum level of
liquidity in order to enable the organization to meet the current obligation of the firm. A
firm has to raise funds from short term obligation. Short term sources of funds are raised
through different components of current liabilities according to requirement. But the
proportion of different components of current liabilities depends upon the financial policy
of the firm. Thus, the composition of current liabilities must be analyzed for proper
management of working capital.

56
Table 4.3
Total Amount of Current Liabilities Components of NABIL Bank
(in millions)
Year
NABIL
Borrowings %Deposit(Excl.FD)
%Bills
Payable %Misc.C.L. % T.C.L.
2004 961.46 7.40 11195.12 86.14 108.94 0.84 730.37 5.62 12,995.89
2005 229.66 1.77 11808.46 91.16 173.5 1.34 741.61 5.73 12,953.23
2006 17.06 0.13 12508.07 95.56 119.75 0.91 444.7 3.40 13,089.582007 173.2 1.02 15898.31 93.49 92.54 0.54 841.7 4.95 17,005.892008 882.57 4.47 17907.01 90.62 83.51 0.42 887.97 4.49 19,761.06Avg. 2.96 91.39 0.81 4.84
(Source: Appendix II)
Figure 4.3
Total Amount of Current Liabilities Components of NABIL Bank
In the above table, we can see total amount of current liabilities components of NABIL
Bank is decreased in second year and after third year; it has started to increase till last
year of the study period.

57
Table 4.4
Total Amount of Current Liabilities Components of NIC Bank
(in millions)
FiscalYear
NIC
Borrowings %Deposit
(Excl. fixeddeposit)
%Bills
Payable %Misc.C.L. % T.C.L.
2004 274.75 11.73 2001.28 85.44 24.35 1.04 42.00 1.79 2342.382005 69.32 2.14 3063.42 94.67 32.92 1.02 70.25 2.17 3235.912006 450.37 11.57 3310.76 85.04 28.33 0.73 103.80 2.67 3893.262007 457.71 8.55 4701.45 87.83 91.51 1.71 101.97 1.91 5352.642008 352.13 5.43 5993.67 92.41 31.69 0.49 108.79 1.68 6486.28Avg 7.88 89.08 1.00 2.04
(Source: Appendix II)
In the above table, we can see total amount of current liabilities components of NIC
Bank. Total amount of current liabilities components of NIC Bank has increased from
beginning till last year of the study period.
Figure 4.4
Total Amount of Current Liabilities Components of NIC Bank
58
4.3.1. Borrowing Percentage
The borrowing percentage of NABIL Bank is fluctuating over the study period. In the
year 2005 and 2006, it decreased and then after it increased till the last year of the study
period. It is highest in the first year, i.e. 7.40% and lowest in the year 2006, i.e. 0.13%.
The average borrowing percentage of NABIL is 2.96%.
The yearly borrowing percentage of NIC Bank is more fluctuating. It has rapidly
decreased in second year and increased in the same way in third year. Then it decreased
till the last year of the study period. It is highest in the year 2004, i.e. 11.73% and lowest
in the year 2005, i.e. 2.14%. The average borrowing percentage of NIC is 7.88%.
The borrowing percentage of both banks is always fluctuating all over the study period.
The average borrowing percentage of NIC is higher than that of NABIL.
4.3.2. Deposit (Excluding Fixed Deposit) Percentage
The deposit (excluding fixed deposit) percentage of NABIL Bank is fluctuating. It has
increased in the year 2005 and 2006 and then it has decreased till the last year of the
study period. It is highest in the year 2006, i.e. 95.56% and lowest in the year 2004, i.e.
86.14%. The average deposit (excluding fixed deposit) percentage of NABIL is 91.39%.
In NIC Bank, the deposit (excluding fixed deposit) percentage is increased in second
year, decreased in third year and increased then after till the last year of the study period.
It is highest in the year 2005, i.e. 94.67% and lowest in the year 2006, i.e. 85.04%. The
average deposit (excluding fixed deposit) percentage of NIC Bank is 89.08%.
The deposit (excluding fixed deposit) percentage of both banks is fluctuating all over the
study period. The average deposit (excluding fixed deposit) percentage of NABIL is
higher than that of NIC.
4.3.3. Bills Payable Percentage

59
The bills payable percentage of NABIL Bank is increased in the second year and then,
decreased till the last year of the study period. The highest bills payable percentage is
1.34% in the year 2005 and it is lowest in the year 2008, i.e. 0.42%. The average bills
payable percentage of NABIL is 0.81%.
In NIC Bank, the bills payable percentage is in decreasing and increasing trend. It
decreased till the third year and started increasing in the fourth year but again decreased
in the fifth year. It is highest in the year 2007, i.e. 1.71% and lowest in the year 2008, i.e.
0.49%. The average bills payable percentage of NIC is higher than that of NABIL.
4.3.4. Miscellaneous Current Liabilities Percentage
The above table shows that the miscellaneous current liabilities percentage of the NABIL
Bank is fluctuating all over the study period. It is increased in second year, decreased in
third year, increased in fourth year and again decreased in the last year of the study
period. It is highest in the year 2005, i.e. 5.73% and lowest in the year 2006, i.e. 3.40%.
The average miscellaneous current liabilities percentage of NABIL Bank is 4.84%.
In NIC, the miscellaneous current liabilities percentage is increasing till third year of the
study period. Then it started to decrease till the last year of the study period. It is highest
in the year 2006, i.e. 2.67% and lowest in the year 2008, i.e. 1.68%. The average
miscellaneous current liabilities percentage is 2.04%
In both the banks, the yearly percentage of miscellaneous current liabilities is fluctuating.
The average miscellaneous current liabilities percentage of NABIL is higher than that of
NIC.
Ratio and its Trend Analysis
Ratio analysis is the powerful financial tool to measure the financial performance of
banks and finance companies comparatively. As mentioned in research methodology,
liquidity, activity, profitability and leverage ratios are calculated. To find the overall
performance as well as general movement of important ratios, trend analysis is also used.

60
a. Liquidity Ratio
Liquid asset is one that can be easily converted into cash without significant loss of its
original value. Converting assets, especially current assets such as inventory and
receivables, to cash is the primary means by which a firm obtains the funds needed to pay
its current bills. Therefore a firm's liquid position deals with the question of how well the
firm is able to meet its current obligations. Short term assets or current assets are more
easily converted to cash than long term assets. So, in general, one firm would be
considered more liquid than another firm if it has a greater proportion of its total assets in
the form of current assets. Liquidity ratio measures the short term solvency position of
the firm. Liquidity ratio is a ratio that shows the relationship of a firm's cash and other
current assets to its current liabilities. Under this there are two types of ratios.
Liquidity of any business organizations is directly related with working capital or current
assets and current liabilities of that organization. In other words, one of the main
objectives of working capital management is keeping sound liquidity position. Banks and
finance companies are different organizations which are engaged in mobilizations of
funds. So, without sound liquidity position, these institutions are not able to operate their
functions. To measure the solvency position or ability to meet its short term obligations,
various liquidity ratios are calculated and to know the trend of liquidity, trend analysis of
major liquidity ratios has been considered.
As per Nepal Rastra Bank's rule, minimum 1 % of total deposit and borrowing should be
deposited into Nepal Rastra Bank in current account. Out of total deposit and borrowing,
2% should be deposited into other commercial banks in current or call account. Similarly,
5% of its deposit should be invested in government securities and if pledged to borrower
fund, should be deducted while calculating the percentage of investment in government
securities.
I. Current Ratio
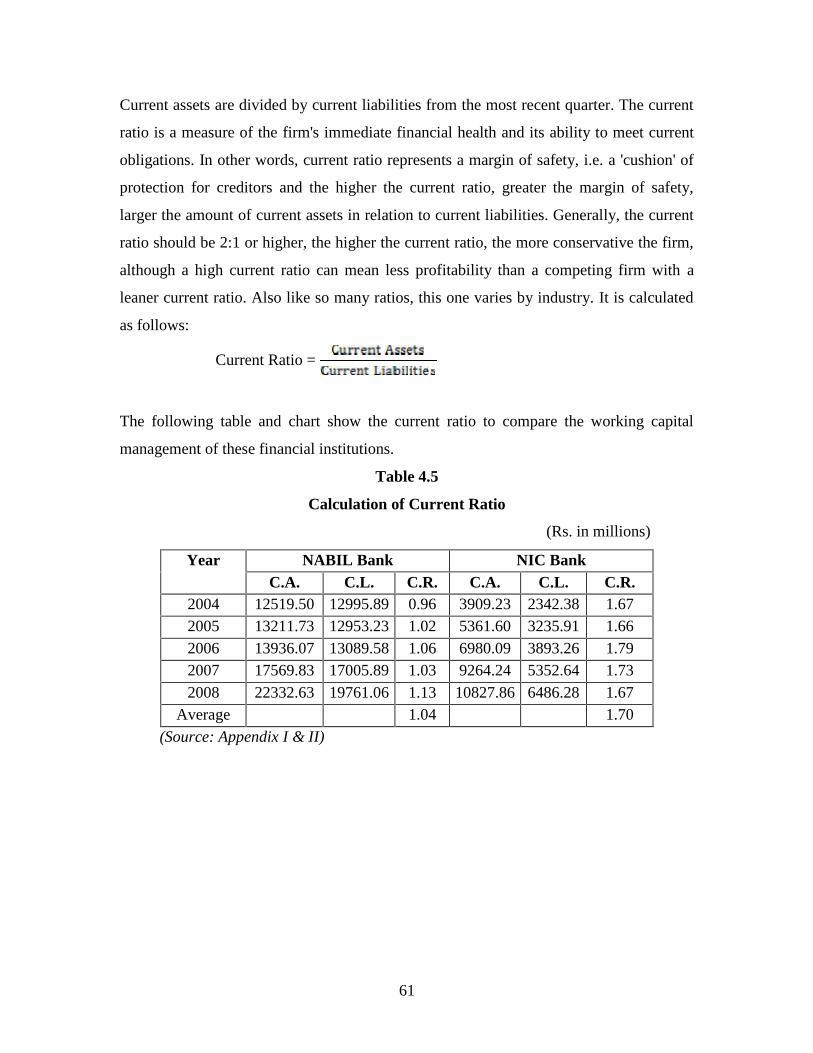
61
Current assets are divided by current liabilities from the most recent quarter. The current
ratio is a measure of the firm's immediate financial health and its ability to meet current
obligations. In other words, current ratio represents a margin of safety, i.e. a 'cushion' of
protection for creditors and the higher the current ratio, greater the margin of safety,
larger the amount of current assets in relation to current liabilities. Generally, the current
ratio should be 2:1 or higher, the higher the current ratio, the more conservative the firm,
although a high current ratio can mean less profitability than a competing firm with a
leaner current ratio. Also like so many ratios, this one varies by industry. It is calculated
as follows:
Current Ratio =
The following table and chart show the current ratio to compare the working capital
management of these financial institutions.
Table 4.5
Calculation of Current Ratio
(Rs. in millions)
Year NABIL Bank NIC BankC.A. C.L. C.R. C.A. C.L. C.R.
2004 12519.50 12995.89 0.96 3909.23 2342.38 1.672005 13211.73 12953.23 1.02 5361.60 3235.91 1.662006 13936.07 13089.58 1.06 6980.09 3893.26 1.792007 17569.83 17005.89 1.03 9264.24 5352.64 1.732008 22332.63 19761.06 1.13 10827.86 6486.28 1.67
Average 1.04 1.70(Source: Appendix I & II)

62
Figure 4.5
Current Ratio
The above depicts that the current assets of NABIL Bank is in increasing trend from 2004
to the last year of the study period. And the current liabilities of NABIL are decreasing in
second year and then increasing till last year of the study period. The current ratios of
NABIL are increasing till third year. It decreased in forth year and then after it begins to
increse in the year 2008, the current ratio highest in the year 2008 i.e. 1.13lowest in the
year 2004, i.e. 0.96. The average current ratio of NABIL is 1.04.
In NIC Bank, the current assets are in increasing trend from the year 2004 to the last year
of the study period. And, the current liabilities of NIC are also in increasing trend from
starting to end of the study period. But the current ratio of NIC is in fluctuating trend. It
has decreased in second year, increased in the third year and then decreased till the last
year of the study period. The current ratio is highest in the year 2006, i.e. 1.79 and lowest
in the year 2005, i.e. 1.66. The average current ratio of NIC is 1.70.
The average current ratio of NIC is higher than that of NABIL. It helps to conclude that
the liquidity position of NIC is better than that of NABIL. NIC has more ability to meet
its current obligation that NABIL.

63
II. Quick Ratio
The assessment of a company's ability to meet short term obligations is also known as the
acid test. Quick ratio establishes a relationship between quick or liquid assets and current
liabilities. An asset is liquid if it can be converted into cash immediately or reasonably
without a loss of value of cash. Cash is the most liquid asset. Other assets, which are
considered to be relatively liquid, are booked debts and marketable securities. In general,
quick ratio should be 1 or higher. A high quick ratio is usually a sign of solid,
conservatively run company which is no danger of imminent demise even if for some
awful reasons, sales immediately ceased. A firm's quick ratio might be of special interest
to investors anticipating some kind of downturn in the firm's business or the economy at
large. The quick ratio can be found out by dividing the total quick assets by total current
liabilities.
Quick Ratio =
For this study, cash and bank balance, government securities are included in quick assets.
The following table and chart show the quick ratio of NABIL Bank and NIC Bank.
Table 4.6
Calculation of Quick Ratio
(Rs. in millions)
Year NABIL Bank NIC BankC.A. C.L. C.R. C.A. C.L. C.R.
2004 4733.53 12995.89 0.36 1423.15 2342.38 0.612005 4643.11 12953.23 0.36 1684.24 3235.91 0.522006 3052.32 13089.58 0.23 2199.85 3893.26 0.572007 4666.6 17005.89 0.27 2505.72 5352.64 0.472008 6771.71 19761.06 0.34 1703.82 6486.28 0.26
Average 0.31 0.48(Source: Appendix I & II)

64
Figure 4.6
Quick Ratio
The above table and figure depict that the quick ratios of NABIL are always fluctuating
over the study period. The quick ratio of NABIL is constant in second year, decreased in
third year and then increased till the last year of the study period. It is highest in the year
2004 and 2005, i.e. 0.36 and lowest in the year 2006, i.e. 0.23. The average quick ratio in
NABIL is 0.31.
The quick ratios of NIC are also fluctuating. The quick ratio of NIC is decreased in
second year, increased in third year and then declined till the last year of the study period.
It is highest in the year 2004, i.e. 0.61 and lowest in the year 2008, i.e. 0.26. The average
of quick ratio in NIC is 0.48.
The yearly quick ratios of NIC are always higher than that of NABIL except in the year
2008. The average quick ratio of NIC is higher than that of NABIL (i.e. 0.48>0.31).

65
III. Cash and Bank Balance to current, margin and Other Deposit Ratio (without
fixed deposit)
This ratio shows the ability of banks' immediate funds to cover their (current, margin, call
and saving) deposits. It is employed to measure whether the bank and cash balance is
sufficient to cover its current calls margin including deposit. It can be calculated dividing
cash and bank balance by deposits (excluding fixed deposit). It can be expressed as:
Cash & Bank Balance to current, margin and Other Deposit Ratio (without fixed deposit)
Table 4.7
Cash and Bank Balance to Current, Margin and Other Deposit Ratio
(Without Fixed Deposit)
(Rs. in millions)
NABIL Bank NIC BankYear Cash &
BankBalance
Deposit(Excluding
fixed deposit)Ratio
Cash &Bank
Balance
Deposit(Excluding
fixed depositRatio
2004 1144.76 11195.12 0.10 347.96 2001.28 0.172005 970.48 11808.46 0.08 448.96 3063.42 0.152006 639.38 12508.07 0.05 1005.5 3310.76 0.302007 2365.14 15898.31 0.15 749.14 4701.45 0.162008 1963.36 17907.01 0.11 599.76 5993.67 0.10
Average 0.10 0.480.18(Source: Appendix I)

66
Figure 4.7
Cash and Bank Balance to Deposit (Excluding Fixed Deposit) Ratio
The above figure depicts that the cash and bank balance to deposit (excluding fixed
deposit) ratios of NABIL are decreasing till the first three years, increasing in fourth year
and again decreasing in the last year of the study period. The ratio is higher in the year
2007, i.e. 0.15 and lower in the year 2006, i.e. 0.05. The average cash and bank balance
to deposit (excluding fixed deposit) ratio of NABIL is 0.10.
The table shows that the cash and bank balance to deposit (excluding fixed deposit) ratios
of NIC is fluctuating over the study period. The highest cash and bank balance to deposit
(excluding fixed deposit) ratio is 0.30 in the year 2006 and lowest is 0.10 in the year
2008. The average cash and bank balance to deposit (excluding fixed deposit) ratio of
NIC is 0.18. It is higher than the yearly ratios of the year 2004, 2005, 2007 &2008, i.e.
0.17, 0.15, 0.16 & 0.10, but is lower than the yearly ratio of the year 2006, i.e. 0.30.
The average cash and bank balance to deposit (excluding fixed deposit) ratio of NABIL,
i.e. 0.10 is lesser than cash and bank balance to deposit (excluding fixed deposit) ratio of
NIC, i.e. 0.18. The above analysis helps to conclude that NIC holds more cash balance
than NABIL. The higher cash and bank balance to deposit ((excluding fixed deposit) ratio

67
of NIC shows that ability of banks' immediate funds to cover its current, margin, call and
saving deposit better than the same of NABIL. In another word, the liquidity position of
NIC is better than NABIL, but the large amount of idle cash and bank balance badly
affect the profitability of the bank. From the point of view of utilizing NABIL has better
position than NIC.
b. Activity Ratio (Turnover ratio)
Activity ratio is needed to measure the effectiveness of employment of the resources in a
business concern. Activity ratio measures the effectiveness of the firm. Through these
ratios, it is known whether the funds employed have been utilized effectively in the
business activities or not. The following are the ratios, employed to analyze the activities
of the concerned joint ventures.
I. Loan and Advances to Total Deposit Ratio
This ratio assesses to what extend, the banks and finance companies are able to utilize the
depositor's funds to earn profit by providing loans and advance. It is computed dividing
the total amounts of loans and advances by total deposited funds. The formula used to
compute this ratio is as follows:
Loan and Advances to Total Deposit Ratio =
High ratio is the symptom of higher and proper utilization of funds and low ratio is the
signal of balance remained utilized or idle.
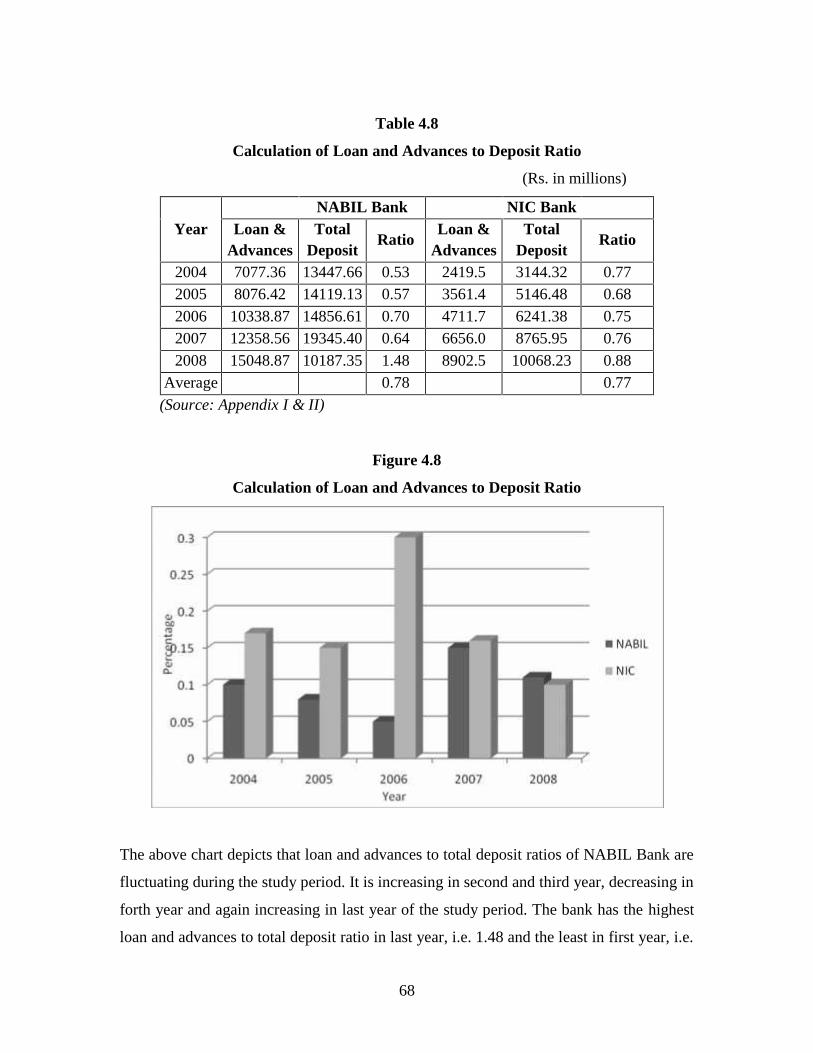
68
Table 4.8
Calculation of Loan and Advances to Deposit Ratio
(Rs. in millions)
NABIL Bank NIC BankYear Loan &
AdvancesTotal
DepositRatio
Loan &Advances
TotalDeposit
Ratio
2004 7077.36 13447.66 0.53 2419.5 3144.32 0.772005 8076.42 14119.13 0.57 3561.4 5146.48 0.682006 10338.87 14856.61 0.70 4711.7 6241.38 0.752007 12358.56 19345.40 0.64 6656.0 8765.95 0.762008 15048.87 10187.35 1.48 8902.5 10068.23 0.88
Average 0.78 0.77(Source: Appendix I & II)
Figure 4.8
Calculation of Loan and Advances to Deposit Ratio
The above chart depicts that loan and advances to total deposit ratios of NABIL Bank are
fluctuating during the study period. It is increasing in second and third year, decreasing in
forth year and again increasing in last year of the study period. The bank has the highest
loan and advances to total deposit ratio in last year, i.e. 1.48 and the least in first year, i.e.
69
0.53. But, the yearly amount of loan and advances to total deposit ratios are not much
difference during the period of study. The average loan and advances to total deposit ratio
of NABIL is 0.78 which is lower than its yearly ratios except last year of the study
period, i.e. 1.48.
For NIC, loan and advances to total deposit ratios are more stable than NABIL. The
range of ratio is 0.69 to 0.88. The average loan and advances to total deposit ratio is 0.77.
The loan and advances to total deposit ratios are decreasing in second year and increased
from third year to last of the study period. The yearly ratio is higher, i.e. 0.88 in the year
2008 and lower, i.e. 0.69 in the year 2005.
The average loan and advances to total deposit ratio of NABIL is higher than the same of
NIC by 0.01. The above analysis helps to conclude that loan and advances to total deposit
ratio or total deposit turnover ratio of NABIL. Thus, NABIL is employing the funds more
efficiently for the profit generating purpose on loan and advances than NIC.
II. Loan and Advances to Fixed Deposit Ratio
This ratio examines that how many times the funds is used in loans and advances against
fixed deposits. For commercial banks, fixed deposit are long term interests bearing
obligations, whereas investment in loans and advances are the main sources of earning.
This ratio is compared dividing loans and advances by fixed deposit as under:
Loan and Advances to Fixed Deposit Ratio =
A low ratio indicates idle cash balance. It means total funds not properly utilized. This
ratio examines to what extend the fixed deposits are utilized for income earning purpose.
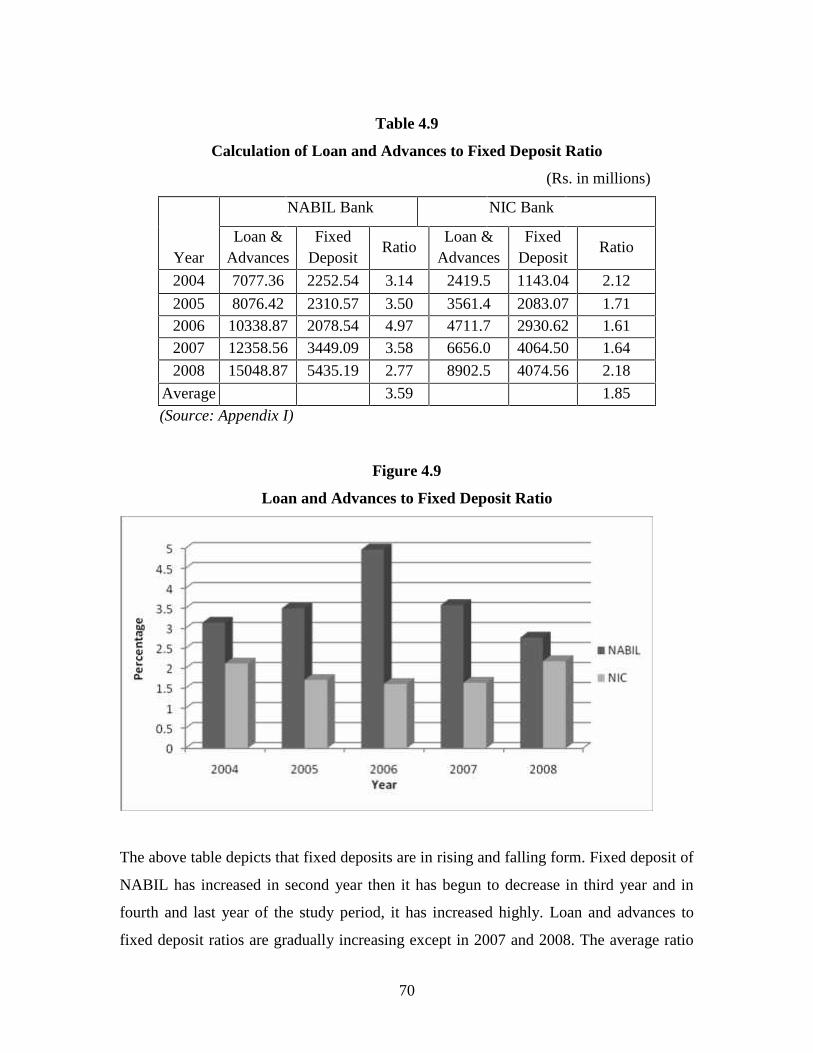
70
Table 4.9
Calculation of Loan and Advances to Fixed Deposit Ratio
(Rs. in millions)
Year
NABIL Bank NIC Bank
Loan &Advances
FixedDeposit
RatioLoan &
AdvancesFixed
DepositRatio
2004 7077.36 2252.54 3.14 2419.5 1143.04 2.12
2005 8076.42 2310.57 3.50 3561.4 2083.07 1.712006 10338.87 2078.54 4.97 4711.7 2930.62 1.612007 12358.56 3449.09 3.58 6656.0 4064.50 1.64
2008 15048.87 5435.19 2.77 8902.5 4074.56 2.18
Average 3.59 1.85(Source: Appendix I)
Figure 4.9
Loan and Advances to Fixed Deposit Ratio
The above table depicts that fixed deposits are in rising and falling form. Fixed deposit of
NABIL has increased in second year then it has begun to decrease in third year and in
fourth and last year of the study period, it has increased highly. Loan and advances to
fixed deposit ratios are gradually increasing except in 2007 and 2008. The average ratio
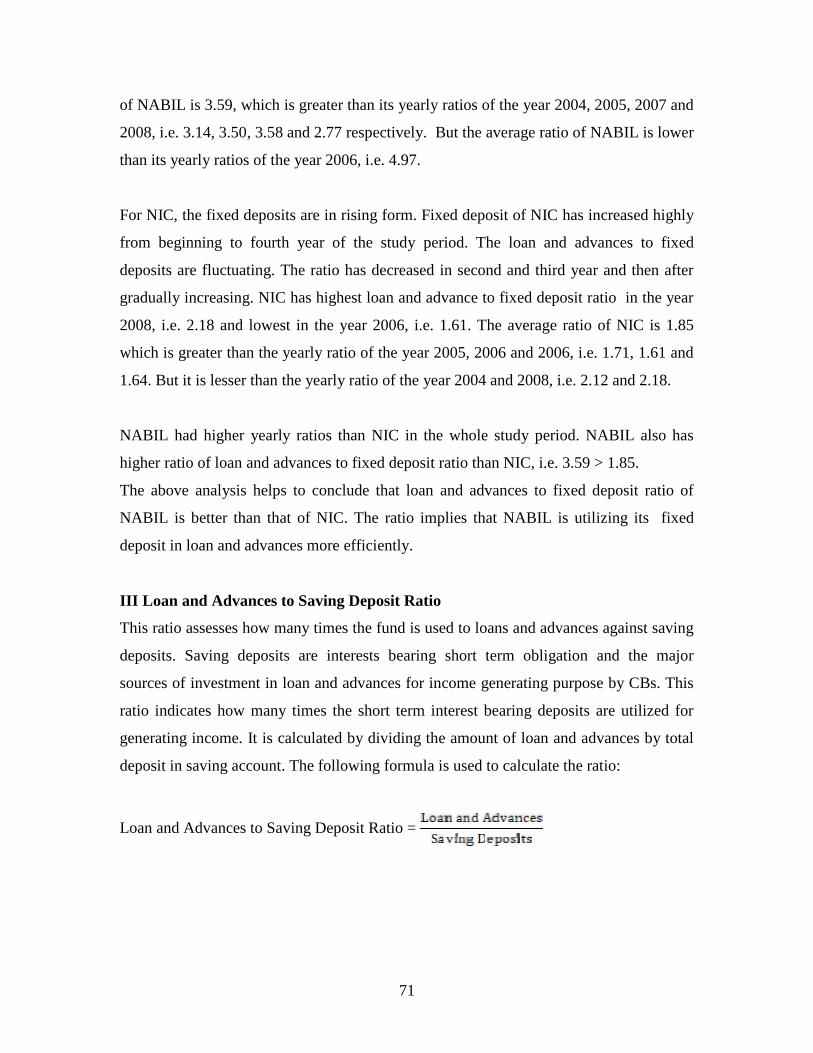
71
of NABIL is 3.59, which is greater than its yearly ratios of the year 2004, 2005, 2007 and
2008, i.e. 3.14, 3.50, 3.58 and 2.77 respectively. But the average ratio of NABIL is lower
than its yearly ratios of the year 2006, i.e. 4.97.
For NIC, the fixed deposits are in rising form. Fixed deposit of NIC has increased highly
from beginning to fourth year of the study period. The loan and advances to fixed
deposits are fluctuating. The ratio has decreased in second and third year and then after
gradually increasing. NIC has highest loan and advance to fixed deposit ratio in the year
2008, i.e. 2.18 and lowest in the year 2006, i.e. 1.61. The average ratio of NIC is 1.85
which is greater than the yearly ratio of the year 2005, 2006 and 2006, i.e. 1.71, 1.61 and
1.64. But it is lesser than the yearly ratio of the year 2004 and 2008, i.e. 2.12 and 2.18.
NABIL had higher yearly ratios than NIC in the whole study period. NABIL also has
higher ratio of loan and advances to fixed deposit ratio than NIC, i.e. 3.59 > 1.85.
The above analysis helps to conclude that loan and advances to fixed deposit ratio of
NABIL is better than that of NIC. The ratio implies that NABIL is utilizing its fixed
deposit in loan and advances more efficiently.
III Loan and Advances to Saving Deposit Ratio
This ratio assesses how many times the fund is used to loans and advances against saving
deposits. Saving deposits are interests bearing short term obligation and the major
sources of investment in loan and advances for income generating purpose by CBs. This
ratio indicates how many times the short term interest bearing deposits are utilized for
generating income. It is calculated by dividing the amount of loan and advances by total
deposit in saving account. The following formula is used to calculate the ratio:
Loan and Advances to Saving Deposit Ratio =

72
Table 4.10
Calculation of Loan and Advances to Saving Deposit Ratio
(Rs. in millions)
Year
NABIL Bank NIC BankLoan &
AdvancesSavingDeposit
RatioLoan &
AdvancesSavingDeposit
Ratio
2004 7077.36 5229.72 1.35 2419.5 734.09 3.30
2005 8076.42 5994.12 1.35 3561.4 1280.48 2.782006 10338.87 7026.33 1.47 4711.7 2024.26 2.332007 12358.56 8770.76 1.41 6656.0 2797.42 2.38
2008 15048.87 10187.35 1.48 8902.5 3335.67 2.67
Average 1.41 2.69(Source: Appendix I & II)
Figure 4.10
Loans and Advances to Saving Deposit Ratio
The above table depicts that the loan and advances to saving deposit ratios of NABIL
bank are fluctuating. The ratio is constant in the second year, increased in the third year,
decreased in fourth year and at last increased in the last year of the study period. The ratio
is highest in the last year, i.e. 1.48 and lowest in the first and second year, i.e. 1.35. The
73
average ratio of NABIL, i.e. 1.41 is higher than the yearly ratio of first two years,
constant in the year 2007 and lower than the yearly ratio of the year 2006 and 2008.
Loan and advances to saving deposit ratio of NIC is decreased in second and third year,
then after it is gradually increased till the last year of the study period. For the NIC, the
ratio is highest in the year 2004, i.e. 3.30 and lowest in the year 2006, i.e. 2.33. The
average ratio is 2.69, which is lower than its yearly ratios in the year 2004 & 2005 and
higher than its yearly ratios in the year 2006, 2007 & 2008
The yearly ratios NIC are always exceeding than NABIL in the study period. So, the
average loan and advances to saving deposit of NIC is higher than that of NABIL. From
the above analysis, it can be concluded that the loan and advances to saving deposits of
NIC are better than the same of NABIL. It implies that NIC is utilizing short term fund of
outsider more effectively than NABIL.
c. Leverage Ratio or Capital Structure
Financial leverage ratios provide an indication of the long term solvency of the firm.
Unlike liquidity ratios which are concerned with short term assets and liabilities, financial
leverage ratios measure the extent to which the firm is using long term debt. Debt and
equity are long term obligations and remaining parts in the liability side of the balance
sheet are termed as short term obligations. Both types of obligations are required in
forming the capital structure of the firm. The long term financial position of the firm is
determined by the leverage or capital structure. The different leverage ratios are
maintained to measure the financial risk or proportion of outsiders' fund and owner's
capital used by the firm. Following ratios fall under leverage ratios.
I. Long Term Debt to Net Worth Ratio
It is used to test the long term solvency of a firm. The ratio indicates the relationship
between debt and equity. It is related to shareholder's fund indicating the degree of
protection against long term creditors. Here, long term debt refers to the amount of fixed
deposit. It is calculated by dividing the fixed obligations of the banks by owner's claim.

74
Long Term Debt to Net Worth Ratio =
The following table and chart shows the long term debt to net worth ratio of the two
sample banks.
Table 4.11
Calculation of Long Term Debt to Net Worth Ratio
(Rs. in millions)
Year
NABIL Bank NIC BankLong term
debtNet
worthRatio
Long termdebt
Net worth Ratio
2004 2252.54 1671.92 1.35 1143.04 552.08 2.07
2005 2310.57 1840.35 1.26 2083.07 620.4 3.36
2006 2078.54 2018.2 1.03 2930.62 684.19 4.28
2007 3449.09 2233.36 1.54 4064.5 1212.62 3.352008 5435.19 1111.08 4.89 4074.56 1305.24 3.12
Average 10.82 3.24(Source: Appendix IV)
Figure 4.11
Long Term Debt To Net Worth Ratio
Long Term Debt
Net Worth

75
The above table depicts that the long term debt of NABIL are fluctuating and the net
worth are gradually increasing till the fourth year of the study period. So, the yearly ratios
of NABIL are also fluctuating. It has declined till third year and then increased in fourth
and in last year of the study period. It increased very highly, i.e. from 1.54 to 48.93. The
highest long term debt to net worth ratio is 48.93 and lowest is 1.03 in the year 2008 and
2006 respectively. The average ratio of NABIL is 10.82.
For NIC, long term debt and net worth are in increasing trend all over the study period.
But, the yearly long term debt to net worth is fluctuating over the period. It increased till
the third year and then it shows down till the last year of the study period. The highest
ratio is 4.28 in the year 2006 and lowest ratio is in the year 2004. The average ratio of
NIC is 3.24.
The above table shows that the average ratio of NABIL is very much higher than that of
NIC. From this analysis, it can be conducted that the long term debt to net worth ratio of
NABIL are greater than NIC, which implies that the proportion of outsiders' claim in total
capitalization is higher in NABIL. The large amount of fixed deposit and very low net
worth in the last year of the study period makes the ratios very much higher in case of
NABIL. So, NABIL has more risky and aggressive capital structure than NIC.
II. Long Term Debt to Total Capital
It is a test of long term solvency of a firm. The ratio indicates the relationship between
long term debt and total capital. It shows the degree of relationship and protection of total
capital against long term or total debt. It is calculated as follows:
Debt to Total Capital Ratio =
Table 4.12
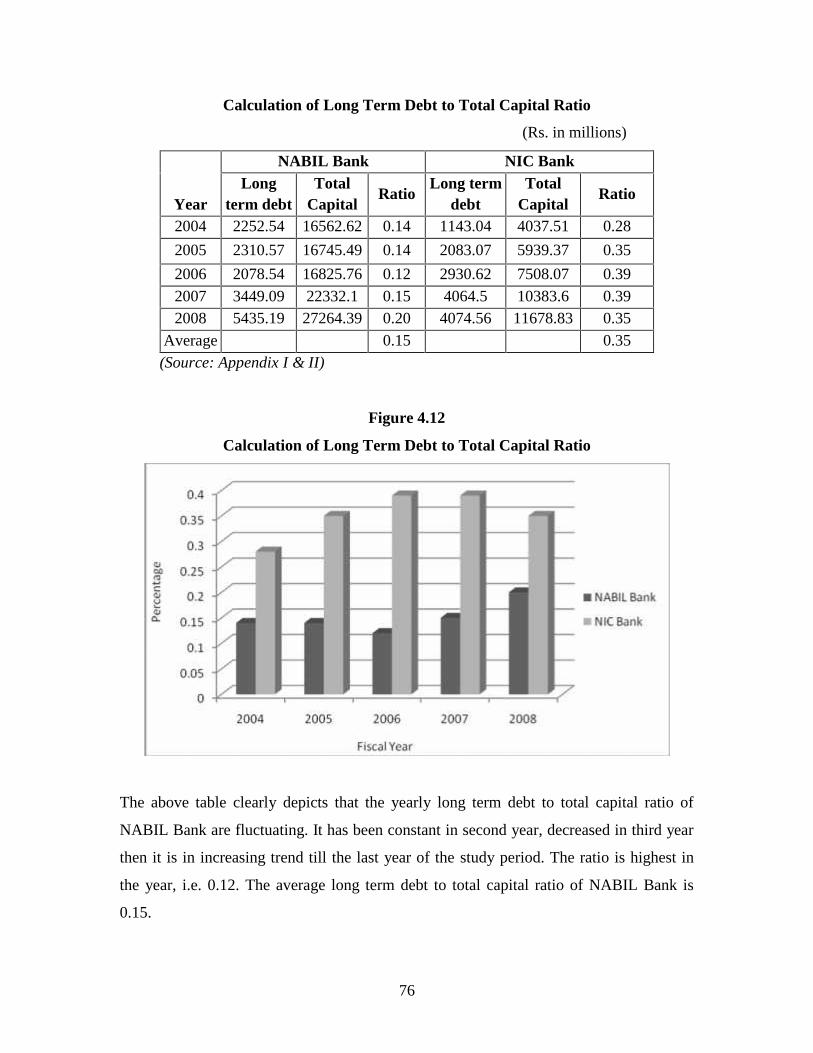
76
Calculation of Long Term Debt to Total Capital Ratio
(Rs. in millions)
Year
NABIL Bank NIC BankLong
term debtTotal
CapitalRatio
Long termdebt
TotalCapital
Ratio
2004 2252.54 16562.62 0.14 1143.04 4037.51 0.28
2005 2310.57 16745.49 0.14 2083.07 5939.37 0.35
2006 2078.54 16825.76 0.12 2930.62 7508.07 0.392007 3449.09 22332.1 0.15 4064.5 10383.6 0.392008 5435.19 27264.39 0.20 4074.56 11678.83 0.35
Average 0.15 0.35(Source: Appendix I & II)
Figure 4.12
Calculation of Long Term Debt to Total Capital Ratio
The above table clearly depicts that the yearly long term debt to total capital ratio of
NABIL Bank are fluctuating. It has been constant in second year, decreased in third year
then it is in increasing trend till the last year of the study period. The ratio is highest in
the year, i.e. 0.12. The average long term debt to total capital ratio of NABIL Bank is
0.15.

77
For NIC, the yearly long term debt to total capital ratio are in fluctuating trend. It has
increased till third year, constant in fourth year and decreased in last year of the study
period. The ratio is in range of 0.28 to 0.39. The average long term debt to total ratio of
NIC Bank is 0.35.
The yearly ratios as well as the average ratio of NIC bank are higher than that of NABIL.
From the above analysis, it can be concluded that total capital covers low portion of long
term debt in both banks. In other language, we can say that both banks use high short
term liabilities to cover total capital. Due to large amount of long term debt in NABIL,
long term debt to total capital is higher in NIC than NABIL.
d. Profitability Ratio
Profitability ratio offers several different measures of the success of the firm at
generating profits. It indicates succession achieving the desired profit. Various
profitability ratios are calculated to measure the operating efficiency of business
enterprises. Through profitability ratios the lender and investors want to decide whether
to invest in a particular business or not. Some of the important profitability ratios used are
as follow:
I. Interest Earned to Total Assets Ratio
Interest earned to total assets ratio formed to find out the percentage of the interest earned
investing total assets. This ratio can be calculated by dividing the amount of interest
earned by the total assets of the firms. It can be expressed as follows:
Interest Earned to Total Assets Ratio =

78
Table 4.13
Calculation of Interest Earned to Total Assets Ratio
(Rs. in millions)
Year
NABIL Bank NIC BankInterestearned
TotalAssets
RatioInterestearned
TotalAssets
Ratio
2004 1017.87 16250.15 0.06 291.14 4037.51 0.072005 1001.62 16186.42 0.06 363.04 5939.37 0.062006 1068.75 16397.9 0.07 457.61 7508.07 0.06
2007 1310.0 22688.33 0.06 579.98 10629.76 0.05
2008 1587.76 27621.64 0.06 725.82 11866.08 0.06
Average 0.06 0.06(Source: Appendix III)
Figure 4.13
Ratio of Interest Earned to Total Assets
The above figure vividly depicts that interest earned by NABIL is decreasing in the year
2005, and then it has begun to increase till the last year of the study period. The interest
earned to total assets ratio of NABIL is in constant form except in the third year of the
study period. The average interest earned to total assets ratio of NABIL is 0.06 which is

79
lower than the yearly ratio of 2006, i.e. 0.07 and constant to the other years of the study
period.
For NIC, the interest earned is increasing till the last year of the study period. The interest
earned to total assets ratio of NIC is fluctuating. The ratio has decreased in the year 2005,
i.e. 0.06, constant in the year 2006, decreased in the year 2007 and then increased in the
last year of the study period. NIC has highest ratio in the year 2004, i.e. 0.07 and lowest
in the year 2006, i.e. 0.05. The average ratio of NIC is 0.06.
The average ratio of NABIL is equal to that of NIC, i.e. 0.06. From the above analysis,
we can conclude that the interest earned to total ratio of NABIL and NIC is equal. So, it
implies that both banks are efficiently utilizing their total assets to earn interest income.
II. Net Profit to Total Assets Ratio
This ratio is very much crucial for measuring the profitability of funds invested in the
bank's assets. It measures the return on assets. It can be calculated by dividing the net
profit tax by total assets. It can be expressed as:
Net Profit to Total Assets Ratio =
Table 4.14
Calculation of Net Profit after Tax to Total Assets Ratio
(Rs. in millions)
Fiscal NABIL Bank NIC BankYear NPAT Total
AssetsRatio
NPAT TotalAssets
Ratio
2004 416.24 16250.15 0.03 25.94 11866.08 0.01
2005 455.31 16186.42 0.03 68.26 10629.76 0.012006 518.64 16397.9 0.03 113.76 7508.07 0.022007 635.26 22688.33 0.03 96.59 10629.76 0.012008 673.96 27621.64 0.02 158.48 11866.08 0.01
Average 0.03 0.01(Source: Appendix I & II)
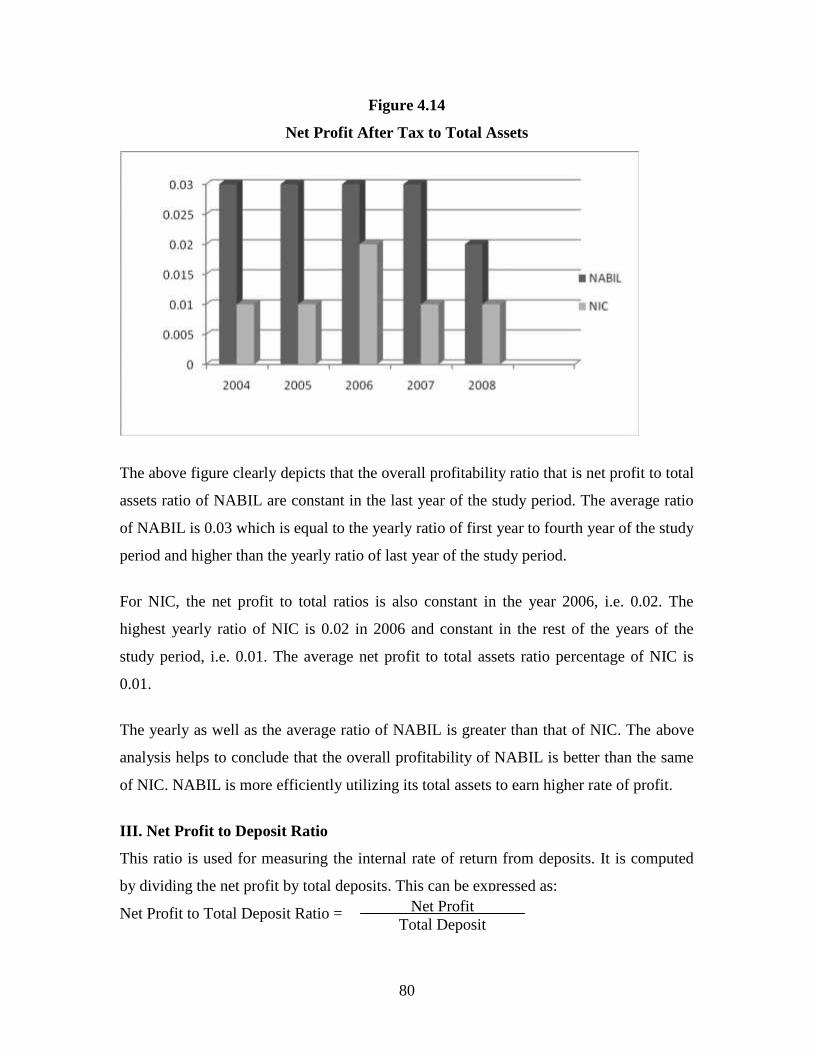
80
Figure 4.14
Net Profit After Tax to Total Assets
The above figure clearly depicts that the overall profitability ratio that is net profit to total
assets ratio of NABIL are constant in the last year of the study period. The average ratio
of NABIL is 0.03 which is equal to the yearly ratio of first year to fourth year of the study
period and higher than the yearly ratio of last year of the study period.
For NIC, the net profit to total ratios is also constant in the year 2006, i.e. 0.02. The
highest yearly ratio of NIC is 0.02 in 2006 and constant in the rest of the years of the
study period, i.e. 0.01. The average net profit to total assets ratio percentage of NIC is
0.01.
The yearly as well as the average ratio of NABIL is greater than that of NIC. The above
analysis helps to conclude that the overall profitability of NABIL is better than the same
of NIC. NABIL is more efficiently utilizing its total assets to earn higher rate of profit.
III. Net Profit to Deposit Ratio
This ratio is used for measuring the internal rate of return from deposits. It is computed
by dividing the net profit by total deposits. This can be expressed as:
Net Profit to Total Deposit Ratio = Net ProfitTotal Deposit

81
Higher ratio indicates the return from investment on loans and advances are desirable and
lower ratio indicates the funds are not properly mobilizing.
Table 4.15
Calculation of Net Profit After Tax to Total Assets Ratio
(Rs. in millions)
Year
NABIL Bank NIC Bank
NPAT TotalDeposits
RatioNPAT Total
DepositsRatio
2004 416.24 13447.66 0.03 25.94 3144.32 0.01s2005 455.31 14119.13 0.03 68.26 5146.48 0.012006 518.64 14856.61 0.03 113.76 6241.38 0.02
2007 635.26 19347.4 0.03 96.59 8765.95 0.01
2008 673.96 10187.35 0.07 158.48 10068.23 0.02Average 0.04 0.01(Source: Appendix III)
Figure 4.15
Ratio of Net Profit After Tax to Total Deposit

82
The above figure shows that net profits of NABIL bank have increased from first to last
year of the study period. The net profit to total deposits ratio are constant till fourth year,
i.e. 0.03 and increased in the last year of the study period. The highest net profit ratio is
0.07 in the last year. The average ratio of NABIL is 0.04 which is lower than the yearly
ratio of the yearly ratio of the year 2008, i.e. 0.07 and higher than the yearly ratio of rest
of the year of the study period.
For NIC, the net profit to total deposit ratio is in rising and falling term. In second year, it
has been constant, i.e. 0.01, and then in the third year, it increased. It decreased in fourth
year of the study and at last in the fifth year, it again has risen. The range is 0.01 to 0.02.
The average net profit to total deposit ratio is 0.01.
The yearly as well as the average ratio of NIC is less than that of NABIL. The above
analysis helps to find out that the net profit to deposit ratio of NABIL are better than NIC.
Mobilization of outsider fund is important to earn profit for commercial banks. Thus, we
can say NABIL has better performance on mobilization of total deposits.
4.4 Correlation
Correlation is statistical tool that refers to the closeness of the relationship between two
or more variables. We can use correlation to describe the degree to which one variable is
linearly related to other variables. The coefficient of correlation deals with determining
the degree of relationship between two or more sets of figures. Among the various
methods of finding out coefficient practice for calculating correlation coefficient, the
most widely used in practice for calculating correlation coefficient is Karl Pearson's
correlation coefficient. So, Karl Person's correlation coefficient method is applied in the
study. Correlation coefficient always lies between +1 to -1. When r = +1, there is perfect
positive correlation between two variables and when r = -1, there is perfect negative
correlation. And, when r = 0, there is no correlation.

83
4.4.1 Coefficient of Correlation between Cash and Bank Balance and Current
Liabilities
Cash and bank balance is most liquid component of current assets. This is required to
meet the unexpected short term obligation, i.e. current liabilities. The coefficient of
correlation between cash and bank balance and current liabilities is to measure the degree
of relationship between cash and bank balance and current liabilities. To find out the
correlation, various calculations are done. The following table shows the coefficient of
correlating between cash and bank balance and current liabilities, i.e. r, PEr and 6PEr.
Table 4.16
Calculation of Coefficient of Correlation between Cash & Bank
Balance and
Current Liabilities
From the above table 4.16, we can find that coefficient of correlation between cash and
bank balance and current liabilities (r) in NABIL is 0.8341. It shows positive relationship
between these two variables. By considering the probable error, since the value of 'r' is
0.8341, which is greater than its 6 PEr, i.e. 0.5502, we can say that the value of 'r' is
significant in NABIL.
On the other hand, when we observe coefficient of correlation between cash and bank
balance and current liabilities (r) in case of NIC, it has found that the value is 0.3789,
which shows the positive relationship between these two variables. On the base of value
of 6 PEr, i.e. 1.551 which is higher than the value of 'r', we can further conclude that the
relationship between coefficient of correlation between cash and bank balance and
current liabilities is not significant.
Bank r PEr 6 PEr
NABIL 0.83412352 0.0917 0.5502
NIC 0.37886235 0.2585 1.551

84
From the above analysis, it can be concluded that there is no significant relationship
between cash and bank balance and current liabilities in NIC, but it is highly significant
in NABIL.
4.4.2 Coefficient of Correlation between Loan and Advances and Net Profit
The basic function of commercial banks is to collect deposit and invest these funds on
loan and advance to generate higher profit. Large amount of loan and advances generate
higher profit. The coefficient of correlation between loan and advances and net profit is
to measure the degree of relationship between loan and advances and net profit. In
correlation analysis, loan and advance is independent variable (Y) and net profit is
dependent variable ( X ). The purpose of computing the correlation of the coefficient is to
justify whether the loan and advance are significant to generate profit or not and whether
there is any relationship between these two variables. The following table.
Table 4.17
Calculation of Coefficient of Correlation between Loan and
Advances & Net Profit
From the above table 4.17, we can find that coefficient of correlation between loan and
advances and net profit ( r) of NABIL is 0.983 and same of NIC is 0.910, which shows
highly positive relationship between these variables in both banks. By considering the
probable error, since the value of 'r' , i.e. 0.983 is greater than its 6 PEr, i.e. 0.06 in
NABIL and the value of 'r' is significant in both banks.
From the above analysis, it can be concluded that there is highly significant relationship
between loan and advances and net profit in NABIL and NIC.
Bank r PEr 6 PEr
NABIL 0.982556774 0.010 0.06
NIC 0.91039333 0.051 0.306
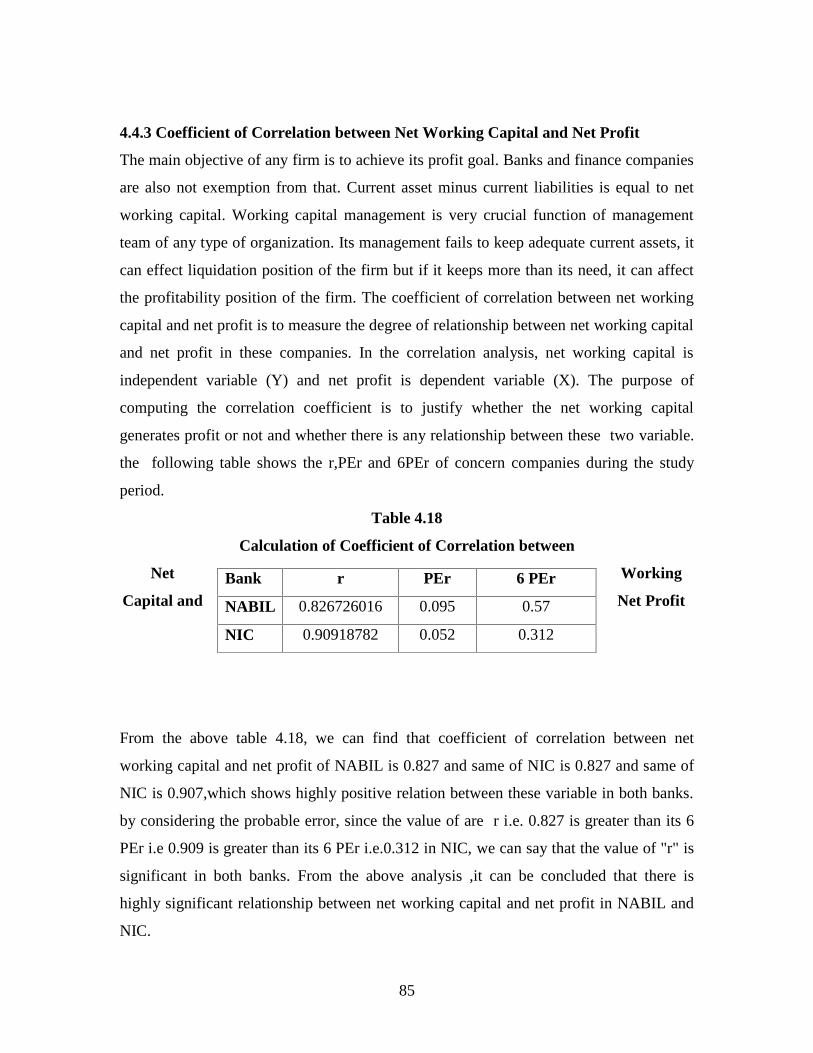
85
4.4.3 Coefficient of Correlation between Net Working Capital and Net Profit
The main objective of any firm is to achieve its profit goal. Banks and finance companies
are also not exemption from that. Current asset minus current liabilities is equal to net
working capital. Working capital management is very crucial function of management
team of any type of organization. Its management fails to keep adequate current assets, it
can effect liquidation position of the firm but if it keeps more than its need, it can affect
the profitability position of the firm. The coefficient of correlation between net working
capital and net profit is to measure the degree of relationship between net working capital
and net profit in these companies. In the correlation analysis, net working capital is
independent variable (Y) and net profit is dependent variable (X). The purpose of
computing the correlation coefficient is to justify whether the net working capital
generates profit or not and whether there is any relationship between these two variable.
the following table shows the r,PEr and 6PEr of concern companies during the study
period.
Table 4.18
Calculation of Coefficient of Correlation between
Net Working
Capital and Net Profit
From the above table 4.18, we can find that coefficient of correlation between net
working capital and net profit of NABIL is 0.827 and same of NIC is 0.827 and same of
NIC is 0.907,which shows highly positive relation between these variable in both banks.
by considering the probable error, since the value of are r i.e. 0.827 is greater than its 6
PEr i.e 0.909 is greater than its 6 PEr i.e.0.312 in NIC, we can say that the value of "r" is
significant in both banks. From the above analysis ,it can be concluded that there is
highly significant relationship between net working capital and net profit in NABIL and
NIC.
Bank r PEr 6 PEr
NABIL 0.826726016 0.095 0.57
NIC 0.90918782 0.052 0.312

86
4.5 Test of Hypothesis
A hypothesis is a conjectural statement of the relation between two or more variables.
Hypothesis always is a declarative sentence form and they relate either generally or
specifically variable or variables. There are two criteria for "good" hypothesis and
hypothesis statement. One hypothetical statement is about the relations between
variables, second hypothesis carries a clear implication for testing and stated relation.
These criteria mean that hypothesis statements contain two or more variables that are
measurable and they specify how the variables are related.
As stated in chapter one, some conceptual framework for null and alternative hypothesis
between NABIL and NIC, in various variables are formulated and tested as follows:
Hypothesis 1
H : There is no significant difference in composition of working capital between NABIL
bank and NIC bank.
H1: There is significant difference in composition of working capital between NABIL
bank and NIC bank.
Hypothesis 2
H0: There is no significant difference in liquidity position between NABIL bank and NIC
bank.
H1: There is significant difference in liquidity position between NABIL bank and NIC
bank.
Hypothesis 3
H0: There is no significant difference in profitability position between NABIL bank and
NIC bank.
H1: There is significant difference in profitability position between NABIL bank and
NIC bank.

87
To test the validity of our assumption, if sample size is less than 30,"t" test is used. For
applying t-test in the contest of small sample, the t-test value is calculated first and
compared with the table value of "t" at a value of a certain level of significance(say on
5%) for given degree of freedom. If calculated value "t" exceeds the table value we infer
that the null hypothesis is rejected. i.e., the difference is significant at 5% level of
significance. But if "t" is less than the concerning table value of "t" the null hypothesis is
accepted. i.e., the difference is not treated as significant.
4.5.1. Composition of Working Capital
Following null hypothesis and alternative hypothesis are formulated and tested to fing
whether there is significant difference in composition of working capital between NABIL
and NIC.
Null Hypothesis
Ho: There is no significant difference in composition of working capital between NABIL
bank and NIC bank.
Alternative hypothesis
H1: There is significant difference in composition of working capital between NABIL
bank and NIC bank.
The following table exhibits the mean value of various percentages measuring the
composition or structure of working capital of NABIL bank and NIC bank and student t
value.
Table 4.19
Composition of working capital
S.N. Composition Nabilmean
NICmean
Cal 't'Value
Tabulated 't'value
Result
1 Cash & bank balance 8.67 9.06 0.1932 2.31 Ho is accepted.2 Loan & advances 65.91 69.98 0.8668 2.31 Ho is accepted.3 Government
Securities21.68 19.36 0.5567 2.31 Ho is accepted.

88
4 Misc. current assets 3.74 1.60 3.5176 2.31 Ho is accepted.From the above table, it is clear that the cash and bank balance, Loan and advances &
Government Securities percentage of NABIL and NIC are not significantly difference but
Misc. current assets percentage of the banks are significantly different.
4.5.2. Liquidity Position
To judge whether there is significant difference in liquidity position between NABIL and
NIC bank, these null hypothesis and alternative hypothesis are formulated and tested.
H0: There is no significant difference in liquidity position between NABIL bank and NIC
bank.
H1: There is significant difference in liquidity position between NABIL bank and NIC
bank.
The following table exhibits the mean value of various ratios measuring the liquidity of
NABIL and NIC bank and their 't' value.
Table 4.20
Liquidity Position
S.N. Composition NABILmean
NICmean
Cal 't'Value
Tabulated't' value
Result
1 Current ratio 1.04 1.70 17.8355 2.31 Ho is rejected2 Quick ratio 0.31 0.48 2.6113 2.31 Ho is rejected3 Cash & bank
balance to depositratio (Excludingfixed deposit)
0.10 0.18 2.0996 2.31 Ho is accepted
From the above table, it is clear that the cash and bank balance to deposit ratio (excluding
fixed deposit) of NABIL and NIC is not significantly different. On other hand, current
ratio and quick ratio of banks are significant different.
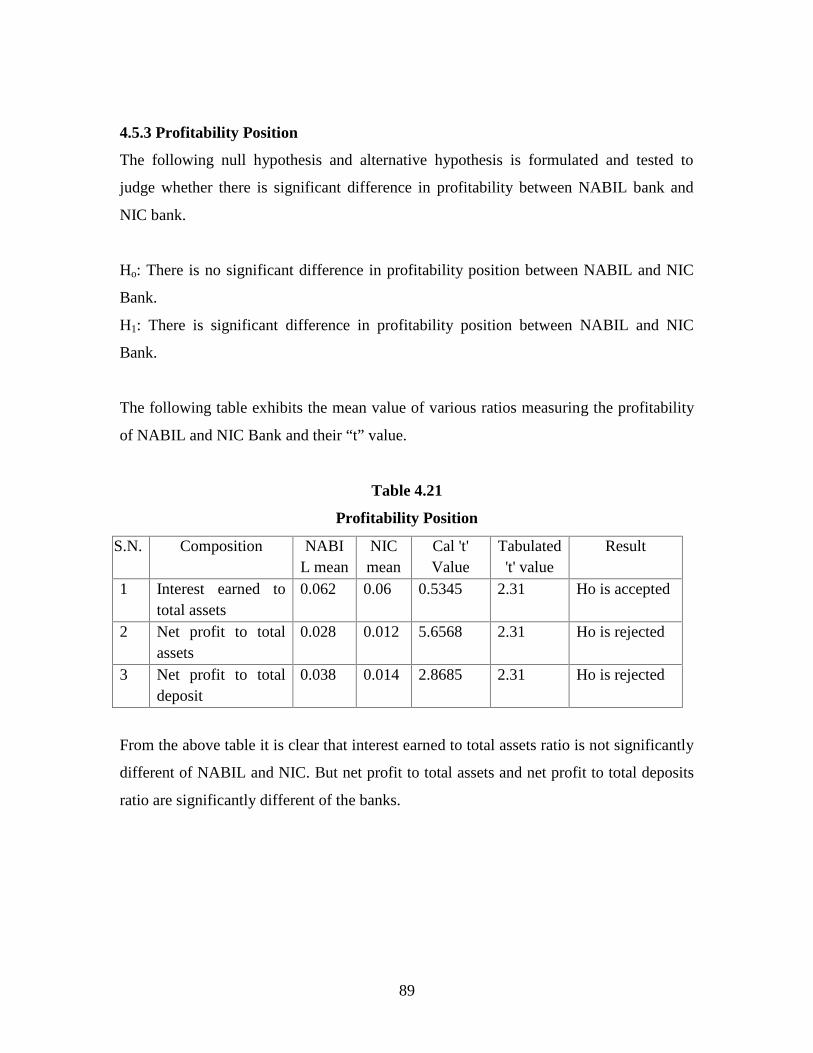
89
4.5.3 Profitability Position
The following null hypothesis and alternative hypothesis is formulated and tested to
judge whether there is significant difference in profitability between NABIL bank and
NIC bank.
Ho: There is no significant difference in profitability position between NABIL and NIC
Bank.
H1: There is significant difference in profitability position between NABIL and NIC
Bank.
The following table exhibits the mean value of various ratios measuring the profitability
of NABIL and NIC Bank and their “t” value.
Table 4.21
Profitability Position
S.N. Composition NABIL mean
NICmean
Cal 't'Value
Tabulated't' value
Result
1 Interest earned tototal assets
0.062 0.06 0.5345 2.31 Ho is accepted
2 Net profit to totalassets
0.028 0.012 5.6568 2.31 Ho is rejected
3 Net profit to totaldeposit
0.038 0.014 2.8685 2.31 Ho is rejected
From the above table it is clear that interest earned to total assets ratio is not significantly
different of NABIL and NIC. But net profit to total assets and net profit to total deposits
ratio are significantly different of the banks.

90
4.6 Major Findings
The major findings of the study during the period of five years from the analysis are
summarized below.
1. The major components of current assets are cash and bank balance, loans and
advances and government securities in concerned bank, i.e., NABIL and NIC
Banks. On the study period, the proportion of cash and bank balance, loans and
advances and government securities to total current assets on an average are 8.67 %,
65.91% and 21.68 % respectively in NABIL and 9.06% , 69.98 % and 19.36 %
respectively in NIC . So, it is found at the average cash and bank balance
percentage and loans and advances percentage are higher in NIC then NABIL. But
the average government securities percentage is higher in NABIL then NIC.
2. The liquidity positions of these banks are analyzed with the current ratio, quick
ratio and cash and bank balance to deposit ratio. The current ratio of NABIL is
lowest in first year i.e, 0.96 and highest in last year of the study period i.e., 1.13.
NIC is ranging between 1.66 to 1.79. NABIL and NIC are able to maintain its
current ratio of 1.04 and 1.70 in an average respectively on the study period. The
average quick ratio of NABIL and NIC are 0.31 and 0.48 respectively. Cash and
bank balance to deposit (Excluding fixed deposit) ratio of NIC is higher than the
same of NABIL. So it is found that the liquidity position of NIC is better then
NABIL. The trend of liquidity ratio i.e., quick ratio and cash and bank balance ratio
of both banks are decreasing. It shows that both the banks tried to reduce it’s idle
money, however, it is shown that liquidity position of NIC is always better than that
of NABIL throughout the study period. It means NIC is bearing lower risk, which
means lower profit in commercial banks; higher liquidity is not always the cause of
lower profitability.
3. Activity ratio is intended to measure the effectiveness to employment of the
resources in a business concern. Loans and advances to total deposit ratio, Loans
and advances to fixed deposit ratios and loans and advances to saving deposit ratio
are calculated. The average value of loans and advances to total deposit ratio ratio,

91
and loans and advances to fixed deposit ratios are 0.78, 3.59 and 1.41 in NABIL
Bank and 0.77, 1.85 and 2.69 in NIC Bank. The trends of this ratio of both the
banks are fluctuating. From the analysis of turnover of these banks, it is found that
the NABIL has better turnover than NIC. Thus NABIL has better utilization of
deposits in income generating activity then NIC. However, NIC is utilizing its
saving deposit in loans and advances more effectively then NABIL.
4. Profitability measures the efficiency of the firm. The profitability position of
NABIL and NIC are analyzed from various angles. The average value of interest on
to total asset ratio of NABIL i.e, 0.06 is equal to that of NIC. The trend values of
interest on both banks are quite fluctuating. The net profits of total assets ratio on
both banks are quite fluctuating. Net profit to total assets ratio are always higher on
NABIL then NIC. So it is found that profitability position of NABIL is far better
then NIC although the interest earned by NABIL and NIC is equal.
5. The average long term debt to net worth ratio of NABIL is higher than that of NIC
i.e., 10.82 of NABIL is greater than 3.24 of NIC. So it is found that NABIL has
higher proportion of outsiders claim in total capitalization then NIC or we can say
NABIL has more risky and aggressive capital structure then NIC from the analysis
of long term debt to total capital ratio, we can find out that the average long term
debt to total capital ratio of NABIL is 0.15 and same of NIC is 0.35 this implies that
both banks are using high short term liabilities to cover total capital but due to large
amount of long-term debt, long term debt to total capital is higher of NIC then that
of NABIL.
6. Correlation between cash and bank balance and current liabilities in NABIL Bank is
positive which shows the positive relationship between these two variables. On the
other hand, coefficient of correlation between cash and bank balance to current
liabilities in case of NIC also shows positive relationship. Considering probable
error, we found correlation between cash and bank balance and current liabilities is
not significant and that in NABIL is highly significant. Correlation between loans
and advances and net profit in NABIL and NIC ie, 0.982 and 0.910 respectively
shows the higher positive relationship between these two variables. Considering the
probable error we found correlation between loans and advances and net profit in

92
both banks are highly significant. Coefficient of correlation between net working
capital and net profit in NABIL and NIC are 0.8267 and 0.909 respectively. That
shows positive relationship between these two variables. After considering the
probable error we find that there is highly significant relationship between net
working capital and net profit in both banks.
7. While testing the hypothesis of compositions of the working capital, it has been
observed that the mean value of proportion of misc. current assets to total current
assets of NABIL is significantly different than NIC and it is also clear that the
proportion of cash and bank balance, loans and advances and government securities
on total current assets of NABIL and NIC are not significantly different. Significant
difference on misc. current assets to total current assets of NABIL and NIC shows
that the management is willing to invest it’s fund more on misc. assets for interest
earning purpose.
8. While testing the hypothesis of liquidity position of both banks, it has been
observed that the mean value of current ratio and quick ratio of NABIL are
statistically different than NIC. But the cash and bank balance to deposit ratio
(excluding fixed deposit are not significantly different.
9. While testing the hypothesis of profitability positions, it is found that the mean
value of interest earned to total assets ratio is not significantly different, but net
profit to total assets and net profit to total deposit are significantly different of
NABIL and NIC.

93
CHAPTER – V
SUMMARY, CONCLUSION AND RECOMMENDATIONS
The final and most important task of the researcher is to enlist finding issues and gaps of
the study and give suggestions for the further improvement. This chapter contains
summary , conclusions and recommendation s. Summary gives the brief introduction of
all chapters , conclusion are based on the consequence of the study of the analysis of
relevant data and recommendation are presented in terms of suggestions that are prepared
on the basis of the findings.
5.1 Summary
Financial institutions are currently viewed as catalyst in the process of economic growth
of a country. A key factor in the development of an economy is the mobilization of the
domestic resources. The financial institution helps the process of resources mobilization.
However, Nepal is been late in recognizing this true fact. Nepal, being the developing
country cannot ignore the important of finance for its economic development. After
restoration of democracy in 2046 B.S. and announcement of government’s liberalization
policy, private sector investors are attracted to invest in different organized commercial
ventures. As a result, numbers of public and private limited companies were established
in a short span of time to reap the benefit of economic liberalization policy of the nation.
After implementation of the open market policy, various joint venture commercial banks
and finance companies are opened. The main objective of the study was to study the
comparative analysis of working capital management as well as its impacts in financial
performance of commercial banks in Nepal. Due to many limitation or restriction. I have
taken two commercial banks they are NABIL and NIC for this study. To fulfill this
objective and other specific objective as described in chapter one, an appropriate research
methodology has developed that include the ratio analysis as a financial tools and trend
analysis, correlation coefficient and test of hypothesis as a statistical tools. The major
ratio analysis consists of the composition of working capital position, liquidity position,
94
profitability position, activity position and capital structure position. Under these, main
ratios and their and their trend position are studies in the chapter four. In order to test the
relationship between the various components of working capital, Karl Pearson’s
correlation coefficient “r” is calculated and analyzed. Some hypothesis formulated in the
chapter three tested in appendix and results are analyzed in chapter four.
The basic objective of this study is to analyze the working capital management of the
commercial banks and to give some remedial thereto. The financial statement of the last
five year i.e., from 2004to 2008 have been examined for the analysis of the subject
working capital of the NABIL and NIC banks. Financial statements are sorted, tabulated
and interpreted by using appropriate ratios. Since the study is based on the historical data,
the research design is historical and explanatory type.
The study has been organized into five chapters consisting of introduction, review of
literature, research methodology, presentation of data and summary, research findings,
conclusion and recommendation. The necessary data are derived from the balance sheet
and profit and loss statement of concerned bank i.e., NABIL and NIC banks for the
period of 2004 to 2008. Now in this chapter, an attempt has been made to present
summary of major findings, conclusions and recommendations. Recommendations are
presented in terms of suggestions that are prepared on the basis of the finding.
5.2 Conclusion
The liquidity positions of these banks are analyzed with the current ratio, quick ratio and
cash and bank balance to deposit ratio. The current ratio of NABIL is lowest in first year
i.e, 0.96 and highest in last year of the study period i.e., 1.13. NIC is ranging between
1.66 to 1.79. NABIL and NIC are able to maintain its current ratio of 1.04 and 1.70 in an
average respectively on the study period. The average quick ratio of NABIL and NIC are
0.31 and 0.48 respectively. Cash and bank balance to deposit (Excluding fixed deposit)
ratio of NIC is higher than the same of NABIL. So it is found that the liquidity position
of NIC is better then NABIL. The trend of liquidity ratio i.e., quick ratio and cash and
bank balance ratio of both banks are decreasing. It shows that both the banks tried to
95
reduce it’s idle money, however, it is shown that liquidity position of NIC is always
better than that of NABIL throughout the study period. It means NIC is bearing lower
risk, which means lower profit in commercial banks; higher liquidity is not always the
cause of lower profitability. Activity ratio is intended to measure the effectiveness to
employment of the resources in a business concern. Loans and advances to total deposit
ratio, Loans and advances to fixed deposit ratios and loans and advances to saving
deposit ratio are calculated. The average value of loans and advances to total deposit
ratio, and loans and advances to fixed deposit ratios are 0.78, 3.59 and 1.41 in NABIL
Bank and 0.77, 1.85 and 2.69 in NIC Bank. The trends of this ratio of both the banks are
fluctuating. From the analysis of turnover of these banks, it is found that the NABIL has
better turnover than NIC. Thus NABIL has better utilization of deposits in income
generating activity then NIC. However, NIC is utilizing its saving deposit in loans and
advances more effectively then NABIL.
Profitability measures the efficiency of the firm. The profitability position of NABIL and
NIC are analyzed from various angles. The average value of interest on to total asset ratio
of NABIL i.e, 0.06 is equal to that of NIC. The trend values of interest on both banks are
quite fluctuating. The net profits of total assets ratio on both banks are quite fluctuating.
Net profit to total assets ratio are always higher on NABIL then NIC. So it is found that
profitability position of NABIL is far better then NIC although the interest earned by
NABIL and NIC is equal. The average long term debt to net worth ratio of NABIL is
higher than that of NIC i.e., 10.82 of NABIL is greater than 3.24 of NIC. So it is found
that NABIL has higher proportion of outsiders claim in total capitalization then NIC or
we can say NABIL has more risky and aggressive capital structure then NIC from the
analysis of long term debt to total capital ratio, we can find out that the average long term
debt to total capital ratio of NABIL is 0.15 and same of NIC is 0.35 this implies that both
banks are using high short term liabilities to cover total capital but due to large amount of
long-term debt, long term debt to total capital is higher of NIC then that of NABIL.
Correlation between cash and bank balance and current liabilities in NABIL Bank is
positive which shows the positive relationship between these two variables. On the other
hand, coefficient of correlation between cash and bank balance to current liabilities in

96
case of NIC also shows positive relationship. Considering probable error, we found
correlation between cash and bank balance and current liabilities is not significant and
that in NABIL is highly significant. Correlation between loans and advances and net
profit in NABIL and NIC i.e., 0.982 and 0.910 respectively shows the higher positive
relationship between these two variables. Considering the probable error we found
correlation between loans and advances and net profit in both banks are highly
significant. Coefficient of correlation between net working capital and net profit in
NABIL and NIC are 0.8267 and 0.909 respectively. That shows positive relationship
between these two variables. After considering the probable error we find that there is
highly significant relationship between net working capital and net profit in both banks.
While testing the hypothesis of profitability positions, it is found that the mean value of
interest earned to total assets ratio is not significantly different, but net profit to total
assets and net profit to total deposit are significantly different of NABIL and NIC. The
major components of current assets are cash and bank balance, loans and advances and
government securities in concerned bank, i.e., NABIL and NIC Banks. On the study
period, the proportion of cash and bank balance, loans and advances and government
securities to total current assets on an average are 8.67 %, 65.91% and 21.68 %
respectively in NABIL and 9.06% , 69.98 % and 19.36 % respectively in NIC . So, it is
found at the average cash and bank balance percentage and loans and advances
percentage are higher in NIC then NABIL. But the average government securities
percentage is higher in NABIL then NIC.
While testing the hypothesis of compositions of the working capital, it has been observed
that the mean value of proportion of misc. current assets to total current assets of NABIL
is significantly different than NIC and it is also clear that the proportion of cash and bank
balance, loans and advances and government securities on total current assets of NABIL
and NIC are not significantly different. Significant difference on misc. current assets to
total current assets of NABIL and NIC shows that the management is willing to invest
it’s fund more on misc. assets for interest earning purpose. While testing the hypothesis
of liquidity position of both banks, it has been observed that the mean value of current

97
ratio and quick ratio of NABIL are statistically different than NIC. But the cash and bank
balance to deposit ratio (excluding fixed deposit are not significantly different.
5.3 Recommendations
After the detailed analysis of working capital in commercial banks in Nepal following
recommendations are made:
1. A large portion of total current assets of both NABIL and NIC Banks have cover
by loans and advances and it is decreasing in NABIL and increasing in NIC. As,
banks should give priority to invest their fund on loans and advances to get higher
return, NABIL has not as much of loans and advances proportion on total current
assets than NIC. So, NABIL should seriously adjust it’s policy of investment on
loans and advances
2. Total deposits turns over position of studied banks are less than one which is not
satisfactory. Fixed deposits and saving deposits turn over position are satisfactory
on both NABIL and NIC Banks. Though, saving deposits turn over of both NABIL
and NIC is satisfactory, NABIL is not utilizing short term fund of outsider more
effectively than NIC.
3. Although interest earned to total assets ratio is equal on both banks, Net profit ratio
is higher in NABIL than NIC. It may be due to higher cost on NIC. So, NIC should
give an attention of reducing cost of operation so that it can have least operation
cost, which further maximize it’s profitability and maximize share holder’s return.
4. The average current ratio of NIC is higher than that of NABIL .It helps to conclude
that the liquidity position of NABIL is worse than that of NIC .So , the NABIL
should give attention to increase the current assets to build ability to meet its current
obligation .
5. Due to the large amount of term debt and low net worth, the proportion of
outsiders’ claim in total capitalization is higher in NABIL .NABIL has more risky
and aggressive capital structure than NIC .Though both banks use high short term
liabilities to cover total capital, NABIL should decrease the long term debt to
increase the degree of protection against long term creditors and to protect total
capital against long term debt

98
BIBLIOGRAPHY
Books:
Bajracharya, B.C. (2061). Business Statistic. Kathmandu: M. K. Publishers and
Distribution.
Brigham, L., Gapanski, C. & Michael, C. E. (2002). Financial Management: Theory and
Practice. New Delhi: Harcourt Asia Pvt. Ltd.
Brown, I.L. & Howard, L.R. (1991). Managerial Accounting and Finance. London: The
ECBS of Macdonald and Eraus Ltd.
Gitman, L.J. (1998). Principles of Managerial Finance. New York: Harper Collins
Publishers.
Gopal, K.P. (1976). Inventory and Working Capital Management Handbook. New Delhi:
MacMillan India Ltd.
Hampton, J. J. (1998). Financial Decision Making: Concepts, Problem and Cases. New
Delhi: Prentice Hall of India Pvt. Ltd.
Jain, S. (1996). Financial Management. Jaipur: Pointer Publication.
Pandey, I.M (1992). Financial Management. New Delhi: Bikash Publishing House.
Pradhan, S. (1992). Basis of Financial Management. Kathmandu: Educational
Enterprises Pvt. Ltd.
Shrestha, K.N. & Manandhar, K.D. (2056). Statistics and Quantitative Techniques for
Management. Kathmandu: Valley Publisher.
Shrestha, S. & Silwal, D.P (2059). Statistical Methods for Management. Kathmandu:
Teleju Prakashan.
Shrivastava, R.M. (1984). Financial Decision Making: Text Problem and Cases. New
Delhi: Sterling Publishing Pvt. Ltd.
Shyam, J. and Dangol, R.M. (2056). Business Finance. Kathmandu: Teleju Prakashan.
Smith, K.V. (1974). Management of Working Capital. New York: West Publishing
Company.
Thapa, K. (2007). Fundamental of Financial Management. Kathmandu: Asmita Books
Publishers and Distributors.
Van Horne, J.C. (1996). Financial Management and Policy. New Delhi: Prentice Hall of
India Pvt. Ltd.
99
Weston, J.F., Breley, S., & Brigham, E.F (1996). Essential of Managerial Finance.
Tokyo: The Dryden Press.
Journal and Articles
Acharya, K. (1985). Problems and Implement in the Management of Working Capital in
Nepalese Enterprises: A Quarterly ISDOS Bulletin, I (3)
Government of Nepal, National Planning Commission. Tenth Plan (2002-2007).
Kathmandu: National Planning Commission.
Joseph, A.M. (1962). Working Capital Concepts. Financial Management and Research
(FMR).
Pradhan, R.S. & Koirala, K.D. (1983). Some Reflection on Working Capital Management
In Nepalese Corporation: A Journal On Management and Economic: FOM, III (I).
Shrestha, M.K. (1983). Working Capital Management in PEs. A Study on Financial
Results and Constraints. ISDOS Bulletins, VIII: 1-4.
Weinruaub, Vicher (1998). Industry Practice Relatively To Aggressive Conservative
Working Capital Policies. Journal of Finance and Strategic Decision V-H (2).
Thesis:
Aryal, B.P. (2002). A Study on Working Capital Management of Nepal Tele
Communication Corporation. An Unpublished Master’s Degree Thesis. Kathmandu:
Shanker Dev Campus, T.U.
Gautam, P. (2002). A Study on Working Capital Management of Soaltee Crown Plaza.
An Unpublished Master’s Degree Thesis. Kathmandu: Shanker Dev Campus, T.U.
Ghimire, R.B. (2003). Working Capital Management of Selected Manufacturing
Company Listed In Nepal Stock Exchange Limited. An Unpublished Master’s
Degree Thesis. Kathmandu: Shanker Dev Campus, T.U.
Kunwar, P. (2005).Working Capital Management of Pharmaceutical Industry of Nepal
with Reference to Royal Drugs Limited. An Unpublished Master’s Degree Thesis.
Kathmandu: Shanker Dev Campus, T.U.

100
Pathak, S. (2005). An Evaluation of Working Capital Management of Nepal Lube Oil
Limited. An Unpublished Master’s Degree Thesis. Kathmandu: Shanker Dev
Campus, T.U.
Sharma, D.R. (1999). A Study on Working Capital Management of Battery Co. Limited.
An Unpublished Master’s Degree Thesis. Kathmandu: Central Department of
Management, T.U.
Yadav, B. (2006). Working Capital Management of Listed in Nepal Stock Exchange. An
Unpublished Master’s Degree Thesis. Kathmandu: Shanker Dev Campus, T.U.

101
APPENDIX - I
From Asset Side of Balance Sheet
Source: http://www.nabilbank.com/annualrep.php
http://www.nicbank.com.np/quick-access/annual.php
Banking and Financial Statistics of NRB
Annual Report of NABIL & NIC
www.nepalstock.com
http://en.wikipedia.org/wiki/Nabil_Bank
Cash and Bank Balance(In million Rs.)
Banks 2004 2005 2006 2007 2008NABIL 1144.76 970.48 639.38 2365.14 1963.36NIC 347.96 448.96 1005.54 749.14 599.76
Loans and Advances(In million Rs.)
Banks 2004 2005 2006 2007 2008NABIL 7077.36 8076.42 10338.9 12358.6 15048.9NIC 2419.52 3561.41 4711.71 6655.96 8902.53
Government Securities(In million Rs.)
Banks 2004 2005 2006 2007 2008NABIL 3588.77 3672.63 2413.94 2301.46 4808.35NIC 1075.19 1235.28 1194.31 1756.58 1104.06
Money at call and short notice(In million Rs.)
Banks 2004 2005 2006 2007 2008NABIL - - 80 1734.90 563.53NIC 92.56 129.66 89.88 353.52 163.01

102
Investments(In million Rs.)
Banks 2004 2005 2006 2007 2008NABIL 6031.18 5835.95 4267.23 6180.66 8956.31NIC 1542.32 1760.72 1572.90 2479.91 1599.48
Risk Assets(In million Rs.)
Banks 2004 2005 2006 2007 2008NABIL 7808.12 8309.20 10465.27 13033.25 15659.96NIC 3557.02 4773.45 5501.94 6902.12 9107.58
Bill Purchased(In million Rs.)
Banks 2004 2005 2006 2007 2008NABIL 305.57 239.46 120.90 245.53 243.07NIC - 1.69 1.81 - 21.07
Fixed Assets(In million Rs.)
Banks 2004 2005 2006 2007 2008NABIL 251.92 338.13 361.24 319.09 286.90NIC 61.72 43.29 59.50 39.86 153.68
Current Assets(In million Rs.)
Banks 2004 2005 2006 2007 2008NABIL 12,519.50 13,211.73 13,936.07 17,569.83 22,332.60NIC - 5,361.60 6,980.09 9,264.24 10,827.80
Other Assets(In million Rs.)

103
Banks 2004 2005 2006 2007 2008NABIL 708.61 492.20 543.88 544.67 512.05NIC 66.56 115.95 68.53 102.56 221.51
Total Assets(In million Rs.)
Banks 2004 2005 2006 2007 2008NABIL 16,250.15 16,186.42 16,397.90 22,688.33 27,621.64NIC 4037.51 5,939.37 7,508.07 10,629.76 11,866.08
Quick Assets(In million Rs.)
Banks 2004 2005 2006 2007 2008NABIL 4,733.53 4,643.11 3,053.32 4,666.60 6,771.71NIC 1,423.15 1,684.24 2,199.85 2,505.72 1,703.82

104
APPENDIX - II
From Capital & Liabilities side of Balance Sheet
Source: http://www.nabilbank.com/annualrep.phphttp://www.nicbank.com.np/quick-access/annual.php
Banking and Financial Statistics of NRBAnnual Report of NABIL & NICwww.nepalstock.comhttp://en.wikipedia.org/wiki/Nabil_Bank
Total Capital(In million Rs.)
Banks 2004 2005 2006 2007 2008NABIL 16,562.62 16,745.49 16,825.76 22,332.10 27,264.39NIC 4,037.51 5,939.37 7,508.07 10,383.60 11,678.83
Borrowings(In million Rs.)
Banks 2004 2005 2006 2007 2008NABIL 961.46 229.66 17.06 173.20 882.57NIC 274.75 69.32 450.37 457.71 352.13
Total Deposit(In million Rs.)
Banks 2004 2005 2006 2007 2008NABIL 13,447.66 14,119.13 14,856.61 19,347.40 10,187.35NIC 3,144.32 5,146.48 6,241.38 8,765.95 10,068.23
Fixed Deposit(In million Rs.)
Banks 2004 2005 2006 2007 2008NABIL 2,252.54 2,310.57 2,078.54 3,449.09 5,435.19NIC 1,143.04 2,083.07 2,930.62 4,064.50 4,074.56

105
Saving Deposit(In million Rs.)
Banks 2004 2005 2006 2007 2008NABIL 5,229.72 5,994.12 7,026.33 8,770.76 10,187.40NIC 734.09 1,280.48 2,024.26 2,797.42 3,335.67
Bills Payable(In million Rs.)
Banks 2004 2005 2006 2007 2008NABIL 108.94 173.50 119.75 92.54 83.51NIC 24.35 32.92 28.33 91.51 31.69
Other Liabilities(In million Rs.)
Banks 2004 2005 2006 2007 2008NABIL 730.37 741.61 444.70 841.84 887.97NIC 42.00 70.25 103.80 101.97 108.79
Total Current Liabilities(In million Rs.)
Banks 2004 2005 2006 2007 2008NABIL 12,995.89 12,953.23 13,089.58 17,005.80 19,761.00NIC 2,342..38 3,235.91 3,893.26 5,352.64 6,486.20

106
APPENDIX - III
From Profit & Loss Account
Source: http://www.nabilbank.com/annualrep.phphttp://www.nicbank.com.np/quick-access/annual.php
Banking and Financial Statistics of NRBAnnual Report of NABIL & NICwww.nepalstock.comhttp://en.wikipedia.org/wiki/Nabil_Bank
Interest Earned(In million Rs.)
Banks 2004 2005 2006 2007 2008NABIL 1017.87 1001.62 1068.75 1310.00 1587.76NIC 291.14 363.04 457.61 579.98 725.82
Net Profit after Tax(In million Rs.)
Banks 2004 2005 2006 2007 2008NABIL 461.24 455.31 518.64 635.26 673.96NIC 25.94 68.26 113.76 96.59 158.48

107
APPENDIX - IV
Source: http://www.nabilbank.com/annualrep.phphttp://www.nicbank.com.np/quick-access/annual.php
Banking and Financial Statistics of NRBAnnual Report of NABIL & NICwww.nepalstock.comhttp://en.wikipedia.org/wiki/Nabil_Bank
Net Worth(In million Rs.)
Banks 2004 2005 2006 2007 2008NABIL 1,671.92 1,840.35 2,018.20 2,233.36 111.08NIC 552.08 620.40 684.19 1,212.62 1,305.24

108
APPENDIX - V
Calculation of Correlation Coefficient
Correlation between Cash and Bank Balance and Current Liabilities of NABIL BankFiscalYear
Cash &Bank Balance
(X)
CurrentLiabilities
(Y)
X² Y² XY
2004 1144.76 12995.89 1310475.46 168893156.9 14877175.042005 970.48 12953.23 941831.43 167786167.4 12570850.652006 639.38 13089.58 408806.78 171337104.6 8369215.662007 2365.14 17005.89 5593887.22 289200294.7 40221310.672008 1963.36 197610.6 3854782.49 390499492.3 38798074.76N=5 ∑X=7083.12
7083.12∑Y=
75805.65∑X²=
12109783.38∑Y²=
1187716216.0∑XY=
114836626.8
Correlation Coefficient (r) =
=
.·. r = 0.83
For the calculation of probable Error (PEr);
PEr = 0.6745
= 0.6745
.·. PEr = 0.0917

109
Correlation between Loans and Advances and Net Profit of NABIL Bank
(In million Rs.)FiscalYear
Net Profit(X)
Loans andAdvances (Y)
X² Y² XY
2004 416.24 7077.36 173255.74 50089024.57 2945880.332005 455.31 8076.42 207307.20 65228560.02 3677274.792006 518.64 10338.9 268987.45 106892853.2 5362167.102007 635.26 12358.6 403555.27 152734994.0 7850924.242008 673.96 15048.9 454222.08 226469391.2 10142356.64N=5 ∑X=2699.41 ∑Y=52900.18 ∑X²=1507327.7
3∑Y²=601414823 ∑XY=29978603.09
Correlation Coefficient (r) =
=
.·. r = 0.9825
For the calculation of probable Error (PEr);
PEr = 0.6745
= 0.6745
.·. PEr = 0.010

110
Correlation between Cash and Bank Balance and Current Liabilities of NIC BankFiscalYear
Cash & BankBalance (X)
CurrentLiabilities (Y)
X² Y² XY
2004 347.96 2342.38 121076.16 5486744.06 815054.542005 448.96 3235.91 201565.08 10471113.53 1452794.152006 1005.54 3893.26 1011110.69 15157473.43 3914828.662007 749.14 5352.64 561210.74 38650754.97 4009876.732008 599.76 6486.28 359712.06 42071828.24 3890211.29N=5 ∑X= 3151.36 ∑Y=21310.47 ∑X²=2254674.73 ∑Y²=101837914.2 ∑XY=14082765.38
Correlation Coefficient (r) =
=
.·. r = 0.37886
For the calculation of probable Error (PEr);
PEr = 0.6745
= 0.6745
.·. PEr = 0.2585

111
Correlation between Loans and Advances and Net Profit of NIC Bank
(In million Rs.)FiscalYear
Net Profit (X) Loans andAdvances (Y)
X² Y² XY
2004 25.94 2419.52 672.88 5854077.03 62762.352005 68.26 3561.41 4659.43 12683641.19 243101.852006 113.76 4711.71 12941.34 22200211.12 536004.132007 96.59 6655.96 9329.63 44301803.52 642899.182008 158.48 8902.53 25115.91 79255040.4 1410872.95N=5 ∑X=463.03 ∑Y=26251.13 ∑X²=52719.19 ∑Y²=164294773.3 ∑XY=2895640.46
Correlation Coefficient (r) =
=
.·. r = 0.9104
For the calculation of probable Error (PEr);
PEr = 0.6745
= 0.6745
.·. PEr = 0.051

112
Calculation of Net Working Capital(In million Rs.)
NABIL NICCurrentAssets
CurrentLiabilities
NetWorkingCapital
CurrentAssets
CurrentLiabilities
NetWorkingCapital
12519.50 12995.89 (476.39) 3909.23 2342.38 1566.8513211.73 12953.23 258.40 5361.60 3235.91 2125.6913936.07 13089.58 846.49 6980.09 3893.26 3086.8317569.83 17005.89 563.94 9264.24 5352.64 3911.6022332.63 19761.06 2571057 10827.86 6486.28 4341.58
Correlation between Net Working capital Net Profit of NABIL Bank(In million Rs.)
FiscalYear
Net Profit(X)
Net WorkingCapital (Y)
X² Y² XY
2004 416.24 (476.39) 173255.74 226947.43 (198292.57)12005 455.31 258.5 207307.20 66822.25 117697.642006 518.64 846.49 268987.45 716545.32 439023.572007 635.26 563.94 403555.27 318028.32 358248.522008 673.96 2571.57 454222.08 6612972.265 1733135.32N=5 ∑X=2699.41 ∑Y=3764.11 ∑X²=1507327.73 ∑Y²=7941316 ∑XY=2449812.477
Correlation Coefficient (r) =
=
.·. r = 0.8267
For the calculation of probable Error (PEr);
PEr = 0.6745
= 0.6745
.·. PEr = 0.095