a changing natural history of primary biliary cholangitis
TRANSCRIPT

A Changing Natural History of Primary Biliary Cholangitis and Its Influence on Risk Stratification
by
Carla Fiorella Murillo Perez
A thesis submitted in conformity with the requirements for the degree of Master of Science
Institute of Medical Science University of Toronto
© Copyright by Carla Fiorella Murillo Perez (2018)

ii
A changing natural history of primary biliary cholangitis and its
impact on risk stratification
Carla Fiorella Murillo Perez
Master of Science
Institute of Medical Science University of Toronto
2018
Abstract
We sought to describe temporal trends in the presenting characteristics and clinical course of
primary biliary cholangitis (PBC) from the 1970s to 2014 in a large international cohort of
patients. There was a 10-year increase in age at diagnosis and the proportion of patients
presenting with a mild biochemical and histological disease stage increased. Furthermore, recent
decades had improved decompensation and transplant-free survival rates. Since most patients
presented with normal bilirubin, we aimed to evaluate whether normal bilirubin is associated
with transplant-free survival. In patients with normal bilirubin at 1 year, the threshold with the
highest ability to predict liver transplantation or death was 0.6×ULN. Patients with normal
bilirubin, yet above this threshold, had a 2.1-fold increase in risk. In conclusion, the natural
history of PBC has changed over time and bilirubin levels ≤0.6×ULN are associated with the
lowest risk for liver transplantation or death in patients with PBC.

iii
Acknowledgments I would like to thank my family and friends for supporting and helping me on this journey
towards the completion of my Master’s.
I would like to express my gratitude towards my supervisor and mentors for their guidance,
advice, and support: Harry Janssen, Bettina Hansen, Jordan Feld, and Aliya Gulamhusein. It has
truly been a pleasure working with all of you.
I would also like to thank my international co-workers: Jorn Goet, Willem Lammers, Henk van
Buuren, Maren Harms, and Adriaan van de Meer who have collaborated with me.
I would also like to also acknowledge the MSc/PhD students at the Toronto Centre for Liver
Disease who have supported me: Seng Liem, Lisette Krassenburg, Mina Farag, Hooman
Zangneh, Surain Roberts, Jason Lau, and Hannah Choi.
I would like to thank the GLOBAL PBC Study Group members for welcoming me as a new
member and supporting my research.

iv
Table of Contents Acknowledgments.......................................................................................................................... iii
Table of Contents ........................................................................................................................... iv
List of Tables ............................................................................................................................... viii
List of Figures ..................................................................................................................................x
List of Abbreviations .................................................................................................................... xii
Chapter 1 : Literature Review ..........................................................................................................1
Primary Biliary Cholangitis ........................................................................................................1
1.1 Introduction ..........................................................................................................................1
1.2 Epidemiology .......................................................................................................................1
1.3 Etiology ................................................................................................................................3
1.3.1 Genetic factors .........................................................................................................3
1.3.2 Environmental factors ..............................................................................................5
1.4 Clinical Presentation and Symptoms ...................................................................................6
1.4.1 Associated disorders ................................................................................................6
1.4.2 Symptoms ................................................................................................................7
1.4.3 Symptom development and prognosis .....................................................................8
1.4.4 Ethnic differences in presentation and symptoms ...................................................9
1.5 Biochemistry, Serology and Histology ................................................................................9
1.5.1 Liver biochemistry ...................................................................................................9
1.5.2 Serology .................................................................................................................11
1.5.3 Histology ................................................................................................................14
1.6 Diagnosis............................................................................................................................16
1.7 Pathogenesis .......................................................................................................................16
1.7.1 Immunopathogenesis of PBC ................................................................................16

v
1.7.2 Loss of self-tolerance .............................................................................................18
1.8 Natural History and Prognosis ...........................................................................................18
1.9 Complications ....................................................................................................................19
1.9.1 Osteoporosis ...........................................................................................................19
1.9.2 Portal hypertension ................................................................................................20
1.9.3 HCC .......................................................................................................................21
1.9.4 Extrahepatic malignancies .....................................................................................21
1.9.5 Fat-soluble vitamin malabsorption ........................................................................21
1.10 Treatment ...........................................................................................................................22
1.10.1 Ursodeoxycholic acid.............................................................................................22
1.10.2 Adjuvant therapies .................................................................................................26
1.11 Predictors of Prognosis ......................................................................................................27
1.11.1 Prognostic models ..................................................................................................28
1.12 Liver Transplantation .........................................................................................................30
1.12.1 Recurrence of PBC after liver transplantation .......................................................31
1.13 Trends in PBC ....................................................................................................................31
Chapter 2 ........................................................................................................................................33
Aims and Hypothesis ................................................................................................................33
2.1 Study 1: Calendar Time Trends .........................................................................................33
2.1.1 Aims .......................................................................................................................33
2.1.2 Hypothesis..............................................................................................................33
2.1.3 Rationale for hypothesis ........................................................................................33
2.2 Study 2: Bilirubin Within the Normal Range ....................................................................34
2.2.1 Aims .......................................................................................................................34
2.2.2 Hypothesis..............................................................................................................34
2.2.3 Rationale for hypothesis ........................................................................................34

vi
Chapter 3 : Study 1 ........................................................................................................................36
Milder Disease Stage in Patients with Primary Biliary Bholangitis Over a 44-year Period: A Changing Natural History ..........................................................................................................36
3.1 Introduction ........................................................................................................................36
3.2 Patients and Methods .........................................................................................................37
3.2.1 Population and study design ..................................................................................37
3.2.2 Data collection .......................................................................................................38
3.2.3 Statistical analysis ..................................................................................................38
3.3 Results ................................................................................................................................39
3.3.1 Study population characteristics ............................................................................39
3.3.2 Age and sex trends .................................................................................................43
3.3.3 Liver biochemistry and serological status..............................................................44
3.3.4 Trends in biochemical and histological disease stage............................................46
3.3.5 Trends in UDCA-response rates ............................................................................46
3.3.6 Decompensation, HCC, and transplant-free survival ............................................49
3.4 Discussion ..........................................................................................................................51
3.5 Supplementary Tables and Figures ....................................................................................55
Chapter 4 : Study 2 ........................................................................................................................68
Bilirubin is Predictive of Transplant-free Survival Even Within the Normal Range in Patients with Primary Biliary Cholangitis .....................................................................................68
4.1 Introduction ........................................................................................................................68
4.2 Patients and Methods .........................................................................................................69
4.2.1 Population and study design ..................................................................................69
4.2.2 Data collection .......................................................................................................69
4.2.3 Statistical analysis ..................................................................................................70
4.3 Results ................................................................................................................................72
4.3.1 Study population characteristics ............................................................................72

vii
4.3.2 Normal bilirubin quartiles are associated with liver transplant-free survival ........74
4.3.3 Bilirubin threshold within the normal range ..........................................................75
4.3.4 The risk for liver transplantation or death increases at bilirubin levels of 0.6×ULN ................................................................................................................79
4.3.5 Patients who remain below 0.6×ULN over time have good long-term prognosis ................................................................................................................80
4.3.6 The proportion of patients with bilirubin ≤0.6×ULN increased over time ............80
4.4 Discussion ..........................................................................................................................82
4.5 Supplementary Tables and Figures ....................................................................................85
Chapter 5 ........................................................................................................................................91
General Discussion....................................................................................................................91
5.1 Calendar Time Trends........................................................................................................91
5.1.1 Discussion ..............................................................................................................91
5.1.2 Strengths and limitations........................................................................................96
5.1.3 Implications............................................................................................................97
5.2 Bilirubin Within the Normal Range ...................................................................................98
5.2.1 Discussion ..............................................................................................................98
5.2.2 Strengths and limitations......................................................................................100
5.2.3 Implications..........................................................................................................101
Chapter 6 ......................................................................................................................................103
Conclusions .............................................................................................................................103
Chapter 7 ......................................................................................................................................105
Future Directions .....................................................................................................................104
References ....................................................................................................................................105
Copyright Acknowledgements.....................................................................................................124
Appendix ......................................................................................................................................125
viii
List of Tables Table 1-1. Various response criteria to UDCA for PBC .............................................................. 25
Table 3-1. Demographic and clinical characteristics of PBC patients at study entry over calendar
time ............................................................................................................................................... 41
Table 3-2. Multivariable logistic regression for the attainment of biochemical response
according to Paris-Ia (n=2283) ...................................................................................................... 48
Table S3-1. Distribution of PBC patients across calendar time and center ................................. 55
Table S3-2. Calendar time trends in patients with a maximum lag of 2 years between diagnosis
and study entry .............................................................................................................................. 57
Table S3-3. Factorial ANOVA analysis of age at diagnosis over calendar time adjusting for sex
....................................................................................................................................................... 62
Table S3-4. Response rate in UDCA-treated patients according to various published criteria over
calendar time ................................................................................................................................. 63
Table S3-5. Response rate over calendar time in UDCA-treated patients who did not meet
criteria at baseline ......................................................................................................................... 64
Table S3-6. Multivariable Cox regression of 10-year hepatic decompensation (n=2962) .......... 65
Table S3-7. Multivariable Cox regression for 10-year HCC incidence (n=3963) ....................... 66
Table S3-8. Multivariable Cox regression analysis of 10-year transplant-free survival (n=3354)
....................................................................................................................................................... 67
Table 4-1. Characteristics of PBC patients in each normal bilirubin cohort ................................ 73
Table 4-2. Multivariable Cox regression analyses of various bilirubin thresholds in patients with
normal bilirubin at 1 year to evaluate performance for the prediction of liver transplantation and
death .............................................................................................................................................. 76

ix
Table S4-1. Multivariable Cox regression analyses of various bilirubin thresholds in patients
with normal bilirubin at time zero to evaluate performance for the prediction of liver
transplantation and death .............................................................................................................. 85
Table S4-2. Multivariable analysis of 0.6×ULN threshold at 1 year in various sub-groups ....... 87
x
List of Figures Figure 3-1. Age at diagnosis of PBC patients across different decades. ..................................... 43
Figure 3-2. Study entry characteristics associated with disease severity of patients diagnosed in
different decades.. ......................................................................................................................... 45
Figure 3-3. Response rates to ursodeoxycholic acid (UDCA) therapy over calendar time. ........ 47
Figure 3-4. Time-to-event analyses of decompensation, hepatocellular carcinoma (HCC), and
liver transplantation or death over calendar time. ......................................................................... 50
Figure S3-1. Mean age at diagnosis over calendar time stratified by A) Center (each line
corresponds to an individual center); B) Sex; and C) Biochemical disease stage. ....................... 60
Figure S3-2. Absolute number of patients according to age at diagnosis and over calendar time.
....................................................................................................................................................... 61
Figure 4-1. Transplant-free survival of the normal bilirubin quartiles in patients with normal
bilirubin at A) time zero and B) 1 year. ........................................................................................ 74
Figure 4-2. Transplant-free survival in patients with normal bilirubin (stratified by 0.6×ULN
threshold) and abnormal bilirubin. ................................................................................................ 77
Figure 4-3. Sub-group analyses based on the bilirubin threshold of 0.6×ULN in patients with
normal bilirubin at 1 year. ............................................................................................................. 78
Figure 4-4. The association between bilirubin levels (×ULN) and risk for liver transplantation or
death. ............................................................................................................................................. 79
Figure 4-5. Mean bilirubin levels over 5 years in patients with normal bilirubin at study entry
and stratified by outcome. ............................................................................................................. 81
Figure S4-1. Distribution of clinical events (liver transplantation, liver-related death, liver-
unrelated death) from the 10-year transplant-free survival rates associated with each bilirubin
group at A) time zero and B) 1 year. .............................................................................................86

xi
Figure S4-2. The association between bilirubin levels (mg/dL) and risk for liver transplantation
or death.......................................................................................................................................... 88
Figure S4-3. The association between bilirubin levels (×ULN) and risk for liver transplantation
(LT) or death. ................................................................................................................................ 89
Figure S4-4. The distribution of patients with bilirubin below and above 0.6×ULN in those with
normal bilirubin at baseline (n=2791)........................................................................................... 90
xii
List of Abbreviations AAR, AST/ALT ratio
AIH, autoimmune hepatitis
ALP, alkaline phosphatase
ALT, alanine aminotransferase
AMA, anti-mitochondrial antibody
ANA, antinuclear antibody
ANOVA, analysis of variance
APC, antigen presenting cell
APRI, AST to platelet ratio index
AST, aspartate aminotransferase
BCOADC, branched-chain oxo acid dehydrogenase complex
CI, confidence interval
ELISA, enzyme-linked immunosorbent assay
FDA, food and drug administration
FDR, first-degree relative
FXR, farnesoid X receptor
GGT, gamma-glutamyl transferase
HCC, hepatocellular carcinoma
HLA, human leukocyte antigen
HR; hazards ratio
HRQOL, health-related quality of life
IBD, inflammatory bowel disease
IIF, indirect immunofluorescence
IQR, interquartile range

xiii
LBR, lamin B receptor
LLN, lower limit of normal
MCMC, Markov chain Monte Carlo
MELD, model for end-stage liver disease
MHC, major histocompatibility complex
MMPT, mitochondrial membrane permeability transition
MMTV, mouse mammary tumor virus
MND, multiple nuclear dot
NHANES III, third national health and nutrition examination survey
NPC, nuclear pore complex
OADC, 2-oxo acid dehydrogenase complex
OCA, obeticholic acid
OGDC, oxoglutarate dehydrogenase complex
OR, odds ratio
PBC, primary biliary cholangitis
PDC, pyruvate dehydrogenase complex
PML, promyelocytic leukemia
POISE, PBC OCA international study of efficacy
PPAR, peroxisome proliferator-activated receptor
PSC, primary sclerosing cholangitis
PT, prothrombin time
RL/M, rim-like membranous
ROC, receiver operating characteristic
ROS, reactive oxygen species
SD, standard deviation
SMA, smooth muscle antibody

xiv
SMR, standard mortality ratio
TE, transient elastography
UDCA, ursodeoxycholic acid
UGT1A1, urine diphosphate glycosyltransferase 1A1
UK, United Kingdom
ULN, upper limit of normal
UTI, urinary tract infection

1
Chapter 1 : Literature Review
1 Primary Biliary Cholangitis
1.1 Introduction Autoimmune diseases constitute a diverse group of conditions that affect 5%-8% of the
population in which the immune system fails to distinguish between self and non-self antigens
(Fairweather & Rose, 2004). Some are organ-specific, while others can affect multiple systems.
Primary biliary cholangitis (PBC) is a chronic autoimmune disease that is characterized by
immune-mediated destruction of small and medium intrahepatic bile ducts. This process is slow
and progressive, thus, over time it may lead to fibrosis, cirrhosis, and liver failure. It is
considered a paradigmatic autoimmune disease due to its female predominance, its association
with other autoimmune diseases, and the presence of disease-specific anti-mitochondrial
antibodies (AMA) and antinuclear antibodies (ANA).
1.2 Epidemiology Like many other autoimmune diseases, PBC exhibits a typical female predominance and the
majority of female: male ratios have been reported to be 9/10:1. A systematic review that
assessed various epidemiological studies on PBC reported that the mean proportion of female
patients was 92% and ranged from 76% to 100% (Boonstra, Beuers, & Ponsioen, 2012).
Furthermore, recent reports suggest an increased proportion of males are affected by PBC, with
male: female ratios of 2.3:1, 4.2:1, and 6.2:1 in Lombardia, Denmark, and South Korea,
respectively (K. A. Kim et al., 2016; Lleo et al., 2016). However, studies from Finland and
Japan have not found evidence of changes in female: male ratios over time (Rautiainen et al.,
2007; Sakauchi, Oura, Ohnishi, & Mori, 2007). This may indicate that different populations have
varying male: female ratios, rather than there being a change over time.
PBC primarily affects middle-aged individuals and it is estimated that globally, 1 in 1,000
women over the age of 40 are affected by PBC (Hirschfield et al., 2017). The age at diagnosis of
PBC has been suggested to be increasing over time in a study of patients from Padova, Italy that
were diagnosed from 1973 to 2007, in which the mean age at diagnosis increased from 48 to 64
(Floreani et al., 2011). Even in symptomatic patients, an increase in median age has been

2
reported in a Japanese population from 59 years old in 1999 to 63 in 2004 (Sakauchi et al.,
2007).
Descriptive epidemiological studies that describe the incidence and prevalence of PBC in various
geographical regions are critical for understanding disease burden and gaining insight into the
etiology of PBC. Metcalf and James (1997) have described some criteria needed to conduct
proper descriptive epidemiological studies, which include strict inclusion criteria, multiple case
finding methods, and clear descriptions of disease onset, study period, geographical area, and the
population being studied. Although PBC affects people from all geographical regions and
ethnicities, it has an increased prevalence in Caucasian populations, especially those from
northern Europe, and the least prevalence in the Indian subcontinent and Africa (Howel et al.,
2000). Varying incidence and prevalence rates have been reported across different regions, in
which Northeast England, Iceland, and Minnesota have some of the highest prevalence rates,
whereas Australia and South Korea have some of the lowest prevalence rates (T. Baldursdottir et
al., 2012; James et al., 1999; K. A. Kim et al., 2016; W. R. Kim et al., 2000; Watson et al.,
1995).
The varying rates of incidence and prevalence according to geographical region may be due to
differences in genetics, ethnicity, and environmental factors. The contribution of genetics and
ethnicity was demonstrated in a study that compared the prevalence of PBC in Australia in
Australian-born individuals to that of migrant populations from Britain, Italy, and Greece. They
reported that the prevalence (per million) was higher in the migrant groups (Greece: 208, Italy:
200, and Britain: 141) compared to individuals that were born in Victoria, Australia (37) (Sood,
Gow, Christie, & Angus, 2004).
In an early review of descriptive epidemiologic studies for PBC, Metcalf and James (1997)
reported wide variations in incidence between regions from less than 25 cases per million
(Australia and Canada) to 200-252 cases per million (South Wales and Northeast England). They
also reported very few cases in sub-Saharan Africa and India (Metcalf & James, 1997). In a more
recent review of 24 studies published between 1972 and 2007, the annual incidence and
prevalence rates per 100,000 individuals ranged from 0.33-5.8 and 1.91-40.2, respectively
(Boonstra et al., 2012). Furthermore, all studies for which there were yearly prevalence rates

3
available for several consecutive years reported an increase in prevalence over time (Boonstra et
al., 2012). Conversely, temporal trends of incidence rates have been inconsistent, as some studies
report stable incidence rates and others report an increase over time (Boonstra et al., 2014;
McNally, James, Ducker, Norman, & James, 2014).
Rises in incidence and prevalence of PBC may be a surrogate of increased routine testing and
AMA testing as a result of improved disease awareness by physicians, which would suggest that
early epidemiological studies of PBC may have underestimated its prevalence (M. I. Prince &
James, 2003). On the contrary, if a true increase in incidence has occurred, it may be attributed to
an increased exposure to an environmental agent that triggers the disease or the aging population,
whom are inherently at risk for PBC (M. I. Prince & James, 2003). Furthermore, the increase in
prevalence of PBC can be attributed to the potential increase in survival of patients, an indication
of earlier diagnosis and improved care of PBC patients. Evidence for potentially improved
survival was observed in a population from Finland, in which there was an increase in the
median time from diagnosis to death from 1988 to 1999 (Rautiainen et al., 2007).
1.3 Etiology Although an exact cause for PBC is unknown, its development is speculated to be due to a
combination of both genetic and environmental factors. More specifically, genetics render an
individual susceptible to PBC, in whom the disease is triggered by exposure to an environmental
agent.
1.3.1 Genetic factors
Familial clustering and high concordance rates in monozygotic twins of 63% provide evidence to
suggest that genetic factors are implicated in the development of PBC (Hayase et al., 2005;
Selmi et al., 2004). There have been reports of PBC in sisters (Chohan, 1973), brothers (Bown,
Clark, & Doniach, 1975), and mother and daughter (Fagan, Williams, & Cox, 1977). The
prevalence rates of PBC in the family members of affected individuals are estimated to be
4%-9%. One particular study found estimates of 4282 per 100,000 (4.3%) in families compared
to 0.7-7.5 per 100,000 in the general population (Bach & Schaffner, 1994). Additionally, another
study reported that 5.9% of PBC patients had a family history of PBC (Hayase et al., 2005).

4
Unaffected relatives of patients with PBC still exhibit an increased frequency of extrahepatic
autoimmune diseases and immunological abnormalities, such as hypergammaglobulinemia
(increased IgM and IgA), and non-organ specific autoantibodies (ANA, smooth muscle
antibodies [SMA], and AMA) (Hayase et al., 2005). In a geographically-based cohort from the
United Kingdom (UK), 14% of first-degree relatives (FDR) of patients with PBC had an
autoimmune disease (Watt, James, & Jones, 2004). Additionally, both PBC patients and healthy
FDRs show abnormalities of in vitro suppressor cell function and T cell function (Miller,
Sepersky, Brown, Goldberg, & Kaplan, 1983). AMA positivity has been reported to be increased
in FDRs relative to age- and sex matched controls (Feizi, Naccarato, Sherlock, & Doniach,
1972; Lazaridis et al., 2007; Zografos et al., 2012). In one study, 7% of healthy relatives of
patients with PBC were AMA-positive, compared to none of the age- and sex- matched controls
(Feizi et al., 1972). In another study, the prevalence of AMA in FDRs and controls (age, sex,
and residence matched) was 13.1% and 1%, respectively (Lazaridis et al., 2007).
Genetic association studies of PBC have been primarily focused on genes from the major
histocompatibility complex (MHC)/human leukocyte antigen (HLA) region, which codes for 3
classes of proteins (class I, class II, and class III) that regulate the immune system. An
exploration into the potential genetic associations of PBC have been widely studied in many
populations and the only consistently reported genetic association has been with HLA-
DRB1*0801. Rates of this genetic variant have been shown to be increased in PBC patients
compared to population-specific healthy controls in Italy (12% vs 4%) and the UK (18% vs 6%)
(Donaldson et al., 2006).
A study on German PBC patients found no association with HLA class I, but they found an
increased association with HLA class II (HLA DRw8) and HLA class III (C4AQ0) in PBC
patients compared to healthy controls (Manns et al., 1991). In Danish patients, there have been
associations with B8, DR3, DQA1*0501, and DQB1*0201 (Morling et al., 1992). Other
associations in Caucasian populations have been with DR8 and DQB1*0402 (Gregory et al.,
1993; Underhill et al., 1992). Interestingly, there have also been reports of genetic loci that are
associated with a reduced risk for developing PBC, such DRB1*11 in an Italian population
(Invernizzi et al., 2003). The inconsistency of genetic association studies suggests that PBC is

5
genetically heterogeneous (Morling et al., 1992). Furthermore, variations between studies may
result from inherent problems in HLA serotyping and differences in methodology.
1.3.2 Environmental factors
Environmental factors are speculated to play a role in genetically susceptible individuals.
Although there have not been strong environmental factors associated with PBC, various
potential contributors have been reported, some of which are consistent across studies.
The female predominance of PBC has led to the hypothesis that reproductive factors may play a
role in the etiology of PBC. However, in a case-control study from the Netherlands, there were
no differences observed between PBC cases and controls in terms of age at menarche, age at first
pregnancy, and number of children (Boonstra et al., 2014). Smoking, tonsillectomy, and vaginal
or urinary tract infection (UTI) in females were some risk factors associated with PBC in a US
study (Parikh-Patel, Gold, Worman, Krivy, & Gershwin, 2001). Furthermore, in large case-
control studies, recurrent UTIs, active/past smoking, and the use of hormone replacement
therapy have been associated with an increased risk for PBC (Corpechot, Chrétien,
Chazouillères, & Poupon, 2010; Gershwin et al., 2005). Additional associations include the
frequent use of nail polish and hair dye (Gershwin et al., 2005; Mantaka et al., 2012; Prince,
Ducker, & James, 2010), while the use of oral contraceptives has been associated with a
decreased risk (Corpechot et al., 2010).
A smoking history is more common in patients with an advanced histological stage (III or IV) at
presentation, which suggests that smoking may accelerate the progression of PBC, independent
of its contribution to disease susceptibility (Corpechot et al., 2012; Zein et al., 2006). This
association was not related to an increase in histological inflammatory activity, severity of bile
duct damage, and biochemical and immunological markers of disease, which indicates that
tobacco smoking exerts direct, pro-fibrotic effects in PBC that are unrelated to immunity
(Corpechot et al., 2012).
Infectious agents have also been proposed to play a role in the development of PBC, such as
Chlamydia pneumoniae, whose antigens and RNA have been found in the liver tissue of PBC
patients (Abdulkarim et al., 2004). Additional infectious agents include Escherichia coli (E.

6
coli), mycobacteria, Novosphingobium aromaticivorans, Lactobacillus species, Helicobacter
pylori, viral infections (human retrovirus), and mouse mammary tumor virus (MMTV) (Mantaka
et al., 2012). Collectively, these studies indicate that exposure to multiple environmental factors
may contribute to PBC risk.
1.3.2.1 Geographical clustering
A phenomenon that supports the involvement of environmental factors in the etiology of PBC is
spatial clustering in specific locations that deviate from a random distribution, as has been found
in Northeast England and Alaska (Abu-Mouch et al., 2003; McNally et al., 2014; M. I. Prince et
al., 2001). In Northeast England, the risk for PBC was increased in geographical regions that had
higher levels of socioeconomic hardship, defined as those with overcrowded homes, an increased
proportion of households without cars, and higher levels of homes that were non-owned
(McNally et al., 2014). Furthermore, an increased prevalence of PBC patients has been reported
near toxic waste sites and among atomic bomb survivors from Hiroshima (Ala et al., 2006; Kita,
He, & Gershwin, 2004).
There is also evidence of space-time clustering, which is different from spatial clustering, and is
defined as an excess of cases within a small geographical region over a limited period of time
(McNally, Ducker, & James, 2009). This type of clustering was found in a population-based
study from Northeast England in which they also reported seasonal variation in the incidence of
PBC with a peak in diagnosis in June (McNally et al., 2009; McNally, James, Ducker, & James,
2011). The presence of this type of clustering may be indicative of a transient environmental
factor (infectious, air pollution, dietary factors) versus a static (non-infectious) factor (McNally
et al., 2009).
1.4 Clinical Presentation and Symptoms
1.4.1 Associated disorders
Patients with PBC have an increased prevalence of other autoimmune diseases (Gershwin et al.,
2005; Watt et al., 2004). In a geographically-based cohort from the UK, 53% of patients had at
least one autoimmune disease in addition to PBC (Watt et al., 2004). The most common
autoimmune disease associated with PBC is Sjogrens/sicca syndrome (69-81%), a disease that
7
affects the exocrine glands and leads to impaired glandular secretions and mucosa dryness
(Tsianos et al., 1990). However, they can also be affected by rheumatoid arthritis, complete or
incomplete CREST syndrome (calcinosis cutis, Raynaud syndrome, esophageal motility
disorder, sclerodactyly, telangiectasia), and thyroid disorders (Bittencourt et al., 2004; Parikh-
Patel et al., 2001; Reynolds, Denison, Frankl, Lieberman, & Peters, 1971; Siegel, Luthra,
Donlinger, Angulo, & Lindor, 2003; Tsianos et al., 1990)
1.4.2 Symptoms
Some of the symptoms that may be experienced by patients include fatigue, pruritus, pain in the
upper right quadrant, hyperlipidemia, keratoconjunctivitis, steatorrhea, and xerostomia (Siegel et
al., 2003). However, not all patients are affected in the same way as the presence and severity of
symptoms is heterogeneous. Furthermore, the symptoms affecting patients seem to have evolved
over time. Patients diagnosed in earlier times would frequently present with jaundice, which is
yellow discoloration of the skin, sclera, and mucous membranes that develops in late stages of
disease (Hirschfield et al., 2017). However, the proportion of asymptomatic patients at diagnosis
has reportedly been increasing over time, which implies an earlier diagnosis. In an early study,
13% of patients referred between 1955 and 1979 were asymptomatic at diagnosis, compared to
61% in prevalent cases from 1987 to 1994 (Mahl, Shockcor, & Boyer, 1994; M. Prince,
Chetwynd, Newman, Metcalf, & James, 2002). In Italy, there was an increase in the proportion
of asymptomatic patients at diagnosis from 25% to 46% from 1973 to 2007 (Floreani et al.,
2011). In Iceland, a decrease in the proportion of patients with symptoms at diagnosis was also
reported, from 57% in 1991-2000 to 36% in 2001-2010 (T. Baldursdottir et al., 2012). These
studies indicate that nowadays, up to 60% of patients are asymptomatic. Although asymptomatic
patients generally demonstrate a less advanced disease stage as indicated by biochemistry and
histology when compared to initially symptomatic patients, asymptomatic PBC does not
necessarily suggest early disease (M. Prince et al., 2002). There have been reports that 61% of
asymptomatic patients had a liver biopsy at baseline that demonstrated fibrosis or cirrhosis
(Balasubramaniam, Grambsch, Wiesner, Lindor, & Dickson, 1990). Furthermore, patients have
died prior to the development of any symptoms (M. Prince et al., 2002).

8
The most common symptoms at diagnosis are pruritus and fatigue, and least common are
hyperpigmentation, hepatomegaly, splenomegaly, and jaundice (M. Prince et al., 2002; Zein,
Angulo, & Lindor, 2003). Younger patients are more likely to report fatigue and pruritus
(Carbone et al., 2013). Fatigue, present in up to 50% of patients, is the most debilitating
symptom of PBC and imposes the greatest impact on quality of life, however, the degree of
fatigue does not correlate with any conventional parameters of disease severity, such as liver
histology or biochemistry (Cauch-Dudek, Abbey, Stewart, & Heathcote, 1998; Huet, Deslauriers,
Tran, Faucher, & Charbonneau, 2000; Newton et al., 2007; Newton, Gibson, Tomlinson, Wilton,
& Jones, 2006). In turn, fatigue does correlate with sleep quality (daytime somnolence) and is
associated with higher depression scores (Cauch-Dudek et al., 1998; Newton et al., 2006).
Patients with PBC not only experience decreased energy levels compared to an age- and sex-
matched control group, but they also demonstrate worse emotional reaction scores (R. E.
Poupon, Chrétien, Chazouillères, Poupon, & Chwalow, 2004). These findings emphasize the
importance of considering health-related quality of life (HRQOL) in PBC, defined as a patient’s
perception of their health status and the impact the disease poses on their life (R. E. Poupon et
al., 2004). PBC-40, a measure of HRQOL specifically for PBC was developed that allowed the
quantification of 6 domains that affect QOL: fatigue, emotional, social, cognitive function,
general symptoms, and itch (Jacoby et al., 2005). This measure was implemented in the UK-PBC
cohort and indicated that the majority (66%) of patients report good/neutral scores, but 34%
report poor scores (Dyson et al., 2016). Older age was associated with improved perceived QOL
for all symptom domains, except itch (Dyson et al., 2016).
1.4.3 Symptom development and prognosis
Although there are asymptomatic patients that don’t develop symptoms up to 10 years from
presentation, the majority will eventually develop symptoms during the course of disease and
experience progressive PBC (Long, Scheuer, & Sherlock, 1977; Mitchison et al., 1990; Springer,
Cauch-Dudek, O’Rourke, Wanless, & Heathcote, 1999). One or more symptoms developed in
89% of untreated patients during a median follow-up of 6.7 years (Balasubramaniam et al.,
1990). In another study, 50% of patients developed symptoms after 5 years and 95% after 20
years (M. I. Prince, Chetwynd, Craig, Metcalf, & James, 2004).

9
In older studies, the survival of asymptomatic patients was reported to be better than
symptomatic patients, but shorter than the general population (Mahl et al., 1994; Springer et al.,
1999). Once symptoms develop, however, there is no difference in the survival of patients who
developed symptoms during follow-up compared to patients who presented with symptoms
(Mahl et al., 1994; Mitchison et al., 1990). More recently, asymptomatic patients have shown to
have comparable survival to that of an age- and sex-matched population, especially if they
present at an early disease stage (Floreani et al., 2011; E. M. Kuiper et al., 2009).
Several attempts have been made to predict which patients may develop symptoms and who will
remain symptom-free based on liver biochemistry or histology, but these did not yield any
significant factors that could predict symptom development (Long et al., 1977; Mahl et al., 1994;
Springer et al., 1999). However, a recent study of asymptomatic ursodeoxycholic acid (UDCA)-
treated patients reported that response to UDCA at 6 months, defined by normalization or a
decrease in gamma-glutamyl transferase (GGT) greater than 70%, was an independent predictor
of symptom development (Azemoto et al., 2009).
1.4.4 Ethnic differences in presentation and symptoms
There is variability in disease severity at presentation of patients according to ethnicity. Non-
Caucasians are more likely to present with a more severe case of PBC, as suggested by lower
activity levels, more severe pruritus, and a greater incidence of hepatic complications (ascites,
hepatic encephalopathy, variceal bleeding) (Levy et al., 2014; Peters et al., 2007). Furthermore,
Hispanics are less likely to respond to treatment when defined as alkaline phosphatase (ALP)
<2× the upper limit of normal (ULN) at 1 year, in which the response rate of Hispanic patients
was 60% vs 88% for non-Hispanics (Levy et al., 2014).
1.5 Biochemistry, Serology and Histology
1.5.1 Liver biochemistry
Alterations in liver biochemistry can be used for the diagnosis of PBC and to help establish the
stage of disease, as well as its progression (Hirschfield et al., 2017). Early biochemical markers
of cholestasis are ALP and GGT, of which an elevation in GGT can be identified prior to an
elevation in ALP (K. D. Lindor et al., 2009; N. Suzuki et al., 2006; Zein et al., 2003). The

10
magnitude of elevation of ALP strongly correlates with the severity of ductopenia and
inflammation and is associated with disease progression (Hirschfield et al., 2017; K. D. Lindor et
al., 2009). There may also be mildly elevated transaminases (alanine aminotransferase [ALT]
and aspartate aminotransferase [AST]) at presentation. Although these are not diagnostic of PBC,
they reflect the extent of liver parenchyma inflammation and necrosis (Hirschfield et al., 2017;
K. D. Lindor et al., 2009; Zein et al., 2003). An increase in immunoglobulin (Ig) concentrations,
particularly IgG and IgM, is also observed in PBC, but they don’t correlate with the duration of
symptoms, degree of jaundice, ALP, or histology (Hirschfield et al., 2017; K. D. Lindor et al.,
2009; MacSween, Horne, Moffat, & Hughes, 1972). Increases in conjugated bilirubin, and
alterations in prothrombin time (PT) and serum albumin are not manifested in PBC until later
stages of disease (K. D. Lindor et al., 2009). Hyperbilirubinemia reflects the severity of
ductopenia and biliary piecemeal necrosis (K. D. Lindor et al., 2009). PBC, as with other
cholestatic diseases, is associated with elevations in serum cholesterol and may result in the
development of xanthomas and xanthelasmas, yellow colored nodules on the surface of the skin
owing to the deposit of cholesterol under the skin. However, hypercholesterolemia is not
associated with an increase in cardiovascular risk or mortality (Cash et al., 2010).
There are three distinct biochemical disease stages based on albumin and bilirubin at study entry.
These biochemical parameters were chosen based on the finding that bilirubin and albumin were
the prognostic factors consistently associated with survival. An early disease is defined as both
normal albumin and bilirubin, moderately advanced is defined as normal bilirubin or albumin,
and advanced is defined as abnormal bilirubin and albumin (ter Borg, Schalm, Hansen, & van
Buuren, 2006).
1.5.1.1 Metabolism of bilirubin
Bilirubin is different from the other liver biochemistry parameters that assess liver function
because its homeostasis is a complex process that entails various enzymes and transporters.
Unlike aminotransferases, for example, whose serum concentrations are dictated by their release
from hepatocytes, serum bilirubin concentrations are dictated by various factors. Bilirubin is
derived primarily from heme produced as a result of red blood cell turnover. Heme oxygenases
cleave heme and produce biliverdin, which is subsequently reduced by biliverdin reductase to

11
bilirubin (Levitt & Levitt, 2014). The production of bilirubin is beneficial since it is a free radical
scavenger that also possesses antioxidant and anti-inflammatory properties. After production,
bilirubin covalently bound to albumin is transported to the liver (delta bilirubin), where it is
rendered water-soluble through conjugation with glucuronic acid to be excreted by the liver with
bile. Conjugation of bilirubin is carried out by urine diphosphate glycosyltransferase 1A1
(UGT1A1). Total serum bilirubin is a composite of unconjugated, delta, and conjugated
bilirubin. In a healthy individual, measurements with high-performance liquid chromatography
of conjugated bilirubin indicate that it comprises 3% of total bilirubin (Levitt & Levitt, 2014).
1.5.1.1.1 Bilirubin in PBC
In PBC, chronic cholestasis results in the accumulation of conjugated bilirubin within the liver
and causes leakage back to the circulation, thereby increasing conjugated bilirubin levels.
Therefore, unlike healthy individuals whose total bilirubin is primarily composed of conjugated
bilirubin, the total bilirubin of PBC patients is predominantly comprised of conjugated bilirubin
with a proportion above 70% (Levitt & Levitt, 2014).
1.5.2 Serology
1.5.2.1 Anti-mitochondrial antibodies
The main serologic hallmark of PBC is positivity for AMA, which are present in 90-95% of
patients and can be detected before any liver-related symptoms appear (Zein et al., 2003). Thus,
AMA-positivity without evidence of biochemical cholestasis may indicate the subsequent
development of PBC (Lazaridis et al., 2007). Although AMA is the characteristic antibody for
PBC, it is not specific for PBC since 2% of patients with primary sclerosing cholangitis (PSC)
are also positive for AMA (Zein et al., 2003). The majority of early studies failed to demonstrate
a prognostic value of AMA since there were no correlations between AMA (IgG and IgM) and
histologic stage or biochemical variables (Mutimer et al., 1989). However, in a recent study,
positivity for AMA (IgG or IgA) at baseline and increased titers during follow-up were
associated with biochemically and histologically advanced disease (Gatselis et al., 2013). AMA-
negative patients, whom constitute 5-10% of patients with PBC, were initially regarded as
having a different clinical entity, yet they exhibit the same clinical, histological, and biochemical

12
features of PBC, including after treatment with UDCA, as AMA-positive patients (Invernizzi et
al., 1997; W. R. Kim et al., 1997).
The autoantigen of AMA is localized to the inner mitochondrial membrane and corresponds to
the M2 family of autoantigens (2-oxo acid dehydrogenase complex [OADC]), for which there is
cross-reactivity due to structural homology (Dähnrich et al., 2009; Flannery et al., 1989;
Mutimer et al., 1989). This functionally-related family of enzymes consists of pyruvate
dehydrogenase complex (PDC), branched-chain oxo acid dehydrogenase complex (BCOADC),
and oxoglutarate dehydrogenase complex (OGDC); each complex consists of multiple copies of
three enzymes (E1-E3) (Mutimer et al., 1989). AMA mainly recognize the E2 subunits of
OADC, of which PDC-E2 is the main autoantigen, since 80-90% of sera react with PDC-E2 and
approximately 10% only react to BCOADC-E2 and/or OGDC-E2 (Dähnrich et al., 2009; Gabeta
et al., 2007). E2 is a dihydrolipoamide acetyltransferase that is highly conserved across species
(Mutimer et al., 1989; Van de Water et al., 1989). The autoepitope of the autoantigen is a 20
amino acid peptide that corresponds to the lipoic acid binding site of PDC-E2 (Van de Water,
Gershwin, Leung, Ansari, & Coppel, 1988). The presence of the lipoyl residue, which is bound
covalently to a lysine residue, is crucial for an effective recognition by AMA since there is a
higher relative affinity for the lipoylated form (Quinn et al., 1993). Meanwhile, the E1 and E3
subunits of OADC are recognized at less frequent rates (Dähnrich et al., 2009).
1.5.2.2 Detection of anti-mitochondrial antibodies
Indirect immunofluorescence (IIF) on rodent multiorgan substrates was the gold standard method
for detecting AMAs, but this method is time-consuming, labor-intensive, and observer-
dependent (Dähnrich et al., 2009; Gabeta et al., 2007; Muratori et al., 2004). In recent years there
has been a shift towards enzyme-linked immunosorbent assay (ELISA) and western
immunoblots as the first-line assays for the detection of AMA because these approaches yield
greater sensitivity and specificity as compared to IIF (Muratori et al., 2004; Van de Water et al.,
1989). A meta-analysis reported that the sensitivity and specificity of ELISA was 84.5% and
97.8%, respectively (S. Hu, Zhao, Wang, & Chen, 2014). Furthermore, these methods are
considered superior because of their objectivity, rapid speed, and semi-automation (Gabeta et al.,
2007; Van de Water et al., 1989).

13
MIT3 is a more recently developed ELISA assay that includes the epitopes from BCOADC-E2
and OGDC-E2 substrates in addition to PDC-E2 to increase the specificity and sensitivity of
AMA detection as compared to IIF and conventional anti-M2 ELISA (Gabeta et al., 2007).
Furthermore, in order to be able to detect antibodies against PDC-E1, a hybrid MIT3 clone was
constructed and mixed with a native PDC antigen (Dähnrich et al., 2009). This newly developed
anti-MIT3/PDC ELISA was compared to the conventional anti-PDC ELISA, anti-MIT3, and IIF,
of which anti-MIT3/PDC showed best diagnostic sensitivity.
1.5.2.3 Antinuclear antibodies
In addition to AMA, patients with PBC may also exhibit positivity for other serum
autoantibodies such as ANA and SMA. However, these additional autoantibodies are more
frequently observed in AMA-negative patients than AMA-positive patients (71% vs 31%)
(Invernizzi et al., 1997). ANAs are directed against proteins of the nuclear envelope and are
observed in 30-50% of patients (C. J. Hu et al., 2012; Shimoda et al., 2003; Wesierska-Gadek,
Hohenuer, Hitchman, & Penner, 1996). The specificity for ANA has been shown to be 99%, and
thus ANA positivity would strongly suggest a diagnosis of PBC, irrespective of AMA status
(Granito et al., 2006).
There are two distinct ANA patterns that are detectable by IIF, multiple nuclear dot (MND) and
Rim-like/membranous (RL/M) patterns. MND is characterized by staining of 3-20 dots of
variable size distributed throughout the cell nucleus and sparing nucleoli. Sp100 and
promyelocytic leukemia antigen (PML) give rise to this type of staining and can be found
simultaneously in 90% of patients. Anti-Sp100 can be observed in 20-40% of patients and has
a specificity of 97% and sensitivity of 30% (Shimoda et al., 2003).
The nuclear pore complex (NPC), a system that mediates molecular trafficking between the
nucleus and cytoplasm contains ANA antigens that give rise to RL/M staining, namely gp210,
lamin B receptor [LBR], and nucleoporin p62. These have high specificity for PBC of over 99%
(Granito et al., 2012; Muratori et al., 2003). Out of NPC antigens, the majority of patients (10-
40%) have autoantibodies against gp210, an integral glycoprotein, while p62 and LBR are
observed less frequently (Shimoda et al., 2003; Wesierska-Gadek et al., 1996).

14
ANAs have been associated with disease severity and can be considered a marker of poor
prognosis. PBC patients with ANA positivity tend to have a more severe biochemical and
histological disease compared to those seronegative, particularly those with IgG3 isotype
(Rigopoulou et al., 2005). Furthermore, bilirubin increased above 2mg/dL in anti-NPC positive
patients at increased rates compared to anti-NPC negative patients (26% vs 5%) (Wesierska-
Gadek et al., 2006). Specifically, anti-gp210 antibodies are more frequent in patients with more
pronounced cholestasis and impaired liver function and are associated with more severe interface
hepatitis and lobular inflammation (Gatselis et al., 2013; C. J. Hu et al., 2012; Muratori et al.,
2003; Nakamura et al., 2007). Positivity for anti-sp100 at baseline was also associated with
biochemically and histologically advanced disease, with decreases in anti-sp100 being reportedly
associated with improved Mayo risk scores and response according to Barcelona criteria
(Gatselis et al., 2013).
Additional autoantibodies other than AMA and ANA include anti-lymphocytotoxic, anti-
thyroglobulin, and anti-centromere (Miller et al., 1983; Nakamura et al., 2007; Watt et al., 2004).
Anti-centromere antibodies have been identified as a risk factor for the development of
esophageal varices or HCC without jaundice and may be a surrogate for a higher propensity to
develop portal hypertension. Additionally, anti-centromere antibodies are associated with more
severe ductular proliferation (Nakamura et al., 2007).
1.5.3 Histology
PBC is histologically characterized by portal inflammation and immune-mediated destruction of
intrahepatic small- and medium-sized bile ducts. There are four histologic stages associated with
PBC that have been described by Ludwig et al. and Scheuer (Ludwig, Dickson, & McDonald,
1978; Scheuer, 1967). Stage 1 is defined as the florid bile duct lesion (granulomatous destruction
of interlobular bile ducts although granulomas not always observed) restricted to the portal area
Stage 2 is periportal hepatitis and ductular proliferation. Stage 3 is characterized by septal
fibrosis or bridging necrosis, while stage 4 is cirrhosis. The majority of patients without effective
therapy will progress histologically within 2 years, as progression was observed in 62% of
patients with stage I or II, and 50% of patients in stage III (Locke, Therneau, Ludwig, Dickson,

15
& Lindor, 1996). Only a minority of precirrhotic patients (20%) showed histological stability,
while histological regression was only observed in 2% of patients.
Liver biopsies are no longer a mandatory requirement for the diagnosis of PBC and are therefore
not routinely performed. They are only beneficial for the diagnosis of PBC in AMA-negative
patients or a minority of AMA-positive patients who don’t demonstrate a cholestatic biochemical
profile (Zein et al., 2003). Some of the drawbacks for routinely performing a liver biopsy include
its invasive nature, high cost, interobserver and intraobserver bias, and the small risk for
complications, such as post biopsy pain, bleeding, bile duct injury, or penetration of the
abdominal viscera (Alempijevic et al., 2009; Su et al., 2009). The incidence of complications and
mortality after a liver biopsy has been reported to be 0.3% and 0.018%, respectively.
The prognostic information rendered by histological staging can be particularly important.
Therefore, non-invasive tools that can assess the degree of liver fibrosis have been sought to
replace liver biopsies and include biochemical markers and transient elastography. AST/ALT
ratio (AAR) is a potential biochemical marker that can evaluate fibrosis and is significantly
higher in patients with advanced fibrosis, yet its correlation with fibrosis has been variable with
reported receiver operating characteristic (ROC) values of 0.66 and 0.85 (Alempijevic et al.,
2009; Su et al., 2009). Furthermore, AST to platelet ratio index (APRI) is a non-invasive marker
that can capture liver fibrosis and portal hypertension (Trivedi et al., 2014). APRI > 0.54 at
baseline and 1 year have been independently associated with transplant-free survival. A more
promising way of evaluating liver fibrosis is the use of transient elastography (TE), a non-
invasive and safe technique that measures liver stiffness (Gómez-Dominguez et al., 2008). This
technique utilizes ultrasounds of 5MHz and low-frequency elastic waves to create an elastic
shear wave that propagates within the liver tissue, while a pulse echo ultrasound simultaneously
measures the velocity of the shear wave. In this context, the velocity is directly related to the
stiffness of the liver and high velocities indicate high liver stiffness. A significant correlation
between histological fibrosis stage and liver stiffness has been found (Gómez-Dominguez et al.,
2008).

16
1.6 Diagnosis The diagnosis of PBC is based on two of the following criteria: 1) biochemical evidence of
cholestasis with an elevated ALP; 2) presence of AMA at titers above 1:40; 3) Histopathologic
evidence of non-suppurative cholangitis and destruction of small- or medium-sized bile ducts if
biopsy is performed (K. D. Lindor et al., 2009). Interestingly, prior to the development of any
clinical or biochemical indication for PBC, AMA-positive patients whose histology is
compatible with PBC are affected but seem to have a slow progression. This was supported by a
study that reported 76% of patients eventually developed symptoms of PBC and 83% developed
cholestatic liver function tests (Metcalf et al., 1996).
1.7 Pathogenesis
1.7.1 Immunopathogenesis of PBC
Abnormalities in humoral and cell-mediated immunity, the presence of autoantibodies, abnormal
complement activation and clearance, abnormal results of in vitro immune function tests, and a
greater association with other autoimmune diseases suggests that the immune system plays a role
in the pathogenesis of PBC (Miller et al., 1983; Nakanuma, 1993). The infiltration of plasma
cells and lymphocytes into the portal tracts of patients with PBC suggests that there is an intense
inflammatory reaction.
1.7.1.1 The pathogenic role of T cells
The destruction of biliary epithelial cells is thought to be mediated by liver-infiltrating
autoreactive T cells (Löhr et al., 1993). Activated T cells with high cytotoxic activity including
CD8+ T cells and CD4+ T cells are the predominant infiltrates surrounding the portal tracts (Kita
et al., 2004; Löhr et al., 1993; Nakanuma, 1993). The major autoreactive antigen of these T cells
is also PDC-E2, similar to AMA. The immunodominant epitope of MHC class II-restricted
CD4+ T cells specific for PDC-E2 has been identified as amino acid residues 163-176 of PDC-
E2 (Kita et al., 2002; Shimoda et al., 2003), while the epitope for MHC class I-restricted CD8+ T
cells lies within amino acids 159-167 (Kita et al., 2002). These PDC-E2-specific T cells are
detected in the peripheral blood, liver, and portal lymph nodes of patients with PBC (Kita et al.,
2002; Shimoda et al., 2003). However, it seems that they are predominantly located in the liver

17
of PBC patients, as there is a 10-fold increase in the frequency of CD8+ T cells specific for
PDC2-E2 in the liver compared to peripheral blood (Kita et al., 2002).
Further evidence to support the immunologic role of T cells is the high expression of HLA class
II on bile duct epithelium (Ballardini et al., 1984; Löhr et al., 1993; Underhill et al., 1992). HLA
class II are cell surface glycoproteins that play an important role in presenting antigens to
regulate immunologic reactions, and their expression is normally restricted to antigen presenting
cells (APCs) (Ballardini et al., 1984; Underhill et al., 1992). It is speculated that this promotes
autorecognition because it may enable the bile duct epithelial cells to present self-antigens to T-
lymphocytes.
Furthermore, there is an increased expression of PDC-E2 on biliary epithelial cells (Shimoda et
al., 2003). It has been suggested that CD4+ helper T cells and the expression of MHC class II
antigens on biliary epithelial cells may be particularly important in the early stages of PBC
(Nakanuma, 1993).
1.7.1.2 The pathogenic role of AMA
Although AMA is present at high titers in the majority of patients, its pathogenic role remains
enigmatic. Evidence that suggests AMA contributes to the pathogenesis of PBC is their ability
to inhibit the enzymatic activity of PDC in vitro and the ability of IgA specific AMA to
undergo transcytosis in biliary epithelial cells that potentially predisposes cells for apoptosis
(Löhr et al., 1993; Matsumura et al., 2004). Although B cells can be found in the bile ducts of
patients, these may not play a relevant role in the pathogenesis of PBC, as they are relatively
scarce in the liver and neither the presence of AMA nor titers correlate with recurrence after
liver transplantation (Nakanuma, 1993; Neuberger, 2003).
1.7.1.3 Non-immune mediated mechanisms
The immunologic destruction of bile ducts results in decreased bile secretion, and therefore there
is retention of endogenous toxic primary bile acids and copper in the liver, which can result in
hepatocellular damage (Aboutwerat et al., 2003; Crosignani et al., 1991). It has also been
suggested that the generation of reactive oxygen species (ROS), such as superoxide anion and

18
hydroxyl radical may play role. Oxidant stress seems to be a significant feature of early stage
PBC (Aboutwerat et al., 2003).
1.7.2 Loss of self-tolerance
Although the exact process by which self PDC-E2 becomes antigenic is unknown, there are
several mechanisms that have been suggested to play a role based on experimental evidence,
including molecular mimicry, self-alteration of PDC-E2 by xenobiotics, and intact immunogenic
epitopes released from apoptotic biliary epithelial cells (M M Kaplan & Gershwin, 2005;
Lazaridis et al., 2007). The most common mechanism described is molecular mimicry between a
self-antigen and an exogenous bacterial or virologic antigen. This mechanism signifies that an
infectious agent is responsible for the initiation of PBC and seems plausible considering the
highly conserved nature of PDC-E2, especially the inner lipoyl domain. Some evidence for this
mechanism includes cross-reactivity between human PDC-E2 and bacterial E. coli E2 (Bogdanos
et al., 2004). The second mechanism by which self-tolerance may be lost is the replacement of
the lipoic acid bound to E2 with a chemical xenobiotic mimic. 107 potential xenobiotic mimics
were coupled to the lysine residue of PDC-E2 and tested against sera from PBC patients for
immunoglobulin reactivity (Amano et al., 2005). Nine of these xenobiotic mimics were found to
yield higher reactivity with PBC sera compared to control sera, and when compared to the native
lipoylated peptide. One particular xenobiotic that exhibited high reactivity with sera from PBC
patients was 2-octynoic acid-PDC-E2, a chemical that can modify PDC in vivo and is widely
used in cosmetics (Amano et al., 2005). Another study also identified 2-octynoic acid as a high
affinity reactant specifically for AMA (Rieger et al., 2006).
1.8 Natural History and Prognosis PBC develops over the course of many years and the rate of progression varies from one patient
to another. There are three irreversible stages: 1) cirrhosis; 2) a terminal phase when serum
bilirubin levels reach 6mg/dL; 3) death unless orthotopic liver transplantation is performed
(Corpechot et al., 2005; Hirschfield et al., 2017).
The survival of patients with PBC has been shown in multiple populations to be poorer than the
age- and sex-matched population (Corpechot et al., 2005; Krzeski et al., 1999; Myers et al.,

19
2009; M. Prince et al., 2002; ter Borg et al., 2006). In a UK study of 930 people with PBC whose
survival was compared to 9202 controls, there was a 2.7-fold increase in adjusted mortality for
the PBC cohort compared to the general population (Jackson et al., 2007). A study from
Northeast England reported the standard mortality ratio (SMR) of prevalent cases between 1987
and 1994 with PBC to be 2.87, and the 10-year survival to be 45% (M. Prince et al., 2002).
Although the majority of deaths are expected to be due to liver disease, a significant proportion
of mortality in these patients was a result of non-liver related deaths (SMR=1.73 when excluded
liver-related deaths), which suggests that PBC patients may be at an increased risk of death from
causes not directly related to the development of advanced liver disease (M. Prince et al., 2002).
A Canadian population-based study of patients diagnosed between 1996 and 2002 reported the
same SMR of 2.87, but reported that the 10-year transplant-free survival rate was 68% (Myers et
al., 2009).
Treatment with UDCA is expected to have an impact on survival since these patients show a less
pronounced increase in mortality with a probability of survival of 65% at 20 years (Floreani et
al., 2011; Jackson et al., 2007). However, the transplant-free survival of UDCA-treated patients
remains lower than an age- and sex-matched control (Corpechot et al., 2008). Some UDCA-
treated patients may still progress toward cirrhosis and end-stage liver disease, as the incidence
of cirrhosis after 5 years from stages I-III was 4%, 12%, and 59%, respectively (Corpechot,
Carrat, Poupon, & Poupon, 2002). Nonetheless, a similar survival to the control population may
be achieved if UDCA is given at early histological stages (I or II) (Corpechot et al., 2005).
1.9 Complications
1.9.1 Osteoporosis Osteoporosis is a progressive systemic skeletal disease whose main features include low bone
mass and deterioration of bone tissues. Although elderly women are naturally prone to
osteoporosis, untreated women with PBC have been shown to lose bone mass at double the rate
compared to age- and sex-matched controls (Mounach et al., 2008). Furthermore, they have an
increased risk for developing osteoporosis as well as a 2-fold increase in the risk for any type of
fracture (Mounach et al., 2008; Solaymani-Dodaran, Card, Aithal, & West, 2006). The
prevalence of osteoporosis was 51.5% in PBC vs 22.7% in a healthy control group (Mounach et

20
al., 2008). Osteoporosis has the potential to greatly impact morbidity, quality of life and even
survival of patient because they are more susceptible to spontaneous or low-trauma fracturing
due to bone fragility.
1.9.2 Portal hypertension
About a third of patients with PBC will develop portal hypertension, which can manifest into
esophageal varices. In a prospective study that screened 265 patients annually for esophageal
varices by endoscopy for a median of 5.6 years, 31% developed esophageal varices, of whom
48% experienced one or more episodes of bleeding (Gores et al., 1989). In another study, portal
hypertension was associated with the development of esophageal varices in up to 35% of patients
during a 4-year period (K D Lindor, Jorgensen, Therneau, Malinchoc, & Dickson, 1997).
Although the use of beta blockers can reduce the risk of the first occurrence of variceal bleeding
and subsequent episodes, the development of esophageal varices is associated with a higher
mortality risk and thus, patients at risk should be closely monitored (Angulo, Lindor, et al., 1999;
Floreani et al., 2011; Gores et al., 1989).
A platelet count of less than 140,000 cu mm and a Mayo risk score ≥4.5 have been reported to be
independent predictors of the development of varices (Levy et al., 2007). After developing
varices, 1- and 3-year survival estimates have been reported to be 83% and 59%, respectively
(Gores et al., 1989).
Portal hypertension can occur even during early stages of disease as a result of significant portal
tract inflammation causing portal venous compression, perisinusoidal fibrosis, and nodular
regenerative hyperplasia. However, they are most common in cirrhotic patients, of whom 50%
are affected by this complication and have a 2-15% annual incidence of bleeding (D’Amico &
Luca, 1997).
Other complications include ascites, the retention of fluid in the abdomen as a result of sodium
retention, and hepatic encephalopathy, a reversible state in which cognitive function is impaired
(Krige & Beckingham, 2001).

21
1.9.3 HCC
One of the least common complications of PBC is the development of hepatocellular carcinoma
(HCC), which affects 0.7-3.6% of patients followed for 3.6-6.8 years (Shibuya et al., 2002; A.
Suzuki et al., 2007). Patients with an advanced histological disease are affected at higher rates of
5.9%-11.1% and therefore HCC surveillance is recommended in patients with cirrhosis (Deutsch,
Papatheodoridis, Tzakou, & Hadziyannis, 2008; Shibuya et al., 2002; Silveira, Suzuki, & Lindor,
2008; A. Suzuki et al., 2007). Older age, male sex, history of blood transfusions, and any signs of
portal hypertension have been associated with the development of HCC (Shibuya et al., 2002; A.
Suzuki et al., 2007; Trivedi et al., 2016). Although UDCA treatment is not associated with HCC
development, non-response to UDCA treatment has been described as a significant predictor for
HCC development (E. M. M. Kuiper, Hansen, Adang, et al., 2010; Trivedi et al., 2016). The
impact of HCC on survival is unclear since an earlier study suggested that HCC was not
associated with survival, however, HCC development has been recently associated with worse
transplant-free survival and overall survival in a globally representative cohort (Shibuya et al.,
2002; Trivedi et al., 2016).
1.9.4 Extrahepatic malignancies
Patients with PBC also tend to be at an increased risk for extrahepatic malignancies that exceeds
the risk for HCC development (Deutsch et al., 2008; Liang, Yang, & Zhong, 2012). In a study of
Greek patients, 10.8% had malignancies, of which 3.8% were attributed to HCC and 7% were
extrahepatic malignancies. The 10-year risk for HCC and extrahepatic malignancies was 4% and
13%, respectively (Deutsch et al., 2008).
1.9.5 Fat-soluble vitamin malabsorption
Deficiencies in fat-soluble vitamins, such as A, D, E, K have been well documented in patients
with PBC (Muñoz, Heubi, Balistreri, & Maddrey, 1989; Phillips, Angulo, Petterson, & Lindor,
2001). Due to cholestasis, an inadequate quantity of bile salts is delivered to the intestinal
lumen and therefore results in fat-soluble vitamin malabsorption and deficiency
(Phillips et al., 2001). The mechanism of vitamin E deficiency is related to gastrointestinal
malabsorption of vitamin D (Muñoz et al., 1989). The proportion of patients with vitamin A, D,

22
E, K deficiency was reported as 33.5%, 13.2%, 1.9%, and 7.8%, respectively (Phillips et al.,
2001).
1.10 Treatment
1.10.1 Ursodeoxycholic acid
The standard treatment for PBC is UDCA, which is required as life-long treatment (U. Leuschner
et al., 1989). UDCA (3α, 7β-dihydroxy-5β-cholanic cid) is normally found endogenously but
makes up only 3% of the total bile acid pool (Paumgartner & Beuers, 2002). The off-label use of
UDCA began in the late 1980s, as suggested in a study that reported that all patients that were
diagnosed from 1988 onward were all treated with UDCA (Floreani et al., 2011). However,
UDCA did not gain Food and Drug Administration (FDA) approval until 1997. The dosage of
UDCA administered is important and dosages of 13-15mg/kg per are normally recommended. A
comparison of 3 dosages (5-7mg/kg, 13-15mg/kg, and 23-25mg/kg) showed that UDCA dosages
of 13-15mg/kg and 23-25mg/kg yield greater improvements in ALP, AST, and Mayo scores
when compared to the low dosage. However, the high dose group was not superior to the
standard dose group of 13-15mg/kg (Angulo, Dickson, et al., 1999). Furthermore, in a Dutch
study that assessed the treatment regimen of UDCA, inappropriate dosages at a median of
9.33mg/kg were mostly administered to patients diagnosed before 1999 (Lammers et al., 2016).
35% of non-responders that were initially given inappropriate dosages and in whom the dosage
was increased became responders after 2 years from the dosage change.
Several large randomized, double-blind, placebo-controlled trials have consistently shown that
UDCA improves liver biochemistry parameters, such as ALP, AST, ALT, bilirubin, cholesterol
and IgM, as early as 3 months from the start of treatment (Battezzati et al., 1993; Heathcote et
al., 1994; K. D. Lindor et al., 1994; R. E. Poupon, Poupon, & Balkau, 1994). In the Canadian
multicenter trial of 222 patients treated with 14mg/kg for 2 years, UDCA was shown to improve
some histological features, but did not have an impact on symptoms, liver transplantation, or
death (Heathcote et al., 1994). In the French multicenter trial of patients treated with UDCA at a
dosage of 13-15mg/kg for 4 years, three endpoints were evaluated: 1) progression as defined by
hyperbilirubinemia, ascites, variceal bleeding, or encephalopathy; 2) liver transplantation or
referral; and 3) transplant-free survival. This study showed that long-term UDCA slows

23
progression and reduces the need for liver transplantation (R. E. Poupon et al., 1994). The
American trial reported that UDCA delayed progression of disease, but failed to show an effect
on symptoms, histology, and liver transplantation or survival (K. D. Lindor et al., 1994). The
inconsistency in survival benefit results led to a combined analysis of data from these three trials
to determine the effect of UDCA after 4 years of treatment. The study concluded that long-term
UDCA improves transplant-free survival in patients with moderate or severe disease, as defined
with bilirubin 1.4-3.5mg/dL or >3.5mg/dL, and histological stage IV (R. E. Poupon et al., 1997).
Although some studies have reported that UDCA does not have an impact on liver
transplantation or death, multiple studies have confirmed the beneficial effect of UDCA on liver
transplantation and survival (K. D. Lindor, Therneau, Jorgensen, Malinchoc, & Dickson, 1996;
Parés et al., 2000; R. E. Poupon, Bonnand, Chrétien, & Poupon, 1999; Shi et al., 2006).
UDCA delays histological progression, particularly in those with early stage PBC (Parés et al.,
2000; Shi et al., 2006). Additionally, UDCA has been shown to reduce the risk of developing
esophageal varices in patients with PBC, as the 4-year risk for developing new varices was 16%
with UDCA and 58% in the placebo group (K. D. Lindor et al., 1997). Conversely, a meta-
analysis reported that UDCA does not seem to exert any significant effects on pruritus and
fatigue (Shi et al., 2006).
1.10.1.1 Mechanism of action of UDCA
In PBC, there is impaired hepatic clearance of bile acids, which leads to the accumulation of
endogenous hydrophobic bile acids in the liver and serum. The accumulation of bile acids in the
liver can lead to hepatocellular toxicity. Although a clear mechanism of action for UDCA is
unclear, it is likely multifactorial and experimental evidence suggests that there are three major
mechanisms of action that can be attributed to UDCA. First, UDCA protects cholangiocytes
against the cytotoxicity of hydrophobic bile acids by reducing the cytotoxicity of bile and
possibly reducing the concentration of hydrophobic bile acids in cholangiocytes (Paumgartner &
Beuers, 2002). UDCA has fewer hepatotoxic properties compared to endogenous bile acids and
treatment with UDCA leads to this hydrophilic acid becoming the predominant bile acid in the
pool (40-50%), while endogenous bile acids such as cholic acid are decreased, thus increasing
the degree of hydrophilicity of the bile acid pool (Crosignani et al., 1991; U. Leuschner et al.,

24
1989; K. D. Lindor et al., 1994; Stiehl et al., 1990). Second, UDCA can stimulate hepatobiliary
secretion. Third, it can prevent bile acid-induced apoptosis of hepatocytes by inhibiting the
mitochondrial membrane permeability transition (MMPT), and possibly stimulating the survival
pathway (Paumgartner & Beuers, 2002). Lastly, UDCA has been shown to decrease HLA class I
display by hepatocytes and reduce inflammatory cytokine production (K. Lindor, 2007; K. D.
Lindor et al., 1994).
1.10.1.2 Response to UDCA
UDCA has an impact on liver biochemistry, thus biochemical response based on liver
biochemistry can be a useful tool for the prediction of long-term outcomes. There have been
several criteria developed on the basis of liver biochemistry to determine response to treatment.
The Barcelona criteria was defined as an ALP decrease greater than 40% of baseline values or
normal levels after 1 year of treatment. Patients who met these criteria were considered
responders and had a survival similar to that of the control population, but survival differed in
non-responders (Parés, Caballería, & Rodés, 2006).
Paris-I response was established as ALP ≤3×ULN, AST ≤2×ULN, and bilirubin ≤1mg/dL after 1
year. Patients that met these criteria had improved survival and a 1-year transplant-free survival
rate of 90%, as compared to 51% in non-responders. Paris-I criteria showed to be superior than
Barcelona criteria in discriminating patient survival in this cohort, as Barcelona responders had a
1-year survival of 79% and 53% for non-responders (Corpechot et al., 2008). An absence of
response according to Paris-I criteria was an independent predictor of death or liver
transplantation, independent of other baseline predictive factors such as bilirubin, histologic
stage, and interface hepatitis. Sex and age have been reported to be independent predictors for
response to UDCA according to Paris-I criteria, in which men and younger patients are less
likely to respond to treatment (Carbone et al., 2013).
The Rotterdam criteria for response was based on changes in bilirubin and albumin after
treatment with UDCA. Response was defined as normal bilirubin and albumin after 1 year of
treatment, given one of these parameters was abnormal or both were abnormal at study entry (E.
M. Kuiper et al., 2009).

25
The Toronto criteria was established based on the risk for progressive liver damage. Histological
progression by a one-stage increase during extended follow-up was associated with an absence in
response when defined as ALP>1.67×ULN after 2 years. Additionally, a two-stage increase was
associated with an absence in response when defined as ALP>1.76×ULN after 2 years (Kumagi
et al., 2010).
Distinct response criteria were established for patients with an early histological stage or when
early PBC was defined as normal albumin and bilirubin. The best criteria in these patients,
named Paris-II, was determined as ALP≤1.5×ULN, AST≤1.5×ULN, and normal bilirubin after 1
year of treatment (Corpechot, Chazouillères, & Poupon, 2011).
Although the majority of the criteria were initially established to be determined at 1 year, with
the exception of Toronto criteria, it has been suggested that response can be applied at 6 months.
In a Chinese population, response at 6 months showed the same or higher positive predictive
value, as well as similar negative predictive values when compared to response at 1 year (Zhang
et al., 2013). These findings are important because an earlier determination of response would
allow earlier identification of patients in need of additional therapies.
Table 1-1. Various response criteria to UDCA for PBC
Response Response criteria
Barcelona (Parés et al., 2006) ALP decrease > 40% baseline values or normal levels
after 1 year of treatment
Paris-I (Corpechot et al., 2008) ALP ≤3×ULN, AST≤2×ULN, and bilirubin ≤1mg/dL
after 1 year of treatment
Rotterdam (E. M. Kuiper et al.,
2009)
Normal bilirubin and albumin after 1 year of treatment,
given one of these parameters was abnormal or both
were abnormal at baseline
Toronto (Kumagi et al., 2010) ALP<1.67×ULN after 2 years of treatment
Paris-II (Corpechot et al., 2011) ALP≤1.5×ULN, AST≤1.5×ULN, and normal bilirubin
after 1 year of treatment

26
1.10.2 Adjuvant therapies
Although UDCA is effective at reducing liver biochemistry and delaying histological
progression, 30-40% of patients still do not respond to UDCA and are at risk for complications
of PBC. Therefore, there is still a need for adjuvant therapies to UDCA for the treatment of PBC.
1.10.2.1 Obeticholic acid
Farnesoid X receptor (FXR) is a nuclear hormone receptor that regulates the expression of genes
involved in bile acids homeostasis, of which the most potent endogenous FXR agonist is
chenodeoxycholic acid (Pellicciari et al., 2002). Obeticholic acid (OCA) is a semi-synthetic
analogue of chenodeoxycholic acid that selectively activates FXR, however, it exerts a 100×
greater potency in the activation of FXR compared to chenodeoxycholic acid (Pellicciari et al.,
2002). OCA gained FDA approval in 2016 and has been the first therapeutic agent to gain FDA
approval for the treatment of PBC since the introduction of UDCA. The results from the PBC
OCA International Study of Efficacy (POISE) phase III trial, a 12-month, double-blind trial,
were pivotal for its approval (Nevens et al., 2016). This study assessed the efficacy of OCA as
monotherapy or as adjuvant therapy to UDCA in 216 patients that had an inadequate response to
UDCA monotherapy. It included patients whose ALP was ≥1.67×ULN or whose bilirubin was
abnormal. Three groups, corresponding to placebo, 5-10mg, and 10mg were compared. The end-
point was a composite of ALP <1.67×ULN and normal bilirubin with an ALP reduction of at
least 15% from baseline. The end-point was reached at similar rates for the 5mg and 5-10mg
groups (46% and 47%) yet was only achieved in 10% of patients receiving placebo. One
common side effect of OCA is pruritus and appears to be dose-dependent (Hirschfield et al.,
2015; Nevens et al., 2016). The long-term survival benefit of OCA remains to be determined.
1.10.2.2 Fibrates
Fibrates represent another agent with therapeutic potential in PBC that act as ligands for the
nuclear receptor peroxisome proliferator-activated receptor (PPAR), which exists in three
isoforms: PPARα, PPARγ, and PPARβ/δ (Tyagi, Gupta, Saini, Kaushal, & Sharma, 2011).
Bezafibrate is a non-selective PPAR-agonist that has recently shown favorable results in the first
large, randomized controlled trial to assess the efficacy of bezafibrate as adjuvant therapy to
UDCA. Patients without response to UDCA according to Paris-II criteria were randomized to

27
receive bezafibrate at 400mg/day or placebo. Out of the patients whom received bezafibrate,
30% achieved normalization of ALP, bilirubin, aminotransferases, albumin, and PT after 2 years,
while 67% of patients achieved ALP normalization. Conversely, none of the patients in the
placebo group achieved normalization of any of the biochemical parameters. Furthermore, it was
shown to improve pruritus and prevent the progression of liver stiffness (Corpechot et al., 2017).
1.10.2.3 Immunosuppressive agents
Due to the presumed autoimmune nature of PBC, several immunosuppressants and
immunomodulatory agents have been evaluated for the treatment of PBC, most of which were
tested in addition to UDCA. Randomized controlled trials have been conducted for methotrexate
(Combes et al., 2005), cyclosporine (Wiesner et al., 1990), colchicine (Almasio et al., 2000),
azathioprine (Gong, Christensen, & Gluud, 2007), and corticosteroids (M. Leuschner et al.,
1996). However, these trials have not been successful, as either the therapeutic agents led to
major side effects or did not show efficacy at improving liver biochemistry, histology, or
survival. For example, the addition of methotrexate to patients already receiving UDCA for 48
weeks led to toxicity and was not associated with added benefit in terms of symptoms,
biochemistry, or histology (González-Koch, Brahm, Antezana, Smok, & Cumsille, 1997).
1.11 Predictors of Prognosis Since PBC is a slowly progressing disease, predictors of prognosis are essential to assess disease
progression and predict survival of patients, and thus have been extensively studied in the
literature. These can be used to determine the optimal time of referral for liver transplantation,
when a patient requires additional therapies, and as end-points in clinical trials (Mayo et al.,
2008). Liver biopsy was previously regarded as the only reliable means to assess prognosis in
all stages of disease. Indeed, an advanced histological stage has consistently been associated
with an increased risk for liver transplantation or death (Christensen et al., 1980; Floreani et al.,
2011; Mahl et al., 1994; Trivedi et al., 2014). However, there has been an increased emphasis on
non-invasive surrogate markers because they can be easily attained, performed frequently, and
do not pose the same risks as liver biopsies.

28
Bilirubin has been established as a main predictor of prognosis prior to the introduction of
UDCA. In untreated patients, a rapid rise in bilirubin was consistently observed prior to a
patient’s death (Shapiro, Smith, & Schaffner, 1979). The prognostic value of bilirubin is
maintained in treated patients and treated patients who had normalization of bilirubin had
improved survival (Bonnand, Heathcote, Lindor, & Poupon, 1999). Elevated bilirubin has been
consistently associated with an increased risk for liver transplantation or death (Christensen et
al., 1980; Lammers et al., 2014; R. E. Poupon et al., 1994; Trivedi et al., 2014). Out of multiple
thresholds, the optimal threshold of bilirubin for determining risk of liver transplantation and
death has been established to be 1×ULN (Lammers et al., 2014).
Another liver parameter associated with transplant-free survival is ALP, in which ALP <2×ULN
was found to correlate with transplant-free survival, independent of time. Furthermore, absolute
levels of ALP after 1 year predict transplant-free survival better than a percentage change. A
combination of ALP and bilirubin increases the predictive value of these biochemical parameters
(Lammers et al., 2014). Additional biochemical factors associated with improved prognosis have
been AAR and APRI. An AAR ≤2 is associated with improved prognosis, while APRI>0.54 is
associated with worse prognosis (Su et al., 2009; Trivedi et al., 2014).
Demographic factors such as age and sex are also associated with prognosis in PBC patients, in
which male sex and older age at diagnosis are independently associated with increased mortality
(Mahl et al., 1994; Myers et al., 2009). The impact of age on mortality, however, is different
when comparing that of PBC patients to a general population. In a study of asymptomatic
patients, although the mortality rate of elderly patients above 55 years old was higher than that of
younger patients, it was not different from an age- and gender-matched population (Kubota et al.,
2009). This was attributed to an excess of deaths due to other causes in the elderly, particularly
malignancies, while younger patients were more likely to die as a result of liver failure (Kubota
et al., 2009).
1.11.1 Prognostic models
Several prognostic models have been developed for PBC to predict survival. The Mayo model is
one of the earliest prognostic models developed to predict survival and was cross-validated in
various populations. It was derived from 312 untreated patients seen at the Mayo clinic from

29
1974 to 1984 and includes age, serum bilirubin, albumin, PT, and severity of edema to estimate
survival up to 7 years (Dickson, Grambsch, Fleming, Fisher, & Langworthy, 1989). It was
subsequently updated to predict short-term survival at 2 years at any time during disease from
variables measured at the latest patient visit (Murtaugh et al., 1994). Some more recent models
include the UK-PBC risk score and the GLOBE score. The UK-PBC research group derived a
prognostic model to predict 5-, 10-, and 15-year survival in 1916 UDCA-treated patients that was
then validated in 1249 patients, namely the UK-PBC risk score. This model includes albumin
and platelet count from baseline, and bilirubin, transaminases, and ALP after 1 year of UDCA
therapy (Carbone et al., 2016). The GLOBE score was developed in a globally representative
population of 4119 UDCA-treated patients to predict whether the transplant-free survival of
patients with PBC differs from that of a control population. The model includes age, bilirubin,
albumin, ALP, and platelet count collected at 1 year (equation 1). However, it can also be used
with values collected from 2-5 years. The GLOBE score can be used as response criteria when
comparing it to age-specific thresholds. If the GLOBE score surpasses the age-specific threshold,
the patient is considered a non-responder and their survival deviates from that of the general
population. The age groups <45, 45-52, 52-58, 58-66, and >66 years are linked with the age-
specific GLOBE score thresholds of -0.52, 0.01, 0.60, 1.01 and 1.69, respectively. Indeed, the
GLOBE score showed to be superior in the discrimination of patients at risk for liver
transplantation or death when compared to Barcelona, Paris-I, Rotterdam, Toronto, and Paris-II
criteria (Lammers et al., 2015). These GLOBE score was validated and proved to be accurate
prognostic predictors in a Chinese population of PBC patients (Yang et al., 2017).
Equation 1: GLOBE score calculation
0.044378 × age at the start of UDCA therapy + 0.93982 × LN(bilirubin [×ULN] at 1 year of
follow-up) + 0.335648 × LN(ALP [×ULN] at 1 year of follow-up) – 2.266708 × albumin
(×LLN) at 1 year of follow-up – 0.002581 × platelet count (×109/L) at 1 year of follow-up +
1.216865.

30
1.12 Liver Transplantation Liver transplantation is the sole treatment option in patients with end-stage PBC and grants
improved patient survival and quality of life (Hubscher et al., 1993; Markus et al., 1989). The
survival rates at 1, 5, and 10 years after liver transplantation from a center in the UK have been
reported to be 83%, 78%, and 67% (Liermann Garcia, Evangelista Garcia, McMaster, &
Neuberger, 2001). The disease severity of PBC prior to liver transplantation also seems to have
an impact on survival post-transplantation, as the survival of patients with an earlier disease
stage has been reported to be 88% at 5 years (W. R. Kim et al., 1998). The status of patients at
the time of transplantation seem to have improved over time as indicated by lower ALP and
bilirubin levels, and less advanced disease stage (E. M. M. Kuiper, Hansen, Metselaar, et al.,
2010; Liermann Garcia et al., 2001). Furthermore, liver transplantations have been conducted at
increasingly succeeding rates because there have been improvements in rejection rates and the
management of complications after liver transplantation, such as acute rejection and infections
(W. R. Kim et al., 1998).
These findings suggest that patients who undergo liver transplantation for PBC nowadays have a
good prognosis. However, the proportion and absolute number of patients who are transplanted
for PBC has reportedly decreased in the US and Europe, which indicates a reduced
transplantation burden for PBC (E. M. M. Kuiper, Hansen, Metselaar, et al., 2010; Lee et al.,
2007; Liermann Garcia et al., 2001). In a single center from the UK, the proportion of patients
grafted for PBC has decreased from 35% in 1990 to 21% in 1999 (Liermann Garcia et al., 2001).
In the US, the number of absolute liver transplantations for PBC has decreased an average of 5.4
cases per year from 1995 to 2006 despite an average increase of 249 transplants per year.
Meanwhile, the number of transplantation for PSC in the US did not change (Lee et al., 2007).
Indications for liver transplantation include liver failure, complications of cirrhosis, rising
bilirubin above 3-5mg/dL, model for end-stage liver disease (MELD) score above 15, and poor
quality of life due to intractable lethargy or pruritus (Hirschfield et al., 2017; Liermann Garcia et
al., 2001). There seems to be a trend towards considering transplantation in those without end-
stage liver disease but who experience intractable symptoms (Pells et al., 2013). Although liver

31
transplantation may be beneficial for pruritus, its impact on systemic symptoms such as fatigue
and cognitive impairment may be limited (Pells et al., 2013).
1.12.1 Recurrence of PBC after liver transplantation
There is evidence to indicate that recurrent PBC is possible, in which the diagnosis is made on
the basis of histological features consistent with a florid duct lesion (Hubscher et al., 1993;
Liermann Garcia et al., 2001; Sylvestre, Batts, Burgart, Poterucha, & Wiesner, 2003).
Histological evidence is required to diagnose recurrent PBC because AMA persists after liver
transplantation and liver biochemistry may be normal (Hirschfield et al., 2017). Recurrence rates
have been variable. In an early study, 8% of patients were diagnosed with recurrent PBC 2-6
years after liver transplantation despite treatment with an immunosuppression regimen that
included cyclosporine, prednisone, and azathioprine (Hubscher et al., 1993). In a UK study,
recurrent PBC was found in 17% of patients at a mean time of 36 months (Liermann Garcia et
al., 2001). The Mayo clinic reported the same recurrence rate of 17% in their population with a
mean time to recurrence of 3.7 years (Sylvestre et al., 2003). Furthermore, a study that included
patients from French and Swiss centers from 1988 to 2010 reported recurrence rates of 53% and
demonstrated that recurrent PBC can be progressive, as 15% of patients progressed to cirrhosis
(Bosch et al., 2015). Although these studies suggest that recurrence of PBC is not uncommon, its
diagnosis does not seem to have a significant impact on re-transplantation or survival (Bosch et
al., 2015; Charatcharoenwitthaya et al., 2007).
Pre- and post-transplantation factors that may be able to predict recurrence of PBC have been
evaluated, but the only risk factor reported has been the use of tracolimus, a calcineurin inhibitor
used in the immunosuppressive regimen after liver transplantation (Liermann Garcia et al.,
2001). Whereas, preventative UDCA has been associated with a decreased risk of recurrence
(Bosch et al., 2015).
1.13 Trends in PBC Although limited, there have been some studies on the temporal trends for PBC. One study from
Finland reported trends over a 12-year period and compared four 3-year periods (1988-1990,
1991-1993, 1994-1997, 1997-1999). They reported no difference in the proportion of male to

32
female patients or median age of the population. However, they suggested there was an
improvement in survival, and the hazard ratio (HR) for all-cause mortality per a 10-year increase
in year of diagnosis was 0.6 (Rautiainen et al., 2007). A Canadian study that evaluated patients
diagnosed from 1996 to 2002 did not find the year of diagnosis was a significant predictor for
mortality (Myers et al., 2009). In a Japanese population of symptomatic patients from 1999 to
2004, there was no change in the male to female ratio (9:1), yet they noted an increase in
median age from 59 years in 1999 to 63 years in 2004, and a decrease in bilirubin, GGT, total
cholesterol and IgM levels (Sakauchi et al., 2007). Interestingly, other autoimmune diseases
were more frequently observed in 2004. A study from Iceland reported a decrease in the
proportion of symptomatic patients at diagnosis from 57% in 1991-2000 to 36% 2001-2010 but
did not find a difference in the proportion of patients who present with an advanced histological
stage (III-IV), whom accounted for 28% (T. R. Baldursdottir et al., 2012).

33
Chapter 2
2 Aims and hypothesis
2.1 Study 1: Calendar Time Trends
2.1.1 Aims
The aim of the first study is to describe the temporal trends in patient and disease characteristics
at presentation with PBC as well as the treatment regimen and clinical outcomes of patients
diagnosed from 1970 to 2014 in a globally representative population. The following time cohorts
with respect to year of diagnosis will be compared: 1970-1979, 1980-1989, 1990-1999, 2000-
2009, and ≥2010. In order to determine whether the natural history of PBC has changed, we will
evaluate whether there have been changes in age at diagnosis, female: male ratio, AMA
serological status, histological stage, and biochemical stage. In addition, changes in treatment
regimen will be assessed in terms of use of UDCA, dosage, and time from diagnosis to the start
of treatment. Response to UDCA will also be assessed. Lastly, to determine whether clinical
outcomes have improved in recent decades, we will examine hepatic decompensation, HCC, and
transplant-free survival rates over the respective time cohorts. Overall, these specific research
questions will aid in determining whether the natural history of PBC has changed over the course
of multiple decades and suggest putative factors that may play a role.
2.1.2 Hypothesis
We hypothesize that the natural history of patients diagnosed in earlier decades is significantly
different from those presenting in more recent decades, consistent with a milder disease stage at
presentation. Furthermore, we hypothesize that recent decades are associated with an improved
treatment regimen and a decrease in clinical outcomes.
2.1.3 Rationale for hypothesis
There have been multiple studies reporting an increase in prevalence of PBC. Furthermore, the
proportion of asymptomatic patients has increased, and the number of liver transplantations
conducted for PBC over the years has decreased. These previous findings collectively suggest
that PBC is being readily detected at increased rates and more importantly at an earlier stage
before symptoms commence. These observations can be attributed to an increased awareness of

34
PBC by physicians and more sensitive and readily available AMA testing. The decrease in liver
transplantations indicates that there has been an improvement in the prognosis of patients with
PBC.
2.2 Study 2: Bilirubin Within the Normal Range
2.2.1 Aims
The aim of the second study is to determine whether bilirubin within the normal range is
predictive of transplant-free survival and if attaining bilirubin levels below the upper limit of
normal yields additional benefit for patients. Therefore, we will first evaluate whether bilirubin
quartiles are associated with distinct transplant-free survival rates. If so, our aim is to establish
the optimal threshold of bilirubin with the best performance in predicting liver transplantation or
death. To validate and confirm the predictive ability of the bilirubin threshold, it will be tested in
various subgroups and at multiple time points.
2.2.2 Hypothesis
We hypothesize that bilirubin levels below the upper limit of normal can be used to predict the
risk for liver transplantation or death in patients with PBC.
2.2.3 Rationale for hypothesis
Bilirubin is one of the strongest predictors for transplant-free survival. Although bilirubin is not
markedly elevated until later stages of disease, minimal changes in bilirubin may be associated
with prognosis. It seems that the majority of patients, even those who are included in clinical
trials to receive additional therapy, have normal bilirubin, as only 6-10% of patients included in
the OCA trial had abnormal bilirubin levels (Nevens et al., 2016). Furthermore, OCA was found
to further decrease their bilirubin even if within the normal range.
In a healthy population from the United States, the modal bilirubin value was 0.4mg/dL (Zucker,
Horn, & Sherman, 2004). Although the ULN for bilirubin varies by laboratory, most are
determined to be from 1.0-1.2mg/dL (Levitt & Levitt, 2014). Therefore, to reach the ULN, an
increase of approximately 0.6-0.8mg/dL in total bilirubin primarily driven by conjugated

35
bilirubin would be required. This suggests a large increase before abnormal bilirubin is detected
and thus the ULN may not be a sensitive way to determine absence in risk for a poor outcome.

36
Chapter 3 : Study 1
Milder Disease Stage in Patients with Primary Biliary 3Cholangitis Over a 44-Year Period: A Changing Natural History
The contents in this chapter have been published:
Murillo Perez, C. F., Goet, J. C., Lammers, W. J., Gulamhusein, A., van Buuren, H. R.,
Ponsioen, C. Y., …. Hansen, B. E. (2018). Milder disease stage in patients with primary biliary
cholangitis over a 44-year period: A changing natural history. Hepatology, 67(5), 1920–1930.
3.1 Introduction Primary biliary cholangitis (PBC) is a chronic autoimmune liver disease characterized by
inflammation and destruction of the small intralobular bile ducts (Kaplan & Gershwin, 2005; K.
D. Lindor et al., 2009; R. Poupon, 2010). The disease mainly affects middle-aged women and
has a slow, progressive course that may lead to fibrosis, cirrhosis, and liver failure requiring liver
transplantation. The standard treatment for PBC is ursodeoxycholic acid (UDCA) as its long-
term use improves liver biochemistry, delays histological progression, and may improve
transplant-free survival (Corpechot et al., 2002; R. E. Poupon et al., 1997; Pratt, 2016). However,
up to 40% of patients can have an inadequate response to UDCA that is associated with reduced
transplant-free survival (Corpechot et al., 2008; E. M. Kuiper et al., 2009; Parés et al., 2006;
Pratt, 2016).
PBC is a rare disease with multiple studies reporting an increase in its incidence and prevalence
in recent years (Boonstra et al., 2012, 2014; Eriksson & Lindgren, 1984; James et al., 1999;
Metcalf, Bhopal, Gray, Howel, & James, 1997; Myers et al., 2009; Myszor & James, 1990; Pla et
al., 2007; Remmel, Remmel, Uibo, & Salupere, 1995). In a systematic review conducted by
Boonstra et al. (2012) the incidence of PBC varied from 0.33 to 5.8 per 100,000/year, yet its
temporal trends are conflicting as some studies suggest an increase (Boonstra et al., 2014;
Metcalf et al., 1997) while others do not substantiate this finding (T. R. Baldursdottir et al., 2012;
McNally et al., 2014). The prevalence ranged from 1.91 to 40.2 per 100,000 and all investigated
studies reported an increase (Boonstra et al., 2012). An increase in prevalence impacts how PBC
contributes to the health care system and may be a result of multiple societal and disease factors.

37
It is important to note that initial reports of an increasing prevalence began during the off-label
use of UDCA period, which suggests that the increased prevalence in the UDCA-era may be due
to prolonged survival (James et al., 1999; Metcalf et al., 1997; Myszor & James, 1990).
Correspondingly, the absolute number of liver transplantations for PBC has decreased in Europe
and the United States since the introduction of UDCA in the early 1990s (Gross & Odin, 2008;
Hirschfield et al., 2015; E. M. Kuiper et al., 2009; Lee et al., 2007; K. D. Lindor et al., 2009).
In addition to epidemiological changes, the clinical presentation of PBC has also changed over
the years. Whereas most patients presented with an advanced histological stage in earlier
decades, nowadays most patients present during an asymptomatic stage (Christensen et al., 1980;
Locke et al., 1996). Therefore, the underlying assumption that PBC, as a disease, is a static entity
may not be accurate. We used a representative large cohort of patients with PBC to assess how
disease presentation and prognosis have changed over the last nearly 50 years. In doing so, we
provide long-term insight into the changing nature of PBC in clinical practice.
3.2 Patients and Methods
3.2.1 Population and study design
This was a retrospective study based on patient data retrieved from the Global PBC Study Group
database, of which characteristics have been described in previous publications (Lammers et al.,
2015, 2014). The database comprises long-term follow-up cohorts from 17 centers across North
America and Europe. UDCA-treated and non-treated patients aged ≥18 with an established PBC
diagnosis from 1970 to 2014, according to internationally accepted guidelines, were included in
the study (Hirschfield et al., 2017; K. D. Lindor et al., 2009; Nguyen, Juran, & Lazaridis, 2010).
Patients with either a short follow-up (<6 months), an unknown date of important clinical events,
an overlap syndrome, or another concomitant liver disease were excluded. Completeness and
accuracy of the database was established through visits to individual centers. This study was
conducted in accordance with the 1975 Declaration of Helsinki. The protocol was approved by
the institutional research board of the corresponding center and at all participating centers as per
local regulations.

38
3.2.2 Data collection
In the established database, study entry (baseline) was the date of UDCA therapy initiation or the
date of the first visit for non-treated patients. The following demographic and clinical data were
available at study entry: sex, date of birth, date of diagnosis, anti-mitochondrial antibody (AMA)
serological status, liver histology, biochemical disease stage, and UDCA therapy (if received and
dosage). In addition, the following laboratory values were available at study entry and every 6-12
months until the end of follow-up: alkaline phosphatase, aspartate aminotransferase, alanine
aminotransferase, total bilirubin, albumin, and platelet count. Histology was considered if the
liver biopsy was completed within 24 months of diagnosis date and dichotomized according to
Ludwig et al. (Ludwig et al., 1978) and Scheuer’s (Scheuer, 1967) classification; specifically, as
mild (stage I and II) and advanced (stage III and IV). The Rotterdam criteria were used to
determine patients’ biochemical stage. According to these criteria, mild stage is defined as
normal bilirubin and albumin, moderate stage is defined as abnormal bilirubin or albumin, and
advanced stage is defined as abnormal bilirubin and albumin (E. M. Kuiper et al., 2009; ter Borg
et al., 2006). Baseline aspartate aminotransferase/platelet ratio index, an independent predictor of
transplant-free survival, was calculated to stratify patients at risk of liver transplantation and
death based on a threshold of 0.54 (Trivedi et al., 2014). The first occurrence of hepatic
decompensation (ascites, variceal bleeding, or hepatic encephalopathy), hepatocellular
carcinoma (HCC), liver transplantation, or all-cause mortality were also retrieved.
In patients that received therapy, biochemical response to UDCA was determined according to
Barcelona (Parés et al., 2006), Paris-I (Corpechot et al., 2008), Rotterdam (E. M. Kuiper et al.,
2009), Toronto (Kumagi et al., 2010), and Paris-II criteria (Corpechot et al., 2011). In addition,
the GLOBE score was compared to age-specific thresholds to determine UDCA-response
(Lammers et al., 2015). Patients were considered responders if their GLOBE score did not
surpass their age-specific threshold.
3.2.3 Statistical analysis
Patients diagnosed between 1970 and 2014 were divided into five cohorts according to their year
of diagnosis: 1970-1979, 1980-1989, 1990-1999, 2000-2009, and ≥2010. To compare patient and
disease characteristics across the five cohorts, we conducted Chi-square tests for categorical

39
variables and analyses of variance for continuous data. A P-value less than 0.05 was considered
significant for all statistical analyses. Significant results were further analyzed to correct for any
possible confounding variables and to assess the influence of other explanatory variables on the
outcome measure. A multivariable logistic regression was applied to binary outcomes, such as
biochemical response to UDCA, biochemical disease stage (moderate and advanced disease
stage grouped as advanced), and histological stage (odds ratio [OR] with 95% confidence
interval [CI]).
For time-to-event analyses, patients diagnosed from 2010 onward were excluded due to a shorter
follow-up period than the other cohorts. Patients without an event and those who were lost to
follow-up were censored at their last visit. The rates of hepatic decompensation, HCC, and liver
transplant-free survival were assessed by Kaplan-Meier estimates and compared across decades
using the log-rank test. If decompensation occurred within the first year of study entry, the
patient was excluded from the time-to-event analysis for decompensation. Transplant-free
survival was compared across decades in the PBC population and within each decade to an age-
and gender-matched Dutch population. These outcomes were also estimated by Cox proportional
hazards’ modelling (hazards ratio [HR] with 95% CI).
Demographic and clinical characteristics are presented as count (percentage) for categorical data
and mean ± standard deviation (SD) for continuous variables. Laboratory values are presented as
median (interquartile range [IQR]). Data that were not normally distributed were log transformed
for the analyses. All analyses were two-sided and were performed using IBM SPSS Statistics for
Windows, version 24.0 (IBM Corp., Armonk, NY).
3.3 Results
3.3.1 Study population characteristics
A total of 4805 PBC patients, diagnosed between 1970 and 2014, were included and divided into
five cohorts according to their year of diagnosis (Table 3-1, Table S3-1). 143 patients were
diagnosed from 1970 to 1979, 858 patients from 1980 to 1989, 1754 patients from 1990 to 1999,
1815 patients from 2000 to 2009, and 235 patients from 2010 onward. The characteristics of
each cohort are presented in Table 3-1. The median follow-up for the five respective cohorts

40
were: 6.7 years (IQR 3.0-14.3), 8.9 years (IQR 4.0-14.7), 10.0 years (IQR 6.0-13.9), 5.6 years
(IQR 3.4-8.3), and 1.6 years (IQR 1.0-2.1). The mean time from diagnosis to study entry was
variable for each cohort: 11.1 years (SD 7.0) for the 1970s, 5.1 years (SD 4.5) for the 1980s, 1.4
years (SD 2.3) for the 1990s, 0.4 years (SD 1.1) for the 2000s, and 0.1 years (SD 0.2) from 2010
onward. To consider this variation, all analyses were repeated in a sub-group of patients
(n=3518) with a maximum two-year lag between diagnosis and study entry, which included
14%, 29%, 76%, 93%, and 100% of patients from the main analysis in each respective cohort
(Table S3-2).

41
Table 3-1. Demographic and clinical characteristics of PBC patients at study entry over calendar time
Baseline characteristics 1970-1979 (n=143)
1980-1989 (n=858)
1990-1999 (n=1754)
2000-2009 (n=1815)
≥2010 (n=235)
P-value
Age at diagnosis, ya 46.9 (10.1) 50.1 (10.7) 52.8 (11.5) 55.0 (12.5) 57.0 (12.1) <0.001
Female 131 (91.6) 775 (90.3) 1593 (90.8) 1619 (89.2) 207 (88.1) 0.396
AMA-positiveᵇ
123/140 (87.9) 763/842 (90.6)
1565/1704
(91.8)
1599/1765
(90.6) 213/235 (90.6)
0.449
Laboratory valuesc
Serum ALP (×ULN) 2.99 (1.85-4.77) 3.20 (1.95-5.23) 2.03 (1.30-3.56) 1.79 (1.19-3.05) 1.55 (1.08-2.93) <0.001
Serum bilirubin (×ULN) 0.93 (0.60-2.1) 0.81 (0.52-1.30) 0.64 (0.47-1.00) 0.60 (0.41-0.95) 0.59 (0.41-1.0) <0.001
Serum AST (×ULN) 1.59 (1.06-2.32) 1.95 (1.20-2.77) 1.35 (0.87-2.20) 1.30 (0.90-2.00) 1.29 (0.85-2.07) <0.001
Serum ALT (×ULN) 1.30 (0.85-2.47) 2.00 (1.3-3.1) 1.66 (1.03-2.68) 1.42(0.90-2.27) 1.32 (0.75-2.38) <0.001
Serum albumin (×LLN) 1.11 (0.99-1.21) 1.16 (1.06-1.26) 1.14 (1.06-1.23) 1.14 (1.06-1.23) 1.14 (1.03-1.23) 0.005
Platelet count (×109/L) 194 (127-242.5) 224 (165-275) 238 (185-289) 258 (204-311) 237 (174.5-291) <0.001
APRI (>0.54)d 61 (76.3) 260 (69.0) 456 (52.3) 476 (47.4) 85 (54.1) <0.001
Biochemical disease stagee 121/143 627/859 985/1755 1073/1816 152/235 <0.001
Mild 50/121 (41.3) 370/627 (59.0) 711/985 (72.2) 757/1073 (70.5) 106/152 (69.7)
Moderately advanced 51/121 (42.1) 196/627 (31.3) 205/985 (20.8) 238/1073 (22.2) 27/152 (17.8)
Advanced 20/121 (16.5) 61/627 (9.7) 69/985 (7.0) 78/1073 (7.3) 19/152 (12.5)
Histological disease stagef 326/1001 948/1754 943/2050 <0.001
Mild (I or II) 197 (60.4) 634 (66.9) 721 (76.5)

42
Baseline characteristics 1970-1979 (n=143)
1980-1989 (n=858)
1990-1999 (n=1754)
2000-2009 (n=1815)
≥2010 (n=235)
P-value
Advanced (III or IV) 129 (39.6) 314 (33.1) 222 (23.5)
UDCA-treatedg 78/139 (56.1) 735/832 (88.3) 1605/1737
(92.4)
1563/1789
(87.4)
195/230 (84.8) <0.001
Data represented as mean (standard deviation), n (%), or median (interquartile range). Primary biliary cholangitis, PBC; AMA, antimitochondrial antibody; ALP, alkaline phosphatase; AST, aspartate aminotransferase; ULN, upper limit of normal; ALT, alanine aminotransferase; LLN, lower limit of normal; APRI, AST to platelet ratio index; UDCA, ursodeoxycholic acid. aAge at diagnosis not available for one patient in 2000-2009 cohort. bAMA status was available for 4686 (97.5%) patients. cALP, bilirubin, AST, and ALT were log transformed prior to analyses and availability for laboratory values is as follows: ALP: 3560 (74.1%); Bilirubin: 3595 (74.8%); AST: 3460 (72.0%); ALT: 3007 (62.6%); Albumin: 3039 (63.2%); Platelet count: 2769 (57.6%) dThe cut-point APRI >0.54 at baseline is predictive of liver transplantation or death (Trivedi et al., 2014) eBiochemical disease stage classification according to Rotterdam criteria (ter Borg et al., 2006) was available in 2958 (61.6%) patients. fHistological disease stage at diagnosis according to Ludwig et al. and Scheuer (Ludwig et al., 1978; Scheuer, 1967) classification was available in 2217 (46.1%) patients. gUDCA therapy status was available for 4727 patients (98.4%).

3.3.2 Age and sex trends
The mean age at diagnosis increased incrementally from 46.9 ± 10.1 years in the 1970s to 57.0 ±
12.1 years from 2010 onward (P < 0.001, Figure 3-1A). This trend was consistent across center,
sex, and biochemical disease stage (Figure S3-1A-C). The effect of calendar time on the
increase in age at diagnosis remained significant (P < 0.001) after correcting for sex (Table S3-
3). Furthermore, the age distribution of patients notably changed over the investigated decades (P
< 0.001, Figure 3-1B). The proportion of patients aged 50-59 years at diagnosis remained
relatively stable across the years, whereas the proportion of patients <50 years of age decreased
and patients ≥60 years of age increased. There was no significant temporal trend in the female to
male ratio, which remained approximately 9:1 (Table 3-1).
Figure 3-1. Age at diagnosis of PBC patients across different decades. A) Mean age (± standard
deviation) at diagnosis (dots) and estimated marginal means (squares) obtained after adjusting
for sex. B) The distribution of age groups over calendar time.
Year of diagnosis
Age
at d
iagn
osis
(yea
rs)
1970-1979 1980-1989 1990-1999 2000-2009 ≥ 201020
30
40
50
60
70
Raw dataEstimated marginal means
P < 0.001
Perc
enta
ge o
f pat
ient
s
1970-19791980-19891990-19992000-2009 ≥ 20100
20
40
60
80
100
<3030-3940-4950-5960-69≥70
Year of diagnosis
Age at diagnosis (years)
A) B)
43

44
3.3.3 Liver biochemistry and serological status
The proportion of patients that were AMA-positive did not significantly differ across the
investigated decades (Table 3-1). Median alkaline phosphatase and bilirubin values (× upper
limit of normal) at study entry decreased, while circulating platelet counts were noted to increase
(P < 0.001), which collectively suggests a less advanced disease stage. The proportion of patients
with alkaline phosphatase values below 2 × the upper limit of normal increased gradually from
30.0% in the 1970s to 63.1% from 2010 onward (P < 0.001) (Figure 3-2A). The proportion of
patients with normal serum bilirubin concentrations also increased from 51.1% in the 1970s to
77.6% in the 1990s, after which it remained relatively stable (P < 0.001) (Figure 3-2B).
Furthermore, a reduced percentage of patients with aspartate aminotransferase/platelet ratio
index >0.54 at study entry was observed (Table 3-1).

45
Figure 3-2. Study entry characteristics associated with disease severity of patients diagnosed in
different decades. A) Percentage of patients with alkaline phosphatase (ALP) above or below 2
times the upper limit of normal (×ULN). B) Percentage of patients with bilirubin above or below
1×ULN. C) Percentage of patients corresponding to each biochemical stage according to
Rotterdam criteria (ter Borg et al., 2006); mild (normal albumin and bilirubin), moderate
(abnormal albumin or bilirubin), advanced (abnormal albumin and bilirubin). D) Percentage of
patients corresponding to each histological stage at diagnosis according to Ludwig et al.’s (1978)
and Scheuer’s (1967) classification: mild (stage I and II) or advanced (stage III and IV).
Perc
enta
ge o
f pat
ient
s
1970-19791980-19891990-19992000-2009 ≥ 20100
20
40
60
80
100 Mild biochemical stageModerate biochemical stageAdvanced biochemical stage
Year of diagnosis
Year of diagnosis
Per
cent
age
of p
atie
nts
1970-19791980-19891990-19992000-2009 ≥ 20100
20
40
60
80
100 bilirubin≤1XULNbilirubin>1XULN
Perc
enta
ge o
f pat
ient
s
1970-19791980-19891990-19992000-2009 ≥ 20100
20
40
60
80
100
Year of diagnosis
ALP≤2xULNALP>2xULN
Perc
enta
ge o
f pat
ient
s
1970-1989 1990-1999 2000-20140
20
40
60
80
100 Mild histological stage (I or II)Advanced histological stage (III or IV)
Year of diagnosis
A) B)
C) D)
P < 0.001 P < 0.001
P < 0.001 P < 0.001

46
3.3.4 Trends in biochemical and histological disease stage
There was a gradual increase in the proportion of patients presenting with a mild biochemical
disease stage from the 1970s to 1990s, and remained stable thereafter (P < 0.001, Figure 3-2C).
In a multivariable logistic regression, calendar time was a significant predictor for biochemical
disease stage (P < 0.001) after adjusting for sex and age at diagnosis. Earlier decades were
associated with an advanced biochemical disease stage.
Out of 2831 patients who underwent liver biopsy at diagnosis, 2217 patients had histological
disease stage available and were included in a subgroup analysis that combined cohorts due to
the limited number of biopsies in the first and last cohorts. There were 326 biopsies from 1970-
1989, 948 biopsies from 1990-1999, and 943 from 2000-2014. The proportion of patients with a
mild histological stage (I or II) at diagnosis increased with time (Table 3-1, Figure 3-2D). In a
multivariable logistic regression, calendar time was a significant predictor for histological stage
after adjusting for sex and age at diagnosis (P < 0.001).
3.3.5 Trends in UDCA-response rates
The proportion of patients that ever received UDCA increased across the investigated decades (P
< 0.001, Table 3-1). In patients that received UDCA, the median number of years between
diagnosis and the start of UDCA therapy decreased across the respective cohorts (1970s to
≥2010): 12.6 years (IQR 10.6-16.1), 4.4 years (IQR 2.1-8.1), 0.23 years (IQR 0.0-2.0), 0.05
years (IQR 0.0-0.41), and 0.0 years (IQR 0.0-0.04). Additionally, the median initial dosage of
UDCA received by patients across the five respective cohorts increased: 9.4 mg/kg/day (IQR
8.5-11.0), 10.0 mg/kg/day (IQR 8.7-13.7), 12.2 mg/kg/day (IQR 9.2-14.7), 13.5 mg/kg/day (IQR
11.1-15.3), 13.3 mg/kg/day (IQR 11.1-15.1).
The proportion of UDCA-responders according to Paris-I, Toronto, Paris-II, Rotterdam, and
GLOBE score criteria increased over the investigated decades (P < 0.001), but not according to
Barcelona criteria (Figure 3-3, Table S3-4). Importantly, this trend remained true in patients
who did not meet the individual criteria at baseline (Table S3-5). In a multivariable logistic
regression, calendar time was not a significant predictor for UDCA-response according to Paris-I
criteria (Table 3-2). Response was associated with an increased age at diagnosis, and lower
alkaline phosphatase and bilirubin levels (P < 0.001). Additionally, calendar time was also not a

47
significant predictor for UDCA-response according to Toronto, Paris-II, Rotterdam, and GLOBE
score criteria.
Figure 3-3. Response rates to ursodeoxycholic acid (UDCA) therapy over calendar time.
Response was determined according to various published criteria: Barcelona, Paris-I, Rotterdam,
Toronto, Paris-II, and the GLOBE score (Corpechot et al., 2008, 2011; E. M. Kuiper et al., 2009;
Kumagi et al., 2010; Lammers et al., 2015; Parés et al., 2006). Response rates according to all
criteria were significantly different over calendar time (P < 0.001), except Barcelona criteria (P =
0.19).
Year of diagnosis
Perc
enta
ge o
f pat
ient
s
1970-19791980-19891990-19992000-2009 ≥20100
20
40
60
80
100
Paris-I
Paris-II
Rotterdam
Barcelona
GLOBE score
Toronto

Table 3-2. Multivariable logistic regression for the attainment of biochemical response
according to Paris-Ia (n=2283)
Variable OR 95% CI P-value
Male sex 0.90 0.63-1.29 0.58
Year of diagnosis 0.67
1970-1979 1.00
1980-1989 0.80 0.37-1.71 0.66
1990-1999 1.01 0.44-2.37 0.96
2000-2009 0.97 0.40-2.32 0.94
≥2010 0.92 0.33-2.57 0.88
Age at diagnosis 0.04
<30 1.00
30-39 1.29 0.53-3.15 0.57
40-49 1.41 0.60-3.33 0.44
50-59 1.95 0.82-4.59 0.13
60-69 2.06 0.86-4.96 0.11
≥70 2.06 0.82-5.21 0.13
Log bilirubin (×ULN) 0.01 0.01-0.02 <0.001
Log ALP (×ULN) 0.12 0.08-0.18 <0.001
Difference between diagnosis and study entry (years) 0.98 0.94-1.03 0.44
OR, odds ratio; CI, confidence interval; ULN, upper limit of normal; ALP, alkaline phosphatase. aResponse rate according to Paris-I is defined as: ALP ≤3 ×ULN, AST ≤2 ×ULN, and normal bilirubin after 1 year of UDCA therapy.
48

49
3.3.6 Decompensation, HCC, and transplant-free survival
The 10-year incidence rate of hepatic decompensation (ascites, variceal bleeding, or hepatic
encephalopathy, whichever came first) decreased over time: 18.5% in the 1970s, 13.7% in the
1980s, 8.5% in the 1990s, and 5.8% in the 2000s (Figure 3-4Ai). All pairwise comparisons were
significantly different, except the difference between the 1970s and 1980s cohorts (P = 0.45). In
a multivariable Cox regression, a temporal trend of lower decompensation risk was observed
after adjusting for sex and age at diagnosis (Figure 3-4Bi, Table S3-6, P = 0.07). Calendar time
as a continuous variable was a significant predictor for hepatic decompensation (HR per 10-year
increase: 0.57, 95% CI 0.44-0.75, P < 0.001).
The 10-year HCC incidence rates across the investigated decades were: 10.3%, 4.0%, 2.1%, and
2.3%, respectively (Figure 3-4Aii). The Kaplan-Meier estimate of cumulative HCC incidence
was significantly higher in the 1970s compared to the 1980s (P = 0.01), 1990s (P < 0.001), and
2000s (P < 0.001). In a multivariable Cox regression, calendar time was not a significant
predictor for HCC risk (P = 0.68) after adjusting for sex, age at diagnosis, and UDCA treatment
(Figure 3-4Bii, Table S3-7).
The 10-year liver-related death rate decreased from 1970-2009: 34.6%, 13.2%, 5.6%, and 6.4%
(P < 0.001). Furthermore, the 10-year transplant-free survival rate improved over the four
respective investigated decades: 48.4%, 68.7%, 79.7%, and 80.1% (Figure 3-4Aiii). There was a
significant difference in transplant-free survival between the 1970s and 1980s (P < 0.001), and
between the 1980s and 1990s (P < 0.001). However, the transplant-free survival rates between
the 1990s and 2000s were equivalent (P = 0.80). In a multivariable Cox regression, calendar time
remained an independent predictor of transplant-free survival, and earlier decades were
associated with an increased risk for liver transplantation and all-cause mortality (Figure 3-4Biii,
Table S3-8). Furthermore, the 10-year transplant-free survival of PBC patients has improved
even when compared to an age- and gender-matched general population (1970s: HR 4.38, 95%
CI 3.54-5.43, P < 0.001; 1980s: HR 2.90, 95% CI 2.60-3.24, P < 0.001; 1990s: HR 2.14, 95% CI
1.94-2.36, P < 0.001; 2000s: HR 1.93, 95% CI 1.69-2.21, P < 0.001).

50
Figure 3-4. Time-to-event analyses of decompensation, hepatocellular carcinoma (HCC), and
liver transplantation or death over calendar time. A) Kaplan-Meier (crude) and B) Multivariable
Cox regression (adjusted) estimates of i) cumulative incidence of decompensation, ii) cumulative
incidence of hepatocellular carcinoma (HCC), and iii) transplant-free survival.
Follow-up (years)
1086420
Cum
ulat
ive
inci
denc
e of
deco
mpe
nsat
ion
(%)
20
15
10
5
0
1970-1979-censored
2000-20091990-20001980-19891970-1979
Follow-up (years)1086420
Cum
ulat
ive
HC
C
inci
denc
e (%
)
15
10
5
0
1970-1979-censored
2000-20091990-20001980-19891970-1979
Follow-up (years)1086420
Tran
spla
nt-fr
ee
surv
ival
(%)
100
80
60
40
20
0
1970-1979-censored
2000-20091990-20001980-19891970-1979
Follow-up (years)1086420
Cum
ulat
ive
inci
denc
e of
de
com
pens
atio
n (%
)
20
15
10
5
0
Crude AdjustedA) B)i)
ii)
iii)
i)
No. at risk1970-19791980-19891990-19992000-2009
No. at risk1970-19791980-19891990-19992000-2009
No. at risk1970-19791980-19891990-19992000-2009
50492
1039810
46434936559
40367784348
34298637163
57574
11401046
59622
12021127
139790
15201666
112697
14101471
93574
12511121
74496
1110742
61420954451
49336788194
143858
17541815
117763
16411611
99641
14661242
78557
1315829
63472
1101502
51379876224
P < 0.001
P < 0.001
P < 0.001
P = 0.07
Follow-up (years)1086420
Tran
spla
nt-fr
ee
su
rviv
al (%
)
100
80
60
40
20
0
P < 0.001
iii)
Follow-up (years)1086420
Cum
ulat
ive
HC
C
inci
denc
e (%
)
5
4
3
2
1
0
ii)P = 0.68

51
3.4 Discussion In this study of a large, internationally representative cohort of PBC patients, we demonstrate
that patients diagnosed in recent decades are older and have a milder disease stage compared to
patients diagnosed in earlier decades. In addition, more patients respond favourably to UDCA
therapy and have improved transplant-free survival. To the best of our knowledge no previous
study has reported on these PBC trends. These results provide unique insight into the possible
changing natural history of PBC over the last five decades. It is noteworthy to mention that
similar results have been observed in a study from Sweden that included 246 patients diagnosed
with primary sclerosing cholangitis between 1984 and 2004. Bergquist et al. reported an increase
in age at diagnosis and lower frequency of symptoms in patients diagnosed after 1998
(Bergquist, Said, & Broomé, 2007).
Although some of the observed trends could be potentially attributed to more sensitive AMA
tests that detect the disease at an earlier stage, we speculate that any changes in AMA testing
have not had a major impact in the observed temporal trends. The conventional method of AMA
detection is indirect immunofluorescence, yet there has been an increase in ELISA-based assays
and immunoblotting that have led to greater sensitivity and specificity (Oertelt et al., 2007).
These improvements would translate to an increase in the proportion of AMA-positive patients,
however this has remained unchanged.
We demonstrate a 10-year increase in the mean age at diagnosis from 1970 to 2014. A similar
increase has been reported previously in the Canadian PBC population, in which prevalent cases
in 1996 had a median age of 53, whereas prevalent cases in 2002 had a median age of 57 (Myers
et al., 2009). These numbers coincide with the findings from our study, in which the mean age at
diagnosis in the 1990s and 2000s is 52.8 and 55.0 years, respectively. Furthermore, an increased
proportion of patients diagnosed in recent years are over 50 years of age and account for 71.5%
of patients diagnosed on 2010 and beyond. Comparable results were found within the UK-PBC
cohort, in which 75% of patients prevalent between 2008 and 2010 were over 50 years of age
(Carbone et al., 2013).
The increase in age may be attributed to the general aging of the population, as the median age in
Northern America and Europe has reportedly increased from 30 in 1970 to 40 in 2015 (United

52
Nations, Department of Economic and Social Affairs, 2017). This represents a 10-year increase
over a 45-year period, which is similar to the 10-year increase in age at diagnosis we observe
over a 44-year interval. Furthermore, the 34% absolute increase of PBC patients 50 years old and
above from 1970 to 2014 was greater than that of the general population, which was only 11%
(25% in 1970 to 36% in 2015) (United Nations, Department of Economic and Social Affairs,
2017). The increase in age may also be attributed to differences in the trigger for a PBC
diagnosis over the years. Although we are not able to assess the symptoms in our cohort, we
speculate that patients in recent decades are predominantly asymptomatic and are therefore
diagnosed when they see their physician to undergo routine testing of liver function, which
occurs more frequently in older individuals. Conversely, younger patients in earlier decades were
more likely to develop symptoms, which led to their diagnoses (Mahl et al., 1994; M. Prince et
al., 2002). Lastly, the increase in age may be disease-specific and represent a shift in the natural
history of PBC towards a new older at-risk population, considering the increase in age was
observed irrespective of biochemical disease stage. It can also be speculated that the later onset is
a result of a prolonged subclinical disease period and potentially a delayed exposure to an
unknown environmental trigger due to temporal changes in lifestyle.
An older age at diagnosis is clinically important because it has been associated with an increased
likelihood of meeting Paris-I criteria for response to UDCA (Carbone et al., 2013). Similarly, we
found an older age at diagnosis to be an independent predictor of Paris-I response, yet calendar
time was not a significant predictor. These results indicate the increase in age at diagnosis may
be an important factor contributing to the increase in UDCA-response rather than calendar time
itself. Furthermore, the low response rates observed in earlier decades can be a result of
inadequate UDCA dosages and the delay in treatment. The importance of an adequate UDCA
dosage of 13-15mg/kg per day has been emphasized in a study that found 40% of UDCA-non-
responders in whom the dosage was increased became responders (Angulo, Dickson, et al., 1999;
Lammers et al., 2016).
In recent decades, patients present at an older age, yet they have milder biochemical and
histological disease stage. Improved disease severity might be explained by an earlier detection
of PBC due to improved disease awareness leading to liver function tests and AMA assays
(European Association for the Study of the Liver, 2009; M. I. Prince et al., 2004). The
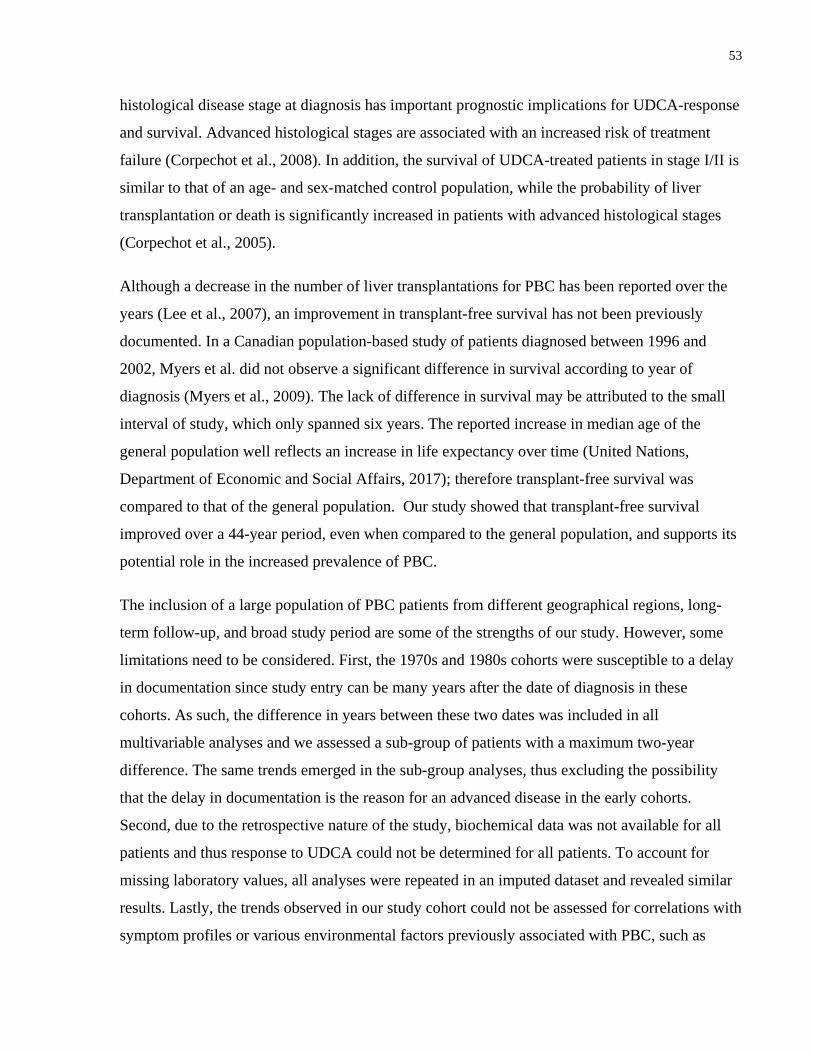
53
histological disease stage at diagnosis has important prognostic implications for UDCA-response
and survival. Advanced histological stages are associated with an increased risk of treatment
failure (Corpechot et al., 2008). In addition, the survival of UDCA-treated patients in stage I/II is
similar to that of an age- and sex-matched control population, while the probability of liver
transplantation or death is significantly increased in patients with advanced histological stages
(Corpechot et al., 2005).
Although a decrease in the number of liver transplantations for PBC has been reported over the
years (Lee et al., 2007), an improvement in transplant-free survival has not been previously
documented. In a Canadian population-based study of patients diagnosed between 1996 and
2002, Myers et al. did not observe a significant difference in survival according to year of
diagnosis (Myers et al., 2009). The lack of difference in survival may be attributed to the small
interval of study, which only spanned six years. The reported increase in median age of the
general population well reflects an increase in life expectancy over time (United Nations,
Department of Economic and Social Affairs, 2017); therefore transplant-free survival was
compared to that of the general population. Our study showed that transplant-free survival
improved over a 44-year period, even when compared to the general population, and supports its
potential role in the increased prevalence of PBC.
The inclusion of a large population of PBC patients from different geographical regions, long-
term follow-up, and broad study period are some of the strengths of our study. However, some
limitations need to be considered. First, the 1970s and 1980s cohorts were susceptible to a delay
in documentation since study entry can be many years after the date of diagnosis in these
cohorts. As such, the difference in years between these two dates was included in all
multivariable analyses and we assessed a sub-group of patients with a maximum two-year
difference. The same trends emerged in the sub-group analyses, thus excluding the possibility
that the delay in documentation is the reason for an advanced disease in the early cohorts.
Second, due to the retrospective nature of the study, biochemical data was not available for all
patients and thus response to UDCA could not be determined for all patients. To account for
missing laboratory values, all analyses were repeated in an imputed dataset and revealed similar
results. Lastly, the trends observed in our study cohort could not be assessed for correlations with
symptom profiles or various environmental factors previously associated with PBC, such as

54
smoking, age at first pregnancy, or the use of hormonal replacement therapy (Gershwin et al.,
2005). Even though the trends observed may be due to a selection of patients whose diagnosis is
triggered by symptoms or complications in earlier decades rather than routine liver function tests
as in recent decades, we describe the presenting characteristics of a typical PBC patient seen by
physicians and how they have changed over time. The observed temporal trends warrant further
investigation in other PBC populations to determine whether they are universally applicable and
to explore the potential influence of a changing environmental trigger.
In conclusion, we demonstrate a 10-year increase in age at diagnosis accompanied by milder
disease severity at presentation of PBC patients. These findings provide the most comprehensive
evidence of a changing natural history of PBC to date.

3.5 Supplementary Tables and Figures Table S3-1. Distribution of PBC patients across calendar time and center
Center 1970-1979 (n=143)
1980-1989 (n=858)
1990-1999 (n=1754)
2000-2009 (n=1815)
≥2010 (n=235)
Total N=4805
North Europe
Rotterdam, The Netherlands
(1973-2012)a 25 (17.5) 122 (14.2) 274 (15.6) 361 (19.9) 37 (15.7) 819
Leuven, Belgium (1974-2011)b 5 (3.5) 20 (2.3) 44 (2.5) 64 (3.5) 13 (5.5) 146
Ghent, Belgium (1991-2014)c 0 0 4 (0.2) 14 (0.8) 6 (2.6) 24
Paris, France (1974-2001)b 11 (7.7) 209 (24.4) 113 (6.4) 14 (0.8) 0 347
London, UK (1972-2007)b 11 (7.7) 31 (3.6) 68 (3.9) 26 (1.4) 0 136
Birmingham, UK (1972-2011)b 1 (0.7) 4 (0.5) 79 (4.5) 264 (14.5) 14 (6.0) 362
Jena, Germany (1979-2013)c 1 (0.7) 5 (0.6) 38 (2.2) 53 (2.9) 24 (10.2) 121
South Europe
Milan, Italy (1970-2005)b,d 71 (49.7) 217 (25.3) 183 (10.4) 62 (3.4) 0 533
Padua, Italy (1972-2012)b 3 (2.1) 38 (4.4) 102 (5.8) 99 (5.5) 28 (11.9) 270
Barcelona, Spain (1971-2005)b 3 (2.1) 51 (5.9) 147 (8.4) 68 (3.7) 0 269
Larissa, Greece (1991-2014)c 0 0 1 (0.1) 76 (4.2) 23 (9.8) 100
North America
Rochester, USA (1970-2012)b 2 (1.4) 11 (1.3) 245 (14) 352 (19.4) 69 (29.4) 679
55

56
Center 1970-1979 (n=143)
1980-1989 (n=858)
1990-1999 (n=1754)
2000-2009 (n=1815)
≥2010 (n=235)
Total N=4805
Toronto, Canada (1974-2010)b 9 (6.3) 87 (10.1) 229 (13.1) 257 (14.2) 1 (0.4) 583
Texas, USA (1977-2011)b 1 (0.7) 62 (7.2) 209 (11.9) 44 (2.4) 10 (4.3) 326
Edmonton, Canada (1989-2007)b 0 1 (0.1) 13 (0.7) 42 (2.3) 0 56
Seattle, USA (1995-2012)b 0 0 5 (0.3) 19 (1) 10 (4.3) 34
Data represented as n (% within corresponding decade). ᵃComprised of centers across the Netherlands (mainly secondary centers). bTertiary center. cSecondary center. dComprised of two centers.
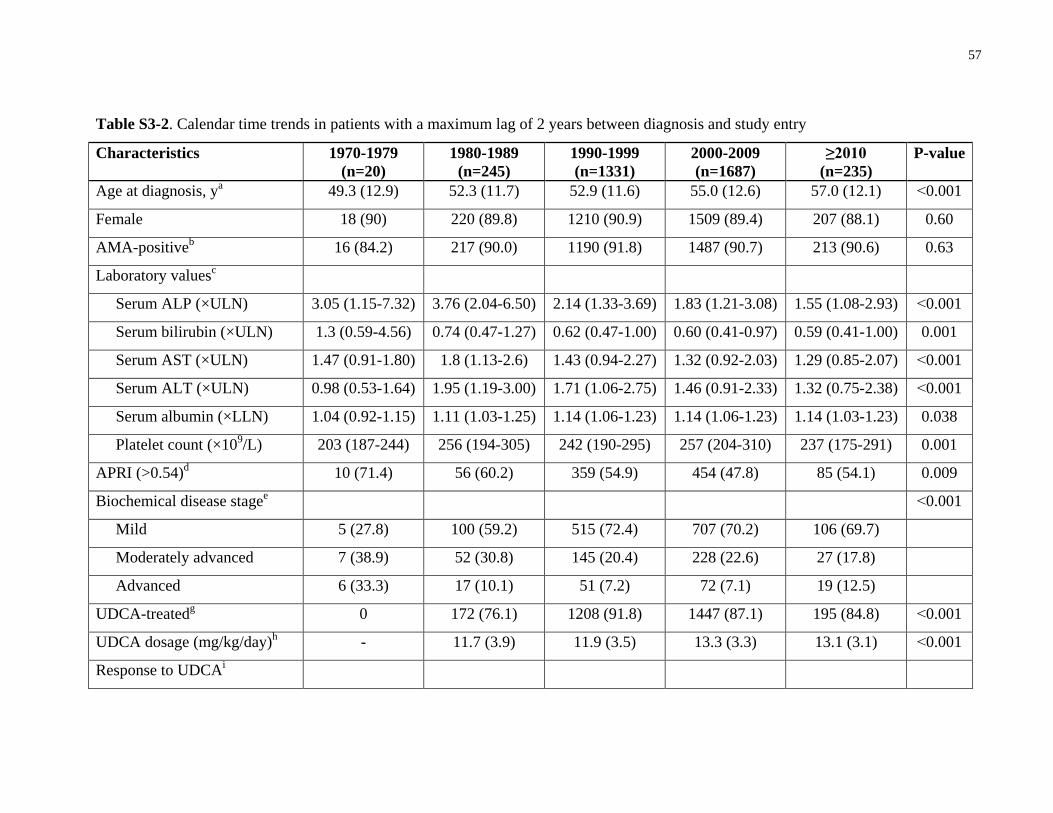
57
Table S3-2. Calendar time trends in patients with a maximum lag of 2 years between diagnosis and study entry
Characteristics 1970-1979 (n=20)
1980-1989 (n=245)
1990-1999 (n=1331)
2000-2009 (n=1687)
≥2010 (n=235)
P-value
Age at diagnosis, ya 49.3 (12.9) 52.3 (11.7) 52.9 (11.6) 55.0 (12.6) 57.0 (12.1) ˂0.001
Female 18 (90) 220 (89.8) 1210 (90.9) 1509 (89.4) 207 (88.1) 0.60
AMA-positiveb 16 (84.2) 217 (90.0) 1190 (91.8) 1487 (90.7) 213 (90.6) 0.63
Laboratory valuesc
Serum ALP (×ULN) 3.05 (1.15-7.32) 3.76 (2.04-6.50) 2.14 (1.33-3.69) 1.83 (1.21-3.08) 1.55 (1.08-2.93) ˂0.001
Serum bilirubin (×ULN) 1.3 (0.59-4.56) 0.74 (0.47-1.27) 0.62 (0.47-1.00) 0.60 (0.41-0.97) 0.59 (0.41-1.00) 0.001
Serum AST (×ULN) 1.47 (0.91-1.80) 1.8 (1.13-2.6) 1.43 (0.94-2.27) 1.32 (0.92-2.03) 1.29 (0.85-2.07) ˂0.001
Serum ALT (×ULN) 0.98 (0.53-1.64) 1.95 (1.19-3.00) 1.71 (1.06-2.75) 1.46 (0.91-2.33) 1.32 (0.75-2.38) ˂0.001
Serum albumin (×LLN) 1.04 (0.92-1.15) 1.11 (1.03-1.25) 1.14 (1.06-1.23) 1.14 (1.06-1.23) 1.14 (1.03-1.23) 0.038
Platelet count (×109/L) 203 (187-244) 256 (194-305) 242 (190-295) 257 (204-310) 237 (175-291) 0.001
APRI (>0.54)d 10 (71.4) 56 (60.2) 359 (54.9) 454 (47.8) 85 (54.1) 0.009
Biochemical disease stagee ˂0.001
Mild 5 (27.8) 100 (59.2) 515 (72.4) 707 (70.2) 106 (69.7)
Moderately advanced 7 (38.9) 52 (30.8) 145 (20.4) 228 (22.6) 27 (17.8)
Advanced 6 (33.3) 17 (10.1) 51 (7.2) 72 (7.1) 19 (12.5)
UDCA-treatedg 0 172 (76.1) 1208 (91.8) 1447 (87.1) 195 (84.8) ˂0.001
UDCA dosage (mg/kg/day)h - 11.7 (3.9) 11.9 (3.5) 13.3 (3.3) 13.1 (3.1) ˂0.001
Response to UDCAi

58
Characteristics 1970-1979 (n=20)
1980-1989 (n=245)
1990-1999 (n=1331)
2000-2009 (n=1687)
≥2010 (n=235)
P-value
Toronto - 43/83 (51.8) 427/616 (69.3) 523/710 (73.7) 48/65 (73.8) ˂0.001
Paris-I - 61/113 (54.0) 610/837 (72.9) 725/977 (74.2) 107/149 (71.8) ˂0.001
Barcelona - 73/113 (64.6) 518/795 (65.2) 633/1058 (59.8) 100/155 (64.5) 0.12
Paris-II - 36/116 (31.0) 432/861 (50.2) 522/1038 (50.3) 81/155 (52.3) ˂0.001
Rotterdam - 87/106 (82.1) 424/516 (82.2) 561/668 (84.0) 90/111 (81.1) 0.79
GLOBE score - 27/40 (67.5) 162/211 (76.8) 360/435 (82.8) 67/88 (76.1) 0.047
Kaplan-Meier estimates (%)
10-year decompensation rate - 7.9 7.1 5.6 - 0.49
10-year HCC incidence rate - 3.0 1.2 2.4 - 0.16
10-year transplant-free
survival
40.1 72.0 87.6 87.1 - <0.001
10-year liver-related death 53.2 14.0 4.9 6.5 - <0.001
Data represented as mean (standard deviation), n (%), or median (interquartile range). AMA, antimitochondrial antibody; ALP, alkaline phosphatase; ULN, upper limit of normal; AST, aspartate aminotransferase; ALT, alanine aminotransferase; LLN, lower limit of normal; APRI, AST to platelet ratio index; UDCA, ursodeoxycholic acid; HCC, hepatocellular carcinoma. aAge at diagnosis not available for one patient in 2000-2009 cohort. bAMA status was available for 3430 (97.5%) patients. cALP, bilirubin, AST, and ALT were log transformed prior to analyses and availability for laboratory values is as follows: ALP: 2662 (75.7%); Bilirubin: 2586 (73.5%); AST: 2593 (73.7%); ALT: 2271 (64.6%); Albumin: 2123 (60.3%); Platelet count: 1998 (56.8%) dThe cut-point APRI >0.54 at baseline is predictive of liver transplantation or death (Trivedi et al., 2014). eBiochemical disease stage classification according to Rotterdam criteria (E. M. Kuiper et al., 2009) was available in 2057 (58.5%) patients.

59 fUDCA therapy status was available for 3452 patients (98.1%). gUDCA dosage was available for 1319 (43.6%) of UDCA-treated patients. hResponse was determined based on the availability of laboratory values at 1 year of UDCA therapy. Response according to Toronto criteria was calculated after 2 years of UDCA therapy.

60
Figure S3-1. Mean age at diagnosis over calendar time stratified by A) Center (each line corresponds to an individual center); B) Sex; and
C) Biochemical disease stage.
Year of diagnosis
Age
at d
iagn
osis
(yea
rs)
1970-19791980-19891990-19992000-2009 ≥20100
2020
30
40
50
60
70
Year of diagnosis
Age
at d
iagn
osis
(yea
rs)
1970-19791980-19891990-19992000-2009 ≥20100
4040
50
60
70
MaleFemale
Year of diagnosis
Age
at d
iagn
osis
(yea
rs)
1970-19791980-19891990-19992000-2009 ≥20100
4040
50
60
70
Mild biochemical stageModerate biochemical stageAdvanced biochemical stage
A) B) C)

61
Figure S3-2. Absolute number of patients according to age at diagnosis and over calendar time.
Year of diagnosis
Cou
nt n
umbe
r
1970-1979 1980-1989 1990-1999 2000-20090
200
400
600
800
<3030-3940-4950-5960-69≥70
Age at diagnosis(years)
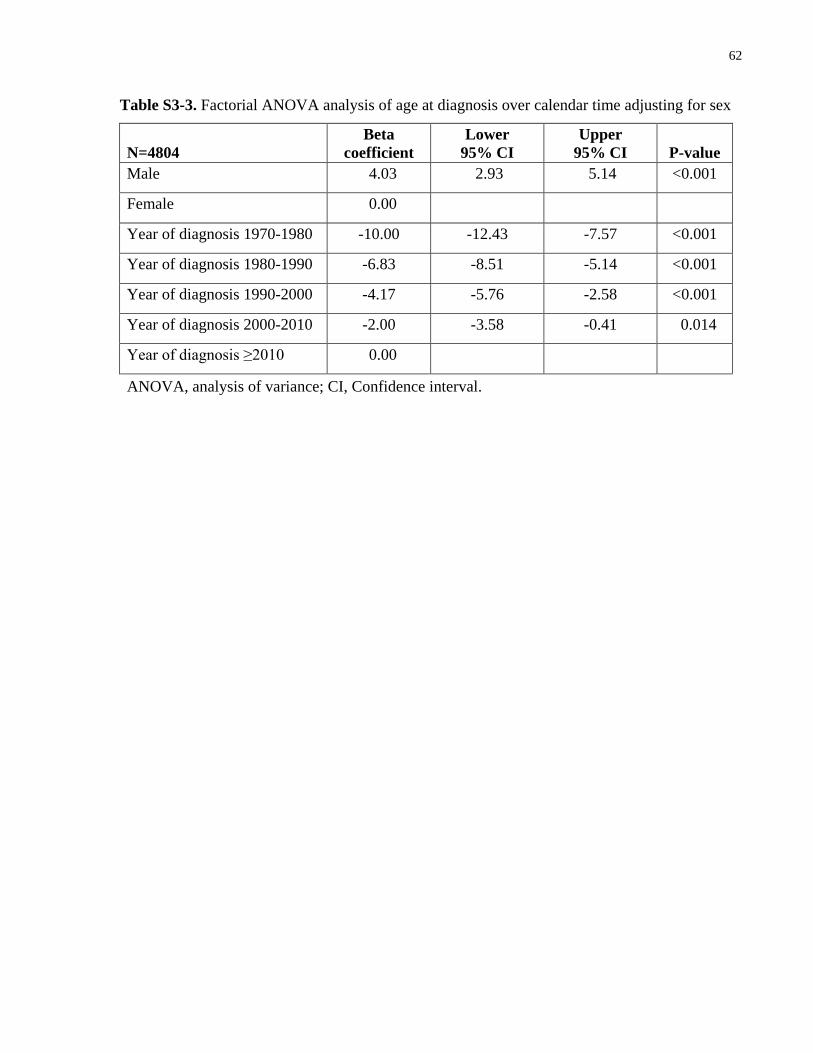
62
Table S3-3. Factorial ANOVA analysis of age at diagnosis over calendar time adjusting for sex
N=4804 Beta
coefficient Lower
95% CI Upper
95% CI P-value Male 4.03 2.93 5.14 <0.001
Female 0.00
Year of diagnosis 1970-1980 -10.00 -12.43 -7.57 <0.001
Year of diagnosis 1980-1990 -6.83 -8.51 -5.14 <0.001
Year of diagnosis 1990-2000 -4.17 -5.76 -2.58 <0.001
Year of diagnosis 2000-2010 -2.00 -3.58 -0.41 0.014
Year of diagnosis ≥2010 0.00
ANOVA, analysis of variance; CI, Confidence interval.

63
Table S3-4. Response rate in UDCA-treated patients according to various published criteria over calendar time
Response criterionᵃ 1970-1979 (n=78)
1980-1989 (n=735)
1990-1999 (n=1605)
2000-2009 (n=1563)
≥2010 (n=195)
P-value
Barcelona 30/61 (49.2) 277/493 (56.2) 630/1062 (59.3) 674/1131 (59.6) 100/155 (64.9) 0.185
Paris-I 31/60 (51.7) 268/533 (50.3) 790/1121 (70.5) 773/1047 (73.8) 107/149 (71.8) <0.001
Rotterdam 37/57 (64.9) 358/479 (74.7) 595/746 (79.8) 601/716 (83.9) 90/111 (81.1) <0.001
Toronto 19/41 (46.3) 200/395 (50.6) 570/851 (67.0) 564/759 (74.3) 48/65 (73.8) <0.001
Paris-II 13/64 (20.3) 151/542 (27.9) 548/1157 (47.4) 563/1121 (50.2) 81/155 (52.3) <0.001
GLOBE scoreb 13/25 (52.0) 111/190 (58.4) 200/285 (70.2) 382/463 (82.5) 67/88 (76.1) <0.001
Data represented as n (%). UDCA, ursodeoxycholic acid. ᵃResponse was determined based on the availability of laboratory values at 1 year of UDCA therapy. Response according to Toronto criteria was calculated after 2 years of UDCA therapy. bResponse according to the GLOBE score was established when the calculated value did not surpass the age-specific threshold (Lammers et al., 2015).

64
Table S3-5. Response rate over calendar time in UDCA-treated patients who did not meet criteria at baseline
Response criterionᵃ 1970-1979 (n=78)
1980-1989 (n=735)
1990-1999 (n=1605)
2000-2009 (n=1563)
≥2010 (n=195)
P-value
Paris-I 12/40 (30.0) 122/344 (35.5) 202/436 (46.3) 215/410 (52.4) 28/58 (48.3) <0.001
Rotterdam 9/29 (31.0) 121/242 (50.0) 176/327 (53.8) 264/379 (69.7) 43/64 (67.2) <0.001
Toronto 12/34 (35.3) 115/284 (40.5) 209/395 (52.9) 209/352 (59.4) 12/24 (50.0) <0.001
Paris-II 10/57 (17.5) 106/448 (23.7) 235/695 (33.8) 274/705 (38.9) 36/93 (38.7) <0.001
Data represented as n (%). UDCA, ursodeoxycholic acid. ᵃResponse was determined based on the availability of laboratory values at 1 year of UDCA therapy. Response according to Toronto criteria was calculated after 2 years of UDCA therapy.

65
Table S3-6. Multivariable Cox regression of 10-year hepatic decompensation (n=2962)
Variable HR 95% CI P value
Year of diagnosis 0.07
1970-1979 1.00
1980-1989 1.32 0.61-2.87 0.48
1990-1999 1.11 0.46-2.70 0.81
2000-2009 0.73 0.28-1.87 0.51
Male sex 1.25 0.80-1.98 0.33
Age at diagnosis (years) 0.21
<30 1.00
30-39 1.35 0.40-4.50 0.63
40-49 1.84 0.58-5.87 0.30
50-59 1.82 0.57-5.82 0.31
60-69 2.00 0.61-6.61 0.25
>70 3.09 0.88-10.81 0.08
Difference between diagnosis and study entry (years) 1.08 1.04-1.13 <0.001
HR, Hazard ratio; CI, confidence interval.

66
Table S3-7. Multivariable Cox regression for 10-year HCC incidence (n=3963)
Variable HR 95% CI P value
Male sex 3.48 2.05-5.89 <0.001
UDCA 0.38 0.21-0.67 0.001
Year of diagnosis 0.68
1970-1979 1.00
1980-1989 1.19 0.49-2.89 0.70
1990-1999 1.51 0.51-4.48 0.46
2000-2009 1.88 0.58-6.06 0.29
Age at diagnosis (years) 0.11
30-39 1.00
40-49 0.27 0.10-0.75 0.01
50-59 0.53 0.28-1.02 0.06
60-69 1.63 0.34-1.15 0.13
≥70 0.62 0.23-1.68 0.35
Difference between diagnosis and study entry (years) 1.19 1.13-1.26 <0.001
HCC, hepatocellular carcinoma; HR, hazard ratio, CI, confidence interval, UDCA, ursodeoxycholic acid.

67
Table S3-8. Multivariable Cox regression analysis of 10-year transplant-free survival (n=3354)
Variable HR 95% CI P-valueMale sex 1.11 0.89-1.40 0.35
UDCA 0.55 0.45-0.68 <0.001
Year of diagnosis <0.001
1970-1979 1.00
1980-1989 1.14 0.81-1.60 0.45
1990-1999 0.72 0.49-1.06 0.10
2000-2009 0.60 0.40-0.89 0.01
Age at diagnosis <0.001
<30 1.00
30-39 1.45 0.58-3.63 0.42
40-49 2.31 0.95-5.63 0.07
50-59 2.34 0.96-5.71 0.06
60-69 4.46 1.82-10.89 0.001
>70 8.52 3.45-21.07 <0.001
Log bilirubin (×ULN) 12.8 10.6-15.4 <0.001
Difference between diagnosis and study entry (years) 1.06 1.03-1.08 <0.001
HR, hazard ratio; CI, confidence interval; UDCA, ursodeoxycholic acid; ULN, upper limit of normal.

68
Chapter 4 : Study 2
Bilirubin is Predictive of Transplant-Free Survival 4Even Within the Normal Range in Patients with Primary Biliary Cholangitis
4.1 Introduction Primary biliary cholangitis (PBC) is an autoimmune cholestatic liver disease that is characterized
by chronic non-suppurative inflammation of the small intrahepatic bile ducts (Kaplan &
Gershwin, 2016). The disease usually has a slow progressive course, which may eventually lead
to cirrhosis and ultimately liver failure or premature death in the absence of liver transplantation.
However, the prolonged number of years it may take for patients to develop such clinical
outcomes poses a significant obstacle in randomized controlled trials that aim to evaluate the
clinical benefit of therapeutic interventions. Due to these feasibility concerns, various surrogate
markers have been evaluated for their prognostic value on clinical outcomes (Lammers et al.,
2014). Such surrogate markers can allow the risk stratification of patients without the need for an
extended follow-up period and can be implemented by health care providers or in clinical trials
to promptly assess the need and benefit of a therapeutic agent.
It is widely established that bilirubin is an independent predictor of prognosis in both
ursodeoxycholic acid (UDCA)-treated and untreated patients with PBC (Bonnand et al., 1999;
Lammers et al., 2014; Shapiro et al., 1979). The normalization of bilirubin prompted by UDCA
has been associated with improved transplant-free survival (Bonnand et al., 1999). Furthermore,
bilirubin has been established as a surrogate endpoint that is “reasonably likely to predict clinical
benefit” and the threshold that best predicted liver transplant-free survival was reported to be the
upper limit of normal (ULN) (Lammers et al., 2014). Normal bilirubin is also a component of
multiple response criteria, such as the Rotterdam, Paris-I, and Paris-II criteria (Corpechot et al.,
2008, 2011; ter Borg et al., 2006). Abnormal bilirubin levels are observed during later stages of
PBC and are indicative of impaired liver function (Hirschfield et al., 2017). Over the past
decades, however, there has been an increase in the proportion of patients that present with
normal bilirubin levels over the years and this group now represents the majority of patients with
PBC (Murillo Perez et al., 2018). Since bilirubin is usually not elevated above the ULN until

69
later stages of the disease, it is considered to be an inadequate marker for risk stratification in
early stage PBC. The prognostic value of bilirubin below the ULN has not been previously
assessed. Thus, the aim of this study was to evaluate whether bilirubin levels within the normal
range (≤1×ULN) are associated with liver transplant-free survival in patients with PBC.
4.2 Patients and Methods
4.2.1 Population and study design
This was a retrospective study on the predictive value of normal bilirubin for liver transplant-free
survival. We utilized the GLOBAL PBC Study Group database, which includes long-term
follow-up data of PBC patients from 17 centers across Europe and North America. To evaluate
the association between normal bilirubin and liver transplant-free survival, we included UDCA-
treated and untreated patients diagnosed with PBC according to internationally accepted
guidelines and whose bilirubin levels were normal (≤1×ULN as defined by each local center) at
time zero or 1 year after study entry (Hirschfield et al., 2017; K. D. Lindor et al., 2009;
Reshetnyak, 2015). Those with short follow-up (<6 months), short-term treatment with UDCA
(discontinued), absent laboratory values, unknown dates of important clinical events, overt
overlapping features of autoimmune hepatitis (AIH), or other concomitant liver diseases were
excluded from the study. Patients were allocated to two independent cohorts based on the time
point(s) at which their bilirubin levels were normal (time zero and 1 year). The inclusion of
patients into each cohort is not mutually exclusive, as patients may have had normal bilirubin
levels at both time points. This study was conducted in accordance with the 1975 Declaration of
Helsinki. The protocol was approved by the institutional research board at all participating
centers as per local regulations.
4.2.2 Data collection
In the GLOBAL PBC Study Group database, time zero (study entry) is defined as the date
UDCA was initiated in treated patients and the date of the first visit in untreated patients. At
study entry, the following data were available: sex, age at diagnosis, anti-mitochondrial (AMA)
antibody serological status, liver histology, biochemical disease stage (according to Rotterdam
criteria [ter Borg et al., 2006]), and UDCA therapy. The following laboratory parameters were
collected every 6-12 months: total bilirubin, alkaline phosphatase (ALP), albumin, aspartate

70
aminotransferase, alanine aminotransferase, and platelet count. Histological data obtained from
liver biopsies conducted within 12 months of study entry were staged according to Ludwig et
al.’s and Scheuer’s criteria (Ludwig et al., 1978; Scheuer, 1967). The completeness and accuracy
of the data was established by visits to participating centers.
4.2.3 Statistical analysis
The primary endpoint was a composite of liver transplantation or all-cause mortality. Patients
without an event (liver transplantation or death) at the end of follow-up and those who were lost
to follow-up were censored at their last visit. The predictive value of normal bilirubin on the
primary endpoint was initially analyzed based on the bilirubin quartiles corresponding to each
cohort. The liver transplant-free survival rates across quartiles were estimated with a Kaplan-
Meier curve and compared with a log-rank test. Multivariable Cox proportional hazards’
regression (hazard ratio [HR] with 95% CI) analyses were performed to adjust for potential
confounding variables: age at study entry, sex, year of diagnosis, UDCA therapy, ALP, and
geographical region.
To test the hypothesis of a threshold and to determine the optimal threshold for bilirubin within
the normal range two approaches were followed: 1) bilirubin levels at baseline and 1 year of
follow-up were dichotomized according to various thresholds ranging from 0.3 to 0.9 ×ULN in
0.01 increments. Multivariable Cox proportional hazards’ regression analyses were employed to
estimate the risk for liver transplantation or death associated with each threshold. The C-statistic
was calculated to evaluate the performance of each threshold in predicting liver transplant-free
survival and the threshold with the best performance was determined by the highest C-statistic.
2) To assess bilirubin on a continuous spectrum and test the hypothesis that the predetermined
bilirubin threshold is the point at which the risk for liver transplantation or death increases,
bilirubin was inserted into the Cox regression as a restricted cubic spline function with five
knots. This analysis included patients with bilirubin levels above the ULN to illustrate how their
risk for a poor prognosis differs relative to those with bilirubin below the ULN. The restricted
spline function was repeated with crude bilirubin levels (mg/dL).
All analyses were adjusted for age at study entry, sex, year of diagnosis, UDCA therapy, ALP,
and geographical region. Laboratory data included in the multivariable model that were not

71
normally distributed were log transformed. Sensitivity analyses of the predetermined bilirubin
threshold by multivariable Cox regression were performed in additional sub-groups stratified by
the ULN of bilirubin (<1.2mg/dL and ≥1.2mg/dL), age at study entry (≤55 years and >55 years),
sex, treatment (UDCA-treated and UDCA-untreated), histological stage (I-II and III-IV), and
ALP (≤1.67×ULN and >1.67×ULN). Furthermore, sensitivity analyses were performed for
bilirubin at 2-4 years after the start of follow-up.
For illustrative purposes, Kaplan-Meier analyses were conducted to describe the liver transplant-
free survival rates associated with bilirubin levels at baseline and 1 year (normal bilirubin [≤/>
the threshold] and abnormal bilirubin). Patients with abnormal bilirubin were included for
reference purposes. The distribution of the clinical events (liver transplantation, liver-related
death, or liver-unrelated death) at 10 years within each bilirubin group was also evaluated.
An additional analysis was conducted in UDCA-treated patients whose baseline bilirubin levels
were above the predetermined threshold and stratified based on their bilirubin levels at 1 year. In
case of missing bilirubin at baseline or 1 year, the imputed laboratory data was used. Multiple
imputation with by the Markov chain Monte Carlo (MCMC) method for missing data and
Rubin’s rules were used to estimate bilirubin and its standard error (Rubin, 1996). Ten imputed
datasets based on the assumption that data were missing at random were created from iterations
to reduce sampling variability.
The pattern of bilirubin (mean and 95% CI) over the first 5 years was evaluated in patients with
normal bilirubin at time zero and stratified based on whether they experienced a late clinical
event (liver transplantation or death from 5-10 years) or no clinical event in the first 10 years of
follow-up. All patients included in the latter group had 10 years of follow-up. The imputed
dataset was used for this analysis.
A P-value less than 0.05 was considered statistically significant. All analyses were two-sided and
were performed using IBM SPSS Statistics for Windows, version 24.0 (IBM Corp., Armonk,
NY, USA) and SAS version 9.4 (SAS Institute Inc., Cary, NC, USA).

72
4.3 Results
4.3.1 Study population characteristics
A total of 3640 patients with normal bilirubin at baseline or one year after study entry were
included. Two normal bilirubin cohorts were constructed based on the time point(s) at which
their bilirubin levels were normal: time-zero cohort (n=2795) and 1-year cohort (n=2967). An
overlap of 2122 patients exists between these cohorts. There were 374 and 410 primary
endpoints according to each respective cohort. Patient characteristics per cohort are presented in
Table 4-1.

73
Table 4-1. Characteristics of PBC patients in each normal bilirubin cohort
Parameter Time zero cohort a, b
(n=2795) 1-year cohort
(n=2967)Follow-up time, y, median (IQR) 7.6 (4.0-12.1) 7.1 (3.5-11.2)
Age at study entry, mean ± SD 55.7 ± 11.9 55.0 ± 11.7
Female, no. (%) 2543 (91.0) 2718 (91.6)
AMA-positive, no. (%) 2502/2736 (91.4) 2649/2897 (91.4)
Year of diagnosis, median (range) 1999 (1961-2014) 1998 (1961-2013)
UDCA-treated, no. (%) 2336/2737 (85.3) 2652/2935 (90.4)
Laboratory parameters, median (IQR)c
Total bilirubin, ×ULN 0.53 (0.40-0.71) 0.50 (0.38-0.68)
ALP, ×ULN 1.84 (1.20-3.03) 1.25 (0.88-1.96)
Albumin, ×LLN 1.17 (1.09-1.26) 1.17 (1.09-1.26)
AST, ×ULN 1.20 (0.83-1.80) 0.84 (0.64-1.18)
ALT, ×ULN 1.45 (0.93-2.30) 0.83 (0.57-1.31)
Platelet count, 109/L 252 (202-304) 247 (197-300)
Bilirubin ULN (mg/dL), median (IQR)d 1.0 (1.0-1.2) 1.0 (1.0-1.2)
PBC, primary biliary cholangitis; IQR, interquartile range; SD, standard deviation; AMA, antimitochondrial antibody; UDCA, ursodeoxycholic acid; ULN, upper limit of normal; ALP, alkaline phosphatase; AST, aspartate aminotransferase; ALT, alanine aminotransferase. aHistological disease stage at study entry available for 1485 patients (53.1%)- stage I/II: 1111 patients (74.8%), stage III/IV: 374 patients (25.2%). bBiochemical disease stage at study entry available for 2259 patients (80.8%) – mild: 2094 (74.9%), moderate: 165 (5.9%), advanced: 0 patients. cLaboratory parameters other than bilirubin were not available for all patients:
Time zero cohort: ALP (n=2627), albumin (n=2259), AST (n=2531), ALT (n=2134), platelet count (n=2039). 1-year cohort: ALP (n=2824), albumin (n=2043), AST (n=2542), ALT (n=2309), plateletcount (n=1370).
dThe upper limit of normal for bilirubin was variable per center.
74
4.3.2 Normal bilirubin quartiles are associated with liver transplant-free survival
The quartiles in each individual cohort were formulated according to the following bilirubin
levels (median [IQR], ×ULN): 0.53 (0.40-0.71) and 0.50 (0.38-0.68), respectively. In Kaplan-
Meier analysis of patients that had normal bilirubin at time zero, the cumulative 10-year liver
transplant-free survival rate decreased with higher bilirubin quartiles and was 92.4%, 89.0%,
87.9%, 77.5% from quartiles 1-4 (Q1-Q4), respectively (Figure 4-1). In pairwise comparisons,
Q4 was significantly different from Q1-Q3 (all P < 0.0001). Similar results were obtained in the
Kaplan-Meier analysis of the 1-year cohort, in which the 10-year liver transplant-free survival
rates with increasing bilirubin quartiles were 91.3%, 91.4%, 86.2%, and 76.7%. Q3 and Q4 were
significantly different from one another and from the remaining quartiles (all P < 0.05). In
multivariable Cox regression analyses, normal bilirubin quartiles were a significant predictor for
transplant-free survival. In the time zero cohort, the risk for liver transplantation or death
increased with higher bilirubin quartiles: Q1 (reference), Q2 (HR 1.24, 95% CI 0.85-1.81, P =
0.26), Q3 (HR 1.28, 95% CI 0.90-1.83, P = 0.18), Q4 (HR 2.16, 95% CI 1.53-3.04, P < 0.0001).
A similar trend was observed in the 1-year cohort: Q1 (reference), Q2 (HR 0.98, 95% CI 0.68-
1.41, P = 0.91), Q3 (HR 1.43, 95% CI 1.01-2.01, P = 0.04), Q4 (HR 2.27, 95% CI 1.65-3.12, P <
0.0001).
Figure 4-1. Transplant-free survival of the normal bilirubin quartiles in patients with normal
bilirubin at A) time zero and B) 1 year.
Follow-up (years)
14121086420
Tran
plan
t-fre
e su
rviv
al (%
)
100
90
80
70
60
50
<25th percentile-censored
>75th percentile 50-75th percentile 25-50th percentile <25th percentile
Quartile 4 Quartile 3Quartile 2 Quartile 1
Follow-up (years)
11111000
Tran
spla
nt-fr
ee s
urvi
val (
%)
100
90
80
70
60
50
<0-25th percentile-censored
>75th percentile 50-75th percentile 25-50th percentile <25th percentile
1 3 5 7 9 11 13 15
A ) B )T im e 0 c o h o rt 1 -y e a r c o h o rt

75
4.3.3 Bilirubin threshold within the normal range
Upon exploration of the optimal threshold of bilirubin within the normal range, all bilirubin
thresholds (0.3-0.9×ULN) were significant predictors of liver transplant-free survival in that
patients with bilirubin above each threshold had an increased risk for liver transplantation or
death (Table 4-2 and Table S4-1). The bilirubin threshold at 1 year with the highest ability to
predict liver transplantation or death was 0.6×ULN (C-statistic 0.7394, 95% CI 0.7134-0.7655).
The 10-year liver transplant-free survival of patients with normal bilirubin ≤0.6×ULN, normal
bilirubin >0.6×ULN, and abnormal bilirubin 1 year were 90.7%, 78.0%, and 39.0%, respectively
(P < 0.0001) (Figure 4-2A). At baseline, the 10-year liver transplant-free survival rates were
89.4%, 81.9%, and 43.4% (P < 0.0001). We evaluated the distribution of clinical events from the
10-year liver transplant-free survival rates associated with each bilirubin group. Clinical events
in patients with bilirubin from 0.6-1.0×ULN were characterized by an increased proportion of
liver transplantations and liver-related deaths, alongside a decreased proportion of liver-unrelated
deaths compared to patients with bilirubin ≤0.6×ULN (Figure S4-1). In an analysis of UDCA-
treated patients with normal bilirubin levels >0.6×ULN at baseline (n=1318), a reduction in
bilirubin ≤0.6×ULN at 1 year was associated with prolonged liver transplant-free survival as
compared to stable bilirubin that remained above the threshold and abnormal bilirubin after 1
year (both P < 0.001) (Figure 4-2B). From these patients, the 10-year transplant-free survival of
patients ≤0.6×ULN, normal bilirubin >0.6×ULN, and abnormal bilirubin was 92.8%, 84.7%, and
62.1%.
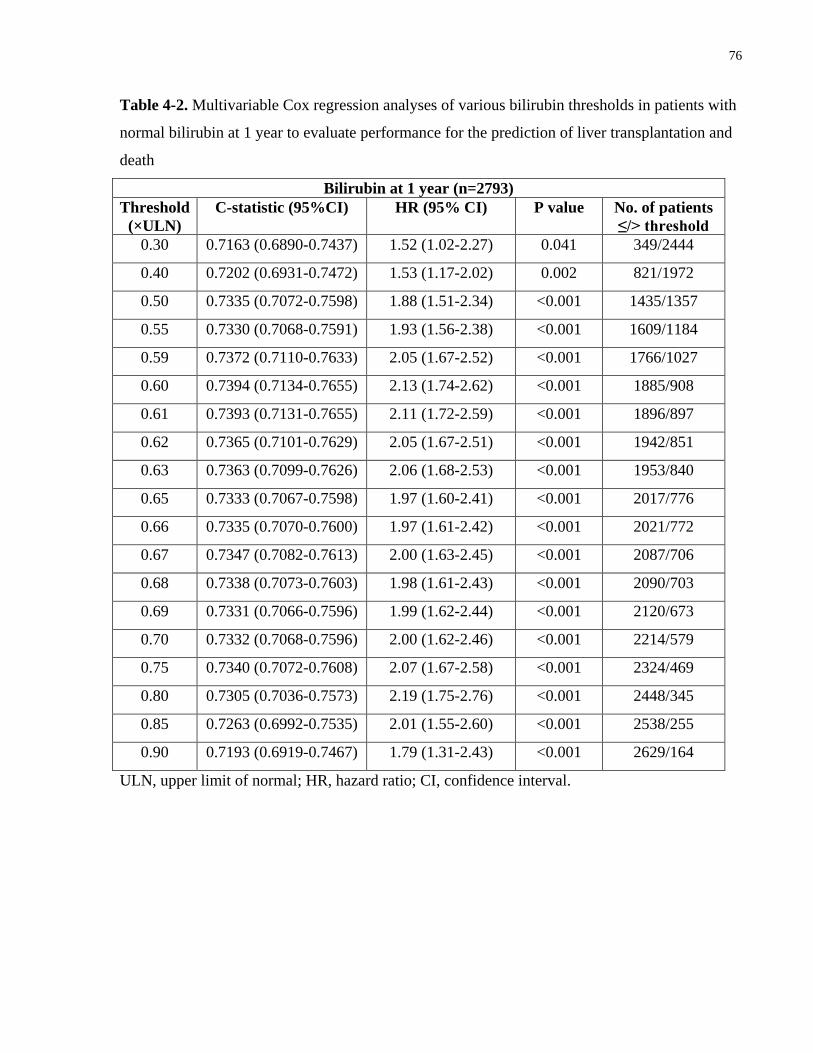
76
Table 4-2. Multivariable Cox regression analyses of various bilirubin thresholds in patients with
normal bilirubin at 1 year to evaluate performance for the prediction of liver transplantation and
death
Bilirubin at 1 year (n=2793) Threshold
(×ULN) C-statistic (95%CI) HR (95% CI) P value No. of patients
≤/> threshold 0.30 0.7163 (0.6890-0.7437) 1.52 (1.02-2.27) 0.041 349/2444
0.40 0.7202 (0.6931-0.7472) 1.53 (1.17-2.02) 0.002 821/1972
0.50 0.7335 (0.7072-0.7598) 1.88 (1.51-2.34) <0.001 1435/1357
0.55 0.7330 (0.7068-0.7591) 1.93 (1.56-2.38) <0.001 1609/1184
0.59 0.7372 (0.7110-0.7633) 2.05 (1.67-2.52) <0.001 1766/1027
0.60 0.7394 (0.7134-0.7655) 2.13 (1.74-2.62) <0.001 1885/908
0.61 0.7393 (0.7131-0.7655) 2.11 (1.72-2.59) <0.001 1896/897
0.62 0.7365 (0.7101-0.7629) 2.05 (1.67-2.51) <0.001 1942/851
0.63 0.7363 (0.7099-0.7626) 2.06 (1.68-2.53) <0.001 1953/840
0.65 0.7333 (0.7067-0.7598) 1.97 (1.60-2.41) <0.001 2017/776
0.66 0.7335 (0.7070-0.7600) 1.97 (1.61-2.42) <0.001 2021/772
0.67 0.7347 (0.7082-0.7613) 2.00 (1.63-2.45) <0.001 2087/706
0.68 0.7338 (0.7073-0.7603) 1.98 (1.61-2.43) <0.001 2090/703
0.69 0.7331 (0.7066-0.7596) 1.99 (1.62-2.44) <0.001 2120/673
0.70 0.7332 (0.7068-0.7596) 2.00 (1.62-2.46) <0.001 2214/579
0.75 0.7340 (0.7072-0.7608) 2.07 (1.67-2.58) <0.001 2324/469
0.80 0.7305 (0.7036-0.7573) 2.19 (1.75-2.76) <0.001 2448/345
0.85 0.7263 (0.6992-0.7535) 2.01 (1.55-2.60) <0.001 2538/255
0.90 0.7193 (0.6919-0.7467) 1.79 (1.31-2.43) <0.001 2629/164
ULN, upper limit of normal; HR, hazard ratio; CI, confidence interval.

77
Figure 4-2. Transplant-free survival in patients with normal bilirubin (stratified by 0.6×ULN
threshold) and abnormal bilirubin. A) Kaplan-Meier estimates of transplant-free survival rates in
patients with normal bilirubin (stratified by 0.6×ULN threshold) and abnormal bilirubin at 1
year. B) Additional analysis of the transplant-free survival rates in UDCA-treated patients with
bilirubin levels >0.6×ULN at baseline.
13
Follow-up (years)
12840
Tran
spla
nt-fr
ee s
urvi
val (
%)
100
80
60
40
20
0Bilirubin at 1yr <=0.6-censoredAbnormal bilirubin Normal bilirubin (>0.6)Nomal bilirubin (<=0.6)
1 5 9
1 9 8 49 8 37 1 5
1 4 2 06 9 93 6 2
8 3 24 4 21 6 8
4 1 32 2 08 9
abc
Follow-up (years)
12840
Tran
spla
nt-fr
ee s
urvi
val (
%)
100
80
60
40
20
0
<=0.6-censoredAbnormal bilirubinBilirubin remained >0.6Bilirubin decreased (<0.6)
1-year bilirubin bilirubin in patients with normal bilirubin (>0.6) at time 0
1 5 9 13
5 4 56 6 31 1 0
4 1 14 9 57 5
2 7 63 3 84 4
1 5 71 6 22 4
abc
a
b
c
a
b
c
A ) B )

78
The threshold was evaluated in various sub-groups of patients that had normal bilirubin at 1 year,
all of which confirmed that patients with bilirubin ≤0.6×ULN have a decreased risk for liver
transplantation or death (Figure 4-3, Table S4-2). Importantly, the association with a reduced
risk remained when all patients with normal bilirubin in which the ULN was defined as
≥1.2mg/dL were excluded from the analyses (HR 2.06, 95% CI 1.58-2.67, P < 0.0001). The
threshold of 0.6×ULN did not reach statistical significance in males, however bilirubin levels
above the threshold were also associated with an increased risk in these patients.
Figure 4-3. Sub-group analyses based on the bilirubin threshold of 0.6×ULN in patients with
normal bilirubin at 1 year. Hazard ratio for liver transplantation or death (95% CI) obtained from
multivariable Cox regression analyses in patients with normal bilirubin in various sub-groups.
The hazard ratios correspond to bilirubin levels >0.6×ULN (versus bilirubin ≤0.6×ULN).
Transplant-free survival hazard ratio ofbilirubin >0.6×ULN at 1 year (95%CI)
0 1 2 3 4 5 6
ALP>1.67×ULN 912
ALP≤1.67×ULN 1870
Histological stage (III-IV) 321
Histological stage (I-II) 896
UDCA-treated 2527
UDCA-untreated 254
Male 229
Female 2561
Age at study entry >55 1379
Age at study entry ≤55 1395
ULN of bilirubin ≥1.2mg/dl 861
ULN of bilirubin <1.2mg/dl 1420
Entire cohort 2793
Sub-groups n=

79
4.3.4 The risk for liver transplantation or death increases at bilirubin levels of 0.6×ULN
We assessed bilirubin on a continuous spectrum with a restricted spline function to evaluate
whether the predetermined threshold is the point at which the transplant-free survival hazard
ratio increases. The reference in each cohort was the predetermined threshold of 0.6×ULN. In
both cohorts, the risk for liver transplantation or death remained stable below 0.6×ULN (Figure
4-4). However, beyond this threshold, a linear relationship was observed between bilirubin and
the risk for liver transplantation or death that continued past the normal range. The test for
curvature, which establishes a non-linear relationship, was significantly different for the baseline
cohort (P < 0.0001) and for the 1-year cohort it approached significance (P = 0.08). As a
sensitivity analysis, the restricted spline function analysis was repeated using crude bilirubin
levels (mg/dL) (Figure S4-2). The spline function analyses were repeated with normal bilirubin
levels at other time points (2-4 years), which suggested that the threshold can be applied after 1
year of follow-up as a similar trend is observed (Figure S4-3).
Figure 4-4. The association between bilirubin levels (×ULN) and risk for liver transplantation or
death. Hazard ratios and 95% CI were estimated by a restricted cubic spline function in A) the
time zero cohort and B) the 1-year cohort. The bilirubin reference in each cohort is 0.6×ULN.

80
4.3.5 Patients who remain below 0.6×ULN over time have good long-term prognosis
To assess how the trajectory of bilirubin over time may be related with the development of a
clinical event (liver transplantation or death), bilirubin levels over the course of 5 years were
evaluated in patients with normal bilirubin at time zero. The patients were stratified according to
whether they developed a late clinical event from 5-10 years (n=132) or did not develop a
clinical event in the first 10 years of follow-up (n=979). Patients who had no clinical event after
10 years of follow-up presented with a mean bilirubin level of 0.55×ULN (95% CI 0.54-0.56)
and demonstrated stable bilirubin levels (below 0.6×ULN) in the first five years (Figure 4-5). In
contrast, patients who reached a clinical endpoint presented with slightly higher mean bilirubin
levels (0.63×ULN, 95% CI 0.59-0.67, P < 0.001) and exhibited a gradual increase within the
normal range that precluded the occurrence liver transplantation or death.
4.3.6 The proportion of patients with bilirubin ≤0.6×ULN increased over time
The proportion of patients with normal bilirubin has increased over time. Therefore, we assessed
if this was applicable with our threshold of 0.6×ULN in patients with already normal bilirubin at
baseline. Even in this group, there was a gradual increase over time in those with bilirubin
≤0.6×ULN over time, whom accounted for 48% in the 1970s but 73% after 2010 (Figure S4-4).
This further supports the notion that bilirubin within the normal may not indicate an absence of
risk in patients with PBC.

81
Figure 4-5. Mean bilirubin levels over 5 years in patients with normal bilirubin at study entry
and stratified by outcome. Trajectory of the mean bilirubin levels (×ULN) and 95% CI over the
first 5 years depending on whether they experienced a late clinical event between 5 and 10 years
(n=132) or no event within the first 10 years of follow-up (n=979). Clinical event is defined as
liver transplantation or death. All patients without a clinical event had a follow-up of at least 10
years.
Time (years)
Bili
rubi
n (x
ULN
)
0 1 2 3 4 50.0
0.5
1.5Late event (5-10 years)No event at 10 years (follow-up to 10 years)
1
0.6

82
4.4 Discussion This study is the first to report that bilirubin levels within the normal range are associated with
the risk for liver transplantation or death in patients with PBC. We demonstrated that bilirubin
levels ≤0.6×ULN at baseline and 1 year were associated with a decreased risk for liver
transplantation or death compared to patients with bilirubin above this threshold and that a
reduction in bilirubin within the ULN after 1 year of UDCA therapy was associated with
prolonged liver transplant-free survival. While the risk for liver transplantation or death was
stable when bilirubin levels were below 0.6×ULN, beyond this threshold, a positive linear
relationship was observed between bilirubin and the risk for a clinical event. These results were
confirmed in several sub-groups of patients. Our findings suggest that the interpretation of not
being at risk if bilirubin is within the normal range needs to be revised. This might have
implications for the number of patients that are eligible for clinical trials and that would be able
to receive novel second-line therapeutic agents. Furthermore, the results presented in this study
raise the question of whether there may be a similar trend present in other laboratory parameters.
Although previous studies reported that the ULN of bilirubin was the most predictive for liver
transplant-free survival in patients with PBC and considered a reasonable threshold (Lammers et
al., 2014), we found that the risk for liver transplantation or death is already increased when
bilirubin levels were above 0.6×ULN. The current ULN of bilirubin represents the 97.5
percentile cut-off in the general population, yet this may not be the best approach to determine an
optimal threshold since levels below this threshold are not reflective of an absence of increased
risk (Zucker et al., 2004). In part, this might be explained by the high percentage of individuals
with Gilbert’s syndrome in the general population, which ranges from 3-10% (Bosma et al.,
1995). These patients experience hyperbilirubinemia due to a genetic deficiency in UGT1A1,
the enzyme responsible for glucuronidation of unconjugated bilirubin, also rendering it water-
soluble for excretion through bile. Additionally, the current ULN of bilirubin may be a
suboptimal threshold for risk stratification in PBC due to the female predominance of the
disease, while sex differences in bilirubin are present in the general population (Podda, Selmi,
Lleo, Moroni, & Invernizzi, 2013). An American study based on the Third National Health and
Nutrition Examination Survey (NHANES III) assessed serum bilirubin levels in 16,865 adults
from the general population and reported that mean serum bilirubin levels are significantly lower
in women (0.52 mg/dL ± 0.003) than men (0.72 mg/dL ± 0.004) (Zucker et al., 2004).

83
Consequently, the 97.5 percentile cut-off was 0.5 mg/dL higher in men. Other studies have
reported similar sex differences in bilirubin levels in the general population (Rosenthal, Pincus,
& Fink, 1984; White, Nelson, Pedersen, & Ash, 1981). Thus, the overall ULN of bilirubin may
be skewed to higher levels in PBC because of the inclusion of both men and women. These
considerations suggest that the ULN for bilirubin may need to be stratified by sex, as has been
previously implemented for aspartate aminotransferase (Prati et al., 2002; Terrault et al., 2016).
We found that the predictive value of the bilirubin threshold of 0.6×ULN was irrespective of age,
treatment with UDCA, histological stage, or ALP levels. Importantly, it remained significantly
predictive at various independent time points. Furthermore, in patients treated with UDCA that
had a bilirubin level above 0.6×ULN but below the ULN at initiation of treatment, we found that
a reduction below 0.6 was associated with a significantly prolonged liver transplant-free survival
as compared to remaining within the normal range or increasing to an abnormal bilirubin level.
This suggests that besides the predictive value of bilirubin within the normal range, a treatment-
induced reduction of bilirubin within the current normal range is beneficial for long-term
prognosis, which could have important implications for current patient care, but also for the
design and interpretation of future clinical trials of potential second-line therapies in PBC. While
recent clinical trials have often included normalization of bilirubin as a primary endpoint, it
might be preferable to aim for lower bilirubin levels (Corpechot et al., 2017; Nevens et al.,
2016).
The pattern of bilirubin within the current normal range over time may also be relevant, as there
was an overall increase of 0.41×ULN in mean bilirubin during the first 5 years of follow-up in
patients who eventually reached a clinical endpoint after extended follow-up. While rapid
increases in bilirubin have been shown to preclude death in untreated patients, these results
suggest that there is an association between the trajectory of bilirubin and clinical outcomes even
if within the normal range (Shapiro et al., 1979). The fact that the mean bilirubin levels of
patients who did not experience a clinical event remained below 0.6×ULN over time further
supports an incentive to aim for bilirubin levels below our proposed threshold of 0.6×ULN.
Further, our findings emphasize the importance of the continuous clinical evaluation of patients’
bilirubin levels even in those with early stage disease.

84
A robust analysis of the predictive value of bilirubin within the normal range would not be
possible without the large number of patients and extended follow-up available from the
GLOBAL PBC Study Group cohort. Furthermore, bilirubin was assessed at multiple
independent time points to confirm that bilirubin levels obtained during a random follow-up
assessment could also be utilized for risk stratification. Nonetheless, some study limitations
should be noted. Bilirubin was available as total bilirubin; therefore, we could not assess
conjugated bilirubin levels independently or the conjugated/unconjugated bilirubin ratio.
Whereas, total serum bilirubin levels in healthy patients are primarily composed of unconjugated
bilirubin, total bilirubin in patients with PBC is predominantly conjugated bilirubin that leaks
into the serum when it is unable to be excreted through bile (Levitt & Levitt, 2014). Since PBC
is characterized by elevations in conjugated bilirubin and an altered conjugated/unconjugated
bilirubin ratio, it might be of additional relevance to measure conjugated bilirubin in future
studies of bilirubin (Levitt & Levitt, 2014). Standard clinical laboratories measure bilirubin
fractions, such as direct and indirect, with the diazo (Van den Bergh) reaction. Both conjugated
and delta bilirubin react directly with the diazo reagent, while unconjugated bilirubin does not.
Therefore, direct bilirubin is not synonymous to conjugated bilirubin, while poses a problem for
measuring conjugated bilirubin independently. Although bilirubin was analyzed based on the
ULN defined by local centers, which ranged from 0.6-1.7mg/dL, sensitivity analyses were
performed to address this. The analyses with crude bilirubin levels (mg/dL) as well as the one
excluding patients with an ULN above 1.2mg/dL confirmed our initial findings and exclude the
possibility that patients with bilirubin levels above 0.6×ULN have worse liver transplant-free
survival due to the utilization of high ULNs.
In this multi-center international follow-up study of patients with PBC, bilirubin levels below the
current ULN were shown to be predictive of liver transplant-free survival and 0.6×ULN was
established as the threshold from which point on the risk for liver transplantation or death
increases. Additionally, reduction within the current normal range to below 0.6×ULN was
associated with prolonged transplant-free survival. Our proposed threshold of 0.6× the current
ULN of bilirubin may be a more sensitive reference to identify patients at risk for a poor
outcome and represent a threshold that increases the number of patients included in intervention
studies that may benefit from therapeutic agents.

85
4.5 Supplementary Tables and Figures Table S4-1. Multivariable Cox regression analyses of various bilirubin thresholds in patients
with normal bilirubin at time zero to evaluate performance for the prediction of liver
transplantation and death
Threshold (×ULN)
C-statistic (95%CI) HR (95% CI) P value No. of patients ≤/> threshold
0.30 0.7320 (0.7036-0.7604) 1.63 (1.02-2.60) 0.042 272/2282
0.40 0.7357 (0.7076-0.7638) 1.53 (1.12-2.10) 0.008 649/1905
0.50 0.7390 (0.7113-0.7666) 1.54 (1.22-1.95) <0.001 1191/1363
0.55 0.7378 (0.7098-0.7658) 1.47 (1.17-1.84) 0.001 1347/1207
0.60 0.7397 (0.7117-0.7676) 1.53 (1.23-1.90) <0.001 1620/934
0.65 0.7456 (0.7181-0.7730) 1.73 (1.39-2.15) <0.001 1732/822
0.66 0.7457 (0.7182-0.7732) 1.72 (1.39-2.14) <0.001 1736/818
0.67 0.7443 (0.7167-0.7719) 1.64 (1.32-2.03) <0.001 1789/765
0.68 0.7415 (0.7136-0.7693) 1.58 (1.27-1.97) <0.001 1800/754
0.69 0.7423 (0.7146-0.7701) 1.60 (1.29-1.99) <0.001 1824/730
0.70 0.7436 (0.7159-0.7713) 1.69 (1.35-2.10) <0.001 1910/644
0.75 0.7435 (0.7161-0.7709) 1.79 (1.43-2.25) <0.001 2041/513
0.80 0.7421 (0.7143-0.7700) 1.73 (1.35-2.21) <0.001 2187/367
0.85 0.7432 (0.7154-0.7709) 1.87 (1.44-2.42) <0.001 2278/276
0.90 0.7434 (0.7157-0.7710) 2.19 (1.61-2.98) <0.001 2392/162
ULN, upper limit of normal; HR, hazard ratio; CI, confidence interval.
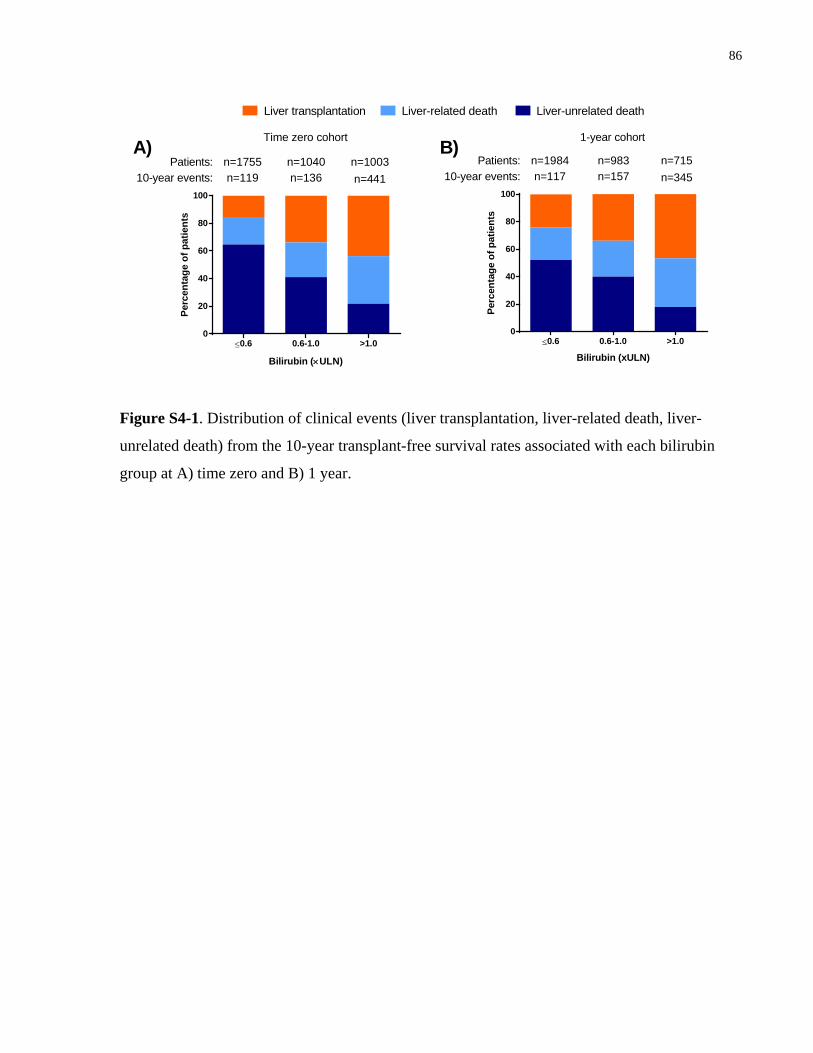
86
Figure S4-1. Distribution of clinical events (liver transplantation, liver-related death, liver-
unrelated death) from the 10-year transplant-free survival rates associated with each bilirubin
group at A) time zero and B) 1 year.
Bilirubin (×ULN)
Perc
enta
ge o
f pat
ient
s
≤0.6 0.6-1.0 >1.00
20
40
60
80
100
Patients:10-year events:
n=1755 n=1040 n=1003n=119 n=136 n=441
Time zero cohort
Bilirubin (xULN)
Perc
enta
ge o
f pat
ient
s
≤0.6 0.6-1.0 >1.00
20
40
60
80
100
Patients:10-year events:
n=1984 n=983 n=715n=117 n=157 n=345
1-year cohortA) B)
Liver-unrelated deathLiver-related deathLiver transplantation

87
Table S4-2. Multivariable analysis of 0.6×ULN threshold at 1 year in various sub-groups
Sub-group Number of patients
HR (95% CI) P value
ULN <1.2 mg/dL 1420 2.06 (1.58-2.67) <0.001
ULN ≥1.2 mg/dL 861 3.71 (2.37-5.82) <0.001
Age at study entry ≤55 1395 1.86 (1.31-2.64) 0.001
Age at study entry >55 1379 2.30 (1.79-2.97) <0.001
Female 2561 2.25 (1.81-2.79) <0.001
Male 229 1.31 (0.68-2.49) 0.42
UDCA-untreated 254 1.97 (1.04-3.73) 0.038
UDCA-treated 2527 2.17 (1.74-2.70) <0.001
Histological stage (I-II)a 896 2.10 (1.28-3.47) 0.004
Histological stage (III-IV)a 321 2.01 (1.74-3.29) 0.006
ALP ≤1.67×ULN 1870 1.95 (1.49-2.56) <0.001
ALP >1.67×ULN 912 2.39 (1.74-3.29) <0.001
HR, hazard ratio; CI, confidence interval; ULN, upper limit of normal; UDCA, ursodeoxycholic acid; ALP, alkaline phosphatase. aHistological stage determined at study entry.

88
Figure S4-2. The association between bilirubin levels (mg/dL) and risk for liver transplantation
or death. Hazard ratios and 95% CI were estimated by a restricted cubic spline function in A) the
time zero cohort and B) the 1-year cohort. The bilirubin reference in each cohort is 0.65 mg/dL
and the test for curvature is significant in both cohorts (P < 0.0001 and P = 0.04).

89
Figure S4-3. The association between bilirubin levels (×ULN) and risk for liver transplantation
(LT) or death. Hazard ratios and 95% CI were estimated by a restricted cubic spline function at
2-4 years. The bilirubin reference in each cohort is 0.6×ULN.

90
Figure S4-4. The distribution of patients with bilirubin below and above 0.6×ULN in those with
normal bilirubin at baseline (n=2791).
Year of diagnosis
Perc
enta
ge o
f pat
ient
s
1970-19791980-19891990-19992000-2009 ≥20100
20
40
60
80
100
≤0.6×ULN
>0.6×ULN
Baseline bilirubin
P < 0.001

91
Chapter 5
General Discussion 5
5.1 Calendar Time Trends
5.1.1 Discussion
Insight into the temporal changes of clinical features at presentation of PBC patients has been
limited. Studies suggest that patients diagnosed in recent decades are predominantly
asymptomatic (T. R. Baldursdottir et al., 2012; Floreani et al., 2011). There are also reports of an
increase in age at diagnosis, and no difference in the female: male ratios (Floreani et al., 2011;
Rautiainen et al., 2007; Sakauchi et al., 2007). Whether there is a difference in the survival rates
of patients according to year of diagnosis is inconclusive. One study from Finland reported
improved survival and a Canadian study did not find year of diagnosis to be a significant
predictor for survival (Myers et al., 2009; Rautiainen et al., 2007).
We sought to describe patient and disease characteristics over a 44-year period in a globally
representative population. This study contains the most comprehensive evidence to date due to
its size, long-term follow-up, and the inclusion of multiple centers worldwide. The main findings
from this retrospective study indicated that the mean age at diagnosis increased by 2-3 years per
decade from 47 years to 57 years, the female to male ratio and AMA-positivity were unchanged,
the proportion of patients presenting with mild biochemical and histological disease stage
increased, more patients responded to UDCA, and there were lower decompensation rates and
higher transplant-free survival rates in more recent decades. These results support the hypothesis
that the natural of history of PBC has changed over time. The most plausible contributors to the
observed changes in the natural history of PBC are improved awareness, early diagnosis, and
availability of treatment. However, the possibility that these changes may also be due to
environmental factors cannot be excluded since multiple studies have indicated that the incidence
of PBC is increasing in various geographical regions (Al-Harthy & Kumagi, 2012; Floreani et
al., 2011).

92
5.1.1.1 Symptoms
A key difference in patients diagnosed in recent times compared to those diagnosed in earlier
times is symptomology, as previous studies have consistently reported a decrease in the
proportion of symptomatic patients (T. R. Baldursdottir et al., 2012; Floreani et al., 2011).
Symptoms are an important aspect to consider when assessing these temporal trends, as studies
show that asymptomatic PBC patients present with an earlier histological stage and improved
biochemical measures (Mitchison et al., 1990). Furthermore, symptomatic presentation may
predict an inadequate response to UDCA and poor prognosis (Jones, Al-Rifai, Frith, Patanwala,
& Newton, 2010; Quarneti et al., 2015). Although asymptomatic PBC is generally less severe at
diagnosis than symptomatic, being asymptomatic is not always synonymous with having an early
disease (Kumagi & Heathcote, 2008). Unfortunately, an evaluation of the changes in
symptomology was not possible because this information was not available in the GLOBAL
PBC database. Since most patients nowadays present without symptoms, we speculate that
patients diagnosed in recent decades from our cohort were predominantly asymptomatic.
5.1.1.2 AMA testing and diagnosis
One of the current diagnostic criteria for PBC is seropositivity for AMA. The conventional
method for AMA detection is IIF, yet there has been an increase in ELISA-based assays and
immunoblotting due to the identification of specific antigen reactivity (Oertelt et al., 2007).
These improvements have led to greater sensitivity and specificity when detecting AMA.
However, there is still heterogeneity in the results and antigenic epitopes tested across
laboratories. Furthermore, patients are generally screened for AMA after they demonstrate
cholestatic laboratory results, such as elevated ALP or GGT. Improvements in the sensitivity of
AMA tests would hypothetically translate to an increase in the proportion of AMA-positive
patients, however this has remained unchanged in our cohort. Therefore, we speculate that any
changes in the techniques used for AMA testing have not played a major role in the distinct
presentation of patients over calendar time. A significant role on the observed changes is
expected to result from increased physician awareness and routine testing of liver function in
recent years, which suggests that earlier cohorts were largely composed of patients that were
diagnosed due to symptoms/complications and only a minority of patients’ diagnosis were
prompted by routine testing.

93
5.1.1.3 Age relative to the general population
In line with our findings, there have been reports that the age at diagnosis has increased over
time in Italian and Japanese populations (Floreani et al., 2011; Sakauchi et al., 2007). Increased
routine testing in recent years may account for the increase in older patients being diagnosed
with PBC, as screening occurs more frequently in the elderly (Spalding & Sebesta, 2008). The
increase in age at diagnosis may potentially be associated with the increase in age seen in the
general population, therefore it is critical that the age data be compared to that of the general
population. In the PBC population, there was a gradual increase in the proportion of patients 50
years old and above at the time of diagnosis from 38% in the 1970s to 72% after 2010, an overall
increase of 34% in the investigated time frame. In the general population there has been an
overall increase of 11% in the proportion of individuals ≥50 years old, which increased from
25% in 1970 to 36% in 2015 (United Nations, Department of Economic and Social Affairs,
2017). When comparing age trends in PBC patients to that of the general population, the
percentage of patients ≥50 years old are overall higher in the PBC population, which may reflect
the restricted age spectrum observed in PBC since patients under 18 years old were excluded and
PBC typically affects middle-aged individuals. It is logical that there are higher proportions of
this age group in the PBC cohort compared to that of the general population. Yet, the increase of
this age group in the PBC population was greater compared to that of the general population
within the specified time frame. This suggests that there may be additional factors contributing to
the increase in age observed in PBC other than an aging population. Additional potential
contributors to the increase in age include a delayed trigger for PBC as a result of changes in
environmental factors or a longer incubation period from when there is AMA-positivity to the
development of abnormal liver biochemistry.
5.1.1.4 Biochemical and histological disease stage
Liver biochemistry and histological findings in the GLOBAL PBC cohort indicated that patients
presented at an earlier disease stage, which can also be attributed to improved patient care and an
earlier diagnosis of PBC. A study from Iceland compared the proportion of patients who
presented with an advanced histological stage (III-IV) in 1991-2000 to those from 2001-2010
and reported no difference over time, accounting for 28% of patients (T. R. Baldursdottir et al.,
2012). Interestingly, they did note a decrease in the proportion of asymptomatic patients, which

94
further supports the notion that symptoms may not directly correlate with histology. In contrast,
we noted patients with an advanced histological stage (III-IV) accounted for 33% in 1990-1999
and that there was a decrease to 23.5% in 2000-2014.
5.1.1.5 Treatment regimen with UDCA
The availability and timing of treatment for PBC can have a major impact on response to
treatment and the subsequent development of clinical outcomes. Although UDCA was used as
off-label therapy starting in the late 1980s, it did not gain FDA approval until 1997. UDCA is
the standard treatment for PBC because it has been shown to delay histological progression and
improve survival (Parés et al., 2000; Shi et al., 2006). The introduction of UDCA was likely a
major contributor for the decrease in the number of liver transplantations for PBC, compared to
the unchanged number of liver transplantations for PSC, a similar chronic disease to PBC for
which there is no available treatment (Lee et al., 2007). Even when UDCA was available for the
treatment of PBC, it seems that the treatment regimen was not optimal, as inappropriate dosages
were administered in earlier decades that deviated from the currently recommended dosage of
13-15mg/kg/day.
Another aspect in the treatment regimen of PBC that has greatly changed over time is timing to
treatment. Although there was a substantial portion (88%) of patients who were diagnosed in the
1980s that received UDCA, they still experienced worse response rates and transplant-free
survival rates compared to patients diagnosed in more recent decades. Time to treatment was a
critical factor that influenced their outcomes since they received UDCA many years after their
diagnosis. In our analysis, the time from diagnosis to study entry was a significant predictor for
hepatic decompensation, HCC development, and transplant-free survival. In the time between
their diagnosis and the start of treatment, the disease had an opportunity to progress and therefore
the introduction of UDCA at this more advanced disease stage would not be as beneficial had it
been administered at an earlier disease stage (Parés et al., 2000; Shi et al., 2006). The time lag to
treatment administration is the greatest in the earlier cohorts and is likely attributable to the lack
of availability of UDCA. Overall, this suggests that the treatment regimen of PBC with UDCA
has improved considerably by the usage of more appropriate dosages and a prompt initiation
after diagnosis.
95
5.1.1.6 Clinical outcomes
As mentioned, there has been an increase in median age and the proportion of individuals ≥50
years old in the general population, which reflects an increase in life expectancy (median life)
over time. We showed that transplant-free survival increased over calendar time in PBC patients,
as is also expected in the general population. Therefore, we compared transplant-free survival
over time with respect to an age-, gender-, and birth year-matched general population. These
results indicated that the survival of PBC patients has improved over time even when compared
to the general population. An increase in survival over calendar time, especially when compared
to the general population, has not been previously shown in a globally representative population.
A Canadian study failed to show an improvement in survival from 1996 to 2002 most likely due
to the short period analyzed (Myers et al., 2009). A study from Finland that evaluated survival
from 1988 to 1999 reported improved survival, in which the age-, gender- and study area-
adjusted HR for all-cause mortality was 0.6 per a 10-year increase in year (Rautiainen et al.,
2007). An improved transplant-free survival may be potentially associated with the strongly
documented increase in the prevalence of in various geographical regions.
There was no difference in HCC incidence after the 1980s, however there was a decrease in
decompensation over time. This can be attributed the overall low incidence of HCC when
compared to decompensation. Therefore, one is unable to capture any differences due to the
small number of events.
5.1.1.7 Trends in primary sclerosing cholangitis
It is relevant to assess how the natural history of another cholestatic liver disease may have
evolved over time as compared to PBC. A Swedish study compared the clinical presentation of
patients with PSC between 1984 and 2004 with an emphasis on patients diagnosed before 1998
and after 1998. In the later cohort of patients diagnosed after 1998, they found an older age at
diagnosis (41 years old vs 37 years old), a lower frequency of symptoms (47% vs 63%), and a
lower rate of inflammatory bowel disease (IBD) (Bergquist et al., 2007). The lower age in the
earlier cohort was partially attributed to the higher proportion of patients with IBD, since these
patients undergo regular clinical check-ups. These results suggest that an increase in age may not
be specific to PBC and that it may also be applicable to other liver diseases. Furthermore, it

96
indicates that overall health care has improved, and patients with various liver diseases are being
diagnosed at an earlier disease stage without symptoms. A key difference between these two
diseases is that PBC exhibits improved outcomes relative to PSC, as suggested by the stable
number in liver transplantations for PSC, compared to a decrease in liver transplantations for
PBC.
5.1.2 Strengths and limitations
5.1.2.1 Strengths
There are strengths associated with this study that entail the population in which it was
performed, and the methodology used. The first strength of the GLOBAL PBC cohort is that it is
a multicenter cohort that includes centers through Europe and North America. This makes the
study unique from other studies that have also evaluated changes in patient characteristic because
the changes can be extrapolated to various geographical regions, rather than be limited to a
certain geographical region. Furthermore, due to the inclusion of patients dating back to the
1960s and their long-term follow-up, an analysis of a broad time period was possible, as well as
their respective rates of complications and outcomes. The 44-year period that was assessed is not
only the longest time period assessed for such a descriptive study, but it also spans the time prior
to UDCA and after UDCA, which allowed us to gain insight into how the introduction of this
treatment affected its natural history.
The survival of the general population has undoubtedly increased over time. Therefore, a simple
description of changes over time would not have been sufficient because it is expected that
survival has improved over time. Therefore, it was critical for the survival to be compared to that
of the general population to adequately assess whether survival indeed changed over time.
5.1.2.2 Limitations
Most epidemiological studies of PBC have been conducted in patients from Western countries
and less so in other populations, such as Asian or Hispanic populations. One of the limitations of
this study is also the limited ethnicity of the population, as the only centers included were from
Europe and North America. Therefore, it is still uncertain whether these changes are applicable
to other ethnic populations or from other geographical locations, especially in populations that

97
have been reported to have a more severe disease stage, such as African American and Hispanic
populations (Peters et al., 2007). Similar results are to be expected, however, as a study on the
temporal trends of a symptomatic Japanese population also reported an increase in age and
improved liver biochemistry at study entry (Sakauchi et al., 2007).
Another limitation of this study is that the association of the observed changes could not be
correlated to symptoms or other environmental factors that have been previously reported to be
associated with PBC, such as smoking, UTIs, and hormonal replacement therapy because these
variables were absent from the GLOBAL PBC database. It would be of relevance to assess their
potential association because it is possible that evolving habits in terms of these environmental
factors may have contributed to a delay in PBC presentation and its associated milder disease
severity.
5.1.3 Implications
We have provided a description of the presenting disease characteristics of a typical PBC patient
seen by physicians during a specified time frame. This in itself is useful because it proves that
the disease is not static and has evolved over time. It also documents the influence that UDCA
has had on the natural history of PBC, as well as the improved health care over time. This is
reassurance that the improvement of care for patients with PBC through an early diagnosis and
timely access to treatment can translate into improved outcomes for patients. Furthermore, it
emphasizes that there are various factors affecting the outcome in patients, including diagnosis
year, availability to treatment, time to treatment, dosage of UDCA, as well as baseline disease
characteristics.
As the disease has proven to not be static and evolving, the prognostic parameters used in the
clinic should be in line with the patients of today. For example, the Mayo model was developed
in a time when patients were at a symptomatic and advanced stage without available treatment.
This model is not applicable in the PBC population of today and has been found to underestimate
the survival of patients.

98
Bilirubin is one of the major predictors for prognosis, it is included in various prognostic models
and response criteria, and the number of patients presenting with normal bilirubin increased over
time, thus this biochemical parameter was further evaluated in the second study.
5.2 Bilirubin Within the Normal Range
5.2.1 Discussion
Up to date, the majority of studies have made an emphasis on normal bilirubin, as indicated by
the inclusion of this criterion for various response criteria, such as Paris-I, Paris-II, and
Rotterdam. Indeed, a study that evaluated various thresholds of bilirubin reported that the best
threshold for predicting liver transplantation or death was at the ULN but did not assess
thresholds below the ULN (Lammers et al., 2014). Bilirubin is not abnormal until later stages of
disease and thus, the predictive value of bilirubin is thought to be limited during early stages of
disease to a small number of patients. In our first study, we showed that there has been an
increasing proportion of patients that have normal bilirubin at study entry, and presumably an
even higher number after 1 year of treatment because of the effect of UDCA on bilirubin. A
recent clinical trial on OCA showed that bilirubin decreased even within the normal range and it
is unknown whether this translates to an improved outcome. We sought to determine whether
bilirubin levels below the ULN could be predictive of transplant-free survival.
When we evaluated the predictive value of bilirubin below the ULN, a bilirubin threshold of
0.6×ULN was established as the optimal threshold. Patients with bilirubin levels below this
threshold possess the lowest risk for liver transplantation or death, whereas the risk increases
linearly above this threshold. Furthermore, we show that in patients who are above the threshold
and subsequently experience a decrease in bilirubin to below the threshold as a result of
treatment with UDCA, there is an improvement in transplant-free survival. It was also suggested
that increasing bilirubin levels over time above this threshold may indicate the future
development of a poor clinical outcome.
5.2.1.1 Sensitivity of ULN of bilirubin for predicting outcome
Our results indicate that the current ULN for bilirubin may not be a sensitive indicator of risk in
PBC. One potential reason for this finding is that PBC is a female predominant disease, yet the

99
ULN is determined in the general population, whereby male bilirubin values may skew the ULN
as they tend to have higher bilirubin levels than females. Furthermore, we speculate that it may
have to do with the relative increase in bilirubin required to reach the ULN, given the modal
bilirubin level in a healthy population was 0.4mg/dL (Zucker et al., 2004). The ULN is usually
between 1-1.2mg/dL, which suggests an increase of 0.6-0.8mgdL would be required.
5.2.1.2 Bilirubin in the general population
There is a positive relationship with bilirubin and the risk for liver transplantation and death
beyond the 0.6× ULN threshold in PBC. Interestingly, there appears to be a different relationship
with bilirubin in individuals without liver disease, in whom increased bilirubin levels have been
associated with a decreased incidence of cardiovascular, rectal cancer, and diabetes (Levitt &
Levitt, 2014; Zucker et al., 2004). In an NHANES study of 4303 individuals 60 years old and
above from 1999 to 2004, individuals with bilirubin between 0.1-0.4mg/dL had the highest
mortality rates. In comparison to those with bilirubin of 0.5-0.7mg/dL, they had a 1.36-fold
increase in risk. Although individuals with bilirubin ≥0.8mg/dL also had higher mortality rates, it
was not statistically significant (Ong et al., 2014). The anti-inflammatory and antioxidant
properties of bilirubin may account for these differences. Furthermore, it is important to keep in
mind that total bilirubin is primarily composed of unconjugated bilirubin in these individuals as
compared to PBC patients, in which elevated bilirubin would be primarily composed of
conjugated bilirubin.
5.2.1.3 Risk stratification in PBC
There are various liver biochemistry parameters that may be utilized in PBC for risk stratification
of which ALP and bilirubin are the primary parameters (Lammers et al., 2014). These are readily
available as they are usually routinely checked in patients, and thus represent a primary means
for risk stratification. However, established response criteria rely on these biochemical
parameters in a dichotomized form, which may lead to a loss in predictive ability. Therefore, risk
stratification in PBC has recently shifted towards prognostic models that utilize various liver
biochemistries to predict transplant-free survival such as the GLOBE score (Lammers et al.,
2015). This score was shown to be superior to other response criteria, potentially because
bilirubin in addition to the other biochemical variables included were input into this model as a

100
continuous variable and it includes a variety of prognostic variables for PBC. Response criteria
in which normal bilirubin was a component would lose the increased risk imposed on patients
with normal bilirubin whose levels were above 0.6×ULN.
Biochemical parameters and prognostic models that rely on these biochemical parameters are the
preferred method for risk stratification as compared to liver biopsies. Although histological
staging provides important prognostic information, it is no longer routinely performed due to its
invasive nature. Transient elastography is a promising tool to assess liver fibrosis by measuring
liver stiffness, yet this may not be the best manner to assess response to therapy after a short
period of time, as changes in fibrosis may not be observed until longer follow-up takes place.
Therefore, liver biochemistry parameters represent an important manner of assessing prognosis
as they are easily attainable and can provide long-term prognostic information (Lammers et al.,
2015).
5.2.2 Strengths and limitations
5.2.2.1 Strengths
The strengths of this study include the large number of patients from a globally representative
population and long-term follow-up. In terms of methodology, the predictive ability of bilirubin
was not only assessed at baseline but also up to 4 years of follow-up, which confirms that the
bilirubin threshold can be applied at various independent time points. This is important because
it allows the implementation of the threshold before treatment, and after therapy to assess
whether the patient requires additional therapy. Indeed, we showed that a reduction in bilirubin
by treatment with UDCA can translate into an improved prognosis. The applicability of the
threshold was found in multiple subgroups, stratified according to age, histological stage, ALP,
and UDCA treatment, which emphasizes that the threshold is generalizable. Although the
threshold was not statistically significant in males, we attribute it to a lack of power due to the
small sample size.
Another strength of this study is that the risk imposed by bilirubin levels above 0.6×ULN was
interpreted relative to that associated with bilirubin above the ULN. This allowed us to
demonstrate that there was a positive relationship between bilirubin and the risk for liver
transplantation or death after 0.6×ULN that extended beyond the ULN. We also underline that

101
there is not only an increased risk for liver transplantation or death above 0.6×ULN, but that
the events are primarily liver-related in this range. Additionally, we were able to assess trends
in bilirubin over 5 years and its relationship with clinical events due to the imputation of
bilirubin. Imputation is a way to deal with missing data by replacing the missing values with an
estimate that is then analyzed as if they were observed values. It provides an unbiased way to
deal with missing data for analysis.
5.2.2.2 Limitations
The study has some limitations. In PBC, conjugated bilirubin is the form that is mainly elevated
and thus it would be beneficial to measure this type of bilirubin to directly measure the effect of
cholestasis on bilirubin levels (Levitt & Levitt, 2014). However, conjugated bilirubin was not
available and only total bilirubin was available in the GLOBAL PBC database. This is due to
the fact that clinical laboratories can only measure direct and indirect bilirubin through the
diazo reaction, in which direct bilirubin does not only include conjugated bilirubin but also
delta bilirubin. Therefore, in order to measure the conjugated bilirubin fraction separately, one
would need to implement other methods, such as high/performance liquid chromatography or
direct spectrophotometry, which are not ideal for routine use.
Furthermore, bilirubin was assessed relative to the ULN of each center, which was variable
across each center. Patients from centers that have a higher ULN may have accounted for the
increased events observed above 0.6×ULN. However, this limitation was overcome by
excluding those with an ULN above 1.2mg/dL and assessing crude bilirubin levels measured in
mg/dL.
5.2.3 Implications
Since patients with bilirubin between 0.6×ULN and 1×ULN are already at an increased risk for
liver transplantation or death, future intervention studies that assess the benefit of therapeutic
drugs may also include these patients since they may be able to benefit from additional therapies.
One of the clinical trials for OCA specified that patients must either have ALP≥1.67×ULN or
abnormal bilirubin (up to 2×ULN) to be included in the study (Nevens et al., 2016). Whereas, the
BEZURSO trial of bezafibrate adjuvant to UDCA indicated that patients included must be non-
responders to Paris-II criteria which also includes abnormal bilirubin (Corpechot et al., 2017).

102
We believe that patients whose bilirubin levels are above the threshold of 0.6×ULN may still
benefit from these therapeutic trials, and if the threshold is implemented, it can lead to an
increase in the number of patients that will become eligible for second-line therapies. This is of
relevance because only a minority of patients that are included in these trials have an abnormal
bilirubin. For example, in the OCA trial, 6% of patients had an abnormal bilirubin in the 5-10mg
group and 10% in 10mg group of OCA (Nevens et al., 2016). Our findings also give insight into
the implications of changes in bilirubin seen in these trials. Depending on the randomization
group, patients included had a mean bilirubin level of 0.69mg/dL (placebo), 0.60mg/dL (OCA
5-10mg), and 0.66mg/dL (OCA 10mg) at baseline. Patients randomized to receive OCA
experienced decreases in bilirubin, whereas the placebo group experienced an increase. Our
results suggest that decreases in bilirubin in the range from 1×ULN to 0.6×ULN are still
beneficial irrespective of whether patients attain the 0.6×ULN threshold. Additionally, in the
BEZURSO trial, mean bilirubin at study entry was 0.8mg/dL after which the median decrease in
patients receiving bezafibrate and UDCA after 2 years was 14% (Corpechot et al., 2017). In
light of these results from clinical trials assessing the benefit of second-line therapies for PBC,
we believe that our study grants insight into how bilirubin changes within the normal range
observed as a result of treatment correlate with transplant-free survival that goes beyond a
normalization of bilirubin being associated with improved prognosis.
Our study also has the implication of early determination of patients that may be at risk for a
future outcome. Currently, patients are not considered at risk if their bilirubin is normal, and thus
may be overlooked until it surpasses the normal range. This emphasizes that patients who are
above the 0.6×ULN threshold but experience gradual increases in bilirubin that remain within the
normal range may be at risk for liver transplantation or death and should be closely monitored.

103
Chapter 6
Conclusions 6The natural history of PBC has proven to be evolving over time and patients diagnosed in recent
decades have an increased age at diagnosis, a predominantly mild disease stage at presentation,
and improved clinical outcomes. Furthermore, we established that patients with bilirubin
≤0.6×ULN have the lowest risk for liver transplantation or death, from which point onward there
is a linear increase in risk.

104
Chapter 7
Future Directions 7Our study provides the most comprehensive evidence to date for a changing natural history of
PBC. However, there are still some questions that need exploration. One potential research
question that can be addressed is whether the changes observed in this population are also
observed in other populations, such as African Americans and Hispanics, in whom PBC tends to
have a more advanced disease stage. Furthermore, the increase in age of patients is peculiar
given that they present with an earlier disease stage. Therefore, the potential influence of
changing environmental factors on the increase in age can be explored in future studies, such as
smoking.
The natural history of PBC has changed primarily due to the introduction of UDCA as the
majority of changes were observed thereafter. The introduction of a new treatment for PBC may
drive further changes. Therefore, it would be interesting to determine how the natural history of
PBC may change in the future with the introduction of OCA or other therapeutic agents and
whether it may impose greater improvements on transplant-free survival.
Bilirubin was found to be an independent predictor of transplant-free survival even within the
normal range. The fact that the normalization of bilirubin is not associated with an absence of
risk raises the question of whether the same may be true for other biochemical parameters such
as ALP. A future study may assess the predictive value of ALP below 1.67×ULN in UDCA-
treated patients, as current studies use this threshold for inclusion in clinical trials and as part of
the primary endpoint. An elevation of ALP is necessary for a diagnosis of PBC, therefore its
predictive ability below 1.67×ULN need be assessed starting after 1 year of treatment, at which
point decreases in ALP are observed.
It may be that bilirubin imposes different risks in the general population compared to PBC
patients. In the general population, it seems that low conjugated bilirubin levels are associated
with an increased risk for mortality. Therefore, it would be of interest to compare mortality of
patients with PBC to that of the general population while adjusting for bilirubin and stratifying
conjugated and unconjugated bilirubin to gain further insight into the role of bilirubin in PBC.
105
References Abdulkarim, A. S., Petrovic, L. M., Kim, W. R., Angulo, P., Lloyd, R. V, & Lindor, K. D.
(2004). Primary biliary cirrhosis: an infectious disease caused by Chlamydia pneumoniae? Journal of Hepatology, 40(3), 380–384.
Aboutwerat, A., Pemberton, P. W., Smith, A., Burrows, P. C., McMahon, R. F., Jain, S. K., & Warnes, T. W. (2003). Oxidant stress is a significant feature of primary biliary cirrhosis. Biochimica et Biophysica Acta, 163(2), 142–150.
Abu-Mouch, S., Selmi, C., Benson, G. D., Kenny, T., Invernizzi, P., Zuin, M., … Gershwin, M. E. (2003). Geographic clusters of primary biliary cirrhosis. Clinical and Developmental Immunology, 10(2–4), 127–131.
Al-Harthy, N., & Kumagi, T. (2012). Natural history and management of primary biliary cirrhosis. Hepatic Medicine: Evidence and Research, 4, 61–71.
Ala, A., Stanca, C. M., Bu-Ghanim, M., Ahmado, I., Branch, A. D., Schiano, T. D., … Bach, N. (2006). Increased prevalence of primary biliary cirrhosis near Superfund toxic waste sites. Hepatology, 43(3), 525–531.
Alempijevic, T., Krstic, M., Jesic, R., Jovanovic, I., Sokic Milutinovic, A., Kovacevic, N., … Popovic, D. (2009). Biochemical markers for non-invasive assessment of disease stage in patients with primary biliary cirrhosis. World Journal of Gastroenterology, 15(5), 591–594.
Almasio, P. L., Floreani, A., Chiaramonte, M., Provenzano, G., Battezzati, P., Crosignani, A., … Craxì, A. (2000). Multicentre randomized placebo-controlled trial of ursodeoxycholic acid with or without colchicine in symptomatic primary biliary cirrhosis. Alimentary Pharmacology & Therapeutics, 14(12), 1645–1652.
Amano, K., Leung, P. S., Rieger, R., Quan, C., Wang, X., Marik, J., … Gershwin, M. E. (2005). Chemical xenobiotics and mitochondrial autoantigens in primary biliary cirrhosis: identification of antibodies against a common environmental, cosmetic, and food additive, 2-octynoic acid. Journal of Immunology, 174(9), 5874–5883.
Angulo, P., Dickson, E. R., Therneau, T. M., Jorgensen, R. A., Smith, C., DeSotel, C. K., … Lindor, K. D. (1999). Comparison of three doses of ursodeoxycholic acid in the treatment of primary biliary cirrhosis: a randomized trial. Journal of Hepatology, 30(5), 830–835.
Angulo, P., Lindor, K. D., Therneau, T. M., Jorgensen, R. A., Malinchoc, M., Kamath, P. S., & Dickson, E. R. (1999). Utilization of the Mayo risk score in patients with primary biliary cirrhosis receiving ursodeoxycholic acid. Liver, 19(2), 115–121.

106
Azemoto, N., Abe, M., Murata, Y., Hiasa, Y., Hamada, M., Matsuura, B., & Onji, M. (2009). Early biochemical response to ursodeoxycholic acid predicts symptom development in patients with asymptomatic primary biliary cirrhosis. Journal of Gastroenterology, 44(6), 630–634.
Bach, N., & Schaffner, F. (1994). Familial primary biliary cirrhosis. Journal of Hepatology, 20(6), 698–701.
Balasubramaniam, K., Grambsch, P. M., Wiesner, R. H., Lindor, K. D., & Dickson, E. R. (1990). Diminished survival in asymptomatic primary biliary cirrhosis. A prospective study. Gastroenterology, 98(6), 1567–1571.
Baldursdottir, T., Bergmann, O. M., Jonasson, J. G., Ludviksson, B. R., Axelsson, T. A., & Björnsson, E. S. (2012). The epidemiology and natural history of primary biliary cirrhosis: a nationwide population-based study. European Journal of Gastroenterology and Hepatology, 24(7), 824–830.
Baldursdottir, T. R., Bergmann, O. M., Jonasson, J. G., Ludviksson, B. R., Axelsson, T. A., & Björnsson, E. S. (2012). The epidemiology and natural history of primary biliary cirrhosis: a nationwide population-based study. European Journal of Gastroenterology and Hepatology, 24(7), 824–830.
Ballardini, G., Mirakian, R., Bianchi, F. B., Pisi, E., Doniach, D., & Bottazzo, G. F. (1984). Aberrant expression of HLA-DR antigens on bileduct epithelium in primary biliary cirrhosis: relevance to pathogenesis. Lancet, 2(8410), 1009–1013.
Battezzati, P. M., Podda, M., Bianchi, F. B., Naccarato, R., Orlandi, F., Surrenti, C., … Manenti, F. (1993). Ursodeoxycholic acid for symptomatic primary biliary cirrhosis. Preliminary analysis of a double-blind multicenter trial. Italian Multicenter Group for the Study of UDCA in PBC. Journal of Hepatology, 17(3), 332–338.
Bergquist, A., Said, K., & Broomé, U. (2007). Changes over a 20-year period in the clinical presentation of primary sclerosing cholangitis in Sweden. Scandinavian Journal of Gastroenterology, 42(1), 88–93.
Bittencourt, P. L., Farias, A. Q., Abrantes-Lemos, C P Goncalves, L. L., Goncalves, P. L., Magalhães, E. P., Carrilho, F. J., … Cançado, E. L. (2004). Prevalence of immune disturbances and chronic liver disease in family members of patients with primary biliary cirrhosis. Journal of Gastroenterology and Hepatology, 19(8), 873–878.
Bogdanos, D. P., Baum, H., Grasso, A., Okamoto, M., Butler, P., Ma, Y., … Vergani, D. (2004). Microbial mimics are major targets of crossreactivity with human pyruvate dehydrogenase in primary biliary cirrhosis. Journal of Hepatology, 40(1), 31–39.
Bonnand, A. M., Heathcote, E. J., Lindor, K. D., & Poupon, R. E. (1999). Clinical significance of serum bilirubin levels under ursodeoxycholic acid therapy in patients with primary biliary cirrhosis. Hepatology, 29(1), 39–43.

107
Boonstra, K., Beuers, U., & Ponsioen, C. Y. (2012). Epidemiology of primary sclerosing cholangitis and primary biliary cirrhosis: a systematic review. Journal of Hepatology, 56(5), 1181–1188.
Boonstra, K., Kunst, A. E., Stadhouders, P. H., Tuynman, H. A., Poen, A. C., van Nieuwkerk, K. M., … Epi PSC PBC study group. (2014). Rising incidence and prevalence of primary biliary cirrhosis: a large population-based study. Liver International, 34(6), e31–e38.
Bosch, A., Dumortier, J., Maucort-Boulch, D., Scoazec, J. Y., Wendum, D., Conti, F., … Corpechot, C. (2015). Preventive administration of UDCA after liver transplantation for primary biliary cirrhosis is associated with a lower risk of disease recurrence. Journal of Hepatology, 63(6), 1449–1458.
Bosma, P. J., Roy Chowdhury, J., Bakker, C., Gantla, S., De Boer, A., Oostra, B. A., … Roy Chowdhury, N. (1995). The genetic basis of the reduced expression of bilirubin UDP-glucuronosyltransferase 1 in gilbert’s syndrome. New England Journal of Medicine, 333(18), 1171–1175.
Bown, R., Clark, M. L., & Doniach, D. (1975). Primary biliary cirrhosis in brothers. Postgraduate Medical Journal, 51(592), 110–115.
Carbone, M., Mells, G. F., Pells, G., Dawwas, M. F., Newton, J. L., Heneghan, M. A., … Jones, D. E. (2013). Sex and age are determinants of the clinical phenotype of primary biliary cirrhosis and response to ursodeoxycholic acid. Gastroenterology, 144(3), 560-569.e7; quiz e13-4.
Carbone, M., Sharp, S. J., Flack, S., Paximadas, D., Spiess, K., Adgey, C., … Kordul, J. (2016). The UK-PBC risk scores: Derivation and validation of a scoring system for long-term prediction of end-stage liver disease in primary biliary cholangitis. Hepatology, 63(3), 930–950.
Cash, W. J., McCance, D., Young, I. S., McEneny, J., Cadden, I. S., Mcdougall, N. I., & Callender, M. E. (2010). Primary biliary cirrhosis is associated with oxidative stress and endothelial dysfunction but not increased cardiovascular risk. Hepatology Research, 40, 1098–1106.
Cauch-Dudek, K., Abbey, S., Stewart, D. E., & Heathcote, E. J. (1998). Fatigue in primary biliary cirrhosis. Gut, 43(5), 705–710.
Charatcharoenwitthaya, P., Pimentel, S., Talwalkar, J. A., Enders, F. T., Lindor, K. D., Krom, R. A., & Wiesner, R. H. (2007). Long-term survival and impact of ursodeoxycholic acid treatment for recurrent primary biliary cirrhosis after liver transplantation. Liver Transplantation, 13(9), 1236–1245.
Chohan, M. R. (1973). Primary biliary cirrhosis in twin sisters. Gut, 14(3), 213–214.

108
Christensen, E., Crowe, J., Doniach, D., Popper, H., Ranek, L., Rodés, J., … Williams, R. (1980). Clinical pattern and course of disease in primary biliary cirrhosis based on an analysis of 236 patients. Gastroenterology, 78(2), 236–246.
Combes, B., Emerson, S. S., Flye, N. L., Munoz, S. J., Luketic, V. A., Mayo, M. J., … Hofmann, A. F. (2005). Methotrexate (MTX) plus ursodeoxycholic acid (UDCA) in the treatment of primary biliary cirrhosis. Hepatology, 42(5), 1184–1193.
Corpechot, C., Abenavoli, L., Rabahi, N., Chretien, Y., Andreani, T., Johanet, C., … Poupon, R. (2008). Biochemical response to ursodeoxycholic acid and long-term prognosis in primary biliary cirrhosis. Hepatology, 48(3), 871–877.
Corpechot, C., Carrat, F., Bahr, A., Chrétien, Y., Poupon, R.-E., & Poupon, R. (2005). The effect of ursodeoxycholic acid therapy on the natural course of primary biliary cirrhosis. Gastroenterology, 128(2), 297–303.
Corpechot, C., Carrat, F., Poupon, R., & Poupon, R. E. (2002). Primary biliary cirrhosis: incidence and predictive factors of cirrhosis development in ursodiol-treated patients. Gastroenterology, 122(3), 652–658.
Corpechot, C., Chazouillères, O., & Poupon, R. (2011). Early primary biliary cirrhosis: Biochemical response to treatment and prediction of long-term outcome. Journal of Hepatology, 55(6), 1361–1367.
Corpechot, C., Chazouillères, O., Rousseau, A., Guyader, D., Habersetzer, F., Mathurin, P., … Poupon, R. (2017). A 2-year multicenter, double-blind, randomized, placebo-controlled study of bezafibrate for the treatment of primary biliary cholangitis in patients with inadequate biochemical response to ursodeoxycholic acid therapy (Bezurso). Journal of Hepatology, 66(1), S89.
Corpechot, C., Chrétien, Y., Chazouillères, O., & Poupon, R. (2010). Demographic, lifestyle, medical and familial factors associated with primary biliary cirrhosis. Journal of Hepatology, 53(1), 162–169.
Corpechot, C., Gaouar, F., Chrétien, Y., Johanet, C., Chazouillères, O., & Poupon, R. (2012). Smoking as an independent risk factor of liver fibrosis in primary biliary cirrhosis. Journal of Hepatology, 56(1), 218–224.
Crosignani, A., Podda, M., Battezzati, P. M., Bertolini, E., Zuin, M., Watson, D., & Setchell, K. D. (1991). Changes in bile acid composition in patients with primary biliary cirrhosis induced by ursodeoxycholic acid administration. Hepatology, 14(6), 1000–1007.
D’Amico, G., & Luca, A. (1997). Natural history. Clinical-haemodynamic correlations. Prediction of the risk of bleeding. Bailliere’s Clinical Gastroenterology, 11(2), 243–256.
Dähnrich, C., Pares, A., Caballeria, L., Rosemann, A Schlumberger, W., Probst, C., Mytilinaiou, M., … Komorowski, L. (2009). New ELISA for detecting primary biliary cirrhosis-specific antimitochondrial antibodies. Clinical Chemistry, 55(5), 978–985.

109
Deutsch, M., Papatheodoridis, G. V, Tzakou, A., & Hadziyannis, S. J. (2008). Risk of hepatocellular carcinoma and extrahepatic malignancies in primary biliary cirrhosis. European Journal of Gastroenterology and Hepatology, 20(1), 5–9.
Dickson, E. R., Grambsch, P. M., Fleming, T. R., Fisher, L. D., & Langworthy, A. (1989). Prognosis in primary biliary cirrhosis: model for decision making. Hepatology, 10(1), 1–7.
Donaldson, P. T., Baragiotta, A., Heneghan, M. A., Floreani, A., Venturi, C., Underhill, J. A., … Bassendine, M. F. (2006). HLA class II alleles, genotypes, haplotypes, and amino acids in primary biliary cirrhosis: a large-scale study. Hepatology, 44(3), 667–674.
Dyson, J. K., Wilkinson, N., Jopson, L., Mells, G., Bathgate, A., Heneghan, M. A., … Jones, D. E. (2016). The inter-relationship of symptom severity and quality of life in 2055 patients with primary biliary cholangitis. Alimentary Pharmacology & Therapeutics, 44(10), 1039–1050.
Eriksson, S., & Lindgren, S. (1984). The prevalence and clinical spectrum of primary biliary cirrhosis in a defined population. Scandinavian Journal of Gastroenterology, 19(7), 971–976.
European Association for the Study of the Liver. (2009). EASL Clinical Practice Guidelines: management of cholestatic liver diseases. Journal of Hepatology, 51(2), 237–267.
Fagan, E., Williams, R., & Cox, S. (1977). Primary biliary cirrhosis in mother and daughter. British Medical Journal, 2(6096), 1195.
Fairweather, D., & Rose, N. R. (2004). Women and autoimmune diseases. Emerging Infectious Diseases, 10(11), 2005–2011.
Feizi, T., Naccarato, R., Sherlock, S., & Doniach, D. (1972). Mitochondrial and other tissue antibodies in relatives of patients with primary biliary cirrhosis. Clinical and Experimental Immunology, 10(4), 609–622.
Flannery, G. R., Burroughs, A. K., Butler, P., Chelliah, J., Hamilton-Miller, J., Brumfitt, W., & Baum, H. (1989). Antimitochondrial antibodies in primary biliary cirrhosis recognize both specific peptides and shared epitopes of the M2 family of antigens. Hepatology, 10(3), 370–374.
Floreani, A., Caroli, D., Variola, A., Rizzotto, E. R., Antoniazzi, S., Chiaramonte, M., … Baldo, V. (2011). A 35-year follow-up of a large cohort of patients with primary biliary cirrhosis seen at a single centre. Liver International, 31(3), 361–368.
Gabeta, S., Norman, G. L., Liaskos, C., Papamichalis, P. A., Zografos, T., Garagounis, A., … Dalekos, G. N. (2007). Diagnostic relevance and clinical significance of the new enhanced performance M2 (MIT3) ELISA for the detection of IgA and IgG antimitochondrial antibodies in primary biliary cirrhosis. Journal of Clinical Immunology, 27(4), 378–387.

110
Gatselis, N. K., Zachou, K., Norman, G. L., Gabeta, S., Papamichalis, P., Koukoulis, G. K., & Dalekos, G. N. (2013). Clinical significance of the fluctuation of primary biliary cirrhosis-related autoantibodies during the course of the disease. Autoimmunity, 46(7), 471–479.
Gershwin, M. E., Selmi, C., Worman, H. J., Gold, E. B., Watnik, M., Utts, J., … USA PBC Epidemiology Group. (2005). Risk factors and comorbidities in primary biliary cirrhosis: a controlled interview-based study of 1032 patients. Hepatology, 42(5), 1194–1202.
Gómez-Dominguez, E., Mendoza, J., García-Buey, L., Trapero, M., Gisbert, J. P., Jones, E. A., & Moreno-Otero, R. (2008). Transient elastography to assess hepatic fibrosis in primary biliary cirrhosis. Alimentary Pharmacology & Therapeutics, 27(5), 441–447.
Gong, Y., Christensen, E., & Gluud, C. (2007). Azathioprine for primary biliary cirrhosis. The Cochrane Database of Systematic Reviews, (3), CD006000.
González-Koch, A., Brahm, J., Antezana, C., Smok, G., & Cumsille, M. A. (1997). The combination of ursodeoxycholic acid and methotrexate for primary biliary cirrhosis is not better than ursodeoxycholic acid alone. Journal of Hepatology, 27(1), 143–149.
Gores, G. J., Wiesner, R. H., Dickson, E. R., Zinsmeister, A. R., Jorgensen, R. A., & Langworthy, A. (1989). Prospective evaluation of esophageal varices in primary biliary cirrhosis: development, natural history, and influence on survival. Gastroenterology, 96(6), 1552–1559.
Granito, A., Muratori, P., Muratori, L., Pappas, G., Cassani, F., Worthington, J., … Bianchi, F. B. (2006). Antinuclear antibodies giving the “multiple nuclear dots” or the “rim-like/membranous” patterns: diagnostic accuracy for primary biliary cirrhosis. Alimentary Pharmacology & Therapeutics, 24(11–12), 1575–1583.
Granito, A., Muratori, P., Quarneti, C., Pappas, G., Cicola, R., & Muratori, L. (2012). Antinuclear antibodies as ancillary markers in primary biliary cirrhosis. Expert Review of Molecular Diagnostics, 12(1), 65–74.
Gregory, W. L., Mehal, W., Dunn, A. N., Cavanagh, G., Chapman, R., Fleming, K. A., … Bassendine, M. F. (1993). Primary biliary cirrhosis: contribution of HLA class II allele DR8. The Quarterly Journal of Medicine, 86(6), 393–399.
Gross, R. G., & Odin, J. A. (2008). Recent advances in the epidemiology of primary biliary cirrhosis. Clinics in Liver Disease, 12(2), 289–303.
Hayase, Y., Iwasaki, S., Akisawa, N., Saibara, T., Kadokawa, Y., Omagari, K., … Onishi, S. (2005). Similar anti-mitochondrial antibody reactivity profiles in familial primary biliary cirrhosis. Hepatology Research, 33(1), 33–38.
Heathcote, E. J., Cauch-Dudek, K., Walker, V., Bailey, R. J., Blendis, L. M., Ghent, C. N., … Wanless, I. R. (1994). The Canadian multicenter double-blind randomized controlled trial of ursodeoxycholic acid in primary biliary cirrhosis. Hepatology, 19(5), 1149–1156.
111
Hirschfield, G. M., Beuers, U., Corpechot, C., Invernizzi, P., Jones, D., Marzioni, M., & Schramm, C. (2017). EASL Clinical Practice Guidelines : The diagnosis and management of patients with primary biliary cholangitis. Journal of Hepatology, 67(1), 145–172.
Hirschfield, G. M., Mason, A., Luketic, V., Lindor, K., Gordon, S. C., Mayo, M., … Shapiro, D. (2015). Efficacy of obeticholic acid in patients with primary biliary cirrhosis and inadequate response to ursodeoxycholic acid. Gastroenterology, 148(4), 751–761.e8.
Howel, D., Fischbacher, C. M., Bhopal, R. S., Gray, J., Metcalf, J. V, & James, O. F. (2000). An exploratory population-based case-control study of primary biliary cirrhosis. Hepatology, 31(5), 1055–1060.
Hu, C. J., Song, G., Huang, W., Liu, G.-Z., Deng, C.-W., Zeng, H.-P., … Li, Y.-Z. (2012). Identification of new autoantigens for primary biliary cirrhosis using human proteome microarrays. Molecular & Cellular Proteomics, 11(9), 669–680.
Hu, S., Zhao, F., Wang, Q., & Chen, W.-X. (2014). The accuracy of the anti-mitochondrial antibody and the M2 subtype test for diagnosis of primary biliary cirrhosis: A meta-analysis. Clinical Chemistry and Laboratory Medicine, 52(11), 1533–1542.
Hubscher, S. G., Elias, E., Buckels, J. A., Mayer, A. D., McMaster, P., & Neuberger, J. M. (1993). Primary biliary cirrhosis. Histological evidence of disease recurrence after liver transplantation. Journal of Hepatology, 18(2), 173–184.
Huet, P. M., Deslauriers, J., Tran, A., Faucher, C., & Charbonneau, J. (2000). Impact of fatigue on the quality of life of patients with primary biliary cirrhosis. American Journal of Gastroenterology, 95(3), 760–767.
Invernizzi, P., Battezzati, P. M., Crosignani, A., Perego, F., Poli, F., Morabito, A., … Podda, M. (2003). Peculiar HLA polymorphisms in Italian patients with primary biliary cirrhosis. Journal of Hepatology, 38(4), 401–406.
Invernizzi, P., Crosignani, A., Battezzati, P. M., Covini, G., De Valle, G., Larghi, A., … Podda, M. (1997). Comparison of the clinical features and clinical course of antimitochondrial antibody-positive and -negative primary biliary cirrhosis. Hepatology, 25(5), 1090–1095.
Jackson, H., Solaymani-Dodaran, M., Card, T. R., Aithal, G. P., Logan, R., & West, J. (2007). Influence of ursodeoxycholic acid on the mortality and malignancy associated with primary biliary cirrhosis: a population-based cohort study. Hepatology, 46(4), 1131–1137.
Jacoby, A., Rannard, A., Buck, D., Bhala, N., Newton, J. L., James, O. F., & Jones, D. E. (2005). Development, validation, and evaluation of the PBC-40, a disease specific health related quality of life measure for primary biliary cirrhosis. Gut, 54(11), 1622–1629.
James, O. F., Bhopal, R., Howel, D., Gray, J., Burt, A. D., & Metcalf, J. V. (1999). Primary biliary cirrhosis once rare, now common in the United Kingdom? Hepatology, 30(2), 390–394.

112
Jones, D. E., Al-Rifai, A., Frith, J., Patanwala, I., & Newton, J. L. (2010). The independent effects of fatigue and UDCA therapy on mortality in primary biliary cirrhosis: Results of a 9 year follow-up. Journal of Hepatology, 53(5), 911–917.
Kaplan, M. M., & Gershwin, M. E. (2005). Primary biliary cirrhosis. New England Journal of Medicine, 353(12), 1261–1273.
Kaplan, M. M., & Gershwin, M. E. (2016). Primary biliary cirrhosis. New England Journal of Medicine, 353(12), 1261–1273.
Kim, K. A., Ki, M., Choi, H. Y., Kim, B. H., Jang, E. S., & Jeong, S. H. (2016). Population-based epidemiology of primary biliary cirrhosis in South Korea. Alimentary Pharmacology and Therapeutics, 43(1), 154–162.
Kim, W. R., Lindor, K. D., Locke, G. R. 3rd, Therneau, T. M., Homburger, H. A., Batts, K. P., … Dickson, E. R. (2000). Epidemiology and natural history of primary biliary cirrhosis in a US community. Gastroenterology, 119(6), 1631–1636.
Kim, W. R., Poterucha, J. J., Jorgensen, R. A., Batts, K. P., Homburger, H. A., Dickson, E. R., … Lindor, K. D. (1997). Does antimitochondrial antibody status affect response to treatment in patients with primary biliary cirrhosis? Outcomes of ursodeoxycholic acid therapy and liver transplantation. Hepatology, 26(1), 22–26.
Kim, W. R., Wiesner, R. H., Therneau, T. M., Poterucha, J. J., Porayko, M. K., Evans, R. W., … Dickson, E. R. (1998). Optimal timing of liver transplantation for primary biliary cirrhosis. Hepatology, 28(1), 33–38.
Kita, H., He, X. S., & Gershwin, M. E. (2004). Autoimmunity and environmental factors in the pathogenesis of primary biliary cirrhosis. Annals of Medicine, 36(1), 72–80.
Kita, H., Matsumura, S., He, X. S., Ansari, A. A., Lian, Z. X., Van de Water, J., … Gershwin, M. E. (2002). Quantitative and functional analysis of PDC-E2-specific autoreactive cytotoxic T lymphocytes in primary biliary cirrhosis. The Journal of Clinical Investigation, 109(9), 1231–1240.
Krige, J. E., & Beckingham, I. J. (2001). ABC of diseases of liver, pancreas, and biliary system: portal hypertensions-2. Ascites, encephalopathy, and other conditions. BMJ, 322(7283), 416–418.
Krzeski, P., Zych, W., Kraszewska, E., Milewski, B., Butruk, E., & Habior, A. (1999). Is serum bilirubin concentration the only valid prognostic marker in primary biliary cirrhosis? Hepatology, 30(4), 865–869.
Kubota, J., Ikeda, F., Terada, R., Kobashi, H., Fujioka, S., Okamoto, R., … Yamamoto, K. (2009). Mortality rate of patients with asymptomatic primary biliary cirrhosis diagnosed at age 55 years or older is similar to that of the general population. Journal of Gastroenterology, 44(9), 1000–1006.

113
Kuiper, E. M., Hansen, B. E., de Vries, R. A., den Ouden-Muller, J. W., van Ditzhuijsen, T. J., Haagsma, E. B., … Dutch PBC Study Group. (2009). Improved prognosis of patients with primary biliary cirrhosis that have a biochemical response to ursodeoxycholic acid. Gastroenterology, 136(4), 1281–1287.
Kuiper, E. M. M., Hansen, B. E., Adang, R. P. R., van Nieuwkerk, C. M. J., Timmer, R., Drenth, J. P. H., … van Buuren, H. R. (2010). Relatively high risk for hepatocellular carcinoma in patients with primary biliary cirrhosis not responding to ursodeoxycholic acid. European Journal of Gastroenterology and Hepatology, 22, 1495–1502.
Kuiper, E. M. M., Hansen, B. E., Metselaar, H. J., Man, R. A. De, Haagsma, E. B., & Hoek, B. Van. (2010). Trends in liver transplantation for primary biliary cirrhosis in the Netherlands 1988-2008. BMC Gastroenterology, 10(1), 144.
Kumagi, T., Guindi, M., Fischer, S. E., Arenovich, T., Abdalian, R., Coltescu, C., … Hirschfield, G. M. (2010). Baseline ductopenia and treatment response predict long-term histological progression in primary biliary cirrhosis. American Journal of Gastroenterology, 105(10), 2186–2194.
Kumagi, T., & Heathcote, E. J. (2008). Primary biliary cirrhosis. Orphanet Journal of Rare Diseases, 3, 1.
Lammers, W. J., Hirschfield, G. M., Corpechot, C., Nevens, F., Lindor, K. D., Janssen, H. L. A., … van Buuren, H. R. (2015). Development and validation of a scoring system to predict outcomes of patients with primary biliary cirrhosis receiving ursodeoxycholic acid therapy. Gastroenterology, 149(7), 1804–1812.e4.
Lammers, W. J., Leeman, M., Ponsioen, C. I., Boonstra, K., van Erpecum, K J Wolfhagen, F H Kuyvenhoven, J. P., Vrolijk, J. M., … Dutch Multicenter PBC Study Group. (2016). How the concept of biochemical response influenced the management of primary biliary cholangitis over time. The Netherlands Journal of Medicine, 74(6), 240–246.
Lammers, W. J., van Buuren, H. R., Hirschfield, G. M., Janssen, H. L. A., Invernizzi, P., Mason, A. L., … Hansen, B. E. (2014). Levels of alkaline phosphatase and bilirubin are surrogate end points of outcomes of patients with primary biliary cirrhosis: An international follow-up study. Gastroenterology, 147(6), 1338–1349.e5.
Lazaridis, K. N., Juran, B. D., Boe, G. M., Slusser, J. P., de Andrade, M., Homburger, H. A., … Petersen, G. M. (2007). Increased prevalence of antimitochondrial antibodies in first-degree relatives of patients with primary biliary cirrhosis. Hepatology, 46(3), 785–792.
Lee, J., Belanger, A., Doucette, J. T., Stanca, C., Friedman, S., & Bach, N. (2007). Transplantation trends in primary biliary cirrhosis. Clinical Gastroenterology and Hepatology, 5(11), 1313–1315.
Leuschner, M., Güldütuna, S., You, T., Hübner, K., Bhatti, S., & Leuschner, U. (1996). Ursodeoxycholic acid and prednisolone versus ursodeoxycholic acid and placebo in the treatment of early stages of primary biliary cirrhosis. Journal of Hepatology, 25(1), 49–57.

114
Leuschner, U., Fischer, H., Kurtz, W., Güldütuna, S., Hübner, K., Hellstern, A., … Leuschner, M. (1989). Ursodeoxycholic acid in primary biliary cirrhosis: results of a controlled double-blind trial. Gastroenterology, 97(5), 1268–1274.
Levitt, D. G., & Levitt, M. D. (2014). Quantitative assessment of the multiple processes responsible for bilirubin homeostasis in health and disease. Clinical and Experimental Gastroenterology, 7, 307–328.
Levy, C., Naik, J., Giordano, C., Mandalia, A., O’Brien, C., Bhamidimarri, K. R., … Martin, P. (2014). Hispanics with primary biliary cirrhosis are more likely to have features of autoimmune hepatitis and reduced response to ursodeoxycholic acid than non-Hispanics. Clinical Gastroenterology and Hepatology, 12(8), 1398–1405.
Levy, C., Zein, C. O., Gomez, J., Soldevila-Pico, C., Firpi, R., Morelli, G., & Nelson, D. (2007). Prevalence and predictors of esophageal varices in patients with primary biliary cirrhosis. Clinical Gastroenterology and Hepatology, 5(7), 803–808.
Liang, Y., Yang, Z., & Zhong, R. (2012). Primary biliary cirrhosis and cancer risk: a systematic review and meta-analysis. Hepatology, 56(4), 1409–1417.
Liermann Garcia, R. F., Evangelista Garcia, C., McMaster, P., & Neuberger, J. (2001). Transplantation for primary biliary cirrhosis: retrospective analysis of 400 patients in a single center. Hepatology, 33(1), 22–27.
Lindor, K. (2007). Ursodeoxycholic acid for the treatment of primary biliary cirrhosis. New England Journal of Medicine, 357(15), 1524–1529.
Lindor, K. D., Dickson, E. R., Baldus, W. P., Jorgensen, R. A., Ludwig, J., Murtaugh, P. A., … Hofmann, A. F. (1994). Ursodeoxycholic acid in the treatment of primary biliary cirrhosis. Gastroenterology, 106(5), 1284–1290.
Lindor, K. D., Gershwin, M. E., Poupon, R., Kaplan, M., Bergasa, N. V., & Heathcote, E. J. (2009). Primary biliary cirrhosis. Hepatology, 50(1), 291–308.
Lindor, K. D., Jorgensen, R. A., Therneau, T. M., Malinchoc, M., & Dickson, E. R. (1997). Ursodeoxycholic acid delays the onset of esophageal varices in primary biliary cirrhosis. Mayo Clinic Proceedings, 72(12), 1137–1140.
Lindor, K. D., Therneau, T. M., Jorgensen, R. A., Malinchoc, M., & Dickson, E. R. (1996). Effects of ursodeoxycholic acid on survival in patients with primary biliary cirrhosis. Gastroenterology, 110(5), 1515–1518.
Lleo, A., Jepsen, P., Morenghi, E., Carbone, L., Moroni, M., Battezzati, P., … Invernizzi, P. (2016). Evolving trends in female to male incidence and male mortality of primary biliary cholangitis. Scientific Reports, 6, 25906.
Locke, G. R. 3rd, Therneau, T. M., Ludwig, J., Dickson, E. R., & Lindor, K. D. (1996). Time course of histological progression in primary biliary cirrhosis. Hepatology, 23(1), 52–56.

115
Löhr, H., Fleischer, B., Gerken, G., Yeaman, S. J., Meyer zum Büschenfelde, K., & Manns, M. (1993). Autoreactive liver-infiltrating T cells in primary biliary cirrhosis recognize inner mitochondrial epitopes and the pyruvate dehydrogenase complex. Journal of Hepatology, 18(3), 322–327.
Long, R. G., Scheuer, P. J., & Sherlock, S. (1977). Presentation and course of asymptomatic primary biliary cirrhosis. Gastroenterology, 72(6), 1204–1207.
Ludwig, J., Dickson, E. R., & McDonald, G. S. A. (1978). Staging of chronic nonsuppurative destructive cholangitis (Syndrome of primary biliary cirrhosis). Virchows Archiv A Pathological Anatomy and Histology, 379(2), 103–112.
MacSween, R. N., Horne, C. H., Moffat, A. J., & Hughes, H. M. (1972). Serum protein levels in primary biliary cirrhosis. Journal of Clinical Pathology, 25(9), 789–792.
Mahl, T. C., Shockcor, W., & Boyer, J. L. (1994). Primary biliary cirrhosis: survival of a large cohort of symptomatic and asymptomatic patients followed for 24 years. Journal of Hepatology, 20(6), 707–713.
Manns, M. P., Bremm, A., Schneider, P. M., Notghi, A., Gerken, G., Prager-Eberle, M Stradmann-Bellinghausen, B., … Rittner, C. (1991). HLA DRw8 and complement C4 deficiency as risk factors in primary biliary cirrhosis. Gastroenterology, 101(5), 1367–1373.
Mantaka, A., Koulentaki, M., Chlouverakis, G., Enele-Melono, J. M., Darivianaki, A., Tzardi, M., & Kouroumalis, E. A. (2012). Primary biliary cirrhosis in a genetically homogeneous population: disease associations and familial occurrence rates. BMC Gastroenterology Gastroenterology, 12, 110.
Markus, B. H., Dickson, E. R., Grambsch, P. M., Fleming, T. R., Mazzaferro, V., Klintmalm, G. B., … Starzl, T. E. (1989). Efficacy of liver transplantation in patients with primary biliary cirrhosis. New England Journal of Medicine, 320(26), 1709–1713.
Matsumura, S., Van De Water, J., Leung, P., Odin, J. A., Yamamoto, K., Gores, G. J., … Gershwin, M. E. (2004). Caspase induction by IgA antimitochondrial antibody: IgA-mediated biliary injury in primary biliary cirrhosis. Hepatology, 39(5), 1415–1422.
Mayo, M. J., Parkes, J., Adams-Huet, B., Combes, B., Mills, A. S., Markin, R. S., … Rosenberg, W. M. (2008). Prediction of clinical outcomes in primary biliary cirrhosis by serum enhanced liver fibrosis assay. Hepatology, 48(5), 1549–1557.
McNally, R. J., Ducker, S., & James, O. F. (2009). Are transient environmental agents involved in the cause of primary biliary cirrhosis? Evidence from space-time clustering analysis. Hepatology, 50(4), 1169–1174.
McNally, R. J., James, P. W., Ducker, S., & James, O. F. (2011). Seasonal variation in the patient diagnosis of primary biliary cirrhosis: further evidence for an environmental component to etiology. Hepatology, 54(6), 2099–2103.

116
McNally, R. J., James, P. W., Ducker, S., Norman, P. D., & James, O. F. (2014). No rise in incidence but geographical heterogeneity in the occurrence of primary biliary cirrhosis in North East England. American Journal of Epidemiology, 179(4), 492–498.
Metcalf, J., & James, O. (1997). The geoepidemiology of primary biliary cirrhosis. Seminars in Liver Disease, 17(1), 13–22.
Metcalf, J. V, Bhopal, R. S., Gray, J., Howel, D., & James, O. F. (1997). Incidence and prevalence of primary biliary cirrhosis in the city of Newcastle upon Tyne, England. International Journal of Epidemiology, 26(4), 830–836.
Metcalf, J. V, Mitchison, H. C., Palmer, J. M., Jones, D. E., Bassendine, M. F., & James, O. F. (1996). Natural history of early primary biliary cirrhosis. Lancet, 348(9039), 1399–1402.
Miller, K. B., Sepersky, R. A., Brown, K. M., Goldberg, M. J., & Kaplan, M. M. (1983). Genetic abnormalities of immunoregulation in primary biliary cirrhosis. The American Journal of Medicine, 75(1), 75–80.
Mitchison, H. C., Lucey, M. R., Kelly, P. J., Neuberger, J. M., Williams, R., & James, O. F. (1990). Symptom development and prognosis in primary biliary cirrhosis: a study in two centers. Gastroenterology, 99(3), 778–784.
Morling, N., Dalhoff, K., Fugger, L., Georgsen, J., Jakobsen, B., Ranek, L., … Svejgaard, A. (1992). DNA polymorphism of HLA class II genes in primary biliary cirrhosis. Immunogenetics, 35(2), 112–116.
Mounach, A., Ouzzif, Z., Wariaghli, G., Achemlal, L., Benbaghdadi, I., Aouragh, A., … El Maghraoui, A. (2008). Primary biliary cirrhosis and osteoporosis: a case-control study. Journal of Bone and Mineral Metabolism, 26(4), 379–384.
Muñoz, S. J., Heubi, J. E., Balistreri, W. F., & Maddrey, W. C. (1989). Vitamin E deficiency in primary biliary cirrhosis: gastrointestinal malabsorption, frequency and relationship to other lipid-soluble vitamins. Hepatology, 9(4), 525–531.
Muratori, P., Muratori, L., Ferrari, R., Cassani, F., Bianchi, G., Lenzi, M., … Bianchi, F. B. (2003). Characterization and clinical impact of antinuclear antibodies in primary biliary cirrhosis. American Journal of Gastroenterology, 98(2), 431–437.
Muratori, P., Muratori, L., Gershwin, M. E., Czaja, A. J., Pappas, G., MacCariello, S., … Bianchi, F. B. (2004). “True” antimitochondrial antibody-negative primary biliary cirrhosis, low sensitivity of the routine assays, or both? Clinical and Experimental Immunology, 135(1), 154–158.
Murillo Perez, C. F., Goet, J. C., Lammers, W. J., Gulamhusein, A., van Buuren, H. R., Ponsioen, C. Y., … Hansen, B. E. (2018). Milder disease stage in patients with primary biliary cholangitis over a 44-year period: A changing natural history. Hepatology, 67(5), 1920–1930.
117
Murtaugh, P. A., Dickson, E. R., Van Dam, G. M., Malinchoc, M., Grambsch, P. M., Langworthy, A. L., & Gips, C. H. (1994). Primary biliary cirrhosis: prediction of short-term survival based on repeated patient visits. Hepatology, 20(1 Pt 1), 126–134.
Mutimer, D. J., Fussey, S. P., Yeaman, S. J., Kelly, P. J., James, O. F., & Bassendine, M. F. (1989). Frequency of IgG and IgM autoantibodies to four specific M2 mitochondrial autoantigens in primary biliary cirrhosis. Hepatology, 10(4), 403–407.
Myers, R. P., Shaheen, A. A., Fong, A., Burak, K. W., Wan, A., Swain, M. G., … Quan, H. (2009). Epidemiology and natural history of primary biliary cirrhosis in a Canadian health region: a population-based study. Hepatology, 50(6), 1884–1892.
Myszor, M., & James, O. F. (1990). The epidemiology of primary biliary cirrhosis in north-east England: an increasingly common disease? The Quarterly Journal of Medicine, 75(276), 377–385.
Nakamura, M., Kondo, H., Mori, T., Komori, A., Matsuyama, M., Ito, M., … Ishibashi, H. (2007). Anti-gp210 and anti-centromere antibodies are different risk factors for the progression of primary biliary cirrhosis. Hepatology, 45(1), 118–127.
Nakanuma, Y. (1993). Distribution of B lymphocytes in nonsuppurative cholangitis in primary biliary cirrhosis. Hepatology, 18(3), 570–575.
Neuberger, J. (2003). Liver transplantation for primary biliary cirrhosis. Autoimmunity Reviews, 2(1), 1–7.
Nevens, F., Andreone, P., Mazzella, G., Strasser, S. I., Bowlus, C., Invernizzi, P., … Shapiro, D. (2016). A placebo-controlled trial of obeticholic acid in primary biliary cholangitis. New England Journal of Medicine, 375(7), 631–643.
Newton, J. L., Davidson, A., Kerr, S., Bhala, N., Pairman, J., Burt, J., & Jones, D. E. (2007). Autonomic dysfunction in primary biliary cirrhosis correlates with fatigue severity. European Journal of Gastroenterology and Hepatology, 19(2), 125–132.
Newton, J. L., Gibson, G. J., Tomlinson, M., Wilton, K., & Jones, D. (2006). Fatigue in primary biliary cirrhosis is associated with excessive daytime somnolence. Hepatology, 44(1), 91–98.
Nguyen, D. L., Juran, B. D., & Lazaridis, K. N. (2010). Primary biliary cirrhosis. Best Practice and Research. Clinical Gasttroenterology, 24(5), 647–654.
Oertelt, S., Rieger, R., Selmi, C., Invernizzi, P., Ansari, A. A., Coppel, R. L., … Gershwin, M. E. (2007). A sensitive bead assay for antimitochondrial antibodies: Chipping away at AMA-negative primary biliary cirrhosis. Hepatology, 45(3), 659–665.

118
Ong, K. L., Allison, M. A., Cheung, B. M., Wu, B. J., Barter, P. J., & Rye, K. A. (2014). The relationship between total bilirubin levels and total mortality in older adults: the United States National Health and Nutrition Examination Survey (NHANES) 1999-2004. PLoS ONE, 9(4), e94479.
Parés, A., Caballería, L., & Rodés, J. (2006). Excellent long-term survival in patients with primary biliary cirrhosis and biochemical response to ursodeoxycholic acid. Gastroenterology, 130(3), 715–720.
Parés, A., Caballería, L., Rodés, J., Bruguera, M., Rodrigo, L., García-Plaza, A., … Velicia, R. (2000). Long-term effects of ursodeoxycholic acid in primary biliary cirrhosis: Results of a double-blind controlled multicentric trial. UDCA-Cooperative Group from the Spanish Association for the Study of the Liver. Journal of Hepatology, 32(4), 561–566.
Parikh-Patel, A., Gold, E. B., Worman, H., Krivy, K. E., & Gershwin, M. E. (2001). Risk factors for primary biliary cirrhosis in a cohort of patients from the United States. Hepatology, 33(1), 16–21.
Paumgartner, G., & Beuers, U. (2002). Ursodeoxycholic acid in cholestatic liver disease: mechanisms of action and therapeutic use revisited. Hepatology, 36(3), 525–531.
Pellicciari, R., Fiorucci, S., Camaioni, E., Clerici, C., Costantino, G., Maloney, P. R., … Willson, T. M. (2002). 6alpha-ethyl-chenodeoxycholic acid (6-ECDCA), a potent and selective FXR agonist endowed with anticholestatic activity. Journal of Medicinal Chemistry, 45(17), 3569–3572.
Pells, G., Mells, G. F., Carbone, M., Newton, J. L., Bathgate, A. J., Burroughs, A. K., … Jones, D. E. (2013). The impact of liver transplantation on the phenotype of primary biliary cirrhosis patients in the UK-PBC cohort. Journal of Hepatology, 59(1), 67–73.
Peters, M. G., Di Bisceglie, A. M., Kowdley, K. V, Flye, N. L., Luketic, V. A., Munoz, S. J., … PUMPS Group. (2007). Differences between Caucasian, African American, and Hispanic patients with primary biliary cirrhosis in the United States. Hepatology, 46(3), 769–775.
Phillips, J. R., Angulo, P., Petterson, T., & Lindor, K. D. (2001). Fat-soluble vitamin levels in patients with primary biliary cirrhosis. American Journal of Gastroenterology, 96(9), 2745–2750.
Pla, X., Vergara, M., Gil, M., Dalmau, B., Cisteró, B., Bella, R. M., & Real, J. (2007). Incidence, prevalence and clinical course of primary biliary cirrhosis in a Spanish community. European Journal of Gastroenterology and Hepatology, 19(10), 859–864.
Podda, M., Selmi, C., Lleo, A., Moroni, L., & Invernizzi, P. (2013). The limitations and hidden gems of the epidemiology of primary biliary cirrhosis. Journal of Autoimmunity, 46, 81–87.
Poupon, R. (2010). Primary biliary cirrhosis: a 2010 update. Journal of Hepatology, 52(5), 745–758.

119
Poupon, R. E., Bonnand, A. M., Chrétien, Y., & Poupon, R. (1999). Ten-year survival in ursodeoxycholic acid-treated patients with primary biliary cirrhosis. The UDCA-PBC Study Group. Hepatology, 29(6), 1668–1671.
Poupon, R. E., Chrétien, Y., Chazouillères, O., Poupon, R., & Chwalow, J. (2004). Quality of life in patients with primary biliary cirrhosis. Hepatology, 40(2), 489–494.
Poupon, R. E., Lindor, K. D., Cauch-Dudek, K., Dickson, E. R., Poupon, R., & Heathcote, E. J. (1997). Combined analysis of randomized controlled trials of ursodeoxycholic acid in primary biliary cirrhosis. Gastroenterology, 113(3), 884–890.
Poupon, R. E., Poupon, R., & Balkau, B. (1994). Ursodiol for the long-term treatment of primary biliary cirrhosis. The UDCA-PBC Study Group. New England Journal of Medicine, 330(19), 1342–1347.
Prati, D., Taioli, E., Zanella, A., Torre, E. Della, Butelli, S., Del Vecchio, E., … Sirchia, G. (2002). Updated definitions of healthy ranges for serum alanine aminotransferase levels. Annals of Internal Medicine, 137(1), 1–10.
Pratt, D. S. (2016). Primary biliary cholangitis--A new name and a new treatment. New England Journal of Medicine, 375(7), 685–687.
Prince, M., Chetwynd, A., Newman, W., Metcalf, J. V, & James, O. F. (2002). Survival and symptom progression in a geographically based cohort of patients with primary biliary cirrhosis: follow-up for up to 28 years. Gastroenterology, 123(4), 1044–1051.
Prince, M. I., Chetwynd, A., Craig, W. L., Metcalf, J. V, & James, O. F. (2004). Asymptomatic primary biliary cirrhosis: clinical features, prognosis, and symptom progression in a large population based cohort. Gut, 53(6), 865–870.
Prince, M. I., Chetwynd, A., Diggle, P., Jarner, M., Metcalf, J. V, & James, O. F. (2001). The geographical distribution of primary biliary cirrhosis in a well-defined cohort. Hepatology, 34(6), 1083–1088.
Prince, M. I., Ducker, S. J., & James, O. F. (2010). Case-control studies of risk factors for primary biliary cirrhosis in two United Kingdom populations. Gut, 59(4), 508–512.
Prince, M. I., & James, O. F. (2003). The epidemiology of primary biliary cirrhosis. Clinics in Liver Disease, 7(4), 795–819.
Quarneti, C., Muratori, P., Lalanne, C., Fabbri, A., Menichella, R., Granito, A., … Muratori, L. (2015). Fatigue and pruritus at onset identify a more aggressive subset of primary biliary cirrhosis. Liver International, 35(2), 636–641.
Quinn, J., Diamond, A. G., Palmer, J. M., Bassendine, M. F., James, O. F., & J, Y. S. (1993). Lipoylated and unlipoylated domains of human PDC-E2 as autoantigens in primary biliary cirrhosis: significance of lipoate attachment. Hepatology, 18(6), 1384–1391.

120
Rautiainen, H., Salomaa, V., Niemelå, S., Karvonen, A. L., Nurmi, H., Isoniemi, H., & Färkkilä, M. (2007). Prevalence and incidence of primary biliary cirrhosis are increasing in Finland. Scandinavian Journal of Gastroenterology, 42(11), 1343–1353.
Remmel, T., Remmel, H., Uibo, R., & Salupere, V. (1995). Primary biliary cirrhosis in Estonia. With special reference to incidence, prevalence, clinical features, and outcome. Scandinavian Journal of Gastroenterology, 30(4), 367–371.
Reshetnyak, V. I. (2015). Primary biliary cirrhosis : Clinical and laboratory criteria for its diagnosis. World Journal of Gastroenterology, 21(25), 7683–7708.
Reynolds, T. B., Denison, E. K., Frankl, H. D., Lieberman, F. L., & Peters, R. L. (1971). Primary biliary cirrhosis with scleroderma, Raynaud’s phenomenon and telangiectasia. New syndrome. The American Journal of Medicine, 50(3), 302–312.
Rieger, R., Leung, P. S., Jeddeloh, M. R., Kurth, M. J., Nantz, M. H., Lam, K. S., … Gershwin, M. E. (2006). Identification of 2-nonynoic acid, a cosmetic component, as a potential trigger of primary biliary cirrhosis. Journal of Autoimmunity, 27(1), 7–16.
Rigopoulou, E. I., Davies, E. T., Pares, A., Zachou, K., Liaskos, C., Bogdanos, D. P., … Vergani, D. (2005). Prevalence and clinical significance of isotype specific antinuclear antibodies in primary biliary cirrhosis. Gut, 54(4).
Rosenthal, P., Pincus, M., & Fink, D. (1984). Sex- and age-related differences in bilirubin concentrations in serum. Clinical Chemistry, 30(8), 1380–1382.
Rubin, D. B. (1996). Multiple imputation after 18+ years. Journal of the American Statitical Association, 91(434), 473–489.
Sakauchi, F., Oura, A., Ohnishi, H., & Mori, M. (2007). Comparison of the clinical features of Japanese patients with primary biliary cirrhosis in 1999 and 2004: utilization of clinical data when patients applied to receive public financial aid. Journal of Epidemiology, 17(6), 210–214.
Scheuer, P. (1967). Primary biliary cirrhosis. Proceedings of the Royal Society of Medicine, 60(12), 1257–1260.
Selmi, C., Mayo, M. J., Bach, N., Ishibashi, H., Invernizzi, P., Gish, R. G., … Gershwin, M. E. (2004). Primary biliary cirrhosis in monozygotic and dizygotic twins: genetics, epigenetics, and environment. Gastroenterology, 127(2), 485–492.
Shapiro, J. M., Smith, H., & Schaffner, F. (1979). Serum bilirubin: a prognostic factor in primary biliary cirrhosis. Gut, 20(2), 137–140.
Shi, J., Wu, C., Lin, Y., Chen, Y. X., Zhu, L., & Xie, W. F. (2006). Long-term effects of mid-dose ursodeoxycholic acid in primary biliary cirrhosis: a meta-analysis of randomized controlled trials. American Journal of Gastroenterology, 101(7), 1529–1538.

121
Shibuya, A., Tanaka, K., Miyakawa, H., Shibata, M., Takatori, M., Sekiyama, K., … Morizane, T. (2002). Hepatocellular carcinoma and survival in patients with primary biliary cirrhosis. Hepatology, 35(5), 1172–1178.
Shimoda, S., Nakamura, M., Ishibashi, H., Kawano, A., Kamihira, T., Sakamoto, N., … Harada, M. (2003). Molecular mimicry of mitochondrial and nuclear autoantigens in primary biliary cirrhosis. Gastroenterology, 124(7), 1915–1925.
Siegel, J. L., Luthra, H., Donlinger, J., Angulo, P., & Lindor, K. (2003). Association of primary biliary cirrhosis and rheumatoid arthritis. Journal of Clinical Rheumatology, 9(6), 340–343.
Silveira, M. G., Suzuki, A., & Lindor, K. D. (2008). Surveillance for hepatocellular carcinoma in patients with primary biliary cirrhosis. Hepatology, 48(4), 1149–1156.
Solaymani-Dodaran, M., Card, T. R., Aithal, G. P., & West, J. (2006). Fracture risk in people with primary biliary cirrhosis: a population-based cohort study. Gastroenterology, 131(6), 1752–1757.
Sood, S., Gow, P. J., Christie, J. M., & Angus, P. W. (2004). Epidemiology of primary biliary cirrhosis in Victoria, Australia: high prevalence in migrant populations. Gastroenterology, 127(2), 470–475.
Spalding, M. C., & Sebesta, S. C. (2008). Geriatric screening and preventive care. American Family Physician, 78(2), 206–215.
Springer, J., Cauch-Dudek, K., O’Rourke, K., Wanless, I. R., & Heathcote, E. J. (1999). Asymptomatic primary biliary cirrhosis: a study of its natural history and prognosis. American Journal of Gastroenterology, 94(1), 47–53.
Stiehl, A., Rudolph, G., Raedsch, R., Möller, B., Hopf, U., Lotterer, E., … Senn, M. (1990). Ursodeoxycholic acid-induced changes of plasma and urinary bile acids in patients with primary biliary cirrhosis. Hepatology, 12(3 Pt 1), 492–497.
Su, W. C., Chan, C. C., Hung, H. H., Huo, T. I., Huang, Y. H., Li, C. P., … Wu, J. C. (2009). Predictive value of aspartate aminotransferase to alanine aminotransferase ratio for hepatic fibrosis and clinical adverse outcomes in patients with primary biliary cirrhosis. Journal of Clinical Gastroenterology, 43(9), 876–883.
Suzuki, A., Lymp, J., Donlinger, J., Mendes, F., Angulo, P., & Lindor, K. (2007). Clinical predictors for hepatocellular carcinoma in patients with primary biliary cirrhosis. Clinical Gastroenterology and Hepatology, 5(2), 259–264.
Suzuki, N., Irie, M., Iwata, K., Nakane, H., Yoshikane, M., Koyama, Y., … Sakisaka, S. (2006). Altered expression of alkaline phosphatase (ALP) in the liver of primary biliary cirrhosis (PBC) patients. Hepatology Research, 35(1), 37–44.

122
Sylvestre, P. B., Batts, K. P., Burgart, L. J., Poterucha, J. J., & Wiesner, R. H. (2003). Recurrence of primary biliary cirrhosis after liver transplantation: Histologic estimate of incidence and natural history. Liver Transplantation, 9(10), 1086–1093.
ter Borg, P. C. J., Schalm, S. W., Hansen, B. E., & van Buuren, H. R. (2006). Prognosis of ursodeoxycholic acid-treated patients with primary biliary cirrhosis. Results of a 10-yr cohort study involving 297 patients. American Journal of Gastroenterology, 101(9), 2044–2050.
Terrault, N. A., Bzowej, N. H., Chang, K., Hwang, J. P., Jonas, M. M., & Murad, M. H. (2016). AASLD guidelines for treatment of chronic hepatitis B. Hepatology, 63(1), 261–283.
Trivedi, P. J., Bruns, T., Cheung, A., Li, K.-K., Kittler, C., Kumagi, T., … Hirschfield, G. M. (2014). Optimising risk stratification in primary biliary cirrhosis: AST/platelet ratio index predicts outcome independent of ursodeoxycholic acid response. Journal of Hepatology, 60(6), 1249–1258.
Trivedi, P. J., Lammers, W. J., van Buuren, H. R., Parés, A., Floreani, A., Janssen, H. L. A., … Hirschfield, G. M. (2016). Stratification of hepatocellular carcinoma risk in primary biliary cirrhosis: A multicentre international study. Gut, 65(2), 321–329.
Tsianos, E. V, Hoofnagle, J. H., Fox, P. C., Alspaugh, M., Jones, E. A., Schafer, D. F., & Moutsopoulos, H. M. (1990). Sjögren’s syndrome in patients with primary biliary cirrhosis. Hepatology, 11(5), 730–734.
Tyagi, S., Gupta, P., Saini, A. S., Kaushal, C., & Sharma, S. (2011). The peroxisome proliferator-activated receptor: A family of nuclear receptors role in various diseases. Journal of Advanced Pharmaceutical Technology and Research, 2(4), 236–240.
Underhill, J., Donaldson, P., Bray, G., Doherty, D., Portmann, B., & Williams, R. (1992). Susceptibility to primary biliary cirrhosis is associated with the HLA-DR8-DQB1*0402 haplotype. Hepatology, 16(6), 1404–1408.
United Nations, Department of Economic and Social Affairs, P. D. (2017). World population prospects: The 2017 revision, key findings and advance tables. Retrieved from https://esa.un.org/unpd/wpp/Publications/Files/WPP2017_KeyFindings.pdf
Van de Water, J., Cooper, A., Surh, C. D., Coppel, R., Danner, D., Ansari, A., … Gershwin, M. E. (1989). Detection of autoantibodies to recombinant mitochondrial proteins in patients with primary biliary cirrhosis. New England Journal of Medicine, 320(21), 1377–1380.
Van de Water, J., Gershwin, M. E., Leung, P., Ansari, A., & Coppel, R. L. (1988). The autoepitope of the 74-kD mitochondrial autoantigen of primary biliary cirrhosis corresponds to the functional site of dihydrolipoamide acetyltransferase. The Journal of Experimental Medicine, 167(6), 1791–1799.

123
Watson, R. G., Angus, P. W., Dewar, M., Goss, B., Sewell, R. B., & Smallwood, R. A. (1995). Low prevalence of primary biliary cirrhosis in Victoria, Australia. Melbourne Liver Group. Gut, 36(6), 927–930.
Watt, F. E., James, O. F., & Jones, D. E. (2004). Patterns of autoimmunity in primary biliary cirrhosis patients and their families: a population-based cohort study. QJM, 97(7), 397–406.
Wesierska-Gadek, J., Hohenuer, H., Hitchman, E., & Penner, E. (1996). Autoantibodies against nucleoporin p62 constitute a novel marker of primary biliary cirrhosis. Gastroenterology, 110(3), 840–847.
Wesierska-Gadek, J., Penner, E., Battezzati, P. M., Selmi, C., Zuin, M., Hitchman, E., … Invernizzi, P. (2006). Correlation of initial autoantibody profile and clinical outcome in primary biliary cirrhosis. Hepatology, 43(5), 1135–1144.
White, G. L., Nelson, J. A., Pedersen, D. M., & Ash, K. O. (1981). Fasting and gender (and altitude?) influence reference intervals for serum bilirubin in healthy adults. Clinical Chemistry, 27(6), 1140–1142.
Wiesner, R. H., Ludwig, J., Lindor, K. D., Jorgensen, R. A., Baldus, W. P., Homburger, H. A., & Dickson, E. R. (1990). A controlled trial of cyclosporine in the treatment of primary biliary cirrhosis. New England Journal of Medicine, 322(20), 1419–1424.
Yang, F., Yang, Y., Wang, Q., Wang, Z., Miao, Q., Xiao, X., … Ma, X. (2017). The risk predictive values of UK-PBC and GLOBE scoring system in Chinese patients with primary biliary cholangitis: the additional effect of anti-gp210. Alimentary Pharmacology & Therapeutics, 45(5), 733–743.
Zein, C. O., Angulo, P., & Lindor, K. D. (2003). When is liver biopsy needed in the diagnosis of primary biliary cirrhosis? Clinical Gastroenterology and Hepatology, 1(2), 89–95.
Zein, C. O., Beatty, K., Post, A. B., Logan, L., Debanne, S., & McCullough, A. J. (2006). Smoking and increased severity of hepatic fibrosis in primary biliary cirrhosis: A cross validated retrospective assessment. Hepatology, 44(6), 1564–1571.
Zhang, L. N., Shi, T. Y., Shi, X. H., Wang, L., Yang, Y. J., Liu, B., … Zhang, F. C. (2013). Early biochemical response to ursodeoxycholic acid and long-term prognosis of primary biliary cirrhosis: results of a 14-year cohort study. Hepatology, 58(1), 264–272.
Zografos, T. A., Gatselis, N., Zachou, K., Liaskos, C., Gabeta, S., Koukoulis, G. K., & Dalekos, G. N. (2012). Primary biliary cirrhosis-specific autoantibodies in first degree relatives of Greek primary biliary cirrhosis patients. World Journal of Gastroenterology, 18(34), 4721–4728.
Zucker, S. D., Horn, P. S., & Sherman, K. E. (2004). Serum bilirubin levels in the U.S. population: Gender effect and inverse correlation with colorectal cancer. Hepatology, 40(4), 827–835.

124
Copyright Acknowledgements
JOHN WILEY AND SONS LICENSE TERMS AND CONDITIONS
Jul 03, 2018
This Agreement between Ms. Carla Fiorella Murillo Perez ("You") and John Wiley and Sons ("John Wiley and Sons") consists of your license details and the terms and conditions provided by John Wiley and Sons and Copyright Clearance Center.
License Number 4353830876851
License date May 21, 2018
Licensed Content Publisher
John Wiley and Sons
Licensed Content Publication
Hepatology
Licensed Content Title Milder disease stage in patients with primary biliary cholangitis over a 44‐year period: A changing natural history
Licensed Content Author Carla F. Murillo Perez, Jorn C. Goet, Willem J. Lammers, et al
Licensed Content Date Apr 6, 2018
Licensed Content Volume 67
Licensed Content Issue 5
Licensed Content Pages 11
Type of use Dissertation/Thesis
Requestor type Author of this Wiley article
Format Print and electronic
Portion Full article
Will you be translating? No
Title of your thesis / dissertation
The changing natural history of primary biliary cholangitis and its influence on risk stratification
Expected completion date Sep 2018
Expected size (number of pages)
110
Publisher Tax ID EU826007151
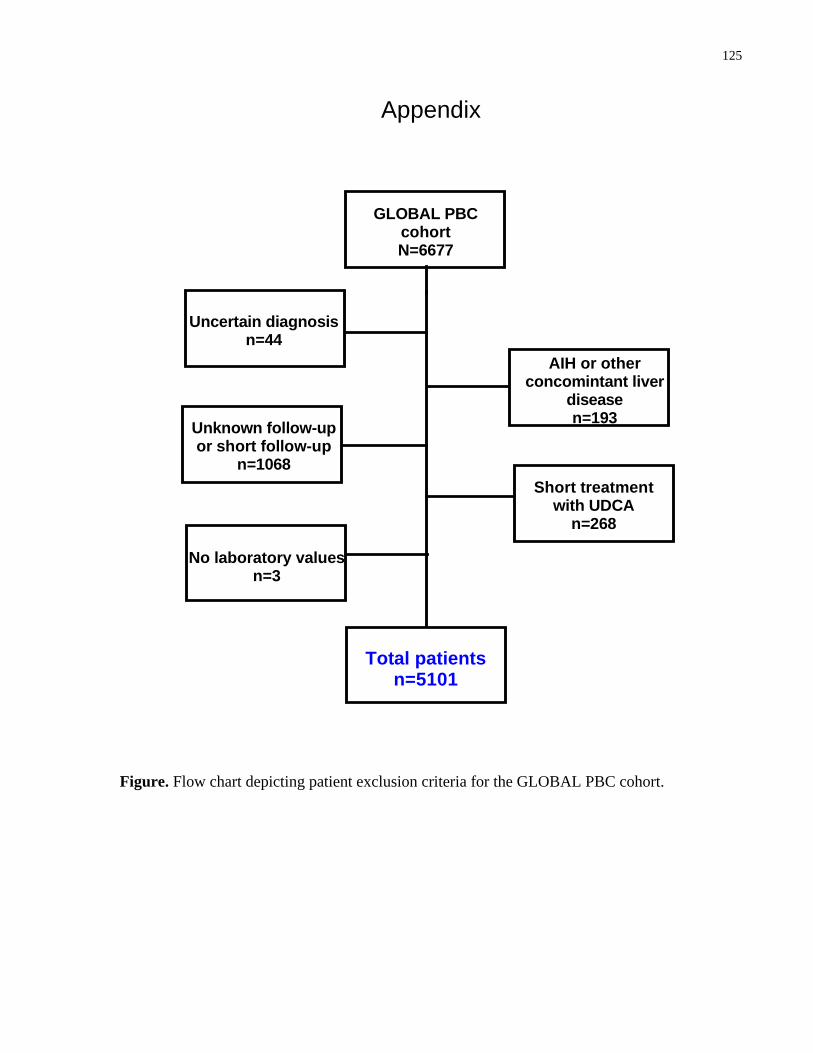
125
Appendix
Figure. Flow chart depicting patient exclusion criteria for the GLOBAL PBC cohort.
GLOBAL PBCcohortN=6677
AIH or otherconcomintant liver
diseasen=193
Uncertain diagnosisn=44
No laboratory valuesn=3
Unknown follow-upor short follow-up
n=1068Short treatment
with UDCAn=268
Total patientsn=5101

126
Contributions Carla Fiorella Murillo Perez had access to the data and performed the majority of the statistical
analysis. Harry Janssen, Jordan Feld, and Bettina Hansen provided guidance throughout the
course of my research, from study design to the interpretation of results. Bettina Hansen also
provided assistance with statistical analyses. Jorn Goet, Willem Lammers, Henk van Buuren,
Maren Harms, and Adrian van der Meer provided feedback and aided with critical revision of the
study for important intellectual content.
Acquisition of data was a collective effort by the GLOBAL PBC Study group. Members of the
GLOBAL PBC group also aided with critical revision of the study for important intellectual
content and provided advice and suggestions.
This study was supported by unrestricted grants from Intercept Pharmaceuticals and was funded
by the Foundation for Liver and Gastrointestinal Research (a not-for-profit foundation) in
Rotterdam, the Netherlands and Toronto Centre for Liver Disease. The supporting parties had no
influence on the study design, data collection and analyses, or interpretation of the results.