a characterization of calculus i final exams in u.s ... · a characterization of calculus i final...
TRANSCRIPT
A Characterization of Calculus I Final Exams in U.S.Colleges and Universities
Michael A. Tallman1,2& Marilyn P. Carlson2
&
David M. Bressoud3& Michael Pearson4
Published online: 14 January 2016# Springer International Publishing Switzerland 2016
Abstract In this study, we developed a three-dimensional framework to characterizepost-secondary Calculus I final exams. Our Exam Characterization Framework (ECF)classifies individual exam items according to the cognitive demand required to answerthe item, the representation of both the task statement and the solution, and the item’sformat. Our results from using the ECF to code 150 post-secondary Calculus I finalexams from across the United States revealed that the exams generally require lowlevels of cognitive demand, seldom contain problems stated in a real-world context,rarely elicit explanation, and do not require students to demonstrate or apply theirunderstanding of the course’s central ideas. We compared the results from analyzingindividual instructor’s exams with survey data of their beliefs about the conceptualorientation of their exams. Our analysis revealed inconsistencies between our charac-terization of Calculus I final exams and instructors’ perceptions of their final examsrelative to their conceptual focus and the extent to which the exam items ask students toexplain their thinking. We also compared the characteristics of our sample of final
Int. J. Res. Undergrad. Math. Ed. (2016) 2:105–133DOI 10.1007/s40753-015-0023-9
* Michael A. [email protected]
Marilyn P. [email protected]
David M. [email protected]
Michael [email protected]
1 Department of Mathematics, Oklahoma State University, 401 MSCS, Stillwater, OK 74074, USA2 School of Mathematical and Statistical Sciences, Arizona State University, P.O. 87804, Tempe,
AZ 85287, USA3 Department of Mathematics, Statistics, and Computer Science, Macalester College, 1600 Grand
Avenue, Saint Paul, MN 55105, USA4 Mathematical Association of America, 1529 Eighteenth Street Northwest, Washington,
DC 20036, USA
exams with post-secondary Calculus I final exams administered in 1986/87. We foundthat Calculus I final exams in U.S. colleges and universities have changed very little inthe past 25 years with respect to the percentage of exam items that require students toapply their understanding of foundational concepts, which suggest that the calculusreform movement of the late 1980s has had little effect on what is being assessed incurrent Calculus I courses in U.S. postsecondary institutions.
Keywords Calculus . Assessment .Mathematical reasoning . University levelmathematics
Introduction
Course exams are among the most revealing written artifacts of the mathematical skillsand understandings instructors want their students to acquire in a mathematics course.A course exam provides information about an instructor’s expectations for students’level of computational fluency, their depth of understanding specific concepts, and thedegree to which students are expected to make connections among the course’s centralideas.
Our review of the literature related to Calculus I assessment revealed that little isknown about the content of Calculus I exams administered in colleges and universitiesin the United States. Several studies have characterized items on mathematics examsand in textbooks according to their conceptual focus (Bergqvist 2007; Boesen et al.2006; Gierl 1997; Li 2000; Lithner 2000, 2003, 2004; Mesa et al. 2012; Palm et al.2006), while others have examined the format of exam questions (Senk et al. 1997),and the degree to which students can solve problems by imitating procedures(Bergqvist 2007; Lithner 2000, 2004). These approaches, however, characterize a smallsample of exam and textbook items and therefore provide a limited snapshot of themathematics valued by instructors or curriculum developers. The present study pro-vides one response to this gap in the literature by characterizing a large number of finalexams from first-semester calculus courses at a variety of post-secondary U.S. institu-tions. The four research questions that guided this study were:
1. What are the characteristics of post-secondary Calculus I final exams in the UnitedStates?
2. How do instructors’ perceptions of their exams compare with our characterizationsof them?
3. How is an exam item’s representation and format related to the level of cognitivedemand the item elicits?
4. How do the characteristics of our sample of modern post-secondary Calculus I finalexams compare with those from 1986/87?
We begin this paper by outlining our study’s context. We then chronicle thedevelopment of our Exam Characterization Framework (ECF), including details onhow the existing literature informed its development and how iterative coding led to itsrefinement. Next, we describe the three strands of the ECF and provide examples ofcoded items to clarify potentially problematic interpretations. We then present the
106 Int. J. Res. Undergrad. Math. Ed. (2016) 2:105–133
results from coding a random sample of 150 post-secondary Calculus I final exams,collectively containing 3735 items. This is followed by a presentation of results fromcomparing instructors’ perceptions of their exams with our characterization of them.We conclude by comparing our characterization of the sample of 150 exams with thecognitive demand of a sample of Calculus I final exams from 1986/1987 administeredat 13 different colleges and universities in the United States (Steen 1988).
Context of Study
This study is a part of a larger initiative by the Mathematical Association of America todetermine the characteristics of successful programs in college calculus. As part of alarger data corpus, faculty from 253 universities electronically submitted instructorsurveys and Calculus I final exams from the 2010/2011 academic year. Of these 253exams, we randomly selected 150 for use in this study. We decided to analyze a randomsample of 150 exams because we expected our results to stabilize after having codedsuch a large subsample. As we analyzed the exams, we kept track of the percentage ofexam items classified within each category of the ECF and noticed that these percent-ages became stable after having coded about 100 exams. We therefore did not see anyneed to code the entire sample of 253 exams. Additionally, because we randomlyselected 150 exams from a rather arbitrary sample size of 253, we found no statisticallyconvincing reason to analyze the entire sample.
At the time the instructors provided data for the larger data corpus, 48 % weretenured or tenure-track faculty, 28 % were other full-time faculty, 9 % were part-timefaculty, and 15 % were graduate students. Moreover, of the 150 exams we randomlyselected, 61.9 % were administered at national universities, 22.7 % at regional univer-sities, 9.4 % at community colleges, 4.6 % at national liberal arts colleges, and 1.4 % atregional colleges.1
Literature that Informed Our Development of the Exam CharacterizationFramework
A major product of this study is the Exam Characterization Framework (ECF), whichprovides a means by which one can efficiently code mathematics exam items to achievean objective characterization of the exam itself. It was our goal to locate or create aframework to characterize items relative to their conceptual versus procedural orienta-tion, the representational context in which the items are presented (e.g., word problems,formulas, graphs) and the format of the items. In the first stage of developing ourframework, we examined other frameworks (e.g., Li 2000; Lithner 2004; Mesa 2010;Mesa et al. 2012; Smith et al. 1996) that have been used to characterize items on examsand in textbooks. While our review of the literature allowed us to identify issues that
1 National universities are those that offer a full range of undergraduate majors as well as a host of master’sand doctoral degrees. Regional universities offer a full range of undergraduate programs, some master’sprograms, and few doctoral programs. National Liberal Arts Colleges are schools that emphasize undergrad-uate education and award at least half of their degrees in the liberal arts fields of study. Regional colleges areinstitutions focusing on undergraduate education, awarding less than half of their degrees in liberal arts fieldsof study. We used the university classifications of U.S. News & World Report (www.usnews.com/education).
Int. J. Res. Undergrad. Math. Ed. (2016) 2:105–133 107
were important for us to consider, we did not locate a framework that was suited for ourpurpose. The ECF emerged from 12 cycles of our coding exam items, refining ourcharacterization of ECF constructs, and recoding items until we were satisfied that theconstructs that comprise the ECF were accurately characterizing the exam items in ourrandom sample and effectively distinguishing qualitatively distinct items.
In the remainder of this section, we summarize the various frameworks thatinformed our design of the ECF. This literature serves as a backdrop against whichwe present our framework in the following section.
Item Coding Frameworks
Li (2000) characterized items focused on the addition and subtraction of integers inAmerican and Chinese mathematics textbooks. Through her examination of thesetextbook items, Li identified three dimensions of problem requirements: (a) mathemat-ical feature, (b) contextual feature, and (c) performance requirements. The mathemat-ical feature strand refers to the number of computational procedures needed to solve aproblem. Li coded items as either single computation procedure required (S) ormultiple computation procedures required (M). The contextual feature dimension ofher framework refers to the nature of contextual information contained in a problemstatement, such as whether the problem statement was situated in a purely mathematicalcontext in numerical or word form (PM) or illustrative context with pictorial represen-tation or story (IC) (Li 2000, p. 237). Li further partitions the performance requirementdimension of her framework into two categories: (a) response type, and (b) cognitiverequirement. Response type refers to the contextual feature of the solution that a taskelicits whereas cognitive requirement refers to the mental act in which one engageswhile solving a task.
Lithner (2004) developed a cognitive framework to classify calculus textbook itemsaccording to various strategies that could be employed to complete the item. Hisinterest in coding textbook items was based on his belief that most items in calculustextbooks could be completed without considering the intrinsic mathematical propertiesof the item. Lithner’s framework includes six reasoning practices that one mightemploy when solving calculus textbook exercises, including reasoning based onidentification of similarities, reasoning based on what seems to be true based on pastexperiences, and repeated algorithmic reasoning.
Smith et al. (1996) propose a taxonomy for classifying the cognitive demand ofassessment tasks that evolved from the six intellectual behaviors in the cognitivedomain of Bloom’s taxonomy (Bloom et al. 1956).2 Smith et al. adapted Bloom’sinitial taxonomy for use in a mathematical context and proposed the taxonomycategories: (1) factual knowledge, (2) comprehension, (3) routine use of procedures,(4) information transfer, (5) application in new situations, (6) justifying andinterpreting, (7) implications, conjectures, and comparisons, and (8) evaluation. Theprimary purpose of their taxonomy was to assist instructors in writing exam items.
Anderson and Krathwohl (2001) developed a revision of Bloom’s taxonomy toreflect developments in cognitive psychology occuring after the publication of Bloom’s
2 These six intellectual behaviors are: knowledge, comprehension, application, analysis, synthesis, andevaluation.
108 Int. J. Res. Undergrad. Math. Ed. (2016) 2:105–133
original taxonomy (Bloom et al. 1956). They also modified the categories in thecognitive domain of Bloom’s original taxonomy to make the revised taxonomy moresuited for classifying teaching goals (e.g., defining learning objectives).
Mesa et al. (2012) analyzed the characteristics of examples in college algebratextbooks along the four dimensions proposed by Charalambous et al. (2010): (1)cognitive demand, (2) the expected response, (3) the use of representations, and (4) thestrategies available for verifying the correctness and appropriateness of the solution.The cognitive demand dimension consists of the categories: memorization, procedureswithout connections, procedures with connections, and doing mathematics. A studentcan solve tasks that require the cognitive behavior of memorizing by simply recallinginformation from memory without enacting a procedure. Tasks that require students toemploy procedures without connections can be solved by applying rehearsed proce-dures without attending to connections to other mathematical ideas or real worldcontexts. Tasks that require students to employ procedures with connections promptthem to apply a procedure in which they draw connections to other mathematical ideasor real world contexts. Finally, tasks that expect students to do mathematics requirethem to investigate fundamental mathematics concepts that promote the generation ofnew knowledge.
The expected response dimension of Mesa et al.’s analytical framework refers to thesolution that an example provides by identifying whether the solution offers only ananswer, gives an answer with an explanation or justification of the process undertakento arrive at that answer, or contains both an answer and a mathematical sentence.Moreover, Mesa et al. identified the representation of the statement of the example andthe solution provided according to five representation categories: symbols, tables,graphs, numbers, and verbalizations.
Development of the Exam Characterization Framework
Our development of the Exam Characterization Framework (ECF) began with usfamiliarizing ourselves with the random sample of 150 Calculus I final exams. Indoing so we identified items that we conjectured might be difficult to characterizerelative to the level of cognition required for a correct response. Since we were mostinterested in characterizing the cognitive demand of exam items, our initial codinginvolved identifying the level of cognition required to solve an item. We chose to callthis dimension item orientation.
Our initial attempt to apply the three cognitive requirements in Li’s (2000) frame-work (mathematical feature, contextual feature, and performance requirements) in ourcoding revealed that these constructs were too coarsely defined for our purpose, andthus resulted in qualitative variation of items within each category with respect to thecognitive demand needed to respond to them. When attempting to use the variousreasoning practices defined in Lithner’s (2004) framework, we found that withoutknowledge of students’ prior experiences, the boundaries of each classification lackedthe specificity required to code items with a high degree of reliability. However, we didadopt Lithner’s approach to classifying items based on the cognitive demand that wasnecessary for providing a correct response. Attending to the cognitive demand requiredby a task was necessary to achieve a reliable characterization of exam items since wedid not have knowledge of students’ experiences in their calculus courses.
Int. J. Res. Undergrad. Math. Ed. (2016) 2:105–133 109
We became aware of Mesa et al.’s framework after having developed a completedraft of the ECF, but decided to consider her constructs for the purpose of refining ourframework, especially since her dimensions had some similarities with those in theECF. We attempted to code select exam items using the cognitive demand dimension ofMesa et al.’s (2012) framework, but found their characterization of the cognitivedemand of exam items more related to desired understandings instead of the under-standings that a task requires. Moreover, we had difficulty agreeing on precisely whatconstitutes a connection for an exam item. While discerning whether or not exam itemsevoked connections, we were unable to reliably categorize items within the Bprocedureswithout connections^ and Bprocedures with connections^ categories of the cognitivedemand dimension of Mesa et al.’s framework.
The categories of Smith et al.’s (1996) framework, which evolved from Bloom’sorigional taxonomy (Bloom et al. 1956), appealed to us, but because they weredesigned to assist instructors in writing exam items, their categories lacked the hierar-chical structure that a diagnostic taxonomy typically requires. Therefore, Anderson andKrathwohl’s (2001) modification of the six intellectual behaviors in the cognitivedomain of Bloom’s taxonomy was the most helpful for informing our approach tocoding the cognitive demand of exam items. Anderson and Krathwohl (2001) devel-oped their revision of Bloom’s taxonomy to reflect developments in cognitive psychol-ogy occuring after the publication of Bloom’s original taxonomy, and to make thetaxonomy more suited to the purposes of classroom teaching (e.g., defining learningobjectives). They characterize the levels of their taxonomy using the verbs: remember-ing, understanding, applying, analyzing, evaluating, and creating.
Since we were evaluating tasks rather than actual behaviors, our definitions neededto focus exlusively on the nature of the exam items, leading us to consider thecategories: remember, understand, apply, analyze, evaluate, and create. Coding thecognitive demand of calculus exam items using these constructs revealed that someitems (e.g., determine the derivative of f) required students to use procedural skillswhile requiring no understanding of the concept(s) on which the skills arebased. This required a different cognitive behavior than simply recalling infor-mation, and led to our introducing the construct recall and apply procedure toAnderson and Krathwohl’s levels. Similarly, our preliminary coding revealedthat one could demonstrate an understanding of a concept without applying theunderstanding to achieve a goal or solve a problem, resulting in our introducingthe level apply understanding.
To classify exam items relative to the cognitive demand they elicit, we have adaptedthe six intellectual behaviors in the conceptual knowledge dimension of Anderson andKrathwohl’s modified Bloom’s taxonomy to (1) reflect the variety of cognitive behav-iors elicited by mathematics tasks, and (2) accurately characterize the cognitive demandof mathematics tasks in the absence of information about students’ prior knowledge forwhom the tasks were intended. We describe these constructs, and our use of them, inmore detail in the following section.
In the process of coding items, we found it relatively straightforward to specify therepresentation in which mathematics items are presented. Consistent with Li (2000) andMesa et al. (2012), we also found it useful to code both the representation of theproblem statement and the representation of the solution. We noted a representationtype in the solution only if it was necessary to solve the problem or complete the task.
110 Int. J. Res. Undergrad. Math. Ed. (2016) 2:105–133
The mathematical feature dimension of Li’s framework led us to consider the codingdimension item density. We defined a dense item as one that necessitates the incorpo-ration of multiple concepts, procedures, and skills. However, since calculus tasks areoften subject to being solved in a variety of ways, we were unable to specify how manyprocedures and concepts were needed to solve a specific calculus problem. Moreover,the grain-size of Bprocedure^ has a wide range of interpretations, thus making codingproblematic for more complicated tasks. We thus determined that our attempts to codeitems according to the number of procedures and concepts that are needed to solve aproblem was less important than the overall cognitive demand of the task. As a result,we abandoned the item density dimension early in our framework development.
We also considered the fourth dimension of Mesa et al.’s framework that identifiesthe strategies needed for students to employ control (i.e., verify the correctness andappropriateness of a solution) during the process of completing a task. Our efforts tocode for control led us to recognize that control is exercised idiosyncratically since itis initiated by a student’s assessment of the validity and appropriateness of their ownwork. For example, one student might take the time to reflect on the reasonablenessof computations when working a multi-step applied problem, while another studentmight continue with a sequence of memorized steps and pay no attention to compu-tations that produce unreasonable results. There are, however, instances in whichstudents are more likely to exhibit control. Two such instances are when a questionprompts students to provide either an explanation or justification for their work. Mesaet al. refer to such actions as further elaboration. We conjecture that the act ofproviding an explanation or justification might require one to reflect upon and assessthe correctness of his or her work. However, if the teacher had the student practicejustifying a response or solution, in homework or during class, it is possible that thestudent did not exercise control when responding to the exam item. Therefore, insteadof coding for a mental process that a student might or might not exercise whenresponding to an item, we decided to not code for control but rather to add adimension in the item format category for noting instances in which exam itemsrequire students to explain or justify their response.
Exam Characterization Framework
The Exam Characterization Framework characterizes exam items according to threedistinct item attributes: (a) item orientation, (b) item representation, and (c) item format.The first two authors independently coded five Calculus I final exams while makingnote of each exam item’s characteristics. We then met to compare and refine ourcharacterizations so as to ensure that our meanings were consistent. After 12 cyclesof coding and meeting to compare and refine our characterizations, we emerged with astable framework that included categories that we found to be most useful for charac-terizing Calculus I final exam items. Two other coders coded ten randomly selectedexams for the purpose of establishing the readability of our construct descriptions. Afterwe refined the framework, the lead author independently coded all 150 exams in thesample.
The item orientation dimension of the framework includes the following sevencategories of intellectual behaviors needed to respond to an exam item: remember,recall and apply procedure, understand, apply understanding, analyze, evaluate, and
Int. J. Res. Undergrad. Math. Ed. (2016) 2:105–133 111
create. When coding items for their representation type, we coded representationspresent in the question or problem statement. We also coded for the representationsrequired when responding to a question or working a problem. This dimension of ourframework includes the categories: applied/modeling, symbolic, tabular, graphical,definition/theorem, proof, example/counterexample, and explanation. The third dimen-sion of our framework is item format, with the categoriesmultiple choice, short answer,and broad open-ended. When coding the format of the item, we also noted whether theitem required students to provide a justification or explanation.
Item Orientation
The six classifications of the item orientation taxonomy are hierarchical, as is Bloom’staxonomy and Anderson and Krathwohl’s (2001) modification of Bloom’s taxonomy.The lowest level requires students to remember information and the highest levelrequires students to make connections (see Table 1). When coding items using theitem orientation categories, we classified an item at a specific level only when thiscognitive behavior was necessary for responding to the item. Even if an item wasdesigned to assess a student’s understanding of an idea, if a student is able to solve theproblem by applying a memorized procedure, then we classified the item as Brecall andapply a procedure.^ As emphasized above, since we had no information about students’experiences in their calculus courses, we attended only to the highest-level cognitivebehavior that a task required. We also made a distinction between items that requirestudents to understand an idea and those that require students to apply their under-standing of an idea or concept (e.g., derivative) to solve the problem. The intellectualbehaviors in the item orientation taxonomy of the ECF are described in more detail inTable 1.
Note that item orientation is not the same as item difficulty. The former takes as theunit of analysis the type of cognition an exam item elicits while the latter focuses on anitem’s complexity. A procedural item might be very complex (e.g., differentiating acomplicated function) while a item that requires understanding might be relativelystraightforward (e.g., explain what the output value of a point on the derivative functionrepresents).
Characterizing the Item Orientation Dimensions
This subsection presents examples of Calculus I items that require the various cognitivebehaviors within the item orientation taxonomy of the ECF. We provide examples fromthe first five categories of the item orientation taxonomy only, since none of theCalculus I final exam items we coded met the criteria for eliciting the cognitivebehaviors Bevaluate^ or Bcreate.^ We chose these examples to illustrate some of themore difficult interpretations we made during coding. These descriptions should alsohelp to clarify our taxonomy categories.
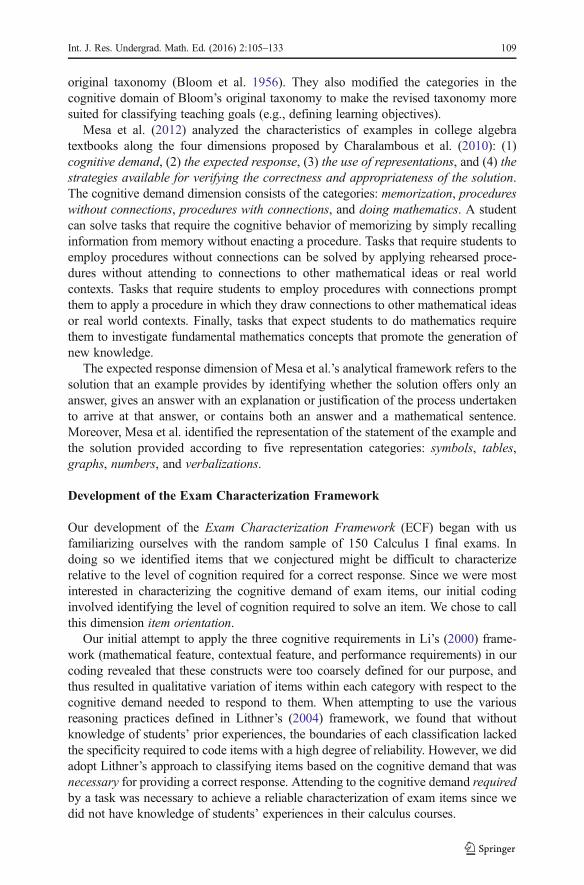
Exam items that elicit the cognitive behavior of remembering prompt the student torecall factual information, but do not require the student to apply a procedure ordemonstrate understanding. As one example, a test question that we classified asBremember^ prompted students to recall a part of the statement of the Mean ValueTheorem (Fig. 1). Successfully answering the question in Fig. 1 does not require
112 Int. J. Res. Undergrad. Math. Ed. (2016) 2:105–133
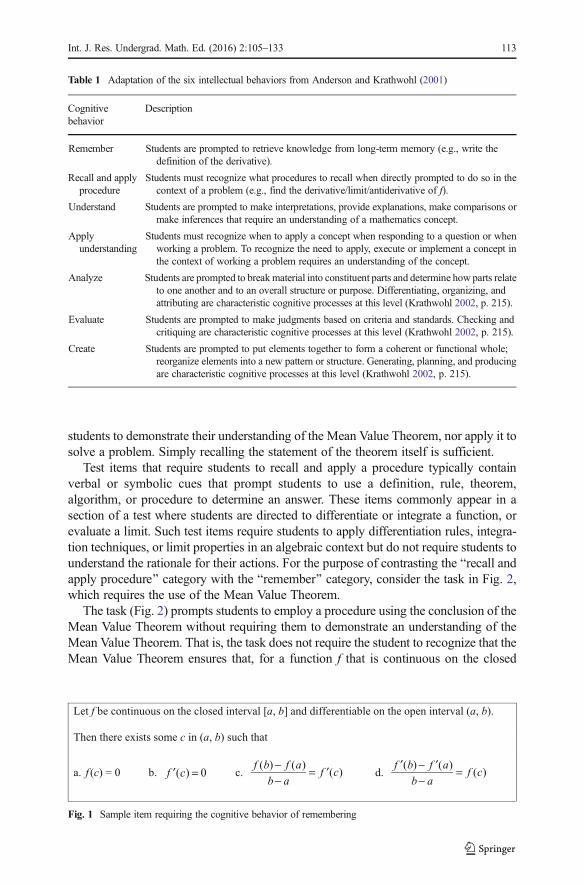
students to demonstrate their understanding of the Mean Value Theorem, nor apply it tosolve a problem. Simply recalling the statement of the theorem itself is sufficient.
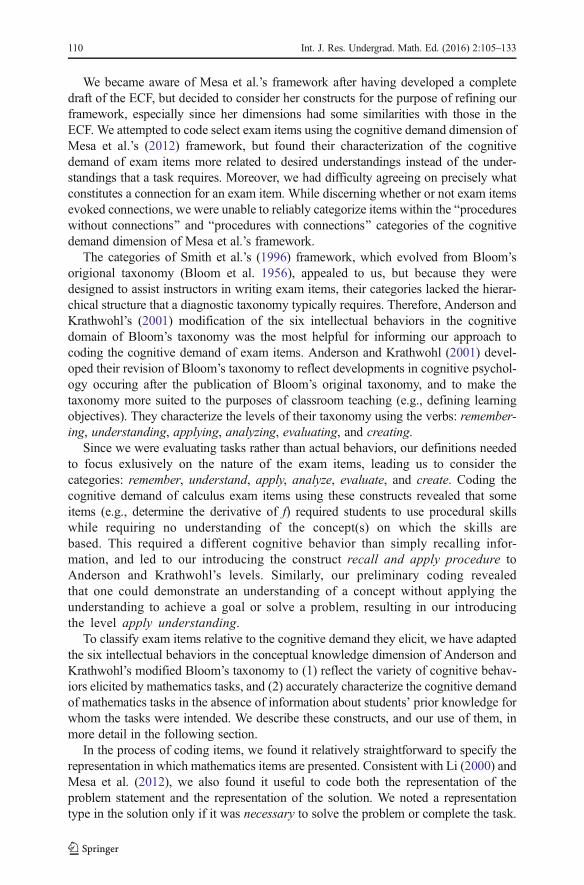
Test items that require students to recall and apply a procedure typically containverbal or symbolic cues that prompt students to use a definition, rule, theorem,algorithm, or procedure to determine an answer. These items commonly appear in asection of a test where students are directed to differentiate or integrate a function, orevaluate a limit. Such test items require students to apply differentiation rules, integra-tion techniques, or limit properties in an algebraic context but do not require students tounderstand the rationale for their actions. For the purpose of contrasting the Brecall andapply procedure^ category with the Bremember^ category, consider the task in Fig. 2,which requires the use of the Mean Value Theorem.
The task (Fig. 2) prompts students to employ a procedure using the conclusion of theMean Value Theorem without requiring them to demonstrate an understanding of theMean Value Theorem. That is, the task does not require the student to recognize that theMean Value Theorem ensures that, for a function f that is continuous on the closed
Table 1 Adaptation of the six intellectual behaviors from Anderson and Krathwohl (2001)
Cognitivebehavior
Description
Remember Students are prompted to retrieve knowledge from long-term memory (e.g., write thedefinition of the derivative).
Recall and applyprocedure
Students must recognize what procedures to recall when directly prompted to do so in thecontext of a problem (e.g., find the derivative/limit/antiderivative of f).
Understand Students are prompted to make interpretations, provide explanations, make comparisons ormake inferences that require an understanding of a mathematics concept.
Applyunderstanding
Students must recognize when to apply a concept when responding to a question or whenworking a problem. To recognize the need to apply, execute or implement a concept inthe context of working a problem requires an understanding of the concept.
Analyze Students are prompted to breakmaterial into constituent parts and determine how parts relateto one another and to an overall structure or purpose. Differentiating, organizing, andattributing are characteristic cognitive processes at this level (Krathwohl 2002, p. 215).
Evaluate Students are prompted to make judgments based on criteria and standards. Checking andcritiquing are characteristic cognitive processes at this level (Krathwohl 2002, p. 215).
Create Students are prompted to put elements together to form a coherent or functional whole;reorganize elements into a new pattern or structure. Generating, planning, and producingare characteristic cognitive processes at this level (Krathwohl 2002, p. 215).
Let f be continuous on the closed interval [a, b] and differentiable on the open interval (a, b).
Then there exists some c in (a, b) such that
a. f (c) = 0 b. ′f (c) = 0 c. f (b) − f (a)
b− a= ′f (c) d.
′f (b) − ′f (a)
b− a= f (c)
Fig. 1 Sample item requiring the cognitive behavior of remembering
Int. J. Res. Undergrad. Math. Ed. (2016) 2:105–133 113
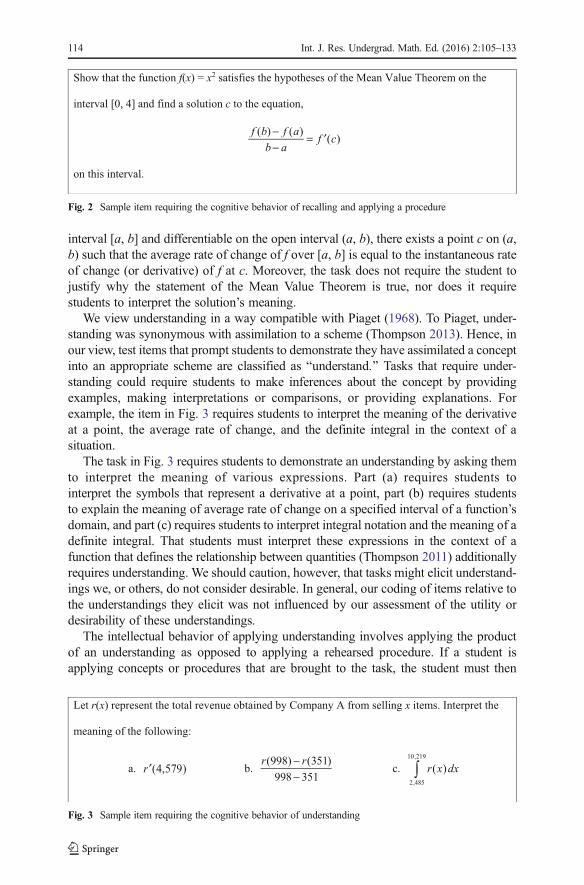
interval [a, b] and differentiable on the open interval (a, b), there exists a point c on (a,b) such that the average rate of change of f over [a, b] is equal to the instantaneous rateof change (or derivative) of f at c. Moreover, the task does not require the student tojustify why the statement of the Mean Value Theorem is true, nor does it requirestudents to interpret the solution’s meaning.
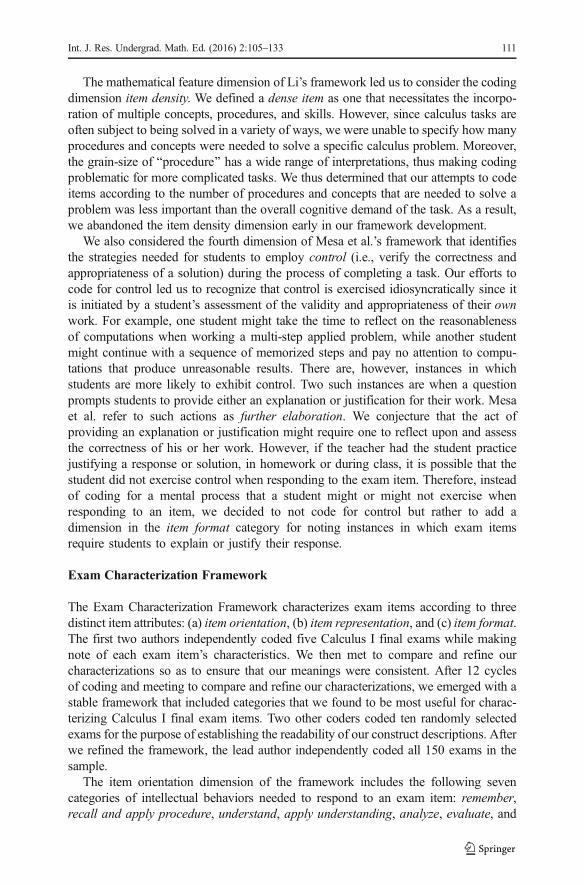
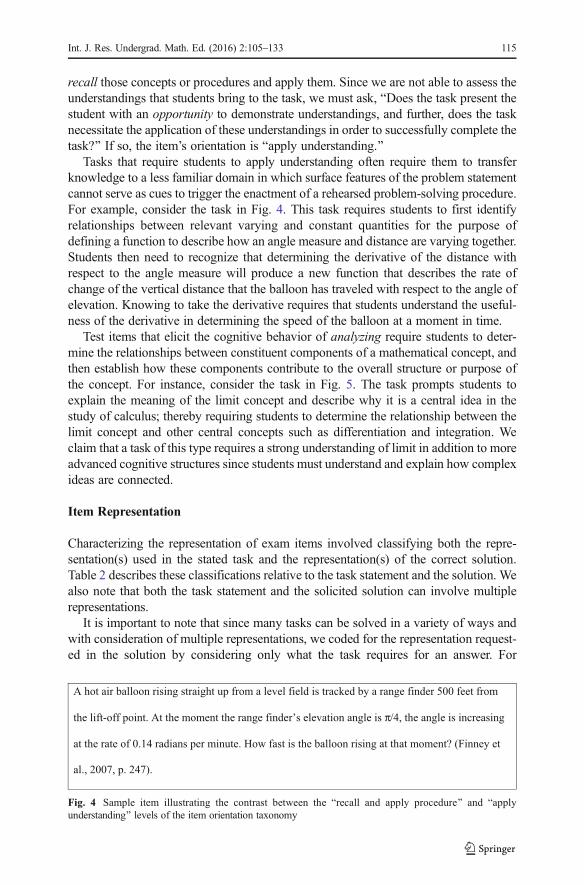
We view understanding in a way compatible with Piaget (1968). To Piaget, under-standing was synonymous with assimilation to a scheme (Thompson 2013). Hence, inour view, test items that prompt students to demonstrate they have assimilated a conceptinto an appropriate scheme are classified as Bunderstand.^ Tasks that require under-standing could require students to make inferences about the concept by providingexamples, making interpretations or comparisons, or providing explanations. Forexample, the item in Fig. 3 requires students to interpret the meaning of the derivativeat a point, the average rate of change, and the definite integral in the context of asituation.
The task in Fig. 3 requires students to demonstrate an understanding by asking themto interpret the meaning of various expressions. Part (a) requires students tointerpret the symbols that represent a derivative at a point, part (b) requires studentsto explain the meaning of average rate of change on a specified interval of a function’sdomain, and part (c) requires students to interpret integral notation and the meaning of adefinite integral. That students must interpret these expressions in the context of afunction that defines the relationship between quantities (Thompson 2011) additionallyrequires understanding. We should caution, however, that tasks might elicit understand-ings we, or others, do not consider desirable. In general, our coding of items relative tothe understandings they elicit was not influenced by our assessment of the utility ordesirability of these understandings.
The intellectual behavior of applying understanding involves applying the productof an understanding as opposed to applying a rehearsed procedure. If a student isapplying concepts or procedures that are brought to the task, the student must then
Show that the function f(x) = x2 satisfies the hypotheses of the Mean Value Theorem on the
interval [0, 4] and find a solution c to the equation,
f (b) − f (a)
b− a= ′f (c)
on this interval.
Fig. 2 Sample item requiring the cognitive behavior of recalling and applying a procedure
Let r(x) represent the total revenue obtained by Company A from selling x items. Interpret the
meaning of the following:
a. ′r (4,579) b. r(998) − r(351)
998 − 351 c. r(x)dx
2,485
10,219
∫
Fig. 3 Sample item requiring the cognitive behavior of understanding
114 Int. J. Res. Undergrad. Math. Ed. (2016) 2:105–133
recall those concepts or procedures and apply them. Since we are not able to assess theunderstandings that students bring to the task, we must ask, BDoes the task present thestudent with an opportunity to demonstrate understandings, and further, does the tasknecessitate the application of these understandings in order to successfully complete thetask?^ If so, the item’s orientation is Bapply understanding.^
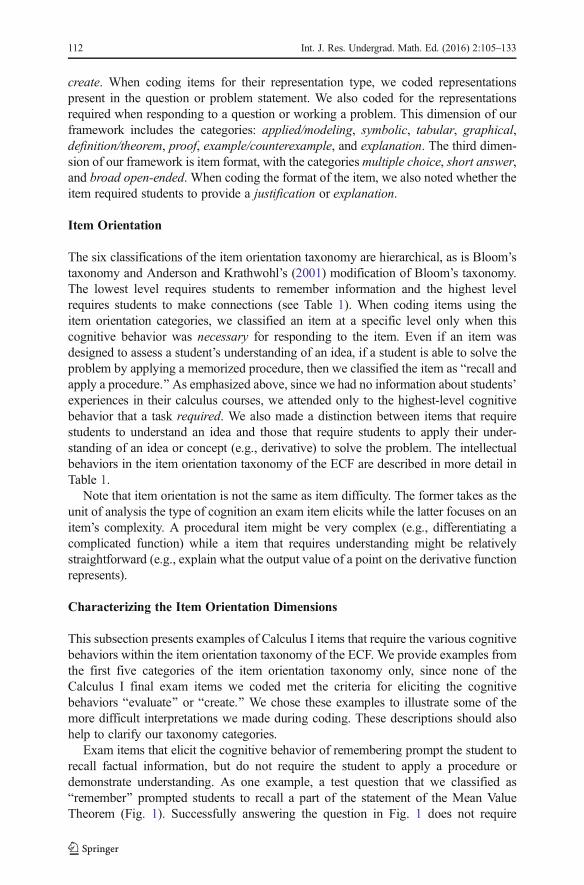
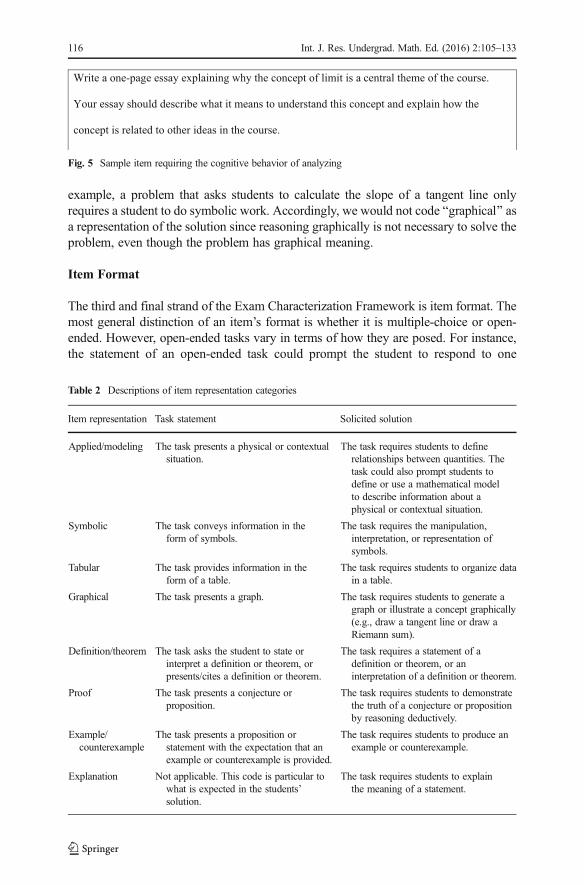
Tasks that require students to apply understanding often require them to transferknowledge to a less familiar domain in which surface features of the problem statementcannot serve as cues to trigger the enactment of a rehearsed problem-solving procedure.For example, consider the task in Fig. 4. This task requires students to first identifyrelationships between relevant varying and constant quantities for the purpose ofdefining a function to describe how an angle measure and distance are varying together.Students then need to recognize that determining the derivative of the distance withrespect to the angle measure will produce a new function that describes the rate ofchange of the vertical distance that the balloon has traveled with respect to the angle ofelevation. Knowing to take the derivative requires that students understand the useful-ness of the derivative in determining the speed of the balloon at a moment in time.
Test items that elicit the cognitive behavior of analyzing require students to deter-mine the relationships between constituent components of a mathematical concept, andthen establish how these components contribute to the overall structure or purpose ofthe concept. For instance, consider the task in Fig. 5. The task prompts students toexplain the meaning of the limit concept and describe why it is a central idea in thestudy of calculus; thereby requiring students to determine the relationship between thelimit concept and other central concepts such as differentiation and integration. Weclaim that a task of this type requires a strong understanding of limit in addition to moreadvanced cognitive structures since students must understand and explain how complexideas are connected.
Item Representation
Characterizing the representation of exam items involved classifying both the repre-sentation(s) used in the stated task and the representation(s) of the correct solution.Table 2 describes these classifications relative to the task statement and the solution. Wealso note that both the task statement and the solicited solution can involve multiplerepresentations.
It is important to note that since many tasks can be solved in a variety of ways andwith consideration of multiple representations, we coded for the representation request-ed in the solution by considering only what the task requires for an answer. For
A hot air balloon rising straight up from a level field is tracked by a range finder 500 feet from
the lift-off point. At the moment the range finder’s elevation angle is π/4, the angle is increasing
at the rate of 0.14 radians per minute. How fast is the balloon rising at that moment? (Finney et
al., 2007, p. 247).
Fig. 4 Sample item illustrating the contrast between the Brecall and apply procedure^ and Bapplyunderstanding^ levels of the item orientation taxonomy
Int. J. Res. Undergrad. Math. Ed. (2016) 2:105–133 115
example, a problem that asks students to calculate the slope of a tangent line onlyrequires a student to do symbolic work. Accordingly, we would not code Bgraphical^ asa representation of the solution since reasoning graphically is not necessary to solve theproblem, even though the problem has graphical meaning.
Item Format
The third and final strand of the Exam Characterization Framework is item format. Themost general distinction of an item’s format is whether it is multiple-choice or open-ended. However, open-ended tasks vary in terms of how they are posed. For instance,the statement of an open-ended task could prompt the student to respond to one
Write a one-page essay explaining why the concept of limit is a central theme of the course.
Your essay should describe what it means to understand this concept and explain how the
concept is related to other ideas in the course.
Fig. 5 Sample item requiring the cognitive behavior of analyzing
Table 2 Descriptions of item representation categories
Item representation Task statement Solicited solution
Applied/modeling The task presents a physical or contextualsituation.
The task requires students to definerelationships between quantities. Thetask could also prompt students todefine or use a mathematical modelto describe information about aphysical or contextual situation.
Symbolic The task conveys information in theform of symbols.
The task requires the manipulation,interpretation, or representation ofsymbols.
Tabular The task provides information in theform of a table.
The task requires students to organize datain a table.
Graphical The task presents a graph. The task requires students to generate agraph or illustrate a concept graphically(e.g., draw a tangent line or draw aRiemann sum).
Definition/theorem The task asks the student to state orinterpret a definition or theorem, orpresents/cites a definition or theorem.
The task requires a statement of adefinition or theorem, or aninterpretation of a definition or theorem.
Proof The task presents a conjecture orproposition.
The task requires students to demonstratethe truth of a conjecture or propositionby reasoning deductively.
Example/counterexample
The task presents a proposition orstatement with the expectation that anexample or counterexample is provided.
The task requires students to produce anexample or counterexample.
Explanation Not applicable. This code is particular towhat is expected in the students’solution.
The task requires students to explainthe meaning of a statement.
116 Int. J. Res. Undergrad. Math. Ed. (2016) 2:105–133
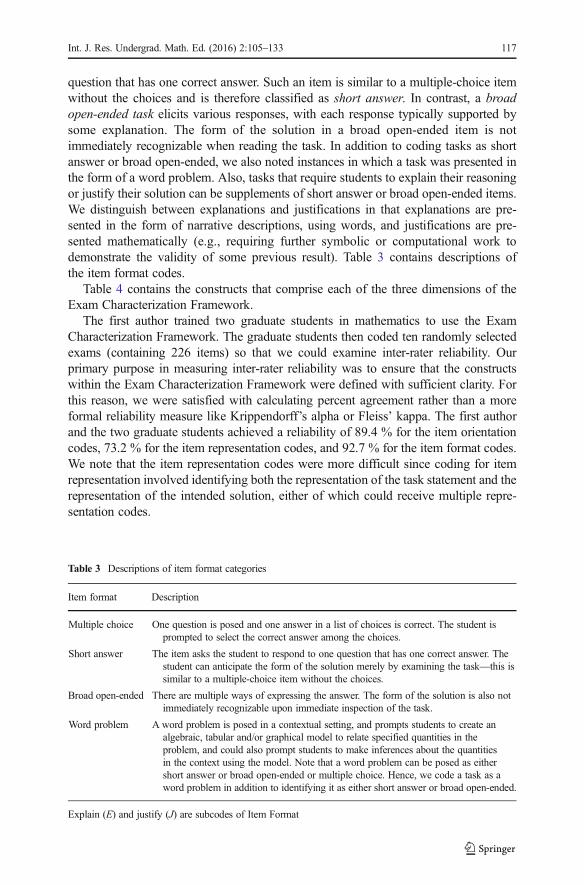
question that has one correct answer. Such an item is similar to a multiple-choice itemwithout the choices and is therefore classified as short answer. In contrast, a broadopen-ended task elicits various responses, with each response typically supported bysome explanation. The form of the solution in a broad open-ended item is notimmediately recognizable when reading the task. In addition to coding tasks as shortanswer or broad open-ended, we also noted instances in which a task was presented inthe form of a word problem. Also, tasks that require students to explain their reasoningor justify their solution can be supplements of short answer or broad open-ended items.We distinguish between explanations and justifications in that explanations are pre-sented in the form of narrative descriptions, using words, and justifications are pre-sented mathematically (e.g., requiring further symbolic or computational work todemonstrate the validity of some previous result). Table 3 contains descriptions ofthe item format codes.
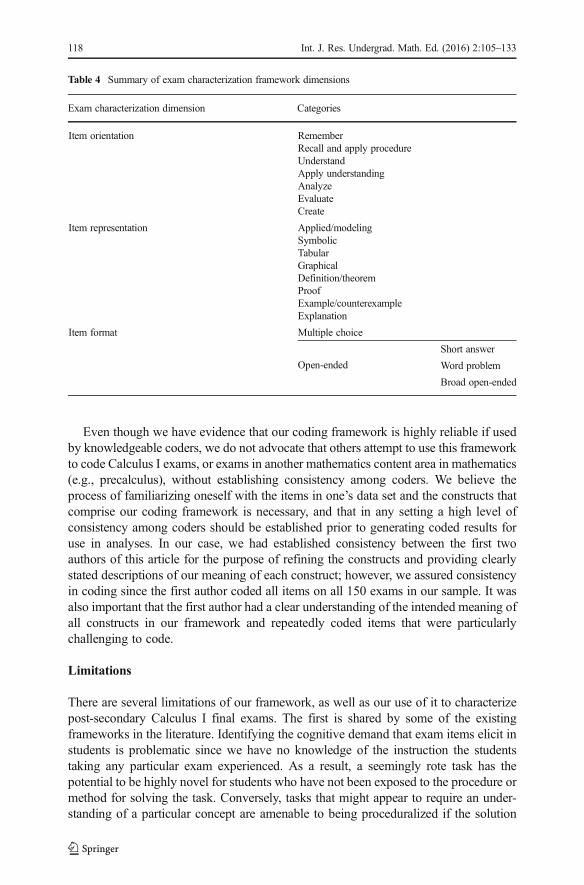
Table 4 contains the constructs that comprise each of the three dimensions of theExam Characterization Framework.
The first author trained two graduate students in mathematics to use the ExamCharacterization Framework. The graduate students then coded ten randomly selectedexams (containing 226 items) so that we could examine inter-rater reliability. Ourprimary purpose in measuring inter-rater reliability was to ensure that the constructswithin the Exam Characterization Framework were defined with sufficient clarity. Forthis reason, we were satisfied with calculating percent agreement rather than a moreformal reliability measure like Krippendorff’s alpha or Fleiss’ kappa. The first authorand the two graduate students achieved a reliability of 89.4 % for the item orientationcodes, 73.2 % for the item representation codes, and 92.7 % for the item format codes.We note that the item representation codes were more difficult since coding for itemrepresentation involved identifying both the representation of the task statement and therepresentation of the intended solution, either of which could receive multiple repre-sentation codes.
Table 3 Descriptions of item format categories
Item format Description
Multiple choice One question is posed and one answer in a list of choices is correct. The student isprompted to select the correct answer among the choices.
Short answer The item asks the student to respond to one question that has one correct answer. Thestudent can anticipate the form of the solution merely by examining the task—this issimilar to a multiple-choice item without the choices.
Broad open-ended There are multiple ways of expressing the answer. The form of the solution is also notimmediately recognizable upon immediate inspection of the task.
Word problem A word problem is posed in a contextual setting, and prompts students to create analgebraic, tabular and/or graphical model to relate specified quantities in theproblem, and could also prompt students to make inferences about the quantitiesin the context using the model. Note that a word problem can be posed as eithershort answer or broad open-ended or multiple choice. Hence, we code a task as aword problem in addition to identifying it as either short answer or broad open-ended.
Explain (E) and justify (J) are subcodes of Item Format
Int. J. Res. Undergrad. Math. Ed. (2016) 2:105–133 117
Even though we have evidence that our coding framework is highly reliable if usedby knowledgeable coders, we do not advocate that others attempt to use this frameworkto code Calculus I exams, or exams in another mathematics content area in mathematics(e.g., precalculus), without establishing consistency among coders. We believe theprocess of familiarizing oneself with the items in one’s data set and the constructs thatcomprise our coding framework is necessary, and that in any setting a high level ofconsistency among coders should be established prior to generating coded results foruse in analyses. In our case, we had established consistency between the first twoauthors of this article for the purpose of refining the constructs and providing clearlystated descriptions of our meaning of each construct; however, we assured consistencyin coding since the first author coded all items on all 150 exams in our sample. It wasalso important that the first author had a clear understanding of the intended meaning ofall constructs in our framework and repeatedly coded items that were particularlychallenging to code.
Limitations
There are several limitations of our framework, as well as our use of it to characterizepost-secondary Calculus I final exams. The first is shared by some of the existingframeworks in the literature. Identifying the cognitive demand that exam items elicit instudents is problematic since we have no knowledge of the instruction the studentstaking any particular exam experienced. As a result, a seemingly rote task has thepotential to be highly novel for students who have not been exposed to the procedure ormethod for solving the task. Conversely, tasks that might appear to require an under-standing of a particular concept are amenable to being proceduralized if the solution
Table 4 Summary of exam characterization framework dimensions
Exam characterization dimension Categories
Item orientation RememberRecall and apply procedureUnderstandApply understandingAnalyzeEvaluateCreate
Item representation Applied/modelingSymbolicTabularGraphicalDefinition/theoremProofExample/counterexampleExplanation
Item format Multiple choice
Open-ended
Short answer
Word problem
Broad open-ended
118 Int. J. Res. Undergrad. Math. Ed. (2016) 2:105–133
method is practiced repetitiously. We spoke earlier of our intention to code for theminimal reasoning practices and solution representations that a task requires. To do thiswith a reasonable degree of validity required us to assess minimal reasoning practicesand solution representations relative to our model of the epistemic collegiate calculusstudent.3 Additionally, our coding was informed by our knowledge of those concepts inthe calculus curriculum that are generally proceduralized (e.g., differentiation, integra-tion, limit evaluation). The first two authors have taught the entire calculus sequencemultiple times and have researched student learning in Calculus I. These commonexperiences resulted in the authors reaching a common understanding of what consti-tuted viable models of the epistemic calculus student and the general calculuscurriculum.
A second limitation is that we do not have data indicating how the exams weregraded. Accordingly, we present our results as percentages of exam items classifiedwithin each of the respective categories of the Exam Characterization Framework. Thismethod of computing results does not account for the reality that particular exam itemsmight represent a higher portion of the exam grade, and thus be valued by the instructorto a greater extent.
A third limitation is that we coded each part of an item as an individual item. Forinstance, we coded a task that has parts (a), (b), and (c) as three distinct items.This is a limitation in the sense that some instructors have a tendency to sub-divide tasks while others do not, and our Exam Characterization Frameworkdoes not identify the number of mathematical procedures or understandingsneeded to complete a task. However, our large sample size somewhat mediatesthis concern. While our decision to code each part of an exam question as anindividual item has its disadvantages, a reviewer of a previous version of thismanuscript suggested that this decision might have contributed to our achievinga more accurate characterization of the final exams since an instructor’s subdi-vision of tasks might constitute a form of scaffolding intended to providestudents with explicit intermediate goals.
In the introduction of this paper, we reveal our assumption that the content of a finalexam reflects an instructor’s expectations for students’ learning. We were less explicit,however, about our assumption that a final exam is a viable representation of aninstructor’s assessment practices. While both assumptions were crucial to thedesign of this study, we would like to preface our results by acknowledgingthree limitations of these assumptions. First, many instructors administer de-partmental exams, which are typically developed by course coordinators whosolicit the input of the faculty to various extents. A final exam may thereforenot be under the direct control of individual instructors. Second, mathematicsdepartments often experience pressure from client departments and higheradministration to lower failure rates in introductory courses. This pressuremight compel instructors and course coordinators to create exams that are notas cognitively demanding than they would otherwise be. Third, instructorsmight use more conceptually oriented tasks to support students’ learning ofcontent that are not reflected in exams that are designed to assess learning
3 BEpistemic collegiate calculus student^ is used in the Piagetian sense and is characterized by our idealizedabstraction of the college calculus student.
Int. J. Res. Undergrad. Math. Ed. (2016) 2:105–133 119
outcomes. All of these factors likely contribute to skewing the makeup of finalexams toward more procedural tasks. We encourage the reader to interpret ourresults in light of these limitations.
Results
Data analysis in this study consisted of three phases. In the first phase, we developedthe Exam Characterization Framework discussed above and used it to code the 150randomly selected exams in our sample. In the second phase, we compared the codedexam data with data obtained from a post-term instructor survey with the intention ofdetermining the extent to which our characterization of the exams corresponds withinstructors’ perceptions of their exams relative to their conceptual orientation. In thethird phase, we coded 13 Calculus I final exams administered in U.S. colleges anduniversities in 1986/87 and compared these results to those of our random sample of150 exams.
Characteristics of Post-Secondary Calculus I Exams
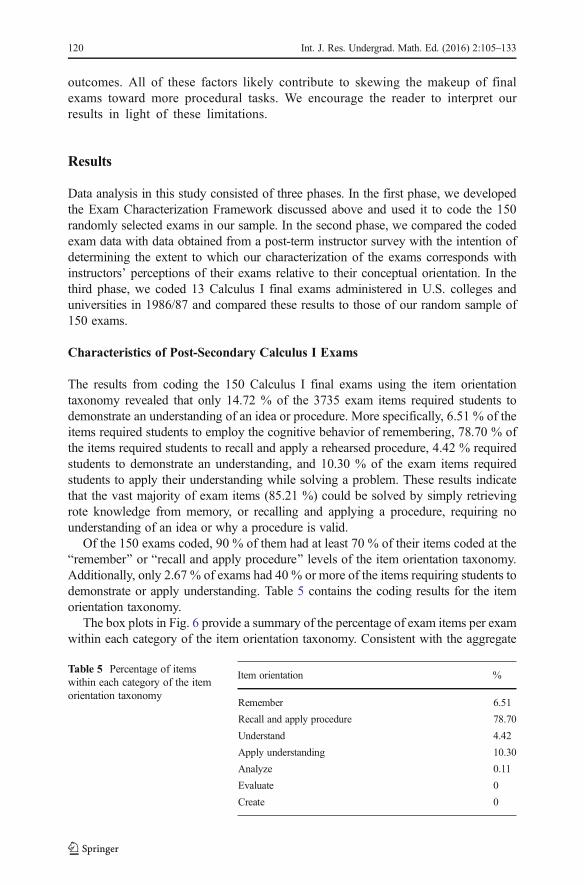
The results from coding the 150 Calculus I final exams using the item orientationtaxonomy revealed that only 14.72 % of the 3735 exam items required students todemonstrate an understanding of an idea or procedure. More specifically, 6.51 % of theitems required students to employ the cognitive behavior of remembering, 78.70 % ofthe items required students to recall and apply a rehearsed procedure, 4.42 % requiredstudents to demonstrate an understanding, and 10.30 % of the exam items requiredstudents to apply their understanding while solving a problem. These results indicatethat the vast majority of exam items (85.21 %) could be solved by simply retrievingrote knowledge from memory, or recalling and applying a procedure, requiring nounderstanding of an idea or why a procedure is valid.
Of the 150 exams coded, 90 % of them had at least 70 % of their items coded at theBremember^ or Brecall and apply procedure^ levels of the item orientation taxonomy.Additionally, only 2.67 % of exams had 40 % or more of the items requiring students todemonstrate or apply understanding. Table 5 contains the coding results for the itemorientation taxonomy.
The box plots in Fig. 6 provide a summary of the percentage of exam items per examwithin each category of the item orientation taxonomy. Consistent with the aggregate
Table 5 Percentage of itemswithin each category of the itemorientation taxonomy
Item orientation %
Remember 6.51
Recall and apply procedure 78.70
Understand 4.42
Apply understanding 10.30
Analyze 0.11
Evaluate 0
Create 0
120 Int. J. Res. Undergrad. Math. Ed. (2016) 2:105–133
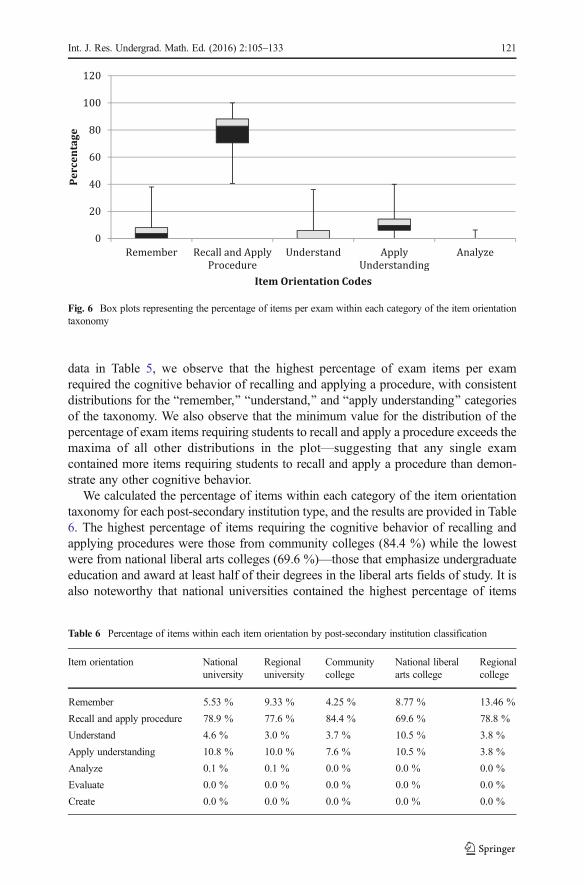
data in Table 5, we observe that the highest percentage of exam items per examrequired the cognitive behavior of recalling and applying a procedure, with consistentdistributions for the Bremember,^ Bunderstand,^ and Bapply understanding^ categoriesof the taxonomy. We also observe that the minimum value for the distribution of thepercentage of exam items requiring students to recall and apply a procedure exceeds themaxima of all other distributions in the plot—suggesting that any single examcontained more items requiring students to recall and apply a procedure than demon-strate any other cognitive behavior.
We calculated the percentage of items within each category of the item orientationtaxonomy for each post-secondary institution type, and the results are provided in Table6. The highest percentage of items requiring the cognitive behavior of recalling andapplying procedures were those from community colleges (84.4 %) while the lowestwere from national liberal arts colleges (69.6 %)—those that emphasize undergraduateeducation and award at least half of their degrees in the liberal arts fields of study. It isalso noteworthy that national universities contained the highest percentage of items
0
20
40
60
80
100
120
Remember Recall and Apply
Procedure
Understand Apply
Understanding
Analyze
Perc
enta
ge
Item Orientation Codes
Fig. 6 Box plots representing the percentage of items per exam within each category of the item orientationtaxonomy
Table 6 Percentage of items within each item orientation by post-secondary institution classification
Item orientation Nationaluniversity
Regionaluniversity
Communitycollege
National liberalarts college
Regionalcollege
Remember 5.53 % 9.33 % 4.25 % 8.77 % 13.46 %
Recall and apply procedure 78.9 % 77.6 % 84.4 % 69.6 % 78.8 %
Understand 4.6 % 3.0 % 3.7 % 10.5 % 3.8 %
Apply understanding 10.8 % 10.0 % 7.6 % 10.5 % 3.8 %
Analyze 0.1 % 0.1 % 0.0 % 0.0 % 0.0 %
Evaluate 0.0 % 0.0 % 0.0 % 0.0 % 0.0 %
Create 0.0 % 0.0 % 0.0 % 0.0 % 0.0 %
Int. J. Res. Undergrad. Math. Ed. (2016) 2:105–133 121
requiring students to apply their understanding (10.8 %) while the lowest were fromregional colleges (3.8 %)—those that focus on undergraduate education, awarding lessthan half of their degrees in liberal arts fields of study. Moreover, national liberal artscolleges contained the highest percentage of items at the Bunderstand^ level of the itemorientation taxonomy or higher (21 %), while regional colleges contained the highestpercentage of items at the Bremember^ or Brecall and apply procedure^ levels(96.26 %).
In terms of item representation, exam items were predominantly statedsymbolically (73.70 %) or required a symbolic solution (89.4 %). Few itemsprompted students for information in the form of a table (1.02 %), presenteda proposition or statement with the expectation that students provide anexample or counterexample (0.59 %), or presented a conjecture or proposi-tion with the expectation that students construct a proof (1.29 %). Table 7contains percentages of exam items within each of the item representationcategories.
The majority of Calculus I final exam items in our sample were statedsymbolically and required a symbolic solution (65.45 %). Moreover, only6.94 % of the items presented a physical or contextual situation and solicited asolution in which students were required to define relationships between quantities oruse a mathematical model to describe information about a physical or contextualsituation. Taking into consideration the increased emphasis in calculus on makingconnections among multiple representations (i.e., words, symbols, tables, and graphs),it is noteworthy that only 9.59 % of exam items were stated exclusively as Bapplied/modeling,^ Bsymbolic,^ Btabular,^ or Bgraphical^ while requiring the solution to bepresented in a different representation. Table 8 outlines the most prevalent combinationsof item representations in our sample.4
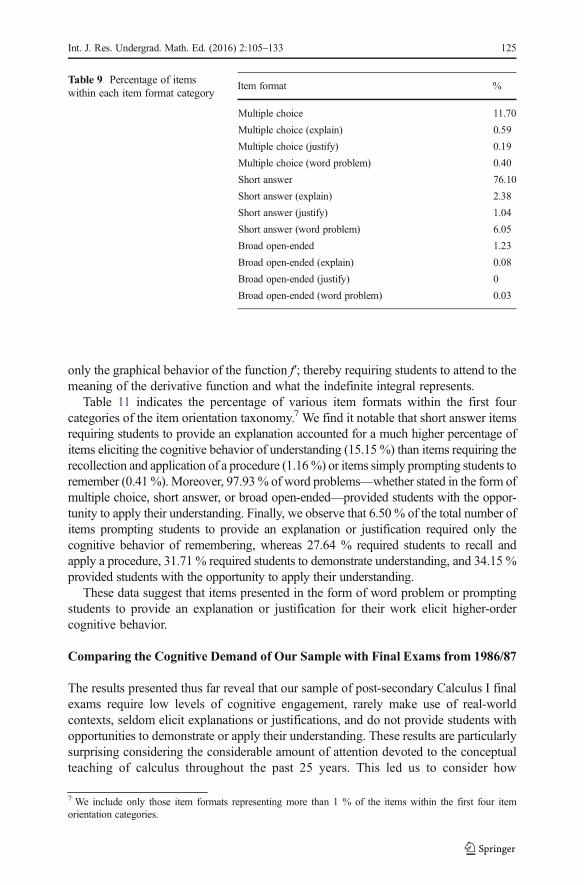
Our analysis also indicated that introductory calculus final exams seldominclude tasks that are stated in the context of a real-world situation. Our codingrevealed that 38.67 % of the coded exams had less than 5 % of the itemsclassified as word problems, in either the Bshort answer^ or Bbroad open-ended^ format categories. Further, only 22 % of the coded exams had morethan 10 % of the exam’s test items classified as a word problem in the Bshortanswer^ or Bbroad open-ended^ format categories. It is also noteworthy that18 % of the exams contained no word problems. We provide the coding resultsfrom the item format dimension of the ECF in Table 9.
In the final analysis, results from coding the 150 randomly selected examswith the Exam Characterization Framework revealed that the Calculus I finalexams in our random sample require low levels of cognitive demand, containfew problems stated in a real-world context, rarely elicit explanation, andseldom require students to demonstrate or apply their understanding of thecourse’s central ideas.
4 By Bmost prevalent^ we refer those item representations that accounted for more than 1 % of items in oursample.
122 Int. J. Res. Undergrad. Math. Ed. (2016) 2:105–133
Contrast Between Instructors’ Beliefs and Coding Results
To address the second focus of our study, we coordinated the results of the exam codesand instructors’ responses to a post-term instructor survey. We devoted particularattention to identifying inconsistencies between our findings about the characteristicsof the Calculus I final exams and instructors’ perceptions of their exams.
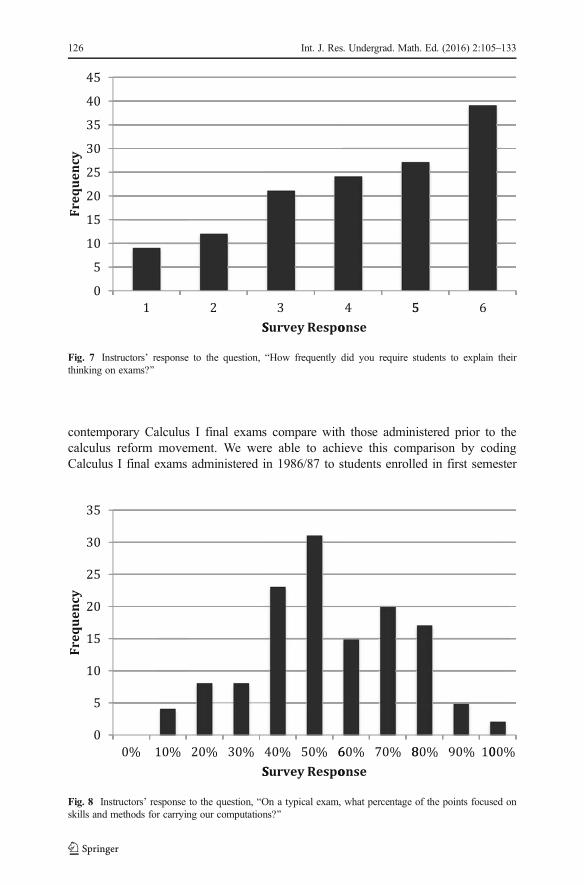
Figure 7 provides the distribution of instructors’ survey responses to the question,BHow frequently did you require students to explain their thinking on exams?^Responses ranged from 1 (not at all) to 6 (very often). We note that we would verylikely have coded an exam item requiring explanation as either Bunderstand^ or Bapplyunderstanding^ using the item orientation taxonomy. Results from the item formatcodes indicate that a total of 3.05 % of all items coded (N=3735) required anexplanation. Further, only 14.72 % of all exam items were coded as Bunderstand^ orBapply understanding^ using the item orientation taxonomy. However, 68.18 % of allinstructors who submitted exams that were part of our sample selected either 4, 5, or 6on this survey item, indicating that these instructors claim to frequently require theirstudents to explain their thinking on exams. These data reveal that the instructors’Calculus I final exams do not align with their perceptions of them relative to the extentto which students are required to explain their thinking.
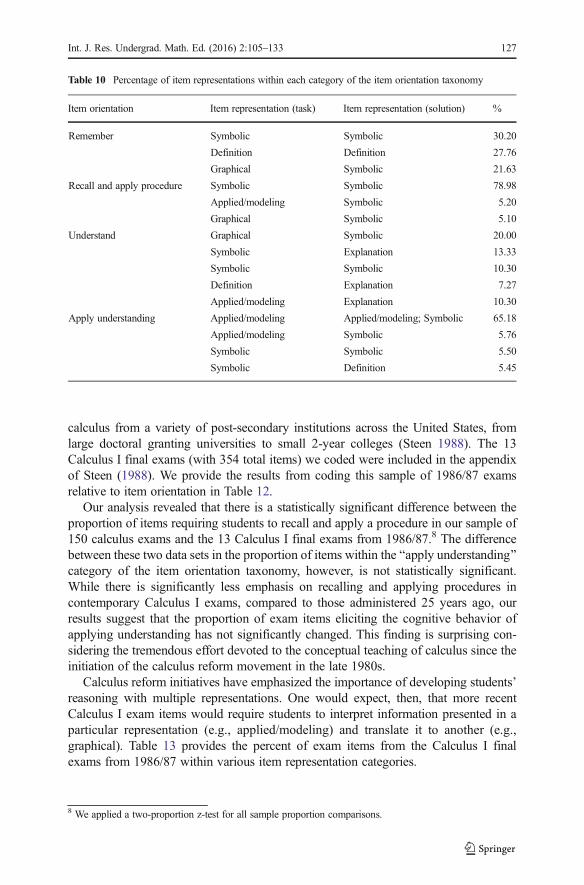
Similarly, there were also discrepancies between our characterization of thefinal exams and survey responses with respect to the percentage of exam itemsthat emphasized skills and methods for executing computations. Figure 8displays the distribution of instructors’ responses to the survey question, BOna typical exam, what percentage of the points focused on skills and methods forcarrying out computations?^ The median response was 50 %. Our codingresults, however, indicate that 78.7 % of exam items require students to recalland apply a procedure. Additionally, 89.4 % of all exam items required studentsto perform symbolic computations.
In summary, these data reveal that there is a misalignment between ourcharacterization of Calculus I final exams and instructors’ perceptions of theirexams relative to the extent to which students are asked to explain theirthinking and the percentage of exam items that focus on skills and methodsfor carrying out computations.
Table 7 Percentage of items within item representation categories
Item representation (task) % Item representation (solution) %
Applied/modeling 13.20 Applied/modeling 6.96
Symbolic 73.70 Symbolic 89.40
Tabular 1.02 Tabular 0.19
Graphical 10.40 Graphical 5.70
Definition/theorem 3.51 Definition/theorem 4.36
Proof 1.29 Proof 1.53
Example/counterexample 0.59 Example/counterexample 0.59
Explanation 2.36 Explanation 2.36
Int. J. Res. Undergrad. Math. Ed. (2016) 2:105–133 123
Correlating Item Orientation with Representation and Format
To determine if particular item representations or formats necessitated higher-ordercognitive activity, we calculated the percentage of item representations and item formattypes within each item orientation category. Table 10 documents the percentage of themost common item representation types (used in the task and asked for in the solution)for the first four levels of the item orientation taxonomy.5
As Table 10 indicates, the highest percentage of items (30.20 %) that required thecognitive behavior of remembering were stated symbolically and required a symbolicsolution. Similarly, the vast majority of tasks that required students to recall and apply aprocedure (78.98 %) were stated symbolically and required a students to produce asolution in the form of mathematical symbols. We also observed that the percentage ofitems on an exam that were stated symbolically and solicited a symbolic solutiondecreased as tasks demanded higher levels of cognitive behavior (10.30 % in theBunderstand^ category, 5.50 % in the Bapply understanding^ category, and 0 % in theBanalyze^ category6).
It is also noteworthy that items presented in a contextual or physical situation (i.e.,applied/modeling) were most prevalent among items that required students to applyunderstanding (70.94 %). The applied/modeling tasks also represented a significantpercentage of items that required students to demonstrate understanding (10.30 %).Moreover, 20 % of items that required students to demonstrate understanding presentedinformation in the form of a graph and solicited symbolic work in the solution—although these items often required explanation or justification. Thus, in the majority ofitems that required students to demonstrate understanding or apply understanding,students were required to interpret information from a graphical representation orapplied setting. As an example, consider the task in Fig. 9 stated graphically.
All parts of the task in Fig. 9 require students to demonstrate understanding sincethey are asked to infer the behavior of a function f and a function ∫f(x)dx by examining
5 By Bmost common,^ we refer to an exclusion of item representations that represented less than 5 % of theitems within a specific item orientation category.
6 The percentages of item representations within the Banalyze^ category of the item orientation taxonomy arenot provided in Table 11 as a result of the small number of items within this category (n = 4).
Table 8 Percentage of exam items within item representation categories
Item representation (task) Item representation (solution) %
Symbolic Symbolic 65.45
Applied/modeling Applied/modeling; Symbolic 6.86
Graphical Symbolic 6.72
Applied/modeling Symbolic 4.90
Symbolic Graphical 2.01
Definition Definition 1.90
Symbolic Symbolic; Graphical 1.61
124 Int. J. Res. Undergrad. Math. Ed. (2016) 2:105–133
only the graphical behavior of the function f′; thereby requiring students to attend to themeaning of the derivative function and what the indefinite integral represents.
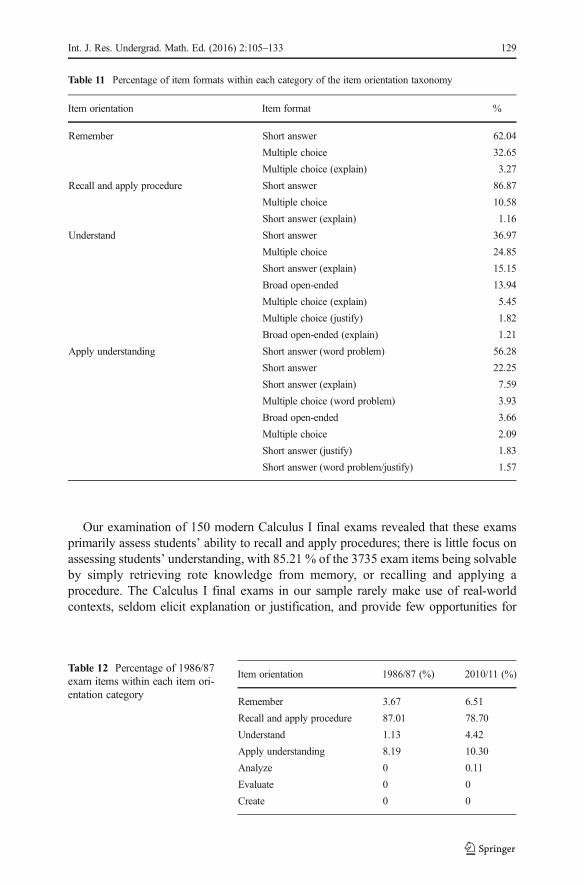
Table 11 indicates the percentage of various item formats within the first fourcategories of the item orientation taxonomy.7 We find it notable that short answer itemsrequiring students to provide an explanation accounted for a much higher percentage ofitems eliciting the cognitive behavior of understanding (15.15 %) than items requiring therecollection and application of a procedure (1.16%) or items simply prompting students toremember (0.41%). Moreover, 97.93% of word problems—whether stated in the form ofmultiple choice, short answer, or broad open-ended—provided students with the oppor-tunity to apply their understanding. Finally, we observe that 6.50 % of the total number ofitems prompting students to provide an explanation or justification required only thecognitive behavior of remembering, whereas 27.64 % required students to recall andapply a procedure, 31.71 % required students to demonstrate understanding, and 34.15 %provided students with the opportunity to apply their understanding.
These data suggest that items presented in the form of word problem or promptingstudents to provide an explanation or justification for their work elicit higher-ordercognitive behavior.
Comparing the Cognitive Demand of Our Sample with Final Exams from 1986/87
The results presented thus far reveal that our sample of post-secondary Calculus I finalexams require low levels of cognitive engagement, rarely make use of real-worldcontexts, seldom elicit explanations or justifications, and do not provide students withopportunities to demonstrate or apply their understanding. These results are particularlysurprising considering the considerable amount of attention devoted to the conceptualteaching of calculus throughout the past 25 years. This led us to consider how
7 We include only those item formats representing more than 1 % of the items within the first four itemorientation categories.
Table 9 Percentage of itemswithin each item format category
Item format %
Multiple choice 11.70
Multiple choice (explain) 0.59
Multiple choice (justify) 0.19
Multiple choice (word problem) 0.40
Short answer 76.10
Short answer (explain) 2.38
Short answer (justify) 1.04
Short answer (word problem) 6.05
Broad open-ended 1.23
Broad open-ended (explain) 0.08
Broad open-ended (justify) 0
Broad open-ended (word problem) 0.03
Int. J. Res. Undergrad. Math. Ed. (2016) 2:105–133 125
contemporary Calculus I final exams compare with those administered prior to thecalculus reform movement. We were able to achieve this comparison by codingCalculus I final exams administered in 1986/87 to students enrolled in first semester
0
5
10
15
20
25
30
35
Freq
uenc
y
0% 10% 20% 30%
S40% 50% 6
Survey Respo60% 70% 8
onse80% 90% 1000%
Fig. 8 Instructors’ response to the question, BOn a typical exam, what percentage of the points focused onskills and methods for carrying our computations?^
0
5
10
15
20
25
30
35
40
45Fr
eque
ncy
1 2
S3
Survey Respo4 5
onse5 6
Fig. 7 Instructors’ response to the question, BHow frequently did you require students to explain theirthinking on exams?^
126 Int. J. Res. Undergrad. Math. Ed. (2016) 2:105–133
calculus from a variety of post-secondary institutions across the United States, fromlarge doctoral granting universities to small 2-year colleges (Steen 1988). The 13Calculus I final exams (with 354 total items) we coded were included in the appendixof Steen (1988). We provide the results from coding this sample of 1986/87 examsrelative to item orientation in Table 12.
Our analysis revealed that there is a statistically significant difference between theproportion of items requiring students to recall and apply a procedure in our sample of150 calculus exams and the 13 Calculus I final exams from 1986/87.8 The differencebetween these two data sets in the proportion of items within the Bapply understanding^category of the item orientation taxonomy, however, is not statistically significant.While there is significantly less emphasis on recalling and applying procedures incontemporary Calculus I exams, compared to those administered 25 years ago, ourresults suggest that the proportion of exam items eliciting the cognitive behavior ofapplying understanding has not significantly changed. This finding is surprising con-sidering the tremendous effort devoted to the conceptual teaching of calculus since theinitiation of the calculus reform movement in the late 1980s.
Calculus reform initiatives have emphasized the importance of developing students’reasoning with multiple representations. One would expect, then, that more recentCalculus I exam items would require students to interpret information presented in aparticular representation (e.g., applied/modeling) and translate it to another (e.g.,graphical). Table 13 provides the percent of exam items from the Calculus I finalexams from 1986/87 within various item representation categories.
8 We applied a two-proportion z-test for all sample proportion comparisons.
Table 10 Percentage of item representations within each category of the item orientation taxonomy
Item orientation Item representation (task) Item representation (solution) %
Remember Symbolic Symbolic 30.20
Definition Definition 27.76
Graphical Symbolic 21.63
Recall and apply procedure Symbolic Symbolic 78.98
Applied/modeling Symbolic 5.20
Graphical Symbolic 5.10
Understand Graphical Symbolic 20.00
Symbolic Explanation 13.33
Symbolic Symbolic 10.30
Definition Explanation 7.27
Applied/modeling Explanation 10.30
Apply understanding Applied/modeling Applied/modeling; Symbolic 65.18
Applied/modeling Symbolic 5.76
Symbolic Symbolic 5.50
Symbolic Definition 5.45
Int. J. Res. Undergrad. Math. Ed. (2016) 2:105–133 127
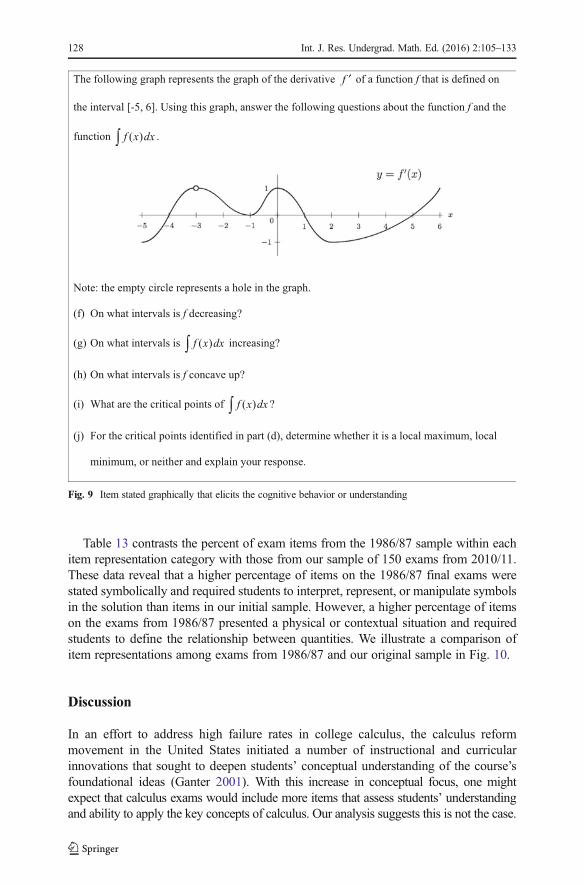
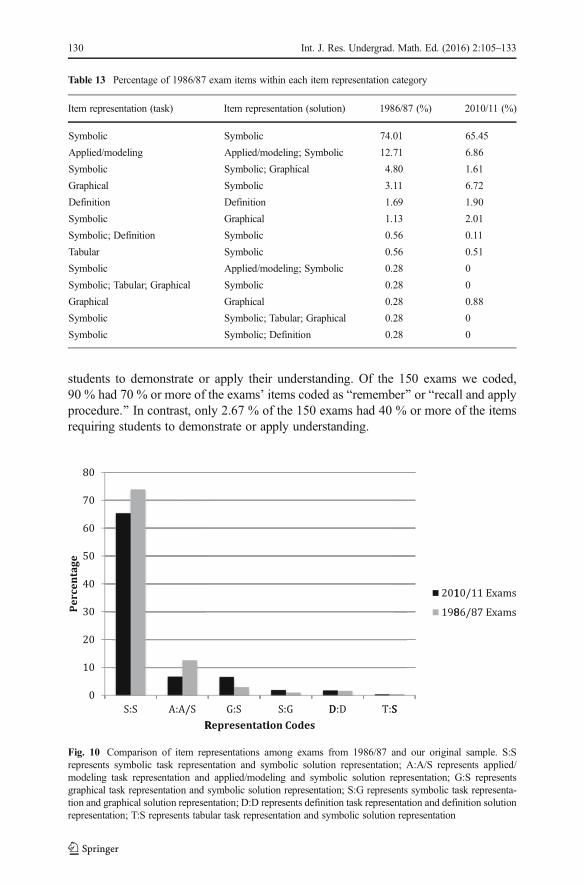
Table 13 contrasts the percent of exam items from the 1986/87 sample within eachitem representation category with those from our sample of 150 exams from 2010/11.These data reveal that a higher percentage of items on the 1986/87 final exams werestated symbolically and required students to interpret, represent, or manipulate symbolsin the solution than items in our initial sample. However, a higher percentage of itemson the exams from 1986/87 presented a physical or contextual situation and requiredstudents to define the relationship between quantities. We illustrate a comparison ofitem representations among exams from 1986/87 and our original sample in Fig. 10.
Discussion
In an effort to address high failure rates in college calculus, the calculus reformmovement in the United States initiated a number of instructional and curricularinnovations that sought to deepen students’ conceptual understanding of the course’sfoundational ideas (Ganter 2001). With this increase in conceptual focus, one mightexpect that calculus exams would include more items that assess students’ understandingand ability to apply the key concepts of calculus. Our analysis suggests this is not the case.
The following graph represents the graph of the derivative ′f of a function f that is defined on
the interval [-5, 6]. Using this graph, answer the following questions about the function f and the
function f (x)dx∫ .
Note: the empty circle represents a hole in the graph.
(f) On what intervals is f decreasing?
(g) On what intervals is f (x)dx∫ increasing?
(h) On what intervals is f concave up?
(i) What are the critical points of f (x)dx∫ ?
(j) For the critical points identified in part (d), determine whether it is a local maximum, local
minimum, or neither and explain your response.
Fig. 9 Item stated graphically that elicits the cognitive behavior or understanding
128 Int. J. Res. Undergrad. Math. Ed. (2016) 2:105–133
Our examination of 150 modern Calculus I final exams revealed that these examsprimarily assess students’ ability to recall and apply procedures; there is little focus onassessing students’ understanding, with 85.21 % of the 3735 exam items being solvableby simply retrieving rote knowledge from memory, or recalling and applying aprocedure. The Calculus I final exams in our sample rarely make use of real-worldcontexts, seldom elicit explanation or justification, and provide few opportunities for
Table 12 Percentage of 1986/87exam items within each item ori-entation category
Item orientation 1986/87 (%) 2010/11 (%)
Remember 3.67 6.51
Recall and apply procedure 87.01 78.70
Understand 1.13 4.42
Apply understanding 8.19 10.30
Analyze 0 0.11
Evaluate 0 0
Create 0 0
Table 11 Percentage of item formats within each category of the item orientation taxonomy
Item orientation Item format %
Remember Short answer 62.04
Multiple choice 32.65
Multiple choice (explain) 3.27
Recall and apply procedure Short answer 86.87
Multiple choice 10.58
Short answer (explain) 1.16
Understand Short answer 36.97
Multiple choice 24.85
Short answer (explain) 15.15
Broad open-ended 13.94
Multiple choice (explain) 5.45
Multiple choice (justify) 1.82
Broad open-ended (explain) 1.21
Apply understanding Short answer (word problem) 56.28
Short answer 22.25
Short answer (explain) 7.59
Multiple choice (word problem) 3.93
Broad open-ended 3.66
Multiple choice 2.09
Short answer (justify) 1.83
Short answer (word problem/justify) 1.57
Int. J. Res. Undergrad. Math. Ed. (2016) 2:105–133 129
students to demonstrate or apply their understanding. Of the 150 exams we coded,90 % had 70 % or more of the exams’ items coded as Bremember^ or Brecall and applyprocedure.^ In contrast, only 2.67 % of the 150 exams had 40 % or more of the itemsrequiring students to demonstrate or apply understanding.
Perc
enta
ge
0
10
20
30
40
50
60
70
80
S:S A:A/S
RG:S
RepresentatiS:G D
ion CodesD:D T:SS
201
198
10/11 Exams
86/87 Exams
Fig. 10 Comparison of item representations among exams from 1986/87 and our original sample. S:Srepresents symbolic task representation and symbolic solution representation; A:A/S represents applied/modeling task representation and applied/modeling and symbolic solution representation; G:S representsgraphical task representation and symbolic solution representation; S:G represents symbolic task representa-tion and graphical solution representation; D:D represents definition task representation and definition solutionrepresentation; T:S represents tabular task representation and symbolic solution representation
Table 13 Percentage of 1986/87 exam items within each item representation category
Item representation (task) Item representation (solution) 1986/87 (%) 2010/11 (%)
Symbolic Symbolic 74.01 65.45
Applied/modeling Applied/modeling; Symbolic 12.71 6.86
Symbolic Symbolic; Graphical 4.80 1.61
Graphical Symbolic 3.11 6.72
Definition Definition 1.69 1.90
Symbolic Graphical 1.13 2.01
Symbolic; Definition Symbolic 0.56 0.11
Tabular Symbolic 0.56 0.51
Symbolic Applied/modeling; Symbolic 0.28 0
Symbolic; Tabular; Graphical Symbolic 0.28 0
Graphical Graphical 0.28 0.88
Symbolic Symbolic; Tabular; Graphical 0.28 0
Symbolic Symbolic; Definition 0.28 0
130 Int. J. Res. Undergrad. Math. Ed. (2016) 2:105–133
As a result of the low percentage of exam items at the Bunderstand^ or Bapplyunderstanding^ levels of the item orientation taxonomy, we conclude that a largepercentage of exam items failed to provide insight into how students understand theconcepts on which their computational or procedural work is based. Hence, theseresults suggest that a large majority of Calculus I final exams being administered incolleges and universities in the United States promote memorization of procedures foranswering specific problem types and do not encourage students to understand or applyconcepts of elementary calculus.
Our analysis further demonstrates that Calculus I final exams in U.S. colleges anduniversities have changed very little in the past 25 years relative to the percentage ofexam items that require students to apply their understanding of foundational concepts.Since final course exams commonly reflect the level of mastery and understandingstudents have attained at the end of the course, these data suggest that the calculusreform movement of the late 1980s has had little effect on what is being assessed incurrent Calculus I courses in U.S. postsecondary institutions.
We also found that there exist inconsistencies between our characterization of post-secondary Calculus I final exams and instructors’ perception of the nature of the examsthey administer to their students. Instructors’ report that their exams require students todemonstrate and apply understandings. Our analyses revealed that a very high percent-age of exam items focus on skills and methods for carrying out computations, while avery low percentage of items prompt students to explain their thinking.
If exams are predominantly based on measures of low level cognitive behaviors suchas Bremember,^ or Brecall and apply procedure,^ students are likely to developperceptions about mathematics as not being about understanding and applying ideasto solve novel problems. This focus on procedures has been reported to be uninterestingto some more capable students who enjoy understanding and reasoning through non-routine problems (Thompson et al. 2007).
We acknowledge that our discussion of this study’s main findings reveal the highvalue we place on exam items that assess students’ understanding of foundationalcalculus concepts, as well as their ability to apply these understandings to solve novelproblems. While we recognize the essential role of procedural fluency in calculusassessment, our privileging of conceptual exam items derives from our own researchand from our review of the literature on students’ learning of ideas in introductorycalculus (e.g., Carlson and Rasmussen 2008). This research has revealed that Calculus Istudents are generally not developing conceptual understanding of the course’s centralideas, which affects the likelihood that they will succeed in calculus and coursesbeyond calculus. Procedural fluency has its place in calculus assessment but as wehave shown, the relative frequencies of procedural and conceptual exam items has notchanged much in 25 years of calculus reform efforts. We believe that assessmentpractices in introductory calculus should reflect the objectives for students’ learningadvocated in the mathematics education literature as well as those promoted by thecalculus reform movement.
We encourage Calculus I instructors and mathematics departments to contemplatethe role of their Calculus I final exams in developing students’ mathematical abilities,and to consider whether their exams are supporting the development of students’mathematical understandings and thinking. In many cases this might require depart-ments to examine their Calculus I curriculum and instruction. Some might also find it
Int. J. Res. Undergrad. Math. Ed. (2016) 2:105–133 131
useful to consult the mathematics education literature (e.g., Carlson and Rasmussen2008) that discusses what is involved in understanding foundational calculus ideas, andwhat studies have revealed about the process of understanding and learning to use theseideas to solve novel problems. We also encourage the use of our Exam CharacterizationFramework in pre-service teaching programs and graduate teaching assistant work-shops as a didactic tool to assist teachers in constructing assessments that affordstudents the opportunity to demonstrate their understanding.
Acknowledgments This research was supported by National Science Foundation Grant DRL-0910240.Any recommendations or conclusions stated here are those of the authors and do not necessarily reflect officialpositions of the NSF. We thank SIGMAA on RUME for the opportunity to present a previous version of thismanuscript at their 15th annual conference. We also thank Chester Ismay for assisting us in using quantitativedata analysis software.
References
Anderson, L. W., & Krathwohl, D. R. (Eds.). (2001). A taxonomy for learning, teaching, and assessing: Arevision of Bloom’s taxonomy of educational objectives. New York: Longman.
Bergqvist, E. (2007). Types of reasoning required in university exams in mathematics. Journal ofMathematical Behavior, 26, 348–370.
Bloom, B. S., et al. (Eds.). (1956). Taxonomy of educational objectives: Part 1, cognitive domain. New York:Longman Green.
Boesen, J., Lithner, J., & Palm, T. (2006). The relation between test task requirements and the reasoning usedby students. Umeå: Department of Mathematics, Umeå University.
Carlson, M. P., & Rasmussen, C. (Eds.). (2008). Making the connection: Research and teaching in under-graduate mathematics education. Washington: Mathematical Association of America.
Charalambous, C., Delaney, S., Hsu, A., & Mesa, V. (2010). The addition and subtraction of fractions in thetextbooks of three countries: a comparative analysis. Mathematical Thinking and Learning, 12(2), 117–151.
Finney, R. L., Demana, F. D., Waits, B. K., & Kennedy, D. (2007). Calculus: Graphical, numerical, algebraic(3rd ed.). Boston: Pearson Prentice Hall.
Ganter, S. L. (Ed.). (2001). Changing calculus:A report on evaluation efforts and national impact from 1988–1998. Washington DC: Mathematical Association of America.
Gierl, M. J. (1997). Comparing cognitive representations of test developers and students on a mathematics testwith Bloom’s taxonomy. The Journal of Educational Research, 91(1), 26–32.
Krathwohl, D. R. (2002). A revision of Bloom’s taxonomy: an overview. Theory Into Practice, 41(4), 212–218.
Li, Y. (2000). A comparison of problems that follow selected content presentations in American and Chinesemathematics textbooks. Journal for Research in Mathematics Education, 31(2), 234–241.
Lithner, J. (2000). Mathematical reasoning in task solving. Educational Studies in Mathematics, 41(2), 165–190.
Lithner, J. (2003). Students’ mathematical reasoning in university textbook exercises. Educational Studies inMathematics, 52(1), 29–55.
Lithner, J. (2004). Mathematical reasoning in calculus textbook exercises. The Journal of MathematicalBehavior, 23, 405–427.
Mesa, V. (2010). Strategies for controlling the work in mathematics textbooks for introductory calculus. In F.Hitt, D. Holton & P. W. Thompson (Eds.), CBMS Issues in Mathematics Education (Vol. 16, pp. 235–261). Providence, RI: AMS.
Mesa, V., Suh, H., Blake, T., & Whittemore, T. (2012). Examples in college algebra textbooks: opportunitiesfor students’ learning. Problems, Resources, and Issues in Mathematics Undergraduate Studies, 23(1),76–105.
Palm, T., Boesen, J., & Lithner, J. (2006). The requirements of mathematical reasoning in upper secondarylevel assessments. Umeå: Departmetn of Mathematics, Umeå University.
132 Int. J. Res. Undergrad. Math. Ed. (2016) 2:105–133
Piaget, J. (1968). Six psychological studies. New York: Vintage Books.Senk, S. L., Beckman, C. E., & Thompson, D. R. (1997). Assessment and grading in high school mathematics
classrooms. Journal for Research in Mathematics Education, 28(2), 187–215.Smith, G., Wood, L., Coupland, M., Stephenson, B., Crawford, K., & Ball, G. (1996). Constructing
mathematical examinations to assess a range of knowledge and skills. International Journal ofMathematics Education in Science and Technology, 27(1), 65–77.
Steen, L. (Ed.). (1988). Calculus for a new century: A pump, not a filter. Washington: The MathematicalAssociation of America.
Thompson, P. W. (2011). Quantitative reasoning and mathematical modeling. In S. Chamberlin, L. L. Hatfield,& S. Belbase (Eds.), New perspectives and directions for collaborative research in mathematics educa-tion: Papers from a planning conference for WISDOMê. Laramie: University of Wyoming.
Thompson, P. W. (2013). In the absence of meaning. In K. Leatham (Ed.), Vital directions for research inmathematics education (pp. 57–93). New York: Springer.
Thompson, P. W., Castillo-Chavez, C., Culbertson, R. J., Flores, A., Greely, R., Haag, S., et al. (2007). Failingthe future: Problems of persistence and retention in science, technology, engineering, and mathematicsmajors at Arizona State University. Tempe: Office of the Provost.
Int. J. Res. Undergrad. Math. Ed. (2016) 2:105–133 133