a chemical marker (m-2) based computer vision method to locate
TRANSCRIPT

A CHEMICAL MARKER (M-2) BASED COMPUTER VISION METHOD TO
LOCATE THE COLD SPOT IN MICROWAVE STERILIZATION PROCESS
By
RAM BHUWAN PANDIT
A dissertation submitted in partial fulfillment of the requirement for the degree of
DOCTOR OF PHILOSOPHY
WASHINGTON STATE UNIVERSITY Program in Engineering Science
December 2006
© Copyright by Ram Bhuwan Pandit, 2006 All Rights Reserved

To the Faculty of Washington State University:
The members of the committee appointed to examine the dissertation of RAM BHUWAN PANDIT find it satisfactory and recommended that it be accepted.
Chair
ii

ACKNOWLEDGEMENT
I would like to acknowledge the academic, financial, and emotional support
provided by my advisor, Dr. Juming Tang. Without his invaluable guidance, motivation
and encouragement, I would never have been able to explore my research work in the
field of microwave sterilization. My heartiest gratitude goes to my graduate committee
members Dr. Barry G. Swanson, Dr. Marvin Pitts and Dr. Barbara Rasco, for their
guidance and motivation. A special thank goes to Dr. Frank Liu for his many advice
during my research work.
I would also like to thank those with whom I shared research time in this
multidisciplinary research work, mainly Ms. Galina Mikhaylenko, Mr. Frank Younce and
Dr. Hyun-Jung Chung. I would like to thank fellow graduate student Hao Chen, Sohan
Birla, Jian Wang, Ali Al-Shami, and Yu Wang for their support and assistance. I am very
thankful to Mr. Waynee Dewitt and Mr. Vincent Himsl for their technical assistance.
This project was financially supported by the US Army Soldier Center, Natick,
Massachusetts with additional support from Kraft Foods, Glenview, Illinois, and from
Washington State University Agricultural Research Center. I also thank the contribution
from other industrial partners, government and institutions. My sincere thanks go to the
Department of Biological Systems Engineering staff and faculty.
Last but not least, I would like to thank the support from my family especially my
father, Shri Satya Narayan Pandit, my mother, Shrimati Laxmi Devi and my brother and

sisters. Without their encouragement, support and sacrifice I would not have completed
my study.
iv
A CHEMICAL MARKER (M-2) BASED COMPUTER VISION METHOD TO
LOCATE THE COLD SPOT IN MICROWAVE STERILIZATION PROCESS
ABSTRACT
by Ram Bhuwan Pandit, PhD WASHINGTON STATE UNIVERSITY
December 2006
Chair: Juming Tang
The single-mode 915 MHz microwave sterilization system developed at
Washington State University, Pullman has the capability to produce high quality shelf
stable foods. In order for this technology to receive FDA approval there is a need for a
rapid and reliable method to determine the location of cold spots in food products of
different chemical composition, and size. My dissertation overcomes the limitations of
the single point temperature sensor with a special focus on the development of a novel
approach for determining heating patterns using chemical marker M-2 based computer
vision method.
Kinetic of chemical marker M-2 formation in mashed potato has been studied to
develop a method to locate the cold spots in microwave sterilization processes. Formation
of chemical marker M-2 with 1.5% D-ribose was found to be suitable over the time-
temperature range of the microwave sterilization process. Factors for chemical marker
formation and kinetic parameters, including the order of reaction, reaction rate constant
and energy of activation, were determined in this study. The results demonstrated that
formation of chemical marker M-2 in mashed potato is a first order reaction.
A computer vision method based on the yield of chemical marker M-2 was
developed to determine the heating patterns in a model food, mashed potato. Through
interactive programming an IMAQ Vision Builder script was designed to locate the cold
spot in foods during thermal processing. Sensitivities to the heating patterns were tested
at different levels of salt and for different tray sizes. Results indicated that salt
significantly influenced the dielectric loss but microwave heating patterns were
repeatable for model foods. The location of the cold spot predicted by the model was
validated using fiber optic temperature probes and microbial inoculation studies.
The developed method here was further improved to facilitate the comparison of
the heating patterns for multiple trays. To do this, a new visual scale which adjusted the
brightness of the scale for samples was developed. A new image system independent of
the lighting position was designed as part of this study. Relationships among computer
vision parameters, color value, thermal lethality (Fo), and M-2 yield for mashed potatoes
were established for two different pathes of heating. Validation tests confirmed that the
method based on chemical marker M-2 yield can accurately determine the cold spot
location in pre-package model food processed by microwave.
To evaluate this method in a food product, salmon in Alfredo was used to
determine the efficacy of this computer vision method. For these studies, a different
model food based upon whey protein gels were used to simulate the heating patterns in
salmon with Alfredo sauce. The dielectric properties of the whey protein gel were
matched as closely as possible to the target food with addition of 0.3% salt. To predict the
heating patterns in salmon with Alfredo sauce, relationship among color value in terms of
grayscale value, thermal lethality to C. botulinum ( Fo), and M-2 yield were studied with
vi

whey protein gels. Matching the time-temperature profile between whey protein gel and
salmon during microwave sterilization process confirmed that whey protein gel can be
used to emulate the heating patterns in real foods. The microbiological study was
conducted in 10 oz polymeric trays to validate the cold spot location in auto processed
salmon with Alfredo sauce. Results showed that whey protein gels in combination with a
computer vision method can predict the cold spot in real food system.
The developed computer vision method in this study is effective in locating the
cold spots in model and real food systems. Because microwave sterilization process is a
promising alternative to conventional retorting methods for producing high quality shelf
stable foods, methods are needed to ensure that these foods can be made safely and that
processes can be reliably validated. The developed method and protocol can be used to
prepare documentation for FDA approval.
vii

TABLE OF CONTENTS
ACKNOWLEDGEMENT ................................................................................................. iii
ABSTRACT........................................................................................................................ v
TABLE OF CONTENTS................................................................................................. viii
LIST OF TABLES............................................................................................................ xv
LIST OF FIGURES ........................................................................................................ xvii
CHAPTER 1. A COMPUTER VISION METHOD TO DETERMINE COLD SPOT
LOCATION IN FOODS STERILIZED IN 915 MHZ MICROWAVE STERILIZATION
SYSTEM
1. Introduction..................................................................................................................... 3
2. Concept of microwave sterilization ................................................................................ 5
3. Chemical marker (M-2) yield as indirect means to evaluate sterilization process ......... 8
4. Computer vision method to determine cold spot location ............................................ 10
5. Major studies in order to develop a novel method……………………………………14
References......................................................................................................................... 15
CHAPTER 2. KINETICS OF CHEMICAL MARKER M-2 FORMATION IN MASHED
POTATO-A TOOL TO LOCATE COLD SPOTS DURING MICROWAVE
STERILIZATION
Abstract ............................................................................................................................. 21
1. Introduction................................................................................................................... 22
2. Materials and methods .................................................................................................. 24
2.1. M-2 yield determination......................................................................................... 25

2.2. Limiting factors M-2 formation ............................................................................. 28
2.3. Statistical Analysis ................................................................................................. 29
2.4. Effect of salt content and additional L-lysine on M-2 yield................................... 34
3. Results and discussion .................................................................................................. 35
3.1. Estimated chemical reaction parameters............................................................... 36
3.2. Estimation of limiting factor .................................................................................. 39
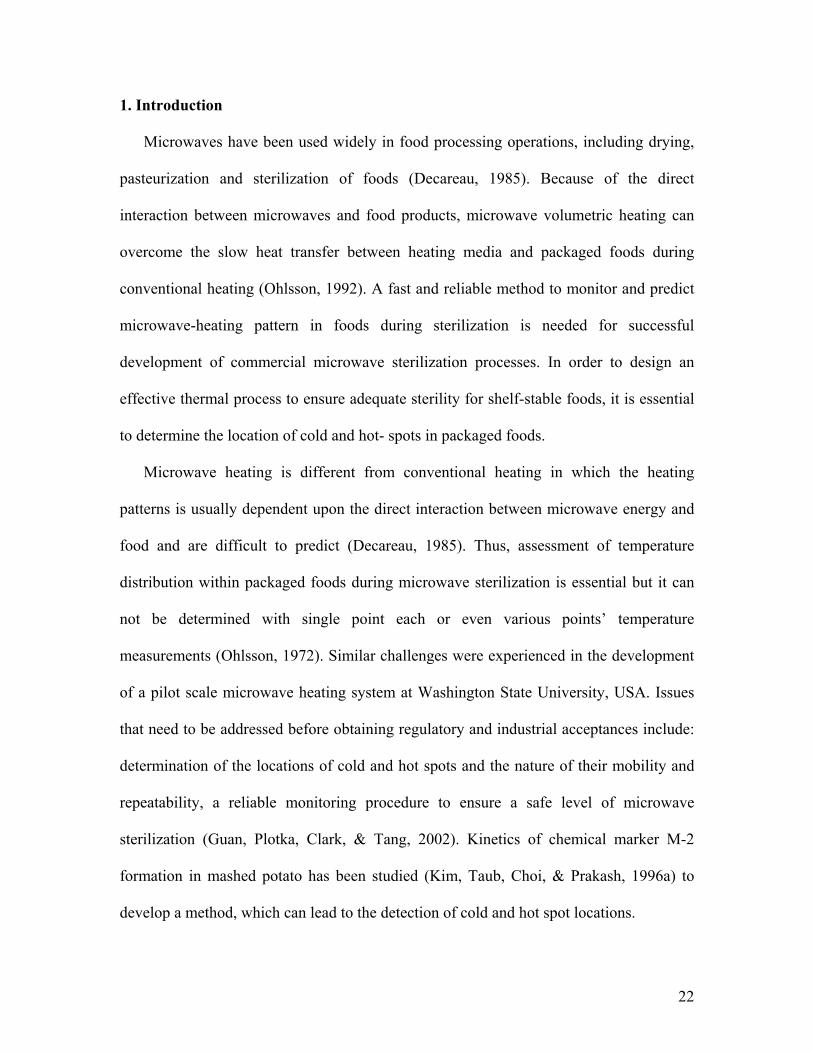
3.3. Estimation of effect of additional Lysine ............................................................... 40
3.4. Variability among different mashed potato sources .............................................. 41
3.5. Effect of salt on marker yield ................................................................................. 42
4. Conclusion .................................................................................................................... 42
Acknowledgements........................................................................................................... 43
Nomenclature.................................................................................................................... 43
References......................................................................................................................... 44
CHAPTER 3. DEVELOPMENT OF A NOVEL APPROACH TO DETERMINE
HEATING PATTERN USING COMPUTER VISION AND CHEMICAL MARKER
(M-2) YIELD
Abstract ............................................................................................................................. 47
1. Introduction................................................................................................................... 48
2. Materials and methods .................................................................................................. 50
2.1. M-2 marker yield as a coloring agent.................................................................... 50
2.2. Microwave as a source of energy .......................................................................... 52
2.3. Image processing system configuration................................................................. 53
ix

2.4. IMAQ vision builder to locate cold and hot spots ................................................. 54
3. Results and discussion .................................................................................................. 57
4. Validation of locations specified by computer vision................................................... 60
5. Conclusions................................................................................................................... 62
Acknowledgements........................................................................................................... 62
Nomenclature.................................................................................................................... 63
References......................................................................................................................... 63
CHAPTER 4. SENSITIVITY ANALYSIS AND VALIDATION OF COMPUTER
VISION HEATING PATTERNS FOR MICROWAVE STERILIZATION PROCESSES
Abstract ............................................................................................................................. 66
1. Introduction................................................................................................................... 67
2. Materials and methods .................................................................................................. 69
2.1. Effect of salt content on chemical marker M-2 yield ............................................. 69
2.2. Dielectric properties measurement........................................................................ 70
2.3. Microwave sterilization of mashed potato samples ............................................... 70
2.4. Computer vision heating patterns based on chemical marker (M-2) yield ........... 71
2.5. FDTD simulation using QW-3D ............................................................................ 74
2.6. Microbial validation .............................................................................................. 74
3. Results and discussion .................................................................................................. 75
3.1. Dielectric properties modeling .............................................................................. 75
3.2. Cold spots location in each size of tray ................................................................. 78
3.3. Effect of tray size and system configuration on heating patterns .......................... 80
x
3.4. Heating patterns validation ................................................................................... 81
3.5. Results of microbial validation .............................................................................. 82
4. Conclusions................................................................................................................... 84
Acknowledgements........................................................................................................... 85
Nomenclature.................................................................................................................... 86
References......................................................................................................................... 86
CHAPTER 5. DEVELOPING A COMPUTER VISION METHOD BASED ON
CHEMICAL MARKER M-2 YIELD TO LOCATE COLD-SPOT IN MICROWAVE
STERILIZATION PROCESSES
Abstract ............................................................................................................................. 91
1. Introduction................................................................................................................... 92
2. Materials and Methods.................................................................................................. 94
2.1. Sample Preparation ............................................................................................... 94
2.2. Color palette and development of a new scale ...................................................... 94
2.3. Computer vision system ......................................................................................... 96
2.4. Effect of lights positions on diffuser box................................................................ 97
2.5. Color value, M-2 yield and Fo relationship ........................................................... 98
2.5.1. Sample preparation and HPLC analysis ......................................................... 98
2.5.2. Image Acquisition and Image editing using Adobe Photoshop.................... 100
2.5.3. Functions in computer vision script.............................................................. 100
2.6. Computer vision heating patterns for food samples using IMAQ Vision Builder 106
3. Results and Discussion ............................................................................................... 106
xi

3.1. Computer vision color patterns ........................................................................... 106
3.2. Color value equivalent to gray-level value and M-2 yield .................................. 108
3.3. Color value equivalent to gray-level value and Fo ............................................. 109
4. Validation of locations specified by computer vision................................................. 111
5. Conclusions................................................................................................................. 114
Acknowledgments........................................................................................................... 115
Nomenclature.................................................................................................................. 116
References....................................................................................................................... 118
CHAPTER 6. PRINCIPLE AND APPLICATION OF CHEMICAL MARKER (M-2)
BASED COMPUTER VISION METHOD TO LOCATE THE COLD SPOTS IN REAL
FOOD SYSTEMS
Abstract ........................................................................................................................... 122
1. Introduction................................................................................................................. 123
2. Principle and application of chemical marker (M-2) to determine the heating patterns
......................................................................................................................................... 126
3. Materials and methods ................................................................................................ 131
3.1. Selection of the model food system ...................................................................... 131
3.2. Dielectric properties measurement...................................................................... 132
3.3. Sample preparation.............................................................................................. 132
3.4. Kinetics of chemical marker (M-2) formation with whey protein gel................ 133
3.5. Computer vision method to specify cold spot ...................................................... 135
3.6. Time-temperature profiles during microwave sterilization ................................. 136
xii

4. Results and discussion ................................................................................................ 137
4.1. Dielectric properties matching ............................................................................ 137
4.2. Relationship among color value, M-2 yield and Fo ............................................. 139
4.3. Locations identified for comparisons................................................................... 142
4.4. Validation and matching of time-temperature profiles........................................ 144
5. Conclusions................................................................................................................. 147
Acknowledgments........................................................................................................... 148
Nomenclature.................................................................................................................. 148
References....................................................................................................................... 149
CHAPTER 7. A COMPUTER VISION METHOD TO LOCATE THE COLD SPOTS IN
AN ENTRÉE: SALMON WITH ALFREDO SAUCE, DURING A MICROWAVE
STERILIZATION PROCESS
Abstract ........................................................................................................................... 153
1. Introduction................................................................................................................. 154
2. Materials and methods ................................................................................................ 156
2.1. Selection of the model food system ...................................................................... 156
2.2. Sample preparation for heating pattern analysis ................................................ 157
2.3. Chemical marker formation versus bacterial inactivation kinetics ................ 157
2.4 Computer vision heating patterns ......................................................................... 161
2.4.1. Color palette and development of a new scale.............................................. 161
2.4.2. Image Acquisition and Image editing using Adobe Photoshop.................... 162
2.4.3. Functions in computer vision script.............................................................. 162
xiii

2.4.4. Heating patterns analysis with whey protein sample.................................... 167
3. Validation of Computer Vision Heating Patterns ....................................................... 168
3.1. Validation of the cold spot using microwave system ...................................... 168
3.2. Validation of the cold spot using inoculated pack studies .............................. 168
4. Results and Discussion ............................................................................................... 169
5. Conclusions................................................................................................................. 174
Acknowledgements......................................................................................................... 174
Nomenclature.................................................................................................................. 175
References....................................................................................................................... 175
CONCLUSIONS AND RECOMMENDATIONS
xiv

LIST OF TABLES CHAPTER 2 Table 1. Estimated order of reaction (n), marker yield at saturation (C∞) values by non-
linear regression based on two replicates of experimental data........................................ 36
Table 2. Estimation of the order of chemical marker (M-2) formation by examining r2
from plot of zero, half and second order reactions based on two replicates of experimental
data.................................................................................................................................... 37
Table 3. Rate constant (min-1), and activation energy, Ea (kcal/mol), for M-2 formation in
mashed potato at four temperatures levels based on two replicates of experimental data.
........................................................................................................................................... 38
CHAPTER 4 Table 1. Mean ± standard deviation (Two replicates) of dielectric constant, dielectric loss
and penetration depth with mashed potato (83.12 wb) at different levels of salt (maximum
1 %) and 1.5 % D-ribose as a function of temperature at 915 MHz................................. 76
Table 2. Positive growth of spores was shouted in microbial validation at cold spot
location identified by computer vision method in case of under process sample during
microwave sterilization..................................................................................................... 84
CHAPTER 5 Table 1. Color values equivalent to gray-scale values and chemical marker M-2 yield for
two different heating conditions, each point represents mean of two replicates. ........... 110
CHAPTER 6
Table 1. Comparison of the kinetic parameters of marker formation and bacterial
inactivation. Parameters were calculated from kinetics data available in Pandit et. al.,
2006................................................................................................................................. 139
Table 2. Three spots based upon color values were specified in the slab shaped whey
protein gel (12 × 8 × 1.4 cm) for comparisons. .............................................................. 143
Table 3. Comparisons of the microwave heating parameters for cold, warm and hot spots
locations in salmon and whey protein gel processed with Alfredo sauce, data points are
based on two replicates (mean ± SD). ............................................................................ 147
CHAPTER 7
Table 1. Comparison of the kinetic parameters of marker formation and bacterial
inactivation. Parameters were calculated from kinetics data available in Pandit et. al.,
2006................................................................................................................................. 158
Table 2.Three spots based upon color values were specified in the slab shaped whey
protein gel (12 × 8 × 1.4 cm) for comparisons. .............................................................. 172
Table 3. Results of the microbiological validation studies using inoculated packs (PA
3679 spores) of salmon in Alfredo sauce to validate the identified cold spot using
computer vision method.................................................................................................. 173
xvi
LIST OF FIGURES
CHAPTER 1 Fig. 1. Reaction pathways leading to the chemical marker formation................................ 9
Fig. 2. Principle of computer vision system ................................................................... 11
CHAPTER 2 Fig. 1. Formation of chemical compound 4-hydroxy-5-methyl- 3(2H)-furanone (M-2) in
presence of D-ribose with mashed potato......................................................................... 25
Fig. 2. Calibration curve of chemical marker M-2 (4-hydroxy-5-methyl-3(2H)-furanone)
in 10mM sulfuric-5mM citric acid buffer. ........................................................................ 27
Fig. 3. Chemical marker yield (M-2) for different temperature levels obtained during
experimental work, scattered data represent means of two replicates. ............................. 35
Fig. 4. Chemical marker (M-2) yield with different percentage of D- ribose at 121 o C,
each point represent mean of two replicates. .................................................................... 39
Fig. 5. Effect of additional L-lysine on marker yield in plain mashed potato at 121 o C,. 41
Fig. 6. Chemical marker (M-2) yield for various sources of mashed potato at 121 oC, each
point represents the mean of two replicates...................................................................... 41
Fig. 7. Effect of salt content on chemical marker (M-2) yield at 121 oC, each level has
two replicates. ................................................................................................................... 42
CHAPTER 3 Fig. 1. Components of a computer vision system............................................................ 54
Fig. 2. Major steps involved in heating pattern analysis using computer vision. ............. 57
Fig. 3. Relationships between M-2 yield and Fo accumulation in mashed potato during
microwave sterilization, each point represents the mean of two replicates. ..................... 58

Fig. 4. Relationships between color values obtained by IMAQ vision builder and Fo for
processed sample, each point represents the mean of two replicates. .............................. 59
Fig. 5. Comparison of heating patterns of 10 oz trays with three levels of salt content after
microwave sterilization, tested in replicates. .................................................................... 59
Fig. 6. Heating profile of hot and cold spots locations in 10 oz trays during microwave
sterilization at 2.67 kW, tested in two replicates .............................................................. 60
Fig. 7. Comparison of computer vision heating patterns and actual temperature mapping
for 10 oz trays. .................................................................................................................. 61
CHAPTER 4 Fig. 1. Penetration depth versus temperature of mashed potato for different levels of salt,
each data point represents the mean of two replicates. ..................................................... 76
Fig. 2. Computer vision heating patterns of middle layers for three different levels of salt
with 14 × 9.5 × 4.2 cm tray at 2.67 kW microwave power level, tested in two replicates.
........................................................................................................................................... 79
Fig. 3. Computer vision heating patterns of middle layers with two different levels of
salt with 19.5 × 14.4 × 3.2 cm tray at 2.67 kW microwave power level, tested in two
replicates. .......................................................................................................................... 79
Fig. 4. Temperature measured by fiber optics probes at cold spot x =12 cm, y = 12 cm
and hot spot x = 11 cm, y = 1.35 cm in 20 oz tray specified by computer vision method in
the middle of trays during microwave sterilization, tested in two replicates................... 80
Fig. 5. Matching of computer vision heating patterns and QW-3D power absorption
patterns for middle layer of 14 × 9.5 × 3.3 cm tray inside the zero degree phase shift
cavity in stationary state.................................................................................................... 81
xviii

Fig. 6. Matching of computer vision heating patterns and QW-3D power absorption
patterns for middle layer of 14 × 9.5 × 3.3 tray inside the 180 degree phase shift cavity in
stationary state. ................................................................................................................. 82
Fig. 7. A cold spot location identified by computer vision was observed as cold spot in
microbial validation study ( ). ....................................................................................... 83
CHAPTER 5 Fig. 1. Concept of converting the gray-level values to color values using rainbow color
palette of IMAQ vision builder program and a method to fix the scale using mashed
potato sample processed at different Fo. ........................................................................... 96
Fig. 2. Computer vision system designed in this study..................................................... 97
Fig. 3. Functions of the developed IMAQ Vision Builder script for heating pattern analysis............................................................................................................................ 101 Fig. 4. Computer vision patterns for the mashed potato samples heated to a set
temperature (T) or held to 121 oC for different Fo, results were tested in two replicates.
......................................................................................................................................... 107
Fig. 5. Comparison of computer vision color patterns with mashed potato samples heated
to different temperature levels for three positions (bottom, middle and top) of lights.
Number denotes the set temperature to which sample was heated. ................................ 108
Fig. 6. M-2 yield and Fo correlation with mashed potato samples heated to different set
temperature (ramp up) levels or held at 121 oC for different Fo, data points are based on
two replicates. ................................................................................................................. 110
Fig. 7. Color value and M-2 yield relationship with mashed potato samples heated to
different set temperatures (ramp up) levels or held at 121 oC for different Fo, data points
are based on two replicates. ............................................................................................ 111
xix

Fig. 8. Color value and Fo relationship with mashed potato samples heated to different set
temperatures (ramp up) levels or held at 121 oC for different Fo, data points are based on
two replicates. ................................................................................................................. 112
Fig. 9. Validation of cold and hot spots locations specified by computer vision method in
10 oz trays during microwave sterilization at 2.67 kW power level, typical temperature
profile from repeated tests in the middle layer of the tray.............................................. 113
Fig. 10. Matching of the experimental and developed method heating patterns for the
middle layer of a 10 oz tray with mashed potato processed at 2.67 kW microwave power
level................................................................................................................................. 114
CHAPTER 6 Fig. 1. Comparison of measured and predicted chemical marker yield based upon the
kinetics parameters.......................................................................................................... 127
Fig. 2 . A scheme to convert the grayscale image into pseudo color image (IMAQ Vision
Builder, 2000). ................................................................................................................ 130
Fig. 3. Diagram of the aluminum cell used to collect the kinetic data with whey protein
gel.................................................................................................................................... 134
Fig. 4. Matching of the dielectric loss of salmon fillet and whey protein gel formulation
by adding 0.3 % salt........................................................................................................ 138
Fig. 5. Matching of the dielectric constant of salmon fillet and whey protein gel
formulation by adding 0.3 % salt. ................................................................................... 138
Fig. 6. M-2 yield and Fo relationship for whey protein samples heated to different set
temperatures (ramp up) levels or held at 121 oC, data points are based on two replicates.
......................................................................................................................................... 140
xx

Fig. 7. Comparisons of cook values during holding and ramp up heating at same
cumulative lethality (Fo = 9 min) .................................................................................... 140
Fig. 8. Computer vision color patterns of the whey protein gel samples processed at
different temperature level and Fo in oil bath. Experiments were tested in replicates.... 141
Fig. 9. Color value and Fo relationship for whey protein samples heated to different set
temperatures (ramp up) levels or held at 121 oC, data points are based on two replicates.
......................................................................................................................................... 142
Fig. 10. Color value and M-2 yield relationship for whey protein samples heated to
different set temperatures (ramp up) levels or held at 121 oC, data points are based on two
replicates. ........................................................................................................................ 143
Fig. 11. Locations of fiber optics probe inserted in salmon fillet and whey protein gel to
compare the time-temperature profile during microwave sterilization process.............. 144
Fig. 12. Time-Temperature profiles for three specified points located in whey protein
slab showing the repeatability of the experimental runs................................................. 145
Fig. 13. Comparisons of the time-temperature profiles (S = salmon, & W = whey) at three
specified locations in whey protein gel and salmon with Alfredo sauce during microwave
sterilization...................................................................................................................... 146
CHAPTER 7
Fig. 1. Major steps involved in computer vision study to determine the location of cold
spots in microwave sterilization process......................................................................... 160
Fig. 2. Images of top, middle, and bottom layers along with the scale sample inserted in
one picture package of Adobe Photoshop before analyzing the heating patterns........... 163
xxi

Fig. 3. Flow chart of major steps developed in computer vision method to determine the
cold spot location. ........................................................................................................... 164
Fig. 4. Computer vision color patterns of the whey protein gel samples processed at
different temperature level and Fo in oil bath. Experiments were tested in replicates.... 170
Fig. 5. Comparison of computer vision heating patterns for top, middle and bottom layers
to find the coldest layer. Cold spot was identified in middle layer. (a) MW processed
trays (b) Computer vision heating patterns. .................................................................... 171
Fig. 6. Heating patterns in middle layers of the five microwave sterilized trays, number
indicate the color values at those locations, (a) Original rectangular shaped whey protein
sample. (b) Computer vision heating pattern.................................................................. 172
Fig. 7. Time-temperature history at three different locations of color values 2.05, 8.55 and
12.86 specified by computer vision method in 7 oz trays during microwave sterilization
of salmon with sauce at 2.67 kW power level, typical temperature profile from repeated
tests. ................................................................................................................................ 173
xxii
DISSERTATION OUTLINE
This dissertation is organized into seven chapters. The first chapter reviews the
development made in computer vision field and their application in fields of food process
engineering. Chapter 2 presents the kinetic study of chemical marker M-2 formation in
mashed potato. Identification of the limiting factors for chemical marker formation and a
prediction of kinetic parameters including, order of reaction, reaction rate constant and
energy of activation, were determined in this study. Chapter 3 explores identification and
development of a novel approach to determine the heating patterns in microwave
sterilization processes. In Chapter 4 sensitivities of the computer vision heating patterns
were tested with different levels of salt contents and tray sizes. In Chapter 5 upgrading of
the developed computer vision method was done by inserting the mashed potato scale
samples to facilitate the comparison of the heating patterns for multiple trays in repeated
experiments. Chapter 6 investigates the principle and application of the chemical marker
M-2 based computer vision method to emulate the heating patterns in real food systems.
Chapter 7 provides a protocol to identify and validate the location of cold spot in real
foods. A brief conclusion from each chapter along with future recommendation is
provided in the last section of this dissertation.
A list of the published chapters and chapters accepted for publication as of
Nov.15, 2006.
Chapter 2 Pandit, R. B., Tang, J*., Liu F., & Pitts, M. (2007) Development of a novel approach to
determine heating pattern using computer vision and chemical marker (M-2) yield.
Journal of Food Engineering, 78(2):522-528.

Chapter 3 Pandit, R. B., Tang, J*., Mikhaylenko, G., & Liu F. (2006). Kinetics of chemical marker
M-2 formation in mashed potato-a tool to locate cold spots under microwave sterilization.
Journal of Food Engineering. 76(3): 353-361.
Chapter 4 R. B. Pandit, J. Tang*, H. Chen, H-C, Jung, F. Liu. Sensitivity analysis and validation of
computer vision heating patterns for microwave sterilization processes. Presented in
ASABE Annual International Meeting, July 17-20, Tampa, Florida, USA. Paper Number:
056145.
Chapter 5 Ram Bhuwan Pandit, Juming Tang*, Frank Liu, and Galina Mikhaylenko. Developing a
computer vision method based on chemical marker M-2 yield to locate cold-spot in
microwave sterilization processes. In review for publication in Pattern recognition.
Chapter 6 Ram Bhuwan Pandit, Juming Tang*, Frank Liu, and Zhongwei Tang. Principle and
application of chemical marker (m-2) based computer vision method to locate the cold
spots in real food systems. Accepted for Presentation in ASABE Annual International
meeting, June, 17-20-2007 Minneapolis, MN, USA. Paper ID: 1929.
Chapter 7 Ram Bhuwan Pandit, Juming Tang*, Frank Liu, Galina Mikhaylenko and Huan-Chung,
Jung. (2006). A computer vision method to locate the cold spots in fish with sauce for
microwave sterilization process. Published in International Microwave Power Institute
40th Annual Symposium Proceedings.
2

CHAPTER 1
A COMPUTER VISION METHOD TO DETERMINE COLD SPOT LOCATION IN
FOODS STERILIZED IN 915 MHZ MICROWAVE STERILIZATION SYSTEM
1. Introduction
Microwave sterilization method developed in our laboratory is a thermal method
that has promise to produce high quality and shelf stable foods. Sterilization of foods in
915 MHz microwave system reduces process time and improve product quality (Pathak,
Liu, & Tang, 2003; Guan, Plotka, Clark, & Tang, 2002; Guan et al., 2003). The
sterilization process involves a physical phenomenon dependent on the dielectric
properties of foods and configuration of microwave cavities. Contrary to conventional
heating methods, microwave heating provides much faster rate of heating. The cold or
hot spots locations depend on product geometry (Campañone, & Zaritky, 2005; Yang, &
Gunasekaran, 2004). Cold spots are regions in foods which receives the least thermal
energy during sterilization processes. In order to develop an advanced thermal process, it
is necessary to determine the cold spots in food to ensure commercial sterilization. To
meet the stringent requirement of food regulatory bodies we decided to measure the time-
temperature history of the determined cold spot when developing the microwave
sterilization processes.
Determination of cold spot locations in foods during microwave sterilization is a
major challenge for researchers in developing processes to ensure that the

processed foods are safe to consumers. Computer simulation models can help in
understanding the sterilization process (Pathak, Liu, & Tang, 2003; Zhang, & Datta,
2000). But simulation models, requires validation and may not always be reliable due to
complexity of the coupling of heat transfer and dielectric heating in complex microwave
sterilization cavities (Ayappa, Davis, Davis, & Gordon, 1991; Pandit, & Prasad, 2003;
Romano, Marra, & Tammaro, 2005). For any geometrically complex system used to
produce safe foods for consumers, an approach of double validation for process
development was emphasized by US food regulatory organizations (Food and Drug
Administration, 2005).
Multi-point online monitoring of time temperature profile in industrial scale
microwave sterilization system is impractical. Metallic thermocouples can not be placed
in a microwave field while fiber optics probes are expensive and inconvenient to monitor
multiple points in a tray. It was impractical to identify the cold spots in packaged foods
during microwave sterilization processes by point temperature measurement methods. In
order to meet the stringent requirements of food regulation bodies for sterilization
processes of food products much effort in both industry and academic communities, has
been made for designing a method to determine the location of cold and hot spots
(Oliveira, & Franca, 2002; Fernandez, Castillero, & Aguilera, 2005, Ghani et al., 2002;
Sale, 1976). Chemical marker methods were studied as indirect means to evaluate relative
heating absorptions in selected food systems (Lau, et al., 2003; Wang, Wig, Tang, &
Hallber, 2003; Pandit et al, 2006). Quantification of chemical marker M-1 and M-2
formed through Maillard reaction between amino acids and reducing sugar such as ribose
and glucose required intensive laboratory analyses using High Performance Liquid
4

Chromatography (HPLC). For example, to analyze a 3-D heating pattern in processed
mashed potato containing ribose in 10 oz trays with HPLC, two persons were needed for
2.5 days to quantify M-2 yield at 40 evenly distributed points in one tray. In process
development, repeated tests were necessary with multiple trays. Analyzing M-2 yield in
those many trays using HPLC became impractical.
It was, therefore, desirable to develop a rapid and reliable method to determine
the cold spots locations in sterilized foods. To meet this goal, the major area of emphasis
for this research program was to develop a novel computer vision method based on the
yield of chemical marker (M-2) to determine the cold spot location in microwave
sterilization process. In this chapter, introductory information is provided about concept
of microwave sterilization, formation of chemical marker (M-2), and principle of
computer vision. In the preceding chapters, kinetics of chemical marker M-2 formation
and other studies need to develop a novel method will be discussed.
2. Concept of microwave sterilization
Microwave occupies the portion of the electromagnetic spectrum between 300
MHz and 30 GHz. Focusing or internal concentration is one of the most significant
features of microwave sterilization as compared with conventional heating. The electrical
properties of materials known as dielectric properties are of critical importance in
understanding the interaction between microwave electromagnetic energy and foods. The
dielectric properties of a material are described by the complex relative permittivity ( ε*
relative to that of free space) in the following relationship (Tang, 2005):
ε* = ε' – j ε" (1)
5

The real part ε' is the dielectric constant that reflects the ability of the material to
store energy in an electromagnetic field; the imaginary part ε" is the dielectric loss factor
that influences the conversion of electromagnetic energy into thermal energy. The
amount of thermal energy converted in food is proportional to the value of the loss factor
( ε"). The power absorbed per unit volume, Q ( W/m3) in the dielectric can be calculated
from (Tang, 2005):
Q = 5.56 × 10 -11 f E2 ε" (2)
where E (V/m-1 ) is electric field intensity, f ( Hz) is frequency .These properties along
with thermal and other physical properties (specific heat, thermal conductivity), and the
characteristic of the microwave electromagnetic fields determine the absorption of
microwave energy and consequent heating behavior of food materials in microwave
sterilization. Heat conduction inside the parallelepiped shaped foods trays during
microwave sterilization in rectangular co-ordinate system can be given as:
φρ +∂∂
∂∂
+∂∂
∂∂
+∂∂
∂∂
=∂∂ )()()(
zTk
zyTk
txTk
xtTC zzyyxxp (3)
. In Equation (1) ρ is density (kg/m3), is specific heat (kJ/kg pC oC) and k is thermal
conductivity of foods. In case of homogeneous isotropic foods kxx = kyy = kzz = k
Microwave power source term (φ , w/m3) gives the microwave power absorbed density at
any location of the foods. When electric field passes through the dielectric medium it
attenuates exponentially in the direction of propagation. The attenuation of power at
distance x from the surface of incidence can be estimated using Lambert’s law as:
φ x = φ o exp (- 2 α x) (4)
6
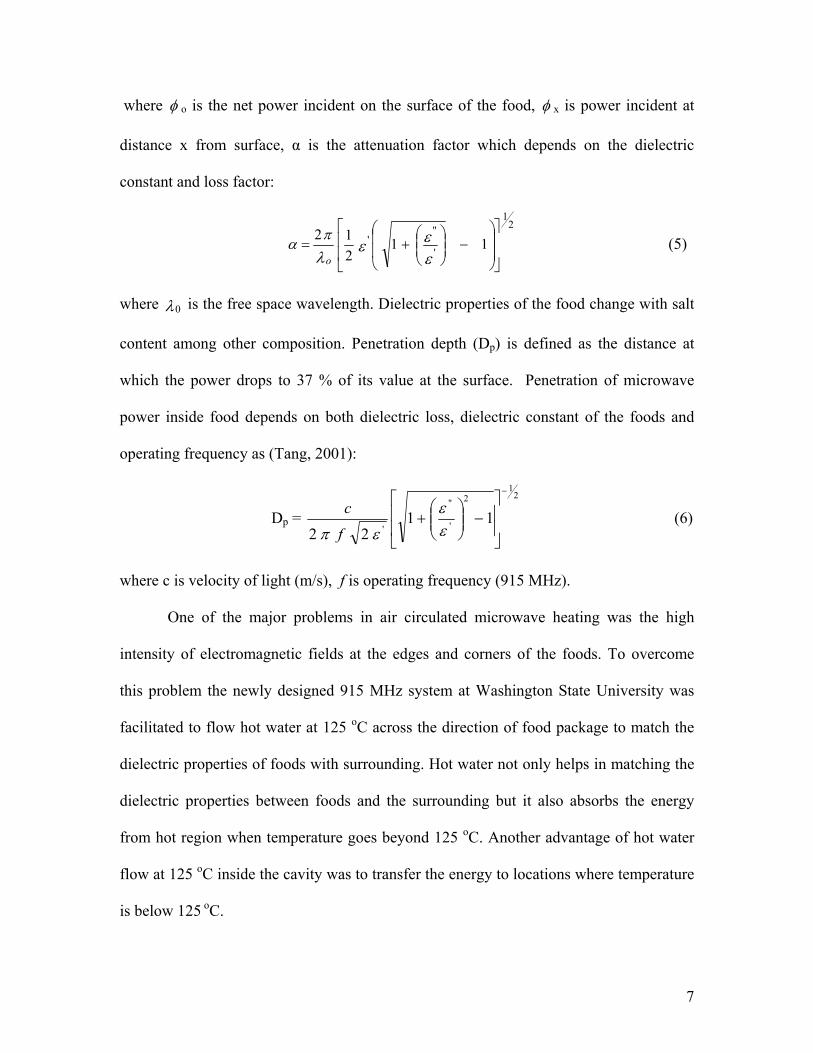
where φ o is the net power incident on the surface of the food, φ x is power incident at
distance x from surface, α is the attenuation factor which depends on the dielectric
constant and loss factor:
2
1
'
"' 11
212
⎥⎥
⎦
⎤
⎢⎢
⎣
⎡
⎟⎟
⎠
⎞
⎜⎜
⎝
⎛−⎟⎟
⎠
⎞⎜⎜⎝
⎛+=
εεε
λπ
αo
(5)
where λ0 is the free space wavelength. Dielectric properties of the food change with salt
content among other composition. Penetration depth (Dp) is defined as the distance at
which the power drops to 37 % of its value at the surface. Penetration of microwave
power inside food depends on both dielectric loss, dielectric constant of the foods and
operating frequency as (Tang, 2001):
Dp = 2
12
'
"
'11
22
−
⎥⎥
⎦
⎤
⎢⎢
⎣
⎡−⎟⎟
⎠
⎞⎜⎜⎝
⎛+
εε
επ fc (6)
where c is velocity of light (m/s), f is operating frequency (915 MHz).
One of the major problems in air circulated microwave heating was the high
intensity of electromagnetic fields at the edges and corners of the foods. To overcome
this problem the newly designed 915 MHz system at Washington State University was
facilitated to flow hot water at 125 oC across the direction of food package to match the
dielectric properties of foods with surrounding. Hot water not only helps in matching the
dielectric properties between foods and the surrounding but it also absorbs the energy
from hot region when temperature goes beyond 125 oC. Another advantage of hot water
flow at 125 oC inside the cavity was to transfer the energy to locations where temperature
is below 125 oC.
7

The novel WSU 915 MHz single-mode microwave sterilization system was tuned
to generate a single mode. The excitation of wave through waveguide was of TE10 mode.
Microwave energy at single modes with zero degree phase shift feeds energy in the
middle of the foods while hot water deliver energy to the edges. Combination of hot
water and zero degree phase shift single-mode microwave heating shorten a complete
sterilization process to 12 minutes. Because of the constraints with existing direct
methods including fiber optics probe, metallic thermocouple, infrared sensor and
spectrophotometer, a chemical marker M-2 yield based method was developed to
determine the cold spot in the microwave sterilization process.
3. Chemical marker (M-2) yield as indirect means to evaluate sterilization process Chemical marker offers an alternative as a time-temperature integrator to determine
heating patterns. A chemical marker method was developed at the United States Army
Natick Research Center (Kim & Taub, 1993) to determine heating patterns in food
system for various thermal processes. Three markers 2, 3-dihydro-3, 5-dihydrixy-6-
methyl-(4H)-pyran-4-one (referred to as M-1), 4-hydroxy-5-methyl-3(2H)-furanone (M-
2) and 5-hydroxymethylfurfural (M-3) have been identified by scientists in Natick US
Army laboratory. Kim et al.(1996b) and Ramaswamy,et al., (1996) have used the M-1
yield as a temperature-time integrator to study Ohmic heating and aseptic processing.
Chemical marker kinetics for M-1 and M-2 has been studied with whey protein
gel (Lau, Tang, Taub, Yang, 2003, Wang, Wig, Tang, & Hallber, 2003). In a whey
protein gel, first order reaction leading to M-2 formation was fast and ultimately gave a
shorter time to reach the saturation point (Wang et al., 2003). M-1 cannot be used for
8

high temperature short time processes. Hence, the Microwave Heating Group at
Washington State University (Pullman, WA) selected mashed potato as a model food to
locate cold and hot spots for regulatory approval of the microwave sterilization unit.
Chemical marker M-2 (4-hydroxy-5-methyl-3(2H))-furanone) is formed by
rearranging Amadori compound product (Fig.1) through the reaction of D-ribose and
amino acids in the presence of weak acidic (PH>5) environment (Prakash, Kim, & Taub,
1997). 1, 2 enolozation is favored in acidic media (pH< 4) and leads to the formation of
2-furaldehyde from ribose.
D-ribose + Amine
Amadori Compound
Strong acid Weak acid 2, 3-enolization 1-2-enolization
H3C O
O HO
O
CHO 2-furaldehyde 4-hydroxy-5-methyl-furanone (M-2) Fig. 1. Reaction pathways leading to the chemical markers formation. Application of 4-hydroxy-5-methyl-3(2H)-furanone to mapping the lethality distribution
within foods for high temperature short time process has been demonstrated by Kim et
al., (1996a). Kinetics study of M-2 formation in whey protein gels were reported by Lau
et al., 2003. However, a lack of kinetics information for M-2 in other food systems
prohibited researchers from quantitatively relating the chemical marker yields to time-
temperature effect in microwave sterilization process. In general, a given chemical
9

marker concentration can be arrived at through many different time-temperature histories.
While reviewing the literature on this subject, we observed there was not enough research
work regarding application of chemical marker as time-temperature integrator to evaluate
the high temperature short time processing. To fill this gap, an extensive study was
necessary to determine reaction order, rate constant and activation energy for M-2
formation in a models food (mashed potato) at range of sterilization temperature.
Knowledge of kinetics parameters was only a preliminary step in order to determine the
cold spot locations based on concentration of chemical marker M-2 formed during
sterilization operation. After collecting the kinetic information an emphasis was given to
develop a chemical marker M-2 assisted method to determine the heating patterns. In our
preliminary study, we found that computer vision would be a possible option to locate the
cold spot in microwave sterilization process.
4. Computer vision method to determine cold spot location
Computer vision is the science that develops the theoretical and algorithmic basis
by which useful information about an object or scene can be automatically extracted and
analyzed from an observed image, image set or image sequence (Haralick and Miller,
1972). Computer vision is a relatively young discipline with its origin traced back to the
1960s (Baxes, 1994). The basic principle of computer vision is described in Fig.2.
Applications of this technique have now expanded to various areas such as medical
diagnostic, automatic manufacturing, surveillance, remote sensing, technical diagnostics,
autonomous vehicle and robot guidance (Sonka, Hlavac, & Boyle, 1999).
10

Computer vision system is a new technology in food industry for inspection and
evaluation purpose as they provide suitable rapid, economic, consistent and objective
assessment. So far, this technology has been applied to a wide variety of foods for quality
evaluation, including apples (Lu, 2004), oranges (Kondo, Ahmad, Monta, & Murase,
2000), potatoes (Tao, Heinemann, Varghese, Morrow, & Sommer, 1995);
Fig. 2.Principle of computer vision system carrots (Andersen, Henriksen, Laursen, & Nielsen, 1999), beef (Yoshikawa et al., 2000)
and pork (Vestergaards, Risum, & AdlerNissen, 2004), etc. Functions of computer vision
are wide-ranging including analysis of chemical properties (Bertram, Whittaker,
Shorthose, Andersen, & Karlsson, 2003), grading and discriminating of foods (Du & Sun,
11

2004); and processing (Wang & Sun, 2003). In most of the computer vision systems,
information or data extracted from the image taken from the original samples is obtained
from pixel of the images. Pixels contain two main types of information, their position and
brightness value, which is also known as color of the images. The color information is
represented by three color components (red, green, blue). Thus the color information can
be easily extracted from the system by simply re-analyzing the stored image.
A color based computer vision investigation has been conducted for different
products such as pizza topping (Du & Sun, 2005; Munkevik, Hall, & Duckett 2005),
chocolate (Briones & Aguilera, 2004), noodle (Hatcher, Symons, & Manivannan, 2003)
as well as meat quality evaluation (Carpenter, Cornforth, & Whittier, 2001). Due to
several benefits, food industry continues to be among the fastest growing segments for
computer vision applications. In fact food industry now ranks among the top ten
industries using computer vision technology (Gunasekaran, 1996).
In the past, color of a food product has been correlated to sensory score (Lu, Tan,
Shatadal, & Gerrard, 2000), pH value (Abriel et al., 2001), moisture (Chaoxin, Sun, &
Zheng, 2006) and so on. But, there was no clear relationship established between color
value and cumulative thermal lethality (Fo) for C. botulinum. For microwave process
development, our research group had an urgent need to develop a method which can
speed up the cold spot determination process in a batch or semi-continuous treatments
system involving multiple trays. A method which would be easy to use, document the
performance of microwave sterilization system and provide illustrative heating patterns
would be advantageous for seeking regulatory approval. Because of these necessities and
benefits a computer vision method was developed in my research program to determine
12

the cold spot location. Outcomes of this research work will overcome the limitation of the
single point limited sensors for monitoring the sterilization operations.
5. Major studies in order to develop a novel method
The main objective of this research work was to develop a rapid and reliable
computer vision method for determining the cold spots in packaged foods sterilized in the
915 MHz microwave system. This objective was accomplished in several steps and each
separate study had specific objectives to meet the goal. Following six major chapters
were considered to discuss the related issues involved in designing a novel method to
determine cold spot:
1. Kinetic studies of chemical marker M-2 formation with model food mashed potatoes.
Under this study a suitable chemical marker was identified for microwave
sterilization process. Limiting factors for chemical marker formation, kinetic
parameters for predicting the chemical marker yield and order of reaction were
determined in this study.
2. Development of a novel approach to determine the heating patterns using computer
vision and chemical marker (M-2) yield. An IMAQ Visio Builder script was
developed through interacting programming to determine the cold spot location in
sterilized foods.
3. Sensitivity analysis and validation of computer vision heating patterns for microwave
sterilization processes. This capter tests the affect of salt content and tray sizes on the
heating patterns. Computer vision heating patterns were validated using microbial
study and fiber optics temperature measurement sensor.
13

4. Upgrading the developed computer vision method to facilitate the comparative study
of heating patterns. The developed computer vision was modified to compare heating
patterns for multiple trays. A kinetics study was also performed to establish the
relationship among thermal lethality (Fo) for C. botulinum, chemical marker yield and
color value. New image system was also designed as part of this study.
5. Principle and application of chemical marker (M-2) based computer vision method to
locate the cold spots in real food systems. This chapter investigate the principle for
applying model food to simulate the heating patterns in other foods namely salmon in
Alfredo sauce.
6. Application of the developed computer vision method to determine cold spot in
salmon with Alfredo sauce and its validation. A complete protocol to simulate the
heating pattern in salmon with Alfredo sauce using whey protein gel is provided in
this study. An inoculated pack study was also performed to confirm the identified
cold spot.
Preceding chapters of this thesis justify the need of a specific study performed and
objective set to address the related issues. Information available in these studies
comprises a novel method to study the microwave sterilization processes.
14

References Abriel, H., Campo, M. M., Onenc, A., Sanudo, C., Alberti, P., & Neguerela, A. I. (2001).
Beef colour evaluation as a function of ultimate pH. Meat Science, 58, 69-78.
Andersen, J-O., Henriksen, C. B., Laursen, J., & Nielsen, A. (1999). Computerized image
analysis to biocrystallograms originating from agricultural products. Computers
and Electronics in Agriculture, 22, 51-69.
Ayappa, K. G., Davis, H. T., Crapisite, G., Davis, E. A., & Gordon, J. (1991).
Microwave heating: An evaluation of power formulations. Chemical
Engineering Science, 46 (4): 1005-1016.
Baxes, G. A., (1994). Digital Image Processing Principle and Application. Wiley, New
York, USA.
Bertram, H. C., Whittaker, A. K., Shorthose, W. R., Andersen, H. J., & Karlsson, A. H.
(2003). Water characteristic in cooked beef as influenced by ageing and high-
pressure treatment-an NMR micro imaging study. Meat Science, 66,301-306.
Briones, V., & Aguilera, J. M. (2004). Image analysis of changes of surface colour of
chocolate. Food Research International, 38, 87-94.
Campañone, L. A., & Zaritzky, N. E. (2005). Mathematical analysis of microwave
power heating process. Journal of Food Engineering. 69(3), 359-368.
Carpenter, C. E., Cornforth, D. P., & Whittier, D. (2001). Consumer preference for beef
colour and packaging did not affect eating satisfaction. Meat Science, 66,301-306.
Chaoxin, Z., Sun, D-W., & Zheng, L. (2006). Correlating color to moisture content of
large cooked beef joints by computer vision. Journal of Food Engineering, 77(4),
858-863.
15

Du, C.-J., & Sun, D.-W. (2004). Recent developments in the application of Image
processing techniques for food quality evaluation. Trends in Food Science and
Technology, 15, 230-249.
Du, C.-J., & Sun, D.-W. (2005). Comparison of three methods for classification of pizza
topping using different colour space transformations. Journal of Food
Engineering, 67, 427-433.
Fernàndez, L., Castillero C., & Aguilera J. M. (2005). An application of Image analysis
to dehydration of apple discs. Journal of Food Engineering, 67: 185-193.
Food and Drug Administrations. (2005). Thermally processed low-acid foods
packaged in hermetically sealed containers. Chapter 1, Available from:
http://www.fda.gov/. Accessed Mar-2005.
Ghani, A. G., Farid, M. M., & Chen, X. D. (2002). Theoretical and experimental
investigation of Bacillus stearothermophilus in food pouches. Journal of Food
Engineering, 51: 221-228.
Guan, D., Plotka, V. C. F., Clark, S., & Tang, J. (2002). Sensory evaluation of
microwave treated macaroni and cheese. J. Food Processing and Preservation
26: 307-322.
Gunasekaran, S. (1996). Computer vision technology for quality assurance. Trends in
Food Science & Technology, 7, 245-256.
Hatcher, D. W., Symons, S. J., & Manivannan, U. (2003). Developments in the use of
analysis for the assessment of oriental noodle appearance and colour. Journal of
Food Engineering, 61, 109-117.
16

Haralick, R. M., & Miller, R. K. (1972). Computer and Robot Vision. Addision-Wesley
Publishing Company, Reading, MA, USA.
Kim, H. J., & Taub, I. A. (1993). Intrinsic chemical marker for aseptic processing of
particulate foods. Food Technology, 47(1), 91-97, 99.
Kim, H. J., Taub, I. A., Choi, Y. M., & Prakash, A. (1996a). Principles and application of
chemical marker of sterility in high-temperature-short time processing of
particulate foods. In T. C. Lee, & H. J. Kim (Eds.), Chemical markers for
processes and stored foods (pp. 54-69). Washington, DC: American Chemical
Society.
Kim, H. J., Choi, Y. M, Tang, T. C. S., Taub, I. A., Tempest, P., Skudder, P., Tucker,
G., & Parrott, D. L.(1996b). Validation of ohmic heating for quality enhancement
of foods products. Food Technology, 50(5), 253-161.
Kondo, N., Ahmad, U., Monta, M., & Murase, H. (2000). Machine vision based quality
evaluation of Iyokan orange fruit using neural network. Computers and
Electronics in Agricultural, 29, 135-147.
Lau, H., Tang, J., Taub, I. A., Yang, T. C. S., Edwards, C. G., & Mao, R. (2003).
Kinetics of chemical marker formation in whey protein gels for studying high
temperature short time microwave sterilization. J. Food Eng., 60: 397-405.
Lu, R. (2004). Multispectral imaging for predicting firmness and soluble solids content of
apple fruit. Postharvest Biology and Technolgy, 31, 147-157.
Lu, J., Tan, J., Shatadal, P., & Gerrard, D. E. (2000). Evaluation of pork color by using
computer vision. Meat Science 56: 57-60.
17

Munkevik, P., Hall, G., & Duckett T. (2005). A computer vision system for appearance-
based descriptive sensory evaluation of meals. Journal of Food Engineering.
78(1):246-256.
Oliveira, M. E. C., & Franca, A. S. (2002). Microwave heating of Foodstuffs. Journal of
Food Engineering, 53, 347-359.
Pandit, R. B., & Prasad S. (2003). Finite element analysis of microwave heating of
potato- transient temperature profiles. Journal of Food Engineering 60:193-202.
Pandit, R. B., Tang, J., Liu F., & Pitts, M. (2007) Development of a novel approach to
determine heating pattern using computer vision and chemical marker (M-2)
yield. Journal of Food Engineering, 78 (2):522-528.
Pandit, R. B., Tang, J., Mikhaylenko, G., & Liu F. (2006). Kinetics of chemical marker
M-2 formation in mashed potato-a tool to locate cold spots under microwave
sterilization. Journal of Food Engineering. 76(3): 353-361.
Pathak, S. K., Liu, F., & Tang, J. (2003). Finite difference domain (FDTD)
characterization of a single mode applicator. J. of Microwave Power &
Electromagnetic Energy 30(1) 1-12.
Prakash, A., Kim, H. J., & Taub, I. A. (1997). Assessment of microwave sterilization of
foods using intrinsic chemical markers. Journal of Microwave and
Electromagnetic Energy, 32(1), 50-57.
Ramaswamy, H. S., Awuah, G. B., Kim, H. J., & Choi, Y. M. (1996). Evaluation of
chemical marker for process lethality measurement at 110 oC in a continuous flow
holding tube. Journal of Food Process and Preservation, 20, 235-249.
18

Romano, V. R., Marra, F., & Tammaro, U. (2005). Modeling of microwave heating of
foodstuff: study on the influence of sample dimensions with FEM approach.
Journal of Food Engineering 71: 233-41.
Sale, A. J. H. (1976). A review of microwave for food processing. Journal of Food
Technology, 11: 319-329.
Sonka, M., Hlavac. V., Boyle, R. (1999). Image Processing, Analysis, and Machine
Vision. PWS Publishing, California, USA.
Tang, J. (2001). Dielectric properties of foods. The Microwave Processing of Foods.
CRC Press, Boca Raton, Boston, NY, US, 23:38.
Tao, Y., Heinemann, P. H., Varghese, Z., Morrow, C. T., & Sommer, H. J. III, (1995).
Machine vision color inspection of potatoes and apples. Transaction of the
ASAE, 38, 1555-1561.
Vestergaard, C., Risum, J., & Adler-Nissen, J. (2004). Qualification of salt concentration
is cured pork by computed tomography. Meat Science, 68,107-113.
Wang, Y., Wig, T. D., Tang, J., & Hallber, L. M. (2003). Dielectric properties of foods
relevant to RF and microwave pasteurization and sterilization. Journal of Food
Engineering. 57(3):257-268.
Wang, H.-H., & Sun, D.-W. (2003). Assessment of cheese browing affected by baking
conditions using computer vision. Journal of Food Engineering, 56, 339-345.
Yang, H. W., & Gunasekaran, S. (2004). Comparison of temperature distributions in
model food cylinders based on Maxwell’s equation and Lambert’s law during
pulsed microwave heating. Journal of Food Engineering, 64, 445-453.
19
Yoshikawa, F., Toraichi, K., Wada, K., Ostu, N., Nakai, H., Mitsumoto, M., & Katagishi,
K. (2000). On a grading system for beef marbling. Pattern Recognition, 21, 1037-
1050.
Zhang, H., & Datta, A. K. (2000). Coupled electromagnetism and thermal modeling of
microwave oven heating of foods. International Microwave Power Institute. 35
(2):71-85
20
CHAPTER 2
KINETICS OF CHEMICAL MARKER M-2 FORMATION IN MASHED POTATO-A
TOOL TO LOCATE COLD SPOTS DURING MICROWAVE STERILIZATION
R. B. Pandit, J*. Tang, G. Mikhaylenko, F. Liu (2006) Journal of Food Engineering, 76(3): 353-361
* Department of Biological Systems Engineering, Washington State University, 213 L J
Smith Hall, Pullman, WA 99164-6120, USA.
Abstract
Chemical marker M-2 (4-hydroxy-5-methyl-3(2H)-furanone) can be used as a
tool to evaluate heating patterns of foods under microwave sterilization. This research
studied the kinetics of the M-2 formation in mashed potato as influenced by temperature
and salt content. Mashed potato (83.12 % moisture content) with 1.5 % D-ribose was
heated in the capillary tubes at four temperatures. Chemical marker M-2 yield was
determined using high performance liquid chromatography. Formation of M-2 in plain
mashed potato was a first-order reaction. The rate constant changed with temperature
following an Arrehenius relationship. For kinetic parameters estimation, one-step non-
linear regression was the best followed by modified two-step regression. The amino acid
substrate was the limiting element in the formation M-2 in mashed potato. The salt
content of zero to one percent had no influence on the chemical marker yield. Addition of
L-lysine more than 1 % resulted in dark color.
Keywords: Chemical marker M-2; M-2 kinetics; D-ribose; L-lysine; Mashed potato;
Microwave sterilization; Cold and hot spots.
1. Introduction
Microwaves have been used widely in food processing operations, including drying,
pasteurization and sterilization of foods (Decareau, 1985). Because of the direct
interaction between microwaves and food products, microwave volumetric heating can
overcome the slow heat transfer between heating media and packaged foods during
conventional heating (Ohlsson, 1992). A fast and reliable method to monitor and predict
microwave-heating pattern in foods during sterilization is needed for successful
development of commercial microwave sterilization processes. In order to design an
effective thermal process to ensure adequate sterility for shelf-stable foods, it is essential
to determine the location of cold and hot- spots in packaged foods.
Microwave heating is different from conventional heating in which the heating
patterns is usually dependent upon the direct interaction between microwave energy and
food and are difficult to predict (Decareau, 1985). Thus, assessment of temperature
distribution within packaged foods during microwave sterilization is essential but it can
not be determined with single point each or even various points’ temperature
measurements (Ohlsson, 1972). Similar challenges were experienced in the development
of a pilot scale microwave heating system at Washington State University, USA. Issues
that need to be addressed before obtaining regulatory and industrial acceptances include:
determination of the locations of cold and hot spots and the nature of their mobility and
repeatability, a reliable monitoring procedure to ensure a safe level of microwave
sterilization (Guan, Plotka, Clark, & Tang, 2002). Kinetics of chemical marker M-2
formation in mashed potato has been studied (Kim, Taub, Choi, & Prakash, 1996a) to
develop a method, which can lead to the detection of cold and hot spot locations.
22

Direct measurement of time-temperature history for all points in food packages is
not possible in microwave sterilization. Chemical marker offers an alternative as a time-
temperature integrator to determine heating patterns. A chemical marker method was
developed at the United States Army Natick Research Center (Kim & Taub, 1993) to
determine heating patterns in food system for various thermal processes. Three markers
2, 3-dihydro-3, 5-dihydrixy-6-methyl-(4H)-pyran-4-one (referred to as M-1), 4-hydroxy-
5-methyl-3(2H)-furanone (M-2) and 5-hydroxymethylfurfural (M-3) have been identified
by scientists in Natick US Army laboratory. Kim et al.(1996b) and Ramaswamy, Awuah,
Kim and Choi (1996) have used the M-1 yield as a temperature-time integrator to study
ohmic heating and aseptic processing.
Chemical marker kinetics for M-1 and M-2 has been studied with whey protein gel
(Lau, Tang, Taub, Yang, 2003, Wang, Lau, Tang, Mao, 2004). But that information can
not be used to determine the location of cold spot for newly developed microwave
sterilization system. In whey protein gel, reaction leading to M-2 formation was fast and
ultimately giving a shorter time to reach the saturation point. M-1 could not be used for
high temperature short time processes. The Microwave Heating Group at Washington
State University (Pullman, WA) selected mashed potato as a model food to locate cold
and hot spots for approval of the sterilization unit by regulatory bodies. Hence, kinetics
information for M-2 with mashed potato was needed to monitor the microwave
sterilization process qualitatively
Understanding kinetics of the chemical marker M-2 formation in mashed potato
as well as information about order of reaction, correlation of M-2 yield with cumulative
lethality (Fo), M-2 yield with degree of cooking (Cook value), limiting factor of the
23

reaction, effect of D-ribose and amino acids on the chemical marker M-2 yield will guide
us to develop a reliable method for determining heating patterns.
The objectives of this study were: 1) to determine the reaction order, rate constant
and energy of activation for the M-2 formation in mashed potato at four temperature; 2)
to find the limiting factor and the influence of different sources of mashed potato on the
M-2 yield; 3) to study the M-2 formation over the range of dielectric properties of model
food by changing the salt content of mashed potato.
This kinetics study will help in establishing a process to develop a reliable method
for determining the location of the cold and hot spots in 915 MHz microwave sterilization
system.
2. Materials and methods
Chemical marker M-2 (4-hydroxy-5-methyl-3(2H))-furanone) is formed by
rearranging Amadori compound product (Fig.1) through the reaction of D-ribose and
amino acids in the presence of weak acidic (PH>5) environment (Prakash, Kim, & Taub,
1997). Early consumption of any component either D-ribose or amino acids will limit the
yield of the chemical marker M-2 during sterilization process. Amino acids especially
lysine, arginine, histidine and methoinine are of prime importance during formation of
chemical marker M-2 in presence of D-ribose. A yield point after which there will be no
significant effect of heating on chemical marker yield is called marker yield at saturation
D-ribose + Amine Amadori Compound CH3 O
O HO
4-hydroxy-5-methyl- 3(2H)-furanone (M-2)
24

Fig. 1. Formation of chemical compound 4-hydroxy-5-methyl- 3(2H)-furanone (M-2) in
presence of D-ribose with mashed potato.
(C ∞ ). Chromatographic detection showed that chemical marker M-2 has a UV absorption
maximum at 285 nm with a retention time of 5.8 min (Kim & Taub, 1993). Mashed
potato used in this study contained added 1.5 % D-ribose (Sigma, St. Lous, MO).
Concentrations of amino acids in the sample were as follows: methionine 1.41 µM/g,
lysine 1.7 µM/g, histidine 1.33 µM/g, arginine 3.70 µM/g. Concentration of amino acids
in the model food was much lower than that of D-ribose due to the chemical composition
of potato. Equation for studying the kinetics of chemical marker (M-2) formation with
mashed potato can be given as (Lau et al., 2003):
=dt
dC k (C∞ - C) n (1)
The above equation conveys that the rate of formation dtdC is proportional to nth power of
difference between concentration of marker yield at saturation, C∞ gm /gm of sample)
and marker yield at any time, (C gm /gm of sample), while n is order of the reaction and
k is reaction constant.
2.1. M-2 yield determination
Mashed potato was selected as a model food in study because of homogeneity and
availability. During sample preparation, 1.5 g of D-ribose was dissolved first in 83.12 g
of distilled water at room temperature and was then mixed with 15.38 g dry mashed
potato flakes (Washington Potato Company, Warden, WA). About 2 ml of the dispersed
paste was carefully injected into the glass capillary tubes (inner diameter=1.75 mm;
25

length=15 cm). Both ends of the tubes were sealed with a hot flame. During tube sealing,
precaution was taken to avoid heating of mashed potato. The transition temperature for
mashed potato (MP) in 0.7 M phosphate buffer at pH =5.92 was taken 68 and 83 oC
(Palumbo, 1992). Experiments were carried using an oil bath set at 116, 121, 126 and 131
oC at several time intervals in order to cover a range of likely temperature-time
combinations in the microwave sterilization processes. At each temperature level
experiment was conducted in two replicates and both replicates were considered for
estimation of kinetics parameters and order of reaction. The come-up time for the
capillary tube filled with mashed potato to reach set temperature level was between 12-14
sec. Tubes were heated in the oil bath at each temperature to 60 minutes. After
predetermined heating times, the tubes were removed from the oil bath and immediately
placed in a basin containing crushed ice. Cooled tubes were opened; the potato was
removed and immediately weighed. A sample weighing between 0.16-0.17 g was placed
in a mortar and carefully ground in 2 ml extraction buffer (10 mM sulphuric acid and 5
mM citric acid) according to the modified extraction procedure described by Lau et. al.,
(2003). Extracts were collected and sealed tubes were stored overnight in a -20ºC freezer.
Upon thawing at room temperature, extracts were mixed thoroughly and centrifuged for
10 min at 14,000 rpm (Eppendorf centrifuge, Brinkman Instruments, Westbury, NY).
Supernatants were transferred into fresh tubes and were centrifuged again at the same
conditions (10 min at 14,000 rpm). The supernatants were filtered using a PTFE syringe
filter with a 0.45 nm pore size and placed into a high performance liquid chromatography
sample holder for analysis to obtain M-2 yield.
26

The Agilent 1100 HPLC system (Agilent Technology, USA) was equipped with a
diode array detector. Twenty five µl aliquots were run through the fast acid analysis
column, 100 × 7.8 mm (Bio-Rad Laboratories, Hercules, CA). The mobile phase was 10
mM at a flow rate of 1 ml/min. Absorbance of was determined at 285 nm as per Kim and
Taub (1993). A calibration curve (Fig. 2.) was established using a commercial sample of
chemical marker M-2 obtained from Givaudan Flavor Corporation (Cincinnati, Ohio).
y = 57348xR2 = 0.9983
0.E+00
1.E+04
2.E+04
3.E+04
4.E+04
5.E+04
6.E+04
7.E+04
0 0.2 0.4 0.6 0.8 1 1.2
M-2 concentration (mg/ml)
Peak
Are
a ( m
Au*
s)
Fig. 2. Calibration curve of chemical marker M-2 (4-hydroxy-5-methyl-3(2H)-furanone)
in 10mM sulfuric-5mM citric acid buffer.
Standard dilutions were prepared using the same extraction buffer as for samples
of mashed potato in kinetic studies. Calibration curve contributes in expressing yield as
mg of marker per gram of sample. The following equation was used in this study to
express peak area of the sample as mg of marker per gram of sample:
27

Marker Yield = Peak Area (sample) × volume of extract ( 2 ) 57348 weight of sample
Initial M-2 yield in plain mashed potato was not observed even at high sensitivity
of the HPLC, indicating that the marker yield observed is a product of reaction between
added D(-) ribose and amino-acids endogenous to potato flakes. The kinetic experiments
were carried out in two replicates.
2.2. Limiting factors M-2 formation Instant mashed-potato flakes from two manufacturing lots: old (2002), new
(2003) were acquired from Washington Potatoes Co. (Warden, WA) and were analyzed
for amino acid composition. Since potato flakes are high in starch content (~66%
according to the Data of National Grain and Feed Association), direct amino acid analysis
with the raw material was not possible due to a high glucose concentration that interfered
with the spectral detection of amino acids. Instead the potato flakes were pre-extracted
prior to the amino acid analysis according to the modified method described by Yang
(1997). One gram of flakes was extracted with 25 ml of 80 percent ethanol by shaking in
a gyratory shaker (New Brunswick Scientific Precision Inc, M-3, Brunswick, NJ ) at
room temperature for 15 min and centrifuging at 1200 g at 5 °C for 10 min. The
supernatant was filtered through ashless Whatman filter paper of size 40 to remove potato
particles. The total volume of extracts was brought up to 25 ml final volume with 80%
ethanol. An aliquot was then applied to the column of Beckman 6300 Automatic amino
acid analyzer (Beckman Instruments Co., Palo Alto, CA).
28

The moisture of potato flakes was determined according to the official AOAC
method 7.003 (AOAC, 1980). Total protein content of potato flakes was determined
using a Leco protein analyzer (Leco Corporation, St. Joseph, MI). All analyses of potato
flakes samples were conducted in at least two replicates. Total protein content of mashed
potato was 7.3 percent while the content of four major amino acids which participate in
chemical marker M-2 formation are: methionine 1.41 µM/g, lysine 1.7 µM/g, histidine
1.33 µM/g, and arginine 3.70 µM/g.
To determine the limiting factor in M-2 formation, mashed potato sample was
prepared with 1.5 %, D-ribose. Chemical marker yield of the sample heated in an oil bath
for predefined time at 121 oC temperature was obtained using HPLC. Experiments were
repeated for higher levels of D-ribose: 3, 4.5 %. Levels of the D-ribose were selected to
investigate the heating time at which amino acid content of the mashed potato become
inadequate for M-2 formation. Chemical marker yield obtained at different levels were
plotted to analyze the results. At each level five different time intervals were selected to
obtain M-2 yield with two replicates.
2.3. Statistical Analysis
Order of reaction and kinetics parameters can be determined by different methods
statistically (Hill and Grieger-Block, 1980). Following three methods are commonly
used: modified two-step, multi-linear regression and one-step non-linear regression
analyses. Those methods were chosen due to their ability to accurately estimate the
kinetic parameters of the Arrhenius model (Haralampu, Saguy & Karel, 1985). It was
reported that among the above three methods, modified two-step regression gives least
29

accurate estimation of the Arrhenius parameters because of the need to calculate many
intermediate values before estimating the kinetics parameters. (Haralampu, Saguy &
Karel, 1985). Multiple linear regressions showed bias with little improvement over
modified two-step regression (Ramaswamy, Awuah, Kim, & Choi, 1996). Non-linear
regression is probably the most appropriate theoretical method because it does not
estimate unnecessary parameters (Arabshahi & Lund, 1984). These three methods were
used to estimate the kinetics parameters in this study.
SAS Systems Release 8.1 (SAS Institute Inc., Cary, NC, 2000) was used to
perform the statistical analysis. Modified two-step, multi-linear regression and one-step
non-linear regression analyses were considered to estimate the kinetic parameters.
Integrating equation (1) between Co to C for a time interval of zero to time interval t we
have:
∫ =−∞
C
C
t
no
dtkCC
dC
0)( ∫ (3)
(4) tknCCCC no
n )1()()( 11 −−=−−− −∞
−∞
nno tknCCCC −−
∞∞ −−−=− 11
1 ])1()[()( (5)
The above equation does not apply to n=1 because the term n−1
1 will become
indeterminate. After rearranging the equation (5) we get:
C = C∞ - [(C∞ - Co) 1-n – (1- n) k t] 1/1-n (n ≠ 1) (6)
30

The above model was fitted with the experimental data using procedure NLIN of
SAS Systems Release 8.1 (SAS Institute Inc., Cary, NC, 2000). PROC NLIN (nonlinear
procedure) fits nonlinear regression models using the least square method. Experimental
data supplied were marker yield at various time interval and values estimated from model
were order of reaction, marker yield at saturation (C∞).Values of Co were considered as
zero during estimation.
Coefficient of determination is the best measure to show the degree of fitting
between experimental data and prescribed model. However, along with R-square of non-
linear regression we also validated the estimation using graphical analysis. In graphical
analysis, exponent n in equation (1) was set to zero, half, one, and two to compare the
coefficient of determination among zero, half, first, and second order reactions
respectively. Results obtained are presented in Table 2.
Fitting of the experimental data to model (6) predict the order of reaction as first.
(Table 1). Graphical analysis also supports the predicted order of reaction. Estimation of
the kinetic parameters was obtained considering n =1 in equation (1) and integrating
between Co to C:
ln (C∞ - C) = ln (C∞ - Co) - k t (7)
Equation (6) in exponential form can be written as:
C = C∞ - (C∞ - Co) (8) tke−
The activated complex theory for chemical reaction rates is the basis for the
Arrhenius equation, which relates reaction rate constants to the absolute temperature. The
Arrhenius equation is (Holdsworth, 2000):
TRE a
eAk−
= (9)
31

where Ea (kcal/mol) is the activation energy, A is the rate constants and T is absolute
temperature (K). R is the universal gas constant (1.987 cal/mol K). Another form of the
Arrhenius equation involves the reaction rate constant at a reference temperature. Under
this study reference temperature To (396.7 K) was taken as average of all four
temperature considered. If ko is the reaction rate constant at To then equation (8) can be
modified by replacing constant A as:
⎟⎟⎠
⎞⎜⎜⎝
⎛−−
= o
a
TTRE
o ekk11
(10)
Equation (9) can be written in linear form by taking logarithmic both sides:
)11(lnlno
ao TTR
Ekk −−= (11)
Following three statistical methods: modified two-step, multi-linear and one-step
non-linear regression methods were considered for estimation of the kinetics parameters.
(i) Method I: In Modified two-step regression method experimental data were fitted to
the model (8) using NLIN procedure of SAS, which is based on the Marquardt algorithm
to obtain M∞ and k at each temperature. Marquardt iterative algorithm regresses the
residuals onto the partial derivatives of the model with respect to the parameters until the
estimates converge. Reaction rate constants (k) at all temperatures were fitted into the
linear model (11) to obtain REa as slope and ln(ko) with intercept term. Energy of
activation Ea and ko were calculated from the slop and intercept term, respectively.
(ii) Method II: In Two-step multi-linear regression, times were introduced as pseudo-
dummy variables tTi at different temperatures, Ti in equation (7).The dummy time
32

variable were created by associating the reaction times at a particular temperature ,Ti,
with a parameter, ki , and setting the dummy times associated with the other temperature
levels to zero. In this study, m was taken as four because of four temperature levels:
(12) )ln()ln( 01
CCtkCCm
iTii −−∑=−− ∞
=∞
Detailed information on using Eq. (12) is provided in Haralampu, Saguy & Karel, (1985).
C∞ value obtained from non-linear regression method was used in calculating ln (C∞ - C).
ln (C∞ - C) and pseudo-dummy variables tTi were fitted with model (12) to obtain reaction
rate constant ki at each temperature level. After all the k values at different reaction
temperatures were obtained, they were fitted to model (11) and Ea, ko were estimated
same as in case of modified two-step regression.
(iii) Method III: One-step non-linear regression performs a single regression on all of the
data to estimate REa and ko without calculating the reaction rate at each temperature. An
equation without reaction rate constant can be obtained by replacing the k terms in
equation (8):
1 1a
o
ER T T
o oC C ( C C ) exp t k e⎛ ⎞
− −⎜ ⎟⎝ ⎠
∞ ∞
⎧ ⎫⎪ ⎪= − − × −⎨ ⎬⎪ ⎪⎩ ⎭
(13)
Substituting k in equation (8) with Eq. (10), we obtain:
⎪⎭
⎪⎬⎫
⎪⎩
⎪⎨⎧
⎥⎥⎦
⎤
⎢⎢⎣
⎡−−−×−−= ∞∞ )11(expexp)(
TTREktCCCC
o
aoo (14)
Transformation of the equation to this form improves the accuracy of the estimation
because of involvement of the several parameters (Nelson 1983). The non-linear
33

regression procedure in SAS Systems was used to fit the marker yield (C) versus time (t)
data to model (14), to estimate the Ea and ko at each temperature level. Reaction rate
constant at each temperature was calculated back using equation (11).
2.4. Effect of salt content and additional L-lysine on M-2 yield
Mashed potato with zero and one percent salt content was filled into the capillary
glass tubes and experiment was carried out at 121 oC. Tubes were taken out after 5 min
interval from an oil bath and samples were prepared for HPLC analysis as mentioned
above. M-2 yield obtained after HPLC analysis at each salt level with two replicates were
plotted to determine the effect of salt level on M-2 yield.
Effects of additional L-lysine on chemical marker yield was studied with added L-
lysine, ranging from 0.5, 1.0, and 2 .0 %. Mashed potato sample containing L-lysine in
specified proportions were filled into tubes and heated at 121 oC. First tube of two
percent L-lysine taken out at 5 min interval was very dark because the marker yield
reached the saturation point. Microwave sterilization processing lower than five minutes
can not be anticipated on industrial scale unit. Hence, we discarded any experiment of
additional L-lysine higher than two percent. Chemical marker yield of different products
with different chemical composition: Potato Buds (8.7 % protein), Russet potato (5.2 %
protein) and Idahoan Real potato (8.69 % protein) and samples from 2002 and 2003 lots
were compared.
34

3. Results and discussion
Increases in marker yield (M-2) as a function of time at four different
temperatures are shown in Fig.3. Those data were used to determine kinetics information
for formation of M-2 in mashed potato. Chemical marker yield (M-2) in the unheated
mashed potato sample was considered as zero, because no peak was detected during
HPLC analysis. An analysis of variance (ANOVA) shows that the marker yields at
saturation level for different temperatures were not different on 95 % confidence interval.
Estimated marker yield at the saturation level matched with the marker yield obtained by
HPLC analysis.
Fig. 3. Chemical marker yield (M-2) for different temperature levels obtained during
experimental work, scattered data represent means of two replicates.
35

3.1. Estimated chemical reaction parameters
The chemical marker formation in mashed potato followed a first order reaction.
Graphical analysis also confirmed the first order of reaction. Lau et al., (2003) & Wang,
Lau, Tang, Mao (2004) also obtained a first order reaction for M-2 and M-1 formation in
whey protein gels. Table 1 summarizes the order of reaction and chemical marker yield at
saturation. Results obtained by the graphical analysis for reaction order are presented in
Table 2.
Table 1. Estimated order of reaction (n), marker yield at saturation (C∞) values by
non-linear regression based on two replicates of experimental data.
T (oC) n
C∞
R- square
116 1.050 ± 0.44 0.267 ± 0.04 0.989
121 1.0271 ± 0.23 0.284 ± 0.018 0.990
126 1.062 ± 0.18 0.273 ± 0.012 0.991
131 1.066 ± 0.40 0.268 ± 0.015 0.981
36

Table 2. Estimation of the order of chemical marker (M-2) formation by examining
r2 from plot of zero, half and second order reactions based on two replicates of
experimental data.
Temperature
( oC )
Zero order
(C∞ - C) versus time
Half order (C∞ - C) 0.5 versus time
First order ln(C∞ - C) versus time
Second order
1/(C∞ - C) versus time
116 0.855 0.921 0.987 0.715
121 0.866 0.942 0.973 0.765
126 0.829 0.917 0.978 0.776
131 0.672 0.672 0.959 0.416
First order kinetics (n = 1) for M-2 formation was used to calculate the reaction
constant and activation energy. Kinetic parameters (k, Ea) for M-2 formation were
obtained by modified-two-step, two-step multi-linear and one-step non-linear regression
methods. Results obtained using these statistical methods are given in Table 3. In case of
one-step non-linear regression standard error in reaction rate constant was calculated
using:
⎥⎥⎦
⎤
⎢⎢⎣
⎡⎟⎟⎠
⎞⎜⎜⎝
⎛−
∆+
∆=∆
o
a
o
o
TTRE
kk
kk 11 (15)
Coefficient of determination (r2) and standard error for k, and Ea estimated are provided
in Table 3. One-step non-linear method is the best among considered methods followed
37

by the modified two-step method based on the values of r2 and the standard error. One
step non-linear method has advantage of using whole data set, as well as estimating fewer
parameters during analysis. The multi-linear regression gives the smallest r2 and the
largest standard error for estimation of activation energy.
Table 3. Rate constant (min-1), and activation energy, Ea (kcal/mol), for M-2
formation in mashed potato at four temperatures levels based on two replicates of
experimental data.
Reaction rate, activation
energy
Modified Two-step regression
Two step multi-linear regression
One step non-linear
regression
M-2 formation with whey protein gel (Lau, et al.,
2003).
k116 0.031 ± 0.014 0.029 ± 0.004 0.030 ± 0.001 0.110
k121 0.040 ± 0.007 0.0451 ± 0.004 0.044 ± 0.002 0.152
k126 0.056 ± 0.007 0.053 ± 0.005 0.063 ± 0.003 0.207
k131 0.096 ± 0.024 0.072 ± 0.006 0.089 ± 0.005 0.281
ko 0.050 ± 0.048 0.048 ± 0.066 0.052 ± 0.002 0.178
Ea (kcal mol-1 K-1 ) 22.96 ± 2.73 19.45 ± 3.79 22.23 ± 1.54 19.48
r2= 0.978 r2= 0.914 r2= 0.983
38

Activation energy estimated for M-2 formation (22.23 ± 1.54 kcal/mol) is within
the range cited in the literature for non-enzymatic browining on model food systems
(ranging from 16 to 30 kcal/mol) (Labuza and Baisier, 1992). Kinetic parameters
estimated in this study were compared with the kinetic parameters for M-2 formation
with whey protein gel (Lau et. al., 2003) in Table 3. Reaction rate constant (k) increases
with temperature for both cases. Mashed potato has lower amino acid content than whey
protein gel, which resulted in lower k and higher Ea values.
0
0.05
0.1
0.15
0.2
0.25
0.3
0 10 20 30 40 50 60 7Time (min)
Mar
ker Y
ield
(mg/
g of
Sam
ple)
0
1.5 % D-ribose3 % D-ribose4.5 % D-ribose
Fig. 4. Chemical marker (M-2) yield with different percentage of D- ribose at 121 o C,
each point represent mean of two replicates.
3.2. Estimation of limiting factor Chemical marker yield increased with time until 60 minutes for 1.5 and 3 percent
D-ribose while yield reached to the saturation point around 20 min with 4.5 percent D-
ribose as shown in Fig.4. The amino acid content of mashed potato was adequate for 1.5 ,
39
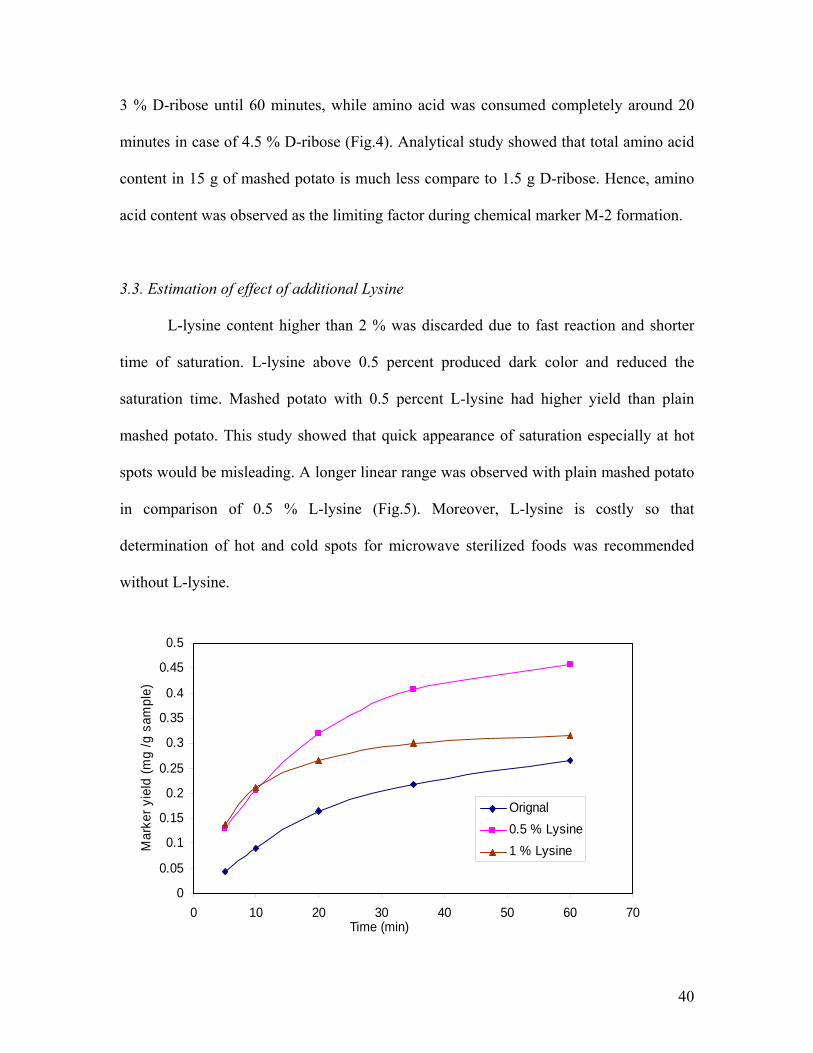
3 % D-ribose until 60 minutes, while amino acid was consumed completely around 20
minutes in case of 4.5 % D-ribose (Fig.4). Analytical study showed that total amino acid
content in 15 g of mashed potato is much less compare to 1.5 g D-ribose. Hence, amino
acid content was observed as the limiting factor during chemical marker M-2 formation.
3.3. Estimation of effect of additional Lysine L-lysine content higher than 2 % was discarded due to fast reaction and shorter
time of saturation. L-lysine above 0.5 percent produced dark color and reduced the
saturation time. Mashed potato with 0.5 percent L-lysine had higher yield than plain
mashed potato. This study showed that quick appearance of saturation especially at hot
spots would be misleading. A longer linear range was observed with plain mashed potato
in comparison of 0.5 % L-lysine (Fig.5). Moreover, L-lysine is costly so that
determination of hot and cold spots for microwave sterilized foods was recommended
without L-lysine.
0
0.05
0.1
0.15
0.2
0.25
0.3
0.35
0.4
0.45
0.5
0 10 20 30 40 50 60 70Time (min)
Mar
ker y
ield
(mg
/g s
ampl
e)
Orignal0.5 % Lysine1 % Lysine
40
Fig. 5. Effect of additional L-lysine on marker yield in plain mashed potato at 121 o C,
each point represents the mean of two replicates.
3.4. Variability among different mashed potato sources Three locally available brands of potato flakes: Potato Buds with (8.7 % protein),
Russet potato with (5.2 % protein) and Idahoan Real potato with (8.69 % protein) along
with old and new batches of mashed potato flakes (8.3 % and 7.3% protein, respectively)
were considered for estimating the variability of mashed potatoes sources on chemical
marker yield. M-2 yield obtained (Fig. 6) were statistically analyzed using SAS software.
M-2 yields from different sources of potatoes were not significantly different (P-value =
0.989).
0
0.05
0.1
0.15
0.2
0.25
0.3
0 5 10 15 20 25 30 35 40
Time (min)
Mar
ker Y
ield
( m
g / g
sam
ple)
plain mashed poatao
Potato buds,8.7 %
Old batch of plainmashed potato
Idaho russet,protein 5.2%
Idahoan real, protein8.69 % "
Fig. 6. Chemical marker (M-2) yield for various sources of mashed potato at 121 oC, each
point represents the mean of two replicates.
41

3.5. Effect of salt on marker yield
Two replicates for each level of salt were evaluated and statistical analysis of
chemical marker yield was performed using SAS software. Analysis (P>0.99) showed
that chemical marker yield was independent of salt content (Fig.7).
0
0.05
0.1
0.15
0.2
0.25
0 5 10 15 20 25 30Time (min)
M-2
yie
ld (
mg
/ g s
ampl
e)
1 % Salt repli-1
1 % Salt repli-2
Plain repli-1
Plain-repli-2
Fig. 7. Effect of salt content on chemical marker (M-2) yield at 121 oC, each level has
two replicates.
4. Conclusion
Chemical marker (M-2) formation in mashed potato with 1.5 percent D-ribose
was predicted as a first order reaction. Kinetic parameters were predicted much
accurately by one-step non-linear regression method followed by modified two step
regression. One-step non-linear regression was a more appropriate method since it does
not estimate unnecessary parameters and gives both unbiased and precise estimation of
42

the parameters. Modified two-step regression was a second option with higher standard
error in estimation of the activation energy. Multiple linear regression method gives
broader confidence interval in the estimation of activation energy along with the lowest
overall coefficient of determination (r2). Amino acid content was the limiting factor in
formation of M-2 from D-ribose and mashed potato. Chemical marker yields of the
considered sources of potatoes were not significantly different. Marker yield was found
to be independent of the level of salt. The kinetic parameters obtained in this study can be
used for determining the hot and cold spots locations during high temperature short time
microwave sterilization processes.
Acknowledgements This research work was supported by US Army Natick Soldier Center, Natick,
MA, and WSU microwave sterilization consortium that consists of Kraft Foods, IL,
Ferrite components, NH, Hormel Foods, MN, Master Foods, CA, Ocean Beauty Sea
Foods, WA, Graphics Packaging, CO, Rexam Containers, MO, and Washington State
University.
Nomenclature C Chemical marker (M-2) concentration at any time (mg / g of sample)
∞C Chemical marker (M-2) concentration at saturation (mg / g of sample)
Ea Activation energy for chemical reaction (kcal mol-1 )
Fo Cumulative thermal lethality (min)
43

k Chemical reaction rate constant (min-1)
ko Rate constant at reference temperature (min-1)
n Order of the chemical reaction
Ro Universal gas constant at reference temperature
t Time (min)
T Absolute temperature (K)
References AOAC (1980). Official Methods of Analysis. 13th ed., Sec 7-003. Association of Official
Analytical Chemistry, Washington, DC.
Arabshahi, A., & Lund, D. B. (1984). Consideration in calculating kinetic parameters
from experimental data. Journal of Food Process Engineering, 7, 239-251.
Decareau, R. D. (1985). Microwaves in the Food Processing Industry. Orlando, FL:
Academic Press.
Guan, D., Plotka, V. C. F, Clark, S., & Tang, J. (2002). Sensory evaluation of microwave
treated macaroni and cheese. Journal of Food Processing and Preservation, 26,
307-322.
Haralampu, S. G., Saguy, I., & Karel, M. (1985). Estimation of Arrhenius model
parameters using three least square methods. Journal of Food Processing and
Preservation, 9,129-143.
Hill, C. G. and Grieger-Block, R. A. (1980). Kinetics data: generation, interpretation, and
use. Food Technology. 34 (2), 56.
44

Holdsworth, S. D. (2000). Kinetics of thermal processing. Thermal Processing of Foods.
70-93.
Kim, H. J., & Taub, I. A. (1993). Intrinsic chemical marker for aseptic processing of
particulate foods. Food Technology, 47(1), 91-97, 99.
Kim, H. J., Taub, I. A., Choi, Y. M., & Prakash, A. (1996a). Principles and application of
chemical marker of sterility in high-temperature-short time processing of
particulate foods. In T. C. Lee, & H. J. Kim (Eds.), Chemical Markers for
Processes and Stored Foods (pp. 54-69). Washington, DC: American Chemical
Society.
Kim, H. J., Choi, Y. M, Tang, T. C. S., Taub, I. A., Tempest, P., Skudder, P., Tucker,
G., & Parrott, D. L.(1996b). Validation of ohmic heating for quality enhancement
of foods products. Food Technology, 50(5), 253-161.
Labuza, T. P., & Baisier, W. M. (1992). The kinetics and non-enzymatic browning. In H.
G. Schwartzberg, & R. W. Hartel (Eds.), Physical Chemistry of Foods (pp. 595-
649). New York, NY: Marcel Dekker.
Lau, H., Tang, J., Taub, I. A., Yang, T. C. S., Edwards, C.G. and Mao, R. (2003).
Kinetics of chemical marker formation in whey protein gels for studying high
temperature short time microwave sterilization. J. Food Eng., 60: 397-405.
Nelson R. R. (1983). Considerations in modeling food processes. Food Technology. 37
(1), 92-94.
Ohlsson, T. (1972). Possibility and limits of microwave sterilization. In Proceeding of
International Symposium, Karlsruhe, Germany.
45

Ohlsson, T. (1992). Development and evaluation of a microwave sterilization process for
plastic pouches. Paper presented at the 8th World Congress of Food Science and
Technology, Toronto, September 29-October 4, 1991.
Palumbo, M. S. (1992). Milk and milk products. In J. bowers (Ed.), Food Theory and
Application (second ed., pp. 425-504). New York, NY: Macmillan Publishing
Company.
Prakash, A., Kim, H. J., & Taub, I. A. (1997). Assessment of microwave sterilization of
foods using intrinsic chemical markers. Journal of Microwave and
Electromagnetic Energy, 32(1), 50-57.
Ramaswamy, H. S., Awuah, G. B., Kim, H. J., & Choi, Y. M. (1996). Evaluation of
chemical marker for process lethality measurement at 1 oC in a continuous flow
holding tube. Journal of Food Process and Preservation, 20, 235-249.
Wang, Y., Lau, M. H., Tang, J., Mao, R. (2004). Kinetics of chemical marker M-1
formation in whey protein gels for developing sterilization processes based on
dielectric heating. J. Food Eng., 64: 111-118.
Yang, J. (1997). The effect of natural sprout inhibitors on sugars and free amino acids in
stored potato tubers. MS Thesis. FSHN, Washington state University, Pullman,
WA.
46

CHAPTER 3
DEVELOPMENT OF A NOVEL APPROACH TO DETERMINE HEATING
PATTERN USING COMPUTER VISION AND CHEMICAL MARKER (M-2)
YIELD
R. B. Pandit, J. Tang*, F. Liu, M. Pitts (2007) Journal of Food Engineering, 78(2):522-528
*Department of Biological Systems Engineering, Washington State University, 213 L J Smith
Hall, Pullman, WA 99164-6120, USA.
Abstract In this study, a novel approach to determine heating patterns using chemical
marker (M-2) yield and computer vision was developed for packaged foods after
microwave sterilization. Due to various constraints of temperature measurement devices
such as fiber optic temperature sensors, thermocouples, and infrared sensors, there is a
need to develop an accurate and rapid method to determine heating patterns in packaged
food trays after microwave sterilization. Yield of a heat sensitive chemical marker (M-2)
was used as a coloring agent and digital images of the processed trays were analyzed
using a computer vision system. A script in IMAQ Vision Builder software was written
to obtain a 3-D heating pattern for the sterilized trays. Relationship between chemical
marker (M-2) yield and cumulative thermal lethality (Fo) was also studied. Validation of
the locations of cold and hot spots determined by computer vision were performed by
fiber-optics temperature measurement sensor. Results show that computer vision in
combination with chemical marker M-2 and other accessories can be used as a rapid,
accurate and cost efficient tool to specify the location of cold and hot spots after
microwave sterilization.

Keywords: IMAQ vision builder; Chemical marker M-2; Computer vision; Machine
vision; Digital image processing; Cold and hot spots; Microwave heating; Sterilization
1. Introduction
Computer vision is a technology for acquiring and analyzing a digital image to
obtain information or to control processes. Computer vision can be a successful tool for
online measurement of several food products with applications ranging from routine
inspection to complex vision monitoring (Gunasekaran, 1996). Du and Sun (2004)
presented a review about recent developments in the application of image processing
techniques for food quality evaluation and pointed out many opportunities for image
processing in the food industry. Computer vision includes capturing, processing and
analyzing images to asses the visual quality characteristic in food products (Gonzalez &
Wintz, 1991). It is the construction of an explicit and meaningful description of physical
objects from images (Ballard & Brown, 1982). Computer vision is a branch of science
that develops the theoretical and algorithmic basis by which useful information about an
object or scene can be automatically extracted and analyzed from an observed image,
image set or images sequence (Haralick & Shapiro, 1992). The technology aims to
duplicate and augment human vision by electronically perceiving and understanding an
image (Sonka, Hlavac, & Boyle, 1999). Recent advances in hardware and software have
expanded this technology by providing low cost powerful solutions, leading to more
studies on the development of computer vision systems in the food industry (Locht,
Thomsen, & Mikkelsen, 1997; Sun, 2000).
48

The increased awareness and sophistication of consumers has created the
expectation for improving quality in food products. This in turn has increased the need
for enhanced quality monitoring. Microwave sterilization is a thermal method that has
promise to produce high quality and shelf stable foods (Zhang, Datta, Taub, & Doona,
2001; Guan et al., 2003). To design new thermal processes that ensure adequate sterility
for shelf stable foods, it is necessary to determine the locations of cold and hot spots
during microwave sterilization. The cold spot is the region which receives the lowest
thermal energy and the hot spot is the region of highest thermal energy reception. In order
to meets the stringent requirement of food regulatory bodies, there is a need to develop
reliable and rapid methods to determine the heating pattern, especially the location of
cold spots.
A chemical marker method was developed at the United States Army Natick
Research Center (Kim & Taub, 1993) to correlate heating intensity with development of
brown color through the Maillard reaction. The chemical marker M-2 (4-hydroxy-5-
methyl-3(2H) furanone) is formed by reaction between D-ribose and amines through non-
enzymatic browning reaction after enolization under low acid condition (pH>5). The
yield of M-2 can be used as means to detect the degree of thermal treatment at any
location of processed homogeneous foods.
High performance liquid chromatography (HPLC) can be used to determine the
chemical marker yield (M-2 yield) at different locations of microwave-sterilized food
(Pandit, Tang, Mikhaylenko, & Liu, 2006). It was observed that HPLC analysis is a
costly and time consuming method to determine the heating pattern. A rapid analysis of
the heating pattern for different layers of processed foods was not possible by HPLC
49

method. Automated visual inspection may be the best possible option because of its cost
effectiveness, consistency, superior speed and accuracy.
This study deals with the application of Image Acquisition (IMAQ) Vision
Builder software, digital imagine systems, and chemical marker M-2 yield as a tool to
map heating patterns of thermally treated homogeneous food products. Specific
objectives of this study were as follows: 1) to establish a relationship between thermal
cumulative lethality (Fo) and chemical marker (M-2) yield 2) to develop a novel method
using computer vision systems and chemical marker (M-2) yield to locate the cold/hot
spots. 3) to verify the specified cold/hot spots locations.
This information will help in evaluating the heating uniformity as well developing
a monitoring procedure to ensure safe level of microwave sterilization.
2. Materials and methods 2.1. M-2 marker yield as a coloring agent
Instant mashed-potato flakes acquired from Oregon/Washington Potatoes Co.
(Boardman, OR) was selected as the model food and the accumulation of M-2 marker
yield as a coloring agent to quantify the amount of thermal energy at a point. The mashed
potato sample was prepared with 1.5 % D-ribose and a moisture content of 83.12 % (wb).
Polymeric trays 14 × 9.5 × 2.67 cm (7 oz) were filled with 200 g of mashed potato and
vacuum-sealed at 18 inch of Hg vacuum. Each tray was fitted with a thermowell located
in the middle to monitor temperature at the single point using a fiber-optic temperature
sensor. The single-mode 915 MHz microwave sterilization system developed at
Washington State University, Pullman, WA was used a source of energy and trays were
50

kept in stationary at the center of pressurized microwave cavity. Trays were heated to
various Fo values ranging from 3.7 to 18.
Fo is a quantitative measurement of the degree of cumulative thermal lethality
which is explained as (Holdsworth, 1997):
Fo = dtt
zTT ref
∫−
0
10 (1)
where z is defined as change in temperature to increase the rate of inactivation by a factor
of ten (Holdsworth, 1997). T is a temperature in oC at any time t during microwave
heating. For thermal processes to produce shelf-stable low acid foods, C. botulinum type
A and B are the targeted bacteria, z for this bacterium is about 10 oC and Tref is
considered as 121.1 oC (Prescott, Harley, & Klein, 2002). Typically, in commercial
canning practices, Fo varies between 3 to 12 min depending upon raw material and
storage conditions for the processed foods.
The temperature history of the monitored point was saved at two second intervals
in each experiment. A sample weight between 0.20 to 0.21 g was taken out precisely
from the region around the sensor tip for HPLC analysis. M-2 marker yield for each Fo at
any given power level was calculated from M-2 peak area obtained after HPLC analysis.
Chemical marker (M-2) yield was expressed as mg/g of sample using slope of the
calibration curve established for a commercial chemical marker sample by Givaudan
Flavor Corporation (Cincinnati, Ohio). Mathematically yield of chemical marker (M-2)
during heating process is expressed as:
∫ −−−×−−= ∞∞
t
o
aoo dt
TtTRE
kCCCtC0
}])1)(
1[(exp{exp)()( (2)
51

where C (t) is marker yield at any time, C∞ marker yield at saturation, Ea is energy of
activation, R molar gas constant, T(t) is recorded temperature-time history at the
measured point, To is reference temperature. Initial marker yield before heating, Co, was
determined as zero for mashed potato sample with 1.5 % D-ribose. Kinetic parameters
were calculated using statistical analysis (Lau et al., 2003; Wang, Lau, Tang, & Mao,
2004; Pandit, Tang, Mikhaylenko, & Liu, 2006) software SAS System Release 8.1 (SAS
Institutes, CARY, NC, 2000).
Experiments were also conducted to correlate the intensity of color measured
using IMAQ vision builder software and degree of thermal lethality (Fo) during
microwave sterilization. Mashed potato with 1.5 % D-ribose in 7 oz trays with fiber optic
temperature sensors fitted in the center of trays were sterilized for various level of Fo.
IMAQ vision builder software was used to determine the color value at the tip of the fiber
optic probes for each level of Fo.
2.2. Microwave as a source of energy
Ten ounce trays (14 × 9.5 × 3.3 cm) were selected for studying the heating pattern
of the sterilization process in the pilot-scale scale 915 MHz microwave sterilization
system. Mashed potato samples with 1.5 % D-ribose were prepared with three different
salt content levels: 0, 0.5 and 1 %. Salt concentration was changed to alter the dielectric
loss of the mashed potato so that the study can be applied to a broad range of
homogenous foods with different dielectric properties. Trays were heated at 2.67 kW
power levels with a repeatable heating pattern. Fiber optic sensors were fitted at the
center of each tray and the trays were heated to a temperature of 121 ± 2 oC. After
52

heating up to the set temperature, trays were rapidly cooled down to room temperature
and taken out from the microwave cavities. To stop further chemical marker formation as
well as to harden the processed mashed potatoes, the microwave processed trays were
cooled in the deep-freezer at -35 oC for 30-45 minutes. Hardening of the processed trays
in the deep-freezer made it easy to cut the mashed potatoes into layers. In this study, the
mashed potatoes were cut into vertical and middle layers and pictures of each layer were
taken to analyze the results.
2.3. Image processing system configuration Computer vision systems generally consist of five basic components: a digital
camera, an image capturing box, illumination, computer hardware and software as shown
in Fig. 1. A digital camera (Olympus C -750 Ultra Zoom) was set on top of a wooden box
(40 × 30 × 24 cm) and an illuminating round light was mounted inside the box. The
resolution of digital camera was 2288 ×1712 pixel. Even illumination is an important
prerequisite in image acquisition for food quality evaluation. A wide variety of light
sources and lighting arrangements are available (Tao, Chance, & Liu, 1995). The quality
of the captured image can be greatly affected by the lighting condition and a well-
designed illumination system can help to improve the success of the image analysis by
enhancing the image contrast (Novini, 1995). The camera was mounted perpendicular to
the surface of the tray. The lighting system was arranged to provide the contrast
necessary between the object under inspection and the background. The used camera was
providing enough resolution to meet the minimum requirements of the software. National
53
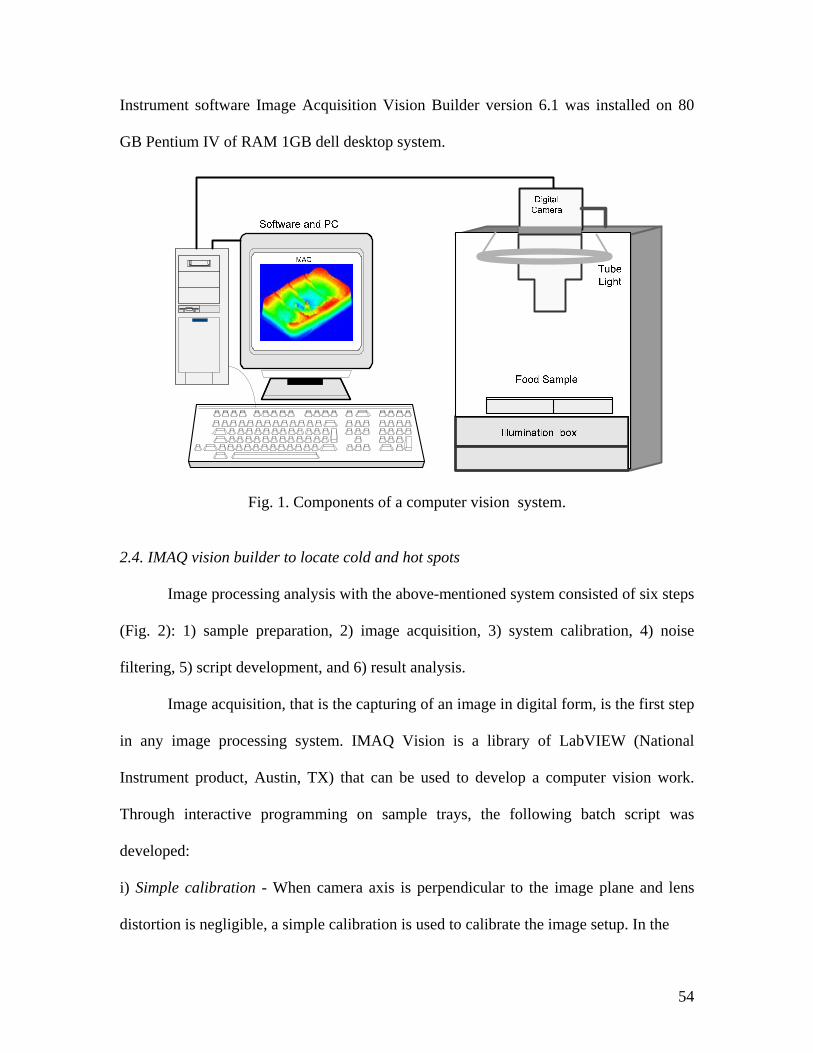
Instrument software Image Acquisition Vision Builder version 6.1 was installed on 80
GB Pentium IV of RAM 1GB dell desktop system.
Fig. 1. Components of a computer vision system.
2.4. IMAQ vision builder to locate cold and hot spots
Image processing analysis with the above-mentioned system consisted of six steps
(Fig. 2): 1) sample preparation, 2) image acquisition, 3) system calibration, 4) noise
filtering, 5) script development, and 6) result analysis.
Image acquisition, that is the capturing of an image in digital form, is the first step
in any image processing system. IMAQ Vision is a library of LabVIEW (National
Instrument product, Austin, TX) that can be used to develop a computer vision work.
Through interactive programming on sample trays, the following batch script was
developed:
i) Simple calibration - When camera axis is perpendicular to the image plane and lens
distortion is negligible, a simple calibration is used to calibrate the image setup. In the
54

sample calibration, a pixel coordinate is transformed to a real-world coordinates through
scaling in the x and y directions. To express measurements in real-world units; a
coordinate system was defined by specifying origin, angle, and axis direction.
ii) Extract color planes: HSL - saturation breaks down a color image into various set of
primary components such as HSL (Hue, Saturation, and Luminance). Each component
becomes an 8-bit image that can be processed as gray scale image. Two principal factors-
the coupling of the intensity component from the color information and close relationship
between chromaticity and human perception of color makes the HSL space ideal for
developing machine vision applications.
iii) Image mask-from ROI - Region of interest (ROI) is an area of an image in which we
want to focus our image analysis. ROI can be defined interactively, programmatically, or
with an image mask; and an area of the image that is graphically selected from a window
displaying the image.
iv) Look up table (LUT) Equalize- to highlight image details in an area containing
significant information at the expense of the other areas. A LUT transformation converts
input grayscale values in the source image into other grayscale values in the transformed
image. IMAQ Vision provides four VI’s that directly or indirectly apply lookup tables to
images. IMAQ Equalize distributes the grayscale values evenly within a given grayscale
range. This is used to increase the contrast in image.
v) Gray morphology-Dilate - Grayscale morphology helps in removing or enhancing
isolated features. Grayscale morphological transformations compare a pixel to those
pixels surrounding it. The transformation keeps the smallest pixel values when
performing erosion or keeps the largest pixel values when performing dilation. Dilation
55

increases the brightness of pixels surrounded by neighbors with a higher intensity. They
mainly are used to delineate objects and prepare them for quantitative inspection analysis.
vi) FFT filters-truncate low pass-Fast Fourier Transform (FFT) is used to convert an
image into its frequency domain. An image can have extraneous noise, such as periodic
stripes, introduced during the digitization process. In the frequency domain, the periodic
pattern is reduced to a limited set of high spatial frequencies.
A low pass frequency filter attenuates or removes high frequencies present in the
FFT (Fast Fourier’s Transforms) plane. This filter suppresses information related to rapid
variation of light intensities in the spatial image i.e., frequency components above the
ideal cut-off frequency are removed, and the frequency component below it remains
unaltered. This generally helps in smoothing the sharp edges.
vii) Advance morphology-Remove small objects- Morphological transformations extract
and alter the structure of objects in an image. We can use these transformations to prepare
objects for quantitative analysis, observe the geometry of regions, and extract the
simplest forms for modeling and identification purposes. The advanced morphology
functions are conditional combinations of fundamental transformations such as the binary
erosion and dilation. This function eliminates tiny holes isolated in objects and expands
the contour of the objects based on the structuring element.
viii) Image-3D View- This function gives a pictorial color base three-dimensional heating
pattern. IMAQ Vision has several color scales to depict the heating pattern. Under this
study, the program was set so that the red color of the spectrum represents the hot area
having higher microwave thermal treatment and this region was shown as ridge region.
56

Similarly the deep blue color represents the cold area having less thermal treatment and
was shown as depressed region.
Sample preparation Image acquisition System calibration
Noise filtering Script development Result Analysis
Fig. 2. Major steps involved in heating pattern analysis using computer vision. ix) Quantify- The Grayscale quantify tool provide a numeral value for the color intensity.
Interpretations of the numerical value depend on the selection of color palette. For
Rainbow color palette the number zero is assigned to deep blue and 255 to dark red.
These dimensions less numbers relatively compares the degree of color intensity varying
from deep blue to dark red.
System calibration and noise filtering were done to improve the accuracy and
visibility of the trays. After running the script for each layer results were analyzed to
locate cold and hot spots.
3. Results and discussion
For a 2.67 kW power level, experiments were conducted for various values of Fo.
At each Fo the M-2 marker yield was obtained using HPLC method. A linear correlation
(R2 = 0.97) was obtained between the accumulated marker yield and Fo (Fig. 3). The
linear relationship between Fo and the marker yield suggests that darker regions of the
tray had higher marker yield and higher degrees of thermal treatment. Similarly, lighter
57

regions had lower marker yield and lower degrees of thermal treatment. Increases in
marker yields for selected points were best fitted with linear relationship.
y = 0.01x - 0.02R2 = 0.97
0.02
0.04
0.06
0.08
0.10
4 6 8 10 12Fo ( min )
M-2
yie
ld (m
g / g
sam
ple)
Fig. 3. Relationships between M-2 yield and Fo accumulation in mashed potato during
microwave sterilization, each point represents the mean of two replicates.
A linear relationship (R2 = 0.98) was also observed between color value at the tip
of fiber optics probes (Fig. 4) and Fo. The deep red color has the highest color value and
the deep blue has the lowest color value. This result suggests that the degree of the color
intensity increases with level of the thermal treatment.
The deep blue color shows cold spot location and dark red color shows the hot
spot location (Fig. 5). It was observed that center of the middle layer in the packaged
food was less processed than the edges in each tray (Fig. 5). Cold spot was specified at
middle of middle layer and hot spot at the location close to right farther corner in ten-
ounce tray. Locations of cold and hot spots were independent to the levels of salt content.
58
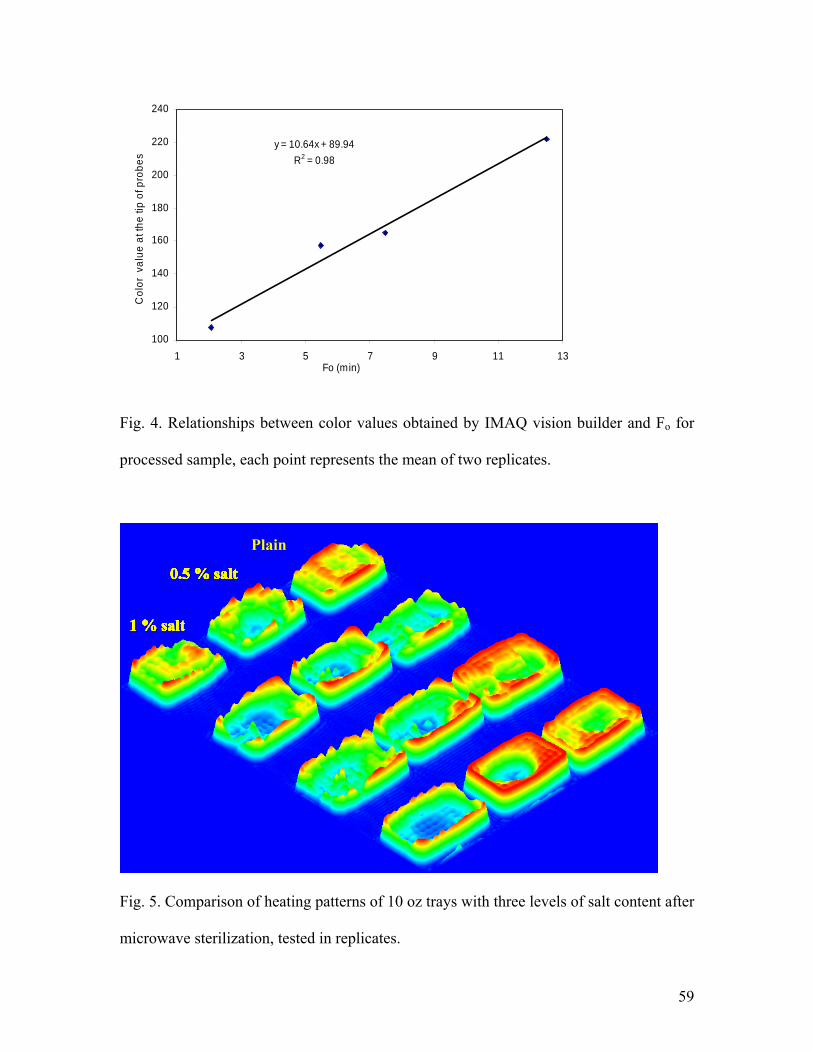
y = 10.64x + 89.94R2 = 0.98
100
120
140
160
180
200
220
240
1 3 5 7 9 11Fo (min)
Col
or v
alue
at t
he ti
p of
pro
bes
13
Fig. 4. Relationships between color values obtained by IMAQ vision builder and Fo for
processed sample, each point represents the mean of two replicates.
1 % salt 1 % salt 1 % salt 1 % salt 1 % salt 1 % salt 1 % salt 1 % salt
0.5 % salt 0.5 % salt 0.5 % salt 0.5 % salt 0.5 % salt 0.5 % salt 0.5 % salt 0.5 % salt
Plain
Fig. 5. Comparison of heating patterns of 10 oz trays with three levels of salt content after
microwave sterilization, tested in replicates.
59

4. Validation of locations specified by computer vision
In order to evaluate the accuracy of the cold and hot spot locations determined by
computer vision, experiments were conducted using microwave as a source of energy.
Experiments were carried in two replicates to test the repeatability of heating profile and
temperature difference between cold and hot spots at 2.67 kW power levels. Fiber optic
temperature sensors were inserted at those two selected specified locations and
experiments were carried at 2.67 kW power level.
0
20
40
60
80
100
120
140
0 5 10 15 20
Time (min)
Tem
pera
ture
( o C
)
hot spot
cold spot
Fig. 6. Heating profile of hot and cold spots locations in 10 oz trays during microwave
sterilization at 2.67 kW, tested in two replicates
The measured temperature confirmed the hot and cold spots for each replicate (Fig. 6).
To further confirm the location of the cold spot in relationship with other parts of the tray
additional 13 tests were conducted. In each case of the test four fiber optic sensors were
placed in the sample tray during sterilization process. One of the sensors was always
60

inserted at the cold spot identified by the computer vision method while the other three
were placed in the three different locations. Compiling the temperature measurement for
13 tests provided temperature of 40 points (8 × 5) evenly distributed in the middle layer
of the tray. Computer vision heating patterns and temperature mapping obtained using
fiber optic probes are compared in Fig. 7. Results showed that heating pattern and cold
spot location obtained by both methods are in good agreement. This indicates that the
novel method can indeed be used to study general heating patterns in homogeneous foods
after microwave sterilization processes.
Front of tray
Side of tray Temp.
(o C)
Side Front
a). IMAQ heating pattern b). Actual temperature profile Fig. 7. Comparison of computer vision heating patterns and actual temperature mapping
for 10 oz trays.
61
5. Conclusions In this paper, a novel approach has been developed to determine the heating
pattern using the chemical marker M-2, digital imaging, and computer vision software
(IMAQ) vision builder. A linear correlation was obtained between the M-2 marker yield
and the degree of thermal treatment (Fo), which suggests that darker color corresponds to
higher thermal lethality. Relationship between color at the tip of fiber optics probe and Fo
was observed as linear. Locations of cold and hot spots obtained after image processing
were also verified using fiber-optic temperature sensors. Locations of the cold and hot
spots specified by computer vision matched well with temperature measurements using
fiber optics probes. The experiments prove that computer vision (IMAQ Vision Builder)
with the chemical marker M-2 and other accessories can be used as an effective tool to
identify the location of cold and hot spots in microwave processed foods. Due to its cost
effectiveness, consistency, fast speed and accuracy in comparison to HPLC, this method
can be considered as the best option to determine the heating pattern.
Acknowledgements This research work was supported by US Army Natick Soldier Center, Natick,
MA, Kraft Foods, IL, Ferrite components, NH, Master Foods, CA, Ocean Beauty Sea
Foods, WA, Graphics Packaging, CO, Rexam Containers, MO, and Washington State
University Agricultural Research Center.
62

Nomenclature C marker yield (gm/ ml of sample)
oC initial marker yield (gm/ ml of sample)
∞C marker yield at saturation (gm/ ml of sample)
Ea activation energy (kcal mol-1)
Fo cumulative thermal lethality (min)
ko reaction constant at reference
LUT look up table
R universal gas constant at reference temperature (cal/mol K)
t time (min)
To reference temperature
T temperature (K)
References Ballard, D. A., & Brown, C. M. (1982). Computer vision. Englewood Cliffs, NJ, USA:
Prentice-Hall
Du, C.-J., & Sun, D.-W. (2004). Recent developments in the application of Image
processing techniques for food quality evaluation. Trends in Food Science and
Technology, 15, 230-249.
Gonzalez, R., & Wintz, O. (1991). Digital image processing (3rd ed.). Massachusetts:
Addison-Wesley Publishing Co.
63

Guan, D., Gray, P., Kang, D. H, Tang, J., Shafer, B., Younce, F., & Yang, C.S. (2003).
Microbiological validation of microwave-circulated water combination heating
technology by inoculated pack studies. Journal of Food Sci 68(4), 1428-1432.
Gunasekaran, S. (1996). Computer vision technology for food quality assurance. Trends
in Food Science and Technology, 7(8), 245-246.
Haralick, R. M., & Shapiro, L. G. (1992). Computer and Robot Vision. Addison-Wesley
Publishing Company, Reading, MA, USA.
Holdsworth, S. D. (1997). Sterilization, pasteurization and cooking criteria. Thermal
Processing of Packaged Foods. (pp. 99-110). New York, USA: Blackie Academic
and Professional.
Kim, H. J., & Taub, I. A. (1993). Intrinsic chemical markers for aseptic processing of
particulate foods. Food Technology, 47(1), 91– 99.
Lau, M. H., Tang, J., Taub, I. A., Yang, T. C. S., Edwards, C. G., & Mao, R. (2003).
Kinetics of chemical marker formation in whey protein gels for studying high
temperature short time microwave sterilization. Journal of Food Engineering,
60, 397-405.
Locht, P., Thomsen, K., & Mikkelsen, P. (1997). Full color image analysis as a tool for
quality control and process development in the food industry. In 1997 ASAE
Annual International Meeting, Paper No. 973006. St. Joseph, Michigan, USA:
ASAE.
Novini, A. (1995). The latest in vision technology in today’s food and beverage container
manufacturing industry. In Food Processing Automation IV Proceeding of the
1995 Conference. St Joseph, Michigan, USA: ASAE.
64

Pandit, R. B., Tang, J., Mikhaylenko, G., & Liu F. (2006). Kinetics of chemical marker
M-2 formation in mashed potato-a tool to locate cold spots under microwave
sterilization. Journal of Food Engineering. 76(3): 353-361.
Prescot, L. M, Harley, J. P., Klein, D. A. (2002). Control of microorganisms by physical
and chemical agents. Microbilogy (pp. 174-151). New York: McGraw Hill.
Sonka, M., Hlavac, V., & Boyle, R. (1999). Image Processing, Analysis and Machine
Vision. California, USA: PWS Publishing.
Sun, D.-W. (2000). Inspecting pizza topping percentage and distribution by a computer
vision method. Journal of Food Engineering, 44, 245-249.
Tao, Y., Chance, L., & Liu, B. (1995). Full-scale fruit vision sorting system design-
factors and considerations. In Proceeding of the Food Processing Automation
Conference IV (pp. 14-22). St Joseph, Michigan, USA: ASAE.
Wang, Y., Lau, M. H., Tang J., & Mao, R. (2004). Kinetics of chemical marker M-1
formation in whey protein gels for developing sterilization processes based on
dielectric heating. Journal of Food Engineering, 64, 111-118.
Zhang, H., Datta, A. K., Taub, I. A., & Doona, C. (2001). Electromagnetic, Heat
Transfer, and Thermokinetics in Microwave Sterilization. AICHE Journal, 47(9),
1957-1968.
65

CHAPTER 4
SENSITIVITY ANALYSIS AND VALIDATION OF COMPUTER VISION HEATING
PATTERNS FOR MICROWAVE STERILIZATION PROCESSES
R. B. Pandit, J. Tang*, H. Chen, H-C, Jung, F. Liu Presented in ASABE Annual International meeting, July 17-20, Tampa, Florida, USA.
Paper Number: 056145.
*Department of Biological Systems Engineering, Washington State University, 213 L J Smith
Hall, Pullman, WA 99164-6120, USA.
Abstract
To develop a computer vision method for evaluating the heating characteristic of
microwave sterilization system, it is necessary to identify and validate the locations of the
cold and hot spots for different sizes of tray for food products of differing composition,
most importantly, salts levels. A computer vision method based on the yield of chemical
marker M-2 was used to determine the location of cold and hot spots in microwave
sterilized trays. Locations of the identified cold and the hot spots were tested by changing
the dielectric properties of mashed potato. Addition of salt changed the dielectric loss
significantly but the heating patterns were not affected by the salt level. An inoculated
pack study was performed to detect the number of survivors at the cold spot location
specified by computer vision method. A finite difference time domain software
QuickWave-3D was used to match the computer vision heating patterns for stationary
states. The time-temperature trends of the cold and hot spots were compared during
microwave sterilization process. Microbiological validation and real temperature
measurement confirmed the identified cold spot locations. This study provided

convincing results to indicate that computer vision method can be used to predict the cold
spot location for microwave sterilized foods.
Keywords: Automated machine vision; Computer or machine vision; Chemical marker
M-2 yield; Cold and hot spots; Microwave heating pattern; Sterilization; FDTD method;
M-2 Kinetics; Image analysis
1. Introduction
Microwave sterilization is a thermal method that has promise to produce high
quality and shelf stable foods ( Guan et al., 2004 & 2003) Pathak, Liu, & Tang, 2003;
Zhang & Datta, 2000; Datta & Anantheswaran, 2001). The sterilization process is a
complex physical phenomenon dependent on dielectric properties of foods and
configuration of microwave cavities. (Lin, Anantheswar, & Puri, 1995; Zhou, Puri,
Anantheswarn, & Yeh, 1995; Pandit, & Prasad 2003). Contrary to conventional heating
methods, microwave heating delivers much faster rate of heating. However, the corollary
of the volumetric heating method is that if uneven heating occurs, the location of cold or
hot spots may vary and depend on product geometry (Campañone, & Zaritky, 2004;
Yang, & Gunasekaran, 2004). Being a fast method of sterilization if a food process does
not get sufficient time to equilibrate by the end of heating operation, may results into
development of cold or hot spots (Ma, Paul, & Pothecary, 1995). Microbes can survive at
cold spot while food quality degradation may occur at hot spot (Ghani, Farid, & Chen,
2002; Sale, 1976). Sterilization as a method to guarantee lethality temperatures (121 oC)
67

for microorganism, overheating occurring in hot spots zones can cause quality losses
(Ayappa, Davis, Crapisite, Davis, & Gordon, 1991; Dinčov, Parrott, & Pericleous, 2004).
Multi-point online monitoring of time temperature profile in industrial scale
microwave sterilization system was meticulous task. Metallic thermocouples can not be
placed in microwave field while fiber optics probes are expensive and inconvenient to
monitor multiple points in a tray. High performance liquid chromatography (HPLC) can
be used as an indirect means to determine chemical marker (M-2) yield in process trays.
But using HPLC method was time and resource consuming (Pandit, Tang, Mikhaylenko,
& Liu, 2006). In order to meet the stringent requirements of food regulation bodies for
sterilization processes of food products much effort at both industry and academic level
has been made to design a method to determine the location of cold and hot spots (John,
Maria, Ruth, & Andrew, 1999; Oliveira, & Franca, 2002; Munkevik, Hall, & Duckett,
2005; Yam, & Papadakis, 2004; Fernandez, Castillero, & Aguilera, 2005). Microwave
Heating Group at Washington State University (Pullman, WA) has developed a computer
vision method based on chemical marker M-2 yield to locate the cold spot (Pandit, Tang,
Liu, & Pitts, 2007).
Previous studies involved kinetics of chemical marker M-2 formation with
mashed potato followed by development of a novel approach to determine the heating
patterns using computer vision method based on chemical marker (M-2) yield (Pandit,
Tang, Mikhaylenko, & Liu, 2006 ; Pandit, Tang, Liu, & Pitts, 2007 ). The specific
objectives of this study were 1) to determine the locations of cold and hot spots with
different sizes of trays using computer vision method; 2) to investigate the effect of salt
68
levels on cold/hot spots locations, and 3) to validate the specified cold spots locations
using simulation, microbial study and fiber optics temperature measurement sensors.
This study can be used as a protocol to evaluate the heating patterns of
sterilization system with combinations of tray size, salt levels, and MW power levels.
2. Materials and methods
Investing the nature and locations of cold spots for different size of trays are
needed to ensure safe level of microwave sterilization process. Variation of heating
patterns with different sizes of trays as affected by salt contents was considered in this
study to test the sensitivity of heating patterns to dielectric properties changes.
2.1. Effect of salt content on chemical marker M-2 yield Amino acids (Lysine, Arginine, Histidine and Methionine) and D-ribose are
principal reactants in chemical marker M-2 formation (Kim, & Taub, 1993). Instant
mashed-potato flakes acquired from Oregon/Washington Potatoes Co. (Boardman, OR)
was selected as a model food and accumulated M-2 yield as a coloring agent to quantify
the amount of thermal energy at a point (Lau et al, 2003). Mashed potato (15.38 % )
sample was prepared with 1.5 % D-ribose and with a moisture content of 83.12 % (w.b).
Chemical marker yield for the reaction was also studied in this research in presence of
salt. Capillary tubes filled with mashed potato sample for 0.0, 1.0 % levels of salt were
heated in oil bath at 121 oC and were taken out from the oil bath at intervals of 5 minutes.
Chemical marker M-2 yield of the extracted mashed potato sample was determined using
69

HPLC method (Agilent Technology, USA) (Pandit, Tang, Mikhaylenko, & Liu, 2006).
Each test was duplicated.
2.2. Dielectric properties measurement
Dielectric properties of mashed potato supplies were determined over range of
temperatures from 20 to 121 ºC at 1 to 1800 MHz using a Hewlett-Packard 85070B open
ended coaxial probe connected to an Agilent 4291B Impedance Analyzer (Agilent
Technologies, Inc., Palo Alto, CA). Mashed potato sample with 0.5 %, 1 % salt added
and 1.5 % D-ribose composition was prepared for measuring dielectric properties at 915
MHz in two replicates (Guan, Cheng, Wang, &Tang, 2004). Detailed description of the
calibration and measurement procedure is provided in Wang, Wig, Tang, Hallberg
(2003).
2.3.Microwave sterilization of mashed potato samples
Seven ounce (14 × 9.5 × 2.67 cm), ten ounce (14 × 9.5 × 3.3 cm), thirteen ounce
(14 × 9.5 × 4.2 cm) and twenty ounce (19.5 × 14.4 × 3.2 cm) plastic trays were filled
with 200 g, 300 g, 400 g and 600 g of mashed potato sample respectively. Trays were
vacuum-sealed at 18 inch of Hg vacuum twice with time setting of 3 and 1 second. To
measure the sample temperature using optical fiber sensors (Fiso Technologies, Inc.
Quebec, Canada)., a polyimide tubing of outer diameter 0.075 inch (Cole-Parmer, IL,
USA) was sealed at one end using silicone sealant (Dow Corning, Midland, MI, USA).
The tube was inserted through a hole in the side of the tray so that the temperature of the
located point can be monitored. Twenty ounce trays had two fiber-optic probes, one
70

fitted in middle and another close in one end to left side of the tray. Experiments were
conducted in a 915 MHz single mode water circulated microwave heating system at 2.67
kW power level with 35 liter per minute flow rate of water at 125 oC temperatures. To
investigate the heating patterns of 180 and zero degree phase shift, trays were situated at
the center of the cavities during microwave heating. In order to study the combined effect
of phase shift the tray support was moved from 180 degree to zero degree phase shift
cavity. Initial temperature of sample was 22 ± 1 o C. Speed of the tray support was set to
0.23 inch per second so that temperature at middle point in holding section could reach to
121 o C. The tray support was made of the Tempalux material ( Ultem Polyetherimide
Resin, Lenni, PA, USA). Ultum tray support held four trays across length of size 7, 10,
13 oz trays or two trays along length for 20 oz trays. After reaching the sterilization
temperature (121 oC) processed trays were cooled fast by passing the tap water at 16 oC
through the cavity. Fast cooling minimizes formation of chemical marker M-2. Processed
trays were stored in the deep-freezer at -35 oC for 60 minutes to harden the mashed potato
before cutting into the layers. Trays were cut into vertical, middle and bottom layers and
images of each layer were taken using digital camera (Olympus C -750 Ultra Zoom)
mounted with computer vision system.
2.4.Computer vision heating patterns based on chemical marker (M-2) yield
Location of cold spots was determined by analyzing heating patterns of middle
and bottom layers using IMAQ vision builder software (National Instrument product,
Austin, TX). Vertical layers heating patterns were used to determine microwave power
penetration, middle and bottom layer were considered to specify the location of cold and
71

hot spots for each size of tray. A script developed in IMAQ vision builder software was
used to determine the 3-D heating patterns of processed sample (Pandit, Tang, Liu, &
Pitts, 2007). Through interactive programming the script was developed by selecting
following functions tools of the IMAQ software: color plane extraction, look up table
equalize-dilate and erosion, gray morphology, filters smoothing and high-lights details,
fast Fourier’s Transform low pass filters, and grayscale quantization. Fourier’s transform
is one of the most important tools which have been extensively used not only for
understanding the nature of an image and its formation but also for processing the image.
The two-dimensional Fourier’s transform of a continuous function f (x, y) is given as
(Acharya, & Ray, 2005):
F (ω , dydxyxjyxf ])(2exp[),() ψωπψ +−= ∫ ∫+∞
∞−
+∞
∞−
) (1)
Using Euler’s formula the exponential function can be decomposed into:
exp ))(2sin())(2cos()](2[ yxjyxyxj ψωπψωπψωπ +−+=+− (2)
which implies that the function f(x, y) is essentially multiplied by the terms cos(2 xωπ )
cos (2 )yπψ , sin(2 xωπ ) sin (2 )yπψ , sin(2 xωπ ) cos (2 )yπψ , and cos(2 xωπ ) sin (2
)yπψ . If the function is doubly symmetric function along both the X and Y directions,
then Fourier transform of f(x, y) involves only the multiplication of cos(2 xωπ ) cos (2
)yπψ term. During this study the f(x, y) multiplication involved all four terms. Thus
integrand F ( ),ψω gives the limit summation of an infinite number of sine and cosine
terms. The variable ω in Eq.1 denotes number of waves per unit length in X direction,
and ψ indicates the number of waves along the Y direction. For a certain pair of
72

frequency components (ω ,ψ ) the integrand gives amplitude of the chosen component.
The amplitude spectrum of two dimensional function is:
),(),(),( 22 ψωψωψω IRF += (3)
where R ( ),ψω is real part and I( ),ψω is an imaginary part of the F ( ),ψω . Low pass
filtration of the image was done by taking the weighted average of the neighborhood
pixels. The output image in that case would be expressed as:
g(m, n) = (4) Wknkmfka ∈−−∑∑ )1,(),1,()1,(
where f(m, n) and g(m, n) are the input and output images respectively, W is
neighborhood around the pixel at location (m, n), and a(k, 1) are the filters weights. All
weights were assigned equal values in this study and in that case equation (4) reduced to:
g(m, n) = WknkmfN
∈−−∑∑ )1,(),1,(1 (5)
where N is the number of pixels in the neighborhood W. The spatial averaging operation
on an image was used to smooth the noise. If an observed image is given as:
g (m, n) = f (m, n) + η (m , n) (6)
then the spatial average will be calculated as:
g(m, n) = WknmnkmfN
∈+−−−
∑∑ )1,(),,()1,(1 η (7)
where is the spatial average of the noise component η (m, n). ),( nm−
η
The dark red color of the rainbow color palette was set in the pattern to depict hot
spot region and deep blue as a cold spot region. For each size of tray two replicates at
each salt level were analyzed to determine the cold spot. The middle layer of each tray
was divided into rectangular grids of 8 × 5 (rows × column) and color value equivalent to
73

grayscale value of each grid was obtained using IMAQ vision software. A grid common
in each tray with lowest color value for each level of salt was considered as the cold spot.
Similarly, the hot spot was detected as rectangular grid common in each tray with highest
color value. Distances of the middle point of the region identified as cold spot and hot
spot were measured in Cartesian co-ordinate system using IMAQ vision builder software.
2.5. FDTD simulation using QW-3D
Heating patterns based on computer vision analysis were compared with the absorbed
power distribution patterns using QuickWave-3D program. QuickWave-3D solves the
Maxwell equation using the finite difference time domain method (FDTD). It makes use
of finite difference approximation to electric and magnetic fields components, which are
staggered both in time and space domain. (Yee, 1996; Peterson, Ray, & Mitra, 1997).
Detail of the mathematical modeling and experimental validation is provided elsewhere
in Chen et al., (in press).
2.6. Microbial validation
Locations of cold spots detected by chemical markers were validated using inoculated
pack study. Clostridium sporogenes spores were inoculated in mashed potato to make a
final concentration of 7.5 × 10⁶ CFU/10 oz trays. The mashed potato and spores were
mixed thoroughly and filled into the trays. The trays were microwave processed at
different Fo values based on the thermal characteristics of the spores and the temperature
history of the potential cold spot in the mashed potato. After microwave processing, the
trays were divided into 40 small cubes (1.75 x 1.9 cm) and numbered from 1 to 40 from
74

rear side of the trays. For trays processed at low Fo values (< 3.0), the cubes were diluted
and plated on agar medium, and survivors were enumerated after incubation. Cubes from
trays with Fo values higher than 3.0 were incubated in enrichment media for 48 hours at
32˚C and presence or absence of growth was determined.
3. Results and discussion
3.1. Dielectric properties modeling
Statistical analysis of the chemical marker yield with 0.0 and 1.0 % salt confirmed
(P > 0.9988) that there was no influence of salt content on chemical marker yield (Pandit
et al., 2006). Dielectric loss of mashed potato was significantly changed by addition of
salt from 0 to 1 % (Table 1). Dielectric loss of mashed potato with 1 % salt content was
3.5 times higher than plain mashed potato at 121 oC (Table 1). The range of variation in
dielectric loss may cover a wide range of homogeneous foods namely mashed potato,
whey protein gel etc (Guan et al., 2004). Effect of food temperature (T oC) and
percentage of salt content (S) on dielectric constant (ε’) and dielectric loss (ε”) of mashed
potato were modeled. Based on coefficient of determination ( 0.999), using
statistical analysis software SAS (SAS Institute Inc., Cary, NC, 2000), the fitted models
are:
2adj.R =
= - 0.148. T + 1.45. S + 68.176 R'ε 2 = 0.999 (8)
0.00108. T ="ε 2 + 0.535. T. S + 8.6171. S + 15.3216 R2 = 0.999 (9)
where penetration depth (Dp) is the distance at which the power drops to 37 % of its
original value at the surface. Penetration depth is affected by dielectric constant,
dielectric loss factor, and operating frequency as (Tang et. al., 2002):
75
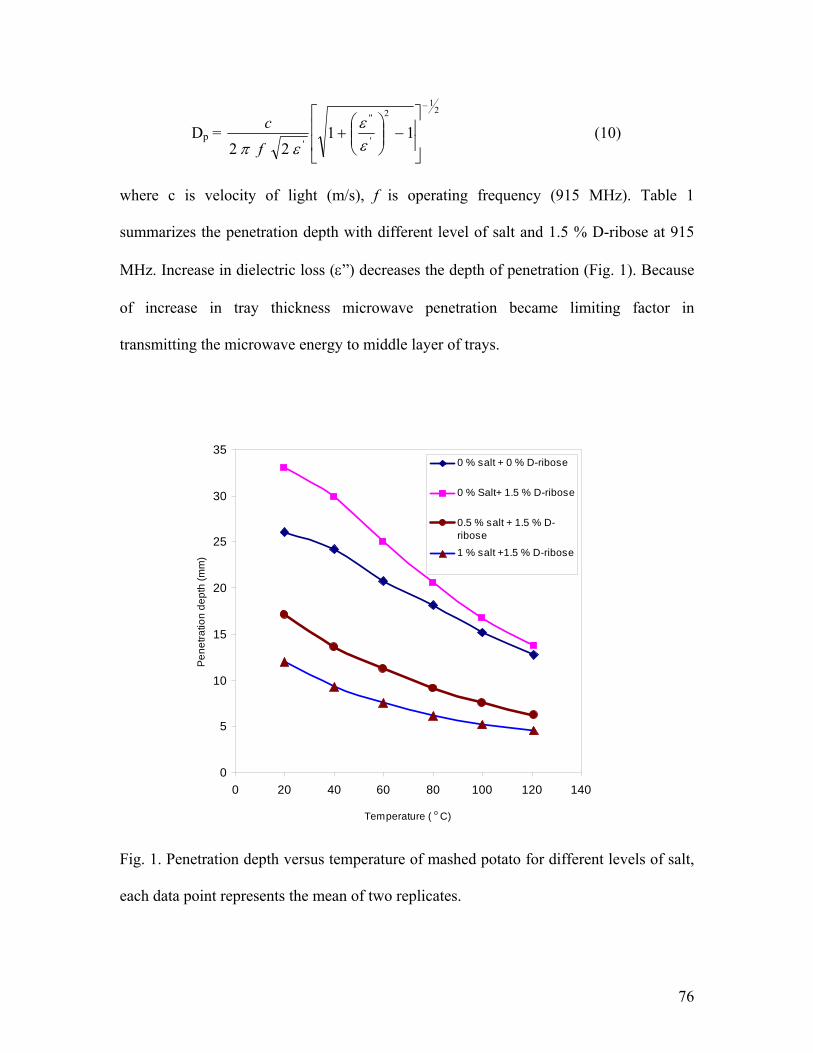
Dp = 2
12
'
"
'11
22
−
⎥⎥
⎦
⎤
⎢⎢
⎣
⎡−⎟⎟
⎠
⎞⎜⎜⎝
⎛+
εε
επ fc (10)
where c is velocity of light (m/s), f is operating frequency (915 MHz). Table 1
summarizes the penetration depth with different level of salt and 1.5 % D-ribose at 915
MHz. Increase in dielectric loss (ε”) decreases the depth of penetration (Fig. 1). Because
of increase in tray thickness microwave penetration became limiting factor in
transmitting the microwave energy to middle layer of trays.
0
5
10
15
20
25
30
35
0 20 40 60 80 100 120 140
Temperature ( o C)
Pen
etra
tion
dept
h (m
m)
0 % salt + 0 % D-ribose
0 % Salt+ 1.5 % D-ribose
0.5 % salt + 1.5 % D-ribose
1 % salt +1.5 % D-ribose
Fig. 1. Penetration depth versus temperature of mashed potato for different levels of salt,
each data point represents the mean of two replicates.
76

Table 1. Mean ± standard deviation (two replicates) of dielectric constant, dielectric
loss and penetration depth with mashed potato (83.12 % wb) at different levels of
salt (maximum 1 %) and 1.5 % D-ribose as a function of temperature at 915 MHz.
Sample
T ( o C )
ε’
ε’’
Pd
(mm)
Mashed potato + 0 % salt 20.00 70.17 ± 2.05 16.88 ± 2.95 26.05 40.00 68.44 ± 1.12 17.951 ± 3.10 24.23 60.00 63.26 ±2.43 20.218 ± 2.85 20.77 80.00 59.86 ± 2.67 22.6015 ± 1.79 18.16 100.00 56.01 ± 1.21 26.3215 ± 0.65 15.21 121.00 52.105 ± 0.36 30.695 ± 0.71 12.75
Mashed potato + 0 % salt +
20.00 66.865 ± 0.60 12.9785 ± 0.85 33.01
1.5 % D-ribose 40.00 62.925 ± 0.36 13.943 ± 0.83 29.85 60.00 59.18 ± 0.34 16.161 ± 0.85 25.05 80.00 56.26 ± 0.40 19.261 ± 0.94 20.59 100.00 53.745 ± 0.73 23.3 ± 1.80 16.77 121.00 50.85 ± 0.014 27.88 ± 2.24 13.80
Mashed potato + 0.5 % salt +
20.00 62.05 ± 7.78 24.36 ± 1.05 17.17
1.5 % D-ribose 40.00 61.925 ± 5.92 31.035 ± 0.80 13.61 60.00 62.38 ± 0 38.08 ± 0.39 11.27 80.00 54.55 ± 0.57 45.27 ± 1.97 9.12 100.00 52.79 ± 0.46 55.49 ± 1.28 7.56 121.00 51.19 ± 0.48 69.18 ± 1.85 6.24
Mashed potato + 1 % salt +
20.00 67.12 ± 2.10 36.81 ± 1.87 12.01
1.5 % D-ribose 40.00 64.795 ± 0.29 47.49 ± 2.73 9.35 60.00 61.885± 0.66 59.78 ± 2.35 7.50 80.00 58.91 ± 1.053 73.83 ± 1.82 6.18 100.00 54.605 ± 0.62 88.61 ± 1.05 5.24 121.00 51.21 ± 0.64 105.26 ± 0.53 4.54
77

Salt is strong electrolyte, which increases the electrical conductivity or rate of dissipation
(dielectric loss) of power. Increasing temperature also decreases the relaxation time of the
water molecules, which resulted into higher dielectric loss. Hence, at high salt content
(1%) in higher temperature range (>121 oC) depth of penetration was observed to be
minimum with mashed potato (Fig. 1).
3.2. Cold spots location in each size of tray
Microwave penetration was sufficient to reach the energy to middle layers in
mashed potato sample and heating patterns were similar for all levels of salts in 10 oz
trays. For cold spot determination, distances were measured considering the left bottom
corner of the middle layer of the mashed potato sample as the reference point i.e., (x = 0,
y=0). Cold spots for seven-ounce tray was located at x =1.5 cm, y = 4.45 cm and hot spot
at x = 1.35 cm, y =13.05 cm. For 10 and 13 oz trays heating patterns were similar to
conventional heating i.e., cold spot was observed in middle of the tray (Fig. 2). Due to
limitation on microwave power penetration middle layer of thirteen ounce tray received
lesser energy. Combined affects of both hot water and 180 degree phase shift were
creating dominant edge heating in thirteen ounce tray until middle layer reached to 121
oC. Location of cold spot and hot spot were obtained in middle layers at x = 6.82 cm, y =
4.75 cm and x = 1.35 cm, y = 13.05 cm for both 14 × 9.5 × 3.3 cm and 14 × 9.5 × 4.2 cm
trays. Cold spot area was much wider and appearing with increasing level of salt.
Thirteen-ounce tray with 1% salt level had lowest power penetration and significant edge
heating. Cold spot was observed at x =12 cm, y = 12 cm and hot spot at x = 11 cm, y =
1.35 cm with 20 oz tray. Heating patterns were repeatable for each level of salt (Fig. 3).
78

Plain
0.5 % salt
1 % salt
Fig. 2. Computer vision heating patterns of middle layers for three different levels of salt
with 14 × 9.5 × 4.2 cm tray at 2.67 kW microwave power level, tested in two replicates.
0.5 % salt
1 % salt
Fig. 3. Computer vision heating patterns of middle layers with two different levels of salt
with 19.5 × 14.4 × 3.2 cm tray at 2.67 kW microwave power level, tested in two
replicates.
79

3.3. Effect of tray size and system configuration on heating patterns
Locations of cold spots were dependent on the size of food packages, orientation
of the tray and configuration of the microwave sterilization cavity. Boundary regions
were receiving higher amount of energy for each size of food package. Hot water (125
oC) and 180 degree phase shift both had combined affect on edge heating. Hot spots were
located at right farthest corner for each size of package. Considerably, edge heating can
be minimized by lowering the hot water temperature or by changing of degree of phase
shift. Application of zero degree phase shift for both the cavities would be the best
option to improve the degree of uniformity.
0
20
40
60
80
100
120
140
0 5 10 15 20 25Time [min]
Para
met
ers
Hot spot
Cold spot
Fig. 4. Temperature measured by fiber optics probes at cold spot x =12 cm, y = 12 cm
and hot spot x = 11 cm, y = 1.35 cm in 20 oz tray specified by computer vision method in
the middle of trays during microwave sterilization, tested in two replicates.
80

3.4. Heating patterns validation The temperature measured by fiber optics probe confirmed the hot and cold spots
for each replicate. Computer vision heating patterns and temperature mapping obtained
using fiber optics are compared in Fig. 6 for middle layers. Computer vision heating
patterns and cold spot location obtained by fiber optics probes are in good agreement.
a) Computer vision heating pattern b) Microwave power absorption
using QW-3D
Fig. 5. Matching of computer vision heating patterns and QW-3D power absorption
patterns for middle layer of 14 × 9.5 × 3.3 cm tray inside the zero degree phase shift
cavity in stationary state.
81

a) Computer vision heating pattern b) Microwave power absorption
using QW-3D
Fig. 6. Matching of computer vision heating patterns and QW-3D power absorption
patterns for middle layer of 14 × 9.5 × 3.3 tray inside the 180 degree phase shift cavity in
stationary state.
Fig. 5 and Fig. 6 shows matches between heating patterns of developed chemical marker
method and simulation for zero and 180 degree phase shift cavities in stationary state.
Heating patters comparisons were made only for middle layer of the mashed potato
sample. Matching of the QW-3D absorbed power distribution patterns with computer
vision heating patterns shows this method can indeed be used as an optional means to
determine the heating patterns of foods rapidly and accurately.
3.5. Results of microbial validation
D-value and z value of the spore in mashed potato were found to be 1.02 min at
121 oC and 10.79 oC respectively. Based on the D121-value of the spore in mashed potato,
for 7.5 × 10⁶ CFU microbial concentration of target Fo was set to 7.7 min. Number of
82

survivors was counted at each cube during enumeration. For the trays processed higher
than Fo 3 min, no survivors were detected. Survivors were detected at cold spot for trays
processed at low Fo (< 3 min). The location of cubes showing survivals or growth was
compared to that determined by heating patterns using chemical marker yield and
computer vision system. The microbiological validation also supported the cold spots
locations specified by the computer vision method (Fig. 7).
a) dark blue region showing cold spot b) Cold spot location observed in
in computer vision heating patters microbial validation
Fig. 7. A cold spot location identified by computer vision was observed as cold spot in
microbial validation study ( ).
83

Table 2. Positive growth of spores was shouted in microbial validation at cold spot
location identified by computer vision method in case of under process sample
during microwave sterilization.
Inoculated
levels of
spores/300g
Process levels
Designed
sterilization
value (SV)
Number of
potato cubes
Number of
positive
growth
7.5 × 10⁶ Under target 3.21 40 4
7.5 × 10⁶ Target 7.78 40 0
7.5 × 10⁶ Target 8.64 40 0
7.5 × 10⁶ Over target 12.66 40 0
4. Conclusions
A computer vision method based on yield of chemical marker M-2 was used to
locate cold and hot spots with different sizes of tray in microwave sterilization system.
Locations of cold and hot spots were found to be independent to the salt contents for each
case. Hot water at 125 oC and 180 degree phase shift combined created edge heating,
which caused hot spot close to the edge in each tray. Heating patterns were found to be
sensitive to the cavity configuration and tray support structure. Temperature measured at
specified locations by fiber optics probes confirmed the hot and cold spots for each
replicate. Power distribution pattern using QW-3D and heating pattern by computer
vision were matching well for stationary state. Confirmation of the locations specified by
computer vision using QW-3D software, fiber optics probes and microbial validations
84

proved this method as potential means to identify cold spots in microwave sterilization
processes.
Acknowledgements This research work was supported by US Army Natick Soldier Center, Natick,
MA, and WSU microwave sterilization consortium that consists of Kraft Foods, IL,
Ferrite components, NH, Hormel Foods, MN, Master Foods, CA, Ocean Beauty Sea
Foods, WA, Graphics Packaging, CO, Rexam Containers, MO, and Washington State
University.
85

Nomenclature 'ε dielectric constant
"ε dielectric loss
ω number of waves per unit length in X direction,
ψ number of waves along the Y direction.
oC degree centigrade
c speed of light (m /s)
Dp depth of penetration (cm)
F ( ),ψω Fourier’s transforms of the function f (x, y)
Fo cumulative lethality (min)
f operating frequency
Po microwave power absorption density (w / m3 )
S salt content ( % )
t time (min)
T temperature (o C )
References Acharya, T., & Ray, A., K. (2005). Image Transformation. Image Processing Principles
and Application. John Wiley & Sons, Inc., Publication, Hoboken, New Jersey.
Ayappa, K. G., Davis, H. T., Crapisite, G., Davis, E. A., & Gordon, J. (1991).
Microwave heating: An evaluation of power formulations. Chemical
Engineering Science, 46 (4): 1005-1016.
86

Campañone, L. A., & Zaritzky, N. E. (2005). Mathematical analysis of microwave
power heating process. Journal of Food Engineering. 69(3), 359-368.
Chen, H., Tang, J., Liu, F., & Hudson, S. (In press). Coupled simulation of microwave
heating process using FDTD method and its experiment validation. IEEE-
Microwave theory and Technology.
Datta, A. K., & Anantheswaran, R. C. (2001). Handbook of Microwave Technology for
Food Application, Marker Dekker, Inc. New York: Dekker Inc. Basel. 72.
Dinčov, D. D., Parrott, K. A., & Pericleous, K. A, (2004). Heat and mass transfer in two-
phase porous materials under intensive microwave heating. Journal of Food
Engineering, 65 (3): 403-412.
Fernàndez, L., Castillero C., & Aguilera J. M. (2005). An application of Image analysis
to dehydration of apple discs. Journal of Food Engineering, 67: 185-193.
Guan, D., Cheng, M., Wang, Y., & Tang, J. (2004). Dielectric properties of mashed
potatoes relevant to microwave and radio-frequency pasteurization and
sterilization processes. J. Food Sci., 69(1):30-37.
Guan, D., Gray, P., Kang, D. H, Tang, J., Shafer, B., Younce, F., & Yang, C.S. (2003).
Microbiological validation of microwave-circulated water combination heating
technology by inoculated pack studies. Journal of Food Sci 68(4), 1428-1432.
Ghani, A. G., Farid, M. M., & Chen, X. D. (2002). Theoretical and experimental
investigation of Bacillus stearothermophilus in food pouches. Journal of Food
Engineering, 51: 221-228.
87

John, R. B., Maria, L. P., Ruth, J., & Andrew, C. M., (1999). Microwave phase control
heating. International Journal of Food Science and Technology, 34, 295-304.
Kim, H. J., & Taub, I. A. (1993). Intrinsic chemical marker for aseptic processing of
particulate foods. Food Technology, 47(1), 91-99.
Lau, H., Tang, J., Taub, I. A., Yang, T. C. S., Edwards, C. G., & Mao, R. (2003).
Kinetics of chemical marker formation in whey protein gels for studying high
temperature short time microwave sterilization. J. Food Eng., 60: 397-405.
Lin, Y. E., Anantheswaran, R. C., & Puri, V. M. (1995). Finite Element analysis of
microwave heating of solids foods. Journal of Food Engineering, 25: 85-112.
Ma, L., Paul, L. D., & Pothecary, N., (1995). Experimental validation of a combined
electromagnetic and thermal FDTD model of a microwave heating process. IEEE
Transaction on microwave theory and technique, 43 (11): 2565-2572.
Munkevik, P., Hall, G., & Duckett T. 2005. A computer vision system for appearance-
based descriptive sensory evaluation of meals. Journal of Food Engineering.
78(1):246-256.
Oliveira, M. E. C., & Franca, A. S. (2002). Microwave heating of Foodstuffs. Journal of
Food Engineering, 53, 347-359.
Pandit, R. B., & Prasad S. (2003). Finite element Analysis of microwave heating of
potato- transient temperature profiles. Journal of Food Engineering 60:193-202.
Pandit, R. B., Tang, J., Liu F., & Pitts, M. (2007) Development of a novel approach to
determine heating pattern using computer vision and chemical marker (M-2)
yield. Journal of Food Engineering, 78( 2):522-528.
88

Pandit, R. B., Tang, J., Mikhaylenko, G., & Liu F. (2006). Kinetics of chemical marker
M-2 formation in mashed potato-a tool to locate cold spots under microwave
sterilization. Journal of Food Engineering. 76(3): 353-361.
Pathak, S., Liu, F., & Tang, J. (2003). Finite difference time domain simulation of single-
mode 915 MHz cavities in processing pre-packaged foods. J. Microwave Powers
Electrom. Ene. 38(1): 37-48.
Peterson, A. F., Ray, S. C., & Mitra, R. (1997). Computational Methods for
electrodynamics, IEEE Press. Pp. 401-485. The Institute of Electrical and
Electronic Engineering, Inc., New York.
Sale, A. J. H. (1976). A review of microwave for food processing. Journal of Food
Technology, 11: 319-329.
Tang, J., Wang, Y., & Chan, T.V. (2002). Radio-frequency heating in food processing.
Novel Food Processing Technology. Madision Ave, NY 10016, Marcel Dekker,
501-524.
Wang, Y., Wig, T. D., Tang, J., & Hallber, L. M. (2003). Dielectric properties of foods
relevant to RF and microwave pasteurization and sterilization. Journal of Food
Engineering. 57(3):257-268.
Yam, K. L, & Papadakis, E. S. (2004). A simple imaging method for measuring and
analyzing color of foods surfaces. Journal of Food Engineering, 61: 137-142.
Yang, H. W., & Gunasekaran, S. (2004). Comparison of temperature distributions in
model food cylinders based on Maxwell’s equation and Lambert’s law during
pulsed microwave heating. Journal of Food Engineering, 64, 445-453.
89

Yee, K.S. (1966). Numerical solution of initial boundary values problems involving
Maxwell’s equations in isotropic media. IEEE Transaction on Antennas and
Propagation, 14: 302-307.
Zhang, H., & Datta, A. K. (2000). Coupled Electromagnetism and Thermal Modeling of
Microwave Oven Heating of Foods. International microwave power institute. 35
(2): 71-85.
Zhou, L., Puri, V. M., Anatheswaran, R. C., & Yeh, G. (1995). Finite element modeling
of heat and mass transfer in food materials during microwave heating-model
development and validation. Journal of Food Engineering 25:509-29.
90

CHAPTER 5
DEVELOPING A COMPUTER VISION METHOD BASED ON CHEMICAL
MARKER M-2 YIELD TO LOCATE COLD-SPOT IN MICROWAVE
STERILIZATION PROCESSES
Ram Bhuwan Pandit, Juming Tang*, Frank Liu, and Galina Mikhaylenko In Review for publication in Pattern recognition
*Department of Biological Systems Engineering, Washington State University, 213 L J Smith
Hall, Pullman, WA 99164-6120, USA.
Abstract A major challenge in developing advanced thermal process based on
electromagnetic heating is to determine the location of cold spots in foods, when
developing a thermal process to ensure commercial sterilization. A rapid and reliable
method was developed with the aim to effectively locate the cold spot in model food
sterilized in microwave systems. The developed method involved application of chemical
marker M-2 yield to a model food, mashed potatoes, using computer vision system and
IMAQ Vision Builder program. A systematic study was conducted to establish
relationships among M-2 yields, color values from captured images of cut food samples,
and thermal lethality (Fo). Several factors including consistency of imaging background
and positions of lights over the diffuser box were considered to standardize the method.
To facilitate the comparative study of heating characteristic for different combinations of
power levels and Fo, a mapping scale using unheated and saturated mashed potato
samples was developed by fixing the lowest and upper most gray-scale values. Color
values equivalent to gray-level values were positively correlated to Fo and M-2 yield. The
specified cold spot location determined by computer vision method was validated in the
915 MHz single-mode microwave sterilization system. The results showed that the
computer vision method can potentially be used as an effective tool in microwave
sterilization process development for regulatory approval and industrial applications.
Keywords: Color values; computer vision; image processing; chemical marker; heating
patterns; microwave sterilization; process validation; IMAQ vision builder; cold spot
1. Introduction
Microwave sterilization holds promise to reduce process time and improve
product quality (Guan, Plotka, Clark, & Tang, 2002; Guan et al., 2003). Determination of
cold spot locations in foods during microwave sterilization, however, is a major challenge
for researchers when developing processes to ensure that the processed foods will be safe
for consumers. Computer simulation models can help in understanding the sterilization
process (Pathak, Liu, & Tang, 2003; Zhang, & Datta, 2000). Simulation models,
however, require validation and may not always be reliable due to complexity of the
coupling of heat transfer and dielectric heating in complex microwave sterilization
cavities (Ayappa, Davis, Davis, & Gordon, 1991; Pandit, & Prasad, 2003; Romano,
Marra, & Tammaro, 2005). For any geometrically complex system used to produce safe
foods for consumers, an approach of double validation for process development was
emphasized by US food regulatory organizations (Food and Drug Administration).
It is impossible to identify the cold spots in packaged foods during microwave
sterilization processes by point temperature measurement methods. Chemical marker
methods were studied as indirect means to evaluate relative heating absorptions in
92

selected food systems (Lau, et al., 2003; Wang, Lau, Tang, & Mao, 2003; Pandit, Tang,
Mikhaylenko, & Liu, 2006). Quantification of chemical marker M-1 and M-2 formed
through Maillard reaction between amino acids and reducing sugar such as ribose and
glucose required intensive laboratory analysis using High Performance Liquid
Chromatography (HPLC). For example, to analyze 3-D heating pattern in processed
mashed potato containing ribose in 10 oz trays with HPLC, two persons were needed for
2.5 days to quantify M-2 yield at 40 evenly distributed points in one tray. In process
development, repeated tests would be necessary with multiple trays and analyzing M-2
yield in those many trays using HPLC became impractical. It was, therefore, desirable to
develop a rapid and reliable method to capture the color intensities of chemical markers
(M-2) formation that reflect 3-D heating patterns.
A novel approach based on combination of chemical marker (M-2) yield and
computer vision has been proposed as an option for evaluating the heating patterns of
microwave-sterilized foods (Pandit, Tang, Liu, & Pitts, 2007). More research was needed
to standardize the method and to establish correlation between color intensity and process
cumulative lethality. In recent years, computer vision has reached wide-spread
applications for quality inspection, classification, evaluation of product and process in the
agri-food industry (Abdullah, Guan, Lim, & Karim, 2004; Wang & Sun, 2002; Yam &
Papadakis, 2004; Hwang, Park, Nguyen, & Chen, 1997). Computer vision method has
been approved as an optional technology for acquiring and analyzing an image to obtain
information reflecting important product attributes (Brosnan & Sun, 2004; Gunasekaran,
1996; Cheng & Sun, 2004, Tan, Shatadal & Gerrard, 2000; Zion, Shklyar, & Karplus,
1999). A similar approach may be applied in thermal processing applications.
93

The specific objectives of this study were to: 1) establish a standard method that is
not influenced by artifacts; 2) study the correlations among color values, chemical
markers (M-2) yield and lethality (Fo); 3) validate this method in identifying the cold spot
location in packaged foods processed with the microwave sterilization system by direct
temperature measurement with fiber optics probe
The ultimate goal of this study was to develop an effective and reliable method
for cold spot detection in support of an FDA approval process for microwave sterilization
system and for future process development in industrial applications.
2. Materials and Methods
2.1. Sample Preparation Mashed potato samples with 83.12% moisture content and 1.5% D-ribose were
prepared similar as Pandit, Tang, Mikhaylenko, & Liu, 2006. Eight grams of mashed
potato sample were placed and sealed into custom-built aluminum containers (diameter
3.5 cm × height 1.4 cm) with an air-tight lid for heating to elevated temperatures in oil
baths. A type-T thermocouple was fitted into the lid of the box. The tip of the
thermocouple was set to monitor sample temperature at the geometric center of the
aluminum container during heating.
2.2. Color palette and development of a new scale A set of RGB (red, green, blue) values defines the rainbow palette of the IMAQ
(Image Acquisition) program (National Instrument, Austin, TX, USA) in which varying
degree of red, green, and blue colors are mathematically combined to produce a color in
94

gray-level range. National Instrument IMAQ Vision Builder 6.1 (National Instrument,
Austin, TX, USA) assigned color value equivalent to gray-level value 255 to the darkest
pixels of the image while color value to a lightest pixel was not fixed.
Since the full scale for color values varies depending upon the range of color
intensity distribution in an image, for comparative study it was necessary to fix the gray-
level values to certain pixel intensity. This was done by selecting saturated and unheated
mashed potato as upper and lower limits to fix the full scale. Saturated samples were
obtained when limiting factor amino acids in mashed potato were consumed during
heating process and the formation of chemical marker would reach a saturation point.
Beyond this point further heating would not yield to significant chemical marker
formation and color changes. The unheated mashed potato sample (marker M-2 yield = 0
mg / g sample) was used as the lowest point of the scale by setting color value to zero,
and saturated mashed potato sample (Fo = 38 min; marker yield = 0.268 mg / g sample)
was used as the upper most point of the scale by setting color value to 255. A third point
in the middle with color value 127 ± 5 (Fo = 12 min) was set to improve the color
resolution (Fig. 1).
Color Value = 255 Fo = 38
Color Value = 128 Fo = 12
Color Value = 0 Fo = 0
95

a). Rainbow palette b). New developed scale
Fig. 1. Concept of converting the gray-level values to color values using pseudo color
palette of IMAQ vision builder program and a method to fix the scale using mashed
potato sample processed at different Fo.
To produce samples with different levels of marker formation, mashed potato
samples were heated in air-tight aluminum containers with oil baths at 121oC to Fo = 12
min or until the chemical marker reached saturation. The Look- up table function of the
IMAQ Vision Builder software version 6.1 was used to maintain the brightness of the
scale-sample to minimize the variation in the color value equivalent to gray scale value
during color analysis. The developed scale was also tested for several levels of
cumulative lethality (Fo) to obtain the distinctive color value for each level of Fo. The
gray-level value of the sample was transformed to a one dimensional color value using
the color scheme of Fig. 1. Fo was calculated using the following formula:
Fo = dtt
zT
∫−
0
1.121
10 (1)
where, T is the sample temperature in oC at any time t during heating, z was taken as 10
oC for bacterial inactivation (Holdsworth, 1997). Value of z for chemical marker (M-2)
formation in mashed potato was calculated at 32 oC using kinetic data (Pandit, Tang,
Mikhaylenko, & Liu, 2006).
2.3. Computer vision system The computer vision system consists of a light pod; helical compact fluorescent
bulb; a digital camera with right-angle viewing attachment; automatic image acquisition
software and computer vision software installed in a 1.6 GHz RAM Dell station (Fig. 2).
96

A Nikon D 70 (Nikon Instrument, Melville, NY, USA) digital camera with 18-70 mm
DX Nikkor lens was fitted on top of the Paterson Light Pod (Paterson Photographic Inc.,
Douglassville, GA, USA). The CCD (Charge Coupled Device) camera could move
vertically on the stand to adjust the magnification and its distance from the sample. Nikon
Capture 4 Editor version 4.3.0 (Nikon Instrument, Melville, NY, USA) software was
used to acquire and download the images to a Dell Workstation.
Fig. 1. Computer vision system designed in this study.
2.4. Effect of lights positions on diffuser box In the computer vision system, lights were mounted outside the light pod to
maintain an even luminosity inside the box. Four helical 26W (120VAC, 60Hz) bulbs
(GE, Schenectady, NY, USA) were mounted on a stand at an angle of 45o around a
97

Paterson light pod “Cocoon” style medium diffusion shooting tent ( 43 × 50 ×70 cm).
The diffusion light pod was used to prevent the incident monochromatic light source to
the object. The incident light intensity inside the diffuser box was measured using a
Sekonic exposure meter, FLASHMATE L-308BII (Sekonic, Elmsford, NY, USA). High
quality images were captured by matching the exposure meter readings, F (Aperture
value = 30) and f/s (number of frame per second = 11), to Nikon D 70 digital camera
through manual setting.
Computer vision analysis was performed to test the consistency in background for
each image. To evaluate the effect of light positions on heating patterns, lights were
mounted at top, middle and bottom positions of the light pod. Computer vision patterns
for five samples heated to 110, 116, 121, 126 and 131 oC temperatures were compared at
each position of lights to investigate the affect of light position. Images of the heated
samples taken at each position were analyzed using IMAQ Vision Builder software to
determine the RGB value equivalent to a gray-scale value.
2.5. Color value, M-2 yield and Fo relationship 2.5.1. Sample preparation and HPLC analysis The activation energy of chemical marker formation in mashed potato Ea = 22.23
± 1.54 kcal /mol is different from that of bacterial inactivation (Ea = 80 ± 10 kcal /mol). It
was anticipated that time-temperature history for mashed potato samples may affect the
chemical marker yield even for the same final Fo. Due to these variables two different
pathways: 1) direct heating to a set temperature and 2) holding at 121 oC for different Fo
were considered in this study. In the first set of tests, samples sealed in aluminum
98

containers were heated to 110, 116, 121, 126, and 131 oC temperatures (T) in an oil-bath
to reach different levels of Fo. In another set of tests, oil-bath temperature was set at 121
oC and samples were held for a different period of time to cumulative lethality ( Fo ) of
1.5, 3, 6, 9, 12, 15 and 18 min. The samples were then rapidly cooled by immersing the
aluminum containers into ice cubes. The purpose of fast cooling was to minimize
additional cumulative lethality (Fo) after reaching the desired Fo. Each experiment
condition was repeated twice. Temperature and Fo of the heated samples were monitored
using data logging software MS Visual Basic 6 with measurement-computing software
Active X, Omega IDRX thermocouple (Omega Engineering Inc., Stamford, CT, USA)
isolator controls, and hardware with serial output mounted on a personal computer.
Software was logging data at an interval of six seconds.
Chemical marker M-2 yield for both sets of samples were determined using the
Agilent 1100 HPLC system (Agilent Technology, Palo Alto, CA , USA). Before the
analyses, samples weighing between 0.20 g and 0.21 g were ground in 2 ml extraction
buffer (10 mM sulphuric acid and 5 mM citric acid). Sample extraction and HPLC
analysis procedures were the same as described in Pandit, Tang, Mikhaylenko, & Liu
(2006). Additionally, chemical marker (M-2) yield during heating process was predicted
from measured temperature using the mathematical equation ( Lau, Tang, Taub, & Yang,
2003):
∫ −−−×−−= ∞∞
t
oo
aoo dt
TtTRE
kCCCtC0
}])1)(
1[(exp{exp)()( (2)
where C (t) is marker yield at any time, C∞ marker yield at saturation (0.268 mg/g
sample), Ea is energy of activation (22.23 kcal mol-1 K-1), Ro is molar gas constant (1.988
cal mol-1 K-1), T(t) is recorded time-temperature history at the measured point, and To is
99

reference temperature (396.7 K). Initial marker yield before heating, Co, was considered
to be zero for mashed potato samples with 1.5 % D-ribose. An experiment was also
conducted to compare the M-2 yield of a sample taken from the middle point of the
container and a sample taken by mixing the whole container (3.5 × 1.4 cm) for HPLC
analysis.
2.5.2. Image Acquisition and Image editing using Adobe Photoshop Nikon’s Capture camera control tool was used for automatically acquiring and
downloading the image. Sizes of images taken were 3008 × 2000 with 24 bit per pixel,
and were saved in Joint Photographic Experts Group (JPEG) format.
Adobe Photoshop CS version 8.0 (Adobe Systems, San Jose, CA, USA) was used
to insert scale images and images to be analyzed into one package. A 20 × 25 cm
automatic picture package was divided into 5 × 4 layouts (Thomas, 2003). The first
column of the layouts was reserved for the scale samples and other columns were used
for images to be analyzed for heating patterns. Resolution of images in picture package
was set to 500 pixels per inch.
2.5.3. Functions in computer vision script A computer vision script was developed through interactive programming to
determine the color patterns of heated samples. Developed script in IMAQ Vision
Builder contains functions as shown in Fig. 3. Selection of those function tools were
made to meet the desired output, as a result of the sequential mathematical computation
over original pixels of an image. Main functions are described in details in the following:
100

(i) Look-up Table- Look-up Tables (LuT) was used to set the brightness of the scale
samples. An image (І) in rectangular matrix was defined as (Thomas, 2003):
I = f [ sin (x, y)] (3)
Filters: Smoothing local average
Simple Calibration Image Mask: from ROI
Extract Color plane: HSL-saturation
Image Mask: from ROI
Scale Brightness
Look up Table: Equalize
Gray morphology: Erode
Filters: Smoothing highlights details
Gray Morphology: remove small
Adv. Morphology: remove small
FFT filters: Truncate
Grayscale: Quantify
Fig. 3. Functions of the developed IMAQ Vision Builder script for heating pattern analysis. where x is row index and y is column index. The original gray-scale values sin (x, y) can
be assigned any value out of the gray-scale set g = {0, 1,……….., 255} for an 8-bit
image. Resulting set of output values sout (x, y) using LuT would be:
sout (x, y) = f [ sin (x, y)] (4)
101

For each value of g, function f (g) will have 256 possible values in a look-up table,
therefore:
LuT (g) = f (g) (5)
In that case, the computed output of the LuT function becomes:
sout (x, y) = LuT ( sin (x, y)) (6)
(ii) Extract Color Planes: HSL- IMAQ Vision Builder provides a pre-defined unique
feature based on this concept to represent the gray-level value of a pixel into
corresponding one dimensional color value comprised of varying amounts of red, green,
and blue (Fig. 1). Color plane HSL (Hue, Saturation, and Luminance) saturation was
extracted from each image to adjust the lowest gray-level value to the lightest pixel and
the highest gray-level value to the darkest pixel of an image. The coordinate system for
HSL color space is cylindrical. The hue (H) value runs from 0 to 360o, the saturation (S)
ranges from 0 to 1, and luminance (L) also ranges from 0 to 1, where 0 is black and 1 is
white. Following equations describe the nonlinear transformation that maps the RGB
color space to the HSL color space:
L = 0.3 × R + 0.59 × G + 0.11 × B (7)
V2 = 3 × (G - B) (8)
V1 = 2 × R - G – B (9)
H = 256 × 1 2 21
− ×ΠVtan ( ) / ( )V
(10)
S = 255 × ( 31 ×−
+ +min( R,G,B )
( R G B ) ) (11)
102
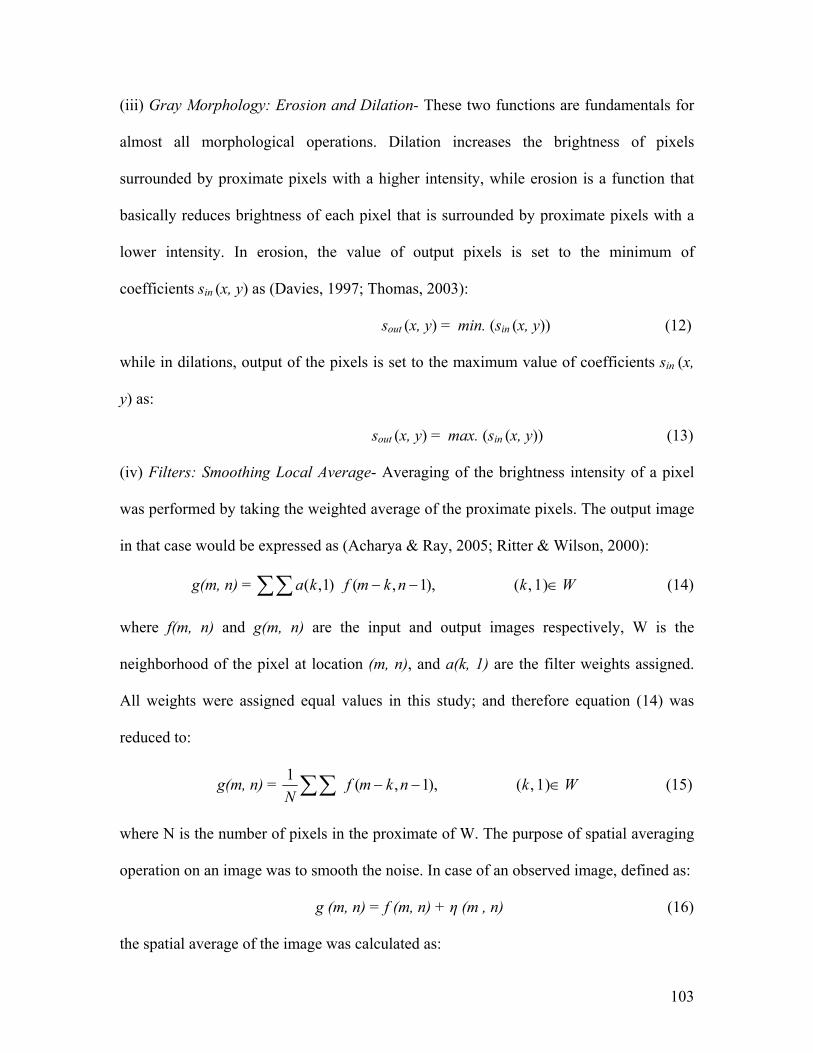
(iii) Gray Morphology: Erosion and Dilation- These two functions are fundamentals for
almost all morphological operations. Dilation increases the brightness of pixels
surrounded by proximate pixels with a higher intensity, while erosion is a function that
basically reduces brightness of each pixel that is surrounded by proximate pixels with a
lower intensity. In erosion, the value of output pixels is set to the minimum of
coefficients sin (x, y) as (Davies, 1997; Thomas, 2003):
sout (x, y) = min. (sin (x, y)) (12)
while in dilations, output of the pixels is set to the maximum value of coefficients sin (x,
y) as:
sout (x, y) = max. (sin (x, y)) (13)
(iv) Filters: Smoothing Local Average- Averaging of the brightness intensity of a pixel
was performed by taking the weighted average of the proximate pixels. The output image
in that case would be expressed as (Acharya & Ray, 2005; Ritter & Wilson, 2000):
g(m, n) = (14) Wknkmfka ∈−−∑∑ )1,(),1,()1,(
where f(m, n) and g(m, n) are the input and output images respectively, W is the
neighborhood of the pixel at location (m, n), and a(k, 1) are the filter weights assigned.
All weights were assigned equal values in this study; and therefore equation (14) was
reduced to:
g(m, n) = WknkmfN
∈−−∑∑ )1,(),1,(1 (15)
where N is the number of pixels in the proximate of W. The purpose of spatial averaging
operation on an image was to smooth the noise. In case of an observed image, defined as:
g (m, n) = f (m, n) + η (m , n) (16)
the spatial average of the image was calculated as:
103

g(m, n) = WknmnkmfN
∈+−−−
∑∑ )1,(),,()1,(1 η (17)
where was an average of the noise component η (m, n) in the spatial domain of
the image.
),( nm−
η
(v) Filters: Smoothing Highlight Details- Filtering improved the quality of the image by
calculating the new pixel value by using the original pixel value and those of its
proximities. Mathematical computation on each pixel was performed by using the
equation (Gerhard & Joseph, 1996; Thomas, 2003):
sout (x, y) = ),(.),(1 1
0
1
02 vufvkyukxs
m
m
u
m
vin −+−+∑∑
−
=
−
=
(18)
The output pixel values sout (x, y) depends on the size of kernel matrix (m × m). IMAQ
has three predefined kernel matrices of size m = 3, 5 and 7. Under this study, most of the
calculations were done with m = 3 and parameter k was defined as:
2
)1( −=
mk (19)
Indices u, and v depend on x and y with k in terms of filter kernel function (Gerhard and
Joseph 1996). In case of kernel size 3 × 3, all nine neighboring pixels were represented
as:
F = ( f (u, v)) (20) (0,0) (0,1) (0, 2)(1,0) (1,1) (1, 2)(2,0) (2,1) (2, 2)
f f ff f ff f f
⎛ ⎞⎜ ⎟= ⎜ ⎟⎜ ⎟⎝ ⎠
Using indices x and y equation (20) can be elaborated as:
F = (21) ( 1, 1) ( , 1) ( 1, 1)
( 1, ) ( , ) ( 1, )( 1, 1) ( , 1) ( 1, 1)
f x y f x y f x yf x y f x y f x y
f x y f x y f x y
− − − + −⎛ ⎞⎜ ⎟−⎜ ⎟⎜ ⎟− + + + +⎝ ⎠
+
104

this includes a pixel (x, y) with its eight proximities pixels.
(vi) Fast Fourier Transforms (FFT: Low pass truncation) - The 2D Fourier Transforms
transforms a spatial function f(x, y) of an image into frequency domain F(u, v), which in
continuous domain, was defined as [Thomas, 2003; Shapiro, & Stockman, 2001):
F (u, v) = (22) ∫ ∫∞
∞−
∞
∞−
+− dxdyeyxf yvxuj )(2),( π
The exponential function was expressed using Euler’s identity as:
))(2sin())(2cos())(2exp( vyuxjvyuxvyuxj +−+=+− πππ (23)
where f(x, y) was the light intensity of the points (x, y), and u, v were the horizontal and
vertical spatial frequencies. Equation (22) implies that the function f(x, y) is essentially
multiplied by the terms cos(2 uxπ ) cos (2 )vyπ , sin(2 uxπ ) sin(2 )vyπ , sin(2 uxπ )
cos(2 )vyπ , and cos(2 uxπ ) sin(2 )vyπ . In case of a symmetric function, along both the
X and Y axes, Fourier transform of f(x, y) involves the multiplication of cos (2 uxπ ) cos
(2 )vyπ term only. But in this study, the f(x, y) multiplication involved all four terms due
to asymmetric images. Inversely Fast Fourier Transformed F (u, v) can be transformed
back into a spatial image f(x, y) of resolution N × M:
f(x, y) = )(21
0
1
0),( M
yvNxujN
u
M
vevuF
−−
=
−
=∑ ∑
π (24)
where F (u, v) consists of an infinite sum of sine and cosine terms, which are determined
by the corresponding frequency. For the given set of u and v all values of f(x, y)
contribute to F (u, v). The FFT computation on the image before quantifying the RGB
values took between 2-10 minutes depending upon the size of the image to be analyzed
for cold spot detection.
105

2.6. Computer vision heating patterns for food samples using IMAQ Vision Builder A picture package including images of mashed potato samples in Adobe
Photoshop was analyzed using IMAQ Vision Builder program. Brightness of the scale
samples were fixed using look-up table, and regions of interest (ROI) were selected using
image mask. A developed function script (Fig. 3) was run to determine the heating
patterns. Forty (8 × 5) rectangular grids were generated on the heating patterns of each
tray. The color values of the grids for each tray were directly extracted to Microsoft
Office program Excel (MS Office-2003, USA). Similar steps were followed to collect
color values from other images of the package. Using MS Excel, a grid with lowest color
value was selected among all of the grids and detected as the cold spot region of the
microwave sterilization process.
3. Results and Discussion 3.1. Computer vision color patterns Colors of heated samples were analyzed by referencing the developed scale in
each picture package using Adobe Photoshop. Computer vision showed different color as
a result of different M-2 yield at each level of Fo (Fig. 4). HPLC analysis revealed that
the sample held at 121 oC for Fo = 6 min had much higher chemical marker yield (0.089
mg/g) than a sample directly heated to 126 oC (0.029 mg/g) for a similar level of Fo
(Table 1). Due to a short heating duration and higher temperature than 121 oC, directing
heating to 126, 131 oC temperatures leads to higher Fo in the tested samples, while
chemical marker yields were all comparatively lower. This is because of the earlier stated
106

difference between the activation energy for M-2 formation and that for thermal
inactivation of C. botulinum spores used in Fo calculation.
Fo = 12 1Fo = 38
Fo = 9 Fo = 18
Fo = 6 Fo = 15Fo = 12
Fo = 3
Fo = 0
T = 1
a). Original sample b). Compute
Fig. 4. Computer vision patterns for the mashed po
temperature (T) or held to 121 oC for different Fo, results w
It is clear that correlation between M-2 formation and F
pathway which will be discussed in details.
Our test results also showed that positions of lights
effect on the color images captured by the computer vis
study was also conducted to compare the color values of
heating and samples stored maintaining a protocol ( storag
hours at 5 oC, and 1 hour again -35oC ). This study show
value> 0.98) in color value for both set of samples.
T= 116
T = 121
T = 126
T = 13
Fo = 1.510
r vision patterns
tato samples heated to a set
ere tested in two replicates.
o are dependent of temperature
around the diffuser box had no
ion system (Fig. 5). A separate
the sample analyzed right after
e protocol: 1 hour at -35oC, 12
ed no significant difference (P-
107

a). Bottom b). Middle c). Top
Fig. 5. Comparison of computer vision color patterns with mashed potato samples heated
to different temperature levels for three positions (bottom, middle and top) of lights.
Number denotes the set temperature to which sample was heated.
3.2. Color value equivalent to gray-level value and M-2 yield Gray-scale quantification tool was used to obtain the color value equivalent to a
gray-level value for each sample. A representative color value along with the standard
deviation of selected ROI (Region of Interest) was obtained using IMAQ Vision Builder.
Our tests showed that chemical marker yield of the sub-sample taken at center of the
sample and that of the mixed whole sample in the same container was not significantly
different (P-value = 0.985) (SAS, Institutes Inc., Cary, NC, USA). To expedite the
extraction procedure, a sub-sample from the middle section of the treated sample was
taken at each level of Fo for determination of the M-2 yield using HPLC. M-2 yield of
analyzed samples were positively correlated with the cumulative thermal lethality Fo (Fig.
108
6). M-2 yield of the samples were also correlated with imagine parameter, color value, to
establish a relationship (Table -1). Results showed a unique positive correlation between
M-2 yield and color values (Fig. 7) regardless of heating pathways. This indicates that
computer visions based on the color value equivalent to gray scale can uniquely reflect
M-2 yields in thermal processes.
3.3. Color value equivalent to gray-level value and Fo The color values measured for each sample using IMAQ Vision Builder were
plotted against Fo values. Two different positively correlated trends, one for samples
heated by holding at 121 oC and another for samples directly heated to a set temperature
(ramp up) were obtained (Fig. 8). For each different heating pathway, plotted result
showed that each level of Fo will lead to unique M-2 yield and color value (Fig. 6, Fig. 8).
These relationships between M-2 yield vs. Fo, and color value vs. Fo are unique for a
given condition of heating. Based on these relationships, by referring a scale, color value
can be used as a representative for the thermal lethality ( Fo) and chemical marker (M-2)
yield.
109

y = -0.001x2 + 0.02x - 0.01R2 = 0.99
0.00
0.05
0.10
0.15
0.20
0.25
0 5 10 15 20Fo (min)
M-2
yie
ld (
mg
/ g o
f sam
ple)
Holding at 121 C
Ramp up to differenttemperature levels
y = 0.001x2 + 0.006x + 0.0035R2 = 0.99
Fig. 6. M-2 yield and Fo correlation with mashed potato samples heated to different set
temperature (ramp up) levels or held at 121 oC for different Fo, data points are based on
two replicates.
Table 1. Color values equivalent to gray-scale values and chemical marker M-2 yield for two different heating conditions, each point represents mean of two replicates.
Data Collected for Temperature (oC) or target
Fo (min)
Fo (min) M-2 yield ( mg / g of sample)
Color value equivalent to
Gray-level Ramp up to 110.00 0.15 ± 0.00 0.005 ± 0.004 10.17 ± 2.48 temperature 116.00 0.53 ± 0.15 0.013 ± 0.005 29.70 ± 8.65
levels 121.00 1.85 ± 0.03 0.021 ± 0.008 47.78 ± 7.71 126.00 6.17 ± 0.28 0.029 ± 0.001 84.69 ± 2.16 131.00 17.81 ± 3.83 0.053 ± 0.011 108.78 ± 3.13
Holding at 121 oC
1.50 1.57 ± 0.09 0.016 ± 0.001 29.08 ± 9.55 for Fo 3.00 2.98 ± 0.10 0.034 ± 0.004 78.70 ± 3.26
6.00 6.08 ± 0.01 0.089 ± 0.001 125.84 ± 2.28 9.00 9.05 ± 0.08 0.124 ± 0.008 143.54 ± 5.25 12.00 12.02 ± 0.04 0.152 ± 0.003 158.01 ± 0.04 15.00 15.05 ± 0.04 0.167 ± 0.002 184.68 ± 3.57 18.00 17.98 ± 0.04 0.201 ± 0.014 196.05 ± 2.28
110

y = -3748.07x2 + 1597.20x + 17.20R2 = 0.95
0
40
80
120
160
200
0 0.05 0.1 0.15 0.2M-2 yield ( mg/ g sample) .
Col
or v
alue
equ
ival
ent t
o gr
aysc
ale
valu
e
Holding at 121 C
Ramp up to different temperature levels
Fig. 7. Color value and M-2 yield relationship with mashed potato samples heated to
different set temperatures (ramp up) levels or held at 121 oC for different Fo, data points
are based on two replicates.
4. Validation of locations specified by computer vision In order to validate the accuracy of the cold and the hot spot locations determined
by the computer vision method, experiments were conducted in a 915 MHz single-mode
pilot-scale microwave sterilization system in two replicates. Thermo wells that separate
sealed sample from fiber-optic sensors were fitted into the tray at the measured distance
of cold and hot spots locations. Each tray was filled with 200g of mashed potato sample
mixed with 1.5% D-ribose and then vacuum-sealed at 18 in. of Hg vacuum. Trays were
set on an Ultum support and a proper speed-time combination was chosen to move the
tray support from the loading section to the holding section through two single-mode
111
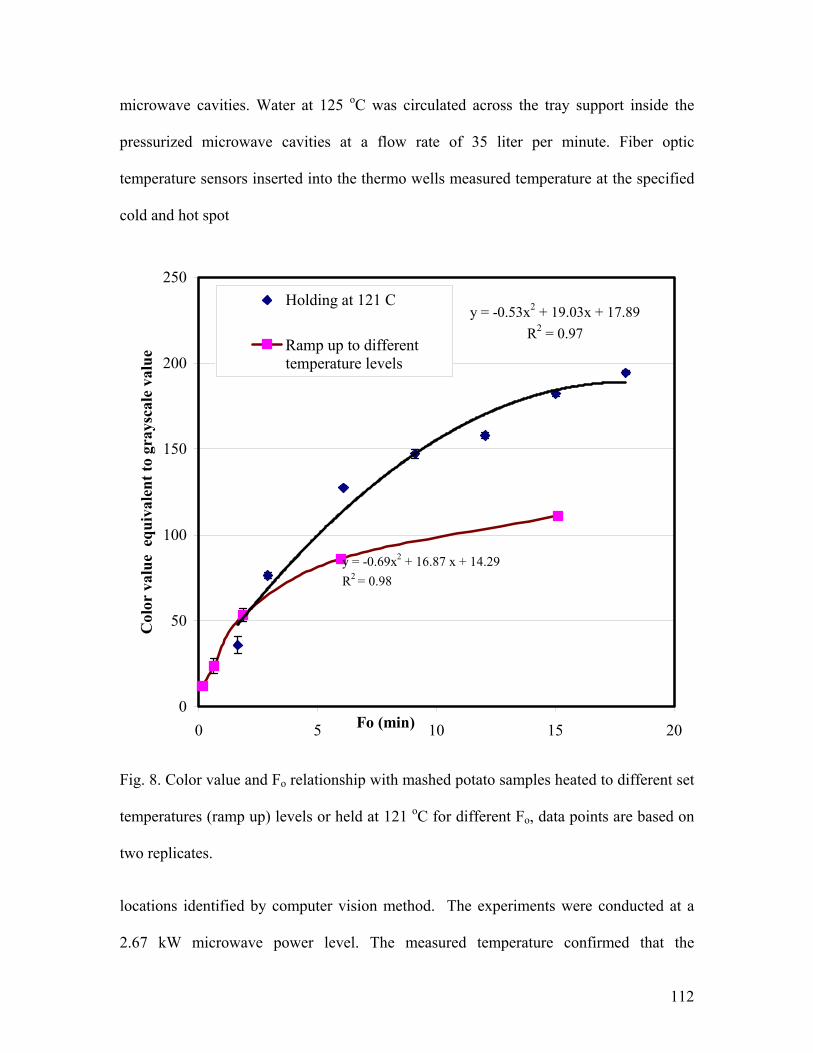
microwave cavities. Water at 125 oC was circulated across the tray support inside the
pressurized microwave cavities at a flow rate of 35 liter per minute. Fiber optic
temperature sensors inserted into the thermo wells measured temperature at the specified
cold and hot spot
y = -0.53x2 + 19.03x + 17.89R2 = 0.97
0
50
100
150
200
250
0 5 10 15 20Fo (min)
Col
or v
alue
equ
ival
ent t
o gr
aysc
ale
valu
e
Holding at 121 C
Ramp up to differenttemperature levels
y = -0.69x2 + 16.87 x + 14.29R2 = 0.98
Fig. 8. Color value and Fo relationship with mashed potato samples heated to different set
temperatures (ramp up) levels or held at 121 oC for different Fo, data points are based on
two replicates.
locations identified by computer vision method. The experiments were conducted at a
2.67 kW microwave power level. The measured temperature confirmed that the
112

temperature measured at the perceived hot spot was indeed always higher than the cold
spot for all tests, as shown by a representative curve in Fig. 9.
To further confirm the locations of the cold spots relative to other parts of the
tray, additional 13 tests were conducted. In each of the tests, four optic sensors were
0
20
40
60
80
100
120
140
0 5 10 15 20
Time (min)
Tem
pera
ture
( o C
)
hot spot
cold spot
Fig. 9. Validation of cold and hot spots locations specified by computer vision method in
10 oz trays during microwave sterilization at 2.67 kW power level, typical temperature
profile from repeated tests in the middle layer of the tray.
placed in a sample tray during the microwave sterilization process. One of the sensors
was always inserted at the cold spot identified by the computer vision method while the
others placed in three different locations. Compiling all the measured temperatures from
the 13 tests, provided temperature profile for a total of 40 different points (8 × 5) evenly
distributed in the middle layer of a tray. Computer vision patterns and temperature
113

mapping, for middle layers, obtained using fiber optics are compared in Fig. 10. It shows
that heating pattern and cold spot location obtained by both the methods were concordant.
This indicates that the novel computer vision method indeed reliably reveal the cold spots
in foods and can be used to study general heating patterns in foods after microwave
sterilization processes.
Side of tray
(a) Heating pattern by developed (b) Temperature distribution measured
computer by vision method. by fiber optic probes.
Fig. 10. Matching of the experimental and developed method heating patterns for the
middle layer of a 10 oz tray with mashed potato processed at 2.67 kW microwave power
level.
5. Conclusions
The designed computer vision system provided consistent background for the
images. The developed scale can be used to compare the heating patterns of microwave-
sterilized foods for combinations of power levels and Fo. Shooting tent worked well as an
114

effective diffuser, and positions of lights for a fixed setting of exposure intensity had no
influence on the heating patterns.
Color value equivalent to gray scale value was positively correlated with chemical
marker yield and cumulative thermal lethality (Fo). For a given Fo, chemical marker (M-
2) yield of the samples heated directly to 126, 131 oC temperatures were lower than
holding the sample at 121oC. Separate pathway provides different correlation between M-
2 yield and Fo. But correlation between color values and M-2 yield are independent of
heating pathway. Based on these relationships, a computer vision method was developed
to identify the cold and the hot spot regions of a processed food sample. Validation tests
confirmed that the computer vision method based on chemical marker M-2 yield can
accurately determine the location of cold spots. The developed knowledge base will
support application of this method for evaluation of microwave sterilization processes.
Currently this method is being used to locate the cold spots in pink salmon fillets
in an Alfredo sauce to develop filing documents for FDA approval of the 915 MHz
microwave sterilization system.
Acknowledgments
This research work was supported by the US Army Natick Soldier Center, Natick,
MA and the Washington State University Agricultural Research Center, Pullman WA.
115

Nomenclature
a(k, l) filters weight B blue color value
C marker yield (mg/ g of sample)
oC initial chemical marker yield (mg/ g of sample)
∞C chemical marker yield at saturation (mg/ g of sample)
Ea activation energy (kcal mol-1)
Fo cumulative thermal lethality (min)
F aperture value
f(x, y) light intensity of the points (x, y)
F(u, v) frequency domain of an image
FFT Fast Fourier’s Transforms
g gray level values
G green color value
H hue
L luminance
ko reaction constant at reference temperature
M-2 chemical marker M-2
m size of matrix array
N number of pixels
Ro universal gas constant at reference temperature (cal/mol K)
R red color value
RGB red, green, and blue color value
116

S saturation
sin (x, y) original gray-scale values
sout (x, y) output pixel values
t time (min)
T temperature (oC)
T(t) temperature (K)
To reference temperature
u horizontal spatial frequency
v vertical spatial frequency
W neighborhood around the pixel
117

References
Abdullah, M. Z., Guan, L. C., Lim, K. C., Karim, A. A. (2004). The application of
computer vision system and topographic radar imaging for assessing
physical properties of food. Journal of Food Engineering 61: 125-35.
Acharya, T., & Ray, A. K. (2005). Image Processing: Principles and Application.
Hoboken, New Jersey, Wiley-Interscience Publication.
Ayappa, K. G., Davis, H. T., Davis, E. A., & Gordon, J. (1991). Two dimensional finite
element analysis of microwave heating. AIChE Journal, 38(10): 1577-1592.
Brosnan, T., & Sun, D. W. (2004). Improving quality inspection of food products by
computer vision -a review. Journal of Food Engineering 61:3-16.
Cheng, D. J., & Sun, D. W. (in press). Pizza sauce spread classification using color
vision and support vector machines. Journal of Food Engineering.
Davies, E. R. (1997). Machine Vision: Theory Algorithms and Practicalities. Academic
Press.
Food and Drug Administrations. (2005). Thermally processed low-acid foods
packaged in hermetically sealed containers. Chapter 1, Available from:
http://www.fda.gov/. Accessed Mar-2005.
Gerhard, X. T., & Joseph N. W. (1996). Handbook of Computer Vision Algorithms in
Image Algebra. Boca Raton, NY, CRC Press.
Guan, D., Plotka, V. C. F., Clark, S., & Tang, J. (2002). Sensory evaluation of
microwave treated macaroni and cheese. J. Food Processing and Preservation
26: 307-322.
118

Guan, D., Gray, P., Kang, D. H., Tang, J., Shafer, B., Ito, K., Younce, F., Yang, C. S.
(2003). Microbiological validation of microwave-circulated water combination
heating technology by inoculated pack studies, J. Food Sci. 68(4): 1428-1432.
Gunasekaran, S. (1996). Computer vision technology for food quality assurance. Trends
in Food Science & Technology 7: 245-56.
Holdsworth, S. D. (1997). Sterilization, pasteurization and cooking criteria. Thermal
processing of packaged foods. Boundary Row, London: Blackie Academic and
Professional. 99-110.
Hwang, H., Park, B., Nguyen, M., Chen, Y. R. (1997). Hybrid image processing for
robust extraction of lean tissue on beef cut surfaces. Computers and Electronics
in Agriculture 31: 17-29.
IMAQ vision builder tutorials, National Instrument Corporation. Available
from:http://www.ni.com/. Accessed on Jan 2004.
Lau, M. H., Tang, J., Taub, I. A., Yang, T. C. S., Edwards, C. G., & Mao, R. (2003).
Kinetics of chemical marker formation in whey protein gels for studying high
temperature short time microwave sterilization. Journal of Food Engineering,
60:397-405.
Lu, J., Tan, J., Shatadal, P., & Gerrard, D. E. (2000). Evaluation of pork color by using
computer vision. Meat Science 56: 57-60.
Pandit, R. B., & Prasad, S. (2003). Finite element Analysis of microwave heating of
potato- transient temperature profiles. Journal of Food Engineering 60:193-202.
119
Pandit, R. B., Tang, J., Liu F., & Pitts, M. (2007) Development of a novel approach to
determine heating pattern using computer vision and chemical marker (M-2)
yield. Journal of Food Engineering, 78:522-528.
Pandit, R. B., Tang, J., Mikhaylenko, G., & Liu F. (2006). Kinetics of chemical marker
M-2 formation in mashed potato-a tool to locate cold spots under microwave
sterilization. Journal of Food Engineering. 76(3): 353-361.
Pathak, S. K., Liu, F., & Tang, J. (2003). Finite difference domain (FDTD)
characterization of a single mode applicator. J. of Microwave Power &
Electromagnetic Energy 30(1) 1-12.
Ritter, G. X., & Wilson, J. N. (2000). Handbook of computer vision algorithms in Image
Algebra. Boca Raton, New York, CRC Press.
Romano, V. R., Marra, F., & Tammaro, U. (2005). Modeling of microwave heating of
foodstuff: study on the influence of sample dimensions with FEM approach.
Journal of Food Engineering 71: 233-41.
Shapiro, L. G., & Stockman, G. C. (2001).Computer Vision. Upper Saddle River, New
Jersey, Prentice-Hall, Inc.
Thomas, K. (2003). Image processing with LabView and IMAQ vision. Image
Processing. Upper Saddle River, NJ, Prentice Hall.
Wang, H. H., & Sun, D. W. (2002). Melting characteristics of cheese: analysis of effects
of cooking conditions using computer vision techniques. Journal of Food Science
51: 305-10.
120

Wang, Y., Lau, M. H., Tang, J., Mao, R. (2004). Kinetics of chemical marker M-1
formation in whey protein gels for developing sterilization processes based on
dielectric heating. Journal of Food Engineering 64: 111-118.
Yam, K. L., & Papadakis, S. E. (2004). A simple digital imaging method for measuring
and analyzing color of food surfaces. Journal of Food Engineering 61: 137-42.
Zhang, H., & Datta, A. K. (2000). Coupled electromagnetism and thermal modeling of
microwave oven heating of foods. International Microwave Power Institute. 35
(2): 71-85.
Zion, B., Shklyar, A., & Karplus, I. (1999). Sorting fish by computer vision. Computers
and Electronics in Agriculture 23(3): 175-87.
121

CHAPTER 6
PRINCIPLE AND APPLICATION OF CHEMICAL MARKER (M-2) BASED
COMPUTER VISION METHOD TO LOCATE THE COLD SPOTS IN REAL FOOD
SYSTEMS
Ram Bhuwan Pandit, Juming Tang*, Frank Liu, and Zhongwei Tang
Accepted for Presentation in ASABE Annual International meeting, June, 17-20-2007 Minneapolis, MN, USA. Paper ID: 1929.
Abstract
This paper investigates and develops a protocol for determining the location of
cold spots for microwave sterilization process for pink salmon fillets with Alfredo sauce
(2:1) using computer vision method to assist the development of novel microwave
sterilization processes. Whey protein gel was selected as the model food to emulate the
heating patterns in a real food system, salmon fillet. Dielectric property of the whey
protein gel was adjusted by adding salt to match that of pink salmon fillet. Kinetic studies
was performed to establish relationship among cumulative lethality (Fo), chemical marker
(M-2) concentration, and color value in terms of gray-scale value in whey protein gels
containing ribose as a pre-cursor for M-2 formation through Mallard reaction during
thermal processing. Heating patterns of slab shaped whey protein gel processed in a pilot-
scale 915 MHz microwave (MW) sterilization system were analyzed using a computer
imaging system. The region with lowest color value was identified as the cold spot
location. Two other locations having color value closer to the cold spot were selected for
validation using fiber optic temperature sensors in the pilot scale microwave sterilization
system. Time-temperature profiles for the three selected points, including the cold spot,

in whey protein gel slabs processed with added sauce were found repeatable during
microwave sterilization. Time-temperature profiles for the points selected in the whey
protein gel also matched with that in salmon fillet processed in the same sauce. Results
showed that the cold spot location identified in whey protein gels was indeed the cold
spot in the salmon fillet. This study demonstrated the potential of using computer vision
for chemical marker M-2 formed in specially formulated whey protein gels to locate the
cold spots in real food systems in microwave sterilization processes.
Keywords: Computer vision method; microwave heating; salmon fillet; dielectric
properties; cold spot; whey protein gel
1. Introduction
Computer vision is increasingly used by the food industry for various application,
including food quality inspection, process monitoring and classification system because it
provides an alternative as automatic and cost-effective technique (Steenhoek, Misra,
Hurburgh, & Ben, 2001; Li, Wang & Gu, 2002; Du & Sun, 2004; Tan, 2004; Kumar,
Ganjyal, Jones & Hanna, 2006). For similar benefits, a computer vision method based on
the yield of chemical marker M-2 was developed in our laboratory to locate the cold
spots in microwave sterilization processes. After successful development of a computer
vision method to locate the cold spot in homogeneous model food (Pandit, Tang, Liu &
Pitts, 2007), our next step was to develop a methodology to determine the cold spot in
real food systems. In order to develop microwave sterilization processes for industrial
application, determining the cold spots in heterogeneous food system was a major
challenge (Wang, Lau, Tang, & Mao, 2004; Yam & Papadakis, 2004; Dworkin & Nye,
123

2006). To apply this method to real food systems, we decided to provide a complete
protocol to determine the cold spot locations.
Several physical and chemical changes occur in food during thermal processing.
Due to the chemical reactions, color of the heterogeneous food components changes in
sterilization operations (Godereaux, Goullieux, & Kint, 2003; Kim & Ball, 1994; Ross,
1993). Size shrinkage and syneresis can also be noticed with several food systems during
sterilization process. The deep pink fillets of salmon became white with shrinkage in
shape after processing. Because of these constraints we decided to use a generic model
food system with predictable thermal sensitivity color change characteristic to assist
identification of the cold spots in real foods. It is desirable that the extent of color
development in the model food system is positively correlated to the thermal lethality
received in the heated food systems when exposed to the same heat treatment (Kim &
Taub, 1993; Wnorowski & Yaylayan, 2001).
A model food system which can be shaped to simulate real food geometry and
yield chemical marker proportional to the degree of thermal treatment would be the best
choice for this study. Two model food system mashed potato and whey protein gel with
the addition of D-ribose (Sigma-Aldrich), have been used in our laboratory for computer
vision analysis of heating patterns (Lau et al, 2003; Wang et al, 2004 and Pandit, Tang,
Mikhaylenko, & Liu, 2006). Salmon in Alfredo sauce was selected as example of real
food system to document the microwave processing for FDA approval. Whey protein gel
was chosen as a model food for salmon since there is no diffusion of whey-sauce phase as
would took place with the mashed potato. The next step for finding the heating pattern of
the product was to find the composition of whey protein that would resemble dielectric
124

behavior of salmon fillet. Adjustment of dielectric properties of whey protein gel was
accomplished by additional salt. A proper composition of salt was found by matching the
dielectric constant and dielectric loss of the whey protein gel and salmon.
Whey protein concentrate (Alacen 878, Fonterra, New Zealand) was used to form
whey protein gels. It contains about 73% protein on dry basis. Other constitutes of the
whey protein concentrate were as follows: moisture 5.5 %, carbohydrates 12.89%, ash
5%, fat 3.72 % and Sodium 1546mg/100g. Due to high amount of amino acids, several
levels of D-ribose (Sigma, St. Louis, MO) were tested to find suitable proportions to
cover the time temperature range of microwave sterilization. Chemical marker formation
and bacterial inactivation have different z and D-values (Prescott, Harley, & Klein,
2002). These refers that temperature changes have different influence on the marker
formation and bacterial inactivation. Because of these reasons, we tested the influence of
path of heating on the relationship of chemical marker formation and bacterial
inactivation. Before applying this method to real food system, we studied how formation
of chemical marker (M-2), bacterial inactivation parameter (Fo) and color value
equivalent to gray-scale value are correlated.
After matching the dielectric properties of the whey protein gel with salmon fillet it
was desirable to compare the time-temperature profiles of the cold spot locations in both
food systems during microwave sterilization. In order to accomplish this study to provide
sufficient support for predicting heating patterns in the real foods, following specific
objectives were considered: 1) Matching the dielectric properties of the model food and
real food, 2) Establishing relationships among M-2 formation, cumulative lethality ( Fo)
125

and color value equivalent gray scale value and 3) Comparing the time-temperature
profiles for model and real food systems during microwave sterilization.
This study will provide basis for application of the developed computer vision
method to emulate the heating patterns and the cold spot with real food systems.
2. Principle and application of chemical marker (M-2) to determine the heating
patterns
Chemical marker M-2 (4-hydroxy-5-methyl-3(2H)-furanone) was developed at the
United States Army Natick Research Center (Kim & Taub, 1993; Prakash, Kim, & Taub,
1997). It is the product of non-enzymatic browning reaction (Maillard reaction) between
D-ribose and amines. Rate of chemical marker M-2 formation during heating was found
suitable for monitoring high temperature short time processes (Lau et al, 2003, Pandit, et
al., 2006). The concept of using chemical marker for monitoring sterilization process is
based on the fact that measured concentration of the thermally generated brown color
(marker M-2) serves as a time-temperature integrator. The concentration of the brown
color formed in food during sterilization operation followed a 1st order reaction (Lau, et
al, 2003) is good indicator of the absorbed thermal energy and sterility to Clostridium
botulinum (Wnorowski & Yaylayan, 2001).
Pandit, Tang, Mikhaylenko & Liu (2006) and Lau et al., (2003) established a first
order reaction for chemical maker M-2 formation in mashed potato and whey protein gel.
The concentration of M-2 yield during a thermal process is related to processing time as:
126

∫ −−−×−−= ∞∞
t
o
aoo dt
TtTRE
kCCCtC0
}])1)(
1[(exp{exp)()( (1)
where C (t) is M-2 marker yield at any time, C∞ marker yield at saturation, Ea is
activation energy, R molar gas constant, T (t) is recorded temperature-time history at the
measured point, and ko is the reaction rate constant at reference temperature (To). Using
the kinetics parameters obtained in Pandit, Tang, Mikhaylenko & Liu (2006) for mashed
potato, the predicted yield of chemical marker (M-2) was compared with measured yield
in mashed potatoes processed in aluminum container after heating in oil bath during ramp
up and holding processes. Comparison showed (Fig. 1) that equation (1) can be used to
predict the chemical marker yield during microwave sterilization process. But direct
compare of Predictions of chemical marker yield for multiple points were impossible
because it requires the time-temperature history of all the points.
y = 0.941x + 0.011R2 = 0.998
0.00
0.05
0.10
0.15
0.20
0.00 0.05 0.10 0.15 0.20 0.25Measured M-2 yield (mg / g sample)
Pred
icte
d M
-2 y
ield
(mg/
g sa
mpl
e)
Fig. 1. Comparison of measured and predicted chemical marker yield based upon the
kinetics parameters.
127

Direct measurement, using HPLC and spectrophotometer, of chemical marker M-
2 yields C(t) at adequate points in microwave sterilized model foods to allow accurate
identification of the cold spot is time-consuming and impractical. In addition, reliable
determination requires multiple experiments. Hence, there was a need for rapid and
accurate method to evaluate the sterilization operation. A computer vision method was
developed to capture the color images of processed model foods. The acquired images
were in three–dimensional RGB color space, which requires a large storage memory
(18.04 Mb) for multiple trays with high resolution. In 3D-RGB color space, each pixel
(commonly known as bits per pixel) is usually apportioned with 8 bits each for red, green
and blue, giving a range of 256 possible values, or intensities for each hue. With this
(non-optimal) system, 16,777,216 (2563 or 224) discrete combinations of hue and intensity
can be specified. This in practice is much larger than gamut of color that can be
reproduced. It is claimed that the human eye can distinguish as many as 10 million
discrete hues (Cowlishaw, 1985). This number varies from person to person depending
upon the condition of the eye and the age of the individual. However, at the resolution of
latest computer screens (1280 × 800 pixels) and at a standard viewing distance people
cannot distinguish more than a few hundred hues (Cowlishaw, 1985). For these reasons,
it was chosen to use grayscale to represent the brown color distribution. Equation (2) was
used in our study to convert RGB image into a grayscale image on a pixel- by- pixel basis
(IMAQ Vision Builder, 2000):
grayscale value = 0.30 R + 0.59 G + 0.11 B (2)
128
This above equation is used in the National Television System Committee (NTSC)
standard for luminance. An alternative conversion from RGB to grayscale is a simple
average:
grayscale value = 3
( R G B )+ + (3)
In mathematical computation on pixel, a grayscale digital image is an image in
which the value of each pixel is a single sample. Grayscale images intended for visual
display are typically stored with 8 bits per sampled pixel (28 = 256 colors), which allows
256 intensities (i.e., shades of gray) to be recorded. The accuracy provided by this format
is sufficient to avoid visible banding artifacts, and very convenient for programming. To
maintain a better appearance on the relatively low color depth, 8-bit color, the stored
value was indexed into a color map or palette. The colors available in the palette itself
may be fixed to the pseudo-color derived from a grayscale image by mapping each pixel
value to a color according to a table or function (Fig. 2).
129
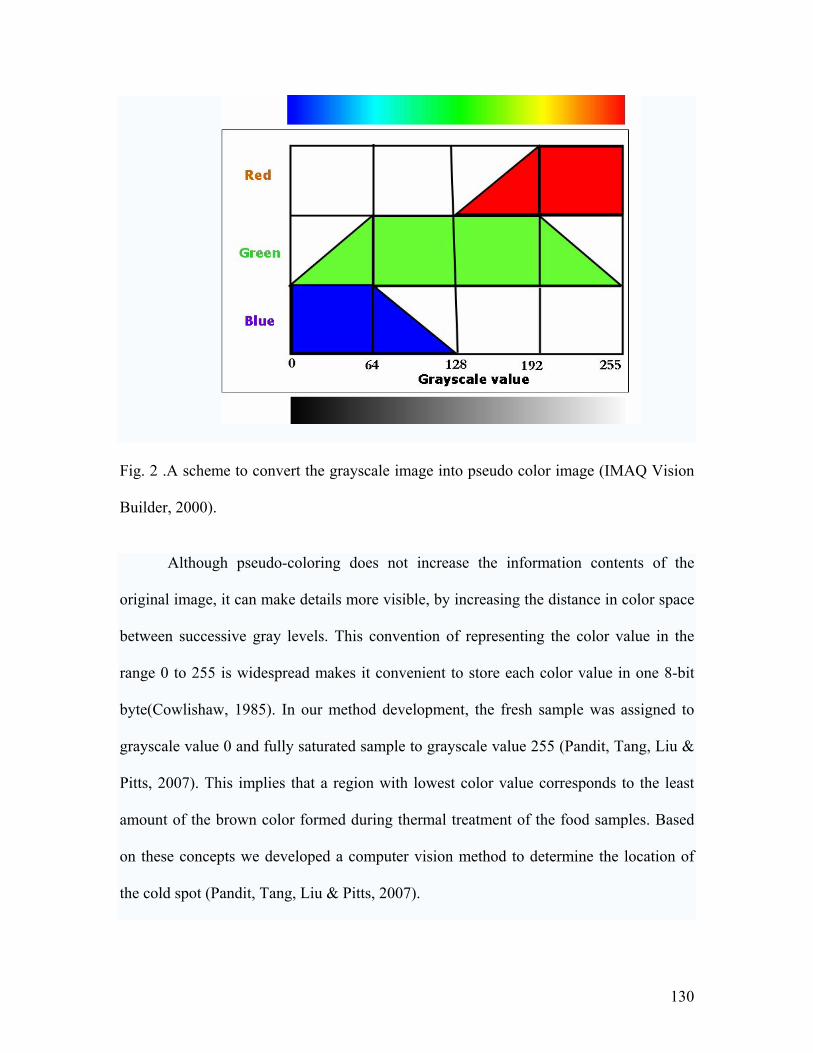
Fig. 2 .A scheme to convert the grayscale image into pseudo color image (IMAQ Vision
Builder, 2000).
Although pseudo-coloring does not increase the information contents of the
original image, it can make details more visible, by increasing the distance in color space
between successive gray levels. This convention of representing the color value in the
range 0 to 255 is widespread makes it convenient to store each color value in one 8-bit
byte(Cowlishaw, 1985). In our method development, the fresh sample was assigned to
grayscale value 0 and fully saturated sample to grayscale value 255 (Pandit, Tang, Liu &
Pitts, 2007). This implies that a region with lowest color value corresponds to the least
amount of the brown color formed during thermal treatment of the food samples. Based
on these concepts we developed a computer vision method to determine the location of
the cold spot (Pandit, Tang, Liu & Pitts, 2007).
130

3. Materials and methods 3.1. Selection of the model food system
Whey protein was selected in this study because it has specific amino acids
(methionine, lysine, histidine, and arginine) needed for chemical marker (M-2) formation
(Lau et al, 2003; Wang et al, 2004 and Pandit, Tang, Mikhaylenko, & Liu, 2006). Whey
protein can easily disperse in water and form firm gel. Whey protein dispersion forms
gels after cooking at 80 oC for 40 minutes. Those gels can then be cut into a desired
geometry to simulate different solid foods. Because of these advantages, whey protein gel
was selected as model food in this study.
Several formulations of whey protein with the marker precursor D-ribose and
different levels of salt were tested to find best possible match for the product of interest.
Throughout the heating process, a phase comes after which there would be no significant
chemical marker formation is called saturation point (Lau et. al., 2003). Heating patterns
analysis after reaching the saturation point is impossible because no significant marker
formation would be observed after that. Whey protein preparation with 1.5% D-ribose
had saturation point at Fo = 12 min and a shorter linear time-span (8-10 min) at 121 oC.
Preliminary study showed that whey protein sample with 1% D-ribose reached a
saturation point when Fo = 18 min at 121 oC temperature (Wang, Wig, Tang & Hallberg,
2003; Wang, Lau, Tang & Mao, 2004). Experiments suggested that for 2.7- 4 kW
microwave power settings the addition of 1% ribose to basic whey protein gel
formulation is effective to visualize the heating patterns. The time span equivalent to 1%
D-ribose was more suitable for evaluation of sterilization process.
131

3.2. Dielectric properties measurement
Dielectric properties of salmon were determined over range of temperatures from
20 to 120 ºC at 1 to 1800 MHz using a Hewlett-Packard 85070B open ended coaxial
probe connected to an Agilent 4291B Impedance Analyzer (Agilent Technologies, Inc.,
Palo Alto, CA) (Guan, Cheng, Wang, & Tang, 2004; Wang, Wig, Tang, Hallberg, 2003).
Five randomly selected fish fillet (Oncorhyncus gorbuscha). The fish was frozen in
Kodiak, AK and filleted, deep-skinned, shipped, stored frozen and thawed in Pullman.
These were female fish recovered from a terminal fishery. Two replications of Ocean
Beauty Seafood shipments were used for this analysis. The salmon sample (15 g) after
being broken into small pieces was placed into the test cell. The dielectric probe was
sealed and kept in close contact with samples through pressure from a stainless steel
spring and piston. Detailed description of the calibration and measurement procedure is
provided in Wang, Wig, Tang, Hallberg (2003).
To match the dielectric properties, addition of salt in whey protein precursor with
1% D-ribose was considered a preferred method. Several levels of salt was tried to match
the dielectric properties with salmon. Additional 0.3% salt in whey protein formulation
matched well with the dielectric properties of salmon fillet.
3.3. Sample preparation
Additional salt was mixed in whey protein concentrate (Alacen 878, Fonterra, New
Zealand) to match the dielectric loss of the whey protein gels to that of the salmon fillet.
Added 0.3% salt and 1% D-ribose (Sigma, St. Louis, MO) were first dissolved in
deionized water at 20 oC to form whey protein gel of 78.07 % moisture content (w.b).
132

Then, small amount of water with dissolved salt and D-ribose was added to the whey
protein concentrate and mixed with spatula. Osterizer blender (Oster Appliances, Boca
Raton, Florida, USA) was used to achieve homogeneity of mixture. The left over water
was used to rinse beaker and the blender. This preparation allowed for the uniform
distribution of whey protein throughout the solution.
A suitable temperature-time combination ( 80oC for 40 minutes) was used to set 200g
of the whey mix into gel of 78.07 % et basis in a 7 oz (14 × 9.5 × 2.67 cm) tray for
heating patterns analysis (Lau et. al., 2003; Wang, Lau, Tang & Mao, 2004)
For kinetics study, 7 g of whey protein samples was cooked in several custom-built
aluminum containers (inner diameters 3.5 cm × height 1.4 cm; Fig. 3).
3.4. Kinetics of chemical marker (M-2) formation with whey protein gel
Due to difference in activation energy for chemical marker formation (Ea = 19.48 ±
0.76 kcal /mol) and bacterial inactivation (Ea = 80 ± 10 kcal /mol) it was anticipated that
the path of heating may influence the chemical marker yield and consequently the heating
patterns (Toledo, 2000). Because of these variables two different pathways: 1) direct
heating to a set temperature; and 2) holding at 121 oC to different Fo. In the first set of
tests, aluminum containers were heated to 110, 116, 121, 126, and 131 oC temperatures
(T) in an oil-bath to different levels of Fo. In another set, oil-bath temperature was set at
121 oC and samples were held for a different period of time to cumulative lethality (Fo) of
1.5, 3, 6, 9, 12, and 15 min. The samples were then rapidly cooled by immersing the
aluminum containers into the ice. The purpose of fast cooling was to minimize additional
cumulative lethality (Fo) after reaching the desired Fo. Each experimental treatment was
133
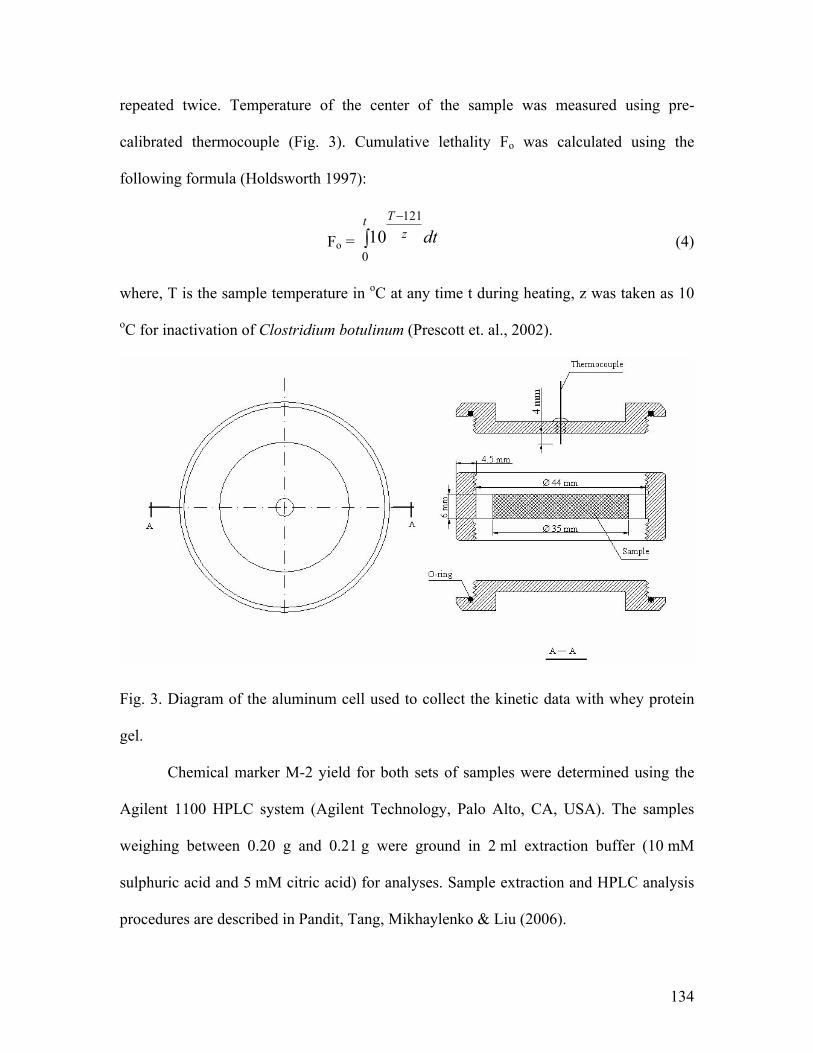
repeated twice. Temperature of the center of the sample was measured using pre-
calibrated thermocouple (Fig. 3). Cumulative lethality Fo was calculated using the
following formula (Holdsworth 1997):
Fo =
121
010
Ttz dt−
∫ (4)
where, T is the sample temperature in oC at any time t during heating, z was taken as 10
oC for inactivation of Clostridium botulinum (Prescott et. al., 2002).
Fig. 3. Diagram of the aluminum cell used to collect the kinetic data with whey protein
gel.
Chemical marker M-2 yield for both sets of samples were determined using the
Agilent 1100 HPLC system (Agilent Technology, Palo Alto, CA, USA). The samples
weighing between 0.20 g and 0.21 g were ground in 2 ml extraction buffer (10 mM
sulphuric acid and 5 mM citric acid) for analyses. Sample extraction and HPLC analysis
procedures are described in Pandit, Tang, Mikhaylenko & Liu (2006).
134
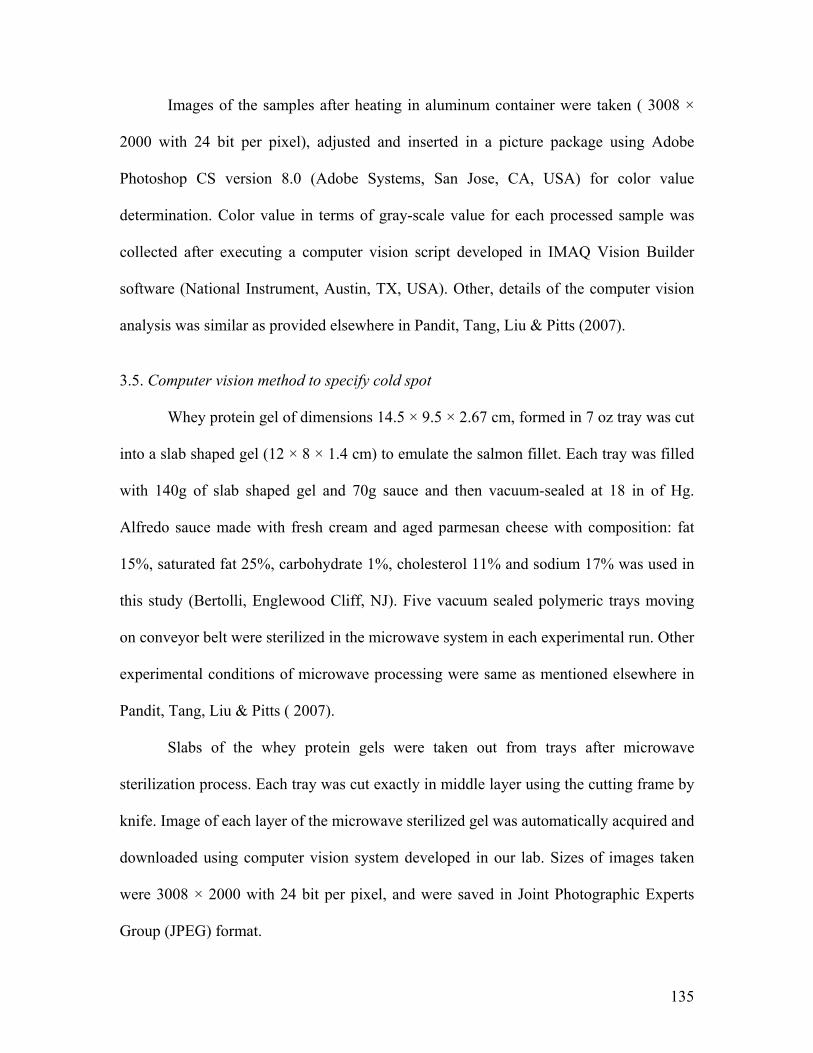
Images of the samples after heating in aluminum container were taken ( 3008 ×
2000 with 24 bit per pixel), adjusted and inserted in a picture package using Adobe
Photoshop CS version 8.0 (Adobe Systems, San Jose, CA, USA) for color value
determination. Color value in terms of gray-scale value for each processed sample was
collected after executing a computer vision script developed in IMAQ Vision Builder
software (National Instrument, Austin, TX, USA). Other, details of the computer vision
analysis was similar as provided elsewhere in Pandit, Tang, Liu & Pitts (2007).
3.5. Computer vision method to specify cold spot
Whey protein gel of dimensions 14.5 × 9.5 × 2.67 cm, formed in 7 oz tray was cut
into a slab shaped gel (12 × 8 × 1.4 cm) to emulate the salmon fillet. Each tray was filled
with 140g of slab shaped gel and 70g sauce and then vacuum-sealed at 18 in of Hg.
Alfredo sauce made with fresh cream and aged parmesan cheese with composition: fat
15%, saturated fat 25%, carbohydrate 1%, cholesterol 11% and sodium 17% was used in
this study (Bertolli, Englewood Cliff, NJ). Five vacuum sealed polymeric trays moving
on conveyor belt were sterilized in the microwave system in each experimental run. Other
experimental conditions of microwave processing were same as mentioned elsewhere in
Pandit, Tang, Liu & Pitts ( 2007).
Slabs of the whey protein gels were taken out from trays after microwave
sterilization process. Each tray was cut exactly in middle layer using the cutting frame by
knife. Image of each layer of the microwave sterilized gel was automatically acquired and
downloaded using computer vision system developed in our lab. Sizes of images taken
were 3008 × 2000 with 24 bit per pixel, and were saved in Joint Photographic Experts
Group (JPEG) format.
135

Adobe Photoshop CS version 8.0 (Adobe Systems, San Jose, CA, USA) was used
to insert images to be analyzed into one package. Fresh and saturated whey protein
samples images were also inserted in each picture package as scale images. A 20 × 25 cm
automatic picture package was divided into 5 × 4 layouts. The first column of the layouts
was reserved for the scale samples and other columns were used for images to be
analyzed for heating patterns. Resolution of images in picture package was set to 500
pixels per inch.
A script developed in IMAQ Vision Builder program was used to determine the
heating patterns and then cartesian co-ordinates of the cold spots locations. Other details
related to developed computer vision method are provided elsewhere in Pandit, Tang, Liu
& Pitts (2007).
3.6. Time-temperature profiles during microwave sterilization
In order to gather time-temperature profiles for considered points, experiments
were conducted in a 915 MHz single-mode pilot-scale microwave sterilization system
with whey protein gel in Alfredo sauce. Thermowell were secured at the specified
locations to insert fiber optics probes during microwave sterilization. Each tray was filled
with 140g slab shaped whey protein gel cut with 70g sauce and then vacuum-sealed at 18
in of Hg. Five trays were set on the conveyor belt in the microwave sterilization system
and a proper speed-time (0.81 inch per second) combination was chosen to move the belt
from the loading section to the holding section through two single-mode microwave
heating sections. Water at 125 oC was circulated across the movement of conveyor belt
inside the pressurized microwave cavities at a flow rate of 40 lpm. The experiments were
136

conducted at a 2.67 kW microwave power level. Initial temperatures of the samples were
maintained at 7 oC. The cold spot location was preheated to 60 oC before trays
movement started from loading to holding section until temperature of the cold spot
reached to 121 oC. The desired Fo (6 min) was achieved by holding trays at 121 oC in the
holding section before cooling was started. Fo during microwave heating was calculated
using Equation (1) and C-value (Cook Value) was calculated as:
C-value = 010
Re f
c
T Tt
z dt−
∫ (5)
where, T is the sample temperature at any time t during microwave sterilization
and zc value for cooking was obtained by using the kinetics parameters provided in Lau
et. al, 2003. TRef is normally taken as boiling point of water (100 oC ) at atmospheric
pressure and zc value for cooking whey protein was gel was found to be 32.59 oC.
In another set of experiments, salmon was processed with Alfredo sauce. Similar
experimental conditions were maintained to measure the time-temperature profiles in
salmon with Alfredo sauce. Data was collected in replicates to compare the time-
temperature trends for considered points.
4. Results and discussion 4.1. Dielectric properties matching
Trend of the dielectric loss and dielectric constant with temperature for salmon
and adjusted whey protein gel formulation are presented in Figs. 4 and 5. The formulation
of whey protein gel with 20% whey protein concentrate + 1% D-ribose + 0.3% salt was
shown to be close to the measured dielectric properties of salmon fillets.
137
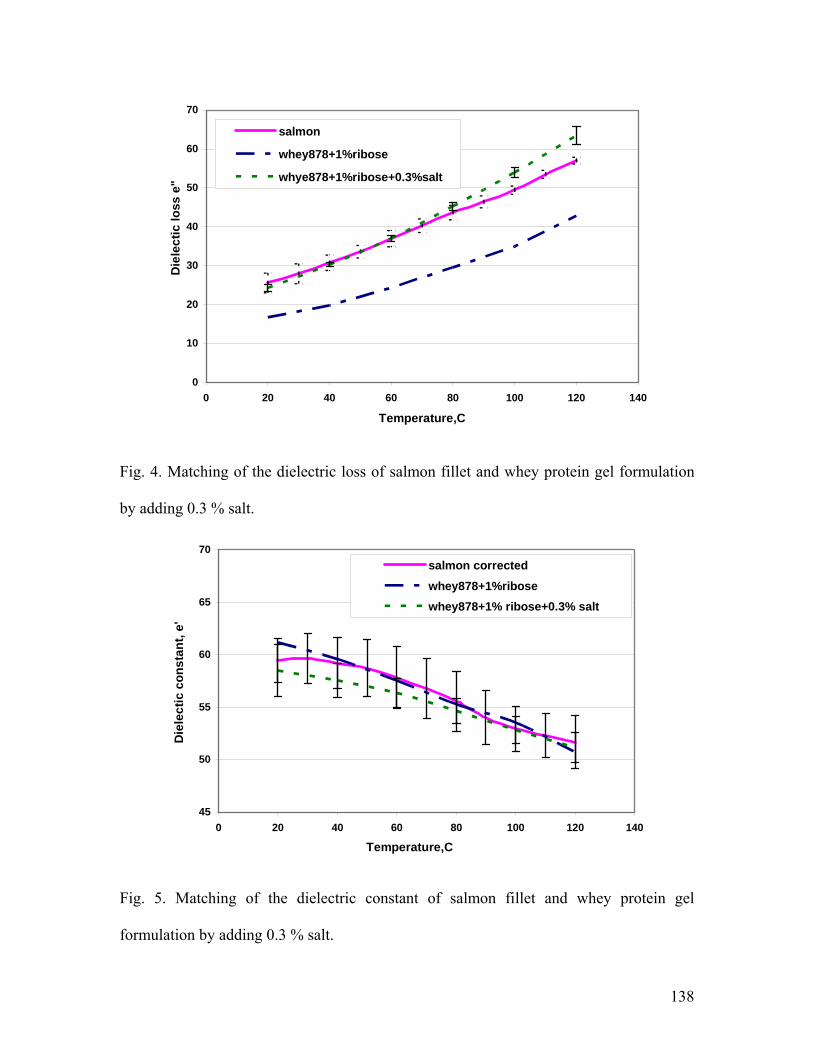
0
10
20
30
40
50
60
70
0 20 40 60 80 100 120 1
Temperature,C
Die
lect
ic lo
ss e
"
40
salmon
whey878+1%ribose
whye878+1%ribose+0.3%salt
Fig. 4. Matching of the dielectric loss of salmon fillet and whey protein gel formulation
by adding 0.3 % salt.
45
50
55
60
65
70
0 20 40 60 80 100 120 140
Temperature,C
Die
lect
ic c
onst
ant,
e'
salmon correctedwhey878+1%ribosewhey878+1% ribose+0.3% salt
Fig. 5. Matching of the dielectric constant of salmon fillet and whey protein gel
formulation by adding 0.3 % salt.
138

4.2. Relationship among color value, M-2 yield and Fo
Chemical marker yield during holding processes was found higher than ramp up
heating (Fig. 6). This confirms that the rate of chemical marker formation is less sensitive
to temperature change than bacterial inactivation as indicated by kinetics parameter in
(Table 1).
Table 1. Comparison of the kinetic parameters of marker formation and bacterial inactivation. Parameters were calculated from kinetics data available in Pandit et. al., 2006.
Parameters Chemical Marker formation
Bacterial inactivation (C. botulinum)
z-value (oC ) 32.57 10
D-value (min) @ 121 oC 0.0198 3.77
k ( min-1) @ 121 oC 116.31 0.61
Chemical marker yields of points corresponding to Fo = 9 min were compared for both
ramp up and holding processes (Fig. 7). The longer cooking during holding (C-value = 47
min) at 121 oC for Fo = 9 min compared to ramp up heating to 128 for Fo = 11.15 min (C-
value = 9.17 min) resulted into higher chemical marker yield (Fig. 6). Differences in the
Fo, C-value and M-2 yield for both methods of heating showed the path dependent nature
of these parameters. Fig. 7 supports the statement that microbial inactivation occurred
faster than chemical marker formation at high temperature. Which is the main attraction
of the high temperature short time (HTST) sterilization processes.
139

Color value equivalent to gray scale value is another variable which was obtained
using computer vision method to represent the concentration of chemical marker formed
during heating (Fig. 8).
y = -0.0038x2 + 0.1233x + 0.2735
R2 = 0.9842
0
0.2
0.4
0.6
0.8
1
1.2
1.4
1.6
0 5 10 15 20 25
Fo (min)
M-2
yie
ld (m
g/ g
sam
ple)
Holding at 121 C
Ramp up to differenttemperature levels
y = 0.0014x2 + 0.0527x + 0.354R2 = 0.9762
Fig. 6. M-2 yield and Fo relationship for whey protein samples heated to different set
temperatures (ramp up) levels or held at 121 oC, data points are based on two replicates.
0
10
20
30
40
50
0 3 6 9 12
Time (min)
C- v
alue
and
Fo
(min
) for
hol
ding
and
ram
p up
he
atin
g
15
Fo- Holding
C-value Holding
Fo- Ramp up
C- value Ramp up
Fig. 7. Comparisons of cook values during holding and ramp up heating at same
cumulative lethality (Fo = 9 min)
140

Color values collected for each sample heated during ramp up and holding
processes were correlated with Fo and M-2 yield. Relationship between color value
equivalent to gray scale value and Fo showed the similar trends for holding and ramp up
heating (Fig. 9). These relationships confirmed that Fo can not uniquely represent the
chemical marker concentrations.
A unique positive correlation was observed between color value equivalent to
gray-scale value and M-2 yield for whey protein samples (Fig. 10).
Fig. 8. Computer vision color patterns of the whey protein gel samples processed at
different temperature level and Fo in oil bath. Experiments were tested in replicates.
The color value equivalent to gray-scale value increases linearly in this case with
chemical marker M-2 yield. This relationship explains that color value is a true indicator
of concentration of chemical marker formed during heating process.
141

0
50
100
150
200
250
0 5 10 15 20 25
Fo (min)
Col
or v
alue
equ
ival
ent t
o gr
ay-s
cale
va
lue.
Holding at 121 C
Ramp up to different temperature
y = - 0.387x2 +12.417x + 17.566R2 = 0.95
y = -0.6716x2 + 22.343x + 21.79R2 = 0.9691 Fo = 16
Fo = 9 Fo =12
Fo = 6
131 128
126 Fo =3
121
116 110
Fig. 9. Color value and Fo relationship for whey protein samples heated to different set
temperatures (ramp up) levels or held at 121 oC, data points are based on two replicates.
4.3. Locations identified for comparisons
The IMAQ Vision Builder script was executed to identify the coldest layers.
Middle layer was observed as coldest layer during microwave processing. A repeatable
computer vision heating patterns was observed for each layer. In middle layer the second
tray (Tray-2) from left was observed as coldest tray. Tray-2 was divided into 40 grids (8
× 5) to collect the color values equivalent to gray-scale value. Based upon the color
values three spots were identified for confirmation in microwave sterilization system
(Fig. 11). A region with lowest color value was identified as cold spot while a
142
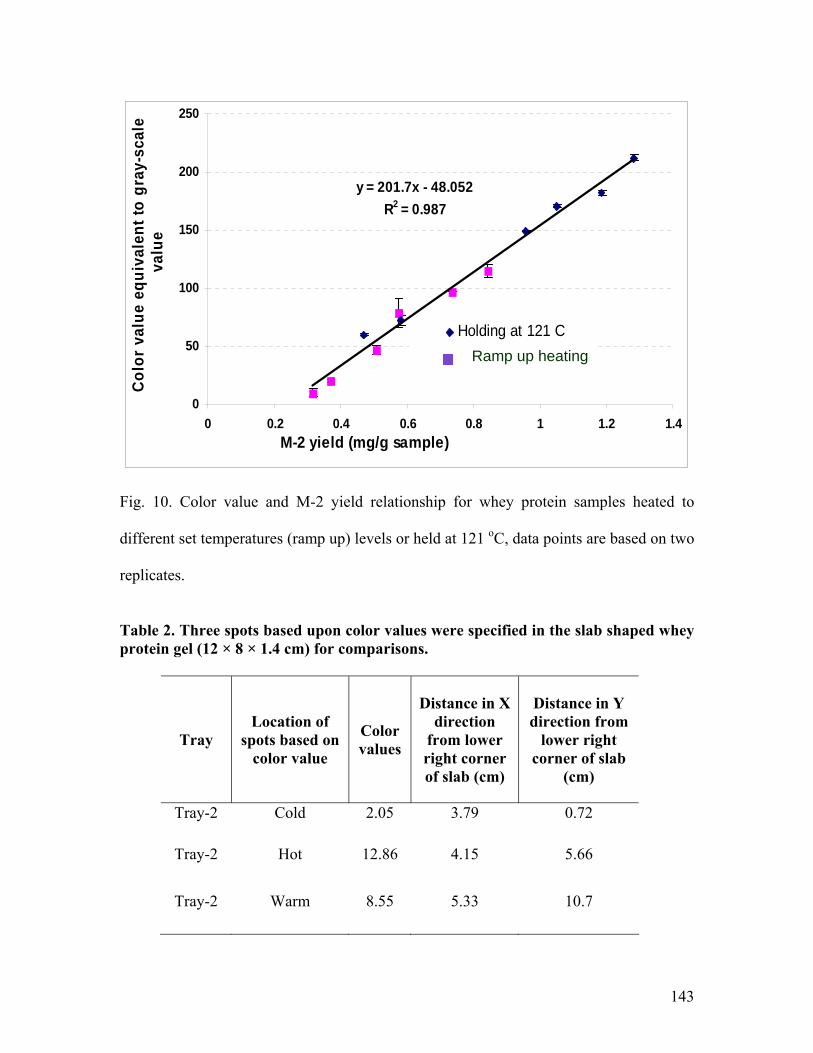
y = 201.7x - 48.052R2 = 0.987
0
50
100
150
200
250
0 0.2 0.4 0.6 0.8 1 1.2 1.4M-2 yield (mg/g sample)
Col
or v
alue
equ
ival
ent t
o gr
ay-s
cale
va
lue
Holding at 121 CRamp up heating
Fig. 10. Color value and M-2 yield relationship for whey protein samples heated to
different set temperatures (ramp up) levels or held at 121 oC, data points are based on two
replicates.
Table 2. Three spots based upon color values were specified in the slab shaped whey protein gel (12 × 8 × 1.4 cm) for comparisons.
Tray Location of
spots based on color value
Color values
Distance in X direction
from lower right corner of slab (cm)
Distance in Y direction from
lower right corner of slab
(cm)
Tray-2 Cold 2.05 3.79 0.72
Tray-2 Hot 12.86 4.15 5.66
Tray-2 Warm 8.55 5.33 10.7
143

Fig. 1. Locations of fiber optics probe inserted in salmon fillet and whey protein gel to
compare the time-temperature profile during microwave sterilization process.
region with highest color value as hot spot. Locations of the selected points, their color
values and positions are presented in Table 2, and Fig.11.
4.4. Validation and matching of time-temperature profiles
Time-temperature profiles of the three points specified by computer vision
method were compared to test the repeatability of the result with whey protein gel.
Result showed a repeatable heating pattern (Fig. 12). Region with lowest color values
144

has lowest temperature, Fo, and C-value (Cook Value). Location 2, which was geometric
center, of the tray was found to be hot spot with highest temperature, Fo and C-value.
0
20
40
60
80
100
120
140
0 5 10 15 20 25 30
Time (min)
Para
met
ers
Water Temp-W
Left generator
Right generator
Cold-W
Hot-W
Warm-W
Water Temp-W2
Left generator
Right generator
Cold-W2
Hot-W2
Warm-W2
Fig. 12. Time-Temperature profiles for three specified points located in whey protein
slab showing the repeatability of the experimental runs.
Time-temperature profiles obtained in whey protein gel were also compared with
salmon (Fig. 13). We observed that cold spots in both food systems were at same
locations. Trends of temperature variations at considered locations were noticed similar.
Table 3 provides the initial and end point data collected at cold, warmer and hot spots
locations for whey protein gel and salmon processed under microwave system.
Preheating temperatures were maintained same for both foods and cold spot were heated
until temperature reached to 121 oC. Microwave heating time for whey protein gel and
salmon with sauce were observed to be very close. Cumulative lethality and cook values
145

were found in accordance at cold, warm and hot spots location with both the food
systems.
0
20
40
60
80
100
120
140
0 5 10 15 20 25
Time (min)
Para
met
ers
Water Temp-W
Left generator-W
Right generator-W
Cold-W
Hot-W
Warm-W
Water Temp-S
Left generator
Right generator
Cold-S
Hot-S
Warm-S
Fig. 13. Comparisons of the time-temperature profiles (S = salmon, & W = whey) at three
specified locations in whey protein gel and salmon with Alfredo sauce during microwave
sterilization.
Matching of the time-temperature profiles for both whey protein gel and salmon
confirmed that whey protein gel can be used as model food to emulate the heating
patterns of real food systems. This resemblance of time-temperature profile also suggests
that dielectric properties of model food need to match close enough with the food to
predict the cold spot.
146

Table 3. Comparisons of the microwave heating parameters for cold, warm and hot spots locations in salmon and whey protein gel processed with Alfredo sauce, data points are based on two replicates (mean ± SD).
Salmon fillet
Whey protein gel
Parameters
Cold Warm Hot Cold Warm Hot
Preheating Temperature
(C)
61.06 ± 0.01
72.38 ± 7.10
81.84 ± 0.42
61.58 ± 0.32
61.45 ± 3.63
62.1 ± 1.75
Final Temperature
( C )
120.87 ± 0.99
133.86 ± 1.50
130.81 ± 5.98
121.32 ± 0.19
127.85 ± 3.57
129.89 ± 1.17
Fo (min) 8.1 ± 0.028
26.325 ± 11.22
53.07 ± 9.57
10.53 ± 0.18
24.04 ± 9.24
40.53 ± 7.74
Cook Value (min)
36.55 ± 5.15
47.82 ± 2.30
60.66 ± 2.39
41.27 ± 1.38
53.005 ± 5.89
64.99 ± 2.93
MW Heating Time (min)
5.96 ± 0.63
6.16 ± 0.01
The methodology developed in this study can be used to predict the cold spot and heating
patterns in other food system.
5. Conclusions Dielectric properties of the whey protein gel can be adjusted to match the real
foods. Due to difference in kinetics parameters, chemical marker formation and bacterial
inactivation were found to be dependent on the path of heating. Color value equivalent to
gray-scale value can be used to indicate the concentration of chemical marker M-2
formed during microwave sterilization process. A region of lowest color value can be
identified as cold region of the microwave sterilization process. During microwave
sterilization, time-temperature profiles of the points selected by computer vision method
were found repeatable. Cold spots identified in model food systems matched those for a
147

real food consisting of pink salmon in Alfredo sauce during microwave sterilization.
Time and temperature trend at the warmer and hot points in whey protein gel also
matches well with salmon during microwave sterilization. This study confirmed that
whey protein gel can be used to emulate the heating pattern in real food system. Protocol
developed in this study can be applied for other food system to predict the cold spot of
microwave processing.
Acknowledgments
This research work was supported by the US Army Natick Soldier Center, Natick,
MA and the Washington State University Agricultural Research Center, Pullman WA.
Nomenclature C cook value (min)
D decimal reduction time (min)
oC initial marker yield (gm/ ml of sample)
∞C marker yield at saturation (gm/ ml of sample)
Ea activation energy (kcal mol-1)
Fo cumulative thermal lethality (min)
t time (min)
TRef reference temperature
T temperature (K)
zc z value ( oC )
148

References Cowlishaw, M. F. (1985). Fundamental requirements for picture presentation, Proc.
Society for Information Display, Volume 26, No. 2 .
Du, C. J., & Sun, D. W. (2004). Recent developments in the application of image
processing techniques for food quality evaluation. Trends in Food Science and
Technology, 15, 230-249.
Godereaux, S.C., Goullieux, A., & Kint, M. Q. (2003). Elaboration and kinetic modeling
of the formation of a biochemical marker to quantify HTST processing. Food
Research International. 36:131-139.
Dworkin, S. B., & Nye, T. J. (2006). Image processing for machine vision measurement
of hot formed parts. Journal of Materials Processing Technology, 174:1-6.
Guan, D., Cheng, M., Wang, Y., & Tang, J. ( 2004). Dielectric properties of mashed
potatoes relevant to microwave and radio-frequency pasteurization and
sterilization processes. J. Food Sci . 69(1):30-37
Holdsworth, S. D. (1997). Sterilization, pasteurization and cooking criteria. Thermal
processing of packaged foods. (pp. 99-110). New York, USA: Blackie Academic
and Professional.
Kim, H. J., & Taub, I. A. (1993). Intrinsic chemical markers for aseptic processing of
particulate foods. Food Technology, 47(1), 91– 99.
Kim, H. J., & Ball, D. (1994). Analysis of thermally produced compound in foods by
thermospray liquid chromatography- mass spectrometry and gas chromatography-
mass spectrometry. Journal of Agricultural and Food Chemistry. 42:2812-2816.
149

Kumar A., Ganjyal, G. M., Jones D. D., & Hanna M. A. (2006). Digital image processing
for measurement distribution in a laboratory extruder. Journal of Food
Engineering, 75, 237-244.
Lau, M. H., Tang, J., Taub, I. A., Yang, T. C. S., Edwards, C. G., & Mao, R. (2003).
Kinetics of chemical marker formation in whey protein gels for studying high
temperature short time microwave sterilization. Journal of Food Engineering,
60, 397-405.
Li, Q., Wang, M., & Gu, W. (2002). Computer vision based system for apple surface
defect detection. Computers and Electronics in Agriculture, 36(2-3), 215-223.
Pandit, R. B., Tang, J., Liu F., & Pitts, M. (2007) Development of a novel approach to
determine heating pattern using computer vision and chemical marker (M-2)
yield. Journal of Food Engineering, 78(2): 522-528.
Pandit, R. B., Tang, J., Mikhaylenko, G., & Liu F. (2006). Kinetics of chemical marker
M-2 formation in mashed potato-a tool to locate cold spots under microwave
sterilization. Journal of Food Engineering. 76(3): 353-361.
Prakash, A., Kim, H. J., & Taub, I. A. (1997). Assessment of microwave sterilization of
foods using intrinsic chemical markers. Journal of Microwave and
Electromagnetic Energy, 32(1), 50-57.
Prescott, L. M., Harley, J. P., & Klein, A. D. (2002). Control of microorganism by
physical and chemical agents. Microbiology, fifth edition. The McGraw-Hill
Companies Inc., New York, NY. 136:144.
150

Ross, W. E. (1993). Relation of bacterial destruction to chemical marker formation
during processing by thermal pulses. Journal of Food Processing Engineering.
16:247-270.
Steenhoek, L. W., Misra M. K., Hurburgh, C. R., & Bern, C. J. (2001). Implementing a
computer vision system for corn kernel damage evaluation. Applied Engineering
in Agriculture. 17(2):235-240.
Toledo, R. T. (2000). Kinetics of chemical reactions in Foods. Fundamental of Food
Process Engineering. CBS Publisher & Distribution, New Delhi, India. 302-314.
Tan, J. (2004). Meat quality evaluation by computer vision. Journal of Food
Engineering. 61: 27-35.
Wang, Y., Lau, M. H., Tang, J., & Mao, R. (2004). Kinetics of chemical marker M-1
formation in whey protein gels for developing sterilization processes based on
dielectric heating. Journal of Food Engineering. 64: 111-118.
Wang, Y., Wig, T. D., Tang, J., & Hallber, L. M. (2003). Dielectric properties of foods
relevant to RF and microwave pasteurization and sterilization. Journal of Food
Engineering. 57(3):257-268.
Wang S., Tang J., Johnson J.A., Mitcham E., Hansen J.D., Hallman G., Drake S.R.,
& Wang, Y. (2003). Dielectric properties of fruits and insect pests as related to
radio frequency and microwave treatments. Biosystems Eng., 85(2): 201-212.
Wnorowski, A., & Yaylayan V. A. (2001). Prediction of process lethality through
measurement of Maillard-generated chemical markers. JFS: Food Chemistry and
Toxicology. 67(6):2149-2152
151

Yam, K. L., & Papadakis, E. S. (2004). A simple digital imaging method for measuring
and analyzing color of food surfaces. Journal of Food Engineering. 61: 137-142.
152

CHAPTER 7
A COMPUTER VISION METHOD TO LOCATE THE COLD SPOTS IN AN
ENTRÉE: SALMON WITH ALFREDO SAUCE, DURING A MICROWAVE
STERILIZATION PROCESS
Ram Bhuwan Pandit, Juming Tang*, Frank Liu, Galina Mikhaylenko and Huan-Chung, Jung (2006)
International Microwave Power Institute 40th Annual Symposium Proceedings
*Department of Biological Systems Engineering, Washington State University, 213 L J Smith Hall, Pullman, WA 99164-6120, USA.
Abstract Salmon fish with sauce was selected as a real food to study the heating
characteristics of 915 MHz single-mode microwave sterilization system. This paper
presents a methodology to locate the cold spots in an entrée style product consisting of a
pink salmon fillet in an Alfredo sauce using computer vision method. Due to color
change of salmon after microwave processing it was not possible to locate the cold spots
directly in salmon fillet using computer vision method. Therefore, whey protein gels
containing 1% D-ribose cut into rectangular slabs, to simulate fish fillet, were used to
locate the cold spots. Dielectric properties of whey protein gels were matched with those
of salmon by adding 0.3 % salt to the basic whey protein gel formulation. The rectangular
slabs of whey protein gels (140 g) were sterilized in microwave system with sauce (70 g).
Alfredo Sauce made with fresh cream and aged parmesan cheese with composition: fat
15%, saturated fat 25%, carbohydrate 1% and sodium 17% was used in this study. Color
intensity of chemical marker (M-2) yield in whey protein gels after microwave
processing was captured and analyzed using computer vision system to obtain the heating
patterns. The cold spots corresponded to lightest regions in the gel. The cold spot

locations determined in whey protein gels were validated using salmon in sauce. Direct
temperature measurement using fiber optics probes at different locations in salmon fillet
during microwave sterilization process confirmed the identified cold spot locations.
Microbiological validation was also conducted to support the study. Results showed that
adjusted dielectric properties of whey protein gel in combination with a computer vision
method can predict the cold spot in real food system. The developed computer vision
procedures will be used to validate and provide documentation for the system
effectiveness as needed in order to receive FDA approval for a microwave sterilization
scheduled process for this food.
Keywords: Computer vision; chemical marker M-2 yield; heating patterns; microwave
sterilization; image processing; IMAQ vision builder; cold spot; salmon fillet.
1. Introduction Computer vision method has been proven as a promising tool to locate the cold
spots in microwave sterilization processes (Pandit, Tang, Liu, & Pitts, 2007). Due to
intricacy in the designed microwave sterilization system, our research group was in need
to develop a rapid and efficient tool to determine cold spot and monitor the machinery
system as well other related unit operations (Pathak, Liu, & Tang, 2003). In our research,
we have developed a computer vision system and method to determine the heating
patterns of the microwave sterilized foods (Pandit, Tang, Liu, & Pitts, 2007).
A successful development and validation of a computer vision method with
model food, mashed potato, to identify cold spot of microwave sterilization processes
154

was accomplished. It was always a concern regarding application of the developed
method to real food systems. Interacting with FDA, Microwave Heating Group of
Washington State University, Pullman, USA, selected salmon with Alfredo sauce the real
food system to study the efficacy of the sterilization system before FDA approval. The
computer vision method to locate cold spot is based on the development of brown-
reddish color corresponding to the accumulation of chemical marker (M-2) yield in
mashed potato or whey protein gel (Pandit, Tang, Mikhaylenko, & Liu, 2006) during
sterilization process. Chemical marker (M-2) is a product of the reaction between amino
acids and D-ribose (Lau et. al., 2003). Due to the color of the salmon fillet, the cold spot
detection method based on chemical marker yield can’t be applied directly to sterilize
salmon.
In our previous studies, we developed a protocol for analyzing the heating
patterns using mashed potato as a model food system. But mashed potato used in
previous studies was impractical to identify the cold spot in fish with sauce since it would
‘fall apart’ during the microwave treatment. Whey protein would be better choice
compared to mashed potato to simulate the heating patterns of fish because it can be
shaped to simulate salmon fillet to yield chemical marker during thermal treatment. An
exhaustive study including kinetics of whey protein gel was performed to establish whey
protein gel as model to emulate the heating patterns of a salmon fillet. Comparison of
time and temperature profiles between whey protein gel and salmon products were
performed for microwave sterilization process. Our preliminary study showed that whey
protein gel can emulate the heating patterns for this particular food system.
155

In light of the above mentioned facts, this study presents a method to identify and
validate the cold spots locations in salmon with sauce after microwave sterilization. In
order to develop the complete protocol, following specific objectives were set: 1) identify
the cold spot locations in whey protein gel, shaped to simulate salmon fillet, with Alfredo
sauce; 2) validations of the identified cold spot locations in salmon with Alfredo sauce.
Identification and validation of the cold spots with fish and sauce in this study
were accomplished to prepare documentation for FDA filing of a scheduled process
developed for 915 MHz single-mode microwave sterilization system.
2. Materials and methods 2.1. Selection of the model food system
Whey protein has specific amino acids (methionine, lysine, histidine, and arginine)
needed for chemical marker (M-2) formation. In addition to amino acids availability,
whey protein can also be easily dispersed in water and form firm gel. Whey protein
dispersion forms gels after cooking at 80 oC for 40 minutes, they can then be cut into a
rectangular slab to simulate the salmon fillet (Lau et. al., 2003; Wang, Lau, Tang, & Mao,
2004.). Because of these advantages, whey protein was selected as model food.
During a heating process, a phase after which there would be no significant chemical
marker formation is referred to as at the saturation point (Lau et. al., 2003, Wang, Lau,
Tang, & Mao, 2004). Several levels of D-ribose (0.75%, 1% and 1.5 %) were tried to find
the suitable combination of ribose and potato flakes levels. It was necessary to find the
appropriate combination of D-ribose to facilitate the suitable time, and Fo range for
microwave sterilization study. Whey protein preparation with 1.5% D-ribose had
156
saturation point at Fo = 12 min and a shorter linear time-span (8-10 min) at 121 oC.
Whey protein with 0.75 % ribose has not sufficient browning for duration of microwave
heating. Our preliminary studies indicated (data not shown) that whey protein sample
with 1% D-ribose has saturation point of Fo = 18 min at 121 oC temperature. This time
span was more suitable for evaluation of sterilization process.
2.2. Sample preparation for heating pattern analysis
An appropriate amount of salt (0.3 %) was added to whey protein concentrate
(Alacen 878, Fonterra, New Zealand) in preparing a whey protein gels to match its
dielectric property with that of salmon. Several formulations of whey protein with the
marker precursor D-ribose and different levels of salt were tested to find best possible
match for the product of interest. A considerable matching of dielectric properties was
obtained for 0.3 % salt (Pandit, Tang, Mikhaylenko, Liu & Tang, 2007a). The
formulation of whey protein 20 % + 1 % ribose + 0.3 % salt was chosen to be close to the
determined dielectric properties of salmon filets. The added 0.3% salt and 1% D-ribose
(Sigma, St. Louis, MO) were first dissolved in 78.07 % (wb) of water at 20 oC. Then,
small amount of water with dissolved salt and D-ribose was added to the whey protein
concentrate and mixed with spatula. Osterizer blender (Oster Appliances, Boca Raton,
Florida, USA) was used to achieve homogeneity of mixture. The left-over water was used
to rinse beaker and the blender. This preparation allowed for the uniform distribution of
whey protein throughout the solution.
2.3. Chemical marker formation versus bacterial inactivation kinetics
157

Activation energy for chemical marker formation (Ea = 19.48 ± 0.76 kcal /mol) is
lower than bacterial inactivation (Ea = 80 ± 10 kcal /mol) (Prescott et al, 2002). Due to
difference in z-values, bacterial inactivation (z-value = 10 oC) seems to be much more
sensitive to temperature variation than chemical marker formation (z-value = 32.59 oC).
Another kinetics parameters such as, D-value and reaction constant (k) for both chemical
marker formation and bacterial (C. botulinum) inactivation, are noticeable different
(Table 1). In general, a given chemical marker concentration can be reached through
many different time-temperature histories (Wnorowski and Yaylayan, 2001; Kim and
Ball, 1994; Kim and Choi, 1998). Because of these variables two different pathways
namely, 1) direct heating to a set temperature; and 2) holding at 121 oC to different Fo,
were considered in to test the validity of these facts. Kinetics parameters for chemical
marker formation and bacterial destruction are presented in Table-1. Presented data is
based upon the kinetics information available in Pandit et al., 2006.
Table 1. Comparison of the kinetic parameters of marker formation and bacterial
inactivation. Parameters were calculated from kinetics data available in Pandit et.
al., 2006.
Parameters Chemical Marker formation
Bacterial inactivation (C. botulinum)
z-value (oC ) 32.57 10
D-value (min) @ 121 oC 0.0198 3.77
k ( min-1) @ 121 oC 116.31 0.61
158
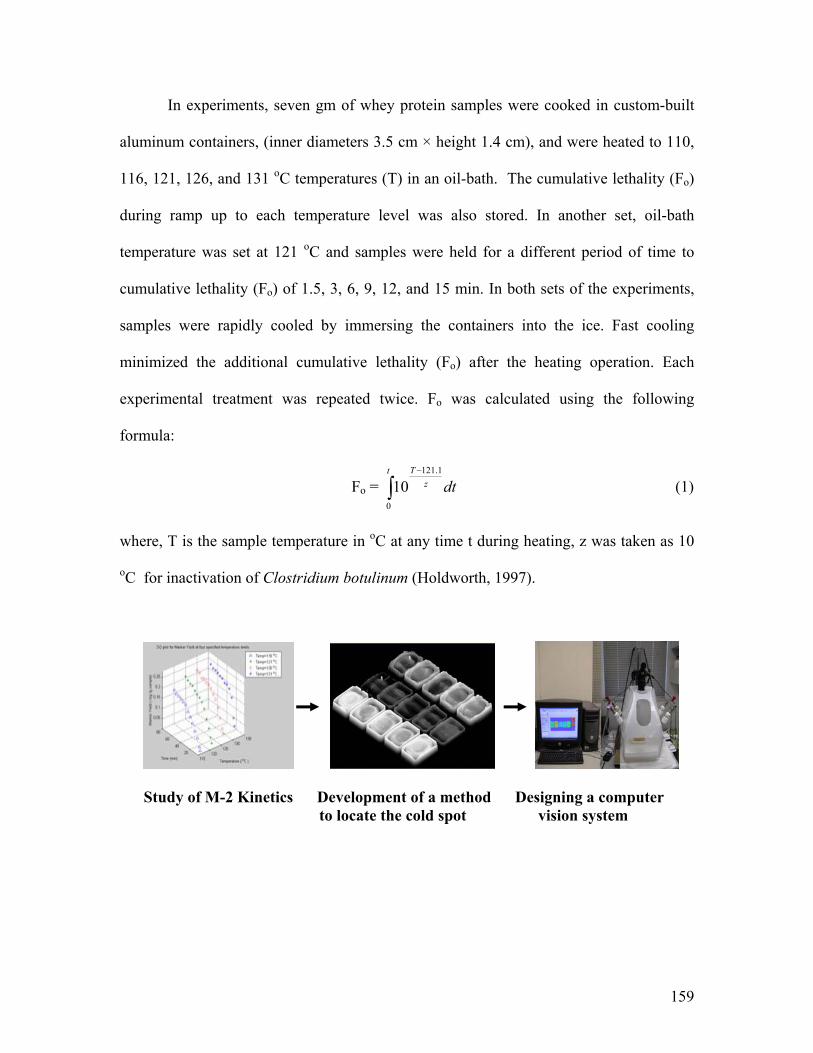
In experiments, seven gm of whey protein samples were cooked in custom-built
aluminum containers, (inner diameters 3.5 cm × height 1.4 cm), and were heated to 110,
116, 121, 126, and 131 oC temperatures (T) in an oil-bath. The cumulative lethality (Fo)
during ramp up to each temperature level was also stored. In another set, oil-bath
temperature was set at 121 oC and samples were held for a different period of time to
cumulative lethality (Fo) of 1.5, 3, 6, 9, 12, and 15 min. In both sets of the experiments,
samples were rapidly cooled by immersing the containers into the ice. Fast cooling
minimized the additional cumulative lethality (Fo) after the heating operation. Each
experimental treatment was repeated twice. Fo was calculated using the following
formula:
Fo = dtt
zT
∫−
0
1.121
10 (1)
where, T is the sample temperature in oC at any time t during heating, z was taken as 10
oC for inactivation of Clostridium botulinum (Holdworth, 1997).
Study of M-2 Kinetics Development of a method Designing a computer to locate the cold spot vision system
159

0.00
0.05
0.10
0.15
0.20
0 5 10 15 20F o ( mi n ) Relationship between color Position of cold spots Temperature and values Fo, and M-2 Yield with several food systems microbial validation Fig. 1. Major steps involved in computer vision study to determine the location of cold
spots in microwave sterilization process.
Chemical marker M-2 yield for both sets of samples were determined using the
Agilent 1100 HPLC system (Agilent Technology, Palo Alto, CA , USA). The samples
weighing between 0.20 g and 0.21 g were ground in 2 ml extraction buffer (10 mM
sulphuric acid and 5 mM citric acid) for analyses. Sample extraction and HPLC analysis
procedures are described in Pandit et al. (2006).
Images (3008 × 2000) of the samples heated in aluminum container were taken
using the automatic image acquisition system with 24 bit per pixel. Images resolution
and sizes were adjusted before inserting each image into a picture package. Adobe
Photoshop CS version 8.0 (Adobe Systems, San Jose, CA, USA) was used to insert all
images in one package for comparing the heating intensity. Experiments were done in
replicate and each package was analyzed in IMAQ Vision Builder software (National
Instrument, Austin, TX, USA) for color determination. Color value equivalent to gray-
scale value for each processed sample was collected after executing a computer vision
script developed in IMAQ Vision Builder.
160

2.4 Computer vision heating patterns
Computer vision method developed in this research work to simulate the heating
patterns in salmon with Alfredo sauce involved several major steps. These steps in order
are presented in Fig. 1. Details of the principle and application of the computer vision
method to determine the cold spot in real food system is provided elsewhere (Pandit,
Tang, Mikhaylenko, Liu, & Tang, 2007a).
2.4.1. Color palette and development of a new scale
On grayscale the color distribution in an image is represented by positive integer
between 0 and 255. The lowest number in heating pattern analysis corresponded to the
lightest intensity of brown color of the processed tray. Similarly, the darkest color
corresponded to highest grayscale value in each analysis. Color intensity of the processed
trays varies upon the level of the thermal treatment (Fo). Due to these variations it was
impossible to compare heating patterns of two separate experiments, or even two trays in
same experiment. For comparative study, it was necessary to fix the gray-level values to
certain pixel intensity in each analysis. This was done by inserting fully saturated and
unheated (Fresh) whey protein gels samples in each analysis. The saturated whey protein
gel sample (Fo = 18 min; marker yield =1.14 ± 0.09 mg/g sample) was always fixed to the
upper most point of the scale by setting color value to 255. The unheated whey protein
gel sample (marker M-2 yield = 0.12 ± 0.07 mg/g sample) was fixed to the lowest point
of the scale by setting color value to zero. For these purpose, samples processed in
Aluminum container were inserted in each picture package of the Adobe Photoshop 8.0
to fix the scale and to facilitate the comparative heating patterns analysis.
161

2.4.2. Image Acquisition and Image editing using Adobe Photoshop Nikon’s Capture camera control program was used for automatically acquiring
and downloading the image on Dell Workstation. Sizes of images taken were 3008 ×
2000 with 24 bit per pixel, and were saved in Joint Photographic Experts Group (JPEG)
format.
Adobe Photoshop CS version 8.0 (Adobe Systems, San Jose, CA, USA) was used
to insert scale images and images to be analyzed into one package. A 20 × 25 cm
automatic picture package was divided into 5 × 4 layouts (Thomas, 2003). The first
column of the layouts was reserved for the scale samples and other columns were used
for images to be analyzed for heating patterns (Fig. 2). Resolution of images in picture
package was set to 500 pixels per inch.
2.4.3. Functions in computer vision script A computer vision script in IMAQ Vision Builder was developed through
interactive programming to determine the heating patterns of microwave processed
samples. Several additional functions were added into the script to generate the grid and
extract the color values. The extracted color values were compared to locate cold spot in
the tray. A flow chart and functions of IMAQ Vision Builder script is provided in the Fig.
3. Details of the functions are described elsewhere in Pandit (2007b).
162

Fig. 2. Images of top, middle, and bottom layers along with the scale sample inserted in
one picture package of Adobe Photoshop before analyzing the heating patterns.
163

Fig. 3. Flow chart of major steps developed in computer vision method to determine the
cold spot location.
164

Several additional functions with the option of selecting either dilation or erosion were
added into the scripts. These grayscale morphological operators filter or smooth the pixel
intensities that results into noise filtering, background correction and gray-level feature
extraction. Selection of anyone of these operators which influences the brightness of the
neighborhood pixel may lead to much clear heating patterns. The neighborhood is
defined by structuring elements.
Sternberg’s formulae for computing the gray value dilation and erosion are the
most straightforward. This formula is based on the concept of umbra. Let X R⊂ n and
f: X R be a function. Then the umbra of f, denoted by u(f) is the set u(f) R→ ⊂ n+1,
defined by ( Ritter & Wilson, 2000):
u(f) = 1
1 2 3 1 1 2 3
1 1 2 3
( , , , ............. , ) : ( , , , ............. )( , , , ............. )
nn n n
n n
x x x x x R x x x x X andx f x x x x
++
+ ≤
⎧ ⎫∈ ∈⎪ ⎪⎨ ⎬⎪ ⎪⎩ ⎭
(2)
Since u(f) R⊂ n+1 , we can dilate u(f) by any other subset of Rn+1. This observation
provides the clue for dilation of gray-valued images. In general dilation of a function
f : Rn→R by a function g: X R, where X R→ ⊂ n is defined through the dilation of their
umbra u(f) u(g) as follows: ×
Let, x = ( 1 2 3, , , ............. nx x x x ) nR∈ (3)
and a function d: Rn→R which can be define as:
d(x) = max { z R∈ : (x, z)∈ u(f)× u(g)} (4)
then we define dilation as:
f× g ≡ d. (5)
and similarly erosion of f by g is defined as the function:
165

f / g ≡ e (7)
where e = -[(-f) × ĝ] and ĝ (x ) = g (-x).
For two-dimensional calculation, the new functions d = f× g and e = f / g for dilation
and erosion respectively reduces ( Acharya & Ray, 2005):
d(y) = { }max ( ) ( )x X
f y x g x∈
+ + (8)
for the dilation, and
e(y) = { }'
*min ( ) ( )x X
f x y g x∈
+ − (9)
for the erosion, where is defined by: * *:g X R→
(10) *( ) ( )g x g x x X= − ∀ ∈ *
In practice the function f represents the image and g represents the structuring element.
IMAQ Vision Builder operates with structural element of dimension 3×3, 5×5 and 7×7.
In our study a structuring element of size 3 × 3 was selected for most of cases.
The color intensity meter function of the script measures the grayscale image
statistics in an image or regions in an image. IMAQ Vision Builder contains the
following densitometer parameters: minimum gray value, maximum gray value, mean
gray value and standard deviation. An area with minimum standard deviation of the color
value was selected as grid size to extract the color values. If G represents the set of
grayscale G = {0, 1, 2, …………..255} values of the selected region of interest (ROI)
then mean ( ) is commonly referred as average: G−
1
1 Ni
iG
N
−
== G∑ (11)
The standard deviation ( V ) of the color value was calculated as: −
166

2
1
1 (1
Ni
iV G
N
− −
==
−∑ )G− (12)
The last step in this application was measurement of the distances in real word units. The
dimensional measurements obtained from the image must be compared with values that
are specified in real units. For this purpose, we converted the measurement from the
image into real-word units using the calibration tools (IMAQ Manual, 2004).
2.4.4. Heating patterns analysis with whey protein sample Whey protein gel of dimensions 14.5 × 9.5 × 1.4 cm was first formed in 7 oz tray
at 80 oC, then cut into a slab shaped gel (12 × 8 × 1.4 cm) to emulate the salmon fillet.
Alfredo sauce made with fresh cream and aged parmesan cheese with composition: fat
15%, saturated fat 25%, carbohydrate 1%, cholesterol 11% and sodium 17% was used in
this study (Bertolli, Englewood Cliff, NJ). Seventy grams of sauce was added to the tray,
with half of the sauce on the bottom and half on top of the whey protein gel’s slab prior
to sealing and microwave heating. Five vacuum sealed polymeric trays (18 inch of Hg
vacuums) moving on a conveyor belt were sterilized in the microwave system in each
experimental run. Other experimental conditions of microwave processing were same as
mentioned elsewhere in Chapter 3 (Pandit et al., 2007). In the first step, the coldest layer
in microwave sterilization was obtained by comparing top, middle and bottom layers of
the trays. In the next step, the coldest tray was identified in the coldest layer. Total 40
rectangular grids (5 × 8) were generated on the coldest tray to collect the grayscale values
equivalent to color value. Color values were directly extracted into the Excel spreadsheet
to obtain the lowest color value. A rectangular grid with lowest color value was declared
as the cold spot of the microwave sterilization process. A script developed in IMAQ
167

vision builder program was used to determine the Cartesian co-ordinates of the cold
spots.
For microbiological validation and real temperature measurement we identified
three spots corresponding two three lowest color values or appearing as blue in computer
vision heating patterns. The specified locations were validated using salmon in Alfredo
sauce.
3. Validation of Computer Vision Heating Patterns 3.1. Validation of the cold spot using microwave system In order to validate the accuracy of the cold spots determined by the computer
vision method, experiments were conducted in a 915 MHz single-mode pilot-scale
microwave sterilization system with salmon and sauce. Thermo wells that separate sealed
sample from fiber-optic sensors were fitted into the tray at the measured co-ordinates of
cold spots locations. Each tray was filled with 140g of salmon fillet and 70g sauce and
then vacuum-sealed at 18 in of Hg. A mesh belt with several small pins was used to hold
and move the belt from the loading section to the holding section through two single-
mode microwave heating section during the microwave processing. Water at 125 oC was
circulated across the movement of conveyor belt inside the pressurized microwave
cavities at a flow rate of 40 liter per minute. The experiments were conducted at a 2.67
kW microwave power level.
3.2. Validation of the cold spot using inoculated pack studies
168

Clostridium sporogenes PA 3679 spores (batch 308, NFPA strain) were used to
validate the cold spot. The inoculums level in this study was set to 106 CFU. The heat
resistance of these spores was evaluated previously in phosphate buffer (D121=0.8 min).
The D-values of the spores in salmon and Alfredo sauce were 1.03 and 1.05 min at
121°C, respectively.
The schedules for automatic processing of the salmon fillets were established for
different Fo levels in microwave sterilization system. Preliminary inoculation pack
studies were carried out to verify the correctness of selected auto schedules for different
Fo levels. Large scale inoculation pack studies were carried out to verify the effectiveness
of sterilization process in Washington State University microwave sterilization system.
The cold spots determined by the heating pattern of whey protein gels were validated
using the real product temperature profile.
Spores were injected into salmon fillet in several locations of potential cold spots
identified by computer vision method of microwave-processed whey protein gel that
simulated salmon fillet. Three levels of Fo, 3.0, 6.0, and 12.0 (target Fo = 6.0 min) based
on information used to define scheduled process for processing were considered in
inoculated pack test. After processing, the salmon trays were subjected to incubation 32ºC
for a week and trays with positive growth were sought (Guan et al., 2003).
4. Results and discussion A unique positive correlation was established between color value equivalent to
gray-scale value and M-2 yield for whey protein samples heated during ramp up and
holding method (Pandit, 2007a). This relationship confirmed that color value equivalent
169

to gray-scale value increases uniquely with increase in chemical marker M-2 yield
(Fig.4).
Heating patterns of the top, bottom and middle layers of each experimental
replicate were compared to find out the coldest layer (Fig. 5). Due to limitations of the
microwave power penetration and heat conduction, the middle layer of each tray was
determined as the coldest layer. Comparisons of the middle layers heating patterns for the
five trays are shown in Fig. 6 Second tray from left (Tray-2) was observed as the coldest
tray during sterilization process. In Tray-2 three minimum color values regions: 2.05,
8.55 and 12.86 were identified for experimental validation (Table 2). Considering bottom
left corner of the Tray-2 as the reference point, location of first point was measured as x =
3.79 cm, y = 0.72 cm, second point as x =5.66 cm, y = 4.12 cm and third point as x =
5.33 cm, y =10.7cm.
Fig. 4. Computer vision color patterns of the whey protein gel samples processed at
different temperature level and Fo in oil bath. Experiments were tested in replicates.
170

(a) (b) Fig. 5. Comparison of computer vision heating patterns for top, middle and bottom layers
to find the coldest layer. Cold spot was identified in middle layer. (a) MW processed
trays (b) Computer vision heating patterns.
Fig. 7 shows the temperatures measured at three different locations using fiber
optics probes during microwave sterilization. Temperature measured at first location,
with color value 2.05, was lowest (121 oC) and temperature at third location, with color
value 12.86, was highest (126.26 oC) during experimental validation. This validation
confirmed that a region with lowest color value indeed was the coldest region during
temperature measurement using fiber optics probes.
(a) MW processed tray (b) Computer vision heating pattern
171

Fig. 6. Heating patterns in middle layers of the five microwave sterilized trays, number
indicate the color values at those locations, (a) Original rectangular shaped whey protein
sample. (b) Computer vision heating pattern.
The results of microbial validation studies using inoculated packs of salmon in
Alfredo sauce showed that microwave processing delivered designed lethality to the
selected heat resistant PA 3679 spores at each processing levels. At lower Fo, 8 packages
Table 2.Three spots based upon color values were specified in the slab shaped whey protein gel (12 × 8 × 1.4 cm) for comparisons.
Tray Location of
spots based on color value
Color values
Distance in X direction
from lower right corner of slab (cm)
Distance in Y direction from
lower right corner of slab
(cm)
Tray-2 Point 1 2.05 3.79 0.72
Tray-2 Point 2 12.86 4.15 5.66
Tray-2 Point 3 8.55 5.33 10.7
172

Fig. 7. Time-temperature history at three different locations of color values 2.05, 8.55 and
12.86 specified by computer vision method in 7 oz trays during microwave sterilization
of salmon with sauce at 2.67 kW power level, typical temperature profile from repeated
tests.
Table 3. Results of the microbiological validation studies using inoculated packs (PA 3679 spores) of salmon in Alfredo sauce to validate the identified cold spot using computer vision method. Inoculation level of spores/tray
Process level
F0 (min)
Number of processed
trays
Number of positive trays*
1.0 x 10⁶ Control Samples N/A 6 6
1.0 x 10⁶ Under Target 3.0 12 8 1.0 x 10⁶ Target 6.0 12 0 1.0 x 10⁶ Over Target 12.0 12 0 *: Indicated by gas production and characteristic odor (storage period: 7 days at 32 oC)
173

of processed foods showed survival of PA 3679 spores. In case of target (Fo = 6 min) and
over target microwave sterilization processes no survivor was detected (Table 3).
5. Conclusions
A positive correlation between chemical marker (M-2) yield and color value
equivalent to gray-scale value was observed during this study. Temperature measured at
three different location identified by computer vision method signifies that color value
can be used to represent the level of thermal treatments. The results of inoculation pack
study supported the specified cold spots. Whey protein gel after adjusting the dielectric
properties can be used to emulate the heating patterns for real food during microwave
sterilization system. The computer vision method developed in this study, based on
chemical marker (M-2) yield, accurately determined the cold spots location in salmon
with sauce. Protocol developed in study to emulate the cold spot and heating patterns can
be applied for other food systems as well. Microwave sterilization system delivered
sufficient sterility at target Fo. The heating patterns validation tests suggest that newly
designed microwave sterilization system can be scaled up for the commercial application.
Acknowledgements This research work was supported by the US Army Natick Soldier Center, Natick, MA
and the Washington State University Agricultural Research Center, Pullman WA.
174

Nomenclature D decimal reduction time (min)
Ea activation energy (kcal mol-1)
f: X R f is a function from X into R →
f× g Minskowski addition of f and g
f / g Minskowski subtraction of f and g
Fo cumulative thermal lethality (min)
G gray value
k reaction constant
R set of real numbers
t time (min)
T temperature (oC)
x elements of an point set
X represent point sets
z z-value (oC)
References Adobe Systems 2002. Adobe PhotoShop 7.0 User Guide. San Jose, CA: Adobe Systems
Inc.
Acharya, T., & Ray, A. K. (2005). Image Processing: Principles and Application.
Hoboken, New Jersey, Wiley-Interscience Publication.
175

Guan, D., Gray, P., Kang, D. H, Tang, J., Shafer, B., Younce, F., & Yang, C.S. (2003).
Microbiological validation of microwave-circulated water combination heating
technology by inoculated pack studies. Journal of Food Sci 68(4), 1428-1432.
Holdsworth, S., D. (1997). Sterilization, pasteurization and cooking criteria. Thermal
processing of packaged foods. Boundary Row, London: Blackie Academic and
Professional 99-110 p.
IMAQ vision builder tutorials, National Instrument Corporation. Available from
http://www.ni.com/. Accessed on Jan 2004.
Lau, M. H., Tang. J., Taub, I. A., Yang, T. C. S., Edwards, C. G., & Mao, R. (2003).
Kinetics of chemical marker formation in whey protein gels for studying high
temperature short time microwave sterilization. Journal of Food Engineering, 60,
397-405.
Kim, H. J., & Ball, D. (1994). Analysis of thermally produced compound in foods by
thermospray liquid chromatography- mass spectrometry and gas chromatography-
mass spectrometry. Journal of Agricultural and Food Chemistry. 42:2812-2816.
Kim, H. J., & Choi, Y. M. (1998). Chemometric applications of thermally produced
compounds as time-temperature in aseptic processing of particulate foods. In:
Shahidi F, editor. Process-induced chemical changes in food. New York:Plenum
Press. 91-99.
Pandit, R. B., Tang, J., Mikhaylenko, G., Liu F., & Z. Tang (2007a). Principle and
application of chemical marker (M-2) based computer vision method to locate the
cold spots in real food systems. PhD thesis, Chapter 6.
176

Pandit, R. B., Tang, J., Liu F., & Pitts, M. (2007) Development of a novel approach to
determine heating pattern using computer vision and chemical marker (M-2)
yield. Journal of Food Engineering, 78 (2): 522-528.
Pandit, R. B., Tang, J., Mikhaylenko, G., & Liu F. (2006). Kinetics of chemical marker
M-2 formation in mashed potato-a tool to locate cold spots under microwave
sterilization. Journal of Food Engineering. 76(3): 353-361.
Pathak, S. K., Liu, F., Tang, J. (2003). Finite difference domain (FDTD) characterization
of a single mode applicator. J. of Microwave Power & Electromagnetic Energy
30(1):1-12.
Prescott, L. M, Harley, J. P., Klein, D. A. (2002). Control of microorganisms by physical
and chemical agents. Microbilogy (pp. 174-151). New York: McGraw Hill.
Ritter, G. X., & Wilson, J. N. (2000). Handbook of Computer Vision Algorithms in
Image Algebra. Boca Raton, New York, CRC Press.
Wang, Y., Lau, M. H., Tang, J., & Mao, R. 2004. Kinetics of chemical marker M-1
formation in whey protein gels for developing sterilization processes based
on dielectric heating. Journal of Food Engineering, 64, 111-118.
Wnorowski, A., & Yaylayan V. A. (2001). Prediction of process lethality through
measurement of Maillard-generated chemical markers. JFS: Food Chemistry and
Toxicology. 67(6):2149-2152
177

CONCLUSIONS AND RECOMMENDATIONS
A chemical marker (M-2) based computer vision method was developed to
determine the locations of the cold spot in 915 MHz single mode microwave sterilization
process. Kinetics study of the chemical marker M-2 formation was accomplished with
mashed potatoes. Formation of chemical marker was observed as first order reaction. One
step nonlinear regression modeling matched well with the experimental data of marker
yield calculated at four temperatures. Reaction rate constant, energy of activation
confirmed that chemical marker formation is slower than bacterial inactivation. 1.5 % D-
ribose was most suitable with mashed potatoes for heating pattern analysis.
An IMAQ Vision Builder script was successfully developed to identify the cold
spot locations in processed foods. A new image system was developed to minimize the
interference by image system environment on heating patterns. Locations of the cold and
hot spots specified by computer vision matched well with temperature measurements
using fiber optics probes. The experiments results confirm that computer vision method
(IMAQ Vision Builder) with the chemical marker M-2 and other accessories can be used
as an effective tool to identify the location of cold and hot spots in microwave processed
foods.
A sensitivity analysis was also accomplished to test the variability of salt content
on the heating patterns. Addition of 1% salt into the mashed potato formulation changed
the dielectric loss by three and half times but heating patterns were not affected by salt
composition. Mathematically simulated heating patterns using finite difference time
domain method (QW-3D) and finite element analysis supported the computer vision
heating patterns. During microbiological validation, no survival of surrogates (PA 3679)

was detected in microwave processed tray after monitoring the identified cold spot using
computer vision method.
Due to difference in energy of activation and z-value of chemical marker
formation and bacterial inactivation, cumulative lethality (Fo) and chemical marker (M-2)
formation were observed to be dependent on the path of heating. A unique relationship
was observed among color value equivalent to grayscale value and chemical marker
yield. Fresh mashed potatoes and saturated mashed potatoes sample were used as lowest
and upper most point of the scale to facilitate the comparative heating patterns analysis
for the trays processed at different microwave processing levels.
A comprehensive theoretical explanation with support of the experimental data
was provided for application of this method to salmon. Salmon with Alfredo sauce was
selected as a foods system to evaluate in preparation of a validated process and requisite
the documentation for FDA filing of a scheduled process. Because of color change during
microwave processing it was impractical to use salmon directly to determine the cold
spot locations. Whey protein with adjusted dielectric properties was used to emulate the
heating patterns in this particular food. A kinetic study to correlate the chemical marker
yield and cumulative lethality with color value demonstrated the similar trend as mashed
potatoes. Whey protein concentrate with 1% D-ribose was found more suitable to cover
the time-temperature range of the microwave processing. Matching between the time-
temperature profiles of adjusted whey protein gel and salmon confirmed that whey
protein gel can be used to emulate the heating patterns.
The computer vision method developed in this study, based on chemical marker
(M-2) yield, accurately determined the cold spots location in salmon with sauce. Protocol
179
developed in study to emulate the cold spot and heating patterns can be applied for other
food systems as well. No microbial survivor was detected in sterilized foods at target Fo.
Microbial validation showed that microwave sterilization system delivered sufficient
sterility at target Fo. The heating patterns validation tests suggest that newly designed
microwave sterilization system can be scaled up for the commercial application. Due to
its cost effectiveness, consistency, fast speed and accuracy the computer vision method
developed in this study can applied for industrial application and regulatory approval of
the 915 MHz microwave sterilization system.
Microwave sterilization system developed at WSU has potential for approval as
advanced thermal process for industrial application. The developed computer vision
method based on chemical marker M-2 yield accurately determined the cold spot location
in processed foods. Depending upon the requirement of industrial application and
regulatory approval the future research work area may be focused in the following
directions:
1. Identification of the critical factors for microwave process development.
2. Sensitivity of the computer vision heating patterns with critical factors.
3. Application of computer vision method to identify the cold spots in selected
heterogeneous food systems e.g., beef with gravy.
4. Development of a procedure/method to evaluate the level of sterility given to each
tray in continuous sterilization operation. Determining an index to test the
uniformity of microwave sterilization process.
5. Testing/identification of the portable data tracer and equipments.
180

6. Facilitate the microwave system with video camera or tracking device to monitor
or visualize the position of the tray during microwave processing.
7. Design/selection of the suitable packaging materials and machine.
181