a chemical probe technique for the determination of reactive halogen … · · 2017-02-03halogen...
TRANSCRIPT
A chemical probe technique for the determination of
reactive halogen species in aqueous solution: Part 2 ?
chloride solutions and mixed bromide/chloride solutions
C. Anastasio, B. M. Matthew
To cite this version:
C. Anastasio, B. M. Matthew. A chemical probe technique for the determination of reactivehalogen species in aqueous solution: Part 2 ? chloride solutions and mixed bromide/chloridesolutions. Atmospheric Chemistry and Physics, European Geosciences Union, 2006, 6 (9),pp.2439-2451. <hal-00295957>
HAL Id: hal-00295957
https://hal.archives-ouvertes.fr/hal-00295957
Submitted on 29 Jun 2006
HAL is a multi-disciplinary open accessarchive for the deposit and dissemination of sci-entific research documents, whether they are pub-lished or not. The documents may come fromteaching and research institutions in France orabroad, or from public or private research centers.
L’archive ouverte pluridisciplinaire HAL, estdestinee au depot et a la diffusion de documentsscientifiques de niveau recherche, publies ou non,emanant des etablissements d’enseignement et derecherche francais ou etrangers, des laboratoirespublics ou prives.
Atmos. Chem. Phys., 6, 2439–2451, 2006www.atmos-chem-phys.net/6/2439/2006/© Author(s) 2006. This work is licensedunder a Creative Commons License.
AtmosphericChemistry
and Physics
A chemical probe technique for the determination of reactivehalogen species in aqueous solution: Part 2 – chloride solutions andmixed bromide/chloride solutions
C. Anastasio1 and B. M. Matthew1,*
1Atmospheric Science Program, Department of Land, Air & Water Resources, University of California, Davis, USA* now at: Hach Company, Loveland, Colorado, USA
Received: 16 November 2005 – Published in Atmos. Chem. Phys. Discuss.: 2 February 2006Revised: 27 April 2006 – Accepted: 11 May 2006 – Published: 29 June 2006
Abstract. Although reactive halogen species (X*=X•, •X−
2 ,X2 and HOX, where X=Br, Cl, or I) are important environ-mental oxidants, relatively little is known about their kinet-ics in condensed phases such as seawater and sea-salt parti-cles. Here we describe a new technique to determine reactivechlorine and bromine species in aqueous solutions by usingallyl alcohol (CH2=CHCH2OH) as a chemical probe. Thisprobe is combined with competition kinetics in order to de-termine steady state concentrations of X*(aq). In some casesthe technique also can be used to determine the rates of for-mation and lifetimes of X* in aqueous solution. In a com-panion paper we reported the results of our method develop-ment for aqueous solutions containing only bromide (Br−).In this paper, we discuss method development for solutionscontaining chloride (Cl−) alone, and for solutions containingboth bromide and chloride.
1 Introduction
As discussed in detail in the companion paper to this work(Matthew and Anastasio, 2006, hereafter referred to as“Part 1”), aqueous and gaseous reactive halogen species(X*=X •, •X−
2 , XO•, X2 and HOX, where X=Br, Cl, or I)play important roles in the chemistry of marine regions. Tofurther our understanding of aqueous-phase halide chemistry,and its links to the release of reactive gas-phase halogens,we have developed a chemical probe technique to detect andmeasure reactive halogen species in aqueous solutions. Inthis technique we use allyl alcohol (AA) to trap the reactivehalogens (Cl*(aq) and Br*(aq)) and form stable, halogenateddiols (3-chloropropanediol (3CPD) and 3-bromopropanediol(3BPD)) that are quantified.
Correspondence to:C. Anastasio([email protected])
In chloride solutions the formation of Cl*(aq) by•OH oc-curs through reactions that are analogous to those in bromidesolutions (see Part 1):
Cl− +•OH →
•ClOH− (94)
•ClOH−+ Cl− →
•Cl−2 + OH− (95)
•ClOH−+ H+
→ Cl• + H2O (97)
While Cl•, •Cl−2 , and a number of other Cl* species can form3CPD in chloride solutions, under our conditions•Cl−2 isthe dominant source. In solutions containing both chlorideand bromide,•Cl−2 is a less important source of 3CPD andthe mixed halogen species•BrCl− becomes the dominantsource.•BrCl−, and the molecular mixed halogen BrCl, arealso significant sources of 3BPD in mixed halide solutions.These species are formed from a number of reactions, includ-ing interactions such as
•Cl−2 + Br− →•BrCl− + Cl− (173)
Cl− + HOBr + H+→ BrCl + H2O (155)
(Note that these reactions are from the supplementary ma-terial (Sects. S.1–S.12, Reactions 1–192, Eqs. S1–S41, andTables S1–S6) that was introduced in Part 1. To avoid dupli-cation, and because this paper refers to many of the equationsfrom Part 1, we have also made the equation numbering con-tinuous between Part 1 (Eqs. 1–10) and this paper (Eqs. 11–19).)
In Part 1 we described the overall chemical probe tech-nique, its use with competition kinetics, and its applicationto solutions containing bromide. In this paper we apply thetechnique to chloride solutions and to “mixed halide” solu-tions, i.e., those containing both bromide and chloride. Asin Part 1, our first step here is to perform a series of experi-ments under different conditions in order to build and test akinetic model of reactive halogen chemistry. The second step
Published by Copernicus GmbH on behalf of the European Geosciences Union.
2440 C. Anastasio and B. M. Matthew: Technique for measuring aqueous reactive halogens: Part 2
is to use this kinetic model to evaluate the overall chemicalprobe technique, and a series of three data treatments, undera range of experimental conditions.
2 Experimental
The key general aspects to the chemical probe technique arediscussed in detail in Part 1. In the following sections, wegive a brief overview of the technique and a more detaileddescription of the models and procedures that are specific tousing the method in solutions containing either Cl− or bothCl− and Br−.
2.1 Overview of experimental parameters
The reagents (including Milli-Q water) used in this work arethe same as described in Part 1 with the exception of NaCl. Inmany of our experiments with chloride solutions the resultscan be affected by trace levels of Br−. Because we couldfind no source of NaCl that was bromide-free, we developeda technique to remove the small amounts of bromide presentin chloride solutions (Sect. S.7). Using this technique withhigh purity NaCl (Sigma Aldrich; 99.999%) we reduced Br−
levels from∼0.007% mol Br/mol Cl (in untreated chloride)to <0.0002% mol Br/mol Cl, a level that did not significantlyaffect our experimental results.
During experiments aqueous samples (∼23 mL) contain-ing halide, allyl alcohol (AA), and 1.0 mM hydrogen perox-ide (as a photochemical source of•OH) were illuminated(313 nm light) in airtight, stirred, 5 cm quartz cells main-tained at 20◦C. Aliquots of sample were removed at specifiedtimes and analyzed for 3XPD (i.e., 3-chloro-1,2-propanediol(3CPD), and/or 3-bromo-1,2-propanediol (3BPD)) and AAusing techniques discussed in Part 1. When required, samplepH was adjusted using 1.0 M H2SO4 or a mixture of 1.0 mMsodium tetraborate and 0.30 M NaOH. For each experimentthe actinic flux was measured using 2-nitrobenzaldehydeactinometry (Anastasio et al., 1994). Dark controls weretreated the same as illuminated samples except that they wereprepared in 1 cm quartz cells, placed in a dark cell chamber(20◦C, stirred), and sampled at the final illumination timepoint. There was no loss of AA, and no formation of 3BPD or3CPD, in illuminated samples that did not contain H2O2, re-gardless of whether bromide and/or chloride were present. Inaddition, illumination of solutions containing 1.0 mM H2O2,0.80 mM Br−, 3BPD and/or 3CPD lead to no loss of 3XPDover the time scales of our experiments.
2.2 Kinetic models
Halide chemistry in the illuminated solutions was modeledwith Acuchem (Braun et al., 1988). In Part 1, we developeda kinetic model (Br− Full Model) that describes aqueous bro-mide chemistry. Here we extend this model to include chlo-ride and mixed halide (i.e., bromide and chloride) reactions.
The model written for the chloride system (Cl− Full Model)consists of the reactions from Table S1, the reactions of•OHand •CO−
3 with allyl alcohol (Table S3), aqueous chloridereactions (Table S4), and interactions of reactive chloridespecies (Cl*(aq)) with AA (Table S5). The chemistry occur-ring in the mixed halide solutions is described in the “MixFull Model”. This model consists of the “Br− Full Model”(Tables S1–S3), aqueous chloride reactions (Table S4), re-actions of AA with Cl*(aq) and with mixed halogen species(BrCl* (aq)=•BrCl− and BrCl) (Table S5), and mixed halidereactions (Table S6).
Obtaining quantitative information (i.e., rates of formation(Ri
F ), steady-state concentrations ([i]), and lifetimes (τi))
for reactive halogen speciesi requires knowing the yieldsof 3BPD and 3CPD formed from the reactions ofi withAA (Y 3XPD
i ). These yields were calculated as described inSect. 2.2.3 of Part 1, and are based on the modeled rate con-stants for the reactions of speciesi with AA (Tables S3 andS5). In our chloride experiments, dichloride radical anion(•Cl−2 ) is responsible for most of 3CPD formation, while Cl•
contributes only very little (typically<4%). Based on themodeled rate constants, yields of 3CPD from the reactions of•Cl−2 and Cl• with AA are 0.095 and∼0.2, respectively.
In mixed halide solutions 3CPD can also be formed fromthe reaction of AA with•BrCl− or BrCl, with yields of0.0031 and∼5×10⁻⁵, respectively (Table S5). In additionto Br•, Br2, and HOBr (Part 1), 3BPD can also be formedby both BrCl and•BrCl− in mixed halide solutions. Basedon modeled rate constants, the yield of 3BPD from the re-action of BrCl with AA is 0.50 (Table S5). The yield from•BrCl− is pH dependent: 0.078 at pH≤5.5, 0 at pH≥6.5, andvarying linearly between these values. We could find no rateconstants for the reactions of Cl2 or BrCl with AA (Reac-tions 147–149, Table S5) or other alkenes in water. Fittingthe kinetic model to the experimental data produced a totalrate constant of BrCl with allyl alcohol of 1.0×10⁸ M−1 s−1
(Reactions 147–149) and a 3BPD yield of 0.50. Based onthis we estimate that the total rate constant for the reactionof Cl2 with AA is 1.1×10⁸ M−1 s−1 (Reactions 138 and 139,Table S5), but this value is not well constrained by our re-sults.
While we were able to use published values to determineor constrain rate constants for the reaction of AA with a num-ber of reactive halogen species (especially for Br*(aq); Ta-ble S3), in many cases no literature values were available. Inthese cases we estimated rate constants based on fitting ourmodel to our experimental results (e.g., see footnotes in Ta-bles S3, S5, and S6). Similarly, for many of the mixed halidereactions (Table S6) there were no published rate constantsavailable and we therefore compiled our set of reactions andrate constants by fitting model output to the measured ratesof 3BPD and 3CPD formation and AA loss. As describedin section 3.7, this dearth of independently determined reac-tions and rate constants is a weakness of our model, althoughwe have confidence in the overall model because of its ability
Atmos. Chem. Phys., 6, 2439–2451, 2006 www.atmos-chem-phys.net/6/2439/2006/
C. Anastasio and B. M. Matthew: Technique for measuring aqueous reactive halogens: Part 2 2441
to describe our measured results over a wide range of exper-imental conditions.
2.3 Competition kinetics
There are two aspects that complicate our allyl alcohol chem-ical probe technique compared to past techniques: i) the ad-dition of the probe compound (AA) causes a decrease in therate of X*(aq) formation because the AA scavenges•OH,and ii) the compounds formed from the reaction of X*(aq)with allyl alcohol are not specific to an individual species(i.e., 3BPD and 3CPD are each formed by several differentspecies). These complications require that the raw data becorrected to compensate for these effects. In Part 1, the ef-fects associated with i) and ii) were referred to as the “AAeffect” and the “F 3BPD
i effect”, respectively. Here we referto the latter effect as the “F 3XPD
i effect”, whereF 3XPDi is
the fraction of total 3BPD or 3CPD that is formed from thereaction of speciesi with AA.
The dynamics of the reactive halogen species are deter-mined from competition kinetics experiments where productformation rates (3BPD and 3CPD) are measured as a func-tion of allyl alcohol concentration. From these experimentswe calculate steady-state concentrations and other parame-ters for X*(aq) using data from “inverse plots”, i.e., plots ofthe inverse of the rate of 3XPD formation (1/R3XPD
F ) ver-sus 1/[AA]. Recall from Part 1 that there are two general ap-proaches to calculate [i], Ri
F , andτi from the inverse plots.The first approach (data treatment A) is only applicable forBr• in solutions containing only bromide (see Sect. 3.6.1of Part 1) and cannot be used here. This is because thisapproach was derived as an analytical solution to a kineticscheme involving•OH, Br−, and Br•. Similar analytical ex-pressions can be determined for other reactive halogens, butthey cannot be solved because they contain concentrations ofintermediate species that cannot currently be determined.
In the second, more general, approach we assume thatAA has only a minor effect upon•OH (and, therefore, uponX*(aq) formation) in the linear portion of the inverse plot(where [AA] is small and the “AA effect” is minimized). Bymaking this assumption, the kinetic derivations are simpli-fied and can be applied to the other X*(aq) species. In thiscase, Eq. (S13) can be rewritten for all X*(aq) species as:
1
R3XPDF,tot
= a′+
b′
[AA ](11)
whereR3XPDF,tot is the total rate of formation of 3BPD or 3CPD
anda′ andb′ are, respectively, the y-intercept and slope of thelinear portion of the inverse plot. Using a procedure analo-gous to that described for Br*(aq) in Part 1, we can derivegeneral expressions fora′ andb′:
a′=
F 3XPDi
Y 3XPDi Ri
F
(12)
b′=
F 3XPDi
Y 3XPDi kAA
i [i](13)
where Y 3XPDi is the yield of 3XPD from the reaction of
speciesi with AA (Sect. 2.2),RiF and [i] are the rate of
formation and concentration of speciesi, respectively, andF 3XPD
i is the fraction of 3XPD formed from speciesi(Sect. S.12). (Note that these equations are the more generalanalogs of Eqs. S25–S27 derived in Part 1.) In the mixedhalide system we calculateF 3CPD
i based on•Cl−2 , Cl•, Cl2,HOCl, BrCl, and•BrCl−, while for F 3BPD
i we include Br•,•Br−2 , Br2, HOBr, BrCl, and•BrCl−. Other species (e.g.,Br−3 and Cl−3 ) are insignificant sources of 3BPD or 3CPD inour experiments but could be important under other condi-tions.
Equations (12) and (13) can be rearranged to solve for [i],Ri
F , and the lifetime ofi (τi):
[i] =F 3XPD
i
b′ Y 3XPDi kAA
i
(14)
RiF =
F 3XPDi
a′ Y 3XPDi
(15)
τi =a′
b′ kAAi
=[i]
RiF
(16)
As in the bromide system in Part 1 (Sect. 2.3), assuming thatthe AA effect is small in the linear region of the inverse plotcan lead to errors in [i], Ri
F andτi in the chloride and mixedhalide systems, but we can generally correct for these biasesusing the kinetic model.
3 Results and discussion
3.1 Overview of experimental approach
Our first goal is to use our experimental results to construct anumerical model that describes the chemistry occurring in il-luminated mixed halide solutions. We start by characterizingthe rates of 3CPD formation (R3CPD
F, tot) and allyl alcohol loss
(RAAL ) in solutions containing only chloride (Sect. 3.2) to
make a model of chloride chemistry (Cl− Full Model). Thismodel is then combined with the Br− Full Model (Part 1),and a series of mixed halide reactions, to make the “MixFull Model”, which describes the chemistry in mixed halidesolutions. This final model is tested and constrained usingseveral different sets of experiments under various solutionconditions (Sect. 3.3) and is then used to evaluate the ki-netic equations for [i], Ri
F , andτi using model-derived data(Sect. 3.5). Finally, we test the ability of the probe techniqueto experimentally determine reactive halogen kinetics in so-lutions containing both Br− and Cl− (Sect. 3.6).
www.atmos-chem-phys.net/6/2439/2006/ Atmos. Chem. Phys., 6, 2439–2451, 2006
2442 C. Anastasio and B. M. Matthew: Technique for measuring aqueous reactive halogens: Part 2
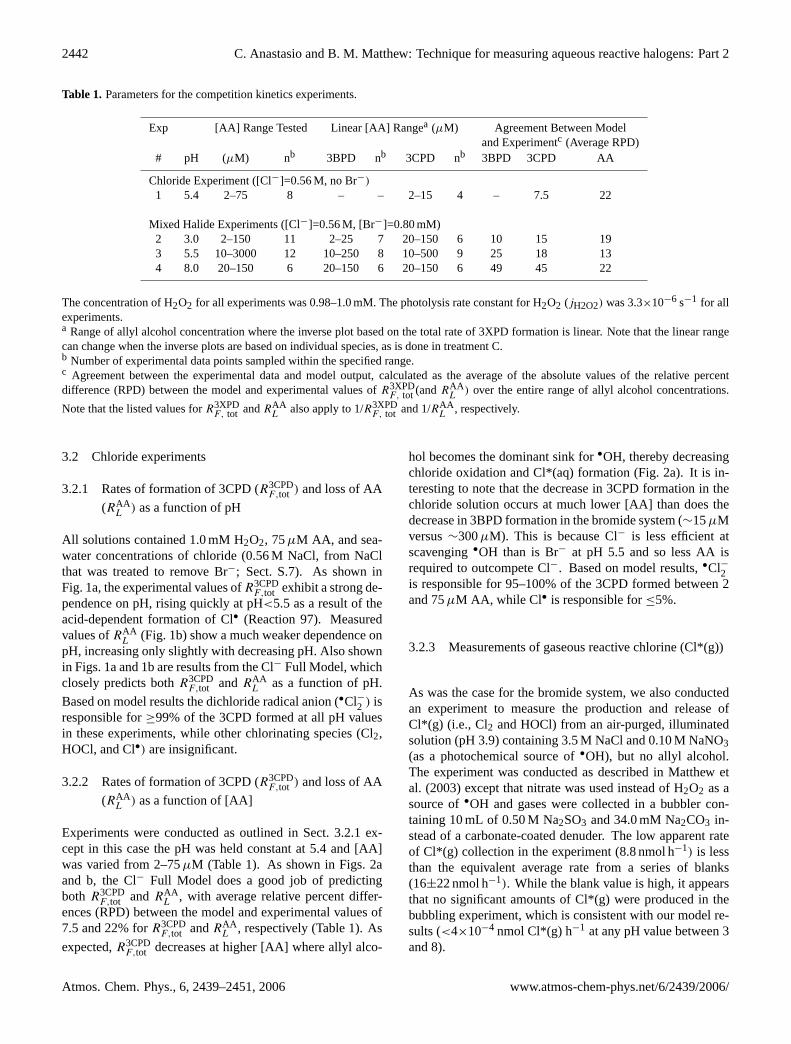
Table 1. Parameters for the competition kinetics experiments.
Exp [AA] Range Tested Linear [AA] Rangea (µM) Agreement Between Modeland Experimentc (Average RPD)
# pH (µM) nb 3BPD nb 3CPD nb 3BPD 3CPD AA
Chloride Experiment ([Cl−]=0.56 M, no Br−)
1 5.4 2–75 8 – – 2–15 4 – 7.5 22
Mixed Halide Experiments ([Cl−]=0.56 M, [Br−]=0.80 mM)2 3.0 2–150 11 2–25 7 20–150 6 10 15 193 5.5 10–3000 12 10–250 8 10–500 9 25 18 134 8.0 20–150 6 20–150 6 20–150 6 49 45 22
The concentration of H2O2 for all experiments was 0.98–1.0 mM. The photolysis rate constant for H2O2 (jH2O2) was 3.3×10⁻⁶ s−1 for allexperiments.a Range of allyl alcohol concentration where the inverse plot based on the total rate of 3XPD formation is linear. Note that the linear rangecan change when the inverse plots are based on individual species, as is done in treatment C.b Number of experimental data points sampled within the specified range.c Agreement between the experimental data and model output, calculated as the average of the absolute values of the relative percentdifference (RPD) between the model and experimental values ofR3XPD
F, tot (andRAAL
) over the entire range of allyl alcohol concentrations.
Note that the listed values forR3XPDF, tot andRAA
Lalso apply to 1/R3XPD
F, tot and 1/RAAL
, respectively.
3.2 Chloride experiments
3.2.1 Rates of formation of 3CPD (R3CPDF,tot ) and loss of AA
(RAAL ) as a function of pH
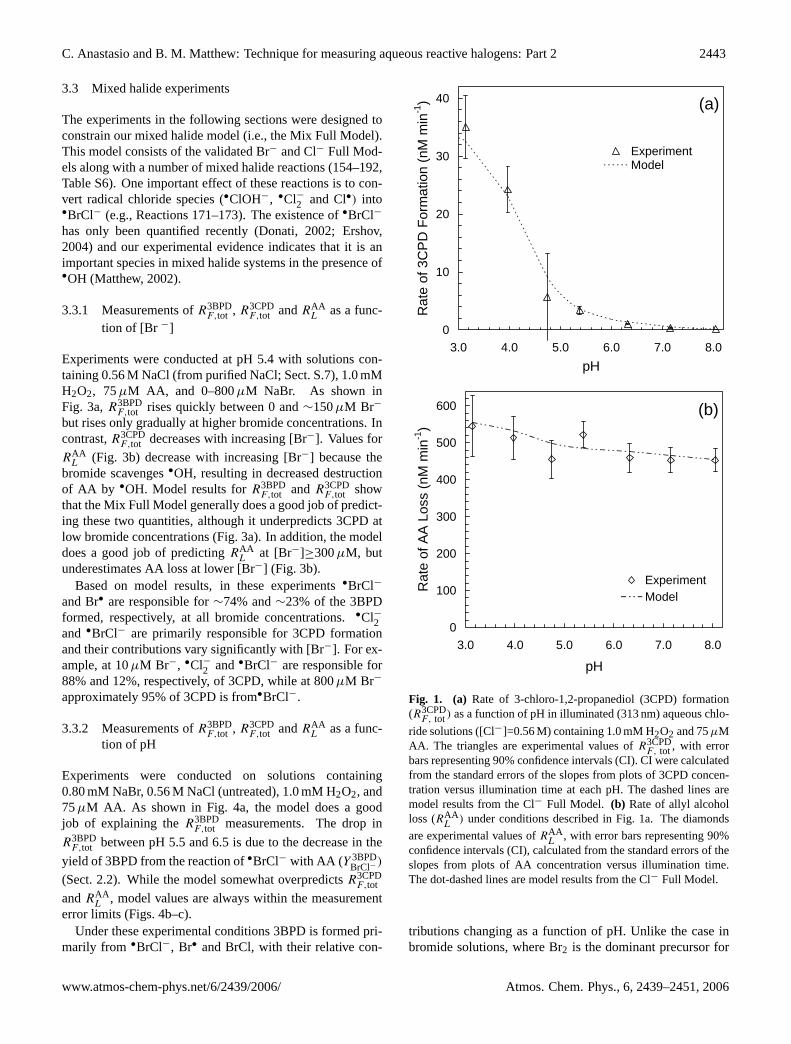
All solutions contained 1.0 mM H2O2, 75µM AA, and sea-water concentrations of chloride (0.56 M NaCl, from NaClthat was treated to remove Br−; Sect. S.7). As shown inFig. 1a, the experimental values ofR3CPD
F,tot exhibit a strong de-pendence on pH, rising quickly at pH<5.5 as a result of theacid-dependent formation of Cl• (Reaction 97). Measuredvalues ofRAA
L (Fig. 1b) show a much weaker dependence onpH, increasing only slightly with decreasing pH. Also shownin Figs. 1a and 1b are results from the Cl− Full Model, whichclosely predicts bothR3CPD
F,tot andRAAL as a function of pH.
Based on model results the dichloride radical anion (•Cl−2 ) isresponsible for≥99% of the 3CPD formed at all pH valuesin these experiments, while other chlorinating species (Cl2,HOCl, and Cl•) are insignificant.
3.2.2 Rates of formation of 3CPD (R3CPDF,tot ) and loss of AA
(RAAL ) as a function of [AA]
Experiments were conducted as outlined in Sect. 3.2.1 ex-cept in this case the pH was held constant at 5.4 and [AA]was varied from 2–75µM (Table 1). As shown in Figs. 2aand b, the Cl− Full Model does a good job of predictingboth R3CPD
F,tot andRAAL , with average relative percent differ-
ences (RPD) between the model and experimental values of7.5 and 22% forR3CPD
F,tot andRAAL , respectively (Table 1). As
expected,R3CPDF,tot decreases at higher [AA] where allyl alco-
hol becomes the dominant sink for•OH, thereby decreasingchloride oxidation and Cl*(aq) formation (Fig. 2a). It is in-teresting to note that the decrease in 3CPD formation in thechloride solution occurs at much lower [AA] than does thedecrease in 3BPD formation in the bromide system (∼15µMversus∼300µM). This is because Cl− is less efficient atscavenging•OH than is Br− at pH 5.5 and so less AA isrequired to outcompete Cl−. Based on model results,•Cl−2is responsible for 95–100% of the 3CPD formed between 2and 75µM AA, while Cl• is responsible for≤5%.
3.2.3 Measurements of gaseous reactive chlorine (Cl*(g))
As was the case for the bromide system, we also conductedan experiment to measure the production and release ofCl*(g) (i.e., Cl2 and HOCl) from an air-purged, illuminatedsolution (pH 3.9) containing 3.5 M NaCl and 0.10 M NaNO3(as a photochemical source of•OH), but no allyl alcohol.The experiment was conducted as described in Matthew etal. (2003) except that nitrate was used instead of H2O2 as asource of•OH and gases were collected in a bubbler con-taining 10 mL of 0.50 M Na2SO3 and 34.0 mM Na2CO3 in-stead of a carbonate-coated denuder. The low apparent rateof Cl*(g) collection in the experiment (8.8 nmol h−1) is lessthan the equivalent average rate from a series of blanks(16±22 nmol h−1). While the blank value is high, it appearsthat no significant amounts of Cl*(g) were produced in thebubbling experiment, which is consistent with our model re-sults (<4×10⁻⁴ nmol Cl*(g) h−1 at any pH value between 3and 8).
Atmos. Chem. Phys., 6, 2439–2451, 2006 www.atmos-chem-phys.net/6/2439/2006/
C. Anastasio and B. M. Matthew: Technique for measuring aqueous reactive halogens: Part 2 2443
3.3 Mixed halide experiments
The experiments in the following sections were designed toconstrain our mixed halide model (i.e., the Mix Full Model).This model consists of the validated Br− and Cl− Full Mod-els along with a number of mixed halide reactions (154–192,Table S6). One important effect of these reactions is to con-vert radical chloride species (•ClOH−, •Cl−2 and Cl•) into•BrCl− (e.g., Reactions 171–173). The existence of•BrCl−
has only been quantified recently (Donati, 2002; Ershov,2004) and our experimental evidence indicates that it is animportant species in mixed halide systems in the presence of•OH (Matthew, 2002).
3.3.1 Measurements ofR3BPDF,tot , R3CPD
F,tot andRAAL as a func-
tion of [Br −]
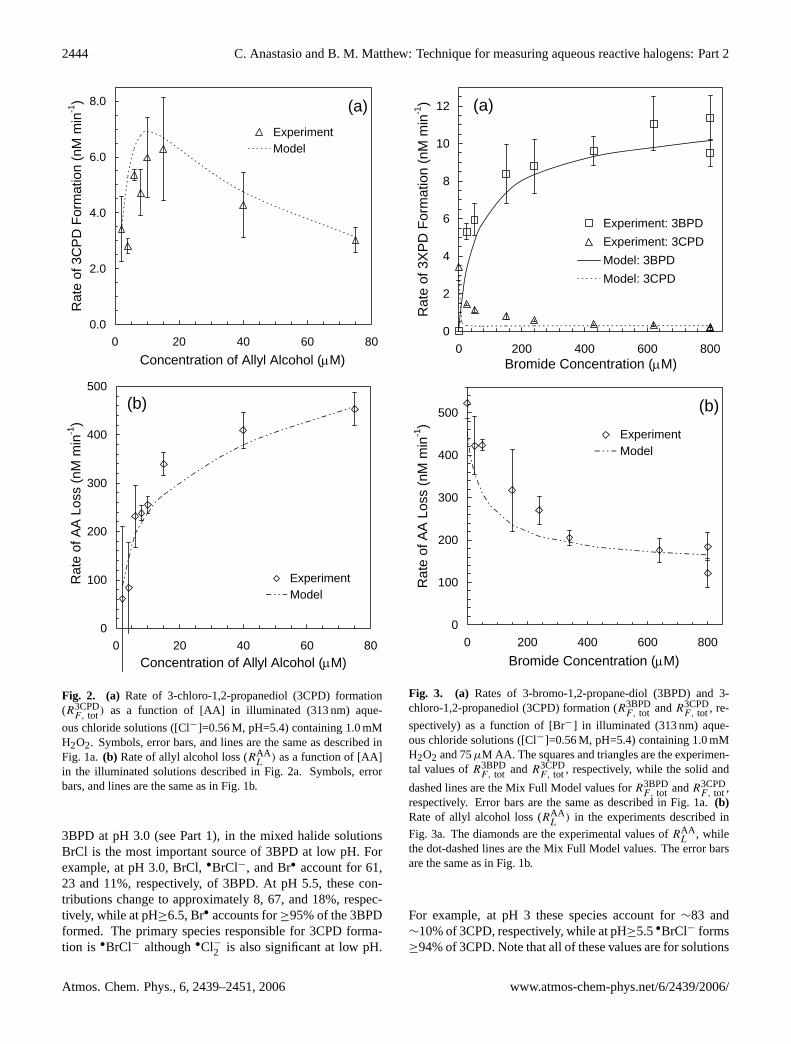
Experiments were conducted at pH 5.4 with solutions con-taining 0.56 M NaCl (from purified NaCl; Sect. S.7), 1.0 mMH2O2, 75µM AA, and 0–800µM NaBr. As shown inFig. 3a,R3BPD
F,tot rises quickly between 0 and∼150µM Br−
but rises only gradually at higher bromide concentrations. Incontrast,R3CPD
F,tot decreases with increasing [Br−]. Values for
RAAL (Fig. 3b) decrease with increasing [Br−] because the
bromide scavenges•OH, resulting in decreased destructionof AA by •OH. Model results forR3BPD
F,tot andR3CPDF,tot show
that the Mix Full Model generally does a good job of predict-ing these two quantities, although it underpredicts 3CPD atlow bromide concentrations (Fig. 3a). In addition, the modeldoes a good job of predictingRAA
L at [Br−]≥300µM, butunderestimates AA loss at lower [Br−] (Fig. 3b).
Based on model results, in these experiments•BrCl−
and Br• are responsible for∼74% and∼23% of the 3BPDformed, respectively, at all bromide concentrations.•Cl−2and •BrCl− are primarily responsible for 3CPD formationand their contributions vary significantly with [Br−]. For ex-ample, at 10µM Br−, •Cl−2 and•BrCl− are responsible for88% and 12%, respectively, of 3CPD, while at 800µM Br−
approximately 95% of 3CPD is from•BrCl−.
3.3.2 Measurements ofR3BPDF,tot , R3CPD
F,tot andRAAL as a func-
tion of pH
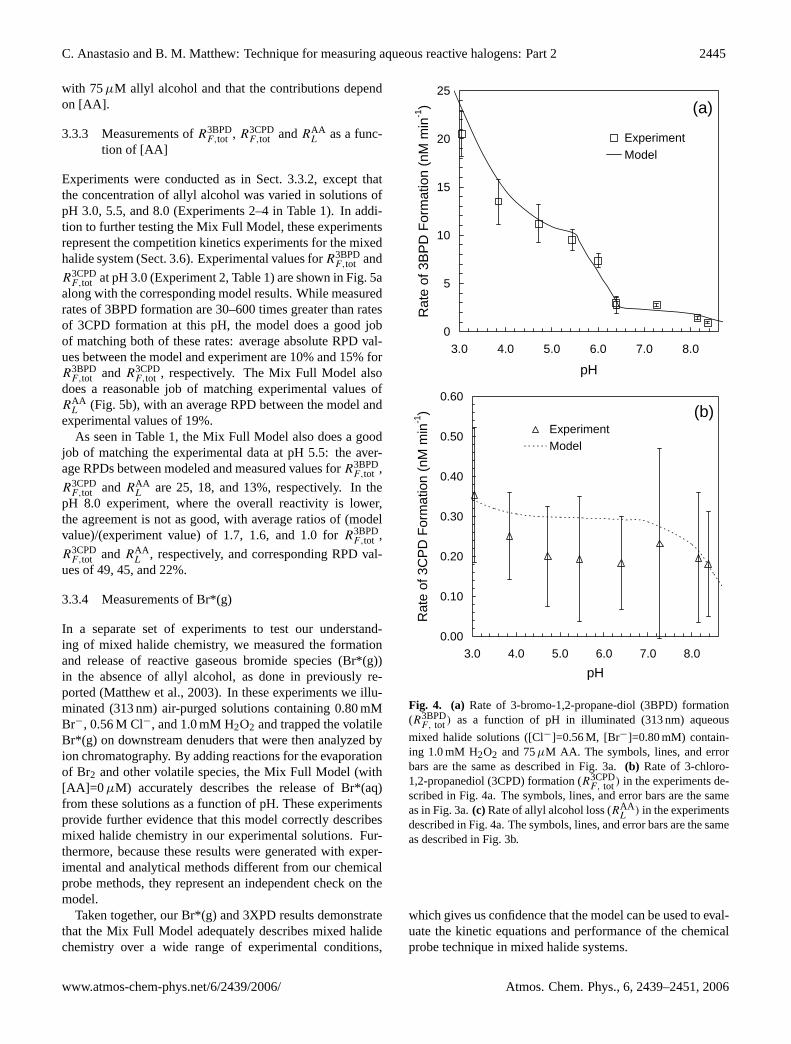
Experiments were conducted on solutions containing0.80 mM NaBr, 0.56 M NaCl (untreated), 1.0 mM H2O2, and75µM AA. As shown in Fig. 4a, the model does a goodjob of explaining theR3BPD
F,tot measurements. The drop in
R3BPDF,tot between pH 5.5 and 6.5 is due to the decrease in the
yield of 3BPD from the reaction of•BrCl− with AA (Y 3BPDBrCl−)
(Sect. 2.2). While the model somewhat overpredictsR3CPDF,tot
andRAAL , model values are always within the measurement
error limits (Figs. 4b–c).Under these experimental conditions 3BPD is formed pri-
marily from •BrCl−, Br• and BrCl, with their relative con-
0
10
20
30
40
3.0 4.0 5.0 6.0 7.0 8.0pH
Rat
e of
3C
PD
For
mat
ion
(nM
min
-1)
ExperimentModel
(a)
0
100
200
300
400
500
600
3.0 4.0 5.0 6.0 7.0 8.0
pH
Rat
e of
AA
Los
s (n
M m
in-1
)
ExperimentModel
(b)
Fig. 1. (a) Rate of 3-chloro-1,2-propanediol (3CPD) formation(R3CPD
F, tot) as a function of pH in illuminated (313 nm) aqueous chlo-
ride solutions ([Cl−]=0.56 M) containing 1.0 mM H2O2 and 75µMAA. The triangles are experimental values ofR3CPD
F, tot , with errorbars representing 90% confidence intervals (CI). CI were calculatedfrom the standard errors of the slopes from plots of 3CPD concen-tration versus illumination time at each pH. The dashed lines aremodel results from the Cl− Full Model. (b) Rate of allyl alcoholloss (RAA
L) under conditions described in Fig. 1a. The diamonds
are experimental values ofRAAL
, with error bars representing 90%confidence intervals (CI), calculated from the standard errors of theslopes from plots of AA concentration versus illumination time.The dot-dashed lines are model results from the Cl− Full Model.
tributions changing as a function of pH. Unlike the case inbromide solutions, where Br2 is the dominant precursor for
www.atmos-chem-phys.net/6/2439/2006/ Atmos. Chem. Phys., 6, 2439–2451, 2006
2444 C. Anastasio and B. M. Matthew: Technique for measuring aqueous reactive halogens: Part 2
0.0
2.0
4.0
6.0
8.0
0 20 40 60 80Concentration of Allyl Alcohol (μM)
Rat
e of
3C
PD
For
mat
ion
(nM
min
-1)
ExperimentModel
(a)
0
100
200
300
400
500
0 20 40 60 80Concentration of Allyl Alcohol (μM)
Rat
e of
AA
Los
s (n
M m
in-1
)
ExperimentModel
(b)
Fig. 2. (a) Rate of 3-chloro-1,2-propanediol (3CPD) formation(R3CPD
F, tot) as a function of [AA] in illuminated (313 nm) aque-
ous chloride solutions ([Cl−]=0.56 M, pH=5.4) containing 1.0 mMH2O2. Symbols, error bars, and lines are the same as described inFig. 1a.(b) Rate of allyl alcohol loss (RAA
L) as a function of [AA]
in the illuminated solutions described in Fig. 2a. Symbols, errorbars, and lines are the same as in Fig. 1b.
3BPD at pH 3.0 (see Part 1), in the mixed halide solutionsBrCl is the most important source of 3BPD at low pH. Forexample, at pH 3.0, BrCl,•BrCl−, and Br• account for 61,23 and 11%, respectively, of 3BPD. At pH 5.5, these con-tributions change to approximately 8, 67, and 18%, respec-tively, while at pH≥6.5, Br• accounts for≥95% of the 3BPDformed. The primary species responsible for 3CPD forma-tion is •BrCl− although•Cl−2 is also significant at low pH.
0
2
4
6
8
10
12
0 200 400 600 800Bromide Concentration (μM)
Rat
e of
3X
PD
For
mat
ion
(nM
min
-1)
Experiment: 3BPDExperiment: 3CPDModel: 3BPDModel: 3CPD
(a)
0
100
200
300
400
500
0 200 400 600 800Bromide Concentration (μM)
Rat
e of
AA
Loss
(nM
min
-1)ExperimentModel
(b)
Fig. 3. (a) Rates of 3-bromo-1,2-propane-diol (3BPD) and 3-chloro-1,2-propanediol (3CPD) formation (R3BPD
F, tot andR3CPDF, tot , re-
spectively) as a function of [Br−] in illuminated (313 nm) aque-ous chloride solutions ([Cl−]=0.56 M, pH=5.4) containing 1.0 mMH2O2 and 75µM AA. The squares and triangles are the experimen-tal values ofR3BPD
F, tot andR3CPDF, tot , respectively, while the solid and
dashed lines are the Mix Full Model values forR3BPDF, tot andR3CPD
F, tot ,respectively. Error bars are the same as described in Fig. 1a.(b)Rate of allyl alcohol loss (RAA
L) in the experiments described in
Fig. 3a. The diamonds are the experimental values ofRAAL
, whilethe dot-dashed lines are the Mix Full Model values. The error barsare the same as in Fig. 1b.
For example, at pH 3 these species account for∼83 and∼10% of 3CPD, respectively, while at pH≥5.5•BrCl− forms≥94% of 3CPD. Note that all of these values are for solutions
Atmos. Chem. Phys., 6, 2439–2451, 2006 www.atmos-chem-phys.net/6/2439/2006/
C. Anastasio and B. M. Matthew: Technique for measuring aqueous reactive halogens: Part 2 2445
with 75µM allyl alcohol and that the contributions dependon [AA].
3.3.3 Measurements ofR3BPDF,tot , R3CPD
F,tot andRAAL as a func-
tion of [AA]
Experiments were conducted as in Sect. 3.3.2, except thatthe concentration of allyl alcohol was varied in solutions ofpH 3.0, 5.5, and 8.0 (Experiments 2–4 in Table 1). In addi-tion to further testing the Mix Full Model, these experimentsrepresent the competition kinetics experiments for the mixedhalide system (Sect. 3.6). Experimental values forR3BPD
F,tot and
R3CPDF,tot at pH 3.0 (Experiment 2, Table 1) are shown in Fig. 5a
along with the corresponding model results. While measuredrates of 3BPD formation are 30–600 times greater than ratesof 3CPD formation at this pH, the model does a good jobof matching both of these rates: average absolute RPD val-ues between the model and experiment are 10% and 15% forR3BPD
F,tot andR3CPDF,tot , respectively. The Mix Full Model also
does a reasonable job of matching experimental values ofRAA
L (Fig. 5b), with an average RPD between the model andexperimental values of 19%.
As seen in Table 1, the Mix Full Model also does a goodjob of matching the experimental data at pH 5.5: the aver-age RPDs between modeled and measured values forR3BPD
F,tot ,
R3CPDF,tot andRAA
L are 25, 18, and 13%, respectively. In thepH 8.0 experiment, where the overall reactivity is lower,the agreement is not as good, with average ratios of (modelvalue)/(experiment value) of 1.7, 1.6, and 1.0 forR3BPD
F,tot ,
R3CPDF,tot andRAA
L , respectively, and corresponding RPD val-ues of 49, 45, and 22%.
3.3.4 Measurements of Br*(g)
In a separate set of experiments to test our understand-ing of mixed halide chemistry, we measured the formationand release of reactive gaseous bromide species (Br*(g))in the absence of allyl alcohol, as done in previously re-ported (Matthew et al., 2003). In these experiments we illu-minated (313 nm) air-purged solutions containing 0.80 mMBr−, 0.56 M Cl−, and 1.0 mM H2O2 and trapped the volatileBr*(g) on downstream denuders that were then analyzed byion chromatography. By adding reactions for the evaporationof Br2 and other volatile species, the Mix Full Model (with[AA]=0 µM) accurately describes the release of Br*(aq)from these solutions as a function of pH. These experimentsprovide further evidence that this model correctly describesmixed halide chemistry in our experimental solutions. Fur-thermore, because these results were generated with exper-imental and analytical methods different from our chemicalprobe methods, they represent an independent check on themodel.
Taken together, our Br*(g) and 3XPD results demonstratethat the Mix Full Model adequately describes mixed halidechemistry over a wide range of experimental conditions,
0
5
10
15
20
25
3.0 4.0 5.0 6.0 7.0 8.0
pH
Rat
e of
3BP
D F
orm
atio
n (n
M m
in-1
)
ExperimentModel
(a)
0.00
0.10
0.20
0.30
0.40
0.50
0.60
3.0 4.0 5.0 6.0 7.0 8.0pH
Rat
e of
3C
PD
For
mat
ion
(nM
min
-1)
ExperimentModel
(b)
Fig. 4. (a) Rate of 3-bromo-1,2-propane-diol (3BPD) formation(R3BPD
F, tot) as a function of pH in illuminated (313 nm) aqueous
mixed halide solutions ([Cl−]=0.56 M, [Br−]=0.80 mM) contain-ing 1.0 mM H2O2 and 75µM AA. The symbols, lines, and errorbars are the same as described in Fig. 3a.(b) Rate of 3-chloro-1,2-propanediol (3CPD) formation (R3CPD
F, tot) in the experiments de-scribed in Fig. 4a. The symbols, lines, and error bars are the sameas in Fig. 3a.(c) Rate of allyl alcohol loss (RAA
L) in the experiments
described in Fig. 4a. The symbols, lines, and error bars are the sameas described in Fig. 3b.
which gives us confidence that the model can be used to eval-uate the kinetic equations and performance of the chemicalprobe technique in mixed halide systems.
www.atmos-chem-phys.net/6/2439/2006/ Atmos. Chem. Phys., 6, 2439–2451, 2006
2446 C. Anastasio and B. M. Matthew: Technique for measuring aqueous reactive halogens: Part 2
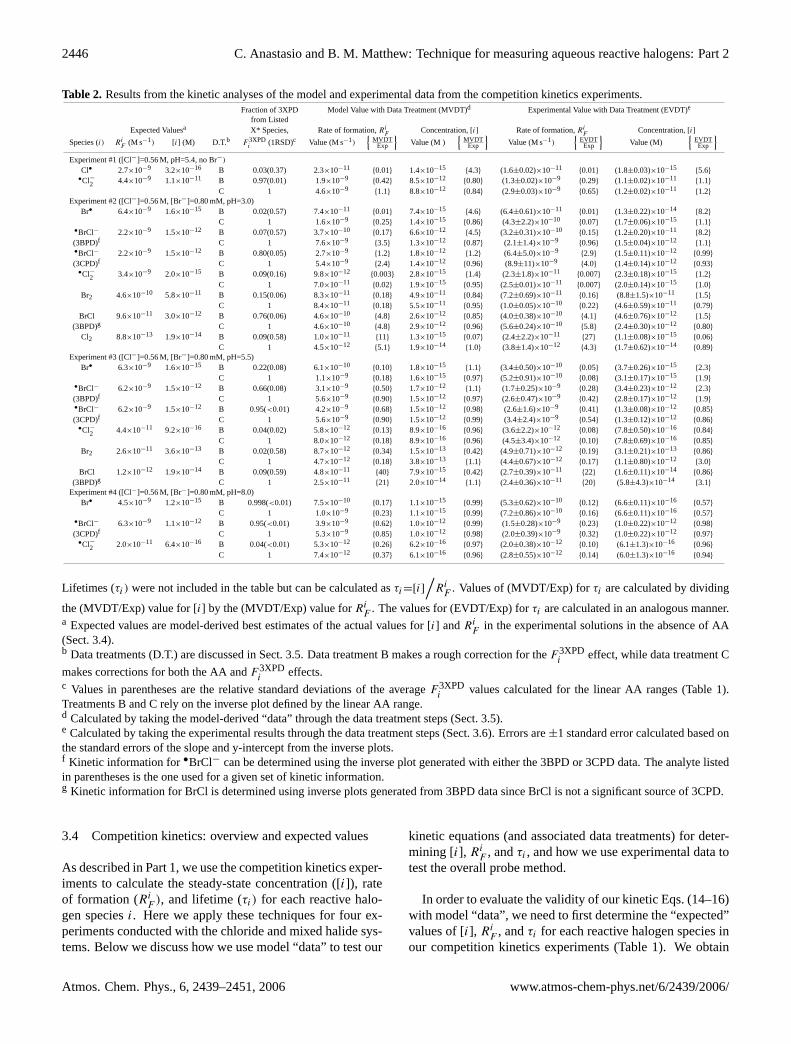
Table 2. Results from the kinetic analyses of the model and experimental data from the competition kinetics experiments.Fraction of 3XPD Model Value with Data Treatment (MVDT)d Experimental Value with Data Treatment (EVDT)e
from ListedExpected Valuesa X* Species, Rate of formation,Ri
FConcentration, [i] Rate of formation,Ri
FConcentration, [i]
Species (i) RiF
(M s−1) [i] (M) D.T.b F3XPDi
(1RSD)c Value (M s−1){
MVDTExp
}Value (M )
{MVDT
Exp
}Value (M s−1)
{EVDTExp
}Value (M)
{EVDTExp
}Experiment #1 ([Cl−]=0.56 M, pH=5.4, no Br−)
Cl• 2.7×10⁻⁹ 3.2×10⁻¹⁶ B 0.03(0.37) 2.3×10⁻¹¹{0.01} 1.4×10⁻¹⁵
{4.3} (1.6±0.02)×10−11{0.01} (1.8±0.03)×10−15
{5.6}•Cl−2 4.4×10⁻⁹ 1.1×10⁻¹¹ B 0.97(0.01) 1.9×10⁻⁹
{0.42} 8.5×10⁻¹²{0.80} (1.3±0.02)×10−9
{0.29} (1.1±0.02)×10−11{1.1}
C 1 4.6×10⁻⁹{1.1} 8.8×10⁻¹²
{0.84} (2.9±0.03)×10−9{0.65} (1.2±0.02)×10−11
{1.2}Experiment #2 ([Cl−]=0.56 M, [Br−]=0.80 mM, pH=3.0)
Br• 6.4×10⁻⁹ 1.6×10⁻¹⁵ B 0.02(0.57) 7.4×10⁻¹¹{0.01} 7.4×10⁻¹⁵
{4.6} (6.4±0.61)×10−11{0.01} (1.3±0.22)×10−14
{8.2}C 1 1.6×10⁻⁹
{0.25} 1.4×10⁻¹⁵{0.86} (4.3±2.2)×10−10
{0.07} (1.7±0.06)×10−15{1.1}
•BrCl− 2.2×10⁻⁹ 1.5×10⁻¹² B 0.07(0.57) 3.7×10⁻¹⁰{0.17} 6.6×10⁻¹²
{4.5} (3.2±0.31)×10−10{0.15} (1.2±0.20)×10−11
{8.2}(3BPD)f C 1 7.6×10⁻⁹
{3.5} 1.3×10⁻¹²{0.87} (2.1±1.4)×10−9
{0.96} (1.5±0.04)×10−12{1.1}
•BrCl− 2.2×10⁻⁹ 1.5×10⁻¹² B 0.80(0.05) 2.7×10⁻⁹{1.2} 1.8×10⁻¹²
{1.2} (6.4±5.0)×10−9{2.9} (1.5±0.11)×10−12
{0.99}(3CPD)f C 1 5.4×10⁻⁹
{2.4} 1.4×10⁻¹²{0.96} (8.9±11)×10−9
{4.0} (1.4±0.14)×10−12{0.93}
•Cl−2 3.4×10⁻⁹ 2.0×10⁻¹⁵ B 0.09(0.16) 9.8×10⁻¹²{0.003} 2.8×10⁻¹⁵
{1.4} (2.3±1.8)×10−11{0.007} (2.3±0.18)×10−15
{1.2}C 1 7.0×10⁻¹¹
{0.02} 1.9×10⁻¹⁵{0.95} (2.5±0.01)×10−11
{0.007} (2.0±0.14)×10−15{1.0}
Br2 4.6×10⁻¹⁰ 5.8×10⁻¹¹ B 0.15(0.06) 8.3×10⁻¹¹{0.18} 4.9×10⁻¹¹
{0.84} (7.2±0.69)×10−11{0.16} (8.8±1.5)×10−11
{1.5}C 1 8.4×10⁻¹¹
{0.18} 5.5×10⁻¹¹{0.95} (1.0±0.05)×10−10
{0.22} (4.6±0.59)×10−11{0.79}
BrCl 9.6×10⁻¹¹ 3.0×10⁻¹² B 0.76(0.06) 4.6×10⁻¹⁰{4.8} 2.6×10⁻¹²
{0.85} (4.0±0.38)×10−10{4.1} (4.6±0.76)×10−12
{1.5}(3BPD)g C 1 4.6×10⁻¹⁰
{4.8} 2.9×10⁻¹²{0.96} (5.6±0.24)×10−10
{5.8} (2.4±0.30)×10−12{0.80}
Cl2 8.8×10⁻¹³ 1.9×10⁻¹⁴ B 0.09(0.58) 1.0×10⁻¹¹{11} 1.3×10⁻¹⁵
{0.07} (2.4±2.2)×10−11{27} (1.1±0.08)×10−15
{0.06}C 1 4.5×10⁻¹²
{5.1} 1.9×10⁻¹⁴{1.0} (3.8±1.4)×10−12
{4.3} (1.7±0.62)×10−14{0.89}
Experiment #3 ([Cl−]=0.56 M, [Br−]=0.80 mM, pH=5.5)Br• 6.3×10⁻⁹ 1.6×10⁻¹⁵ B 0.22(0.08) 6.1×10⁻¹⁰
{0.10} 1.8×10⁻¹⁵{1.1} (3.4±0.50)×10−10
{0.05} (3.7±0.26)×10−15{2.3}
C 1 1.1×10⁻⁹{0.18} 1.6×10⁻¹⁵
{0.97} (5.2±0.91)×10−10{0.08} (3.1±0.17)×10−15
{1.9}•BrCl− 6.2×10⁻⁹ 1.5×10⁻¹² B 0.66(0.08) 3.1×10⁻⁹
{0.50} 1.7×10⁻¹²{1.1} (1.7±0.25)×10−9
{0.28} (3.4±0.23)×10−12{2.3}
(3BPD)f C 1 5.6×10⁻⁹{0.90} 1.5×10⁻¹²
{0.97} (2.6±0.47)×10−9{0.42} (2.8±0.17)×10−12
{1.9}•BrCl− 6.2×10⁻⁹ 1.5×10⁻¹² B 0.95(<0.01) 4.2×10⁻⁹
{0.68} 1.5×10⁻¹²{0.98} (2.6±1.6)×10−9
{0.41} (1.3±0.08)×10−12{0.85}
(3CPD)f C 1 5.6×10⁻⁹{0.90} 1.5×10⁻¹²
{0.99} (3.4±2.4)×10−9{0.54} (1.3±0.12)×10−12
{0.86}•Cl−2 4.4×10⁻¹¹ 9.2×10⁻¹⁶ B 0.04(0.02) 5.8×10⁻¹²
{0.13} 8.9×10⁻¹⁶{0.96} (3.6±2.2)×10−12
{0.08} (7.8±0.50)×10−16{0.84}
C 1 8.0×10⁻¹²{0.18} 8.9×10⁻¹⁶
{0.96} (4.5±3.4)×10−12{0.10} (7.8±0.69)×10−16
{0.85}Br2 2.6×10⁻¹¹ 3.6×10⁻¹³ B 0.02(0.58) 8.7×10⁻¹²
{0.34} 1.5×10⁻¹³{0.42} (4.9±0.71)×10−12
{0.19} (3.1±0.21)×10−13{0.86}
C 1 4.7×10⁻¹²{0.18} 3.8×10⁻¹³
{1.1} (4.4±0.67)×10−12{0.17} (1.1±0.80)×10−12
{3.0}BrCl 1.2×10⁻¹² 1.9×10⁻¹⁴ B 0.09(0.59) 4.8×10⁻¹¹
{40} 7.9×10⁻¹⁵{0.42} (2.7±0.39)×10−11
{22} (1.6±0.11)×10−14{0.86}
(3BPD)g C 1 2.5×10⁻¹¹{21} 2.0×10⁻¹⁴
{1.1} (2.4±0.36)×10−11{20} (5.8±4.3)×10−14
{3.1}Experiment #4 ([Cl−]=0.56 M, [Br−]=0.80 mM, pH=8.0)
Br• 4.5×10⁻⁹ 1.2×10⁻¹⁵ B 0.998(<0.01) 7.5×10⁻¹⁰{0.17} 1.1×10⁻¹⁵
{0.99} (5.3±0.62)×10−10{0.12} (6.6±0.11)×10−16
{0.57}C 1 1.0×10⁻⁹
{0.23} 1.1×10⁻¹⁵{0.99} (7.2±0.86)×10−10
{0.16} (6.6±0.11)×10−16{0.57}
•BrCl− 6.3×10⁻⁹ 1.1×10⁻¹² B 0.95(<0.01) 3.9×10⁻⁹{0.62} 1.0×10⁻¹²
{0.99} (1.5±0.28)×10−9{0.23} (1.0±0.22)×10−12
{0.98}(3CPD)f C 1 5.3×10⁻⁹
{0.85} 1.0×10⁻¹²{0.98} (2.0±0.39)×10−9
{0.32} (1.0±0.22)×10−12{0.97}
•Cl−2 2.0×10⁻¹¹ 6.4×10⁻¹⁶ B 0.04(<0.01) 5.3×10⁻¹²{0.26} 6.2×10⁻¹⁶
{0.97} (2.0±0.38)×10−12{0.10} (6.1±1.3)×10−16
{0.96}C 1 7.4×10⁻¹²
{0.37} 6.1×10⁻¹⁶{0.96} (2.8±0.55)×10−12
{0.14} (6.0±1.3)×10−16{0.94}
Lifetimes (τi) were not included in the table but can be calculated asτi=[i]/
RiF
. Values of (MVDT/Exp) forτi are calculated by dividing
the (MVDT/Exp) value for [i] by the (MVDT/Exp) value forRiF
. The values for (EVDT/Exp) forτi are calculated in an analogous manner.a Expected values are model-derived best estimates of the actual values for [i] andRi
Fin the experimental solutions in the absence of AA
(Sect. 3.4).b Data treatments (D.T.) are discussed in Sect. 3.5. Data treatment B makes a rough correction for theF3XPD
ieffect, while data treatment C
makes corrections for both the AA andF3XPDi
effects.c Values in parentheses are the relative standard deviations of the averageF3XPD
ivalues calculated for the linear AA ranges (Table 1).
Treatments B and C rely on the inverse plot defined by the linear AA range.d Calculated by taking the model-derived “data” through the data treatment steps (Sect. 3.5).e Calculated by taking the experimental results through the data treatment steps (Sect. 3.6). Errors are±1 standard error calculated based onthe standard errors of the slope and y-intercept from the inverse plots.f Kinetic information for•BrCl− can be determined using the inverse plot generated with either the 3BPD or 3CPD data. The analyte listedin parentheses is the one used for a given set of kinetic information.g Kinetic information for BrCl is determined using inverse plots generated from 3BPD data since BrCl is not a significant source of 3CPD.
3.4 Competition kinetics: overview and expected values
As described in Part 1, we use the competition kinetics exper-iments to calculate the steady-state concentration ([i]), rateof formation (Ri
F ), and lifetime (τi) for each reactive halo-gen speciesi. Here we apply these techniques for four ex-periments conducted with the chloride and mixed halide sys-tems. Below we discuss how we use model “data” to test our
kinetic equations (and associated data treatments) for deter-mining [i], Ri
F , andτi , and how we use experimental data totest the overall probe method.
In order to evaluate the validity of our kinetic Eqs. (14–16)with model “data”, we need to first determine the “expected”values of [i], Ri
F , andτi for each reactive halogen species inour competition kinetics experiments (Table 1). We obtain
Atmos. Chem. Phys., 6, 2439–2451, 2006 www.atmos-chem-phys.net/6/2439/2006/
C. Anastasio and B. M. Matthew: Technique for measuring aqueous reactive halogens: Part 2 2447
expected values for [i] directly from the Mix Full Model us-ing the same conditions (e.g., pH, [Br−], [Cl−]) as the corre-sponding experiment except that [AA] is set to zero.
As in Part 1, expected values ofRiF in the chloride and
mixed halide experiments are based on kinetic equations de-rived from the reactions responsible for the formation ofi
(S.8 and S.9). For example, the rates of formation of•Cl−2and Cl• in the chloride and mixed halide systems are calcu-lated using
RCl−2F = kClOH−
Cl− [Cl−][•ClOH−
]+kClOH−
H+ [•ClOH−
][H+](S36)
RClF = kCl−
OH [•OH][Cl−]Y Cl
OH (S37)
In the case of BrCl− the formation rate is calculated using
RBrCl−F = kCl−
BrOH− [•BrOH−
][Cl−]+kBr−ClOH− [
•ClOH−][Br−](S38)
Instead of directly calculating rates of formation of Br•, Br2,Cl2, and BrCl in the mixed halide system, we use their over-all rates of destruction with the major sinks (H2O2, HO•
2,and O−
2 ). This approach works since these species are all atsteady state (thus, for a given species, the formation and de-struction rates are equivalent) and is simpler since the forma-tion rates are difficult to determine (Matthew, 2002). How-ever, because of the complexity of the mixed halide sys-tem and the fact that a number of the mixed halide speciesundergo rapid interconversions, the expected values for therates of formation should be considered estimates. Finally,the expected value for the lifetime of each reactive halogenspecies is calculated from
τi =[i]
RiF
(19)
3.5 Competition kinetics: model experiments and datatreatments
In Part 1 we evaluated our kinetic equations and three datatreatments (A, B, and C) for their ability to provide accurateresults for [i], Ri
F , andτi in bromide solutions. Treatment Ais not used here because it is only applicable for Br• in so-lutions containing only bromide (Part 1). Data treatments Band C are first evaluated here by applying the treatments to“data” generated from model simulations (i.e., model “ex-periments”) performed under the same conditions as the ac-tual competition kinetics experiments (Table 1). We evaluatethese data treatments by comparing the results obtained fromthe model “data” after data treatment (i.e., MVDT values;Table 2) with the expected values described above. Because•BrCl− can form both 3BPD and 3CPD (Table S5), MVDTvalues of [i], Ri
F , andτi for •BrCl− can be obtained fromboth the 3BPD and 3CPD inverse plots. Note that speciesthat are insignificant sources of 3XPD (e.g., Cl• in the mixedhalide solutions) are not evaluated.
0
5
10
15
20
25
0 25 50 75 100 125 150
Concentration of Allyl Alcohol (μM)
Rat
e of
3B
PD F
orm
atio
n (n
M m
in-1
)
0.0
0.5
1.0
1.5
2.0
2.5
Rat
e of
3C
PD F
orm
atio
n (n
M m
in-1
)
Experiment: 3BPD Model: 3BPDExperiment: 3CPD Model: 3CPD
(a)
0
50
100
150
200
250
300
0 25 50 75 100 125 150Concentration of Allyl Alcohol (μM)
Rat
e of
AA
loss
(nM
min
-1) Experiment
Model
(b)
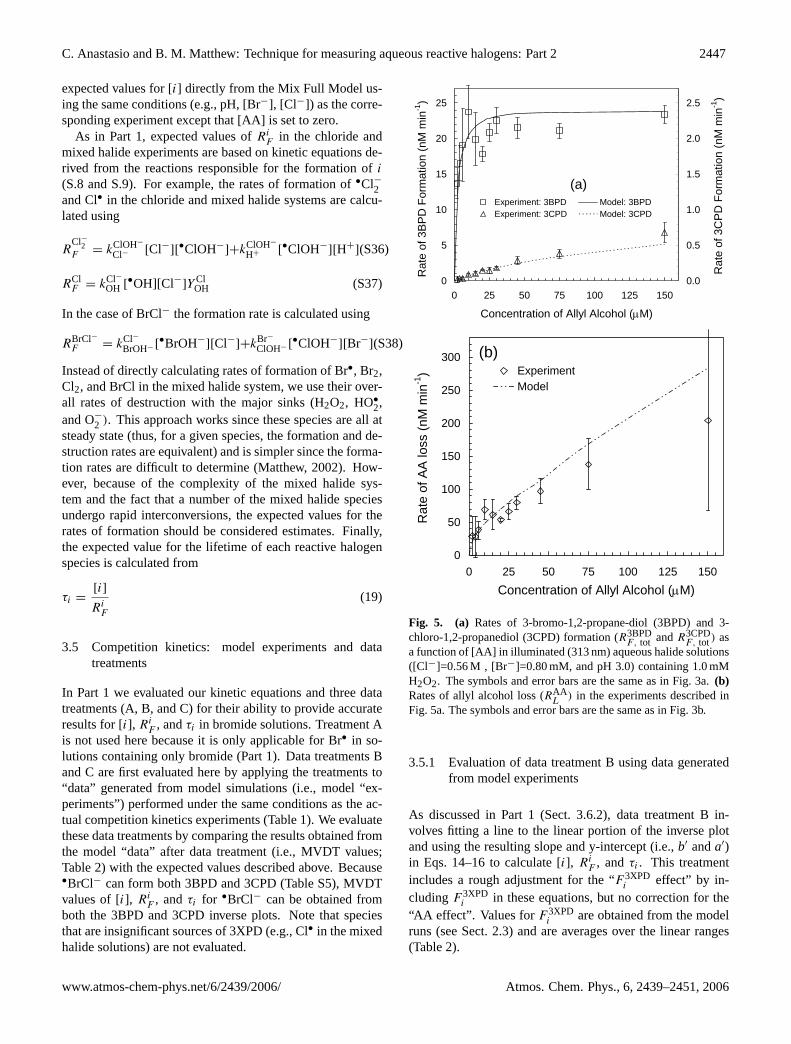
Fig. 5. (a) Rates of 3-bromo-1,2-propane-diol (3BPD) and 3-chloro-1,2-propanediol (3CPD) formation (R3BPD
F, tot andR3CPDF, tot) as
a function of [AA] in illuminated (313 nm) aqueous halide solutions([Cl−]=0.56 M , [Br−]=0.80 mM, and pH 3.0) containing 1.0 mMH2O2. The symbols and error bars are the same as in Fig. 3a.(b)Rates of allyl alcohol loss (RAA
L) in the experiments described in
Fig. 5a. The symbols and error bars are the same as in Fig. 3b.
3.5.1 Evaluation of data treatment B using data generatedfrom model experiments
As discussed in Part 1 (Sect. 3.6.2), data treatment B in-volves fitting a line to the linear portion of the inverse plotand using the resulting slope and y-intercept (i.e.,b′ anda′)in Eqs. 14–16 to calculate [i], Ri
F , andτi . This treatmentincludes a rough adjustment for the “F 3XPD
i effect” by in-cludingF 3XPD
i in these equations, but no correction for the“AA effect”. Values forF 3XPD
i are obtained from the modelruns (see Sect. 2.3) and are averages over the linear ranges(Table 2).
www.atmos-chem-phys.net/6/2439/2006/ Atmos. Chem. Phys., 6, 2439–2451, 2006
2448 C. Anastasio and B. M. Matthew: Technique for measuring aqueous reactive halogens: Part 2
0
5
10
15
20
25
0.00 0.10 0.20 0.30 0.40 0.50Inverse of Allyl Alcohol Concentration (106 M-1)
Inve
rse
Rat
e of
3C
PD F
orm
atio
n (1
09 M-1
s)
ExperimentModel
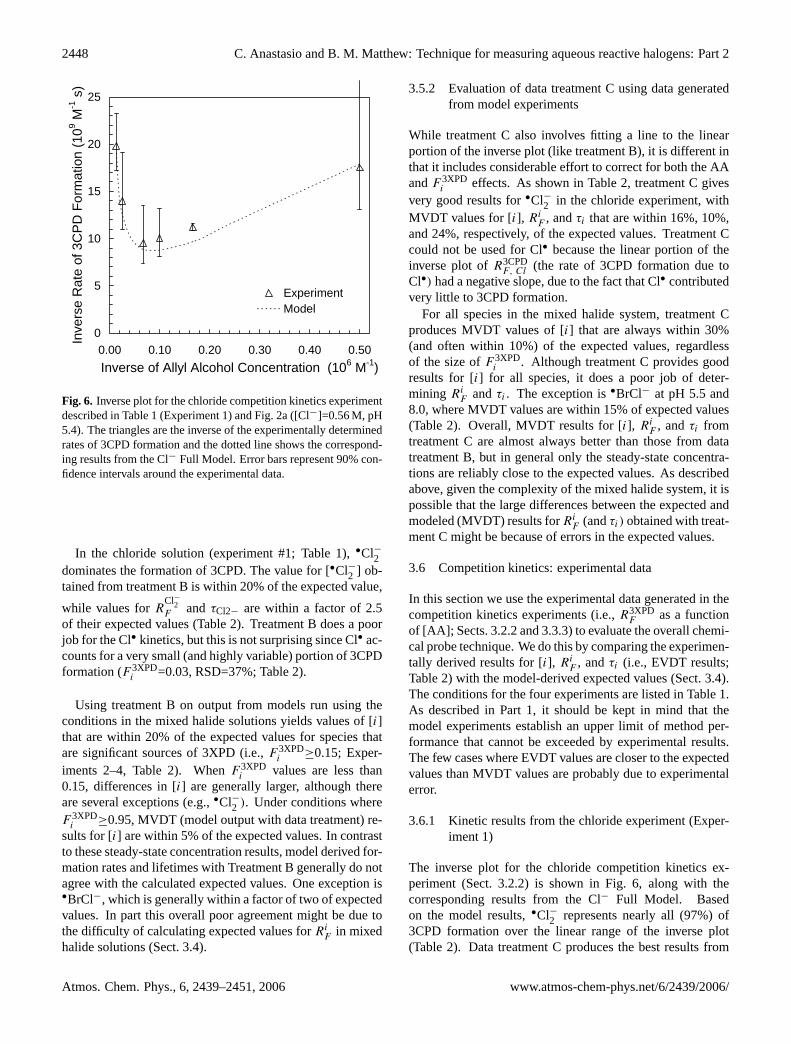
Fig. 6. Inverse plot for the chloride competition kinetics experimentdescribed in Table 1 (Experiment 1) and Fig. 2a ([Cl−]=0.56 M, pH5.4). The triangles are the inverse of the experimentally determinedrates of 3CPD formation and the dotted line shows the correspond-ing results from the Cl− Full Model. Error bars represent 90% con-fidence intervals around the experimental data.
In the chloride solution (experiment #1; Table 1),•Cl−2dominates the formation of 3CPD. The value for [•Cl−2 ] ob-tained from treatment B is within 20% of the expected value,
while values forRCl−2F and τCl2− are within a factor of 2.5
of their expected values (Table 2). Treatment B does a poorjob for the Cl• kinetics, but this is not surprising since Cl• ac-counts for a very small (and highly variable) portion of 3CPDformation (F 3XPD
i =0.03, RSD=37%; Table 2).
Using treatment B on output from models run using theconditions in the mixed halide solutions yields values of [i]that are within 20% of the expected values for species thatare significant sources of 3XPD (i.e.,F 3XPD
i ≥0.15; Exper-iments 2–4, Table 2). WhenF 3XPD
i values are less than0.15, differences in [i] are generally larger, although thereare several exceptions (e.g.,•Cl−2 ). Under conditions whereF 3XPD
i ≥0.95, MVDT (model output with data treatment) re-sults for [i] are within 5% of the expected values. In contrastto these steady-state concentration results, model derived for-mation rates and lifetimes with Treatment B generally do notagree with the calculated expected values. One exception is•BrCl−, which is generally within a factor of two of expectedvalues. In part this overall poor agreement might be due tothe difficulty of calculating expected values forRi
F in mixedhalide solutions (Sect. 3.4).
3.5.2 Evaluation of data treatment C using data generatedfrom model experiments
While treatment C also involves fitting a line to the linearportion of the inverse plot (like treatment B), it is different inthat it includes considerable effort to correct for both the AAandF 3XPD
i effects. As shown in Table 2, treatment C givesvery good results for•Cl−2 in the chloride experiment, withMVDT values for [i], Ri
F , andτi that are within 16%, 10%,and 24%, respectively, of the expected values. Treatment Ccould not be used for Cl• because the linear portion of theinverse plot ofR3CPD
F, Cl (the rate of 3CPD formation due toCl•) had a negative slope, due to the fact that Cl• contributedvery little to 3CPD formation.
For all species in the mixed halide system, treatment Cproduces MVDT values of [i] that are always within 30%(and often within 10%) of the expected values, regardlessof the size ofF 3XPD
i . Although treatment C provides goodresults for [i] for all species, it does a poor job of deter-mining Ri
F andτi . The exception is•BrCl− at pH 5.5 and8.0, where MVDT values are within 15% of expected values(Table 2). Overall, MVDT results for [i], Ri
F , andτi fromtreatment C are almost always better than those from datatreatment B, but in general only the steady-state concentra-tions are reliably close to the expected values. As describedabove, given the complexity of the mixed halide system, it ispossible that the large differences between the expected andmodeled (MVDT) results forRi
F (andτi) obtained with treat-ment C might be because of errors in the expected values.
3.6 Competition kinetics: experimental data
In this section we use the experimental data generated in thecompetition kinetics experiments (i.e.,R3XPD
F as a functionof [AA]; Sects. 3.2.2 and 3.3.3) to evaluate the overall chemi-cal probe technique. We do this by comparing the experimen-tally derived results for [i], Ri
F , andτi (i.e., EVDT results;Table 2) with the model-derived expected values (Sect. 3.4).The conditions for the four experiments are listed in Table 1.As described in Part 1, it should be kept in mind that themodel experiments establish an upper limit of method per-formance that cannot be exceeded by experimental results.The few cases where EVDT values are closer to the expectedvalues than MVDT values are probably due to experimentalerror.
3.6.1 Kinetic results from the chloride experiment (Exper-iment 1)
The inverse plot for the chloride competition kinetics ex-periment (Sect. 3.2.2) is shown in Fig. 6, along with thecorresponding results from the Cl− Full Model. Basedon the model results,•Cl−2 represents nearly all (97%) of3CPD formation over the linear range of the inverse plot(Table 2). Data treatment C produces the best results from
Atmos. Chem. Phys., 6, 2439–2451, 2006 www.atmos-chem-phys.net/6/2439/2006/
C. Anastasio and B. M. Matthew: Technique for measuring aqueous reactive halogens: Part 2 2449
the experimental values, in agreement with the model results.With this treatment experimentally derived values of [i], Ri
F
andτi for •Cl−2 are within 20%, 35%, and 46%, respectively,of the expected values (Table 2). When treatment B is used,the experimental value for [•Cl−2 ] is within 10% of the ex-pected value, butRi
F andτi are off by a factor of 3–4 (Ta-ble 2). Because Cl• accounts for an average of only 3% of the3CPD formed, treatment B with the experimental data yieldsCl• kinetic values that are very poor (as with the MVDT re-sults), while treatment C could not be used.
3.6.2 Kinetic results for the mixed halide experiments (Ex-periments 2–4)
Competition kinetics experiments in mixed halide solutionswere conducted at pH 3.0, 5.5 and 8.0 (Table 2). As summa-rized in Table 1, in all three cases there is good agreementbetween the model and experimental results, with averageRPD values for 1/R3XPD
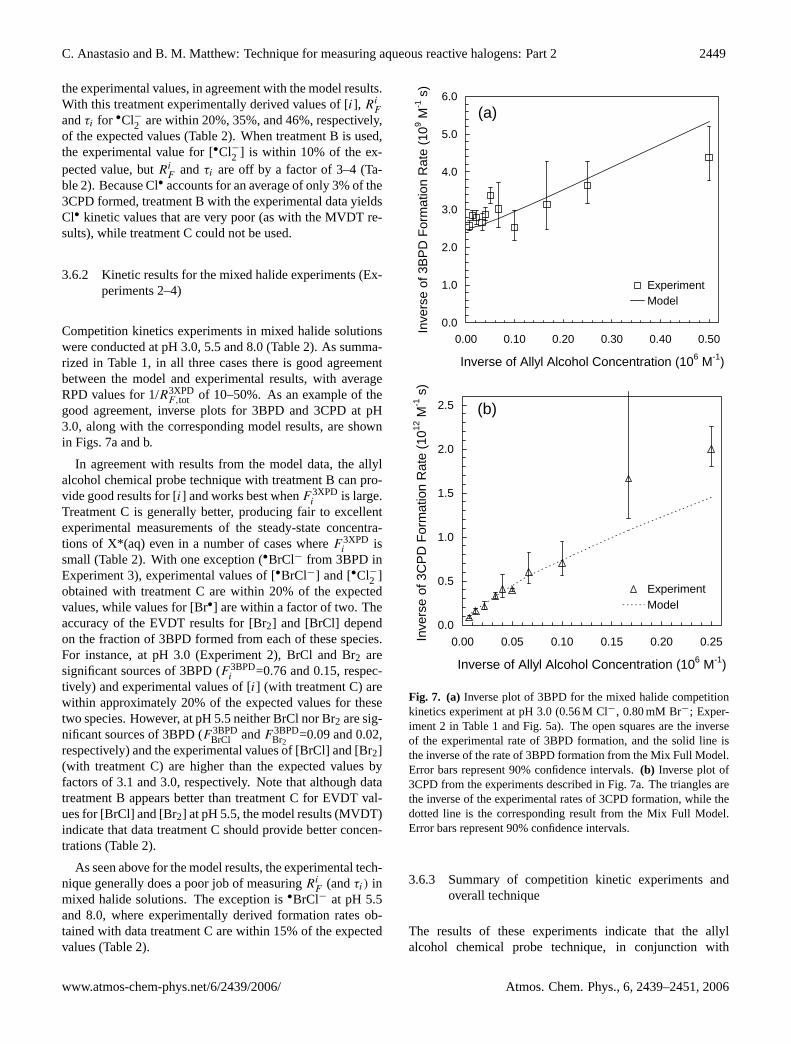
F,tot of 10–50%. As an example of thegood agreement, inverse plots for 3BPD and 3CPD at pH3.0, along with the corresponding model results, are shownin Figs. 7a and b.
In agreement with results from the model data, the allylalcohol chemical probe technique with treatment B can pro-vide good results for [i] and works best whenF 3XPD
i is large.Treatment C is generally better, producing fair to excellentexperimental measurements of the steady-state concentra-tions of X*(aq) even in a number of cases whereF 3XPD
i issmall (Table 2). With one exception (•BrCl− from 3BPD inExperiment 3), experimental values of [•BrCl−] and [•Cl−2 ]obtained with treatment C are within 20% of the expectedvalues, while values for [Br•] are within a factor of two. Theaccuracy of the EVDT results for [Br2] and [BrCl] dependon the fraction of 3BPD formed from each of these species.For instance, at pH 3.0 (Experiment 2), BrCl and Br2 aresignificant sources of 3BPD (F 3BPD
i =0.76 and 0.15, respec-tively) and experimental values of [i] (with treatment C) arewithin approximately 20% of the expected values for thesetwo species. However, at pH 5.5 neither BrCl nor Br2 are sig-nificant sources of 3BPD (F 3BPD
BrCl andF 3BPDBr2
=0.09 and 0.02,respectively) and the experimental values of [BrCl] and [Br2](with treatment C) are higher than the expected values byfactors of 3.1 and 3.0, respectively. Note that although datatreatment B appears better than treatment C for EVDT val-ues for [BrCl] and [Br2] at pH 5.5, the model results (MVDT)indicate that data treatment C should provide better concen-trations (Table 2).
As seen above for the model results, the experimental tech-nique generally does a poor job of measuringRi
F (andτi) inmixed halide solutions. The exception is•BrCl− at pH 5.5and 8.0, where experimentally derived formation rates ob-tained with data treatment C are within 15% of the expectedvalues (Table 2).
0.0
1.0
2.0
3.0
4.0
5.0
6.0
0.00 0.10 0.20 0.30 0.40 0.50
Inverse of Allyl Alcohol Concentration (106 M-1)
Inve
rse
of 3
BP
D F
orm
atio
n R
ate
(109 M
-1 s
)
ExperimentModel
(a)
0.0
0.5
1.0
1.5
2.0
2.5
0.00 0.05 0.10 0.15 0.20 0.25
Inverse of Allyl Alcohol Concentration (106 M-1)
Inve
rse
of 3
CP
D F
orm
atio
n R
ate
(1012
M-1
s)
ExperimentModel
(b)
Fig. 7. (a) Inverse plot of 3BPD for the mixed halide competitionkinetics experiment at pH 3.0 (0.56 M Cl−, 0.80 mM Br−; Exper-iment 2 in Table 1 and Fig. 5a). The open squares are the inverseof the experimental rate of 3BPD formation, and the solid line isthe inverse of the rate of 3BPD formation from the Mix Full Model.Error bars represent 90% confidence intervals.(b) Inverse plot of3CPD from the experiments described in Fig. 7a. The triangles arethe inverse of the experimental rates of 3CPD formation, while thedotted line is the corresponding result from the Mix Full Model.Error bars represent 90% confidence intervals.
3.6.3 Summary of competition kinetic experiments andoverall technique
The results of these experiments indicate that the allylalcohol chemical probe technique, in conjunction with
www.atmos-chem-phys.net/6/2439/2006/ Atmos. Chem. Phys., 6, 2439–2451, 2006
2450 C. Anastasio and B. M. Matthew: Technique for measuring aqueous reactive halogens: Part 2
competition kinetics and data treatment C, can accuratelymeasure steady-state concentrations of a number of reactivehalogen species in mixed halide solutions. These values arenearly all within a factor of 2 of expected values and are of-ten within 20%. The simpler treatment B also generally pro-duces good results for [i] that are within a factor of 2.5 ofexpected values for those reactive halogens responsible for asignificant fraction of the 3XPD measured. In contrast, bothtreatments produce experimentally determined rates of for-mation and lifetimes of reactive halogens in mixed halide so-lutions that are generally quite different from the expectedvalues. This is in contrast to results from solutions contain-ing only bromide (Part 1) or chloride (Sect. 3.6.1), where thetechnique can generally measure [i], Ri
F , andτi to within afactor of 2 for Br•, Br2, HOBr, and•Cl−2 .
3.7 Applications and limitations of the probe technique
As discussed in Part 1, this technique was developed so thatwe could eventually investigate halide oxidation by•OH inenvironmental samples, a process that is important in seawa-ter (Zafiriou et al., 1987; Zhou and Mopper, 1990), sea-saltparticles (Matthew et al., 2003), and perhaps in the snowpack(Chu and Anastasio, 2005). As with the bromide system, ac-curately modeling the chemistry in the chloride and mixedhalide systems requires measuring•OH kinetics in the sam-ple so thatROH
F , [•OH], andτOH can be accurately repre-sented in the model. If other oxidants are employed (e.g.,•NO3 or O3) the kinetic equations and model would need tobe modified and tested.
While the work described here was done on laboratory so-lutions, our technique is sensitive enough that it should alsowork on environmental samples, although we have not yetperformed these experiments. Concentrations of•OH in themixed halide solutions (in the absence of AA) in the competi-tion kinetics experiments here ranged from (4–9)×10−16 M.Based on the sensitive detection limits for 3BPD and 3CPD(approximately 1 and 7 nM, respectively; Matthew and Anas-tasio, 2000), the technique should work readily in illumi-nated sea-salt aerosols where•OH concentrations are typi-cally 10−16–10−15 M (Newberg, 2003). After some modifi-cation to improve sensitivity (e.g., by taking larger samplealiquots), the technique should also be useful in illuminatedseawater samples where hydroxyl radical concentrations aretypically 10−18 to 10−17 M (Zhou and Mopper, 1990). Inaddition to quantifying concentrations of reactive halogensin environmental samples, the technique also offers the op-portunity to quantitatively examine the rates and mechanismsof halogenation of organic compounds under environmentalconditions.
The major limitation of the method stems from the factthat it is somewhat nonspecific, i.e., 3BPD and 3CPD areeach formed by several different reactive halogen species.Because of this, we need to use results from a numericalmodel to calculate the fraction of 3XPD formed from each
species (F 3XPDi ). There are possible biases associated with
using these model-derived values ofF 3XPDi , but as discussed
in Part 1, we feel these biases are generally small. In addi-tion, there are some important conditions (e.g., at the highpH of seawater or fresh sea-salt particles; see Experiment 4in Table 2) where 3XPD is formed by essentially only onespecies and thus the lack of specificity in the technique isunimportant.
A second limitation of the technique is that a data treat-ment must be chosen to analyze the experimental results.In the well-defined laboratory solutions studied here we canchoose data treatments based on their performance in themodel experiments (Sect. 3.5). Similar steps could be per-formed for studies of environmental samples, but this wouldassume that results from the laboratory solutions are gen-erally applicable to environmental samples. A third limi-tation of the technique in mixed halide solutions is that itcan currently only be used to quantitatively measure steady-state concentrations of X*(aq), with the exception of•BrCl−
in non-acidic solutions whereRiF andτi can also be deter-
mined. Finally, one additional limitation is that our kineticmodeling relies, in part, on rate constants that were estimatedbased on fitting the model to our experimental results. Whilewe used independently measured reactions and rate constantwhere possible, there are currently very few published re-ports about mixed halide radical reactions, or the reactionsof reactive halogens with unsaturated organic compounds, inaqueous solution. As new data become available they shouldimprove both the predictive power of the kinetic model aswell as the accuracy of the chemical probe technique.
4 Conclusions
We have developed a chemical probe technique that canquantify reactive halide species in solutions containing bro-mide and/or chloride. This technique is based on the reac-tion of aqueous-phase reactive halogens (X*(aq)) with allylalcohol to form 3-bromo-1, 2-propanediol and 3-chloro-1, 2-propanediol (collectively referred to as 3XPD). Using com-petition kinetics, the measured rates of 3XPD formation areused to determine the steady-state concentrations of X*(aq)as well as their rates of formation and lifetimes under someconditions. The technique was in part validated with mod-els that were constrained by several sets of experiments thatmeasured 3XPD formation and Br2(g) release under a widerange of experimental conditions.
In bromide or chloride solutions the technique can be usedto measure steady- state concentrations, rates of formation,and lifetimes of several reactive halide species, includingBr•, Br2, HOBr, and•Cl−2 . In mixed bromide/chloride solu-tions, the technique can measure steady-state concentrationsof these same species as well as BrCl and•BrCl−. Experi-mentally determined results are generally within a factor of2–3 (and often much closer) of values derived from model
Atmos. Chem. Phys., 6, 2439–2451, 2006 www.atmos-chem-phys.net/6/2439/2006/
C. Anastasio and B. M. Matthew: Technique for measuring aqueous reactive halogens: Part 2 2451
runs. While this technique has a few limitations, it is a newand sensitive tool that can be used to investigate aqueoushalide chemistry, halide oxidation mechanisms and halideradical dynamics in both laboratory solutions and environ-mental samples.
Acknowledgements.This work was supported by the Atmo-spheric Chemistry Program of the National Science Foundation(ATM-9701995), a NASA Earth System Science Fellowship(to B. M. Matthew), and by a University of California, DavisJastro-Shields Fellowship. The authors thank A. Jordan, J. Chang,J. Smith, and I. George for assistance.
Edited by: M.Ammann
References
Anastasio, C., Faust, B. C., and Allen, J. M.: Aqueous phase pho-tochemical formation of hydrogen peroxide in authentic cloudwaters, J. Geophys. Res., 99, 8231–8248, 1994.
Braun, W., Herron, J. T., and Kahaner, D. K.: Acuchem: A com-puter program for modeling complex chemical reaction systems,Int. J. Chem. Kin., 20, 51–62, 1988.
Chu, L. and Anastasio, C.: Formation of hydroxyl radical from thephotolysis of frozen hydrogen peroxide, J. Phys. Chem. A, 109,6264–6271, 2005.
Donati, A.: Spectroscopic and kinetic investigations of halogen-containing radicals in the tropospheric aqueous phase, Ph.D. Dis-sertation, University of Leipzig, 2002.
Ershov, B. G.: Kinetics, mechanism and intermediates of someradiation-induced reactions in aqueous solutions, Russian Chem.Rev., 73, 101–113, 2004.
Matthew, B. M.: Chemical probe technique for the detection of ox-idized halogen species in aqueous solution, Ph.D. Dissertation,University of California – Davis, 2002.
Matthew, B. M. and Anastasio, C.: Determination of halogenatedmono-alcohols and diols in water by gas chromatography withelectron-capture detection, J. Chromatogr. A, 866, 65–77, 2000.
Matthew, B. M. and Anastasio, C.: A chemical probe technique forthe determination of reactive halogen species in aqueous solu-tion: Part 1 – Bromide solutions, Atmos. Chem. Phys., 6, 2423–2437, 2006,http://www.atmos-chem-phys.net/6/2423/2006/.
Matthew, B. M., George, I., and Anastasio, C.: Hydroperoxyl rad-ical (HO2) oxidizes dibromide radical anion (Br2-) to bromine(Br2) in aqueous solutions: Implications for the formation ofBr2 in the marine boundary layer, Geophys. Res. Lett., 30, 2297–2301, 2003.
Newberg, J. T.: Measurements of inorganic ion composition, UV-visible absorption and hydroxyl radical kinetics in marine parti-cles from the northeasetrn Pacific Ocean, M. S. Thesis, Univer-sity of California – Davis, 2003.
Zafiriou, O. C., True, M. B., and Hayon, E.: Consequences of OHradical reaction in sea water: Formation and decay of Br2- ionradical, in: Photochemistry of Environmental Aquatic Systems,edited by: Zika, R. G. and Cooper, W. J., American ChemicalSociety, Washington D.C., 89–105, 1987.
Zhou, X. and Mopper, K.: Determination of photochemically pro-duced hydroxyl radicals in seawater and freshwater, Mar. Chem.,30, 71–88, 1990.
www.atmos-chem-phys.net/6/2439/2006/ Atmos. Chem. Phys., 6, 2439–2451, 2006