a climatology of southern hemisphere extratropical cyclones
TRANSCRIPT

Climate Dynamics (1993) 9:131-145 {limn/¢
Dynnmia © Springer-Verlag 1993
A climatology of Southern Hemisphere extratropical cyclones David A Jones, Ian Simmonds
School of Earth Sciences, University of Melbourne, Parkville, Victoria, 3052, Australia
Received: 24 November 1992/Accepted: 11 March 1993
Abstract. A climatology of extratropical cyclones de- termined by an objective automatic scheme applied to 15 years (1975-89) of once-daily Australian Bureau of Meteorology hemispheric analyses is presented. Con- tour maps of the positions of formation (cyclogenesis), dissipation (cyclolysis) together with other cyclone sta- tistics are presented. The distribution of cyclones through the hemisphere was found to be dominated by a permanent high latitude core coincident with the cir- cumpolar trough. During the winter and intermediate seasons, two mid latitude branches are evident in the cyclone density originating in the Tasman Sea and South American sectors, both spiraling, poleward and merging with the circumpolar core in the Southern Oceans. Systems were observed to move in an east- south-east direction, away from their location of for- mation, exhibiting peak speeds of migration in the mid latitudes. Little seasonality was evident in the densitiy distribution of cyclones through the Southern Oceans, but a considerable amount was found in their central pressure.
Introduction
The extratropical regions of both hemispheres are characterized by a continual procession of migratory synoptic features, resulting in much of the short-term atmospheric variability known as weather. These sys- tems, in particular anticyclones, lows and associated fronts have a considerable impact on the local atmos- pheric conditions in addition to providing a significant mechanism for the transport of energy and momen- tum, important for the maintenance of the global at- mospheric budgets. As a consequence of the primary part played by these features, studies pertaining to their distribution and behavior, both in observational and model derived data sets, are important. This is es- pecially the case in the Southern Hemisphere (SH)
Correspondence to: I Simmonds
where the coincident placement of the temperature and height standing waves means the dominant trans- fer mechanism for energy is through transient eddy transport (compare Oort and Peixdto 1983; Trenberth 1991).
Given the important role of transient disturbances, particularly in the SH, it makes sense to examine their climatology with all available techniques. Jones and Simmonds (1993) have referred to a number of defini- tions of "storm tracks" which have been used in the literature and the differences between them. Given the plethora of definitions, it is important that a climatolo- gy of low pressure centers be established.
Studies of the distribution and behavior of extratro- pical cyclones are not new. With reliable Northern Hemispheric analyses dating back to the nineteenth century, studies of extratropical lows in the Northern Hemisphere (NH) based on analyses over extended time periods have been possible. Petterssen (1956) presents the geographical distribution of the frequency of cyclones and cyclogenesis events for the period, 1899-1939. Klein (1957), using the same 40 year peri- od, determined the distribution of the temporal fre- quency of cyclones in all 12 calendar months in 5 ° x 5 ° quadrangles throughout the NH. Using 20 selected years, with superior data coverage, Klein investigated the geographical distribution of cyclogenesis events.
In the SH such studies have been more restricted as a consequence of the lack of long-term and consistent analyses, and general deficiencies in the observational network. In particular, the large oceanic regions, which comprise the major part of the hemisphere, are grossly under-observed, with only scattered ship, buoy and is- land observations being available prior to the advent of sophisticated satellite technologies.
Although large-scale studies pertaining to extratro- pical cyclones in the SH can be traced back to the early part of the current century (see Palmer 1942; Gibbs 1953), it was not until the International Geophysical Year (IGY) (July 1957-December 1958) that the ob- servational network reached a level adequate to pro- vide a reasonable picture of the behavior of systems on

132 Jones and Simmonds: Climatology of Southern Hemisphere cyclones
a hemispheric scale. The resultant availability of com- prehensive analyses arising from this research effort resulted in the publication of numerous articles and precipitated the synoptic appraisals of Van Loon (1965) and Taljaard (1967). Taljaard's study docu- mented the existence of a core of increased cyclone density through the high southern latitudes, coincident with the circumpolar trough (CPT). During the sum- mer and intermediate seasons, well defined regions of enhanced density of lows were evident over the subtro- pical continents, primarily associated with persistent thermal lows. Of note, during the winter and to a lesser extent the transitional months, two primary spiral arms were evident in the cyclone density, the first extending from the Gran Chaco region of South America through the South Atlantic and the second, stretching from the Tasman Sea through the South Pacific spiral- ing southeast and merging with the CPT core near Drake Passage.
More recently, with the advent of Satellite technolo- gies, SH studies of cyclones have made use of visible and infrared imagery (Streten and Troup 1973; Carle- ton 1979, 1981) to study the development, movement and dissipation of cyclonic vortices. Based on the char- acteristic cloud signatures in the imagery, these authors bypassed the conventional analyses with their asso- ciated shortcomings due to the paucity of observation- al data, but faced the limitations associated with manu- al techniques.
Kep (1984) used 10 years (1972-1981) of manual analyses, to develop a climatology of cyclogenesis, cy- clolysis and track density throughout the hemisphere. This study confirmed many of the findings of early au- thors with a core of high track density throughout the high latitudes of the hemisphere. Kep noted a general tendency for systems to form preferentially between 40-50°S during July and 50-60°S during the month of January. The banding structure in the cyclone tracks, alluded to in the aforementioned studies, was not in evidence in Kep's climatology, possibly as a result of the coarse grid resolution used (10°x 10 °) and tempo- ral averaging.
It has only been in recent times, with the massive advances in computer resources, that numerical sche- mes have become feasible and available for the objec- tive extraction of cyclone based statistics. Earlier stud- ies based on the manual interpretation of analyses or satellite imagery had the disadvantage of being labour intensive, while the requirement for human interven- tion makes possible the introduction of considerable subjectivity. Numerical schemes based on the mathe- matical determination of cyclone positions and tracks from digital analyses have been initiated in light of the methods developed for manual studies. This formula- tion ensures consistency throughout the duration of the study and makes possible the objective production of statistics.
To date, only a handful of studies have made use of numerical algorithms to investigate extratropical lows. Le Marshall and Kelly (1981) in a review of the clima- tology of the Australian analyses for the five year peri-
od 1973-1977, used an automatic vortex finding rou- tine based on a continuous space, gradient technique, to investigate the zonal and geographic distribution of cyclones and anticyclones. Their distributions had much in common with those of earlier researchers, with a core of high cyclone densitiy throughout the high latitudes. The spiral bands evident during winter in the IGY-based studies were also in evidence but somewhat less clearly defined. They concluded that these bands were partially truncated as a result of the temporal averaging procedure which results in a zonal smoothing.
More recently, Lambert (1988) used an automatic cyclone finding routine to form winter climatologies, for both hemispheres, of the cyclonic features in ECMWF/WMO analyses for the years 1980-1984 and in a 5 year simulation of the Canadian Climate Centre general circulation model. Le Treut and Kalnay (1990) made use of a numerical scheme to find and track cy- clones for two special 50-day observing periods of the First GARP Global Experiment (FGGE) and a series of general circulation model (GCM) simulations.
Until now, no objective study of extratropical cy- clones has been presented for the SH, based on an ex- tended period of numerical analyses. It is this task that the current study aims to address. A full 15 years of numerical analyses have been processed using a ver- sion of the low "finding" and "tracking" scheme of Murray and Simmonds (1991a). The results of this have been used to generate a climatology of the distri- bution and behavior of extratropical cyclones through- out the hemisphere. As a consequence of the tech- niques employed, the current study is purely objective, with no manual interference following the initial speci- fication of the search and tracking parameters.
The data and summary of techniques
The data analyses on which the current study is based are the 2300 GMT numerical analyses from the Aus- tralian Bureau of Meteorology, Melbourne, Australia. These numerical analyses (here referred to as the ASH analyses), are presented on a 47x47 polar stereo- graphic (PS) grid centered on the south pole, giving an effective resolution of approximately 500 km at 45°S (Guymer 1986). The earlier years of this set have been used in a wide range of studies (e.g., Le Marshall and Kelly 1981; Trenberth 1981). The quality and veracity of these data has been extensively discussed by Tren- berth (1979), Swanson and Trenberth (1981) and Ny- dam (1989). For an overview of the methods used in the generation of this data set together with the data used as input, the reader is referred to Le Marshall et al. (1985).
Of particular relevance to the current study are dis- crepancies which have been noted between the 1100 GMT and 2300 GMT analysis time, the latter generally considered to be the superior subset. While the "track- ing" scheme used in this study may be applied to ana- lyses provided at any temporal frequency, the inconsis-
Jones and Simmonds: Climatology of Southern Hemisphere cyclones
tencies between the two sampling times lead to the confinement of the current study to the superior 2300 GMT time. The current work is based on analyses for the 15-year period, February 1975 to March 1990. The earlier analyses in the ASH archives (July 1972 to Jan- uary 1975) were excluded owing to the high frequency of missing analyses which complicates and prejudices the tracking of systems.
We have used a version of the objective low finding and tracking scheme described in Murray (1988), Mur- ray and Simmonds (1991a) (MSa) and used in the at- mospheric model based study of Murray and Sim- monds (1991b) (MSb). This scheme is fully objective, with no manual intervention after the initial prescrip- tion of a series of search and tracking parameters. To find the lows, the digital pressure fields, on a confor- mal polar stereographic grid, are represented in terms of continuous functions using cubic splines computed along the grid axes. An iterative differential routine based on the ellipsoidal minimization techniques, is used to define the location of lows in continuous space. Both closed (those systems possessing a closed isobar at a given interval) and open depressions (those not containing a closed isobar) are included in the present study. The position of the closed depressions were de- fined by the minimization of the pressure functions, while open depressions, indicating inflexions in the pressure field, were found by a search for minima in the absolute value of the local pressure gradient.
To avoid the inclusion of small-scale or broad shal- low systems being prone to be associated with topogra- phical or analytical effects rather than being significant migratory features, a minimum curvature test was ap- plied to the data. This "curvature test" requires that the value of the Laplacian of pressure must exceed some specified minimum value for the system to be in- cluded as significant, and be used in the subsequent analysis. In the present study this test has been:
V2P + 0.1V2P > 0.08 hPa(deg.lat.) -2
where 02p 0ap
VzP -- 0 ~ - -~ 0y 2
The overbar represents the areal average of the pres- sure curvature over a pass radius of 5 ° of latitude. This has been calculated by a numerical integration of the continuous Laplacian of pressure over a radius of 5 ° latitude about each cyclone's center. (In this work we have chosen 1 ° of latitude as a basic unit of length, and the square of this as the unit of area.)
Cyclone paths were computed according to the probability of the association of "predicted" and subse- quent observed cyclone positions and pressures. Where no match occurred above a predefined proba- bility level, cyclogenesis or cyclolysis was deemed to have occurred. The probability of matching was com- puted by a weighted average of the difference in the location and central pressure of predicted and subse- quently observed cyclones. The prediction of the sys- tem position involved the use of the past movement of
133
the system in addition to a zonally averaged velocity (in the north-south, east-west directions) of the ex- pected climatic movement. The central pressure pre- dicted for the subsequent time was based on the sys- tems pressure and its past tendency.
The present statistics are based on all systems which existed at two sequential analyses times (i.e., a mini- mum track life-time of 24 h). The derivation of statis- tics involved the interpolation (using cubic splines) of cyclone positions to four intervening positions between the analyses times with all positions, both interpolated and observed being used in the generation of the cy- clone statistics. A Cressman weighting scheme was then applied to each cyclone position to distribute the data about a small group of surrounding grid points. The cyclone statistics were derived on a 47 x 47 PS grid compatible with the original ASH grid.
Cyclone track histories were generated for each cal- endar season with a 10 day extension used at the start and finish of every individual season to facilitate track- ing over the seasonal "boundaries". In the case of mis- sing analyses, the tracking was performed over the break provided the discontinuity was less than three consecutive analyses. In the case of three or more mis- sing consecutive analyses, the tracking was terminated, and it was started again after the time discontinuity (in the 60 seasons only six such cases were encountered). The various seasonal statistics presented are the aver- age of those over each individual season with the weighting based on the number of analysis times con- tained in each season. Cyclogenesis was defined to have occurred at the initial position of each cyclone track while the final tracked position was defined to be the location of cyclolysis.
Sea level pressure
As a background against which we consider the SH cy- clones, we present the time-mean mean sea level pres- sure (MSLP) from the ASH set. In Fig. 1 is displayed this variable for summer (December, January and Fe- bruary) and winter (June, July, August). While the lim- itations associated with the paucity of data means no analyses set may be considered as truly representing the atmospheric state, the ASH set has proven to be of a sufficient quality to allow meaningful studies of the current type.
Cyclone tracks
In Fig. 2 are shown the cyclone tracks and daily posi- tions of cyclones covering the 5-year period, 1985-89, for the summer, autumn (March, April and May), win- ter and spring (September, October and November) seasons. (To reduce the degree of clutter, only the last five years of the 15 year set have been plotted.) Com- parison with the tracks for the remaining 10 years indi- cate no substantial differences, suggesting that a 5-year period is sufficient for qualitatively stable statistics.

134 Jones and Simmonds: Climatology of Southern Hemisphere cyclones
a b
Fig. la. The mean sea level pressure as inferred from the ASH set for summer and b winter. The contour interval is 5.0 hPa
In all seasons one observes peak cyclone track den- sity around the Antarctic coast, in the latitude band 55-70°S, coincident with the CPT. These plots indicate a tendency for systems to develop at lower latitudes before migrating typically in an east-south-east (ESE) direction towards higher latitudes where they merge with the circumpolar core and eventually decay.
During the summer and transition seasons, there are locally increased track concentrations over the sub- tropical Continents, while tropical lows are responsible for the local maxima in cyclone numbers to the north- west of Australia, in the Coral Sea and near Madagas- car. In winter the subtropical maxima over Africa and Australia disappear, while the core of high track densi- ty about the Antarctic coast takes on a more extensive and diffuse form. One observes enhanced track densi- ties throughout the mid latitudes while the CPT region displays generally reduced system numbers.
Examination of the cyclone tracks through the mid latitudes indicates the existence of two branches of en- hanced cyclone density. The principal of these occurs in the Pacific, stretching from Eastern Australia in an ESE direction across the Pacific, merging with the CPT core near Drake Passage. The second, less developed branch, extends from the Gran Chaco region of South America, southeast (SE) across the South Atlantic, merging with the CPT core to the southwest of Africa. Both cores are best developed during winter and spring and only weakly evident during summer.
Seasona l m e a n f ie lds
System density
The geographical distribution of the area normalized system density (the number of systems per degree lati- tude square), for the summer and winter seasons is dis- played in Fig. 3. Peak cyclone densities are observed in a ring coincident with the CPT, with a number of em- bedded maxima evident within this core. These maxi- ma, located to the south of Africa, in the Southern In- dian Ocean and in the East Ross Sea are in evidence during both seasons while a less pronounced maximum occurs in the Weddell Sea during winter. The high lev- els of system density about the East Antarctic coast would appear to be a consequence of enhanced baro- clinicity (van Loon and Kidson 1993) and a more con- stricted storm track through this region (Fig. 2). The maximum in the East Ross Sea lies in a region of fre- quent system stagnation and decay which, combined with the confluence of systems from the Tasman Sea- South Pacific, results in a local enhancement of the cy- clone density.
Through the mid and low latitudes, the distribution of cyclones shows an increased structure with clearly delineated regions of enhanced cyclone density. The summer continental maxima at low latitudes are prima- rily a product of persistent thermal lows formed chiefly as a consequence of the temperature excess in the low- er troposphere.
A secondary branch of increased cyclone density is evident in the South Pacific, stretching from southern Australia, through the Tasman Sea and merging with the circumpolar core near Drake Passage. This branch,

Jones and Simmonds: Climatology of Southern Hemisphere cyclones
o b
135
c d Fig. 2a-d. Tracks and daily positions of all cyclones for a summer; b atumn, c winter and d spring (for the years 1985-89 inclusive)
evident in both seasons, is most clearly defined in win- ter. While the initiation point of this band is somewhat uncertain, the region of enhanced cyclone density ap- pears to commence over the Tasman Sea. Although the Australian Bight shows enhanced cyclone density, this appears disjointed from the band in the Tasman Sea particularly near southeast Australia. This inter- pretation is supported by the regional study of Leigh- ton and Deslandes (1991), which indicates a relative minimum in the cyclonicity near Tasmania. The in-
creased values of the system density in the Tasman Sea, coincide with a maximum in the incidence of cy- clogenesis (Fig. 4) (see Taljaard 1967; Le Treut and Kalnay 1990). The weaker nature of the band during summer would appear to be a consequence of the re- duced incidence of genesis during this season.
Through the South Pacific, this branch of enhanced cyclone density coincides with increased cyclogenetic activity. The increased cyclone density and enhanced levels of genesis coincides with enhanced cloudiness

136 Jones and Simmonds: Climatology of Southern Hemisphere cyclones
Q b
Fig. 3. a The cyclone system density for summer and b winter. The contour interval is 0.5 x 10⁻³cyclones(deg.lat.)-2. Light and heavy stippling denotes area above 1.0 and 3.0 respectively
a b
Fig. 4. a The density of cyclogenesis for summer and b winter. The contour interval is 1.0 x 10⁻⁴cyclones.day- l(deg.lat.) -z. Light and heavy stippling denotes area above 2.0 and 4.0 respectively
associated with the semi-permanent South Pacific Con- vergence Zone. Streten and Troup (1973) have con- f irmed this zone of considerable cloudinesss to be an area of substantial weather activity with wave distur- bances and cyclogenesis activity occurring along its length, the so-formed depressions moving in a general southeasterly direction towards Cape Horn.
Through the Atlantic, there is evidence of a second mid latitude band of enhanced cyclone density to the lee of the Andes, merging with the CPT max imu m near the Greenwich meridian. This is most strongly in evidence during winter, and only weakly apparent dur- ing summer. Examinat ion of the cyclone tracks in this region indicates two chief genesis regions contributing

Jones and Simmonds: Climatology of Southern Hemisphere cyclones
to the increased cyclone density. The first, centered in the Gran Chaco region of South America is the more active of the two. Topographical and thermal effects are thought to be the chief mechanism contributing to the existence of this maximum of the system density and genesis, the damming effect of the Andes moun- tain chain, and low-level warm air advection from the northwest playing the major role. Most of these sys- tems remain semi-stationary as a consequence of their relationship to local influences, relatively few of these becoming transient and contributing to the system den- sity downstream. The second less active, but paradoxi- cally more important source of transient systems lies near 40°W. This coincides with the region of enhanced baroclinicity associated with the frontal zone over the Brazil current (Hoflich 1984).
Cyclogenesis
Figure 4 shows the areal frequency of cyclogenesis for the summer and winter seasons. Although the contour- ing of any feature characterized by discrete episodes must be treated with caution, the large data sample used ensures continuity of statistics in the current re- sults.
Significant numbers of cyclone formations are ob- served to occur throughout the hemisphere with the exception of the eastern ocean basins year round, and subtropical East Africa and Australia during winter. The Antarctic interior is devoid of genesis events, through the high relief and the associated integration of surface pressure to sea level complicates interpreta- tion.
137
Substantial cyclone formation is observed to occur throughout the high southern latitudes within, and to the south of, the CPT in agreement with Kep (1984) and Le Treut and Kalnay (1990). The region centered on the CPT is one the most active genesis regions in the hemisphere, with only the subtropical continents displaying a greater incidence of cyclogenesis.
A number of preferred regions of enhanced genesis are observed through the mid and low latitudes of the hemisphere. Among the most prominent of these are the Gran Chaco region of South America all year round, and Africa and Northern Australia which show geographical maxima in the density of genesis during the summer and intermediate seasons (see Fig. 2). Ad- ditional to the continental peaks, the Central Pacific and New Zealand regions show maxima, especially during the winter season.
Cyclolysis
A similar presentation for cyclolysis (Fig. 5) serves to illuminate the typical life sequence of cyclonic vortices in the SH. Much similarity is evident between the dis- tribution of the frequency density of cyclolysis and cy- clogenesis suggesting considerable in situ development and decay. In particular, the continental cyclogenesis maxima in the subtropics all exhibit equivalent regions of enhanced cyclolysis, the latter being typically 5 ° po- leward and downstream of the formative centers.
Through the mid latitudes, there is a general excess of formation over decay, indicating these regions serve as a net source of cyclonic vortices. The converse is the case at higher latitudes, particularly south of 65 ° S. The
a b
Fig. 5. a The density of cyclolysis for summer and h winter. The contour interval is 1.0 x 10-%yclones.day-l(deg.lat.)--2, Light and heavy stippling denotes area above 2.0 and 4.0 respectively

138
extratropical maximum of the cyclolysis is found to lie typically 5 ° south of the location of the time-mean CPT, supporting the interpretation of Taljaard and others, that this region acts as a net sink of decaying systems.
Apparent in the distribution of cyclolysis is a ten- dency for increased levels to coincide with the embay- ments of the Antarctic coast, most notably the Weddell and Bellingshausen Sea. This structure has been com- mented on by a number of authors (e.g., Streten and Troup 1973; Carleton 1979; Budd 1986) who have as- cribed enhanced cyclolysis to major embayments of the Antarctic coast. Although the plots shown here gener- ally suggest a link, the placement of the hemispheric peak in cyclolysis off the East Antarctic coast, a region devoid of such embayments, suggests such regions are not unique in their high levels of cyclolysis. Examina- tion of the cyclone tracks (Fig. 2) indicates that the en- hanced levels of cyclolysis in the Bellingshausen and Weddell Seas may be as much tied to their position downstream of regions of increased cyclogenesis, both at mid and high latitudes as to local effects. This is sug- gestive that the correspondence between the Antarctic embayments and regions of enhanced cyclolytic activi- ty may be partly an artifact of effects upstream rather than being tied wholly to regional features.
Mean central pressure
Maps of the geographical distribution of the mean cen- tral pressure (MCP) (the mean of the central pressure of systems) of cyclones for the summer and winter sea- sons are displayed in Fig. 6. These show a considerable degree of zonal symmetry with minima in the field
Jones and Simmonds: Climatology of Southern Hemisphere cyclones
coincident with the CPT. Peak values are found in the subtropics, near the subtropical ridge (STR).
The MCP shows considerable seasonality particu- larly at high latitudes. In the CPT, the winter MCP is typically 5 hPa less than that during summer, with ex- tensive regions displaying values less than 970 hPa. At lower latitudes, where warm core systems dominate, the seasonality is reversed with the deepest depres- sions occurring during the summer period.
Although the absence of observational studies relat- ing to the central pressure of systems excludes the pos- sibility of hemispheric comparisons with previously de- rived fields, a limited comparison can be made with the profiles of Karelsky (1963). Even though the averaging periods are different, his figures provide a useful set for comparative purposes. Comparison of the current summer profile with Karelsky (his Fig. 3) shows that, although some of the finer structure is not apparent in our figures, possibly due to the effect of averaging over a greater time period, there is a broad agreement. The placement of the 990 and 996 hPa contours is similar while the 1000 hPa contour shows a slight equatorward shift in the current work. The similarity continues in winter (Karelsky Fig. 7); in particular, the trough in the New Zealand sector is duplicated as is the ridge through southeast Australia.
The interpreation of the mean intensity of cyclones and the seasonality of this is complicated by geographi- cal and temporal variations of the background MSLP field against which cyclones are defined. Hence the de- viation of the MCP from the time-averaged MSLP, rather than the MCP itself may be a more appropriate measure of the intensity of individual cyclones. Sim- monds and Wu (1993) have defined this quantity as the
a b
Fig. 6. a The mean central pressure of cyclones for summer and b winter. The contour mterval is 5.0 hPa. Areas below 970 hPa are stippled
Jones and Simmonds: Climatology of Southern Hemisphere cyclones 139
......... : ..... .............
a b
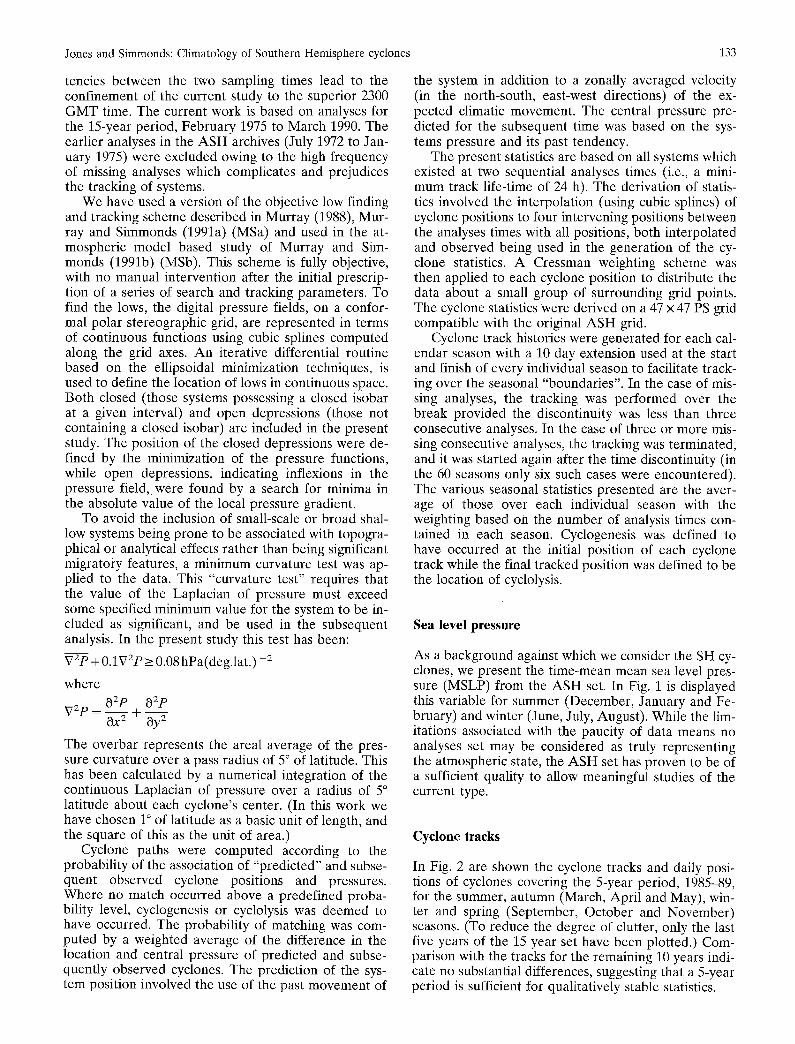
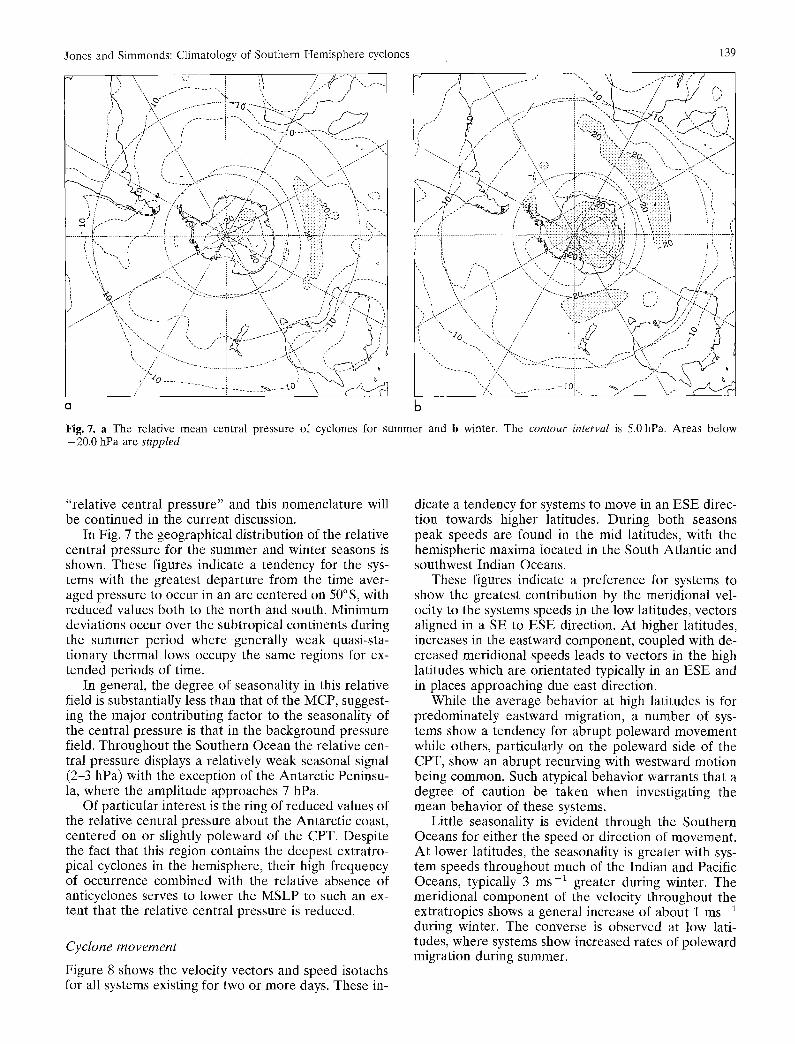
Fig. 7. a The relative mean central pressure of cyclones for summer and b winter. The contour interval is 5.0 hPa. Areas below - 20.0 hPa are stippled
"relative central pressure" and this nomenclature will be continued in the current discussion.
In Fig. 7 the geographical distribution of the relative central pressure for the summer and winter seasons is shown. These figures indicate a tendency for the sys- tems with the greatest departure from the time aver- aged pressure to occur in an arc centered on 50 ° S, with reduced values both to the north and south. Minimum deviations occur over the subtropical continents during the summer period where generally weak quasi-sta- tionary thermal lows occupy the same regions for ex- tended periods of time.
In general, the degree of seasonality in this relative field is substantially less than that of the MCP, suggest- ing the major contributing factor to the seasonality of the central pressure is that in the background pressure field. Throughout the Southern Ocean the relative cen- tral pressure displays a relatively weak seasonal signal (2-3 hPa) with the exception of the Antarctic Peninsu- la, where the amplitude approaches 7 hPa.
Of particular interest is the ring of reduced values of the relative central pressure about the Antarctic coast, centered on or slightly poleward of the CPT. Despite the fact that this region contains the deepest extratro- pical cyclones in the hemisphere, their high frequency of occurrence combined with the relative absence of anticyclones serves to lower the MSLP to such an ex- tent that the relative central pressure is reduced.
Cyclone movement
Figure 8 shows the velocity vectors and speed isotachs for all systems existing for two or more days. These in-
dicate a tendency for systems to move in an ESE direc- tion towards higher latitudes. During both seasons peak speeds are found in the mid latitudes, with the hemispheric maxima located in the South Atlantic and southwest Indian Oceans.
These figures indicate a preference for systems to show the greatest contribution by the meridional vel- ocity to the systems speeds in the low latitudes, vectors aligned in a SE to ESE direction. At higher latitudes, increases in the eastward component, coupled with de- creased meridional speeds leads to vectors in the high latitudes which are orientated typically in an ESE and in places approaching due east direction.
While the average behavior at high latitudes is for predominately eastward migration, a number of sys- tems show a tendency for abrupt poleward movement while others, particularly on the poleward side of the CPT, show an abrupt recurving with westward motion being common. Such atypical behavior warrants that a degree of caution be taken when investigating the mean behavior of these systems.
Little seasonality is evident through the Southern Oceans for either the speed or direction of movement. At lower latitudes, the seasonality is greater with sys- tem speeds throughout much of the Indian and Pacific Oceans, typically 3 ms -1 greater during winter. The meridional component of the velocity throughout the extratropics shows a general increase of about 1 ms-1 during winter. The converse is observed at low lati- tudes, where systems show increased rates of poleward migration during summer.

140 Jones and Simmonds: Climatology of Southern Hemisphere cyclones
a
Fig. 8. a Velocities and overlaid speed isotachs of cyclones for summer and b winter. 1 grid space=20.O ms-~, the contour interval is 5.0 ms-1. Areas above 10.0 ms-1 are stippled
Meridional profiles
Next we explore the zonal averages of a variety of cy- clone based statistics. The SH atmosphere lends itself, ~ 2 to some extent, to a description in terms of zonal aver- '~ ages due to the high degree of zonal symmetry and be- cause the circulation is not dominated by jet stream en- trance and exit regions (Trenber th 1991). ~ 1
System density
The zonally averaged system density for the four calen- dar seasons is shown in Fig. 9. The most conspicuous facet of the distribution of the system density is the dominant peak near 60°S in all seasons. Poleward of this band a sharp decline is evident, while to the north the decrease in the system density is generally less rap- id. While the position of this maximum of the normal- ized system density is similar in all seasons, the ampli- tude and shape show a degree of seasonality. The sum- mer period is characterized by an increased amplitude, and a broadening of the band about its peak while dur- ing winter, the high latitude maxima shows a de- crease.
Additional to the high latitude maximum are two subsidiary maxima, one centered near 40°S in the wint- er and intermediate seasons, while a second is appar- ent near 20°S during summer. The maximum evident in the mid latitudes is attributable to bands of en- hanced cyclone density in the South Pacific and Atlan- tic Oceans which are more evident in winter, autumn and spring. The subtropical maximum is a consequence
I I DJF
. . . . JJA
SON
- - 9 0 6 0 - - 3 0
L a t i t u d e ( d e g . )
Fig. 9. Zonal average of the cyclone system density for summer, autumn, winter and spring. The units are 10-3cyclones (deg.lat.) -2
of persistent thermal depressions and occasional tropi- cal lows which are most prevalent during the warmer period of the year.
Cyclogenesis and cyclolysis
The distribution of cyclogenesis (Fig. 10) shows a ten- dency for genesis to occur at all latitudes with the pos- sible exception of the Antarctic continent south of 80°S. The peak in the genesis throughout the year is found between 55-65 ° S; this peak is primarily attribut- able to the large number of formations evident in the South Indian Ocean. The peak in the cyclogenesis is

Jones and Simmonds: Climatology of Southern Hemisphere cyclones
6 0 0 I I DJF
500 - - - JJA
- - SON
400
3 0 0 2
2 0 0
t 0 0
0 - 9 0 - 6 0 - 3 0
L a t i t u d e ( d e g . )
Fig. 10. The total count of cyclogenesis in 5 ° latitude bands for summer, autumn, winter and spring, for the period, 1975-89. The units are cyclones
141
6 0 0
500
I DJF
)#AM
. . . . . JJA
S O N
4 0 0
3 0 0
2 0 0
i00
J I 0 - 9 0 - - 6 0 - - 3 0
L a t i t u d e (deg.)
Fig. 11. The total count of cyclolysis in 5 ° latitude bands for sum- mer, autumn, winter and spring, for the period, 1975-89. The units are cyclones
1030
1 0 2 0
~ i010 ~ t O 0 0
9 9 0 u
980
9 7 0
DJF
- - SON
/
i i DJF
MAM
. . . . JJA
- - - - 8 0 N
i I i I I
- 8 0 - 3 0
4
3
2
o
3
- 4
- 5 960 - 9 0 - 9 0
O Latitude (deg.) b Latitude (deg.)
i I i I i - - 6 0 3 0
Fig. 12. a Zonal average of the mean central pressure and b pressure tendency, of cyclones for summer, autumn, winter and spring. The units are hPa and hPa.day -1
somewhat poleward of that in many previous studies, e.g., Taljaard (1967), Kep (1984). As to whether this is a manifestation of the differences in the definition of cyclogenesis and cyclolysis (in particular differing mini- mum life times) or the different mean properties of the analysis used is difficult to determine. We note that our profiles more closely resemble the recent results of Le Treut and Kalnay (1990). The substantial impact of sa- tellite data, together with the complexity of tracking systems in the high cyclone density CPT region may go a long way towards explaining the apparent disparity between the more recent, and earlier work. The ob- served peaks in the number of genesis events at lower latitudes are associated with specific regions of cyclo- genesis, such as the Tasman Sea and the subtropical continents.
The distribution of the cyclolysis (Fig. 11) shows a sharp maximum in all seasons near 65°S. Poleward of this maximum, substantial numbers of dissipating cy- clones are evident, with typically twice as many sys- tems decaying as forming (Fig. 10).
Central pressure and its tendency
The zonally averaged central pressure and its mean tendency are displayed in Fig. 12. The former (part a) peaks in the subtropics, in the region of the STR. With increasing southerly latitude there is a steady decrease, with the minimum values of the MCP located in the latitude band 65-75°S. The central pressure through- out the mid latitudes varies little through the year but the high latitudes display a strong seasonal depend- ence. The minimum pressure is observed to occur in the spring period, during the period of most norlherly expansion of the Antarctic sea-ice boundary and greatest high latitude baroclinicity (Taljaard e[ al. 1969; Budd 1982).
The central pressure tendency for systems (Fig. 12b) shows a noisy structure, but in general, systems show intensification between 30 and 65°S, with the peak rates of deepening located in the mid latitudes. Pole- wards of 65°S, the observed cyclones show an average weakening as indicated by the positive values of the pressure tendency. This serves to confirm the previous notion of the CPT region being a net sink of cyclonic systems.

142
The peak zonally averaged rates of cyclone intensif- ication are evident in the mid latitudes, with a peak of 2.5 hPa day -1 near 50°S. The tendency for the greatest rates of deepening to occur during summer, is some- what surprising in light of the seasonality in the MCP. This appears to be a consequence of the seasonality of the background MSLP field and the limiting of system intensification to a more restricted latitude band dur- ing summer.
lnterannual and decadal variability
As fundamentally important as the time averaged as- pects of the atmospheric system and its subcompon- ents, is its variability over the range of contributing time frames. There is clear evidence for the existence of long term and systematic variations of the southern extratropical atmosphere which, combined with possi- ble anthropogenic factors, raises the question of the variation and/or trend of SH cyclonic activity. Al- though some of the observed changes in the analyzed mean climatic state may be due to changes in the cov- erage and quality of the contributing data (Guymer and Le Marshall 1980; Le Marshall et al. 1985), the in- vestigation of temporal variations of the analyzed state is constructive. In this regard, the relatively unchanged nature of the analysis scheme used in the development of the ASH set simplifies interpretation. Le Marshall et al. (1985) have demonstrated significant differences in the level of daily variability of the geopotential height field for the first and second 5 year periods of the ASH set. This raises the question of the stability and variability of the current cyclone data set. Carleton
Jones and Simmonds: Climatology of Southern Hemisphere cyclones
(1989) and Enomoto (1991) have demonstrated fluc- tuations of the broad scale SH circulation over periods of decades. Carleton (1992) has suggested that periods greater than 10 years are needed for the description of the variability of the synoptic circulation of the south- ern extratropics. Although the duration of the current set precludes the possibility of establishing the level of significance, the patterns of observed variation are in- formative. For the purpose of brevity, the current dis- cussion is limited to the MCP (both absolute and rela- tive) for the summer and winter seasons.
In Fig. 13 the latitude-time structure of the zonally averaged MCP for the summer and winter seasons are shown. These serve to highlight the interannual varia- bility of the MCP a measure of the absolute intensity of cyclonic vortices. These figures indicate substantial interannual variability more particularly in the high la- titudes.
The winter profile displays a trend for decreased values of the analyzed MCP through the high latitudes during the period of study. The interpretation is, how- ever, complicated by changes in the observing network which may have resulted in systematic changes in the derived numerical analyses on which these figures are based. Although there is evidence for decreasing val- ues of the MCP through the late 1980s, much of the shift towards more intense systems appears centered on the late 1970s. This coincides with the deployment of the extensive FGGE buoy network, and the inclu- sion of improved and increased satellite data during 1978-1979 (Le Marshall et al. 1985; Nydam 1989).
Guymer and Le Marshall (1980) suggest the anoma- lous structure of the SH analyses during the FGGE pe- riod was primary a consequence of the improved data
-2.5
- 7 5
-12.5
-17.5
-22.5
-27,5
-82.5
" ~ - 3 7 5
~,~ -42.5
-47.5
:~ -52.5
-57 .5
-62 .5
-67 .5
-72 .5
-77 .5
-82 .5
-87 .5 75
i I I I I I I L i I I I i - 2 5
17,5
t -22.5
/ ~ ~ , -"00, Hloo,z.3o " - . _ ) ~ H~.oos...o ~ -32 .5
~ -37 .5
~,~ -42.5
/ - - - ~ m ~ O ~ ~ -47.5
:~ -52.5
_ ~960 -57.5
_ -62.5
67.5
-72.5
-77.5
-82.5
-87.5 76 77 78 79 80 8] 82 83 84 88 86 87 88 89
b
, v k . . . . /
75 716 717 718 719 810 8 I1 812 613 814 815 816 517 8P8 89
O S u m m e r (year ) Winter (year)
Fig. 13a, b. Zonally averaged time series of the mean central pressure of cyclones for a summer and b winter. The contour interval is 2.5 hPa. Areas below 970.0 hPa are stippled

Jones and Simmonds: Climatology of Southern Hemisphere cyclones
coverage. While the post-FGGE period saw a decline in the density of observing, the sampling has remained superior to that prior to this research experiment, this improvement remaining a possible factor contributing to the apparent trends. Although the impact of a vastly improved observational network cannot be disputed, Trenberth (1984) has demonstrated the consistent na- ture of the observed anomalies in the analyzed atmos- pheric state during the FGGE period supporting the interpretation that the anomalous characteristics of analyses were not mere artifacts of an improved data base. This is further supported by station data (e.g., Schwerdtfeger 1984), which indicate the anomalous state of the SH circulation during much of the FGGE period. The anomalous characteristics of the circula- tion during this period when much increase took place in the level of observing serves to inhibit the precise determination of the impact of these changes on the derived analyses. Of relevance to the current discus- sion, van Loon and Kidson (1993), using 9 years of analyses from the European Centre for Medium Range Weather Forecasts, have demonstrated a trend for increased transient eddy flux throughout the winter extratropics for the period 1980-88. Although this does not include the FGGE period, it is suggestive of a real increase in the level of transient eddy activity through the 1980s, consistent with our results.
Examination of the equivalent summer profile indi- cates little trend in the MCP. Although periods of en- hanced intensity are evident (e.g., 1977-1981 and 1985- 1989), the MCP is relatively constant through the peri- od.
Similar time series for the relative central pressure, a field inherently detrended from the background pres-
143
sure field are shown in Fig. 14. The relative central pressure shows considerable interannual variability during both seasons. The previously mentioned discon- tinuity in the strength of cyclones around the FGGE period is less obvious, the post-FGGE relative central pressure being only marginally smaller than that in the earlier seasons. During the later half of the time series there is a suggestion of decreased values of the relative central pressure, particularly during winter, suggesting increased system intensities during the later part of the 1980s.
The presence of trends, particularly in the later half of the analysis period, raises the question of stability of statistics and the minimum period upon which a clima- tology should be based. Such considerations highlight the dangers of determining climatologies on relatively brief data periods.
Conclusions
We have used an objective low "finding" and "track- ing" scheme to produce a climatology of the distribu- tion and behavior of SH cyclones from a data base of 15 years of daily numerical analyses. The application of the scheme in the current investigation has enabled a comprehensive study of extratropical low pressure sys- tems in the SH, and has made available cyclone statis- tics which up to now have not been computed.
In agreement with many prior studies, the current investigation has revealed a single high latitude core of cyclone density, coincident with the CPT. During the winter and intermediate seasons, dual branching has been observed with two mid latitude bands evident in
- -~ .5 I I I I I J I I I I I ] I - -~ ,5 I I I- '" I I I "~. I I I J I I
- 7 . 5 , / , . . , j - ' " , . - - 5 . 0 .
- 12.~ ",,/" ,,,'",,= "):,, ,.,_.__.. , - " .... - 12 .5 - - - - - - ' - 5 . o - " ' . ' " . . . . . . . . . " - - " " . . . . . . . . . . . . . . . . . . . . . . . . . . . . . . / "
- 1 7 . 5 ~, L - i s so ,--- - 1 7 , 5 , / " . . . . . . . . . . . . . . . . - - . . . . . . . . - - . . . . . , , " - ",-, ' ' I -i0.0 " - /
- 2 2 . 5 " , . / / " " . / " , , - 2 2 . 5 - - ' - - . 10.0 . . . . . . . . . . . . . . . . . . " ' - . -- /N~. " . . . . ~ZqO. / , , ,
- 2 7 , 5 " \ "0 " ' " . . . . . . " . . . . - 2 7 . 5
- _ - : - ; : ) • • . . . . . . . . . . . . . . . . . . . , , _ ~ - a v . a j,,,; ,' . . . . , . . . . . . , ~ ', ' - i ,",, ,, . . . . . . ~ - a 7 . 5
- 4 2 . 5 " ' " ' ' ~ " ~ ' ~ - 4 2 , 5 ~ / " L : " " . . . . . . . " . . . . ', ' , - . ' -
...... " " '" " ~" " ~~" " .... ~-47,~ / ",, ) ÷::', ",, ..," ":',",. '.'::. H_:'o .... '!". " .... - " " " " . . . . . . . "'" ~ . . . . . . . . . / " " ' . - " '~;' -'<!:::{ " " , ======================= : : : i : / : : : , ""
- 5 7 . 5 . . . . . . . . . . , . ~5 .o .... . . "--:'~ .,~.-" .... " . . . . . . . . . : l s . d ,,.,. : . . . . . . . . . . . . 57.~ "=. ...... ' " .... . . . . . . . . . ,."",, ',,{ :L~;:.:,~::i:::~o:.:d:-"~:~.,.. . . . . . . . . . . . . . . . . . . . . - - - . . . . . ........ : " ' : " -j-:~:::i:Z:ao:o:!:"g:~: %~:~ ::::::::i~:~i:
- 62 .~ ",,., . . . . i ,,",, ,5' ",. 'H . . . . ., : : : :H_, , .~ -0~,.5 - .~ . . . . . . ; t ~ o "-.
- 6 7 . 5 ' ' " "'--- _ .. . . . . . . . . 67.5 ', H-,.s'~2 '-'~-- ". ,' . . . . . . . "-. " . . . . . . . . . . . " .- ...... , .......... ,L ....... ;;'.::::::-:::: ....... -~5 o ............................ .., "',....- ..-"',", o ,,' .-,-,<::----:~,~ ............... .<.:::- :: :::~-~:~::
- 7 2 . 5 . - ' " , ", / ~ ~,"--:t'=_'-_'-)_%'--'. - - - .- . . . .%,. . . ,- . . . . . . . . , , . . - - 7 2 . 5 ",, " / . . . . . . "-. " ,~ ' ,.' . . - : : j ~ - ; : : : ' : : 0 ,0 . . . . . . . . . '~ ,(,~,;:,,~ ".. 7...~..;::./:r:::::::::::,, ~ :: : : : : : : : : : : : : : : : : : : : : : : ::::::::::::::::::::::::::::::::::
-77.5 -77.5 : : . . . . . ;.'.,..:,..:, : : : : . . . :.::
- a ~ . ~ ~- ::- i : : '" - e z . ~ . . . . . . ::!~i:i:!:i:: /
I 8 7 . 5 I - 8 7 . 5 I I 812 813 8 4 815 E]16 8 1 81B 8 9 7 5 716 717 718 719 8 0 811 BI2 813 8~ 85 BI6 8[7 818 8 9 7 5 7 6 717 718 79 810 811
(3 Summer (year) b Winter (year)
Fig. 14a, b. Zonally averaged time series of the relative mean central pressure Of cyclones for a summer and b winter. The contour interval is 2.5 hPa. Areas below - 2 0 . 0 hPa are stippled

144
the cyclone densities. The mos t p rominen t of the two bands of enhanced cyclone densi ty is found to origi- nate in the Tasman Sea - southeas t Aust ra l ia region, spiraling polewards and merging with the high lat i tude core in the vicinity of the D r a k e Passage. A second, less well-defined, band originates in the region of South Amer ica , s tretching SE th rough the South At - lantic, and merging with the c i rcumpolar core to the south of Africa. B o t h bands or iginate in regions of en- hanced mid lat i tude cyclogenesis, and merge with the CPT core in the high sou thern latitudes.
Examina t ion of the proper t ies of the observed sys- tems indicated that the mos t intense systems occur in a ring coincident with the CPT. Values of the averaged M C P were at a m i n i m u m during the spring and winter periods, while the summer was charac ter ized by an in- crease in the M C P of typically 5-8 hPa. Cyclonic sys- tems were found to general ly move in an E S E to SE direct ion in the low and mid lat i tudes while at h igher lati tudes systems showed general E S E and in places easter ly movemen t .
For the mos t par t the results ob ta ined are similar to those found in earlier studies. There are differences in some quantit ies, which m a y be a c o m m e n t on the pauc- ity of data used in earlier analyses. The use of an objec- tive scheme allows us, with ease, to p roduce m a n y sta- tistics of cyclone behav iour which have no t been pre- viously presented. Given the length of the data per iod used and the object ive and reliable na ture of the sche- me, it can be a rgued that the present results represent the best statistics of SH extratropical cyclones availa- ble.
Acknoweledgements. Thanks are due to Robin Hicks for help in obtaining the original ASH analyses set. A special word of thanks goes to Ross Murray, whose presence and constructive conversa- tions concerning the current work has contributed substantially to its successful completion.
References
Budd WF (1982) The role of Anarctica in southern hemisphere weather and climate. Aust Meteorol Mag 30:265-272
Budd WF (1986) The Southern Hemisphere circulation of atmo- sphere ocean and sea ice. Proceedings of the Second Interna- tional Conference on Southern Hemisphere Meteorology, Wellington, New Zealand, December 1986. Am Meteorol Soc: pp 38-41
Carleton AM (1979) A synoptic climatology of satellite-observed extratropical cyclone activity for the Southern Hemisphere winter. Arch Meteorol Geophys Bioklimatol, Ser B 27:265- 279
Carleton AM (1981) Monthly variability of satellite-derived cy- clonic activity for the Southern Hemisphere winter. J Clim 1 : 21-38
Carleton AM (1989) Antarctic sea-ice relationships with indices of the atmospheric circulation of the Southern Hemisphere. Clim Dyn 3 : 207-220
Carleton AM (1992) Synoptic interactions between Antarctica and lower latitudes. Aust Meteorol Mag 40:129-147
Enomoto H (1991) Fluctuations of snow accumulation in the Antarctic and sea level pressure in the Southern Hemisphere in the last 100 years. Clim Change 18 : 67-87
Gibbs WJ (1953) A comparison of hemispheric circulations with
Jones and Simmonds: Climatology of Southern Hemisphere cyclones
particular reference to the western Pacific. Q J R Meteorol Soc 79:121-136
Guymer LB (1986) Procedures and concepts used in Southern Hemisphere analyses at WMC Melbourne. Proceedings of the Second International Conference on Southern Hemisphere Meteorology, Wellington, New Zealand, December 1986. Am Meteorol Soc: pp 10-16
Guymer LB, Le Marshall JF (1980) Impact of FGGE buoy data on Southern Hemisphere analyses. Aust Meteorol Mag 28 : 19-42
Hoflich O (1984) Climate of the South Atlantic Ocean. World survey of climatology, vol. 15. Elsevier, Amsterdam, pp 1- 191
Jones DA, Simmonds I (1993) Time and space spectral analyses of southern hemisphere sea level pressure variability. Mon Weather Rev 121 : 661-672
Karelsky S (1963) Geographical distribution of pressure in the centres of surface lows and highs in the Australian region in January and July, 1952-1963. Aust Meteorol Mag 43:15-23
Kep SL (1984) A climatology of cyclogenesis, cyclone tracks and cyclolysis in the Southern Hemisphere for the period 1972-81. University of Melbourne, Department of Meteorology, Pub no 25
Klein WH (1957) Principal tracks and mean frequencies of cy- clones and anticyclones in the Northern Hemisphere. Res Pap no 40. Washington, DC, US: US Weather Bureau
Lambert SJ (1988) A cyclone climatology of the Canadian Cli- mate Centre general circulation model. J Clim 1:109-115
Le Marshall JF, Kelly GAM (1981) A January and July climato- logy of the Southern Hemisphere based on daily numerical analyses 1973-77. Aust Meteorol Mag 29:115-123
Le Marshall JF, Kelly GAM, Karoly DJ (1985) An atmospheric climatology of the Southern Hemisphere based on ten years of daily numerical analyses (1972-82): I overview. Aust Me- teorol Mag 33 : 65-85
LeTreut H, Kalnay E (1990) Comparison of observed and simu- lated cyclone frequency distribution as determined by an ob- jective method. Atmosfera 3:57-71
Leighton RM, Deslandes R (1991) Monthly anticyclonicity and cyclonicity in the Australian region: averages for January, April, July and October. Aust Meteorol Mag 39:14%154
Murray RJ (1988) The development of a computer-based scheme for the automatic location and tracking of cyclone centres. CE Report University of Melbourne, Department of Meteorolo- gy (unpublished)
Murray RJ, Simonds I (1991a) A numerical scheme for tracking cyclone centres from digital data Part I: development and op- eration of the scheme. Aust Meteorol Mag 39:155-166
Murray RJ, Simmonds I (1991b) A numerical scheme for track- ing cyclone centres from digital data Part II: application to January and July GCM simulations. Aust Meteorol Mag 39:167-180
Nydam PG (1989) Aspects of the Southern Hemisphere Circula- tion during the 1982/83 ENSO Episode. M Sc Thesis, Dept of Mathematics, Monash University (unpublished)
Oort AH, Peixoto JP (1983) Global angular momentum and en- ergy balance requirements from observations. Adv Geophys 25 : 355-490
Palmer CW (1942) Synoptic analysis over the Southern Hemis- phere. Prof. Note, New Zealand, Meteorol Office, Welling- ton. no 1
Petterssen S (1956) Weather analysis and forecasting, 2nd edn., vol 1. McGraw-Hill, New York
Schwerdtfeger W (1984) Weather and climate of the Antarctic. Elsevier, Amsterdam
Simmonds I, Wu X (1993) Cyclone behavior response to changes in Winter Southern Hemisphere sea ice concentration. Q J R Meteorol Soc: (in press)
Streten NA, Troup AJ (1973) A synoptic climatology of satellite observed cloud cortices over the Southern Hemisphere. Q J R Meteorol Soc 99:56-72

Jones and Simmonds: Climatology of Southern Hemisphere cyclones
Swanson GS, Trenberth KE (1981) Interannual variability in the Southern Hemisphere troposphere. Mon Weather Rev 109:1890-1897
Taljaard JJ (1967) Development, distribution, and movement of cyclones and anticyclones in the Southern Hemisphere during the IGY. J Appl Meteorol 6:973-987
Taljaard JJ, Van Loon H, Crutcher HL, Jenne RL (1969) Climate of the upper air: Southern Hemisphere. NAVAIR 50-1C-55, Chief of Naval Ops, Washington DC
Trenberth KE (1979) Interannual variability of the 500 mb zonal mean flow in the Southern Hemisphere. Mon Weather Rev 107:1515-1524
Trenberth KE (1981) Observed Southern Hemisphere eddy sta-
145
tistics at 500 mb: frequency and spatial dependence. J Atmos Sci 38: 2585-2605
Trenberth KE (1984) Interannual variability of the Southern Hemisphere circulation: representativeness of the year of the global weather experiment. Mon Weather Rev 112:108-123
Trenberth KE (1991) Storm tracks in the Southern Hemisphere. J Atmos Sci 48:2159-2178
Van Loon H (1965) A climatological study of the atmospheric circulation in the Southern Hemisphere during the IGY, Part I: 1 July 1957-31 March 1958. J Appl Meteorol 4:479-491
Van Loon H, Kidson JW (1993) The association between latitu- dinal temperature gradient and eddy transport. Part III. The Southern Hemisphere. Aust Meteorol Mag 42:31-37