a cloud-resolving model study of aerosol-cloud correlation...
TRANSCRIPT
Confidential manuscript submitted to Geophysical Research Letters
1
A Cloud-Resolving Model Study of Aerosol-Cloud Correlation in a Pristine 1 Maritime Environment. 2 3
Nidhi Nishant1 and Steven Sherwood1 4
5 6 7 1 Climate Change Research Centre and ARC Centre of Excellence for Climate System Science, 8 University of New South Wales, Sydney, New South Wales, Australia 9 10
Corresponding author: Nidhi Nishant ([email protected]) 11
12
13
14
15
16
17
18
19
20
21
22
23
Key Points: 24
• Satellite observations show an apparent invigoration of the convective clouds induced by 25 aerosol. 26
• Model with fixed aerosol loading, simulates vigorous clouds at times of high real-world 27 aerosol concentrations. 28
• Wind-cloud and wind-aerosol relationship explains the apparent convective invigoration. 29
Confidential manuscript submitted to Geophysical Research Letters
2
Abstract 30
31
In convective clouds, satellite-observed deepening or increased amount of clouds with increasing 32
aerosol concentration has been reported and is sometimes interpreted as aerosol-induced 33
invigoration of the clouds. However, such correlations can be affected by meteorological factors 34
that affect both aerosol and clouds, as well as observational issues. In this study, we examine the 35
behaviour in a 660x660 km2 region of the South Pacific during June 2007, previously found by 36
Koren et al., [2014] to show strong correlation between cloud fraction, cloud top pressure and 37
aerosols, using a cloud-resolving model with meteorological boundary conditions specified from 38
a reanalysis. The model assumes constant aerosol loading, yet reproduces vigorous clouds at times 39
of high real-world aerosol concentrations. Days with high and low aerosol loading exhibit deep-40
convective and shallow clouds respectively, in both observations and the simulation. Synoptic 41
analysis shows that vigorous clouds occur at times of strong surface troughs, which are associated 42
with high winds and advection of boundary-layer air from the Southern Ocean where sea salt 43
aerosol is abundant, thus accounting for the high correlation. Our model results show that aerosol-44
cloud relationships can be explained by coexisting but independent wind-aerosol and wind-cloud 45
relationships and that no cloud condensation nuclei (CCN) effect is required. 46
47
1 Introduction 48
49 A process of aerosol-cloud invigoration has been hypothesized whereby the development 50
of cloud is enhanced due to the strong coupling between the cloud-microphysics (induced by the 51
aerosol) and cloud system dynamics. For example, studies have suggested that under certain 52
meteorological conditions, aerosol can suppress liquid-phase precipitation which may lead to the 53
Confidential manuscript submitted to Geophysical Research Letters
3
subsequent invigoration of the deep convection due to the increased release of latent heat of fusion 54
[Andreae et al., 2004; Khain et al., 2005; Koren et al., 2005, Rosenfeld et al., 2008; Stevens and 55
Feingold, 2009]. Ascent of clouds to the higher altitudes can have a potential effect on the top of 56
atmosphere cloud radiative forcing. The expansive anvils with cold cloud tops can lead to warming 57
of the atmosphere due to their smaller thermal emittance [Koren et al., 2010; Rosenfeld et al., 58
2014]. The radiative perturbations due to this aerosol-cloud interaction is one of the complex and 59
least understood effect as per the 5th IPCC report [IPCC, 2013]. 60
The strong correlation seen between aerosol and convective cloud properties from satellite 61
retrievals [Kaufman et al., 2005; Koren et al., 2005; 2010; Niu and Li, 2012; Dey and Girolamo, 62
2010; Dey et. al. 2012; Mace and Abernathy, 2016] and the reported deepening of warm mixed 63
phase clouds with increasing aerosol in numerical models [Khain et al., 2005; Tao et al., 2007; 64
Storer and van den Heever, 2013; Fan et al., 2013] might suggest observational and numerical 65
evidence of aerosol-cloud invigoration. However, the factors like meteorological covariations, and 66
the uncertainties in the satellite retrievals, can strongly affect both the aerosol and cloud properties 67
and hence can possibly be misinterpreted as an aerosol influence on clouds. 68
In particular, satellite observations of aerosol often suffer cloud contamination due to 69
incomplete cloud screening [Kaufman et al., 2005; Zhao et al., 2013], three-dimensional radiative 70
effect due to the illumination from the adjacent clouds [Marshak et al., 2006], and hygroscopic 71
growth due to aerosol humidification [Boucher and Quaas, 2013; Altaratz et al., 2013]. The 72
spurious enhancement of aerosol optical depth in similar proportion to the clouds due to the 73
retrieval errors could be responsible for a large part of the correlations between aerosol and cloud 74
[Zhang et al., 2005; Chand et al., 2012]. 75

Confidential manuscript submitted to Geophysical Research Letters
4
Apparent aerosol effects on clouds due to covariations generated by local meteorology has also 76
been a suggested explanations or partial explanation for the observed correlations. Engstrom and 77
Ekman, [2010] using satellite observations and reanalysis data reported significant weakening in 78
the correlation between aerosol optical depth and cloud fraction when the impact of 10-meter wind 79
speed was statistically removed. Similarly, aerosol humidification due to high relative humidity 80
(which is a very strong correlate to cloud fraction) has been suggested to explain the correlation 81
between aerosol optical depth and cloud fraction in the satellite-data-based study of Twohy et al., 82
[2009]. Koren et al., [2010] also reported a correlation between relative humidity, aerosol optical 83
depth and cloud top pressure, but ultimately concluded that it did not strongly influence their 84
invigoration results. Their environmental data were from an atmospheric reanalysis, which is 85
unable to resolve small-scale variability that could be important. 86
87
Efforts have been undertaken to untangle meteorological effects from the aerosol-cloud 88
relationship in both observations and numerical models. Gryspeerdt et al., [2014], using satellite 89
data, showed that the large part of the relationship between aerosol optical depth and cloud top 90
pressure is mediated by the aerosol optical depth and cloud fraction relationship. They inferred 91
from this result a strong influence of meteorological covariations on the aerosol vs. cloud-top-92
pressure relationship, as there is less reason for cloud fraction to be affected by CCN in comparison 93
to the other cloud properties. Studies involving general circulation models have reported a 94
dominant contribution of relative humidity to the models’ aerosol optical depth vs. cloud cover 95
relationship [Quaas et al., 2010; Grandey et al., 2013]. 96
One of the limitations of such global model studies is the coarse resolution. Due to the need 97
for parameterisations in these coarse-resolution models, representation of cloud scale processes is 98

Confidential manuscript submitted to Geophysical Research Letters
5
highly uncertain, and representation of aerosol-cloud interactions is even more so. Therefore, in 99
this study we examine the issue using a cloud-system resolving model with observed large-scale 100
meteorological conditions imposed. Specifically, we re-examine the findings of Koren et al., 101
[2014], hereafter KDA14, whose study is a prominent example of those using satellite retrievals 102
to support aerosol-cloud invigoration. KDA14 reported “aerosol-limited invigoration” of warm 103
convective clouds over a small oceanic region of Southern Pacific, using cloud and aerosol data 104
from the Moderate Resolution Imaging Spectro-radiometer (MODIS). They argued that 105
meteorological factors had no significant effect on the observed relationship between cloud and 106
aerosol properties, implying that the invigoration is primarily driven by the aerosol-cloud 107
interaction. 108
109
2 Materials and Methods 110
111 We choose the same study area and time period as KDA14. The boundaries of the oceanic region 112
over the southern Pacific extend from 13 S to 22 S and from 121 W to 130 W. For observations, 113
the time period considered is from June 1 to August 31 2007; however, due to computational 114
expense the simulation is performed only for the first 40 days of this time period (during which 115
the most interesting meteorological events occur although the relationship between aerosol and 116
cloud is somewhat weaker than over the entire time period). Once-daily observed cloud and 117
aerosol, data are taken from the MODIS instrument on board the Aqua satellite [Platnick et al., 118
2003], Collection 6. As aerosol retrievals from space may be affected by clouds, therefore in order 119
to estimate aerosol-cloud covariations on short time and spatial scales we also examine the 120
Monitoring Atmospheric Composition and Climate (MACC) II dataset which is now a part of 121
Confidential manuscript submitted to Geophysical Research Letters
6
Copernicus Atmospheric Monitoring Service (CAMS) global atmospherics composition data 122
[Inness, 2012]. CAMS use a four-dimensional variational data assimilation technique to combine 123
satellite observational with chemistry-aerosol modelling to obtain a gridded continuous 124
representation of the mass mixing ratios of atmospheric gases and aerosol. The global model and 125
data assimilation system of CAMS is based on the ECMWF’s integrated forecast system, and the 126
atmospheric chemical system is represented by the Model of Ozone and Related Chemical Tracers 127
(MOZART) [Emmons et al., 2010] chemical transport model. We also use 10-m wind, mean 128
surface pressure and specific humidity data (these fields are essentially the same as those of the 129
parent reanalysis product from ECMWF) and surface 80% sea-salt mass mixing ratio (expressed 130
at 80% relative humidity) from the CAMS for our meteorological analysis. We also use dry mass 131
mixing ratio of sulphate, organic matter, dust and black carbon from CAMS. 132
133
Model-simulated cloud properties can differ from observational ones due to limitations in data 134
assimilation or the model (in particular, parameterizations of cloud processes). Nonetheless, 135
numerical models are the most comprehensive tool by which the observed weather/climate 136
phenomenon can be reproduced. Therefore, the cloud variations during the first 40 days are 137
simulated using the Weather Research and Forecasting (WRF) regional meteorological model 138
[Skamarock et al., 2005], version 3.7.1. The initial and boundary conditions for the large-scale 139
atmospheric fields are taken from 6-hourly ERA-Interim reanalysis data [Dee et al., 2011]. The 140
domain comprises 3-way nests at 9, 3 and 1 km horizontal resolution. The size of the outermost to 141
innermost domains are 1000´1000, 840´840 and 660´660 km2. The simulation is free-running 142
after initialization, without any nudging except at the boundaries of the outer domain. All results 143
presented here are from the innermost domain, as it is run at cloud resolving resolution making it 144
Confidential manuscript submitted to Geophysical Research Letters
7
capable of better representation of clouds. In the vertical, 50 pressure levels are defined, with the 145
model top at 50 mbar. The Thompson and Eidhammer [2014] (TE14) scheme is used for the 146
microphysics, and second-order horizontal turbulent diffusion. TE14 is a bulk microphysics 147
scheme which treats five separate water species: cloud water, cloud ice, rain, snow, and a hybrid 148
graupel–hail category. Fixed profiles of cloud condensation nuclei and ice nuclei are used, with 149
near-surface and free-troposphere CCN values of 300 and 50 cm3 respectively, and 1.5 and 0.5 cm 150
-3 respectively for ice nuclei. The Rapid Radiative Transfer Model [Mlawer et al., 1997] and 151
Goddard [Chou and Suarez, 1994] schemes are used for longwave and shortwave radiation, 152
respectively. For the boundary layer, the Yonsei University [Hong et al., 2006] scheme is used. 153
The outer and middle domains employ the Betts-Miller-Janiac [Betts and Miller, 1993] convective 154
parameterization, whereas the innermost domain has no convective parameterization. 155
156
3 Results 157
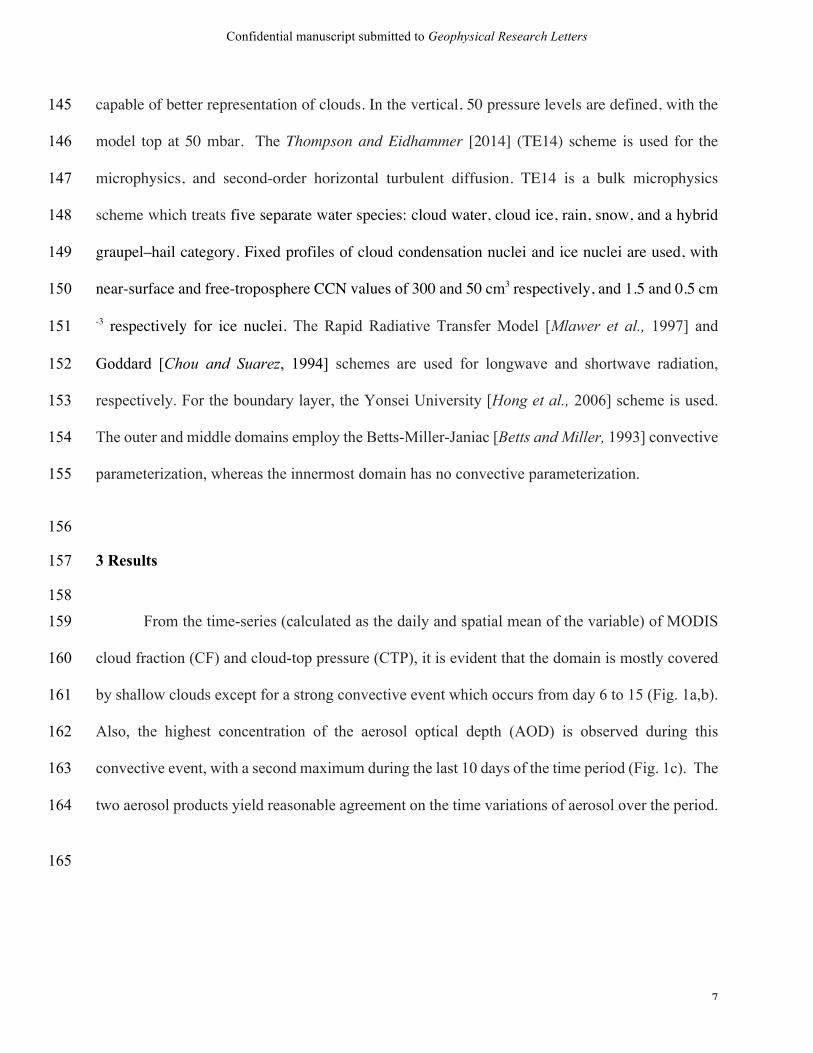
158 From the time-series (calculated as the daily and spatial mean of the variable) of MODIS 159
cloud fraction (CF) and cloud-top pressure (CTP), it is evident that the domain is mostly covered 160
by shallow clouds except for a strong convective event which occurs from day 6 to 15 (Fig. 1a,b). 161
Also, the highest concentration of the aerosol optical depth (AOD) is observed during this 162
convective event, with a second maximum during the last 10 days of the time period (Fig. 1c). The 163
two aerosol products yield reasonable agreement on the time variations of aerosol over the period. 164
165
Confidential manuscript submitted to Geophysical Research Letters
8
166
Figure 1. The time-series (spatial and daily means) of (a) cloud fraction (CF), (b) cloud top pressure 167
(CTP), (c) aerosol optical depth (AOD) and the surface 80% sea-salt mass mixing ratio and (d) 10-168
meter wind speed. Red, blue and green lines represent data from WRF, MODIS and CAMS, 169
respectively. Green solid and green marked line in (c) represent AOD and surface 80% sea salt 170
mass mixing ratio, respectively. 171
172
Confidential manuscript submitted to Geophysical Research Letters
9
Since the cost of running the entire 90 days simulation is high, we run the WRF simulation 173
only for the first 40 days, so that it captures the strong event (between the 6th and 15th day as 174
observed in MODIS data) and few other smaller events (weaker convection between 12th and 19th 175
day) (Fig. 1a,b). After the first 5 days, WRF-simulated cloud properties (CF and CTP) look 176
comparable to those from MODIS, however, the simulated cloud tops do not reach as high as 177
MODIS, and the CF shows larger variability. For the last 10 days of simulation the model is able 178
to capture the cloud pattern, though slightly overestimating the CF. The rough agreement between 179
simulated and observed variations in cloud amount and altitude suggests that WRF is simulating 180
the observed clouds satisfactorily. 181
For the statistical analysis, CF and CTP are sorted as a function of AOD and averaged to 182
create 100 lumped data points, following KDA14. We use the AOD values from CAMS for 183
analysing the aerosol-cloud relationship because we think it may provide more accurate cloud-184
aerosol relationship due to use of wind and sea level pressure data to help constrain aerosol. All 185
data from both CAMS and WRF are regridded to the scale of MODIS and daily means of variables 186
from WRF and CAMS are compared to the once-daily variables of MODIS. 187
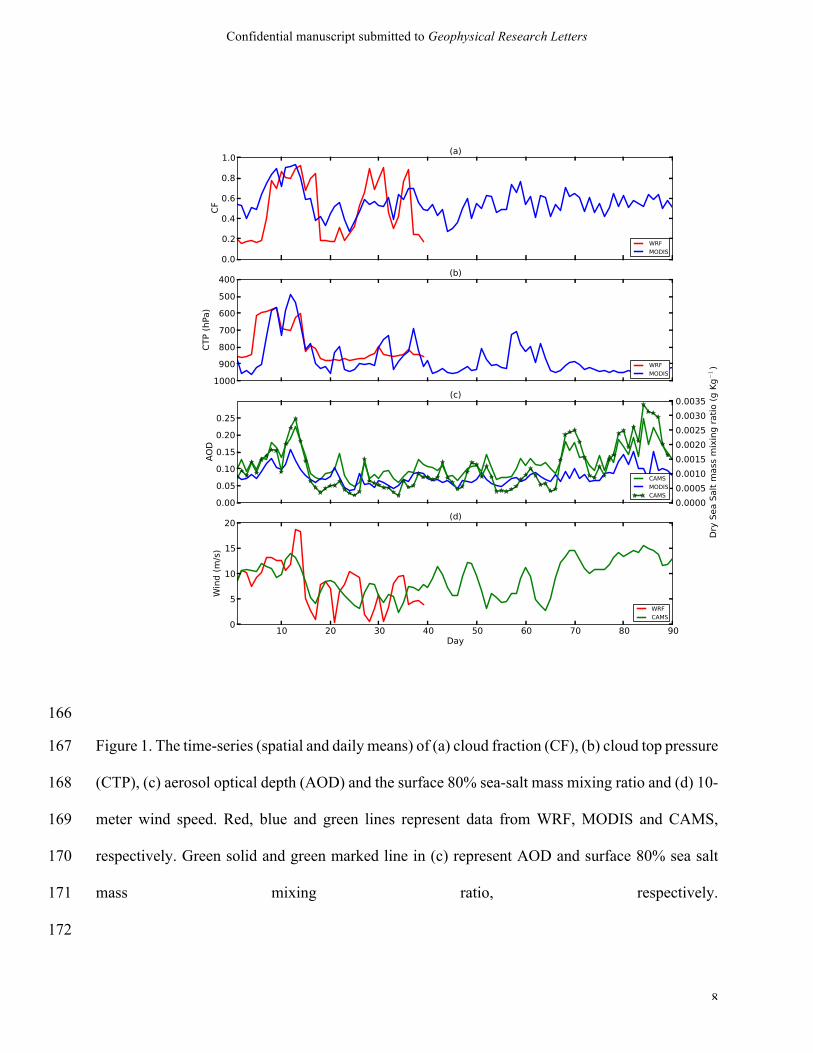
As in KDA14, we find a strong correlation between CF and AOD observations and between 188
CTP and AOD, with clouds becoming more prevalent and deeper at increasing aerosol 189
concentration (Fig. 2 (a,b). For the entire 90 days, a strong positive correlation (r = 0.90±0.05) at 190
2s) between CF and AOD and a strong negative correlation (r= -0.81±0.08) between CTP and 191
AOD is seen. This could suggest that the clouds are invigorating due to their interaction with the 192
aerosol. However, it is mostly the convective clouds which invigorate: shallow CF increases 193
during the invigoration event, but the clouds do not ascend higher. The two correlations noted 194

Confidential manuscript submitted to Geophysical Research Letters
10
above are reduced to r = 0.71±0.09 and r = -0.50±0.12 respectively when the deep convective 195
event (vigorous growth of the deep convective cloud between day 6 and 15) is removed from 196
computation, showing that this event is important but not solely responsible for the observed 197
relationship. 198
199
Figure 2. Relationship between the aerosol optical depth (AOD) from CAMS and (a, c) cloud 200
fraction (CF) and (b, d) cloud top pressure (CTP). Top panel and bottom panel show data from 201
MODIS and WRF, respectively. 202
The correlation between simulated cloud properties and observed AOD is weaker than with 203
observed properties, as the WRF-simulated CF and CTP do not completely agree with those 204
Confidential manuscript submitted to Geophysical Research Letters
11
observed. This is likely a limitation of our model in simulating the observed cloud properties. CTP 205
and AOD show a strong correlation (r= -0.82±0.07) whereas the correlation between CF and AOD 206
is comparatively weaker (r = 0.31± 0.11) (Fig. 2 (c,d)). Hence the WRF simulation could suggest 207
a similar invigoration of clouds as do the observations (Fig. 2c,d). However, the fact that we have 208
run WRF without any aerosol component contradicts the interpretation of this correlation as being 209
the result of an aerosol-cloud interaction. 210
Investigation of the aerosol type from the CAMS reanalysis data revealed that nearly 90% 211
of the aerosol (Fig. 3) is inferred to be sea salt throughout the entire domain. Sea salt is formed 212
by the bursting of entrained air bubbles during whitecap formation [Blanchard, 1983; Monahan et 213
al., 1986]. Therefore, the concentration of sea-salt aerosol is sensitive to the wind speed and 214
pattern. Additionally, strong winds can have a potential effect on the developing clouds, either 215
directly by increasing surface fluxes or indirectly by their relationship with synoptic storm 216
patterns. Hence, it is important to examine the winds and evaluate their relationships with both 217
aerosol and clouds. 218
219

Confidential manuscript submitted to Geophysical Research Letters
12
220
221
Figure 3. Mass mixing ratio of the different aerosol types from CAMS over the study region. 222
The ERA-Interim wind imposed as the WRF boundary condition is similar to the CAMS 223
wind, but the WRF-simulated winds after initial 10 days diverge from the imposed boundary 224
conditions (Fig. 1 (d)). Nonetheless the spatial patterns of wind from either CAMS or the WRF 225
simulation vary together with both AOD and CF. Both the simulated and the re-analysis domain-226
average wind speeds are well correlated (WRF: r = 0.39 ± 0.10), CAMS: (r= 0.95 ± 0.03) with 227
AOD. This indicates advection or local source due to the wind is the possible pathway for the 228
growth and transport of observed sea-salt aerosol. 229
230
Confidential manuscript submitted to Geophysical Research Letters
13
231
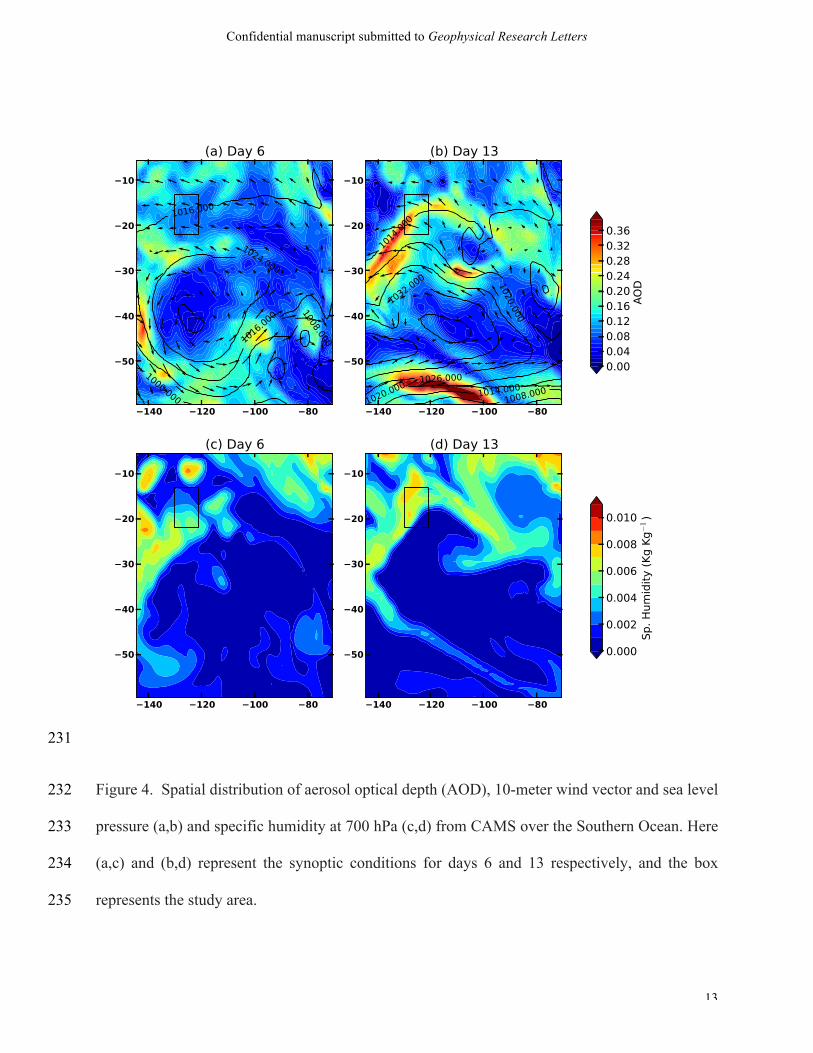
Figure 4. Spatial distribution of aerosol optical depth (AOD), 10-meter wind vector and sea level 232
pressure (a,b) and specific humidity at 700 hPa (c,d) from CAMS over the Southern Ocean. Here 233
(a,c) and (b,d) represent the synoptic conditions for days 6 and 13 respectively, and the box 234
represents the study area. 235

Confidential manuscript submitted to Geophysical Research Letters
14
The CAMS reanalysis meteorological data (which are nearly identical to ERA-I) show the 236
formation of a subtropical depression (Fig. 4 (a,b)) in the Southern Ocean (with its centre around 237
100 W and 25 S) starting from day 7. The subtropical depression grows with time and brings strong 238
winds (>15 m/s) to the study area. Strong southerly wind in the study area advects the high 239
background sea salt concentration over the Southern Ocean into the study region and also enhances 240
the local production of sea salt (Fig. 4). Past studies have too reported enhanced production of sea 241
salt due to strong wind [Gong et al., 2003; Fan and Toon, 2010; Dunne et al., 2014]. However, 242
here, we observe both local source enhancement and advection from high-loading regions farther 243
south contributing towards the reason for the observed variations in the AOD. 244
245
Strong wind can also affect the intensity of shallow and deep convection. Enhanced 246
evaporation due to strong wind produces a greater number of shallow cumuli, where each cumulus 247
contributes to the formation of a deeper precipitating cloud system [Nuijens and Stevens, 2012]. 248
Convergence due to the strong anomalous winds ahead of the subtropical trough has been reported 249
for the intensification of clouds and its associated precipitation by bringing moisture and lifting of 250
air masses leading to the development of organised deep convection [Ziv, 2001; Hart et al., 2010; 251
Tu and Chen, 2011]. We see a strong correlation in the variations of wind, specific humidity and 252
clouds throughout the time period (Figs. 2,4) confirming that the development of clouds in this 253
case is an outcome of the moisture transport due to the strong winds ahead of the subtropical 254
depression. 255
Hygroscopic growth of aerosol in the presence of moisture has been reported by Boucher 256
and Quaas [2013], and the strong correlation between AOD and cloud has been assigned for this 257
reason by Quaas et al., [2010] and Grandey et al., [2013]. In our case, we see similar changes in 258
Confidential manuscript submitted to Geophysical Research Letters
15
AOD and surface 80% sea-salt mass mixing ratio throughout the time period (Fig. 1c) suggesting 259
no anomalous growth of AOD. Thus, the AOD changes are (at least in the aerosol reanalysis) due 260
to changes in sea salt mass and not hygroscopic growth as the 80%-RH mass is directly related to 261
the dry mass. 262
Therefore, the strong correlation between aerosol and cloud properties over the domain, at 263
least for this region and time period, is the result of the subtropical synoptic activity in the Southern 264
Hemisphere, which leads to advection and enhanced local production of sea salt, and formation of 265
deep convective event coincidentally. The results indicate that correlations between cloud 266
properties (CF or CTP) and AOD can be caused primarily by the wind-cloud and wind-aerosol 267
interactions, and should not be taken as evidence of an aerosol-cloud interaction. 268
269
4 Conclusions and Discussion 270
271 Many previous studies have noted that strong convective events in subtropical regions 272
coincide with higher aerosol loadings. Our analysis of a previously reported event (KDA14) 273
confirms this relationship in observations. Our detailed simulations however suggest that this 274
relationship can be explained by coexisting but independent wind-aerosol and wind-cloud 275
relationships. Reproduction of the apparent convective invigoration, in the absence of any aerosol 276
variations in the model, proves that the aerosol-cloud correlations can be explained by the wind-277
cloud and wind-aerosol relationship and no CCN effect is required at least to leading order. The 278
numerical simulation and re-analysis data indicate that subtropical storm activity can control both 279
the cloud and sea-salt aerosol amounts in the pristine conditions over the Southern Pacific, with 280
Confidential manuscript submitted to Geophysical Research Letters
16
associated winds advecting sea-salt aerosol from the Southern Ocean, and associated 281
meteorological conditions (but not the sea salt itself) producing stronger cloud development. 282
Past global model-based studies have also argued that apparent invigoration is an effect of 283
meteorological covariation [Quaas et al., 2010; Gryspeerdt et al., 2014], but ours adds to this list 284
by reproducing observed weather variations in a cloud-resolving simulation, and by clarifying that 285
wind-induced sea-salt production is the dominant mechanism at least in this region. While our 286
results indicate that the leading-order cause of these correlations is wind, a meteorological variable, 287
this does not rule out an important role of aerosols in invigorating clouds, it only means that more 288
sophisticated means would be needed to infer the effect from observations. 289
Our study selected a small oceanic region and relatively short time period; therefore, it will 290
be beneficial if future studies could examine bigger domains and longer time periods. This will 291
help in capturing the synoptic activities which may have a strong implication for results. It would 292
be useful in particular to check the relevance of the results over other oceanic regions and different 293
time of year as our conclusions may not hold in all seasons and over all maritime regions. It will 294
also be beneficial to test the wind-driven sea-salt production mechanism for this region, as we did 295
not specifically test this mechanism yet. 296
297
Acknowledgment 298
299 We acknowledge the European Centre for Medium-Range Weather Forecasts (ECMWF) and 300
National Center for Atmospheric Research, for providing the ERA-Interim Reanalysis data and 301
WRF model. We also acknowledge NASA LAADS DAAC for providing the MODIS data and 302
Confidential manuscript submitted to Geophysical Research Letters
17
ECMWF for providing the CAMS atmospheric composition data. The global CAMS project is 303
built within the European Union’s Global Monitoring of Environment and Security program and 304
a series of Monitoring Atmospheric Composition and Climate (MACC) projects at the ECMWF. 305
We would also like to thank Olivier Boucher for his help in accessing the CAMS data. In addition, 306
we would also like to thank the Australian NCI and ARC Discovery Project DP140101104 for 307
providing computational resources for this work. 308
309
References 310 311
Altaratz, O., Bar-Or, R. Z., Wollner, U., & Koren, I. (2013). Relative humidity and its effect on 312
aerosolers, 8(3), 034025. 313
314
Andreae, M. O., Rosenfeld, D., Artaxo, P., Costa, A. A., Frank, G. P., Longo, K. M., & Silva-315
Dias, M. A. F. (2004). Smoking rain clouds over the Amazon. science, 303(5662), 1337-1342, doi 316
10.1126/science.1092779. 317
318
Betts, A. K., & Miller, M. J. (1993). The Betts-Miller scheme. In The representation of cumulus 319
convection in numerical models (pp. 107-121). American Meteorological Society. 320
321
Blanchard, D. C. (1983). The production, distribution, and bacterial enrichment of the sea-salt 322
aerosol. In Air-sea exchange of gases and particles (pp. 407-454). Springer Netherlands. 323
324
Confidential manuscript submitted to Geophysical Research Letters
18
Boucher, O., & Quaas, J. (2013). Water vapour affects both rain and aerosol optical depth. Nature 325
Geoscience, 6(1), 4-5. 326
327
Chand, D., Wood, R., Ghan, S. J., Wang, M., Ovchinnikov, M., Rasch, P. J., ... & Moore, T. 328
(2012). Aerosol optical depth increase in partly cloudy conditions. Journal of Geophysical 329
Research: Atmospheres, 117(D17), doi: 10.1029/2012JD017894 330
331
Chou, M.-D., and M. J. Suarez, 1994: An efficient thermal infrared radiation parameterization 332
for use in general circulation models. NASA Tech. Memo. 104606, Vol. 3, 85 pp. 333
334
Dee, D. P., Uppala, S. M., Simmons, A. J., Berrisford, P., Poli, P., Kobayashi, S., ... & Bechtold, 335
P. (2011). The ERA-Interim reanalysis: Configuration and performance of the data assimilation 336
system. Quarterly Journal of the royal meteorological society, 137(656), 553-597. 337
338
Dey, S., & Di Girolamo, L. (2010). A climatology of aerosol optical and microphysical properties 339
over the Indian subcontinent from 9 years (2000–2008) of Multiangle Imaging Spectroradiometer 340
(MISR) data. Journal of Geophysical Research: Atmospheres, 115(D15), doi: 341
10.1029/2009JD013395 342
343
Dey, S., Sengupta, K., Basil, G., Das, S., Nidhi, Ni., Dash, S.K., Sardar, A., Srivastava, P., Singh, 344
A., Agarwal, P., (2012). Satellite-based 3D structure of cloud and aerosols over the Indian 345
monsoon region: implications for aerosol-cloud interaction. In: Kawamiya, M., Krishnamurti, T. 346
Confidential manuscript submitted to Geophysical Research Letters
19
N., Maksyutov, S. (Eds), Remote sensing and Modelling of the atmosphere, oceans, and 347
interactions iv. 348
349
Dunne, E. M., Mikkonen, S., Kokkola, H., & Korhonen, H. (2014). A global process-based study 350
of marine CCN trends and variability. Atmospheric Chemistry and Physics, 14(24), 13631-13642. 351
352
Emmons, S. E. F. (2010). Description and evaluation of the Model for Ozone and Related 353
chemical Tracers, version 4 (MOZART-4). Geoscientific Model Development, 3. 354
355
Engström, A., & Ekman, A. M. (2010). Impact of meteorological factors on the correlation 356
between aerosol optical depth and cloud fraction. Geophysical Research Letters, 37(18), doi: 357
10.1029/2010GL044361 358
359
Fan, T., & Toon, O. B. (2010). Modeling sea-salt aerosol in a coupled climate and sectional 360
microphysical model: mass, optical depth and number concentration. Atmospheric Chemistry & 361
Physics Discussions, 10, 24499-24561. 362
363
Fan, J., Leung, L. R., Rosenfeld, D., Chen, Q., Li, Z., Zhang, J., & Yan, H. (2013). Microphysical 364
effects determine macrophysical response for aerosol impacts on deep convective 365
clouds. Proceedings of the National Academy of Sciences, 110(48), E4581-E4590. 366
367
Gong, S. L. (2003). A parameterization of sea-salt aerosol source function for sub-and super-368
micron particles. Global biogeochemical cycles, 17(4), doi: 10.1029/2003GB002079 369
Confidential manuscript submitted to Geophysical Research Letters
20
370
Grandey, B. S., Stier, P., & Wagner, T. M. (2013). Investigating relationships between aerosol 371
optical depth and cloud fraction using satellite, aerosol reanalysis and general circulation model 372
data. Atmospheric Chemistry and Physics, 13(6), 3177-3184. 373
374
Gryspeerdt, E., Stier, P., & Grandey, B. S. (2014). Cloud fraction mediates the aerosol optical 375
depth-cloud top height relationship. Geophysical Research Letters, 41(10), 3622-3627, doi: 376
10.1002/2014GL059524 377
378
Hong, S.-Y., Y. Noh, and J. Dudhia (2006), A new vertical diffusion package with an explicit 379
treatment of entrainment processes, Mon. Weather Rev., 134(9), 2318–2341 380
381
Hart, N. C. G., Reason, C. J. C., & Fauchereau, N. (2010). Tropical–extratropical interactions 382
over southern Africa: three cases of heavy summer season rainfall. Monthly weather 383
review, 138(7), 2608-2623. 384
385
Inness, A. (2012). The MACC reanalysis : an 8-year data set of atmospheric composition. 386
[Reading, Berks.] :[European Centre for Medium-Range Weather Forecasts], 387
388
IPCC, 2013: Climate Change 2013: The Physical Science Basis. Contribution of Working Group 389
I to the Fifth Assessment Report of the Intergovernmental Panel on Climate Change [Stocker, T.F., 390
D. Qin, G.-K. Plattner, M. Tignor, S.K. Allen, J. Boschung, A. Nauels, Y. Xia, V. Bex and P.M. 391

Confidential manuscript submitted to Geophysical Research Letters
21
Midgley (eds.)]. Cambridge University Press, Cambridge, United Kingdom and New York, NY, 392
USA, 1535 pp, doi:10.1017/CBO9781107415324. 393
394
Kaufman, Y. J., Koren, I., Remer, L. A., Rosenfeld, D., & Rudich, Y. (2005). The effect of smoke, 395
dust, and pollution aerosol on shallow cloud development over the Atlantic Ocean. Proceedings 396
of the National Academy of Sciences of the United States of America, 102(32), 11207-11212. 397
398
Khain, A., Rosenfeld, D., & Pokrovsky, A. (2005). Aerosol impact on the dynamics and 399
microphysics of deep convective clouds. Quarterly Journal of the Royal Meteorological Society, 400
131(611), 2639-2663. 401
402
Koren, I., Kaufman, Y. J., Rosenfeld, D., Remer, L. A., & Rudich, Y. (2005). Aerosol invigoration 403
and restructuring of Atlantic convective clouds. Geophysical Research Letters, 32(14), doi: 404
10.1029/2005GL023187 405
406
Koren, I., Feingold, G., & Remer, L. A. (2010). The invigoration of deep convective clouds over 407
the Atlantic: aerosol effect, meteorology or retrieval artifact? Atmospheric Chemistry and Physics, 408
10(18), 8855-8872. 409
410
Koren, I., Dagan, G., & Altaratz, O. (2014). From aerosol-limited to invigoration of warm 411
convective clouds. Science, 344(6188), 1143-1146. 412
413

Confidential manuscript submitted to Geophysical Research Letters
22
Mace, G. G., & Abernathy, A. C. (2016). Observational evidence for aerosol invigoration in 414
shallow cumulus downstream of Mount Kilauea. Geophysical Research Letters, 43(6), 2981-2988, 415
doi: 10.1002/2016GL067830 416
417
Marshak, A., Platnick, S., Várnai, T., Wen, G., & Cahalan, R. F. (2006). Impact of three-418
dimensional radiative effects on satellite retrievals of cloud droplet sizes. Journal of Geophysical 419
Research: Atmospheres, 111(D9) doi: 10.1029/2005JD006686 420
421
Mlawer, E. J., S. J. Taubman, P. D. Brown, M. J. Iacono, and S. A. Clough (1997), Radiative 422
transfer for inhomogeneous atmospheres: RRTM, a validated correlated-k model for the longwave, 423
J. Geophys. Res., 102(D14), 16,663–16,682, doi: 10.1029/97JD00237 424
425
Monahan, E. C., D. E. Spiel, and K. L. Davidson, A model of marine aerosol generation via 426
whitecaps and wave disruption, in Oceanic Whitecaps, edited by E. Monahan, and G. M. Niocaill, 427
pp. 167–174, D. Reidel, Norwell, Mass., 1986. 428
429
Niu, F., & Li, Z. (2012). Systematic variations of cloud top temperature and precipitation rate 430
with aerosols over the global tropics. Atmospheric Chemistry and Physics, 12(18), 8491-8498. 431
432
Nuijens, L., & Stevens, B. (2012). The influence of wind speed on shallow marine cumulus 433
convection. Journal of the Atmospheric Sciences, 69(1), 168-184. 434
435
Confidential manuscript submitted to Geophysical Research Letters
23
Platnick, S., King, M. D., Ackerman, S. A., Menzel, W. P., Baum, B. A., Riédi, J. C., & Frey, R. 436
A. (2003). The MODIS cloud products: Algorithms and examples from Terra. IEEE Transactions 437
on Geoscience and Remote Sensing, 41(2), 459-473. 438
439
Quaas, J., Stevens, B., Stier, P., & Lohmann, U. (2010). Interpreting the cloud cover–aerosol 440
optical depth relationship found in satellite data using a general circulation model. Atmospheric 441
Chemistry and Physics, 10(13), 6129-6135. 442
443
Rosenfeld, D., Lohmann, U., Raga, G. B., O'Dowd, C. D., Kulmala, M., Fuzzi, S., ... & Andreae, 444
M. O. (2008). Flood or drought: how do aerosols affect precipitation?. science, 321(5894), 1309-445
1313. 446
447
Rosenfeld, D., Sherwood, S., Wood, R., & Donner, L. (2014). Climate effects of aerosol-cloud 448
interactions. Science, 343(6169), 379-380. 449
450
Skamarock, W. C., J. B. Klemp, J. Dudhia, D. O. Gill, D. M. Barker, W. Wang, and J. G. Powers 451
(2008), A description of the Advanced Research WRF version 3, NCAR Tech, Note NCAR/TN-452
475+STR, 113 pp. 453
454
Storer, R. L., & Van den Heever, S. C. (2013). Microphysical processes evident in aerosol forcing 455
of tropical deep convective clouds. Journal of the Atmospheric Sciences, 70(2), 430-446. 456
457

Confidential manuscript submitted to Geophysical Research Letters
24
Stevens, B., & Feingold, G. (2009). Untangling aerosol effects on clouds and precipitation in a 458
buffered system. Nature, 461(7264), 607-613. 459
460
Tao, W. K., Li, X., Khain, A., Matsui, T., Lang, S., & Simpson, J. (2007). Role of atmospheric 461
aerosol concentration on deep convective precipitation: Cloud-resolving model 462
simulations. Journal of Geophysical Research: Atmospheres, 112(D24), doi: 463
10.1029/2007JD008728 464
465
Thompson, G., & Eidhammer, T. (2014). A study of aerosol impacts on clouds and precipitation 466
development in a large winter cyclone. Journal of the Atmospheric Sciences, 71(10), 3636-3658. 467
468
Tu, C. C., & Chen, Y. L. (2011). Favorable conditions for the development of a heavy rainfall 469
event over Oahu during the 2006 wet period. Weather and Forecasting, 26(3), 280-300. 470
471
Twohy, C. H., J. A. Coakley Jr., and W. R. Tahnk (2009), Effect of changes in relative humidity 472
on aerosol scattering near clouds, J. Geophys. Res., 114, D05205, doi:10.1029/2008JD010991. 473
474
Zhao, T. X. P., Chan, P. K., & Heidinger, A. K. (2013). A global survey of the effect of cloud 475
contamination on the aerosol optical thickness and its long-term trend derived from operational 476
AVHRR satellite observations. Journal of Geophysical Research: Atmospheres, 118(7), 2849-477
2857, doi: 10.1002/jgrd.50278 478
479

Confidential manuscript submitted to Geophysical Research Letters
25
Zhang, J., Reid, J. S., & Holben, B. N. (2005). An analysis of potential cloud artifacts in MODIS 480
over ocean aerosol optical thickness products. Geophysical Research Letters, 32(15), doi - 481
10.1029/2005GL023254 482
483
Ziv, B. (2001). A subtropical rainstorm associated with a tropical plume over Africa and the 484
Middle-East. Theoretic and Applied Climatology, 69(1), 91-102. 485
486
487