a combination of preliminary electroweak measurements …
TRANSCRIPT

arX
iv:h
ep-e
x/01
1202
1v2
17
Jan
2002
EUROPEAN ORGANIZATION FOR NUCLEAR RESEARCH
CERN-EP/2001-098LEPEWWG/2001-02
ALEPH 2001-078 PHYS 2001-028DELPHI 2001-131 PHYS 906
L3 Note 2723OPAL PR 350
hep-ex/0112021December 17th, 2001
A Combination of Preliminary
Electroweak Measurements and
Constraints on the Standard Model
The LEP Collaborations∗ ALEPH, DELPHI, L3, OPAL,
the LEP Electroweak Working Group†
and the SLD Heavy Flavour and Electroweak Groups‡
Prepared from Contributions of the LEP and SLD Experiments
to the 2001 Summer Conferences.
∗The LEP Collaborations each take responsibility for the preliminary results of their own.†WWW access at http://www.cern.ch/LEPEWWGThe members of the LEP Electroweak Working Group who contributed significantly to this note are:
D. Abbaneo, J. Alcaraz, P. Antilogus, A. Bajo-Vaquero, P. Bambade, E. Barberio, M. Biglietti A. Blondel, S. Blyth,D. Bourilkov, P. Casado, D.G. Charlton, P. Checchia, R. Chierici, R. Clare, B. de la Cruz, M. Elsing, P. Garcia-Abia,M.W. Grunewald, A. Gurtu, J.B. Hansen, P. Hansen, R. Hawkings, J. Holt, R.W.L. Jones, B. Kersevan, N. Kjaer,E. Lancon, L. Malgeri, C. Mariotti, M. Martinez, F. Matorras, C. Matteuzzi, S. Mele, E. Migliore, M.N. Minard,K. Monig, A. Oh, C. Parkes, U. Parzefall, Ch. Paus, M. Pepe-Altarelli, B. Pietrzyk, O. Pooth, G. Quast, P. Renton,H. Rick, S. Riemann, J.M. Roney, H. Ruiz, K. Sachs, S. Spagnolo, A. Straessner, D. Strom, R. Tenchini, F. Teubert,E. Tournefier, A. Valassi, S. Villa, H. Voss, C.P. Ward, N.K. Watson, P.S. Wells.
‡N. de Groot, P.C. Rowson, V. Serbo, D. Su.

Abstract
This note presents a combination of published and preliminary electroweak results from the fourLEP collaborations and the SLD collaboration which were prepared for the 2001 summer conferences.Averages from Z resonance results are derived for hadronic and leptonic cross sections, the leptonicforward-backward asymmetries, the τ polarisation asymmetries, the bb and cc partial widths andforward-backward asymmetries and the qq charge asymmetry. Above the Z resonance, averages arederived for di–fermion cross sections and forward-backward asymmetries, W–pair, Z–pair and single–W production cross section, electroweak gauge boson couplings, W mass and width and W decaybranching ratios. For the first time, total and differential cross sections for di–photon production arecombined.
The main changes with respect to the experimental results presented in summer 2000 are updatesto the Z-pole heavy flavour results from SLD and LEP and to the W mass from LEP. The results arecompared with precise electroweak measurements from other experiments. Using a new evaluation ofthe hadronic vacuum polarisation, the parameters of the Standard Model are evaluated, first usingthe combined LEP electroweak measurements, and then using the full set of electroweak results.

Chapter 1
Introduction
This paper presents an update of combined results on electroweak parameters by the four LEP exper-iments and SLD using published and preliminary measurements, superseding previous analyses [1].Results derived from the Z resonance are based on data recorded until the end of 1995 for the LEPexperiments and 1998 for SLD. Since 1996 LEP has run at energies above the W-pair productionthreshold. In 2000, the final year of data taking at LEP, the total delivered luminosity was as high asin 1999; the maximum centre-of-mass energy attained was close to 209 GeV although most of the datataken in 1999 was collected at 205 and 207 GeV. By the end of LEP-II operation, a total integratedluminosity of approximately 700pb−1 per experiment has been recorded above the Z resonance.
The LEP-I (1990-1995) Z-pole measurements consist of the hadronic and leptonic cross sections, theleptonic forward-backward asymmetries, the τ polarisation asymmetries, the bb and cc partial widthsand forward-backward asymmetries and the qq charge asymmetry. The measurements of the left-rightcross section asymmetry, the bb and cc partial widths and left-right-forward-backward asymmetriesfor b and c quarks from SLD are treated consistently with the LEP data. Many technical aspects oftheir combination are described in References 2, 3 and references therein.
The LEP-II (1996-2000) measurements are di–fermion cross sections and forward-backward asym-metries; di–photon production, W–pair, Z–pair and single–W production cross sections, and elec-troweak gauge boson self couplings. W boson properties, like mass, width and decay branching ratiosare also measured.
Several measurements included in the combinations are still preliminary.
This note is organised as follows:
Chapter 2 Z line shape and leptonic forward-backward asymmetries;
Chapter 3 τ polarisation;
Chapter 4 Measurement of polarised asymmetries at SLD;
Chapter 5 Heavy flavour analyses;
Chapter 6 Inclusive hadronic charge asymmetry;
Chapter 7 Photon-pair production at energies above the Z;
Chapter 8 Fermion-pair production at energies above the Z;
2

Chapter 9 W and four-fermion production;
Chapter 10 Electroweak gauge boson self couplings;
Chapter 11 W-boson mass and width;
Chapter 12 Interpretation of the Z-pole results in terms of effective couplings of the neutral weakcurrent;
Chapter 13 Interpretation of all results, also including results from neutrino interaction and atomicparity violation experiments as well as from CDF and DØ in terms of constraints on the StandardModel
Chapter 14 Conclusions including prospects for the future.
To allow a quick assessment, a box highlighting the updates is given at the beginning of each section.
3

Chapter 2
Z Lineshape and Lepton Forward-Backward
Asymmetries
Updates with respect to summer 2000:
Unchanged w.r.t. summer 2000: All experiments have published final results which enter in thecombination. The final combination procedure is used.
The results presented here are based on the full LEP-I data set. This includes the data taken duringthe energy scans in 1990 and 1991 in the range1 |√s−mZ| < 3 GeV, the data collected at the Z peak in1992 and 1994 and the precise energy scans in 1993 and 1995 (|√s−mZ| < 1.8 GeV). The total eventstatistics are given in Table 2.1. Details of the individual analyses can be found in References 4–7.
year A D L O all
’90/91 433 357 416 454 1660’92 633 697 678 733 2741’93 630 682 646 649 2607’94 1640 1310 1359 1601 5910’95 735 659 526 659 2579
total 4071 3705 3625 4096 15497
ℓ+ℓ−
year A D L O all
’90/91 53 36 39 58 186’92 77 70 59 88 294’93 78 75 64 79 296’94 202 137 127 191 657’95 90 66 54 81 291
total 500 384 343 497 1724
Table 2.1: The qq and ℓ+ℓ− event statistics, in units of 103, used for the analysis of the Z line shapeand lepton forward-backward asymmetries by the experiments ALEPH (A), DELPHI (D), L3 (L) andOPAL (O).
For the averaging of results the LEP experiments provide a standard set of 9 parameters describingthe information contained in hadronic and leptonic cross sections and leptonic forward-backward asym-metries. These parameters are convenient for fitting and averaging since they have small correlations.They are:
• The mass mZ and total width ΓZ of the Z boson, where the definition is based on the Breit-Wigner denominator (s−m2
Z + isΓZ/mZ) with s-dependent width [8].
1In this note ~ = c = 1.
4

• The hadronic pole cross section of Z exchange:
σ0h ≡ 12π
m2Z
ΓeeΓhad
Γ2Z
. (2.1)
Here Γee and Γhad are the partial widths of the Z for decays into electrons and hadrons.
• The ratios:
R0e ≡ Γhad/Γee, R0
µ ≡ Γhad/Γµµ and R0τ ≡ Γhad/Γττ . (2.2)
Here Γµµ and Γττ are the partial widths of the Z for the decays Z → µ+µ− and Z → τ+τ−. Dueto the mass of the τ lepton, a difference of 0.2% is expected between the values for R0
e and R0µ,
and the value for R0τ , even under the assumption of lepton universality [9].
• The pole asymmetries, A0, eFB, A0, µ
FB and A0, τFB , for the processes e+e− → e+e−, e+e− → µ+µ− and
e+e− → τ+τ−. In terms of the real parts of the effective vector and axial-vector neutral currentcouplings of fermions, gVf and gAf , the pole asymmetries are expressed as
A0, fFB ≡ 3
4AeAf (2.3)
with
Af ≡2gVfgAf
g2Vf + g2Af
= 2gVf/gAf
1 + (gVf/gAf)2. (2.4)
The imaginary parts of the vector and axial-vector coupling constants as well as real and imaginaryparts of the photon vacuum polarisation are taken into account explicitly in the fitting formulae andare fixed to their Standard Model values. The fitting procedure takes into account the effects of initial-state radiation [8] to O(α3) [10–12], as well as the t-channel and the s-t interference contributions inthe case of e+e− final states.
The set of 9 parameters does not describe hadron and lepton-pair production completely, becauseit does not include the interference of the s-channel Z exchange with the s-channel γ exchange. Forthe results presented in this section and used in the rest of the note, the γ-exchange contributionsand the hadronic γZ interference terms are fixed to their Standard Model values. The leptonic γZinterference terms are expressed in terms of the effective couplings.
The four sets of nine parameters provided by the LEP experiments are presented in Table 2.2.For performing the average over these four sets of nine parameters, the overall covariance matrix isconstructed from the covariance matrices of the individual LEP experiments and taking into accountcommon systematic errors [2]. The common systematic errors include theoretical errors as well as errorsarising from the uncertainty in the LEP beam energy. The beam energy uncertainty contributes anuncertainty of ±1.7 MeV to mZ and ±1.2 MeV to ΓZ. In addition, the uncertainty in the centre-of-mass energy spread of about ±1 MeV contributes ±0.2 MeV to ΓZ. The theoretical error oncalculations of the small-angle Bhabha cross section is ±0.054 % [13] for OPAL and ±0.061 % [14] forall other experiments, and results in the largest common systematic uncertainty on σ0h. QED radiation,dominated by photon radiation from the initial state electrons, contributes a common uncertainty of±0.02 % on σ0h, of ±0.3 MeV on mZ and of ±0.2 MeV on ΓZ. The contribution of t-channel diagramsand the s-t interference in Z → e+e− leads to an additional theoretical uncertainty estimated to be±0.024 on R0
e and ±0.0014 on A0, eFB, which are fully anti–correlated. Uncertainties from the model-
independent parameterisation of the energy dependence of the cross section are almost negligible,if the definitions of Reference [15] are applied. Through unavoidable remaining Standard Model
5

correlations
mZ ΓZ σ0h R0
e R0µ R0
τ A0, eFB A
0, µFB A0, τ
FB
χ2/Ndf = 169/176 ALEPHmZ [GeV] 91.1891 ± 0.0031 1.00ΓZ [GeV] 2.4959 ± 0.0043 .038 1.00σ0h [nb] 41.558 ± 0.057 −.091−.383 1.00R0
e 20.690 ± 0.075 .102 .004 .134 1.00R0
µ 20.801 ± 0.056 −.003 .012 .167 .083 1.00R0
τ 20.708 ± 0.062 −.003 .004 .152 .067 .093 1.00
A0, eFB 0.0184 ± 0.0034 −.047 .000−.003−.388 .000 .000 1.00
A0, µFB 0.0172 ± 0.0024 .072 .002 .002 .019 .013 .000−.008 1.00
A0, τFB 0.0170 ± 0.0028 .061 .002 .002 .017 .000 .011−.007 .016 1.00
χ2/Ndf = 177/168 DELPHImZ [GeV] 91.1864 ± 0.0028 1.00ΓZ [GeV] 2.4876 ± 0.0041 .047 1.00σ0h [nb] 41.578 ± 0.069 −.070−.270 1.00R0
e 20.88 ± 0.12 .063 .000 .120 1.00R0
µ 20.650 ± 0.076 −.003−.007 .191 .054 1.00R0
τ 20.84 ± 0.13 .001−.001 .113 .033 .051 1.00
A0, eFB 0.0171 ± 0.0049 .057 .001−.006−.106 .000−.001 1.00
A0, µFB 0.0165 ± 0.0025 .064 .006−.002 .025 .008 .000−.016 1.00
A0, τFB 0.0241 ± 0.0037 .043 .003−.002 .015 .000 .012−.015 .014 1.00
χ2/Ndf = 158/166 L3mZ [GeV] 91.1897 ± 0.0030 1.00ΓZ [GeV] 2.5025 ± 0.0041 .065 1.00σ0h [nb] 41.535 ± 0.054 .009−.343 1.00R0
e 20.815 ± 0.089 .108−.007 .075 1.00R0
µ 20.861 ± 0.097 −.001 .002 .077 .030 1.00R0
τ 20.79 ± 0.13 .002 .005 .053 .024 .020 1.00
A0, eFB 0.0107 ± 0.0058 −.045 .055−.006−.146−.001−.003 1.00
A0, µFB 0.0188 ± 0.0033 .052 .004 .005 .017 .005 .000 .011 1.00
A0, τFB 0.0260 ± 0.0047 .034 .004 .003 .012 .000 .007−.008 .006 1.00
χ2/Ndf = 155/194 OPALmZ [GeV] 91.1858 ± 0.0030 1.00ΓZ [GeV] 2.4948 ± 0.0041 .049 1.00σ0h [nb] 41.501 ± 0.055 .031−.352 1.00R0
e 20.901 ± 0.084 .108 .011 .155 1.00R0
µ 20.811 ± 0.058 .001 .020 .222 .093 1.00R0
τ 20.832 ± 0.091 .001 .013 .137 .039 .051 1.00
A0, eFB 0.0089 ± 0.0045 −.053−.005 .011−.222−.001 .005 1.00
A0, µFB 0.0159 ± 0.0023 .077−.002 .011 .031 .018 .004−.012 1.00
A0, τFB 0.0145 ± 0.0030 .059−.003 .003 .015−.010 .007−.010 .013 1.00
Table 2.2: Line Shape and asymmetry parameters from fits to the data of the four LEP experimentsand their correlation coefficients.
assumptions, dominated by the need to fix the γ-Z interference contribution in the qq channel, thereis some small dependence of ±0.2 MeV of mZ on the Higgs mass, mH (in the range 100 GeV to 1000GeV) and the value of the electromagnetic coupling constant. Such “parametric” errors are negligiblefor the other results. The combined parameter set and its correlation matrix are given in Table 2.3.
If lepton universality is assumed, the set of 9 parameters is reduced to a set of 5 parameters.
6

without lepton universality correlations
χ2/Ndf = 32.6/27 mZ ΓZ σ0h R0e R0
µ R0τ A0, e
FB A0, µFB A0, τ
FB
mZ [GeV] 91.1876± 0.0021 1.00ΓZ [GeV] 2.4952 ± 0.0023 −.024 1.00σ0h [nb] 41.541 ± 0.037 −.044−.297 1.00R0
e 20.804 ± 0.050 .078−.011 .105 1.00R0
µ 20.785 ± 0.033 .000 .008 .131 .069 1.00
R0τ 20.764 ± 0.045 .002 .006 .092 .046 .069 1.00
A0, eFB 0.0145 ± 0.0025 −.014 .007 .001−.371 .001 .003 1.00
A0, µFB 0.0169 ± 0.0013 .046 .002 .003 .020 .012 .001−.024 1.00
A0, τFB 0.0188 ± 0.0017 .035 .001 .002 .013−.003 .009−.020 .046 1.00
with lepton universality
χ2/Ndf = 36.5/31 mZ ΓZ σ0h R0ℓ A0, ℓ
FB
mZ [GeV] 91.1875± 0.0021 1.00ΓZ [GeV] 2.4952 ± 0.0023 −.023 1.00σ0h [nb] 41.540 ± 0.037 −.045−.297 1.00R0
ℓ 20.767 ± 0.025 .033 .004 .183 1.00
A0, ℓFB 0.0171 ± 0.0010 .055 .003 .006−.056 1.00
Table 2.3: Average line shape and asymmetry parameters from the data of the four LEP experiments,without and with the assumption of lepton universality.
R0ℓ is defined as R0
ℓ ≡ Γhad/Γℓℓ, where Γℓℓ refers to the partial Z width for the decay into a pair ofmassless charged leptons. The data of each of the four LEP experiments are consistent with leptonuniversality (the difference in χ2 over the difference in d.o.f. with and without the assumption oflepton universality is 3/4, 6/4, 5/4 and 3/4 for ALEPH, DELPHI, L3 and OPAL, respectively). Thelower part of Table 2.3 gives the combined result and the corresponding correlation matrix. Figure 2.1shows, for each lepton species and for the combination assuming lepton universality, the resulting 68%probability contours in the R0
ℓ -A0, ℓFB plane. Good agreement is observed.
For completeness the partial decay widths of the Z boson are listed in Table 2.4, although theyare more correlated than the ratios given in Table 2.3. The leptonic pole cross-section, σ0ℓ , defined as
σ0ℓ ≡ 12π
m2Z
Γ2ℓℓ
Γ2Z
, (2.5)
in analogy to σ0h, is shown in the last line of the Table. Because QCD final state corrections appeartwice in the denominator via ΓZ, σ0ℓ has a higher sensitivity to αs than σ0h or R0
ℓ , where the dependenceon QCD corrections is only linear.
2.1 Number of Neutrino Species
An important aspect of our measurement concerns the information related to Z decays into invisiblechannels. Using the results of Table 2.3, the ratio of the Z decay width into invisible particles and theleptonic decay width is determined:
Γinv/Γℓℓ = 5.942 ± 0.016 . (2.6)
7

without lepton universality correlationsΓhad Γee Γµµ Γττ
Γhad [MeV] 1745.8 ±2.7 1.00Γee [MeV] 83.92±0.12 −0.29 1.00Γµµ [MeV] 83.99±0.18 0.66−0.20 1.00Γττ [MeV] 84.08±0.22 0.54−0.17 0.39 1.00
with lepton universality correlationsΓinv Γhad Γℓℓ
Γinv [MeV] 499.0 ±1.5 1.00Γhad [MeV] 1744.4 ±2.0 −0.29 1.00Γℓℓ [MeV] 83.984±0.086 0.49 0.39 1.00
Γinv/Γℓℓ 5.942 ±0.016
σ0ℓ [nb] 2.0003±0.0027
Table 2.4: Partial decay widths of the Z boson, derived from the results of the 9-parameter averagesin Table 2.3. In the case of lepton universality, Γℓℓ refers to the partial Z width for the decay into apair of massless charged leptons.
The Standard Model value for the ratio of the partial widths to neutrinos and charged leptons is:
(Γνν/Γℓℓ)SM = 1.9912 ± 0.0012 . (2.7)
The central value is evaluated for mZ = 91.1875 GeV and the error quoted accounts for a variation ofmt in the range mt = 174.3±5.1 GeV and a variation of mH in the range 100 GeV ≤ mH ≤ 1000 GeV.The number of light neutrino species is given by the ratio of the two expressions listed above:
Nν = 2.9841 ± 0.0083, (2.8)
which is two standard deviations below the value of 3 expected from 3 observed fermion families.
Alternatively, one can assume 3 neutrino species and determine the width from additional invisibledecays of the Z. This yields
∆Γinv = −2.7 ± 1.6 MeV. (2.9)
The measured total width is below the Standard Model expectation. If a conservative approach is takento limit the result to only positive values of ∆Γinv and renormalising the probability for ∆Γinv ≥ 0 tobe unity, then the resulting 95% CL upper limit on additional invisible decays of the Z is
∆Γinv < 2.0 MeV. (2.10)
The theoretical error on the luminosity [14] constitutes a large part of the uncertainties on Nν and∆Γinv.
8

0.01
0.014
0.018
0.022
20.6 20.7 20.8 20.9
R0l=Γhad/Γ l
A0,
l
fb
68% CL
l+l−
e+e−
µ+µ−
τ+τ−
αs
mt
mH
∆α∆α
Figure 2.1: Contours of 68% probability in the R0ℓ -A0, ℓ
FB plane. For better comparison the resultsfor the τ lepton are corrected to correspond to the massless case. The Standard Model predictionfor mZ = 91.1875 GeV, mt = 174.3 GeV, mH = 300 GeV, and αS(m2
Z) = 0.118 is also shown.The lines with arrows correspond to the variation of the Standard Model prediction when mt, mH,
αS(m2Z) and ∆α
(5)had(m2
Z) are varied in the intervals mt = 174.3 ± 5.1 GeV, mH = 300+700−186 GeV,
αS(m2Z) = 0.118 ± 0.002 and ∆α
(5)had(m2
Z) = 0.02761 ± 0.00036, respectively. The arrows point in the
direction of increasing values of mt, mH, αS and ∆α(5)had(m2
Z).
9

Chapter 3
The τ Polarisation
Updates with respect to summer 2000:
OPAL has finalised their results. While all results are now final, the combination procedure itself isstill preliminary.
The longitudinal τ polarisation Pτ of τ pairs produced in Z decays is defined as
Pτ ≡ σR − σLσR + σL
, (3.1)
where σR and σL are the τ -pair cross sections for the production of a right-handed and left-handedτ−, respectively. The distribution of Pτ as a function of the polar scattering angle θ between the e−
and the τ−, at√s = mZ, is given by
Pτ (cos θ) = −Aτ (1 + cos2 θ) + 2Ae cos θ
1 + cos2 θ + 2AτAe cos θ, (3.2)
with Ae and Aτ as defined in Equation (2.4). Equation (3.2) is valid for pure Z exchange. The effectsof γ exchange, γ-Z interference and electromagnetic radiative corrections in the initial and final statesare taken into account in the experimental analyses. In particular, these corrections account for the√s dependence of the τ polarisation, which is important because the off-peak data are included in the
event samples for all experiments. When averaged over all production angles Pτ is a measurement ofAτ . As a function of cos θ, Pτ (cos θ) provides nearly independent determinations of both Aτ and Ae,thus allowing a test of the universality of the couplings of the Z to e and τ .
Each experiment makes separate Pτ measurements using the five τ decay modes eνν, µνν, πν, ρνand a1ν [16–19]. The ρν and πν are the most sensitive channels, contributing weights of about 40%each in the average. DELPHI and L3 also use an inclusive hadronic analysis. The combination ismade using the results from each experiment already averaged over the τ decay modes.
3.1 Results
Tables 3.1 and 3.2 show the most recent results for Aτ and Ae obtained by the four LEP collaborations[16–19] and their combination. Although the size of the event samples used by the four experimentsare roughly equal, smaller errors are quoted by ALEPH. This is largely associated with the higherangular granularity of the ALEPH electromagnetic calorimeter. Common systematic errors arise from
10

uncertainties in radiative corrections (decay radiation) in the πν and ρν channels, and in the modellingof the a1 decays [20]. These errors and their correlations need further investigation, but are alreadytaken into account in the combination (see also Reference 18). The statistical correlation between theextracted values of Aτ and Ae is small (≤ 5%).
The average values for Aτ and Ae:
Aτ = 0.1439 ± 0.0043 (3.3)
Ae = 0.1498 ± 0.0049 , (3.4)
with a correlation of 0.013, are compatible, in good agreement with neutral-current lepton universality.Assuming e-τ universality, the values for Aτ and Ae can be combined. This combination is performedincluding the small common systematic errors between Aτ and Ae within each experiment and betweenexperiments. The combined result of Aτ and Ae is:
Aℓ = 0.1465 ± 0.0033 , (3.5)
where the error includes a systematic component of 0.0016.
Experiment Aτ
ALEPH (90 - 95), final 0.1451 ± 0.0052 ± 0.0029
DELPHI (90 - 95), final 0.1359 ± 0.0079 ± 0.0055
L3 (90 - 95), final 0.1476 ± 0.0088 ± 0.0062
OPAL (90 - 95), final 0.1456 ± 0.0076 ± 0.0057
LEP Average preliminary 0.1439 ± 0.0043
Table 3.1: LEP results for Aτ . The first error is statistical and the second systematic. In the LEPaverage, statistical and systematic errors are combined in quadrature. The systematic component ofthe error is ±0.0026.
Experiment Ae
ALEPH (90 - 95), final 0.1504 ± 0.0068 ± 0.0008
DELPHI (90 - 95), final 0.1382 ± 0.0116 ± 0.0005
L3 (90 - 95), final 0.1678 ± 0.0127 ± 0.0030
OPAL (90 - 95), final 0.1454 ± 0.0108 ± 0.0036
LEP Average preliminary 0.1498 ± 0.0049
Table 3.2: LEP results for Ae. The first error is statistical and the second systematic. In the LEPaverage, statistical and systematic errors are combined in quadrature. The systematic component ofthe error is ±0.0009.
11

Chapter 4
Measurement of polarised lepton asymmetries
at SLC
Updates with respect to summer 2000:
Unchanged w.r.t. summer 2000: SLD has final results for ALR and the leptonic left-right forward-backward asymmetries.
The measurement of the left-right cross section asymmetry (ALR) by SLD [21] at the SLC providesa systematically precise, statistics-dominated determination of the coupling Ae, and is presently themost precise single measurement, with the smallest systematic error, of this quantity. In principlethe analysis is straightforward: one counts the numbers of Z bosons produced by left and rightlongitudinally polarised electrons, forms an asymmetry, and then divides by the luminosity-weightede− beam polarisation magnitude (the e+ beam is not polarised):
ALR =NL −NR
NL +NR
1
Pe. (4.1)
Since the advent of high polarisation “strained lattice” GaAs photo-cathodes (1994), the average elec-tron polarisation at the interaction point has been in the range 73% to 77%. The method requiresno detailed final state event identification (e+e− final state events are removed, as are non-Z back-grounds) and is insensitive to all acceptance and efficiency effects. The small total systematic errorof 0.64% relative is dominated by the 0.50% relative systematic error in the determination of the e−
polarisation. The relative statistical error on ALR is about 1.3%.
The precision Compton polarimeter detects beam electrons that are scattered by photons from acircularly polarised laser. Two additional polarimeters that are sensitive to the Compton-scatteredphotons and which are operated in the absence of positron beam, have verified the precision polarimeterresult and are used to set a calibration uncertainty of 0.4% relative. In 1998, a dedicated experimentwas performed in order to test directly the expectation that accidental polarisation of the positronbeam was negligible; the e+ polarisation was found to be consistent with zero (−0.02 ± 0.07)%.
The ALR analysis includes several very small corrections. The polarimeter result is corrected forhigher order QED and accelerator related effects, a total of (−0.22 ± 0.15)% relative for 1997/98data. The event asymmetry is corrected for backgrounds and accelerator asymmetries, a total of(+0.15 ± 0.07)% relative, for 1997/98 data.
The translation of the ALR result to a “pole” value is a (−2.5 ± 0.4)% relative shift, where theuncertainty arises from the precision of the centre-of-mass energy determination. This small error due
12

to the beam energy measurement reflects the results of a scan of the Z peak used to calibrate theenergy spectrometers to mZ from LEP data. The pole value, A0
LR, is equivalent to a measurement ofAe.
The 2000 result is included in a running average of all of the SLD ALR measurements (1992, 1993,1994/1995, 1996, 1997 and 1998). This updated result for A0
LR (Ae) is 0.1514±0.0022. In addition, theleft-right forward-backward asymmetries for leptonic final states are measured [22]. From these, theparameters Ae, Aµ and Aτ can be determined. The results are Ae = 0.1544±0.0060, Aµ = 0.142±0.015and Aτ = 0.136± 0.015. The lepton-based result for Ae can be combined with the A0
LR result to yieldAe = 0.1516 ± 0.0021, including small correlations in the systematic errors. The correlation of thismeasurement with Aµ and Aτ is indicated in Table 4.1.
Assuming lepton universality, the ALR result and the results on the leptonic left-right forward-backward asymmetries can be combined, while accounting for small correlated systematic errors,yielding
Aℓ = 0.1513 ± 0.0021. (4.2)
Ae Aµ Aτ
Ae 1.000Aµ 0.038 1.000Aτ 0.033 0.007 1.000
Table 4.1: Correlation coefficients between Ae, Aµ and Aτ
13

Chapter 5
Results from b and c Quarks
Updates with respect to summer 2000:
ALEPH has updated their AbbFB jet-charge measurement using a neural net charge tag
DELPHI has presented new measurements of AbbFB using a neural net charge tag
SLD has updated Rc and most Ab and Ac measurements.
5.1 Introduction
The relevant quantities in the heavy quark sector at LEP-I/SLD which are currently determined bythe combination procedure are:
• The ratios of the b and c quark partial widths of the Z to its total hadronic partial width:R0
b ≡ Γbb/Γhad and R0c ≡ Γcc/Γhad. (The symbols Rb, Rc are used to denote the experimentally
measured ratios of event rates or cross sections.)
• The forward-backward asymmetries, AbbFB and Acc
FB.
• The final state coupling parameters Ab, Ac obtained from the left-right-forward-backward asym-metry at SLD.
• The semileptonic branching ratios, BR(b → ℓ−), BR(b → c → ℓ+) and BR(c → ℓ+), and theaverage time-integrated B0B0 mixing parameter, χ. These are often determined at the sametime or with similar methods as the asymmetries. Including them in the combination greatlyreduces the errors. For example the measurements of χ act as an effective measurement of thecharge tagging efficiency, so that all errors coming from the mixture of different lepton sourcesin bb events cancel in the asymmetries.
• The probability that a c quark produces a D+, Ds, D∗+ meson1 or a charmed baryon. The prob-ability that a c quark fragments into a D0 is calculated from the constraint that the probabilitiesfor the weakly decaying charmed hadrons add up to one.
A full description of the averaging procedure is published in [3]; the main motivations for the procedureare outlined here. Several analyses measure more than one parameter simultaneously, for example the
1Actually the product P(c → D∗+) × BR(D∗+→ π+D0) is fitted because this quantity is needed and measured by
the LEP experiments.
14

asymmetry measurements with leptons or D mesons. Some of the measurements of electroweak pa-rameters depend explicitly on the values of other parameters, for example Rb depends on Rc. Thecommon tagging and analysis techniques lead to common sources of systematic uncertainty, in partic-ular for the double-tag measurements of Rb. The starting point for the combination is to ensure thatall the analyses use a common set of assumptions for input parameters which give rise to systematicuncertainties. The input parameters are updated and extended [23] to accommodate new analyses andmore recent measurements. The correlations and interdependencies of the input measurements arethen taken into account in a χ2 minimisation which results in the combined electroweak parametersand their correlation matrix.
5.2 Summary of Measurements and Averaging Procedure
All measurements are presented by the LEP and SLD collaborations in a consistent manner for thepurpose of combination. The tables prepared by the experiments include a detailed breakdown of thesystematic error of each measurement and its dependence on other electroweak parameters. Wherenecessary, the experiments apply small corrections to their results in order to use agreed values andranges for the input parameters to calculate systematic errors. The measurements, corrected wherenecessary, are summarised in Appendix A in Tables A.1–A.20, where the statistical and systematicerrors are quoted separately. The correlated systematic entries are from physics sources shared withone or more other results in the tables and are derived from the full breakdown of common systematicuncertainties. The uncorrelated systematic entries come from the remaining sources.
5.2.1 Averaging Procedure
A χ2 minimisation procedure is used to derive the values of the heavy-flavour electroweak parameters,following the procedure described in Reference 3. The full statistical and systematic covariance matrixfor all measurements is calculated. This correlation matrix takes into account correlations betweendifferent measurements of one experiment and between different experiments. The explicit dependenceof each measurement on the other parameters is also accounted for.
Since c-quark events form the main background in the Rb analyses, the value of Rb depends onthe value of Rc. If Rb and Rc are measured in the same analysis, this is reflected in the correlationmatrix for the results. However the analyses do not determine Rb and Rc simultaneously but insteadmeasure Rb for an assumed value of Rc. In this case the dependence is parameterised as
Rb = Rmeasb + a(Rc)
(Rc −Rusedc )
Rc. (5.1)
In this expression, Rmeasb is the result of the analysis assuming a value of Rc = Rused
c . The valuesof Rused
c and the coefficients a(Rc) are given in Table A.1 where appropriate. The dependence of allother measurements on other electroweak parameters is treated in the same way, with coefficients a(x)describing the dependence on parameter x.
5.2.2 Partial Width Measurements
The measurements of Rb and Rc fall into two categories. In the first, called a single-tag measurement,a method to select b or c events is devised, and the number of tagged events is counted. This number
15

must then be corrected for backgrounds from other flavours and for the tagging efficiency to calculatethe true fraction of hadronic Z decays of that flavour. The dominant systematic errors come fromunderstanding the branching ratios and detection efficiencies which give the overall tagging efficiency.For the second technique, called a double-tag measurement, each event is divided into two hemispheres.With Nt being the number of tagged hemispheres, Ntt the number of events with both hemispherestagged and Nhad the total number of hadronic Z decays one has
Nt
2Nhad= εbRb + εcRc + εuds(1 −Rb −Rc), (5.2)
Ntt
Nhad= Cbε2bRb + Ccε2cRc + Cudsε2uds(1 −Rb −Rc), (5.3)
where εb, εc and εuds are the tagging efficiencies per hemisphere for b, c and light-quark events, andCq 6= 1 accounts for the fact that the tagging efficiencies between the hemispheres may be correlated.In the case of Rb one has εb ≫ εc ≫ εuds, Cb ≈ 1. The correlations for the other flavours can beneglected. These equations can be solved to give Rb and εb. Neglecting the c and uds backgroundsand the correlations, they are approximately given by
εb ≈ 2Ntt/Nt, (5.4)
Rb ≈ N2t /(4NttNhad). (5.5)
The double-tagging method has the advantage that the b tagging efficiency is derived from the data,reducing the systematic error. The residual background of other flavours in the sample, and theevaluation of the correlation between the tagging efficiencies in the two hemispheres of the event arethe main sources of systematic uncertainty in such an analysis.
This method can be enhanced by including more tags. All additional efficiencies can be determinedfrom the data, reducing the statistical uncertainties without adding new systematic uncertainties.
Small corrections must be applied to the results to obtain the partial width ratios R0b and R0
c
from the cross section ratios Rb and Rc. These corrections depend slightly on the invariant masscutoff of the simulations used by the experiments; they are applied by the collaborations before thecombination.
The partial width measurements included are:
• Lifetime (and lepton) double-tag measurements for Rb from ALEPH [24], DELPHI [25], L3[26], OPAL [27] and SLD [28]. These are the most precise determinations of Rb. Since theycompletely dominate the combined result, no other Rb measurements are used at present. Thebasic features of the double-tag technique are discussed above. In the ALEPH, DELPHI, OPALand SLD measurements the charm rejection is enhanced by using the invariant mass information.DELPHI, OPAL and SLD also add kinematic information from the particles at the secondaryvertex. The ALEPH and DELPHI measurements make use of several different tags; this improvesthe statistical accuracy and reduces the systematic errors due to hemisphere correlations andcharm contamination, compared with the simple single/double tag.
• Analyses with D/D∗± mesons to measure Rc from ALEPH, DELPHI and OPAL. All mea-surements are constructed in such a way that no assumptions on the charm fragmentation arenecessary as these are determined from the LEP-I data. The available measurements can bedivided into three groups:
– inclusive/exclusive double tag (ALEPH [29], DELPHI [30, 31], OPAL [32]): In a first stepD∗± mesons are reconstructed in several decay channels and their production rate is mea-sured, which depends on the product Rc × P(c → D∗+) × BR(D∗+ → π+D0). This sample
16

of cc (and bb) events is then used to measure P(c → D∗+)×BR(D∗+ → π+D0) using a slowpion tag in the opposite hemisphere. In the ALEPH measurement Rc is unfolded internallyin the analysis so that no explicit P(c → D∗+) × BR(D∗+ → π+D0) is available.
– exclusive double tag (ALEPH [29]): This analysis uses exclusively reconstructed D∗+, D0
and D+ mesons in different decay channels. It has lower statistics but better purity thanthe inclusive analyses.
– reconstruction of all weakly decaying charmed states (ALEPH [33], DELPHI [31], OPAL[34]): These analyses make the assumption that the production fractions of D0, D+, Ds
and Λc in c-quark jets of cc events add up to one with small corrections due to unmeasuredcharm strange baryons. This is a single tag measurement, relying only on knowing thedecay branching ratios of the charm hadrons. These analyses are also used to measure thec hadron production ratios which are needed for the Rb analyses.
• A lifetime plus mass double tag from SLD to measureRc [35]. This analysis uses the same taggingalgorithm as the SLD Rb analysis, but with the neural net tuned to tag charm. Although thecharm tag has a purity of about 84%, most of the background is from b which can be measuredwith high precision from the b/c mixed tag rate.
• A measurement of Rc using single leptons assuming BR(c → ℓ+) from ALEPH [29].
To avoid effects from nonlinearities in the fit, for the inclusive/exclusive single/double tag and forthe charm-counting analyses, the products RcP(c → D∗+) × BR(D∗+ → π+D0), RcfD0 , RcfD+ , RcfDs
and RcfΛcthat are actually measured in the analyses are directly used as inputs to the fit. Themeasurements of the production rates of weakly decaying charmed hadrons, especially RcfDs andRcfΛc have substantial errors due to the uncertainties in the branching ratios of the decay mode used.Since these errors are relative, there is a potential bias towards lower measurements. To avoid thisbias, for the production rates of weakly decaying charmed hadrons the logarithm of the productionrates instead of the rates themselves are input to the fit. For RcfD0 and RcfD+ the difference betweenthe results using the logarithm or the value itself is negligible. For RcfDs and RcfΛc the difference inthe extracted value of Rc is about one tenth of a standard deviation.
5.2.3 Asymmetry Measurements
All b and c asymmetries given by the experiments correspond to full acceptance.
The QCD corrections to the forward-backward asymmetries depend strongly on the experimentalanalyses. For this reason the numbers given by the collaborations are also corrected for QCD effects.A detailed description of the procedure can be found in [36] with updates reported in [23].
For the 12- and 14-parameter fits described above, the LEP peak and off-peak asymmetries arecorrected to
√s = 91.26 GeV using the predicted dependence from ZFITTER [37]. The slope of the
asymmetry around mZ depends only on the axial coupling and the charge of the initial and final statefermions and is thus independent of the value of the asymmetry itself, i.e., the effective electroweakmixing angle.
After calculating the overall averages, the quark pole asymmetries A0, qFB , defined in terms of effective
couplings, are derived from the measured asymmetries by applying corrections as listed in Table 5.1.These corrections are due to the energy shift from 91.26 GeV to mZ, initial state radiation, γ exchangeand γ-Z interference. A very small correction due to the nonzero value of the b quark mass is includedin the last correction. All corrections are calculated using ZFITTER.
17

Source δAbFB δAc
FB√s = mZ −0.0013 −0.0034
QED corrections +0.0041 +0.0104γ, γ-Z, mass −0.0003 −0.0008
Total +0.0025 +0.0062
Table 5.1: Corrections to be applied to the quark asymmetries as A0FB = Ameas
FB + δAFB.
The SLD left-right-forward-backward asymmetries are also corrected for all radiative effects andare directly presented in terms of Ab and Ac.
The measurements used are:
• Measurements of AbbFB and Acc
FB using leptons from ALEPH [38], DELPHI [39], L3 [40] and
OPAL [41]. These analyses measure either AbbFB only from a high pt lepton sample or they obtain
AbbFB and Acc
FB from a fit to the lepton spectra. In the case of OPAL the lepton information iscombined with hadronic variables in a neural net. DELPHI uses in addition lifetime informationand jet-charge in the hemisphere opposite to the lepton to separate the different lepton sources.Some asymmetry analyses also measure χ.
• Measurements of AbbFB based on lifetime tagged events with a hemisphere charge measurement
from ALEPH [42], DELPHI [43, 44], L3 [45] and OPAL [46]. These measurements contributeroughly the same weight to the combined result as the lepton fits.
• Analyses with D mesons to measure AccFB from ALEPH [47] or Acc
FB and AbbFB from DELPHI [48]
and OPAL [49].
• Measurements of Ab and Ac from SLD. These results include measurements using lepton [50],D meson [51] and vertex mass plus hemisphere charge [52] tags, which have similar sources ofsystematic errors as the LEP asymmetry measurements. SLD also uses vertex mass for bottomor charm tagging in conjunction with a kaon tag or a vertex charge tag for both Ab and Ac
measurements [53–55].
5.2.4 Other Measurements
The measurements of the charmed hadron fractions P(c → D∗+) × BR(D∗+ → π+D0), f(D+), f(Ds)and f(cbaryon) are included in the Rc measurements and are described there.
ALEPH [56], DELPHI [57], L3 [26,58] and OPAL [59] measure BR(b → ℓ−), BR(b → c → ℓ+) andχ or a subset of them from a sample of leptons opposite to a b-tagged hemisphere and from a doublelepton sample. DELPHI [30] and OPAL [60] measure BR(c → ℓ+) from a sample opposite to a highenergy D∗±.
5.3 Results
In a first fit the asymmetry measurements on peak, above peak and below peak are corrected to threecommon centre-of-mass energies and are then combined at each energy point. The results of this fit,
18

including the SLD results, are given in Appendix B. The dependence of the average asymmetrieson centre-of-mass energy agrees with the prediction of the Standard Model, as shown in Figure 5.1.A second fit is made to derive the pole asymmetries A0, q
FB from the measured quark asymmetries, inwhich all the off-peak asymmetry measurements are corrected to the peak energy before combining.This fit determines a total of 14 parameters: the two partial widths, two LEP asymmetries, twocoupling parameters from SLD, three semileptonic branching ratios, the average mixing parameterand the probabilities for c quark to fragment into a D+, a Ds, a D∗+, or a charmed baryon. If theSLD measurements are excluded from the fit there are 12 parameters to be determined. Results forthe non-electroweak parameters are independent of the treatment of the off-peak asymmetries and theSLD data.
-0.1
0
0.1
0.2
89 90 91 92 93 94√s [GeV]
AF
B(√
s)
LEP
AFB
b
AFB
c
Figure 5.1: Measured asymmetries for b and c quark final states as a function of the centre-of-massenergy.
19

5.3.1 Results of the 12-Parameter Fit to the LEP Data
Using the full averaging procedure gives the following combined results for the electroweak parameters:
R0b = 0.21651 ± 0.00072 (5.6)
R0c = 0.1689 ± 0.0047
A0, bFB = 0.0990 ± 0.0017
A0, cFB = 0.0684 ± 0.0035 ,
where all corrections to the asymmetries and partial widths are applied. The χ2/d.o.f. is 44/(90−12).The corresponding correlation matrix is given in Table 5.2.
R0b R0
c A0, bFB A0, c
FB
R0b 1.00 −0.17 −0.09 0.02
R0c −0.17 1.00 0.07 −0.01
A0, bFB −0.09 0.07 1.00 0.15
A0, cFB 0.02 −0.01 0.15 1.00
Table 5.2: The correlation matrix for the four electroweak parameters from the 12-parameter fit.
5.3.2 Results of the 14-Parameter Fit to LEP and SLD Data
Including the SLD results for Rb, Rc, Ab and Ac into the fit the following results are obtained:
R0b = 0.21646 ± 0.00065 , (5.7)
R0c = 0.1719 ± 0.0031 ,
A0,bFB = 0.0990 ± 0.0017 ,
A0, cFB = 0.0685 ± 0.0034 ,
Ab = 0.922 ± 0.020 ,
Ac = 0.670 ± 0.026 ,
with a χ2/d.o.f. of 47/(99 − 14). The corresponding correlation matrix is given in Table 5.3 and thelargest errors for the electroweak parameters are listed in Table 5.4.
In deriving these results the parameters Ab and Ac are treated as independent of the forward-backward asymmetries A0, b
FB and A0, cFB (but see Section 12.1 for a joint analysis). In Figure 5.2 the
results for R0b and R0
c are shown compared with the Standard Model expectation.
Amongst the non-electroweak observables the B semileptonic branching fraction (BR(b → ℓ−) =0.1062 ± 0.0021) is of special interest. The dominant error source on this quantity is the dependenceon the semileptonic decay models b → ℓ−, c → ℓ+ with
∆BR(b → ℓ−)(b → ℓ− − modelling) = 0.0011. (5.8)
Extensive studies are made to understand the size of this error. Amongst the electroweak quantitiesthe quark asymmetries with leptons depend also on the assumptions on the decay model while theasymmetries using other methods usually do not. The fit implicitly requires that the different methods
20

R0b R0
c A0, bFB A0, c
FB Ab Ac
R0b 1.00 −0.14 −0.08 0.01 −0.08 0.04
R0c −0.14 1.00 0.04 −0.01 0.03 −0.05
A0, bFB −0.08 0.04 1.00 0.15 0.02 0.00
A0, cFB 0.01 −0.01 0.15 1.00 0.00 0.01
Ab −0.08 0.03 0.02 0.00 1.00 0.13Ac 0.04 −0.05 0.00 0.01 0.13 1.00
Table 5.3: The correlation matrix for the six electroweak parameters from the 14-parameter fit.
R0b R0
c A0, bFB A0, c
FB Ab Ac
(10−3) (10−3) (10−3) (10−3) (10−2) (10−2)
statistics 0.43 2.3 1.6 3.0 1.5 2.1internal systematics 0.29 1.4 0.6 1.4 1.2 1.5
QCD effects 0.18 0.1 0.3 0.1 0.3 0.2BR(D → neut.) 0.14 0.3 0 0 0 0
D decay multiplicity 0.13 0.3 0 0 0 0BR(D+ → K−π+π+) 0.09 0.2 0 0 0 0
BR(Ds → φπ+) 0.03 0.5 0 0 0 0BR(Λc →p K−π+) 0.06 0.5 0 0.1 0 0
D lifetimes 0.06 0.1 0 0.1 0 0gluon splitting 0.22 0.1 0.1 0.1 0.1 0.1c fragmentation 0.10 0.2 0.1 0.2 0.1 0.1
light quarks 0.07 0.2 0.1 0.1 0 0beam polarisation 0 0 0 0 0.5 0.4
total 0.65 3.1 1.7 3.5 2.0 2.6
Table 5.4: The dominant error sources for the electroweak parameters from the 14-parameter fit.
give consistent results. This effectively constrains the decay model and thus reduces the error fromthis source in the fit result for BR(b → ℓ−).
To get a conservative estimate of the modelling error in BR(b → ℓ−) the fit is repeated removingall asymmetry measurements. The result of this fit is
BR(b → ℓ−) = 0.1065 ± 0.0023 (5.9)
with
∆BR(b → ℓ−)(b → ℓ− − modelling) = 0.0014. (5.10)
21

0.16
0.17
0.18
0.19
0.214 0.216 0.218 0.22
R0b
R0 c
Preliminary
68% CL
95% CL
SM
Figure 5.2: Contours in the (R0b,R0
c) plane derived from the LEP+SLD data, corresponding to 68%and 95% confidence levels assuming Gaussian systematic errors. The Standard Model prediction formt = 174.3 ± 5.1 GeV is also shown. The arrow points in the direction of increasing values of mt.
22

Chapter 6
The Hadronic Charge Asymmetry 〈QFB〉
Updates with respect to summer 2000:
DELPHI and OPAL revert to their published result. While all results are now final, the combinationprocedure itself is still preliminary.
The LEP experiments ALEPH [61], DELPHI [62], L3 [45] and OPAL [63] provide measurements of thehadronic charge asymmetry based on the mean difference in jet charges measured in the forward andbackward event hemispheres, 〈QFB〉. DELPHI also provides a related measurement of the total chargeasymmetry by making a charge assignment on an event-by-event basis and performing a likelihoodfit [62]. The experimental values quoted for the average forward-backward charge difference, 〈QFB〉,cannot be directly compared as some of them include detector dependent effects such as acceptancesand efficiencies. Therefore the effective electroweak mixing angle, sin2 θlepteff , as defined in Section 12.3,is used as a means of combining the experimental results summarised in Table 6.1.
Experiment sin2 θlepteff
ALEPH (90-94), final 0.2322 ± 0.0008 ± 0.0011
DELPHI (91-91), final 0.2345 ± 0.0030 ± 0.0027
L3 (91-95), final 0.2327 ± 0.0012 ± 0.0013
OPAL (90-91), final 0.2326 ± 0.0012 ± 0.0029
LEP Average 0.2324 ± 0.0012
Table 6.1: Summary of the determination of sin2 θlepteff from inclusive hadronic charge asymmetriesat LEP. For each experiment, the first error is statistical and the second systematic. The latter,amounting to 0.0010 in the average, is dominated by fragmentation and decay modelling uncertainties.
The dominant source of systematic error arises from the modelling of the charge flow in thefragmentation process for each flavour. All experiments measure the required charge properties forZ → bb events from the data. ALEPH also determines the charm charge properties from the data.The fragmentation model implemented in the JETSET Monte Carlo program [64] is used by allexperiments as reference; the one of the HERWIG Monte Carlo program [65] is used for comparison.The JETSET fragmentation parameters are varied to estimate the systematic errors. The centralvalues chosen by the experiments for these parameters are, however, not the same. The smaller of thetwo fragmentation errors in any pair of results is treated as common to both. The present averageof sin2 θlepteff from 〈QFB〉 and its associated error are not very sensitive to the treatment of commonuncertainties. The ambiguities due to QCD corrections may cause changes in the derived value of
23

sin2 θlepteff . These are, however, well below the fragmentation uncertainties and experimental errors.The effect of fully correlating the estimated systematic uncertainties from this source between theexperiments has a negligible effect upon the average and its error.
There is also some correlation between these results and those for AbbFB using jet charges. The
dominant source of correlation is again through uncertainties in the fragmentation and decay modelsused. The typical correlation between the derived values of sin2 θlepteff from the 〈QFB〉 and the Abb
FB jetcharge measurements is estimated to be about 20% to 25%. This leads to only a small change in therelative weights for the Abb
FB and 〈QFB〉 results when averaging their sin2 θlepteff values (Section 12.3).
Thus, the correlation between 〈QFB〉 and AbbFB from jet charge has little impact on the overall Standard
Model fit, and is neglected at present.
24

Chapter 7
Photon-Pair Production at LEP-II
Updates with respect to summer 2000:
This is a new chapter. LEP results on photon-pair production are combined. These combinationresults became available after the summer conferences and were first presented at Siena, in October2001.
7.1 Introduction
The reaction e+e− → γγ(γ) provides a clean test of QED at LEP energies and is well suited to detectthe presence of non-standard physics. The differential QED cross-section at the Born level in therelativistic limit is given by:
(
dσ
dΩ
)
Born
=α2
s
1 + cos2 θ
1 − cos2 θ. (7.1)
Since the two final state particles are identical the polar angle θ is defined such that cos θ > 0.Various models with deviations from this cross-section will be discussed in section 7.4. Results onthe ≥2-photon final state using the high energy data collected by the four LEP collaborations arereported by the individual experiments [66]. Here the results of the LEP working group dedicated tothe combination of the e+e− → γγ(γ) measurements are reported. Results are given for the averagedtotal cross-section and for global fits to the differential cross-sections.
7.2 Event Selection
This channel is very clean and the event selection, which is similar for all experiments, is based on thepresence of at least two energetic clusters in the electromagnetic calorimeters. A minimum energy isrequired, typically (E1 + E2)/
√s larger than 0.3 to 0.6, where E1 and E2 are the energies of the two
most energetic photons. In order to remove e+e− events, charged tracks are in general not allowedexcept when they can be associated to a photon conversion in one hemisphere.
The polar angle is defined in order to minimise effects due to initial state radiation as
cos θ =
∣
∣
∣
∣
sin(θ1 − θ2
2)
∣
∣
∣
∣
/
sin(θ1 + θ2
2) ,
25

where θ1 and θ2 are the polar angles of the two most energetic photons. The acceptance in polar angleis in the range of 0.90 to 0.96 on | cos θ|, depending on the experiment.
With these criteria, the selection efficiencies are in the range of 68% to 95% and the residualbackground (from e+e− events and from e+e− → τ+τ− with τ± → e±νν) is very small, 0.1% to 1%.Detailed descriptions of the event selections performed by the four collaborations can be found in [66].
7.3 Total cross-section
The total cross-sections are combined using a χ2 minimisation. Given the different angular accep-tances, only the ratios of the measured cross-sections relative to the QED expectation r = σmeas/σQED
are averaged. Figure 7.1 shows the measured ratios ri,k of the experiments i at energies k with theirstatistical and systematic errors added in quadrature. Systematic errors are uncorrelated betweenexperiments as the error on the theory is not included in the experimental errors.
Denoting with ∆ the vector of residuals between the measurements and the expected ratios, threedifferent averages are performed:
1. per energy k = 1, . . . , 7: ∆i,k = ri,k − xk
2. per experiment i = 1, . . . , 4: ∆i,k = ri,k − yi
3. global value: ∆i,k = ri,k − z
The seven fit parameters per energy xk are shown in Figure 7.1 as LEP combined cross-sections.They are correlated with correlation coefficients ranging from 10% to 20%. The four fit-parametersper experiment yi are uncorrelated between each other, the results are given in Table 7.1 togetherwith the single global fit parameter z.
No significant deviations from the QED expectations are found. The global ratio is below unityby 1.5σ not accounting for the error on the radiative corrections (1%) which is of similar size as theexperimental error (1.2%).
Experiment cross-section ratio
ALEPH 0.963±0.025DELPHI 0.974±0.032L3 0.982±0.021OPAL 1.000±0.021
global 0.982±0.012
Table 7.1: Cross-section ratios r = σmeas/σQED for the four LEP experiments averaged over allenergies and the global average over all experiments and energies. The error includes the statisticaland experimental systematic error but no error from theory.
7.4 Global fit to the differential cross-sections
The global fit is based on angular distributions at energies between 183 and 207 GeV from the individ-ual experiments. As an example angular distributions from each experiment are shown in Figure 7.2.
26

0.8
0.9
1
1.1
1.2
180 185 190 195 200 205 210√s [GeV]
σ / σ
QE
D
ALEPH √s + 0.4 GeV
DELPHI √s + 0.2 GeV
L3 √s − 0.4 GeV
OPAL √s − 0.2 GeV
published preliminary
LEP preliminary
Sachs 9/2001
Figure 7.1: Cross-section ratios r = σmeas/σQED at different energies. The measurements of thesingle experiments are displaced by ± 200 or 400 MeV from the actual energy for clarity. Filledsymbols indicate published results, open symbols stand for preliminary numbers. The average overthe experiments at each energy is shown as a star. Measurements between 203 and 209 GeV areaveraged to one energy point. The theoretical error is not included in the experimental errors but isrepresented as the shaded band.
data used sys. error [%] |cosθ|published preliminary experimental theory
ALEPH 189 – 202 2 1 0.95DELPHI 189 – 202 206 2.5 1 0.90L3 183 – 189 192 – 207 2.1 1 0.96OPAL 183 – 189 192 – 207 1.1 1 0.90
Table 7.2: The data samples used for the global fit to the differential cross-sections, the systematicerrors, the assumed error on the theory and the polar angle acceptance for the LEP experiments.
Combined differential cross-sections are not available yet, since they need a common binning of thehistograms. All four experiments give preliminary results; DELPHI, L3 and OPAL include the wholeyear 2000 data-taking, as shown in Table 7.2. The systematic errors arise from the luminosity evalu-ation (including theory uncertainty on the small-angle Bhabha cross-section computation), from theselection efficiency and the background evaluations and from radiative corrections. The last contribu-tion, owing to the fact that the available e+e− → γγ(γ) cross-section calculation is based on O(α3)code, is assumed to be 1% and is considered correlated among energies and experiments.
Various model predictions are fitted to these angular distributions taking into account the experi-mental systematic error correlated between energies for each experiment and the error on the theory.A binned log likelihood fit is performed with one free parameter for the model and five fit parametersused to keep the normalisation free within the systematic errors of the theory and the four experiments.
The following models of new physics are considered. In some cases they give rise to identicaldistortions of the predictions; hence their parameters can be transformed into each other.
27

Cut-off parameter Λ± [67, 68]:(
dσ
dΩ
)
Λ±
=
(
dσ
dΩ
)
Born
± α2s
2Λ4±
(1 + cos2 θ) (7.2)
Effective Lagrangian theory [69] describing anomalous e+e−γ couplings in dimension 6 (Λ46 = 2
αΛ4±)
or contact interactions for dimensions 7 and 8 (Λ7 = Λ′; Λ48 = meΛ
37):
(
dσ
dΩ
)
Λ′
=
(
dσ
dΩ
)
Born
+s2
32π
1
Λ′6 (7.3)
Low scale gravity in extra dimensions [70], where Ms is related to the string scale and expected tobe of order O(TeV):
(
dσ
dΩ
)
Ms
=
(
dσ
dΩ
)
Born
− αs
2π
λ
M4s
(1 + cos2 θ) +s3
16π2λ2
M8s
(1 − cos4 θ) , λ = ±1 (7.4)
Excited electrons [71] with mass Me∗ and chiral magnetic coupling described by the Lagrangian
L =1
2Λℓ∗σµν
[
gfτ
2Wµν + g′f ′
Y
2Bµν
]
ℓL + h.c. , (7.5)
where g and g′ are the coupling constants of SU(2)L and U(1)Y , respectively. For the two photon finalstate this leads to the following cross-section:
(
dσ
dΩ
)
e∗=
(
dσ
dΩ
)
Born
+α2
4
f4γΛ4M2
e∗
[
p4
(p2 −M2e∗)2
+q4
(q2 −M2e∗)2
+12s
2 sin2 θ
(p2 −M2e∗)(q2 −M2
e∗)
]
, (7.6)
with fγ = −12(f + f ′), p2 = − s
2(1 − cos θ) and q2 = − s2(1 + cos θ) and Λ = Me∗ .
7.5 Fit Results
Where possible the fit parameters are chosen such that the likelihood function is approximately Gaus-sian. The preliminary results of the fits to the differential cross-sections are given in Table 7.3. Nosignificant deviations with respect to the QED expectations are found (all the parameters are compat-ible with zero) and therefore 95% confidence level limits are obtained by renormalising the probabilitydistribution of the fit parameter to the physically allowed region. For limits on fγ/Λ a scan overMe∗ is performed and presented in Figure 7.3. Only for Me∗ is the cross-section nonlinear in the fitparameter. The obtained negative log likelihood is shown in Figure 7.4 and the limit is determined at1.92 units above the minimum.
7.6 Conclusion
The LEP collaborations study the e+e− → γγ(γ) channel up to the highest available centre-of-massenergies. The total cross-section results are combined in terms of the ratios with respect to theQED expectations. No deviations are found. The differential cross-sections are fit following differentparametrisations from models predicting deviations from QED. No evidence for deviations is foundand therefore combined 95% confidence level limits are given.
28

0
200
400
600
0 0.1 0.2 0.3 0.4 0.5 0.6 0.7 0.8 0.9 1
|CosΘ*|
Ent
ries
/0.0
5
ALEPH PRELIMINARY
√ s = 189-202 GeV
0
1
2
3
4
5
0.1 0.2 0.3 0.4 0.5 0.6 0.7 0.8 0.9
data
Λ+=354 GeV
Λ-=324 GeV
DELPHI preliminary√s
eff = 205.9 GeV L = 214.3 pb-1
|cos θ*|dσ
0 /dΩ
(pb
/str
)
1
10
0 0.2 0.4 0.6 0.8 1|cos Θ|
dσ/
dΩ
(p
b/s
rad
)
L3√ s
− = 189 GeV
Data
Lowest Order QED
Λ+=321 GeV
Λ-=282 GeV
cos(θ∗ )
dσ ⁄
dΩ
[pb
⁄ sr]
30
60
100
300
600
1000
0.3
0.6
1
3
6
10
20
Eve
nts
OPAL
e+ e− γγ(γ)
189 GeV
0 0.2 0.4 0.6 0.8 1
Figure 7.2: Examples for angular distributions of the four LEP experiments. Points are the data andthe curves are the QED prediction (solid) and the individual fit results for Λ± (dashed). ALEPH showsthe uncorrected number of observed events, the expectation is presented as histogram. For OPAL thehistogram represents the number of observed events, before efficiency and radiative corrections areapplied.
29

Fit parameter Fit result 95% CL limit [GeV]
Λ+ > 365Λ−4±
(
4.6+27.0−26.5
)
· 10−12 GeV−4
Λ− > 379
Λ−67
(
0.18+1.95−1.92
)
· 10−18 GeV−6 Λ7 > 794
derived from Λ+ Λ6 > 1484
derived from Λ7 Λ8 > 22.5
λ = +1: Ms > 972λ/M4
s
(
−0.106+0.609−0.615
)
· 10−12 GeV−4
λ = −1: Ms > 940
f4γ (Me∗ = 200GeV) 0.036+0.414−0.400 fγ/Λ < 4.1 TeV−1
Table 7.3: The preliminary combined fit parameters and the 95% confidence level limits for the fourLEP experiments.
30

4
4.5
5
5.5
6
0.1 0.2 0.3 0.4 0.5 0.6Me* [TeV]
f/Λ
[TeV
-1]
LEP preliminary
f = f'Λ = Me*
excluded
Figure 7.3: 95% CL limits on fγ/Λ as a function of Me∗ . In the case of f = f ′ it follows that fγ = f .It is assumed that Λ = Me∗ .
0
0.5
1
1.5
2
2.5
3
3.5
4
0 50 100 150 200 250 300 350 400 450Me*
-4 [TeV-4]
∆Log
L
f = f' = 1Me* > 235 GeV
LEP preliminary
Figure 7.4: Log likelihood difference ∆LogL = − lnL + lnLmax as a function of M−4e∗ . The coupling
is fixed at f = f ′ = 1. The value corresponding to ∆LogL = 1.92 is Me∗ = 235 GeV.
31

Chapter 8
Fermion-Pair Production at LEP-II
Updates with respect to summer 2000:
Additional preliminary results based on the data collected in the year 2000 are included.
8.1 Introduction
Since the start of the LEP-II program LEP has delivered collisions at centre-of-mass energies from∼ 130 GeV to ∼ 209 GeV. The four LEP experiments make measurements of the e+e− → ff processesover this range of energies, and a preliminary combination of these data is discussed in this Chapter.
In the years 1995 to 1999 LEP delivered luminosity at a number of distinct centre-of-mass energypoints. In 2000 most of the luminosity was delivered close to 2 distinct energies, but there was also asignificant fraction of the luminosity delivered in, more-or-less, a continuum of energies. To facilitatethe combination of the measurements, the four LEP experiments all divided the data they collectedin 2000 into two energy bins: from 202.5 to 205.5 GeV; and 205.5 GeV and above. The nominal andactual centre-of-mass energies to which the LEP data are averaged for each year are given in Table 8.1.
A number of measurements on the process e+e− → ff exist and are combined. The preliminaryaverages of cross-section and forward-backward asymmetry measurements are discussed in Section8.2. The results presented in this section update those presented in [1,72–75]. Complete results of thecombinations are available on the web page [76]. In Section 8.3 a preliminary average of the differentialcross-section measurements, dσ
d cos θ , for the channels e+e− → µ+µ− and e+e− → τ+τ− is presented. In
Section 8.4 a preliminary combination of the heavy flavour results Rb, Rc, AbbFB and Acc
FB from LEP-IIis presented. In Section 8.5 the combined results are interpreted in terms of contact interactions andthe exchange of Z′ bosons. The results are summarised in section 8.6.
There are significant changes with respect to results presented in Summer 2000 [1, 73]:
• The method of combining the cross-sections and leptonic forward-backward asymmetries is im-proved.
• The combinations are updated using new data:
– updated preliminary cross-sections and leptonic forward-backward asymmetries for datataken at centre-of-mass energies of 205 and 207 GeV,
32

Year Nominal Energy Actual Energy LuminosityGeV GeV pb−1
1995 130 130.2 ∼ 3136 136.2 ∼ 3133∗ 133.2 ∼ 6
1996 161 161.3 ∼ 10172 172.1 ∼ 10167∗ 166.6 ∼ 20
1997 130 130.2 ∼ 2136 136.2 ∼ 2183 182.7 ∼ 50
1998 189 188.6 ∼ 170
1999 192 191.6 ∼ 30196 195.5 ∼ 80200 199.5 ∼ 80202 201.6 ∼ 40
2000 205 204.9 ∼ 80207 206.7 ∼ 140
Table 8.1: The nominal and actual centre-of-mass energies for data collected during LEP-II operationin each year. The approximate average luminosity analysed per experiment at each energy is alsoshown. Values marked with a ∗ are average energies for 1995 and 1996 used for heavy flavour results.The data taken at nominal energies of 130 and 136 in 1995 and 1997 are combined by most experiments.
– new preliminary differential cross-section results for µ+µ− and τ+τ− final states,
– new preliminary heavy-flavour results.
• The interpretations are updated due to the changes in combined LEP results.
8.2 Averages for Cross-sections and Asymmetries
In this section the results of the preliminary combination of cross-sections and asymmetries are given.The individual experiments’ analyses of cross-sections and forward-backward asymmetries are dis-cussed in [77]. The preliminary cross-section and leptonic forward-backward asymmetry results atcentre-of-mass energies of 205 and 207 GeV are updated with respect to [1, 73]. These are now ob-tained from analyses based on the full data set collected in 2000, improving the precision of themeasurements.
Cross-section results are combined for the e+e− → qq, e+e− → µ+µ− and e+e− → τ+τ− channels,forward-backward asymmetry measurements are combined for the µ+µ− and τ+τ− final states. AtLEP-II energies γ radiation is very important, leading in particular to a high rate for the radiativereturn to the Z. Events are classified according to the effective centre of mass energy,
√s′, measured
in different ways. The averages are made for the samples of events with high√s′, as discussed in the
following.
Individual experiments use their own ff signal definitions; corrections are applied to bring themeasurements to two common signal definitions:
33

• Definition 1:√s′ is taken to be the mass of the s-channel propagator, with the ff signal being
defined by the cut√
s′/s > 0.85. The effects of ISR-FSR photon interference is subtracted torender the propagator mass unambiguous.
• Definition 2: For dilepton events,√s′ is taken to be the bare invariant mass of the outgoing
difermion pair. For hadronic events, it is taken to be the mass of the s-channel propagator.In both cases, ISR-FSR photon interference is included and the signal is defined by the cut√
s′/s > 0.85. When calculating the contribution to the hadronic cross-section due to ISR-FSRinterference, since the propagator mass is ill-defined, it is replaced by the bare qq mass.
The measurement corrected to the common signal definition, Mcommon is computed from the experi-mental measurement Mexp,
Mcommon = Mexp + (Pcommon − Pexp),
where Pexp is the prediction for the measurement obtained for the experiments’ signal definition andPcommon is the prediction for the common signal definition. The predictions are computed with ZFIT-TER [78]. The theoretical uncertainties associated with the corrections are obtained by comparingZFITTER, TOPAZ0 v4.4 [79] and the Monte Carlo generator KK v4.02 [80]. The uncertainties areapproximately 0.2% for the hadronic cross-sections, 0.7% for dilepton cross-sections and 0.003 forthe leptonic asymmetries [75]. These uncertainties will be updated for the final analyses, taking intoaccount the results of Reference 81. These errors are not included in the combination. Results arepresented extrapolated to full 4π angular acceptance. Events containing additional fermion pairs fromradiative processes are considered to be signal, providing that the primary pair passes the cut on√
s′/s and that the secondary pair has a mass below 70 GeV.
The average is performed using the Best Linear Unbiased Estimator (BLUE) technique [82], whichis based on matrix algebra and which is equivalent to a χ2 minimisation. For the first time, allthe data, from centre-of-mass energies of 130 to 207 GeV are averaged together, taking into accountcorrelations between all LEP-II e+e− → ff measurements. Previously [1], the data were treatedas three independent subsamples at (130–189) GeV, (192–202) GeV and (205–207) GeV, ignoringcorrelations between the subsamples.
Particular care is taken to ensure that the correlations between the hadronic cross-sections arereasonably estimated. As in [1, 73] the errors are broken down into 5 categories
1) The statistical uncertainty plus uncorrelated systematic uncertainties, combined in quadrature.
2) The systematic uncertainty for the final state X which is fully correlated between energy pointsfor that experiment.
3) The systematic uncertainty for experiment Y which is fully correlated between different finalstates for this energy point but uncorrelated between energy points.
4) The systematic uncertainty for the final state X which is fully correlated between energy pointsand between different experiments.
5) The systematic uncertainty which is fully correlated between energy points and between differentexperiments for all final states.
In previous averages, uncertainties in the hadronic cross-sections arising from fragmentation modelsand modelling of ISR had been treated as uncorrelated between experiments. However, although
34

there are some differences between the models used and the methods of evaluating the errors, there aresignificant common elements in the estimation of these sources of uncertainty between the experiments.For the average reported here, these errors are treated as fully correlated between energy points andexperiments.
Table 8.2 gives the averaged cross-sections and forward-backward asymmetries for all energies forDefinition 1. The differences in the results obtained using Definition 2 are also given.
The χ2 per degree of freedom for the average of the LEP-II ff data is 170/180. The correlations arerather small, with the largest components at any given pair of energies being between the hadroniccross-sections. The other off-diagonal terms in the correlation matrix are smaller than 10%. Thecorrelation matrix between the averaged hadronic cross-sections at different centre-of-mass energies isgiven in Table 8.3.
Differences in the results with respect to previous combinations at centre-of-mass energies from130–202 GeV [1,73,74] arise mainly from the introduction of correlations between measurements whichwere previously taken to be uncorrelated, and the improved treatment of the correlations themselves.
Figures 8.1 and 8.2 show the LEP averaged cross-sections and asymmetries, respectively, as afunction of the centre-of-mass energy, together with the SM predictions. There is good agreementbetween the SM expectations and the measurements of the individual experiments and the combinedaverages. The measured cross-sections for hadronic final states at most of the energy points aresomewhat above the SM expectations. Taking into account the correlations between the data pointsand also assigning an error of ±0.26% [81] on the absolute SM predictions, the difference of the cross-section from the SM expectations averaged over all energies is approximately 1.8 standard deviations.It is concluded that there is no significant evidence in the results for physics beyond the SM in theprocess e+e− → ff.
35

√s Average
(GeV) Quantity value SM ∆
130 σ(qq) [pb] 82.124±2.232 82.803 -0.251σ(µ+µ−) [pb] 8.620±0.682 8.439 -0.331σ(τ+τ−) [pb] 9.036±0.930 8.435 -0.108Afb(µ+µ−) 0.693±0.060 0.705 0.012Afb(τ+τ−) 0.663±0.076 0.704 0.012
136 σ(qq) [pb] 66.724±1.974 66.596 -0.224σ(µ+µ−) [pb] 8.276±0.677 7.281 -0.280σ(τ+τ−) [pb] 7.086±0.820 7.279 -0.091Afb(µ+µ−) 0.707±0.060 0.684 0.013Afb(τ+τ−) 0.752±0.088 0.683 0.014
161 σ(qq) [pb] 37.014±1.074 35.247 -0.143σ(µ+µ−) [pb] 4.608±0.364 4.613 -0.178σ(τ+τ−) [pb] 5.673±0.545 4.613 -0.061Afb(µ+µ−) 0.537±0.067 0.609 0.017Afb(τ+τ−) 0.646±0.077 0.609 0.016
172 σ(qq) [pb] 29.262±0.989 28.738 -0.124σ(µ+µ−) [pb] 3.571±0.317 3.952 -0.157σ(τ+τ−) [pb] 4.013±0.450 3.951 -0.054Afb(µ+µ−) 0.674±0.077 0.591 0.018Afb(τ+τ−) 0.342±0.094 0.591 0.017
183 σ(qq) [pb] 24.609±0.426 24.200 -0.109σ(µ+µ−) [pb] 3.490±0.147 3.446 -0.139σ(τ+τ−) [pb] 3.375±0.174 3.446 -0.050Afb(µ+µ−) 0.559±0.035 0.576 0.018Afb(τ+τ−) 0.608±0.045 0.576 0.018
189 σ(qq) [pb] 22.446±0.257 22.156 -0.101σ(µ+µ−) [pb] 3.116±0.077 3.207 -0.131σ(τ+τ−) [pb] 3.121±0.099 3.207 -0.048Afb(µ+µ−) 0.566±0.021 0.569 0.019Afb(τ+τ−) 0.584±0.028 0.569 0.018
√s Average
(GeV) Quantity value SM ∆
192 σ(qq) [pb] 22.291±0.523 21.237 -0.098σ(µ+µ−) [pb] 2.943±0.175 3.097 -0.127σ(τ+τ−) [pb] 2.832±0.216 3.097 -0.047Afb(µ+µ−) 0.540±0.052 0.566 0.019Afb(τ+τ−) 0.614±0.070 0.566 0.019
196 σ(qq) [pb] 20.729±0.338 20.127 -0.094σ(µ+µ−) [pb] 2.967±0.106 2.962 -0.123σ(τ+τ−) [pb] 2.984±0.138 2.962 -0.045Afb(µ+µ−) 0.580±0.031 0.562 0.019Afb(τ+τ−) 0.493±0.045 0.562 0.019
200 σ(qq) [pb] 19.372±0.319 19.085 -0.090σ(µ+µ−) [pb] 3.040±0.104 2.834 -0.118σ(τ+τ−) [pb] 2.966±0.134 2.833 -0.044Afb(µ+µ−) 0.518±0.031 0.558 0.019Afb(τ+τ−) 0.549±0.043 0.558 0.019
202 σ(qq) [pb] 19.278±0.430 18.572 -0.088σ(µ+µ−) [pb] 2.621±0.139 2.770 -0.116σ(τ+τ−) [pb] 2.777±0.183 2.769 -0.044Afb(µ+µ−) 0.543±0.048 0.556 0.020Afb(τ+τ−) 0.583±0.060 0.556 0.019
205 σ(qq) [pb] 18.119±0.316 17.811 -0.085σ(µ+µ−) [pb] 2.449±0.100 2.674 -0.112σ(τ+τ−) [pb] 2.705±0.129 2.673 -0.042Afb(µ+µ−) 0.558±0.036 0.553 0.020Afb(τ+τ−) 0.565±0.044 0.553 0.019
207 σ(qq) [pb] 17.423±0.263 17.418 -0.083σ(µ+µ−) [pb] 2.613±0.088 2.623 -0.111σ(τ+τ−) [pb] 2.528±0.108 2.623 -0.042Afb(µ+µ−) 0.540±0.029 0.552 0.020Afb(τ+τ−) 0.561±0.038 0.551 0.019
Tab
le8.2:
Prelim
inary
comb
ined
LE
Presu
ltsfor
e+
e −→
ff.A
llth
eresu
ltscorresp
ond
toth
esign
alD
efin
ition1.
Th
eS
tand
ardM
od
elp
rediction
sare
fromZ
FIT
TE
R[78].
Th
ed
ifferen
ce,∆
,in
the
averagesfor
the
measu
remen
tsfor
Defi
nition
2relative
toD
efin
ition1
aregiven
inth
efi
nal
colum
n.
Th
equ
otedu
ncertain
tiesd
on
otin
clud
eth
eth
eoreticalu
ncertain
tieson
the
corrections
discu
ssedin
the
text.
36

√s
GeV) 130 136 161 172 183 189 192 196 200 202 205 207
130 1.000 0.075 0.085 0.076 0.121 0.151 0.084 0.116 0.131 0.091 0.137 0.160136 1.000 0.079 0.071 0.112 0.140 0.078 0.107 0.121 0.084 0.127 0.148161 1.000 0.082 0.128 0.162 0.089 0.123 0.139 0.097 0.144 0.167172 1.000 0.114 0.145 0.080 0.110 0.125 0.087 0.130 0.150183 1.000 0.237 0.130 0.179 0.203 0.139 0.208 0.242189 1.000 0.173 0.236 0.270 0.184 0.266 0.307192 1.000 0.136 0.156 0.106 0.151 0.173196 1.000 0.212 0.145 0.207 0.238200 1.000 0.166 0.236 0.271202 1.000 0.162 0.185205 1.000 0.282207 1.000
Tab
le8.3:
Th
ecorrelation
coeffi
cients
betw
eenaveraged
had
ronic
cross-sections
atd
ifferen
ten
ergies.
37

Cro
ss s
ectio
n (p
b)
√s
´/s
> 0.85
e+e−→hadrons(γ)e+e−→µ+µ−(γ)e+e−→τ+τ−(γ)
LEPpreliminary
√s
(GeV)
σ mea
s/σ S
M
1
10
10 2
0.8
0.9
1
1.1
1.2
120 140 160 180 200 220
Figure 8.1: Preliminary combined LEP results on the cross-sections for qq, µ+µ− and τ+τ− final states,as a function of centre-of-mass energy. The expectations of the SM, computed with ZFITTER [78],are shown as curves. The lower plot shows the ratio of the data divided by the SM.
38

For
war
d-B
ackw
ard
Asy
mm
etry √s
´/s
> 0.85
e+e−→µ+µ−(γ)e+e−→τ+τ−(γ)
LEPpreliminary
√s
(GeV)
AF
B
mea
s -AF
B
SM
0
0.2
0.4
0.6
0.8
1
-0.2
0
0.2
120 140 160 180 200 220
Figure 8.2: Preliminary combined LEP results on the forward-backward asymmetry for µ+µ− andτ+τ− final states as a function of centre-of-mass energy. The expectations of the SM computed withZFITTER [78], are shown as curves. The lower plot shows differences between the data and the SM.
39

8.3 Averages for Differential Cross-sections
The LEP experiments measure the differential cross-section, dσd cos θ , for the e+e− → µ+µ− and e+e− →
τ+τ− channels for samples of events with√
s′/s > 0.85. A preliminary combination of these resultsis made using a χ2 fit to the measured differential cross sections, using the expected error on thedifferential cross sections, computed from the expected cross sections and the expected numbers ofevents in each experiment. Using a Monte Carlo simulation it is shown that this method provides agood approximation to the exact likelihood method based on Poisson statistics [73].
The combination included data from 183 to 207 GeV, but not all experiments provided mea-surements at all energies. Since [1, 73], new, preliminary, results for centre-of-mass energies of 205and 207 GeV are made available by all experiments. In addition, new, preliminary, results fore+e− → µ+µ− at energies from 192–202 GeV from L3 are made available. The data used in thecombination are summarised in Table 8.4.
Each experiments’ data are binned in 10 bins of cos θ at each energy, using their own signaldefinition. The scattering angle, θ, is the angle of the negative lepton with respect to the incomingelectron direction in the lab coordinate system. The outer acceptances of the most forward and mostbackward bins for which the four experiments present their data are different. This is accounted for aspart of the correction to a common signal definition. The ranges in cos θ for the measurements of theindividual experiments and the average are given in Table 8.5. The signal definition used correspondedto Definition 1 of Section 8.2.
Correlated small systematic errors between different experiments, channels and energies, arisingfrom uncertainties on the overall normalisation are considered in the averaging procedure.
Three separate averages are performed; one for 183 and 189 GeV data, one for 192–202 GeV dataand for 205 and 207 GeV data. The averages for the 183–189 data set are not updated with respectto [1, 73]. The results of the averages are shown in Figures 8.3 and 8.4.
The correlations between bins in the average are less than 2% of the total error on the averagesin each bin. The overall agreement between the averaged data and the predictions is reasonable, witha χ2 of 191 for 160 degrees of freedom. At 202 GeV the cross-section in the most backward bin,−1.0 < cos θ < −0.8, for both muon and tau final states is above the predictions. For the muonsthe excess in the data corresponds to 3.4 standard deviations. For the taus the excess is 2.3 standarddeviations, however, for this measurement the individual experiments are somewhat inconsistent,having a χ2 with respect to the average of 10.5 for 2 degrees of freedom. The data at 202 GeV sufferfrom rather low delivered luminosity, with fewer than four events expected in each experiment in eachchannel in this backward cos θ bin. The agreement between the data and the predictions in the samecos θ bin is better at higher energies.
40

Preliminary LEP Averaged dσ/dcosθ (µµ)
183 GeV
cosθµ
dσ/d
cosθ
(pb
)
189 GeV
cosθµ
dσ/d
cosθ
(pb
)192 GeV
cosθµ
dσ/d
cosθ
(pb
)
196 GeV
cosθµ
dσ/d
cosθ
(pb
)
200 GeV
cosθµ
dσ/d
cosθ
(pb
)
202 GeV
cosθµ
dσ/d
cosθ
(pb
)
205 GeV
cosθµ
dσ/d
cosθ
(pb
)
207 GeV
cosθµ
dσ/d
cosθ
(pb
)
0
2
4
-1 -0.5 0 0.5 10
1
2
3
4
-1 -0.5 0 0.5 1
0
1
2
3
4
-1 -0.5 0 0.5 10
1
2
3
4
-1 -0.5 0 0.5 1
0
1
2
3
4
-1 -0.5 0 0.5 10
1
2
3
-1 -0.5 0 0.5 1
0
1
2
3
-1 -0.5 0 0.5 10
1
2
3
-1 -0.5 0 0.5 1
Figure 8.3: LEP averaged differential cross-sections for e+e− → µ+µ− at energies of 183–207 GeV.The SM predictions, shown as solid histograms, are computed with ZFITTER [78].
41

Preliminary LEP Averaged dσ/dcosθ (ττ)
183 GeV
cosθτ
dσ/d
cosθ
(pb
)
189 GeV
cosθτ
dσ/d
cosθ
(pb
)192 GeV
cosθτ
dσ/d
cosθ
(pb
)
196 GeV
cosθτ
dσ/d
cosθ
(pb
)
200 GeV
cosθτ
dσ/d
cosθ
(pb
)
202 GeV
cosθτ
dσ/d
cosθ
(pb
)
205 GeV
cosθτ
dσ/d
cosθ
(pb
)
207 GeV
cosθτ
dσ/d
cosθ
(pb
)
0
2
4
6
-1 -0.5 0 0.5 10
1
2
3
4
-1 -0.5 0 0.5 1
0
1
2
3
4
-1 -0.5 0 0.5 10
2
4
-1 -0.5 0 0.5 1
0
2
4
-1 -0.5 0 0.5 10
1
2
3
-1 -0.5 0 0.5 1
0
1
2
3
4
-1 -0.5 0 0.5 10
1
2
3
-1 -0.5 0 0.5 1
Figure 8.4: LEP averaged differential cross-sections for e+e− → τ+τ− at energies of 183–207 GeV.The SM predictions, shown as solid histograms, are computed with ZFITTER [78].
42

e+e− → µ+µ− e+e− → τ+τ−√s(GeV) A D L O A D L O
183 - F - F - F - F
189 P F F F P F F F
192–202 P P P P P P - P
205–207 P P P P P P - P
Table 8.4: Differential cross-section data provided by the LEP collaborations (ALEPH, DELPHI, L3and OPAL) for e+e− → µ+µ− and e+e− → τ+τ− combination at different centre-of-mass energies.Data indicated with F are final, published data. Data marked with P are preliminary. Data markedwith a - are not available for combination.
Experiment cos θmin cos θmax
ALEPH −0.95 0.95DELPHI (e+e− → µ+µ− 183) −0.94 0.94DELPHI (e+e− → µ+µ− 189–207) −0.97 0.97DELPHI (e+e− → τ+τ−) −0.96 0.96L3 −0.90 0.90OPAL −1.00 1.00
Average −1.00 1.00
Table 8.5: The acceptances for which experimental data are presented and the acceptance for theLEP average. For DELPHI the acceptance is shown for the different channels and for the muons fordifferent centre of mass energies. For all other experiments the acceptance is the same for muon andtau-lepton channels and for all energies provided.
43

8.4 Averages for Heavy Flavour Measurements
This section presents a preliminary combination of both published [83] and preliminary [84] measure-
ments of the ratios1 Rb and Rc and the forward-backward asymmetries, AbbFB and Acc
FB, from the LEPcollaborations at centre-of-mass energies in the range of 130 to 207 GeV. The averages are updatedwith respect to [1, 73]. New preliminary results from DELPHI and L3 at centre-of-mass energies of205 and 207 GeV, based on analyses of the full 2000 data sets, are also included. New, preliminary,results from ALEPH at lower energies are also combined. Table 8.6 summarises all the inputs thatare combined.
A common signal definition is defined for all the measurements, requiring:
• an effective centre-of-mass energy√s′ > 0.85
√s
• the inclusion of ISR and FSR photon interference contribution and• extrapolation to full angular acceptance.
Systematic errors are divided into three categories: uncorrelated errors, errors correlated between themeasurements of each experiment, and errors common to all experiments. Full details concerning thecombination procedure can be found in [85].
The results of the combination are presented in Table 8.7 and Figures 8.5 and 8.6. The results areconsistent with the Standard Model predictions of ZFITTER.
Because of the large correlation (-0.36) with Rc at 183 GeV and 189 GeV, the errors on thecorresponding measurements of Rb receive an additional contribution which is absent at the otherenergy points. For other energies where there is no measurement of Rc, the Standard Model valueof Rc is used in extracting Rb (the error on the Standard Model prediction of Rc is estimated to benegligible compared to the other uncertainties on Rb).
A list of the error contributions from the combination at 189 GeV is shown in Table 8.8.
√s (GeV) Rb Rc Abb
FB AccFB
A D L O A D L O A D L O A D L O
133 F F F F - - - - - F - F - F - F
167 F F F F - - - - - F - F - F - F
183 F P F F F - - - F - - F P - - F
189 P P F F P - - - P P F F P - - F
192 to 202 P P P - - - - - P P - - - - - -
205 and 207 - P P - - - - - - P - - - - - -
Table 8.6: Data provided by the ALEPH, DELPHI, L3, OPAL collaborations for combination atdifferent centre-of-mass energies. Data indicated with F are final, published data. Data marked withP are preliminary. Data marked with a - are not supplied for combination.
1Unlike at LEP-I, R0q is defined as
σqq
σhad.
44

0.14
0.16
0.18
0.2
0.22
0.24
0.26
80 100 120 140 160 180 200√s (GeV)
Rb
Rb
LEP preliminary
√s’/√s > 0.1 , 0.85
0.14
0.16
0.18
0.2
0.22
0.24
0.26
0.28
0.3
0.32
80 100 120 140 160 180 200√s (GeV)
Rc
Rc
LEP preliminary
√s’/√s > 0.1 , 0.85
Figure 8.5: Preliminary combined LEP measurements of Rb and Rc. Solid lines represent the StandardModel prediction for the signal definition and dotted lines the inclusive prediction. Both are computedwith ZFITTER[86]. The LEP-I measurements are taken from [87].
45

-0.2
0
0.2
0.4
0.6
0.8
1
80 100 120 140 160 180 200√s (GeV)
b-A
sym
met
ry
Ab FB
LEP preliminary
√s’/√s > 0.1 , 0.85
-0.2
0
0.2
0.4
0.6
0.8
1
1.2
80 100 120 140 160 180 200√s (GeV)
c-A
sym
met
ry
Ac FB
LEP preliminary
√s’/√s > 0.1 , 0.85
Figure 8.6: Preliminary combined LEP measurements of the forward–backward asymmetries AbbFB and
AccFB. Solid lines represent the Standard Model prediction for the signal definition and dotted lines
the inclusive prediction. Both are computed with ZFITTER [86]. The LEP-I measurements are takenfrom [87].
46
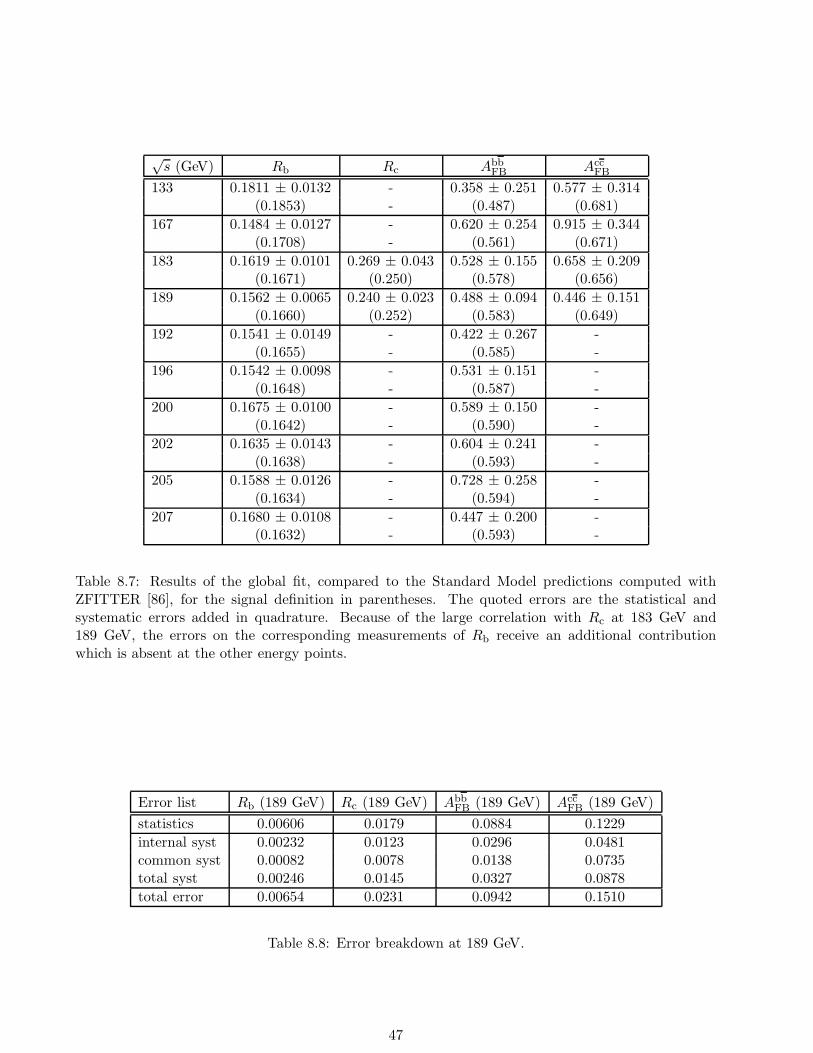
√s (GeV) Rb Rc Abb
FB AccFB
133 0.1811 ± 0.0132 - 0.358 ± 0.251 0.577 ± 0.314(0.1853) - (0.487) (0.681)
167 0.1484 ± 0.0127 - 0.620 ± 0.254 0.915 ± 0.344(0.1708) - (0.561) (0.671)
183 0.1619 ± 0.0101 0.269 ± 0.043 0.528 ± 0.155 0.658 ± 0.209(0.1671) (0.250) (0.578) (0.656)
189 0.1562 ± 0.0065 0.240 ± 0.023 0.488 ± 0.094 0.446 ± 0.151(0.1660) (0.252) (0.583) (0.649)
192 0.1541 ± 0.0149 - 0.422 ± 0.267 -(0.1655) - (0.585) -
196 0.1542 ± 0.0098 - 0.531 ± 0.151 -(0.1648) - (0.587) -
200 0.1675 ± 0.0100 - 0.589 ± 0.150 -(0.1642) - (0.590) -
202 0.1635 ± 0.0143 - 0.604 ± 0.241 -(0.1638) - (0.593) -
205 0.1588 ± 0.0126 - 0.728 ± 0.258 -(0.1634) - (0.594) -
207 0.1680 ± 0.0108 - 0.447 ± 0.200 -(0.1632) - (0.593) -
Table 8.7: Results of the global fit, compared to the Standard Model predictions computed withZFITTER [86], for the signal definition in parentheses. The quoted errors are the statistical andsystematic errors added in quadrature. Because of the large correlation with Rc at 183 GeV and189 GeV, the errors on the corresponding measurements of Rb receive an additional contributionwhich is absent at the other energy points.
Error list Rb (189 GeV) Rc (189 GeV) AbbFB (189 GeV) Acc
FB (189 GeV)
statistics 0.00606 0.0179 0.0884 0.1229
internal syst 0.00232 0.0123 0.0296 0.0481common syst 0.00082 0.0078 0.0138 0.0735total syst 0.00246 0.0145 0.0327 0.0878
total error 0.00654 0.0231 0.0942 0.1510
Table 8.8: Error breakdown at 189 GeV.
47

8.5 Interpretation
The combined cross-sections and asymmetries and results on heavy flavour production are interpretedin a variety of models. The cross-section and asymmetry results are used to place limits on the massof a possible additional heavy neutral boson, Z′, in several models. Limits on contact interactionsbetween leptons and on contact interaction between electrons and b and c quarks are obtained. Theseresults are of particular interest since they are inaccessible to pp or ep colliders. The results updatethose provided in [1, 73].
8.5.1 Models with Z′ Bosons
The combined hadronic and leptonic cross-sections and the leptonic forward-backward asymmetriesare used to fit the data to models including an additional, heavy, neutral boson, Z′. The results areupdated with respect to those given in [1, 73] due to the updated cross-section and leptonic forward-backward asymmetry results.
Fits are made to the mass of a Z′, MZ′ , for 4 different models referred to as χ, ψ, η and L-R [88]and for the Sequential Standard Model [89], which proposes the existence of a Z′ with exactly thesame coupling to fermions as the standard Z. The LEP-II data alone does not significantly constrainthe mixing angle between the Z and Z′ fields, ΘZZ′ . However, results from a single experiment inwhich LEP-I data is used in the fit show that the mixing is consistent with zero (see for example [90],giving limits of 30 mrad or less depending on model). So for these fits ΘZZ
′ is fixed to zero.
No significant evidence is found for the existence of a Z′ boson in any of the models. 95% confidencelevel lower limits on MZ′ are obtained, by integrating the likelihood function2. The lower limits onthe Z′ mass are shown in Table 8.9.
Model χ ψ η L-R SSM
MlimitZ′ (GeV) 678 463 436 800 1890
Table 8.9: The 95% confidence level lower limits on the Z′ mass and χ, ψ, η, L-R and SSM models.
8.5.2 Contact Interactions between Leptons
The averages of cross-sections and forward-backward asymmetries for muon-pair and tau-lepton pairfinal states are used to search for contact interactions between leptons. The results are updatedwith respect to those given in [1, 73] due to the updated cross-section and leptonic forward-backwardasymmetry results.
Following [91], contact interactions are parameterised by an effective Lagrangian, Leff , which isadded to the Standard Model Lagrangian and has the form:
Leff =g2
(1 + δ)Λ2
∑
i,j=L,R
ηijeiγµeif jγµfj,
2To be able to obtain confidence limits from the likelihood function it is necessary to convert the likelihood to aprobability density function; this is done by multiplying by a prior probability function. Simply integrating the likelihoodis equivalent to multiplying by a uniform prior probability function.
48

where g2/4π is taken to be 1 by convention, δ = 1(0) for f = e (f 6= e), ηij = ±1 or 0, Λ is the scaleof the contact interactions, ei and fj are left or right-handed spinors. By assuming different helicitycoupling between the initial state and final state currents, a set of different models can be definedfrom this Lagrangian [92], with either constructive (+) or destructive (−) interference between theStandard Model process and the contact interactions. The models and corresponding choices of ηijare given in Table 8.10. The models LL, RR, VV, AA, LR, RL, V0, A0 are considered here since thesemodels lead to large deviations in the e+e− → µ+µ− and e+e− → τ+τ− channels. The total hadroniccross section on its own does not allow stringent limits to be placed on contact interactions involvingquarks.
For the purpose of fitting contact interaction models to the data, a new parameter ǫ = 1/Λ2
is defined; ǫ = 0 in the limit that there are no contact interactions. This parameter is allowed totake both positive and negative values in the fits. Theoretical uncertainties on the Standard Modelpredictions are taken from [81], see above.
The values of ǫ extracted for each model are all compatible with the Standard Model expectationǫ = 0, at the two standard deviation level. These errors on ǫ are typically a factor of two smallerthan those obtained from a single LEP experiment with the same data set. The fitted values of ǫare converted into 95% confidence level lower limits on Λ. The limits are obtained by integrating thelikelihood function over the physically allowed values, ǫ ≥ 0 for each Λ+ limit and ǫ ≤ 0 for Λ− limits.The fitted values of ǫ and the extracted limits are shown in Table 8.11. Figure 8.7 shows the limitsobtained on the scale Λ for the different models assuming universality between contact interactionsfor e+e− → µ+µ− and e+e− → τ+τ−.
Model ηLL ηRR ηLR ηRL
LL± ±1 0 0 0
RR± 0 ±1 0 0
VV± ±1 ±1 ±1 ±1
AA± ±1 ±1 ∓1 ∓1
LR± 0 0 ±1 0
RL± 0 0 0 ±1
V0± ±1 ±1 0 0
A0± 0 0 ±1 ±1
Table 8.10: Choices of ηij for different contact interaction models.
8.5.3 Contact Interactions from Heavy Flavour Averages
Limits on contact interactions between electrons and b and c quarks are obtained. The formalismfor describing contact interactions including heavy flavours is identical to that described above forleptons.
All heavy flavour LEP-II combined results from 133 to 207 GeV given in Table 8.7 are used asinputs. For the purpose of fitting contact interaction models to the data, Rb and Rc are converted tocross sections σbb and σcc using the averaged qq cross section of section 8.2 corresponding to signalDefinition 2. In the calculation of errors, the correlations between Rb, Rc and σqq are assumed to benegligible.
49

e+e− → µ+µ−
Model ǫ (TeV−2) Λ−(TeV) Λ+(TeV)
LL -0.0056+0.0042−0.0037 8.8 14.4
RR -0.0060+0.0051−0.0046 8.4 13.8
VV -0.0014+0.0016−0.0012 15.5 22.2
AA -0.0025+0.0018−0.0023 12.1 20.1
LR 0.0014+0.0043−0.0074 7.4 9.3
RL 0.0014+0.0043−0.0074 7.4 9.3
V0 -0.0036+0.0032−0.0013 12.2 19.9
A0 0.0008+0.0020−0.0031 12.7 13.0
e+e− → τ+τ−
Model ǫ (TeV−2) Λ−(TeV) Λ+(TeV)
LL -0.0033+0.0056−0.0050 8.9 11.4
RR -0.0036+0.0061−0.0056 8.4 10.9
VV -0.0012+0.0017−0.0020 14.0 19.1
AA -0.0004+0.0025−0.0027 13.1 14.2
LR -0.0053+0.0079−0.2210 2.1 9.2
RL -0.0053+0.0079−0.2210 2.1 9.2
V0 -0.0011+0.0023−0.0033 12.3 15.7
A0 -0.0028+0.0041−0.0043 9.3 12.9
e+e− → ℓ+ℓ−
Model ǫ (TeV−2) Λ−(TeV) Λ+(TeV)
LL -0.0042+0.0027−0.0028 9.8 16.5
RR -0.0046+0.0037−0.0034 9.4 15.8
VV -0.0014+0.0012−0.0012 16.5 26.2
AA -0.0018+0.0016−0.0019 14.0 21.7
LR -0.0023+0.0051−0.0045 8.5 11.2
RL -0.0023+0.0051−0.0045 8.5 11.2
V0 -0.0020+0.0016−0.0019 13.5 22.9
A0 -0.0011+0.0025−0.0023 13.2 15.6
Table 8.11: Fitted values of ǫ and 95% confidence limits on the scale, Λ, for constructive (+) anddestructive interference (−) with the Standard Model, for the contact interaction models discussed inthe text. Results are given for e+e− → µ+µ−, e+e− → τ+τ− and e+e− → ℓ+ℓ−, assuming universalityin the contact interactions between e+e− → µ+µ− and e+e− → τ+τ−.
The results are updated with respect to those given in [1, 73] due to the updated hadronic cross-sections and heavy flavour results. No evidence for contact interactions between electrons and b andc is found. The fitted values of ǫ and their 68% confidence level uncertainties together with the 95%confidence level lower limit on Λ are shown in Table 8.12. Figure 8.8 shows the limits obtained on thescale, Λ, of models with different helicity combinations involved in the interactions.
50

Preliminary LEP Combined
Λ- (TeV) Λ+ (TeV)
LL 9.8 16.5
RR 9.4 15.8
VV 16.5 26.2
AA 14.0 21.7
LR 8.5 11.2
RL 8.5 11.2
V0 13.5 22.9
A0 13.2 15.6
Λ- Λ+
l+l- 30. 0 30.
Figure 8.7: The 95% CL exclusion limits on Λ for e+e− → ℓ+ℓ− assuming universality in the contactinteractions between e+e− → µ+µ− and e+e− → τ+τ−.
8.6 Summary
A preliminary combination of the LEP-II e+e− → ff cross-sections (for hadron, muon and tau finalstates) and forward-backward asymmetries (for muon and tau final states) from LEP running atenergies from 130 to 207 GeV is made. The results from the four LEP experiments are in goodagreement with each other.
The averages for all energies are shown in Table 8.2. Overall the data agree with the StandardModel predictions of ZFITTER. Preliminary differential cross-sections, dσ
d cos θ , for e+e− → µ+µ− ande+e− → τ+τ− are combined. Results are shown in Figures 8.3 and 8.4. A preliminary average ofresults on heavy flavour production at LEP-II is also made for measurements of Rb, Rc, A
bbFB and
AccFB, using results from LEP centre-of-mass energies from 130 to 207 GeV. Results are given in
Table 8.7 and shown graphically in Figures 8.5 and 8.6. The results are in good agreement with thepredictions of the SM.
The preliminary averaged cross-section and forward-backward asymmetry results together withthe combined results on heavy flavour production are interpreted in a variety of models. The LEP-IIaveraged cross-sections and lepton asymmetries are used to obtain lower limits on the mass of a
51

Figure 8.8: The 95% CL exclusion limits on the scale of Contact Interactions in e+e− → bb ande+e− → cc using Heavy Flavour LEP combined results from 133 to 207 GeV.
52

e+e− → bb
Model ǫ (TeV−2) Λ−(TeV) Λ+(TeV)
LL -0.0030+0.0045−0.0047 9.3 11.8
RR -0.1755+0.1634−0.0159 2.2 7.7
VV -0.0029+0.0038−0.0040 10.0 13.3
AA -0.0018+0.0029−0.0031 11.6 14.6
LR -0.0491+0.0555−0.0384 3.1 5.5
RL 0.0065+0.1409−0.0149 7.0 2.5
V0 -0.0021+0.0032−0.0034 11.0 13.9
A0 0.0305+0.0203−0.0348 6.4 4.0
e+e− → cc
Model ǫ (TeV−2) Λ−(TeV) Λ+(TeV)
LL 0.0146+0.5911−0.0259 5.3 1.3
RR 0.0492+0.3723−0.0568 4.6 1.5
VV 0.0008+0.0106−0.0100 7.4 6.7
AA 0.0081+0.0171−0.0154 6.6 5.0
LR 0.0913+0.1076−0.1251 3.5 2.1
RL 0.0145+0.0872−0.0872 2.9 2.6
V0 0.0047+0.0170−0.0133 6.9 1.4
A0 0.0524+0.0736−0.0780 4.0 2.6
Table 8.12: Fitted values of ǫ and 95% confidence limits on the scale, Λ, for constructive (+) anddestructive interference (−) with the Standard Model, for the contact interaction models discussed inthe text. From combined bb and cc results with centre of mass energies from 133 to 207 GeV.
possible Z′ boson in different models. Limits range from 436 to 1890 GeV depending on the model.Limits on the scale of contact interactions between leptons and also between electrons and bb and ccfinal states are determined. A full set of limits are given in Tables 8.11 and 8.12.
53

Chapter 9
W and Four-Fermion Production at LEP-II
Updates with respect to summer 2000:
New preliminary results are presented for W-pair, Z-pair and single W production, based on the fulldata sample collected in the year 2000 between 202 and 209 GeV. Improved procedures are used forthe combination of W-pair cross sections and W decay branching fractions. New averages of the Z-pairand single W cross sections are performed, including also preliminary updates below 205 GeV.
9.1 Introduction
This Chapter summarises the combination of published and preliminary results of the four LEPexperiments on W-pair, Z-pair and single W cross sections and on W decay branching fractions,prepared for the summer 2001 conferences [1, 93]. Where available, the published final results of theanalysis of data collected at centre–of–mass energies up to 209 GeV are used in the combination.
Most relevant, with respect to the results presented at the summer 2000 conferences [1, 94], arenew measurements of the W-pair, Z-pair and single-W cross sections at the highest LEP-II centre–of–mass energies between 202 and 209 GeV, using the full data samples collected in the year 2000.This represents, for energies above 202 GeV, an increase in luminosity by more than a factor of twoover the results presented at the summer 2000 conferences from the year 2000 data available at thattime. Another significant change is an improved procedure for the combination of measured W-paircross sections between 183 and 207 GeV and for the combination of measured W decay branchingfractions, also used to derive the average ratio between the measured W-pair cross sections and thecorresponding theoretical predictions from various models. Finally, new combinations of single-W andZ-pair cross sections are presented to take into account the new data available above 200 GeV, alsoincluding minor changes in the single-W combination procedure and preliminary updates of Z-paircross sections between 192 and 202 GeV.
In the year 2000, LEP ran at centre–of–mass energies larger than 200 GeV, up to a maximumof 209 GeV. For the measurements of the W-pair, Z-pair and single-W cross section, the data col-lected above 202 GeV is divided [95] in two ranges of
√s, below and above 205.5 GeV, to enhance
the sensitivity of the cross-section measurements to possible signals of new physics at the higheste+e− centre–of–mass energy. The two data sets have mean centre–of–mass energies of 204.9 and206.6 GeV, and the respective integrated luminosities used for the analyses considered in this note areapproximately 80 and 130 pb−1 per experiment.
54

Results from different experiments are combined in χ2 minimisations through matrix algebra, basedon the Best Linear Unbiased Estimate (BLUE) method described in Reference 82, and taking intoaccount, when relevant, the correlations between the systematic uncertainties, which arise mainly fromthe use of the same Monte Carlo codes to predict the background and to simulate the hadronisationprocesses. The detailed breakdown of the systematic errors for the measurements combined in thisChapter is described in Appendix C. Experimental results are compared with recent theoreticalpredictions, many of which were developed in the framework of the LEP-II Monte Carlo workshop [96].
9.2 W-pair production cross section
All experiments have published final results on the W-pair (CC03 [96]) production cross section forcentre–of–mass energies from 161 to 189 GeV [97–109]. The preliminary results contributed by all fourcollaborations at
√s = 192–202 GeV are unchanged with respect to the summer 2000 conferences [110–
114]. All experiments contribute new preliminary results at√s = 205–207 GeV [115–118], based on
the analysis of the full data sample collected in the year 2000. New LEP averages of the measurementsat the eight centre–of–mass energies between 183 and 207 GeV are computed for the summer 2001conferences, using an improved combination procedure. In particular, the LEP combined cross sectionsare now obtained from one global fit to the 32 measurements performed by the four experiments ateach of these eight energies, taking into account inter-experiment as well as inter-energy correlations,rather than from eight individual fits at the various energies, neglecting inter-energy correlations, asin the case of the previous combination for the summer 2000 [1, 94] conferences.
In the averaging of results at and above√s = 189 GeV, the component of the systematic error
from each experiment coming from the uncertainty on the 4-jet QCD background is taken to be fullycorrelated between experiments. This is slightly different from the procedure adopted for the summer2000 conferences [1], where some experiments had also included in the correlated error the uncertaintiesdue to the modelling of hadronisation and final state interactions. More importantly, this commonerror, ranging between 0.04 and 0.12 pb, is now taken to be also fully correlated between energies.The remaining sources of systematic errors, taken as completely uncorrelated between experiments,are split by each experiment into two categories, for which 100% and 0% correlations between differentenergies are assumed. The detailed inputs used for the combination are given in Appendix C. Themeasured statistical errors are used for the combination. After building the full 32×32 covariancematrix for the measurements, the χ2 minimisation fit is performed as described in Reference [119].More detailed studies on correlated systematic errors are in progress.
The results from each experiment for the W-pair production cross section are shown in Table 9.1, to-gether with the LEP combination at each energy. All measurements are defined to represent CC03 [96]WW cross sections, and assume Standard Model values for the W decay branching fractions. Theresults for centre–of–mass energies between 183 and 207 GeV, for which new LEP averages are com-puted, supersede the ones presented in [1]: the effect of the new combination procedure is to change theLEP combined cross sections at these energies by 0.6% at most, generally towards lower values. Thecombined LEP cross sections at the eight energies are all positively correlated, with correlations rang-ing from 9% to 24%. For completeness, the measurements at 161 [97,120] and 172 GeV [98–101,121]are also listed in the table. All results from the four experiments listed in the table are preliminary,with the exception of those at 161–189 GeV.
Figure 9.1 shows the combined LEP W-pair cross section measured as a function of the centre–of–mass energy. The combined measurements are compared with the theoretical calculations fromYFSWW [122] and RACOONWW [123] between 155 and 215 GeV for mW = 80.35 GeV. The two
55

√s WW cross section (pb) χ2/d.o.f.
(GeV) ALEPH DELPHI L3 OPAL LEP
161.3 4.23 ± 0.75∗ 3.67 + 0.99 ∗− 0.87 2.89 + 0.82 ∗
− 0.71 3.62 + 0.94 ∗− 0.84 3.69 ± 0.45 1.3 / 3
172.1 11.7 ± 1.3 ∗ 11.6 ± 1.4 ∗ 12.3 ± 1.4 ∗ 12.3 ± 1.3 ∗ 12.0 ± 0.7 0.22/ 3
182.7 15.57 ± 0.68∗ 15.86 ± 0.74∗ 16.53 ± 0.72∗ 15.43 ± 0.66∗ 15.79 ± 0.36
27.42/24
188.6 15.71 ± 0.38∗ 15.83 ± 0.43∗ 16.24 ± 0.43∗ 16.30 ± 0.38∗ 16.00 ± 0.21
191.6 17.23 ± 0.91 16.90 ± 1.02 16.39 ± 0.93 16.60 ± 0.98 16.72 ± 0.48
195.5 17.00 ± 0.57 17.86 ± 0.63 16.67 ± 0.60 18.59 ± 0.74 17.43 ± 0.32
199.5 16.98 ± 0.56 17.35 ± 0.60 16.94 ± 0.62 16.32 ± 0.66 16.84 ± 0.31
201.6 16.16 ± 0.76 17.67 ± 0.84 16.95 ± 0.88 18.48 ± 0.91 17.23 ± 0.42
204.9 16.57 ± 0.55 17.44 ± 0.64 17.35 ± 0.64 15.97 ± 0.64 16.71 ± 0.31
206.6 17.32 ± 0.45 16.50 ± 0.48 17.96 ± 0.51 17.77 ± 0.57 17.33 ± 0.25
Table 9.1: W-pair production cross section from the four LEP experiments and combined values atall recorded centre–of–mass energies. All results are preliminary and unpublished, with the exceptionof those indicated by ∗. The measurements between 183 and 207 GeV are combined in one globalfit, taking into account inter-experiment as well as inter-energy correlations of systematic errors.The results for the combined LEP W-pair production cross section at 161 and 172 GeV are takenfrom [120,121] respectively.
codes have been extensively compared and agree at a level better than 0.5% at the LEP-II energies [96].The calculations above 170 GeV, based for the two programs on the so-called leading pole (LPA)or double pole approximations (DPA) [124], have theoretical uncertainties decreasing from 0.7% at170 GeV to about 0.4% at centre–of–mass energies larger than 200 GeV, while in the threshold regiona larger theoretical uncertainty of 2% is assigned [125]. This theoretical uncertainty is represented bythe width of the shaded band in Figure 9.1. An error of 50 MeV on the W mass would translate intoadditional errors of 0.1% (3.0%) on the cross-section predictions at 200 GeV (161 GeV, respectively).All results, up to the highest centre–of–mass energies, are in agreement with the two theoreticalpredictions considered.
9.2.1 Ratio of measured and predicted W-pair cross sections
The agreement between the measured W-pair cross section, σmeasWW , and its expectation according to a
given theoretical model, σtheoWW, can be expressed quantitatively in terms of their ratio
RWW =σmeasWW
σtheoWW
,
averaged over the measurements performed by the four experiments at different energies in theLEP-II region. The above procedure is used to compare the measurements at the eight energiesbetween 183 and 207 GeV to the predictions of GENTLE [126], KORALW [127], YFSWW [122] andRACOONWW [123]. The measurements at 161 and 172 GeV are not used in the combination becausethey were performed using data samples of low statistics and because of the high sensitivity of thecross section to the value of the W mass at these energies.
The combination of the ratio RWW is performed using as input from the four experiments the 32cross sections measured at each of the eight energies. For each model considered, these are converted
56

0
5
10
15
20
160 170 180 190 200 210
Ecm [GeV]
σWW
[pb]
LEP Preliminary08/07/2001
RacoonWW / YFSWW 1.16
0
5
10
15
20
160 170 180 190 200 210
16
17
18
RacoonWWYFSWW 1.16
0
5
10
15
20
160 170 180 190 200 210
Figure 9.1: Measurements of the W-pair production cross section, compared to the predictions ofRACOONWW [123] and YFSWW [122]. The shaded area represents the uncertainty on the theoreticalpredictions, estimated to be ±2% for
√s<170 GeV and ranging from 0.7 to 0.4% above 170 GeV.
into 32 ratios by dividing them by the corresponding theoretical predictions, listed in Appendix C.The full 32×32 covariance matrix for the ratios is built taking into account the same sources ofsystematic errors used for the combination of the W-pair cross sections at these energies. The smallstatistical errors on the theoretical predictions at the various energies, taken as fully correlated forthe four experiments and uncorrelated between different energies, are also translated into errors onthe individual measurements of RWW. The theoretical errors on the predictions, due to the physicaland technical precision of the generators used, are not propagated to the individual ratios and areused instead when comparing to the combined values obtained for RWW. For each of the four modelsconsidered, two fits are performed: in the first, eight values of RWW at the different energies are
57

extracted, averaged over the four experiments; in the second, only one value of RWW is determined,representing the global agreement of measured and predicted cross sections over the whole energyrange.
The results of the two fits to RWW for each of the four models considered are given in Table 9.2.As already qualitatively noted from Figure 9.1, the LEP measurements of the W-pair cross sectionabove threshold are in very good agreement to the predictions of YFSWW and RACOONWW. Incontrast, the predictions from GENTLE and KORALW are more than 2% too high with respectto the measurements. The main differences between these two sets of predictions come from non-leading O(α) electroweak radiative corrections to the W-pair production process, which are included(in the LPA/DPA approximation [124]) in both YFSWW and RACOONWW, but not in GENTLEand KORALW. Especially interesting is the comparison between KORALW and YFSWW, as thenumerical results provided by the authors for KORALW are actually those of a downgraded versionof YFSWW, such that the only differences between the two calculations are the screening of Coulombinteractions according to the prescription of Reference 128 and the inclusion of non-leading O(α)electroweak radiative corrections to W-pair production (mainly radiation off W bosons and pure weakcorrections). Of these two effects, only the latter is found to be relevant to the measurement of RWW,while the former has a negligible impact on the total W-pair cross section [129].
√s Ratio of measured and expected WW cross sections
(GeV) RGENTLEWW RKORALW
WW RYFSWWWW RRACOONWW
WW
182.7 1.005 ± 0.022 1.011 ± 0.023 1.028 ± 0.023 1.028 ± 0.023
188.6 0.961 ± 0.013 0.967 ± 0.013 0.984 ± 0.013 0.985 ± 0.013
191.6 0.986 ± 0.028 0.991 ± 0.028 1.009 ± 0.029 1.012 ± 0.029
195.5 1.010 ± 0.018 1.015 ± 0.018 1.035 ± 0.019 1.037 ± 0.019
199.5 0.964 ± 0.018 0.970 ± 0.018 0.990 ± 0.018 0.992 ± 0.018
201.6 0.983 ± 0.024 0.989 ± 0.024 1.009 ± 0.025 1.012 ± 0.025
204.9 0.949 ± 0.018 0.955 ± 0.018 0.976 ± 0.018 0.978 ± 0.018
206.6 0.984 ± 0.014 0.989 ± 0.014 1.011 ± 0.015 1.014 ± 0.015
χ2/d.o.f 27.42/24 27.42/24 27.42/24 27.42/24
Average 0.973 ± 0.009 0.979 ± 0.009 0.998 ± 0.009 1.000 ± 0.009
χ2/d.o.f 39.16/31 39.20/31 39.04/31 39.14/31
Table 9.2: Ratios of LEP combined W-pair cross-section measurements to the expectations accordingto GENTLE [126], KORALW [127], YFSWW [122] and RACOONWW [123]. For each of the fourmodels, two fits are performed, one to the LEP combined values of RWW at the eight energies between183 and 207 GeV, and another to the LEP combined average of RWW over all energies. The resultsof the fits are given in the table together with the resulting χ2. Both fits take into account inter-experiment as well as inter-energy correlations of systematic errors.
The results of the fits for YFSWW and RACOONWWare also shown in Figure 9.2, where relativeerrors of 0.5% on the cross-section predictions are assumed. For simplicity, the energy dependence ofthe relative error on the W-pair cross-section predicted by each model is neglected in Figure 9.2.
58

183 GeV 1.028 ± 0.023
189 GeV 0.984 ± 0.013
192 GeV 1.009 ± 0.029
196 GeV 1.035 ± 0.019
200 GeV 0.990 ± 0.018
202 GeV 1.009 ± 0.025
205 GeV 0.976 ± 0.018
207 GeV 1.011 ± 0.015
LEP combined 0.998 ± 0.009
0.9 1. 1.1
Measured σWW / YFSWW
LEP WW Working Group Summer 2001
PRELIMINARY
183 GeV 1.028 ± 0.023
189 GeV 0.985 ± 0.013
192 GeV 1.012 ± 0.029
196 GeV 1.037 ± 0.019
200 GeV 0.992 ± 0.018
202 GeV 1.012 ± 0.025
205 GeV 0.978 ± 0.018
207 GeV 1.014 ± 0.015
LEP combined 1.000 ± 0.009
0.9 1. 1.1
Measured σWW / RacoonWW
LEP WW Working Group Summer 2001
PRELIMINARY
Figure 9.2: Ratios of LEP combined W-pair cross-section measurements to the expectations accordingto YFSWW [122] and RACOONWW [123] The yellow bands represent constant relative errors of 0.5%on the two cross-section predictions.
9.3 W decay branching fractions
From the cross sections for the individual WW→ 4f decay channels measured by the four experimentsat all energies larger than 161 GeV, the W decay branching fractions B(W → ff
′) are determined, with
and without the assumption of lepton universality. All four experiments update their results since thesummer 2000 conferences to include the full data samples collected in the year 2000 at centre–of–massenergies of 205 and 207 GeV [115–118]. The results from each experiment are given in Table 9.3 andFigure 9.3, together with the result of the LEP combination.
Lepton Lepton
non–universality universality
Experiment B(W → eνe) B(W → µνµ) B(W → τντ ) B(W → hadrons)
[%] [%] [%] [%]
ALEPH 10.95 ± 0.31 11.11 ± 0.29 10.57 ± 0.38 67.33 ± 0.47
DELPHI 10.36 ± 0.34 10.62 ± 0.28 10.99 ± 0.47 68.10 ± 0.52
L3 10.40 ± 0.30 9.72 ± 0.31 11.78 ± 0.43 68.34 ± 0.52
OPAL 10.40 ± 0.35 10.61 ± 0.35 11.18 ± 0.48 67.91 ± 0.61
LEP 10.54 ± 0.17 10.54 ± 0.16 11.09 ± 0.22 67.92 ± 0.27
χ2/d.o.f. 14.9/9 18.8/11
Table 9.3: Summary of leptonic and hadronic W branching fractions derived from preliminary W-pairproduction cross-sections measurements up to 207 GeV centre–of–mass energy. A common systematicerror of (0.03–0.06)% on the leptonic branching fractions is taken into account in the combination.
59

02/03/2001
W Leptonic Branching Ratios
ALEPH 10.95 ± 0.31DELPHI 10.36 ± 0.34L3 10.40 ± 0.30OPAL 10.40 ± 0.35
LEP W→eν 10.54 ± 0.17
ALEPH 11.11 ± 0.29DELPHI 10.62 ± 0.28L3 9.72 ± 0.31OPAL 10.61 ± 0.35
LEP W→µν 10.54 ± 0.16
ALEPH 10.57 ± 0.38DELPHI 10.99 ± 0.47L3 11.78 ± 0.43OPAL 11.18 ± 0.48
LEP W→τν 11.09 ± 0.22
LEP W→lν 10.69 ± 0.09
10 11 12
Br(W→lν) [%]
Winter 01 - Preliminary - [161-207] GeV02/03/2001
Br(W→hadrons) [%]
ALEPH 67.33 ± 0.47
DELPHI 68.10 ± 0.52
L3 68.34 ± 0.52
OPAL 67.91 ± 0.61
LEP 67.92 ± 0.27
66 68 70
Br(W→hadrons) [%]
Winter 01 - Preliminary - [161-207] GeV
Figure 9.3: Summary of leptonic and hadronic W branching fractions derived from preliminary W-pair production cross-sections measurements up to 207 GeV centre–of–mass energy, unchanged fromwinter 2001. The thin vertical line denotes the Standard Model expectation.
The two combinations performed, with and without the assumption of lepton universality, bothuse as inputs from each of the four experiments the three leptonic branching fractions, with theirsystematic and observed statistical errors and their three by three correlation matrices. In the fitwith lepton universality, the branching fraction to hadrons is determined from that to leptons byconstraining the sum to unity. In building the full 12×12 covariance matrix, it is assumed thatthe 4-jet QCD background components of the systematic error are fully correlated between differentexperiments both for the same and for different leptonic channels, as they arise mainly from theuncertainty on the WW cross section in the channel where both W bosons decay to hadrons. Thecombination procedure is consistent with that used for the combination of the total W-pair crosssections and outlined in the previous section, as the same sources of inter-experiment correlationsare considered, while inter-energy correlations of systematic errors are taken into account internallyby each experiment when deriving their average branching ratios. The detailed inputs used for thecombination are given in Appendix C.
The results of the fit which does not make use of the lepton universality assumption show anegative correlation of 21.4% (18.9%) between the W → τντ and W → eνe (W → µνµ) branchingfractions, while between the electron and muon decay channels there is a positive correlation of 6.6%.The two-by-two comparison of these branching fractions constitutes a test of lepton universality inthe decay of on–shell W bosons at the level of 2.9%:
B(W → µνµ) /B(W → eνe) = 1.000 ± 0.021 ,
B(W → τντ ) /B(W → eνe) = 1.052 ± 0.029 ,
B(W → τντ ) /B(W → µνµ) = 1.052 ± 0.028 .
The branching fractions are all consistent with each other within the errors.
Assuming lepton universality, the measured hadronic branching fraction is [67.92 ± 0.17(stat.) ±0.21(syst.)]% and the leptonic one is [10.69 ± 0.06(stat.) ± 0.07(syst.)]%. These results are consistent
60

with their Standard Model expectations, of 67.51% and 10.83% respectively [130]. The systematicerror receives equal contributions from the correlated and uncorrelated sources. The high χ2 of thefit, 18.8 for 11 degrees of freedom, is mainly caused by the spread of the L3 results for W decays tomuons and taus around the common average.
Within the Standard Model, the branching fractions of the W boson depend on the six matrixelements |Vqq′ | of the Cabibbo–Kobayashi–Maskawa (CKM) quark mixing matrix not involving the topquark. In terms of these matrix elements, the leptonic branching fraction of the W boson B(W → ℓνℓ)is given by
1
B(W → ℓνℓ)= 3
1 +
[
1 +αs(M
2W)
π
]
∑
i = (u, c),j = (d, s, b)
|Vij |2
,
where αs(M2W) is the strong coupling constant. Taking αs(M
2W) = 0.121±0.002, the measured leptonic
branching fraction of the W yields
∑
i = (u, c),j = (d, s, b)
|Vij |2 = 2.039 ± 0.025 (BW → ℓνℓ) ± 0.001 (αs),
where the first error is due to the uncertainty on the branching fraction measurement and the secondto the uncertainty on αs. Using the experimental knowledge [131] of the sum |Vud|2 + |Vus|2 + |Vub|2 +|Vcd|2 + |Vcb|2 = 1.0477± 0.0074, the above result can be interpreted as a measurement of |Vcs| whichis the least well determined of these matrix elements:
|Vcs| = 0.996 ± 0.013.
The error includes a ±0.0006 contribution from the uncertainty on αs and a ±0.004 contribution fromthe uncertainties on the other CKM matrix elements, the largest of which is that on |Vcd|. Thesecontributions are negligible in the error on this determination of |Vcs|, which is dominated by the±0.013 experimental error from the measurement of the W branching fractions.
9.4 Z-pair production cross section
All experiments have published final results [132–137] on the Z-pair production cross section at√s = 183 and 189 GeV, already presented in [94]. Since the summer 2000 conferences, L3 [138] has
published its updated final results between 192 and 202 GeV, OPAL [139] has provided preliminaryupdates of its previous measurements at those energies [140], whereas the corresponding preliminaryresults from ALEPH [141,142] and DELPHI [143,144] are unchanged. All experiments also contributepreliminary results at 205 and 207 GeV [139,142,145,146], based on the analysis of the full data samplecollected in the year 2000.
The results of the individual experiments and the LEP averages are summarised for the differentcentre–of–mass energies in Table 9.4. The combination of final results at
√s = 183 and 189 GeV is
the same that was given for the summer 2000 conferences, while the results above 189 GeV supersedethose previously presented [1], and are all preliminary with the exception of the L3 results between192 and 202 GeV.
All numerical results presented in this Section are defined to represent NC02 [96] ZZ cross sections.The combination of results is performed using the symmetrized expected statistical error of each
61

√s ZZ cross section (pb) χ2/d.o.f.
(GeV) ALEPH DELPHI L3 OPAL LEP
182.7 0.11 + 0.16 ∗− 0.12 0.38 ± 0.18∗ 0.31 + 0.17 ∗
− 0.15 0.12 + 0.20 ∗− 0.18 0.23 ± 0.08 2.28/3
188.6 0.67 + 0.14 ∗− 0.13 0.60 ± 0.15∗ 0.73 + 0.15 ∗
− 0.14 0.80 + 0.15 ∗− 0.14 0.70 ± 0.08 0.97/3
191.6 0.53 + 0.34− 0.27 0.55 ± 0.34 0.29 ± 0.22∗ 1.13 + 0.47
− 0.41 0.60 ± 0.18 2.88/3
195.5 0.69 + 0.23− 0.20 1.17 ± 0.29 1.18 ± 0.26∗ 1.19 + 0.28
− 0.26 1.04 ± 0.13 3.23/3
199.5 0.70 + 0.22− 0.20 1.08 ± 0.26 1.25 ± 0.27∗ 1.09 + 0.26
− 0.24 1.01 ± 0.13 2.80/3
201.6 0.70 + 0.33− 0.28 0.87 ± 0.33 0.95 ± 0.39∗ 0.94 + 0.38
− 0.33 0.86 ± 0.18 0.32/3
204.9 1.21 + 0.26− 0.23 1.05 ± 0.26 0.84 ± 0.23 1.07 + 0.28
− 0.26 1.03 ± 0.13 1.11/3
206.6 1.01 + 0.19− 0.17 0.98 ± 0.22 1.20 ± 0.21 1.07 + 0.22
− 0.21 1.06 ± 0.11 0.76/3
Table 9.4: Z-pair production cross section from the four LEP experiments and combined values forthe eight energies between 183 and 207 GeV. All results are preliminary with the exception of thoseindicated by ∗. A common systematic error of (0.01–0.07) pb is taken into account in the averagingprocedure.
analysis, to avoid biases due to the limited number of events selected. As in the combination performedfor the summer 2000 conferences [94], the component of the systematic errors that is considered ascorrelated between experiments includes the uncertainty on the backgrounds from qq, WW, Zee andWeν processes and the uncertainty on the b quark modelling. Summing these contributions together,the common error ranges between 0.01 and 0.07 pb for the various experiments, as described inAppendix C.
The measurements are shown in Figure 9.4 as a function of the LEP centre–of–mass energy, wherethey are compared to the YFSZZ [147] and ZZTO [148] predictions. Both these calculations have anestimated uncertainty of ±2% [96]. The data do not show any significant deviation from the theoreticalexpectations.
9.5 Single-W production cross section
Since the summer 2000 [94] conferences, only ALEPH [149] and DELPHI [150] present new measure-ments of the single-W cross section, from the analysis of the full data sample collected in the year 2000at 205 and 207 GeV, while L3 has published unchanged its results at 189 GeV [151], already presentedas preliminary in the summer 2000. None of the other results previously presented by the four experi-ments are updated: these include the results published by ALEPH [152] and L3 [153,154] at 183 GeV,and the preliminary measurements by ALEPH at 189–202 [155], DELPHI at 189–202 [156,157], L3 at192–202 [158] and OPAL at 189 GeV [159].
A new combination of LEP results for the summer 2001 conferences is performed not only at205–207 GeVto include the new results by ALEPH and DELPHI, but also at all energies between 183and 202 GeV. This is done to include the DELPHI results for the total single-W cross section at theseenergies [157] defined according to the common LEP prescription of Reference 160, which accounts forall decays of the W boson, including those to taus. In contrast, for the previous combination performedfor the winter 2000 conferences [160], previous DELPHI results [156] had been used, accounting onlyfor decays of the W boson to hadrons, electrons or muons. In the new average for the summer 2001conferences, results are combined assuming uncorrelated systematic errors between experiments and
62

0
0.5
1
1.5
170 180 190 200
Ecm [GeV]
σZZ
NC
02 [p
b]LEP Preliminary
08/07/2001
±2.0% uncertainty
ZZTO
YFSZZ
Figure 9.4: Measurements of the Z-pair production cross section, compared to the predictions ofYFSZZ [147] and ZZTO [148]. The shaded area represents the ±2% uncertainty on the predictions.
consistently using expected statistical errors for all measurements, given the limited statistical precisionof the single-W cross-section measurements. This also differs slightly from the procedure previouslyused for the winter 2000 conferences, where expected statistical errors had only been used for a fewmeasurements on very limited data samples, reverting to measured statistical errors elsewhere.
The measurements of the hadronic and total single-W cross sections by the four LEP experimentsbetween 183 and 207 GeVare listed in Tables 9.5 and 9.6, together with the corresponding LEPcombined values. All numerical results presented in this Section represent single-W cross sectionsaccording to the common LEP definition given in [160]. Single-W production is considered as thecomplete t-channel subset of Feynman diagrams contributing to eνe ff
′ final states, with additional cutson kinematic variables to exclude the regions of phase space dominated by multiperipheral diagrams,
63

where the cross-section calculation is affected by large uncertainties. The kinematic cuts used inthe signal definitions are: mqq > 45 GeV for the eνeqq final states, Eℓ > 20 GeV for the eνeℓνe finalstates with ℓ = µ or τ , and finally | cos θe− | > 0.95, | cos θe+ | < 0.95 and Ee+ > 20 GeV (or the chargeconjugate cuts) for the eνeeνe final states. The measurements performed on the small amount of databelow 183 GeV, by L3 at 130–172 GeV [154,161] and ALEPH at 161–172 GeV [152], are not convertedinto the single-W common LEP definition and are absent from the tables and the following plot.
The LEP measurements of the single-W cross section are shown, as a function of the LEP centre–of–mass energy, in Figure 9.5 for the hadronic decays and for all decays of the W boson. In the twofigures, the measurements are compared with the expected values from WTO [162], WPHACT [163]and grc4f [164]. As discussed more in detail in [1] and [96], the theoretical predictions are scaledupward to correct for the implementation of QED radiative corrections at the wrong momentumtransfer scale s. The full correction factor of 4%, derived [96] by the comparison to the theoreticalpredictions from SWAP [165], is conservatively taken as a systematic error. This uncertainty dominatesthe ±5% theoretical error currently assigned to these predictions [1, 96], represented by the shadedarea in Figure 9.5. All results, up to the highest centre–of–mass energies, are in agreement with thetheoretical predictions.
64

0
0.25
0.5
0.75
1
160 170 180 190 200 210
Ecm [GeV]
σ(e+
e– → e
νW)
[pb]
LEP Preliminary25/07/2001
±5.0% uncertainty
grc4fWPHACT IFL/α(t)WTO EFL
W → qq-’
0
0.5
1
1.5
160 170 180 190 200 210
Ecm [GeV]
σ(e+
e– → e
νW)
[pb]
LEP Preliminary25/07/2001
±5.0% uncertainty
grc4fWPHACT IFL/α(t)
W → ff-’
Figure 9.5: Measurements of the single-W production cross section. Top: hadronic decay channel ofthe W boson; bottom: total production cross section. Also shown are the predictions of WTO [162](hadronic decay channel only), WPHACT [163] and grc4f [164]. The shaded area represents the ±5%uncertainty on the predictions.
65

√s Single-W hadronic cross section (pb) χ2/d.o.f.
(GeV) ALEPH DELPHI L3 OPAL LEP
182.7 0.40 ± 0.24∗ — 0.58 + 0.23 ∗− 0.20 — 0.50 ± 0.16 0.31/1
188.6 0.31 ± 0.14 0.44 + 0.28− 0.25 0.52 + 0.14 ∗
− 0.13 0.53 + 0.14− 0.13 0.46 ± 0.08 1.47/3
191.6 0.94 ± 0.44 0.01 + 0.19− 0.07 0.85 + 0.45
− 0.37 — 0.73 ± 0.25 1.94/2
195.5 0.45 ± 0.23 0.78 + 0.38− 0.34 0.66 + 0.25
− 0.23 — 0.60 ± 0.15 0.77/2
199.5 0.82 ± 0.26 0.16 + 0.29− 0.17 0.34 + 0.23
− 0.20 — 0.46 ± 0.14 3.60/2
201.6 0.68 ± 0.35 0.55 + 0.47− 0.40 1.09 + 0.42
− 0.37 — 0.80 ± 0.21 1.13/2
204.9 0.50 ± 0.25 0.50 + 0.35− 0.31 — — 0.50 ± 0.20 0.00/1
206.6 0.95 ± 0.24 0.37 + 0.24− 0.21 — — 0.71 ± 0.17 2.77/1
Table 9.5: Single-W production cross section from the four LEP experiments and combined valuesfor the eight energies between 183 and 207 GeV, in the hadronic decay channel of the W boson. Allresults are preliminary with the exception of those indicated by ∗.
√s Single-W total cross section (pb) χ2/d.o.f.
(GeV) ALEPH DELPHI L3 OPAL LEP
182.7 0.61 ± 0.27∗ — 0.80 + 0.28 ∗− 0.25 — 0.70 ± 0.19 0.26/1
188.6 0.45 ± 0.15 0.75 + 0.30− 0.26 0.69 + 0.16 ∗
− 0.15 0.67 + 0.17− 0.15 0.62 ± 0.09 1.60/3
191.6 1.31 ± 0.48 0.17 + 0.34− 0.18 1.06 + 0.49
− 0.42 — 0.99 ± 0.28 2.38/2
195.5 0.65 ± 0.25 0.94 + 0.41− 0.36 0.98 + 0.28
− 0.27 — 0.84 ± 0.16 0.92/2
199.5 0.99 ± 0.27 0.51 + 0.33− 0.32 0.79 + 0.27
− 0.24 — 0.79 ± 0.16 1.40/2
201.6 0.75 ± 0.36 1.15 + 0.55− 0.46 1.38 + 0.47
− 0.42 — 1.06 ± 0.24 1.38/2
204.9 0.78 ± 0.27 0.56 + 0.36− 0.32 — — 0.70 ± 0.22 0.24/1
206.6 1.19 ± 0.25 0.58 + 0.26− 0.23 — — 0.94 ± 0.18 2.71/1
Table 9.6: Single-W total production cross section from the four LEP experiments and combinedvalues for the eight energies between 183 and 207 GeV. All results are preliminary with the exceptionof those indicated by ∗.
66

Chapter 10
Electroweak Gauge Boson Self Couplings
Updates with respect to summer 2000:
Additional preliminary results based on the data collected in the year 2000 are included. No resultson charged TGCs are included as the effects of newly calculated radiative corrections on the couplingsresults derived from W-pair production are still under investigation.
10.1 Introduction
The measurement of gauge boson couplings and the search for possible anomalous contributions dueto the effects of new physics beyond the Standard Model are among the principal physics aims atLEP-II [166]. Combined preliminary measurements of the neutral triple gauge boson couplings andquartic gauge couplings are presented here. The results for the neutral couplings already include thefull data set for all but the OPAL results from Zγ-production. For the quartic gauge couplings thewhole data set is analysed so far only by L3, and by ALEPH for the ννγγ -channel.
The W-pair production process, e+e− → W+W−, involves the charged triple gauge boson verticesbetween the W+W− and the Z or the photon. During LEP-II operation, about 10,000 W-pair eventsare collected by each experiment. Single W (eνW) and single photon (ννγ) production at LEP are alsosensitive to the WWγ vertex. Results from these channels have been combined for previous summerconferences.
For the charged TGCs, new Monte Carlo calculations (RacoonWW [123] and YFSWW [122])including O(αem) corrections to the WW production process have recently become available. Theyhave the potential to largely affect the measurements of the charged TGCs in W-pair production. Theirimplications are still under investigation. Preliminary results including these O(αem) corrections areso far available only from ALEPH [167]. Therefore, as for the winter conferences this year, no newcombinations are made for these measurements.
At centre-of-mass energies exceeding twice the Z boson mass, pair production of Z bosons iskinematically allowed. Here, one searches for the possible existence of triple vertices involving onlyneutral electroweak gauge bosons. Such vertices could also contribute to Zγ production. In contrastto triple gauge boson vertices with two charged gauge bosons, purely neutral gauge boson vertices donot occur in the Standard Model of electroweak interactions.
Within the Standard Model, quartic electroweak gauge boson vertices with at least two charged
67

gauge bosons do exist. In e+e− collisions at LEP-II centre-of-mass energies, the WWZγ and WWγγvertices contribute to WWγ and ννγγ production in s-channel and t-channel, respectively. The effectof the Standard Model quartic electroweak vertices is below the sensitivity of LEP-II. Thus onlyanomalous quartic vertices are searched for in the production of WWγ, ννγγ and also Zγγ finalstates. No results from the Zγγ final state analysis are included in the combinations due to currentinvestigations of differences in the description of the anomalous contributions to this vertex [168].
10.1.1 Neutral Triple Gauge Boson Couplings
There are two classes of Lorentz invariant structures associated with neutral TGC vertices whichpreserve U(1)em and Bose symmetry, as described in [169,170].
The first class refers to anomalous Zγγ∗ and ZγZ∗ couplings which are accessible at LEP in theprocess e+e− → Zγ. The parametrisation contains eight couplings: hVi with i = 1, ..., 4 and V = γ,Z.The superscript γ refers to Zγγ∗ couplings and superscript Z refers to ZγZ∗ couplings. The photonand the Z boson in the final state are considered as on-shell particles, while the third boson at thevertex, the s-channel internal propagator, is off shell. The couplings hV1 and hV2 are CP-odd while hV3and hV4 are CP-even.
The second class refers to anomalous ZZγ∗ and ZZZ∗ couplings which are accessible at LEP-II inthe process e+e− → ZZ. This anomalous vertex is parametrised in terms of four couplings: fVi withi = 4, 5 and V = γ,Z. The superscript γ refers to ZZγ∗ couplings and the superscript Z refers toZZZ∗ couplings, respectively. Both Z bosons in the final state are assumed to be on-shell, while thethird boson at the triple vertex, the s-channel internal propagator, is off-shell. The couplings fV4 areCP-odd whereas fV5 are CP-even.
Note that the hVi and fVi couplings are independent of each other. They are assumed to be realand they vanish at tree level in the Standard Model.
10.1.2 Quartic Gauge Boson Couplings
Anomalous contributions to electroweak quartic vertices are treated in the framework of References [171–173]. Considered are the three lowest-dimensional operators leading to quartic vertices not causinganomalous TGCs. According to a more recent description of the QGCs [174], anomalous contribu-tions to the WWγγ and ZZγγ vertex are treated separately, although their structure is the same. Thecorresponding couplings are parametrised by aV0 /Λ
2 and aVc /Λ2, where Λ represents the energy scale
of new physics and V=W,Z for the respective WWγγ and ZZγγ vertices. An anomalous contributionto the WWZγ vertex is parametrised by an/Λ
2. The couplings aV0 /Λ2 and aVc /Λ
2 conserve C andP, while the coupling an/Λ
2 is CP-violating. The production of WWγ depends on all three aW0 /Λ2,
aWc /Λ2, and an/Λ
2 couplings. The production of ννγγ and Zγγ depend only on aV0 /Λ2 and aVc /Λ
2
(for V=W,Z or Z respectively), as they do not involve the WWZγ vertex. The coupling parametersare assumed to be real and they vanish at tree level in the Standard Model. At present there aredifferences between the Monte Carlo descriptions of [172] and [168] of the quartic gauge couplingvertex, especially in the Zγγ-final state. This issue is still under investigation as stated in [168] andcurrently effort is going on to repeat the measurement using the latter description. No new results areavailable using this framework so far and therefore no new combinations are presented for the ZZγγcouplings. The analyses of the ννγγ final state do not include possible contributions from the ZZγγ
68

vertex and hence the presented measurements here assume a vanishing ZZγγ vertex measuring onlyaW0 /Λ
2, aWc /Λ2 and an/Λ
2 accordingly.
10.2 Measurements
The combined results presented here are obtained from updated neutral electroweak gauge bosoncoupling measurements and quartic gauge coupling measurements as discussed above. The individualreferences should be consulted for details about the data samples used.
The h-coupling analyses of ALEPH, DELPHI and L3 use the data collected at LEP-II up to centre-of-mass energies of 209 GeV. The OPAL measurements so far use the data at 189 GeV. The results ofthe f -couplings are now obtained from the whole data set above the ZZ-production threshold by allof the experiments. The experiments already pre-combine different processes and final states for eachof the couplings. For the neutral TGCs, the analyses use measurements of the total cross sectionsof Zγ and ZZ production and the differential distributions: the hVi couplings [175–178] and the fVicouplings [175,176,179,180] are determined.
For QGCs, the combined results are based on measurements from WWγ and ννγγ production.In addition to the total cross section, the photon energy is used as a sensitive variable in the WWγchannel. The analyses in the ννγγ channel generally restrict to low recoil masses where contributionsfrom the Standard Model and a possible ZZγγ vertex are small. The QGCs aV0 /Λ
2, aVc /Λ2 and
an/Λ2 [181–183] are determined, where the whole data set is analysed by L3 and ALEPH, while
OPAL uses the data at 189 GeV.
10.3 Combination Procedure
The combination procedure is identical to the previous LEP combination of electroweak gauge bosoncouplings [184].
Each experiment provides the negative log likelihood, logL, as a function of the coupling pa-rameters (one or two) to be combined. The single-parameter analyses are performed fixing all otherparameters to their Standard Model values. The two-parameter analyses are performed setting theremaining parameters to their Standard Model values.
The logL functions from each experiment include statistical as well as those systematic uncertain-ties which are considered as uncorrelated between experiments. For both single- and multi-parametercombinations, the individual logL functions are added. It is necessary to use the logL functionsdirectly in the combination, since in some cases they are not parabolic, and hence it is not possible tocombine the results correctly by simply taking weighted averages of the measurements.
The main contributions to the systematic uncertainties that are uncorrelated between experimentsarise from detector effects, background in the selected signal samples, limited Monte Carlo statisticsand the fitting method. Their importance varies for each experiment and the individual referencesshould be consulted for details.
The systematic uncertainties arising from the theoretical cross section prediction in Zγ-production(≃ 1% in the qqγ- and ≃ 2% in the ννγ channel) are treated as correlated. For ZZ production, the
69

uncertainty on the theoretical cross section prediction is small compared to the statistical accuracyand therefore is neglected. Smaller sources of correlated systematic uncertainties, such as those arisingfrom the LEP beam energy, are for simplicity treated as uncorrelated.
The correlated systematic uncertainties in the h-coupling analyses are taken into account by scalingthe combined log-likelihood functions by the squared ratio of the sum of statistical and uncorrelatedsystematic uncertainty over the total uncertainty including all correlated uncertainties. For the generalcase of non-Gaussian probability density functions, this treatment of the correlated errors is only anapproximation; it also neglects correlations in the systematic uncertainties between the parameters inmulti-parameter analyses.
The one standard deviation uncertainties (68% confidence level) are obtained by taking the couplingvalues for which ∆ logL = +0.5 above the minimum. The 95% confidence level (C.L.) limits are givenby the coupling values for which ∆ logL = +1.92 above the minimum. These cut-off values are usedfor obtaining the results of both single- and multi-parameter analyses reported here. Note that inthe case of the neutral TGCs, double minima structures appear in the negative log-likelihood curves.For multi-parameter analyses, the two dimensional 68% C.L. contour curves for any pair of couplingsare obtained by requiring ∆ logL = +1.15, while for the 95% C.L. contour curves ∆ logL = +3.0 isrequired.
10.4 Results
We present results from the four LEP experiments on the various electroweak gauge boson couplings,and their combination. The results quoted for each individual experiment are calculated using themethod described in Section 10.3. Thus they may differ slightly from those reported in the individualreferences. In particular for the h-coupling result from OPAL and DELPHI, a slightly modifiedestimate of the systematic uncertainty due to the theoretical cross section prediction is responsible forslightly different limits compared to the published results. Furthermore, for the QGC, L3 integrates thelikelihood in order to determine the 95%CL, whereas here it is read off the logL-curve at ∆ logL = 1.92as for Gaussian shaped likelihood functions.
10.4.1 Neutral Triple Gauge Boson Couplings in Zγ Production
The individual analyses and results of the experiments for the h-couplings are described in [175–178].
Single-Parameter Analyses
The results for each experiment are shown in Table 10.1, where the errors include both statisticaland systematic uncertainties. The individual logL curves and their sum are shown in Figures 10.1and 10.2. The results of the combination are given in Table 10.2. From Figures 10.1 and 10.2 it isclear that the sensitivity of the L3 analysis [177] is the highest amongst the LEP experiments. This ispartially due to the use of a larger phase space region, which increases the statistics by about a factortwo, and partially due to added information from using an Optimal Observable technique.
70

Parameter ALEPH DELPHI L3 OPAL
hγ1 [−0.14, +0.14] [−0.15, +0.15] [−0.06, +0.06] [−0.13, +0.13]
hγ2 [−0.07, +0.07] [−0.09, +0.09] [−0.053, +0.024] [−0.089, +0.089]
hγ3 [−0.069, +0.037] [−0.047, +0.047] [−0.062, −0.014] [−0.16, +0.00]
hγ4 [−0.020, +0.045] [−0.032, +0.030] [−0.004, +0.045] [+0.01, +0.13]
hZ1 [−0.23, +0.23] [−0.24, +0.25] [−0.17, +0.16] [−0.22, +0.22]
hZ2 [−0.12, +0.12] [−0.14, +0.14] [−0.10, +0.09] [−0.15, +0.15]
hZ3 [−0.28, +0.19] [−0.32, +0.18] [−0.23, +0.11] [−0.29, +0.14]
hZ4 [−0.10, +0.15] [−0.12, +0.18] [−0.08, +0.16] [−0.09, +0.19]
Table 10.1: The 95% C.L. intervals (∆ logL = 1.92) measured by the ALEPH, DELPHI, L3 andOPAL. In each case the parameter listed is varied while the remaining ones are fixed to their StandardModel values. Both statistical and systematic uncertainties are included.
Parameter 95% C.L.
hγ1 [−0.056, +0.055]
hγ2 [−0.045, +0.025]
hγ3 [−0.049, −0.008]
hγ4 [−0.002, +0.034]
hZ1 [−0.13, +0.13]
hZ2 [−0.078, +0.071]
hZ3 [−0.20, +0.07]
hZ4 [−0.05, +0.12]
Table 10.2: The 95% C.L. intervals (∆ logL = 1.92) obtained combining the results from the fourexperiments. In each case the parameter listed is varied while the remaining ones are fixed to theirStandard Model values. Both statistical and systematic uncertainties are included.
Two-Parameter Analyses
The results for each experiment are shown in Table 10.3, where the errors include both statistical andsystematic uncertainties. The 68% C.L. and 95% C.L. contour curves resulting from the combinationsof the two-dimensional likelihood curves are shown in Figure 10.3. The LEP average values are givenin Table 10.4.
71

Parameter ALEPH DELPHI L3
hγ1 [−0.32, +0.32] [−0.28, +0.28] [−0.17, +0.04]
hγ2 [−0.18, +0.18] [−0.17, +0.18] [−0.12, +0.02]
hγ3 [−0.17, +0.38] [−0.48, +0.20] [−0.09, +0.13]
hγ4 [−0.08, +0.29] [−0.08, +0.15] [−0.04, +0.11]
hZ1 [−0.54, +0.54] [−0.45, +0.46] [−0.48, +0.33]
hZ2 [−0.29, +0.30] [−0.29, +0.29] [−0.30, +0.22]
hZ3 [−0.58, +0.52] [−0.57, +0.38] [−0.43, +0.39]
hZ4 [−0.29, +0.31] [−0.31, +0.28] [−0.23, +0.28]
Table 10.3: The 95% C.L. intervals (∆ logL = 1.92) measured by ALEPH, DELPHI and L3. In eachcase the two parameters listed are varied while the remaining ones are fixed to their Standard Modelvalues. Both statistical and systematic uncertainties are included.
Parameter 95% C.L. Correlations
hγ1 [−0.16, +0.05] 1.00 +0.79
hγ2 [−0.11, +0.02] +0.79 1.00
hγ3 [−0.08, +0.14] 1.00 +0.97
hγ4 [−0.04, +0.11] +0.97 1.00
hZ1 [−0.35, +0.28] 1.00 +0.77
hZ2 [−0.21, +0.17] +0.77 1.00
hZ3 [−0.37, +0.29] 1.00 +0.76
hZ4 [−0.19, +0.21] +0.76 1.00
Table 10.4: The 95% C.L. intervals (∆ logL = 1.92) obtained combining the results from ALEPH,DELPHI and L3. In each case the two parameters listed are varied while the remaining ones are fixedto their Standard Model values. Both statistical and systematic uncertainties are included. Since theshape of the log-likelihood is not parabolic, there is some ambiguity in the definition of the correlationcoefficients and the values quoted here are approximate.
72

PreliminaryLEP OPALL3+DELPHI+ALEPH+
h1γ
−∆ln
L
h2γ
−∆ln
L
h3γ
−∆ln
L
h4γ
−∆ln
L
Budapest 2001
0
0.5
1
1.5
2
2.5
3
-0.2 -0.1 0 0.1 0.20
0.5
1
1.5
2
2.5
3
-0.1 0 0.1
0
0.5
1
1.5
2
2.5
3
-0.2 -0.1 0 0.1 0.20
0.5
1
1.5
2
2.5
3
-0.1 0 0.1
Figure 10.1: The logL curves of the four experiments, and the LEP combined curve for the fourneutral TGCs hγi , i = 1, 2, 3, 4. In each case, the minimal value is subtracted.
73

PreliminaryLEP OPALL3+DELPHI+ALEPH+
h1Z
−∆ln
L
h2Z
−∆ln
L
h3Z
−∆ln
L
h4Z
−∆ln
L
Budapest 2001
0
0.5
1
1.5
2
2.5
3
-0.2 -0.1 0 0.1 0.20
0.5
1
1.5
2
2.5
3
-0.1 0 0.1
0
0.5
1
1.5
2
2.5
3
-0.2 -0.1 0 0.1 0.20
0.5
1
1.5
2
2.5
3
-0.2 -0.1 0 0.1 0.2
Figure 10.2: The logL curves of the four experiments, and the LEP combined curve for the fourneutral TGCs hZi , i = 1, 2, 3, 4. In each case, the minimal value is subtracted.
74

SM
LEP Preliminary
68% CL
95% CL
h1γ
h 2γ
Budapest 2001
-0.2
0
0.2
-0.2 -0.1 0 0.1 0.2
SM
LEP Preliminary
68% CL
95% CL
h3γ
h 4γ
Budapest 2001
-0.2
0
0.2
-0.2 -0.1 0 0.1 0.2
SM
LEP Preliminary
68% CL
95% CL
h1Z
h 2Z
Budapest 2001
-0.5
0
0.5
-0.5 0 0.5
SM
LEP Preliminary
68% CL
95% CL
h3Z
h 4Z
Budapest 2001
-0.5
0
0.5
-0.5 0 0.5
Figure 10.3: Contour curves of 68% C.L. and 95% C.L. in the planes (hγ1 , hγ2 ), (hγ3 , h
γ4), (hZ1 , h
Z2 ) and
(hZ3 , hZ4 ) showing the LEP combined result.
75

10.4.2 Neutral Triple Gauge Boson Couplings in ZZ Production
The individual analyses and results of the experiments for the f -couplings are described in [175,176,179,180].
Single-Parameter Analyses
The results for each experiment are shown in Table 10.5, where the errors include both statistical andsystematic uncertainties. The individual logL curves and their sum are shown in Figure 10.4. Theresults of the combination are given in Table 10.6.
Two-Parameter Analyses
The results from each experiment are shown in Table 10.7, where the errors include both statistical andsystematic uncertainties. The 68% C.L. and 95% C.L. contour curves resulting from the combinationsof the two-dimensional likelihood curves are shown in Figure 10.5. The LEP average values are givenin Table 10.8.
10.4.3 Quartic Gauge Boson Couplings
The individual analyses and results of the experiments for the quartic gauge couplings are describedin [181–183].
The results for each experiment are shown in Table 10.9, where the uncertainties include bothstatistical and systematic effects. The individual logL curves and their sum are shown in Figures 10.6.The results of the combination are given in Table 10.10.
Conclusions
No significant deviation from the Standard Model prediction is seen for any of the electroweak gaugeboson couplings studied.
76

Parameter ALEPH DELPHI L3 OPAL
fγ4 [−0.26, +0.26] [−0.26, +0.28] [−0.24, +0.26] [−0.36, +0.36]
fZ4 [−0.44, +0.43] [−0.49, +0.42] [−0.43, +0.41] [−0.55, +0.64]
fγ5 [−0.54, +0.56] [−0.48, +0.61] [−0.48, +0.56] [−0.82, +0.72]
fZ5 [−0.73, +0.83] [−0.42, +0.69] [−0.46, +1.2] [−0.96, +0.31]
Table 10.5: The 95% C.L. intervals (∆ logL = 1.92) measured by ALEPH, DELPHI, L3 and OPAL.In each case the parameter listed is varied while the remaining ones are fixed to their Standard Modelvalues. Both statistical and systematic uncertainties are included.
Parameter 95% C.L.
fγ4 [−0.17, +0.19]
fZ4 [−0.31, +0.28]
fγ5 [−0.36, +0.40]
fZ5 [−0.36, +0.39]
Table 10.6: The 95% C.L. intervals (∆ logL = 1.92) obtained combining the results from all fourexperiments. In each case the parameter listed is varied while the remaining ones are fixed to theirStandard Model values. Both statistical and systematic uncertainties are included.
Parameter ALEPH DELPHI L3 OPAL
fγ4 [−0.26, +0.26] [−0.26, +0.28] [−0.24, +0.26] [−0.36, +0.36]
fZ4 [−0.44, +0.43] [−0.49, +0.42] [−0.43, +0.41] [−0.54, +0.63]
fγ5 [−0.52, +0.53] [−0.52, +0.61] [−0.48, +0.56] [−0.77, +0.73]
fZ5 [−0.77, +0.86] [−0.44, +0.69] [−0.46, +1.2] [−0.96, +0.44]
Table 10.7: The 95% C.L. intervals (∆ logL = 1.92) measured by ALEPH, DELPHI, L3 and OPAL.In each case the two parameters listed are varied while the remaining ones are fixed to their StandardModel values. Both statistical and systematic uncertainties are included.
Parameter 95% C.L. Correlations
fγ4 [−0.17, +0.19] 1.00 +0.10
fZ4 [−0.30, +0.28] +0.10 1.00
fγ5 [−0.34, +0.38] 1.00 −0.18
fZ5 [−0.36, +0.38] −0.18 1.00
Table 10.8: The 95% C.L. intervals (∆ logL = 1.92) obtained combining the results from all fourexperiments. In each case the two parameters listed are varied while the remaining ones are fixed totheir Standard Model values. Both statistical and systematic uncertainties are included. Since theshape of the log-likelihood is not parabolic, there is some ambiguity in the definition of the correlationcoefficients and the values quoted here are approximate.
77

Parameter [GeV−2] ALEPH L3 OPAL
aW0 /Λ2 [−0.029, +0.029] [−0.017, +0.017] [−0.065, +0.065]
aWc /Λ2 [−0.079, +0.080] [−0.03, +0.05] [−0.13, +0.17]
an/Λ2 — [−0.15, +0.14] [−0.61, +0.57]
Table 10.9: The 95% C.L. intervals (∆ logL = 1.92) measured by ALEPH, L3 and OPAL. In eachcase the parameter listed is varied while the remaining ones are fixed to their Standard Model values.Both statistical and systematic uncertainties are included.
Parameter [GeV−2] 95% C.L.
aW0 /Λ2 [−0.018, +0.018]
aWc /Λ2 [−0.033, +0.047]
an/Λ2 [−0.17, +0.15]
Table 10.10: The 95% C.L. intervals (∆ logL = 1.92) obtained combining the results from ALEPH,L3 and OPAL. In each case the parameter listed is varied while the remaining ones are fixed to theirStandard Model values. Both statistical and systematic uncertainties are included.
78

PreliminaryLEP OPALL3+DELPHI+ALEPH+
f4γ
−∆ln
L
f4Z
−∆ln
L
f5γ
−∆ln
L
f5Z
−∆ln
L
Budapest 2001
0
0.5
1
1.5
2
2.5
3
-0.4 -0.2 0 0.2 0.40
0.5
1
1.5
2
2.5
3
-1 -0.5 0 0.5 1
0
0.5
1
1.5
2
2.5
3
-1 -0.5 0 0.5 10
0.5
1
1.5
2
2.5
3
-1 0 1
Figure 10.4: The logL curves of the four experiments, and the LEP combined curve for the fourneutral TGCs fVi , V = γ, Z, i = 4, 5. In each case, the minimal value is subtracted.
79

SM
LEP Preliminary
68% CL
95% CL
f4γ
f 4Z
Budapest 2001
-0.5
-0.25
0
0.25
0.5
-0.4 -0.2 0 0.2 0.4
SM
LEP Preliminary
68% CL
95% CL
f5γ
f 5Z
Budapest 2001
-1
-0.5
0
0.5
1
-1 -0.5 0 0.5 1
Figure 10.5: Contour curves of 68% C.L. and 95% C.L. in the plane (fγ4 , fZ4 ) and (fγ5 , f
Z5 )showing
the LEP combined result.
80

LEP OPALL3 +ALEPH+
a0w/Λ2 [GeV-2]
−∆ln
L
acw/Λ2 [GeV-2]
−∆ln
L
an/Λ2 [GeV-2]
−∆ln
L
a0w/Λ2,ac
w/Λ2: WWγ+ννγγ
an/Λ2 : WWγ
Budapest 2001
0
0.5
1
1.5
2
2.5
3
-0.1 0 0.10
0.5
1
1.5
2
2.5
3
-0.2 0 0.2
0
0.5
1
1.5
2
2.5
3
-1 0 1
Figure 10.6: The logL curves of ALEPH, L3 and OPAL, and the LEP combined curve for the QGCsaW0 /Λ
2, aWc /Λ2 and an/Λ
2. In each case, the minimal value is subtracted.
81

Chapter 11
W-Boson Mass and Width at LEP-II
Updates with respect to summer 2000:
Additional preliminary results based on the data collected in the year 2000 are included.
11.1 W Mass Measurements
The W boson mass results presented in this Chapter are obtained from data recorded over a range ofcentre-of-mass energies,
√s = 161−209 GeV, during the 1996-2000 operation of the LEP collider. The
results reported by the ALEPH, DELPHI and L3 collaborations include an analysis of the year 2000data, and have an integrated luminosity per experiment of about 700 pb−1. The OPAL collaborationhas analysed the data up to and including 1999 and has an integrated luminosity of approximately450 pb−1.
The results on the W mass and width quoted below correspond to a definition based on a Breit-Wigner denominator with an s-dependent width, |(s −m2
W) + isΓW/mW|.
Since 1996 the LEP e+e− collider has been operating above the threshold for W+W− pair produc-tion. Initially, 10 pb−1 of data were recorded close to the W+W− pair production threshold. At thisenergy the W+W− cross section is sensitive to the W boson mass, mW. Table 11.1 summarises theW mass results from the four LEP collaborations based on these data [97].
THRESHOLD ANALYSIS [97]Experiment mW(threshold)/GeV
ALEPH 80.14 ± 0.35DELPHI 80.40 ± 0.45
L3 80.80+0.48−0.42
OPAL 80.40+0.46−0.43
Table 11.1: W mass measurements from the W+W− threshold cross section at√s = 161 GeV. The
errors include statistical and systematic contributions.
Subsequently LEP has operated at energies significantly above the W+W− threshold, where thee+e− → W+W− cross section has little sensitivity to mW. For these higher energy data mW is mea-sured through the direct reconstruction of the W boson’s invariant mass from the observed jets and
82

leptons. Table 11.2 summarises the W mass results presented individually by the four LEP experi-ments using the direct reconstruction method. The combined values of mW from each collaborationtake into account the correlated systematic uncertainties between the decay channels and betweenthe different years of data taking. In addition to the combined numbers, each experiment presentsmass measurements from W+W−→qqℓνe and W+W−→qqqq channels separately. The DELPHI andOPAL collaborations provide results from independent fits to the data in the qqℓνe and qqqq decaychannels separately and hence account for correlations between years but do not include correlationsbetween the two channels. The qqℓνe and qqqq results quoted by the ALEPH and L3 collaborationsare obtained from a simultaneous fit to all data which, in addition to other correlations, takes intoaccount the correlated systematic uncertainties between the two channels. The L3 result is unchangedwhen determined through separate fits. The large variation in the systematic uncertainties in theW+W−→qqqq channel are caused by differing estimates of the possible effects of Colour Reconnec-tion (CR) and Bose-Einstein Correlations (BEC); this is discussed below. The systematic errors in theW+W−→qqℓνe channel are dominated by uncertainties from hadronisation, with estimates rangingfrom 15 to 30 MeV.
DIRECT RECONSTRUCTIONW+W−→qqℓνe W+W−→qqqq Combined
Experiment mW/GeV mW/GeV mW/GeV
ALEPH [185–187] 80.456 ± 0.051 ± 0.032 80.507 ± 0.054 ± 0.045 80.477 ± 0.038 ± 0.032DELPHI [99,188–190] 80.414 ± 0.074 ± 0.048 80.384 ± 0.053 ± 0.065 80.399 ± 0.045 ± 0.049
L3 [100,191–194] 80.314 ± 0.074 ± 0.045 80.478 ± 0.063 ± 0.069 80.389 ± 0.048 ± 0.051OPAL [101,195–198] 80.516 ± 0.067 ± 0.030 80.408 ± 0.066 ± 0.100 80.491 ± 0.053 ± 0.038
Table 11.2: Preliminary W mass measurements from direct reconstruction (√s = 172 − 209 GeV).
The first error is statistical and the second systematic. Results are given for the semi-leptonic, fully-hadronic channels and the combined value. The W+W−→qqℓνe results from the ALEPH and OPALcollaborations include mass information from the W+W−→ℓνeℓνe channel.
11.2 Combination Procedure
A combined LEP W mass measurement is obtained from the results of the four experiments. In orderto perform a reliable combination of the measurements, a more detailed input than that given in Ta-ble 11.2 is required. Each experiment provided a W mass measurement for both the W+W−→qqℓνeand W+W−→qqqq channels for each of the data taking years (1996-2000) that it had analysed. In addi-tion to the four threshold measurements a total of 36 direct reconstruction measurements are supplied:ALEPH and DELPHI provided 10 measurements (1996-2000), L3 gave 8 measurements (1996-2000)having already combined the 1996 and 1997 results and OPAL provided 8 measurements (1996-1999).The W+W−→ℓνeℓνe channel is also analysed by the ALEPH(1997-2000) and OPAL(1997-2000) col-laborations; the lower precision results obtained from this channel are combined by the experimentswith their W+W−→qqℓνe channel mass determinations.
Subdividing the results by data-taking years enables a proper treatment of the correlated system-atic uncertainty from the LEP beam energy and other dependences on the centre-of-mass energy ordata-taking period. A detailed breakdown of the sources of systematic uncertainty are provided foreach result and the correlations specified. The inter-year, inter-channel and inter-experiment correla-tions are included in the combination. The main sources of correlated systematic errors are: colourreconnection, Bose-Einstein correlations, hadronisation, the LEP beam energy, and uncertainties from
83

SK-I W Mass Bias Comparison
ALEPH- Error on points 0 to 17 MeV
DELPHI - Error on points 0 to 6 MeV
L3 - Error on points 0 to 15 MeV
OPAL - Error on points 0 to 13 MeV
% Reconnected Events
W M
ass
SK1-
Sta
ndar
d Je
tset
(M
eV)
-50
0
50
100
150
200
250
300
0 10 20 30 40 50 60 70 80 90 100
Figure 11.1: W mass bias obtained in the SK-I model of colour reconnection relative to a simulationwithout colour reconnection as a function of the fraction of events reconnected, at a centre of massenergy of 189 GeV and for the fully-hadronic decay channel. The analyses of the four LEP experimentsshow similar sensitivity to this effect. The points connected by the lines have correlated uncertaintiesincreasing to the right in the range indicated.
initial and final state radiation. The full correlation matrix for the LEP beam energy is employed [199].The combination is performed and the evaluation of the components of the total error assessed usingthe Best Linear Unbiased Estimate (BLUE) technique, see Reference 82.
The four LEP collaborations gave different estimates of the systematic errors arising from finalstate interactions: these varied from 30-66 MeV for colour reconnection and from 20-67 MeV for Bose-Einstein correlations. This range of estimates could be due to different experimental sensitivities tothese effects or, alternatively, simply a reflection of the different phenomenological models used toassess the uncertainties. This question is resolved by comparing the results of the experiments whenanalysing simulation samples with and without CR effects in the SK-I model [200]. Studies of thesesamples demonstrate that the four experiments are equally sensitive to colour reconnection effects,i.e. when looking at the same CR model similar biases are seen by all experiments. This is shownin Figure 11.1 as a function of the fraction of reconnected events, a reconnection fraction of 30% ofevents is typically assumed by the experiments for the assessment of systematic uncertainties.
For this reason a common value of the CR systematic uncertainty is used in the combination.For Bose-Einstein Correlations, no similar test is made of the respective experimental sensitivities.
84

Source Systematic Error on mW (MeV)qqℓνe qqqq Combined
ISR/FSR 8 9 8Hadronisation 19 17 17Detector Systematics 12 8 10LEP Beam Energy 17 17 17Colour Reconnection − 40 11Bose-Einstein Correlations − 25 7Other 4 4 3
Total Systematic 29 54 30
Statistical 33 30 26
Total 44 62 40
Statistical in absence of Systematics 32 29 22
Table 11.3: Error decomposition for the combined LEP W mass results. Detector systematics includeuncertainties in the jet and lepton energy scales and resolution. The ‘Other’ category refers to errors,all of which are uncorrelated between experiments, arising from: simulation statistics, backgroundestimation, four-fermion treatment, fitting method and event selection. The error decompositionin the qqℓνe and qqqq channels refers to the independent fits to the results from the two channelsseparately.
However, in the absence of evidence that the experiments have different sensitivities to the effect, acommon value of the systematic uncertainty from BEC is assumed. In the combination a commoncolour reconnection error of 40 MeV and a common Bose-Einstein systematic uncertainty of 25 MeVare used. These values are chosen as representative averages of the estimates of the different LEPexperiments, resulting in the same final error on mW as obtained when using the BEC and CRestimates of the experiments. Applying this procedure changes the value of mW from the fit by 7MeV.
11.3 LEP Combined W Boson Mass
The combined W mass from direct reconstruction is
mW(direct) = 80.450 ± 0.026(stat.) ± 0.030(syst.) GeV,
with a χ2/d.o.f. of 31.1/35, corresponding to a χ2 probability of 66%. The weight of the fully-hadronicchannel in the combined fit is 0.27. This reduced weight is a consequence of the relatively large size ofthe current estimates of the systematic errors from CR and BEC. Table 11.3 gives a breakdown of thecontribution to the total error of the various sources of systematic errors. The largest contributionto the systematic error comes from hadronisation uncertainties, which are conservatively treated ascorrelated between the two channels, between experiments and between years. In the absence ofsystematic effects the current LEP statistical precision on mW would be 22 MeV: the statistical errorcontribution in the LEP combination is larger than this (26 MeV) due to the significantly reducedweight of the fully-hadronic channel.
In addition to the above results, the W boson mass is measured at LEP from the 10 pb−1 per
85

experiment of data recorded at threshold for W pair production:
mW(threshold) = 80.40 ± 0.20(stat.) ± 0.07(syst.) ± 0.03(Ebeam) GeV.
When the threshold measurements are combined with the much more precise results obtained fromdirect reconstruction one achieves a W mass measurement of
mW = 80.450 ± 0.026(stat.) ± 0.030(syst.)GeV.
The LEP beam energy uncertainty is the only correlated systematic error source between the thresholdand direct reconstruction measurements. The threshold measurements have a weight of only 0.02 inthe combined fit. This LEP combined result is compared with the results (threshold and directreconstruction combined) of the four LEP experiments in Figure 11.2.
11.4 Consistency Checks
The difference between the combined W boson mass measurements obtained from the fully-hadronicand semi-leptonic channels, ∆mW(qqqq − qqℓνe), is determined:
∆mW(qqqq − qqℓνe) = +9 ± 44 MeV.
A significant non-zero value for ∆mW could indicate that FSI effects are biasing the value of mW
determined from W+W−→qqqq events. Since ∆mW is primarily of interest as a check of the possibleeffects of final state interactions, the errors from CR and BEC are set to zero in its determination. Theresult is obtained from a fit where the imposed correlations are the same as those for the results givenin the previous sections. This result is almost unchanged if the systematic part of the error on mW
from hadronisation effects is considered as uncorrelated between channels, although the uncertaintyincreases by 16%. The study of the mass difference and the equivalent analysis for the W width arenot used to place limits on colour reconnection, for example using the study of the W mass bias in theSK-I colour reconnection model reported in Section 11.2. This is because only one model is analysedthere, and, taken in isolation, the results are not sufficiently precise.
The masses from the two channels obtained from this fit with the BEC and CR errors now includedare:
mW(W+W−→qqℓνe) = 80.448 ± 0.033(stat.) ± 0.028(syst.) GeV,
mW(W+W−→qqqq) = 80.457 ± 0.030(stat.) ± 0.054(syst.) GeV.
These two results are correlated and have a correlation coefficient of 0.28. The value of χ2/d.o.f is31.1/34, corresponding to a χ2 probability of 62%. These results and the correlation between themcan be used to combine the two measurements or to form the mass difference. The LEP combinedresults from the two channels are compared with those quoted by the individual experiments in Figure11.3.
Experimentally, separatemW measurements are obtained from the W+W−→qqℓνe and W+W−→qqqqchannels for each of the years of data. The combination using only the qqℓνe measurements yields:
mindepW (W+W−→qqℓνe) = 80.448 ± 0.033(stat.) ± 0.029(syst.) GeV.
86

The systematic error is dominated by hadronisation uncertainties (±19 MeV) and the uncertainty inthe LEP beam energy (±17 MeV). The combination using only the qqqq measurements gives:
mindepW (W+W−→qqqq) = 80.447 ± 0.030(stat.) ± 0.054(syst.) GeV.
where the dominant contributions to the systematic error arise from BEC/CR (±47 MeV), hadroni-sation (±17 MeV) and from the uncertainty in the LEP beam energy (±17 MeV).
11.5 LEP Combined W Boson Width
The method of direct reconstruction is also well suited to the direct measurement of the width of theW boson. The results of the four LEP experiments are shown in Table 11.4 and in Figure 11.2.
Experiment ΓW (GeV)
ALEPH 2.13 ± 0.11 ± 0.09DELPHI 2.11 ± 0.10 ± 0.07
L3 2.24 ± 0.11 ± 0.15OPAL 2.04 ± 0.16 ± 0.09
Table 11.4: Preliminary W width measurements (√s = 172 − 209 GeV) from the individual experi-
ments. The first error is statistical and the second systematic.
Each experiment provided a W width measurement for both W+W−→qqℓνe and W+W−→qqqqchannels for each of the data taking years (1996-2000) that it has analysed. A total of 25 measurementsare supplied: ALEPH provided 3 W+W−→qqqq results (1998-2000) and two W+W−→qqℓνe results(1998-1999), DELPHI 8 measurements (1997-2000), L3 8 measurements (1996-2000) having alreadycombined the 1996 and 1997 results and OPAL provided 4 measurements (1996-1998) where for thefirst two years the W+W−→qqℓνe and W+W−→qqqq results are already combined.
A common colour reconnection error of 65 MeV and a common Bose-Einstein correlation error of35 MeV are used in the combination. This procedure resulted in the same error on ΓW as obtainedusing the BEC/CR errors supplied by the experiments. The change in the value of the width is only2 MeV.
A simultaneous fit to the results of the four LEP collaborations is performed in the same wayas for the mW measurement. Correlated systematic uncertainties are taken into account and thecombination gives:
ΓW = 2.150 ± 0.068(stat.) ± 0.060(syst.) GeV,
with a χ2/d.o.f. of 19.7/24, corresponding to a χ2 probability of 71%.
11.6 Summary
The results of the four LEP experiments on the mass and width of the W boson are combined takinginto account correlated systematic uncertainties, giving:
mW = 80.450 ± 0.039 GeV,
ΓW = 2.150 ± 0.091 GeV.
87

0
0.1
0.2
0.3
0.4
0.5
0.6
0.7
0.8
0.9
1
80 80.1 80.2 80.3 80.4 80.5 80.6 80.7 80.8 80.9 8180.0 81.0
mW[GeV]
LEP working groupχ2/dof = 32.5 / 39
ALEPH [1996-2000] 80.471±0.049
DELPHI [1996-2000] 80.401±0.066
L3 [1996-2000] 80.398±0.069
OPAL [1996-1999] 80.490±0.065
LEP 80.450±0.039
Summer 2001 - LEP Preliminary
1.5 2.0 2.5
ΓW[GeV]
LEP working groupχ2/dof = 19.7 / 24
ALEPH [1998-2000] 2.13±0.14
DELPHI [1997-2000] 2.11±0.12
L3 [1996-2000] 2.24±0.19
OPAL [1996-1998] 2.04±0.18
LEP 2.150±0.091
Summer 2001 - LEP Preliminary
Figure 11.2: The combined results for the measurements of the W mass (left) and W width (right)compared to the results obtained by the four LEP collaborations. The combined values take intoaccount correlations between experiments and years and hence, in general, do not give the samecentral value as a simple average. In the LEP combination of the qqqq results common values (seetext) for the CR and BEC errors are used. The individual and combined mW results include themeasurements from the threshold cross section.
00.10.20.30.40.50.60.70.80.91
8080.180.280.380.480.580.680.780.880.98180.0 81.0
mW[GeV] (non-4q)
LEP working groupcorrel. with 4q = 0.28
ALEPH [1996-2000] 80.456±0.060
DELPHI [1996-2000] 80.414 ±0.089
L3 [1996-2000] 80.314±0.087
OPAL [1996-1999] 80.516±0.073
LEP 80.448±0.043
Summer 2001 - LEP Preliminary
00.10.20.30.40.50.60.70.80.91
8080.180.280.380.480.580.680.780.880.98180.0 81.0
mW[GeV] (4q)
LEP working groupcorrel. with non-4q = 0.28
ALEPH [1996-2000] 80.507±0.070
DELPHI [1996-2000] 80.384±0.084
L3 [1996-2000] 80.478±0.093
OPAL [1996-1999] 80.408±0.120
LEP 80.457±0.062
Summer 2001 - LEP Preliminary
Figure 11.3: The W mass measurements from the W+W−→qqℓνe (left) and W+W−→qqqq (right)channels obtained by the four LEP collaborations compared to the combined value. The combinedvalues take into account correlations between experiments, years and the two channels. In the LEPcombination of the qqqq results common values (see text) for the CR and BEC errors are used. TheALEPH and L3 qqℓνe and qqqq results are correlated since they are obtained from a fit to bothchannels taking into account inter-channel correlations.
88

Chapter 12
Effective Couplings of the Neutral Weak
Current
Updates with respect to summer 2000:
Effective vector and axial-vector coupling constants are also determined for the heavy quark flavours.
12.1 The Coupling Parameters Af
The coupling parameters Af are defined in terms of the effective vector and axial-vector neutral currentcouplings of fermions (Equation (2.4)). The LEP measurements of the forward-backward asymmetries
of charged leptons (Chapter 2) and b and c quarks (Chapter 5) determine the products A0, fFB = 3
4AeAf
(Equation (2.3)). The LEP measurements of the τ polarisation (Chapter 3), Pτ (cos θ), determineAτ and Ae separately (Equation (3.2)). Owing to polarised beams at SLC, SLD measures the cou-pling parameters directly with the left-right and forward-backward left-right asymmetries (Chapters 4and 5).
Table 12.1 shows the results for the leptonic coupling parameter Aℓ from the LEP and SLDmeasurements, assuming lepton universality.
Using the measurements of Aℓ one can extract Ab and Ac from the LEP measurements of the band c quark asymmetries. The SLD measurements of the left-right forward-backward asymmetriesfor b and c quarks are direct determinations of Ab and Ac. Table 12.2 shows the results on the
Aℓ Cumulative Average χ2/d.o.f.
A0, ℓFB 0.1512 ± 0.0042
Pτ 0.1465 ± 0.0033 0.1482 ± 0.0026 0.8/1
Aℓ (SLD) 0.1513 ± 0.0021 0.1501 ± 0.0016 1.6/2
Table 12.1: Determination of the leptonic coupling parameter Aℓ assuming lepton universality. Thesecond column lists the Aℓ values derived from the quantities listed in the first column. The thirdcolumn contains the cumulative averages of the Aℓ results up to and including this line. The χ2 perdegree of freedom for the cumulative averages is given in the last column.
89

LEP SLD LEP+SLD Standard
(Aℓ = 0.1482 ± 0.0026) (Aℓ = 0.1501 ± 0.0016) Model fit
Ab 0.891 ± 0.022 0.922 ± 0.020 0.899 ± 0.013 0.935
Ac 0.615 ± 0.033 0.670 ± 0.026 0.645 ± 0.020 0.668
Table 12.2: Determination of the quark coupling parameters Ab and Ac from LEP data alone (usingthe LEP average for Aℓ), from SLD data alone, and from LEP+SLD data (using the LEP+SLDaverage for Aℓ) assuming lepton universality.
quark coupling parameters Ab and Ac derived from LEP measurements (Equations 5.6) and SLDmeasurements separately, and from the combination of LEP+SLD measurements (Equation 5.7).
The LEP extracted values of Ab and Ac are in agreement with the SLD measurements, but some-what lower than the Standard Model predictions (0.935 and 0.668, respectively, essentially independentof mt and mH). The combination of LEP and SLD of Ab is 2.8 sigma below the Standard Model,while Ac agrees at the 1.2 sigma level. This is mainly because the Ab value, deduced from the mea-sured A0, b
FB and the combined Aℓ, is significantly lower than both the Standard Model and the directmeasurement of Ab, this can also be seen in Figure 12.1.
12.2 The Effective Vector and Axial-Vector Coupling Constants
The partial widths of the Z into leptons and the lepton forward-backward asymmetries (Section 2),the τ polarisation and the τ polarisation asymmetry (Section 3) are combined to determine the effec-tive vector and axial-vector couplings for e, µ and τ . The asymmetries (Equations (2.3) and (3.2))determine the ratio gVℓ/gAℓ (Equation (2.4)), while the leptonic partial widths determine the sum ofthe squares of the couplings:
Γℓℓ =GFm
3Z
6π√
2(g2Vℓ + g2Aℓ)(1 + δQED
ℓ ) , (12.1)
where δQEDℓ = 3q2ℓα(m2
Z)/(4π), with qℓ denoting the electric charge of the lepton, accounts for finalstate photonic corrections. Corrections due to lepton masses, neglected in Equation 12.1, are takeninto account for the results presented below.
The averaged results for the effective lepton couplings are given in Table 12.3 for both the LEPdata alone as well as for the LEP and SLD measurements. Figure 12.2 shows the 68% probabilitycontours in the gAℓ-gVℓ plane for the individual lepton species. The signs of gAℓ and gVℓ are basedon the convention gAe < 0. With this convention the signs of the couplings of all charged leptonsfollow from LEP data alone. The measured ratios of the e, µ and τ couplings provide a test of leptonuniversality and are shown in Table 12.3. All values are consistent with lepton universality. Thecombined results assuming universality are also given in the table and are shown as a solid contour inFigure 12.2.
The neutrino couplings to the Z can be derived from the measured value of the invisible widthof the Z, Γinv (see Table 2.4), attributing it exclusively to the decay into three identical neutrinogenerations (Γinv = 3Γνν) and assuming gAν ≡ gV ν ≡ gν . The relative sign of gν is chosen to be inagreement with neutrino scattering data [201], resulting in gν = +0.50068 ± 0.00075.
90

0.7
0.8
0.9
1
0.13 0.14 0.15 0.16 0.17
Al
Ab
Preliminary
SM
0.5
0.6
0.7
0.8
0.13 0.14 0.15 0.16 0.17
AlA
c
Preliminary
SM
Figure 12.1: The measurements of the combined LEP+SLD Aℓ (vertical band), SLD Ab,Ac (horizontal
bands) and LEP A0, bFB ,A0, c
FB (diagonal bands), compared to the Standard Model expectations (arrows).The arrow pointing to the left shows the variation in the Standard Model prediction for mH in therange 300+700
−186 GeV, and the arrow pointing to the right for mt in the range 174.3±5.1 GeV. Varying the
hadronic vacuum polarisation by ∆α(5)had(m2
Z) = 0.02761 ± 0.00036 yields an additional uncertainty onthe Standard-Model prediction, oriented in direction of the Higgs-boson arrow and size correspondingto the top-quark arrow. Also shown is the 68% confidence level contour for the two asymmetryparameters resulting from the joint analyses. Although the A0, b
FB measurements prefer a high Higgsmass, the Standard Model fit to the full set of measurements prefers a low Higgs mass, for examplebecause of the influence of Aℓ.
In addition, the couplings analysis is extended to include also the heavy-flavour measurements aspresented in Section 5.3. Assuming neutral-current lepton universality, the effective coupling constantsare determined jointly for leptons as well as for b and c quarks. QCD corrections, modifying Equa-tion 12.1, are taken from the Standard Model, as is also done to obtain the quark pole asymmetries,see Section 5.2.3.
The results are also reported in Table 12.3 and shown in Figure 12.3. The deviation of the b-quarkcouplings from the Standard-Model expectation is mainly caused by the combined value of Ab beinglow as discussed in Section 12.1 and shown in Figure 12.1.
91

Without Lepton Universality:
LEP LEP+SLD
gAe −0.50112 ± 0.00035 −0.50111 ± 0.00035
gAµ −0.50115 ± 0.00056 −0.50120 ± 0.00054
gAτ −0.50204 ± 0.00064 −0.50204 ± 0.00064
gVe −0.0378 ± 0.0011 −0.03816 ± 0.00047
gVµ −0.0376 ± 0.0031 −0.0367 ± 0.0023
gVτ −0.0368 ± 0.0011 −0.0366 ± 0.0010
Ratios of couplings:
LEP LEP+SLD
gAµ/gAe 1.0001 ± 0.0014 1.0002 ± 0.0014
gAτ/gAe 1.0018 ± 0.0015 1.0019 ± 0.0015
gVµ/gVe 0.995 ± 0.096 0.962 ± 0.063
gVτ/gVe 0.973 ± 0.041 0.958 ± 0.029
With Lepton Universality:
LEP LEP+SLD
gAℓ −0.50126 ± 0.00026 −0.50123 ± 0.00026
gVℓ −0.03736 ± 0.00066 −0.03783 ± 0.00041
gν +0.50068 ± 0.00075 +0.50068 ± 0.00075
With Lepton Universality
and Heavy Flavour Results:
LEP LEP+SLD
gAℓ −0.50126 ± 0.00026 −0.50125 ± 0.00026
gAb −0.5179 ± 0.0078 −0.5146 ± 0.0051
gAc +0.5032 ± 0.0079 +0.5043 ± 0.0052
gVℓ −0.03736 ± 0.00066 −0.03751 ± 0.00037
gVb −0.317 ± 0.012 −0.3221 ± 0.0077
gVc +0.173 ± 0.011 +0.1843 ± 0.0067
Table 12.3: Results for the effective vector and axial-vector couplings derived from the LEP data andthe combined LEP and SLD data without and with the assumption of lepton universality. Note thatthe results, in particular for b quarks, are highly correlated.
92

-0.041
-0.038
-0.035
-0.032
-0.503 -0.502 -0.501 -0.5
gAl
g Vl
Preliminary
68% CL
l+l−
e+e−
µ+µ−
τ+τ−
mt
mH
∆α
Figure 12.2: Contours of 68% probability in the (gVℓ,gAℓ) plane from LEP and SLD measurements.The solid contour results from a fit to the LEP and SLD results assuming lepton universality. Theshaded region corresponds to the Standard Model prediction for mt = 174.3 ± 5.1 GeV and mH =300+700
−186 GeV. The arrows point in the direction of increasing values of mt and mH. Varying the
hadronic vacuum polarisation by ∆α(5)had(m2
Z) = 0.02761 ± 0.00036 yields an additional uncertainty onthe Standard-Model prediction indicated by the corresponding arrow.
93

-0.35
-0.33
-0.31
-0.29
-0.54 -0.52 -0.50 -0.48
gAb
g Vb
Preliminary
68.3 95.5 99.5 % CL
SM
0.16
0.18
0.2
0.22
0.47 0.5 0.53
gAc
g Vc
Preliminary
68.3 95.5 99.5 % CL
SM
Figure 12.3: Contours of 68.3, 95.5 and 99.5% probability in the (gVq,gAq) plane from LEP andSLD measurements for b and c quarks and assuming lepton universality. The dot corresponds to
the Standard Model prediction for mt = 174.3 ± 5.1 GeV, mH = 300+700−186 GeV and ∆α
(5)had(m2
Z) =0.02761 ± 0.00036. 94

12.3 The Leptonic Effective Electroweak Mixing Angle sin2 θlepteff
The asymmetry measurements from LEP and SLD can be combined into a single parameter, theeffective electroweak mixing angle, sin2 θlepteff , defined as:
sin2 θlepteff ≡ 1
4
(
1 − gVℓ
gAℓ
)
, (12.2)
without making strong model-specific assumptions.
For a combined average of sin2 θlepteff from A0, ℓFB, Aτ and Ae only the assumption of lepton uni-
versality, already inherent in the definition of sin2 θlepteff , is needed. Also the value derived from themeasurements of Aℓ from SLD is given. We also include the hadronic forward-backward asymmetries,assuming the difference between sin2 θfeff for quarks and leptons to be given by the Standard Model.
This is justified within the Standard Model as the hadronic asymmetries A0,bFB and A0, c
FB have a re-duced sensitivity to the small non-universal corrections specific to the quark vertex. The results ofthese determinations of sin2 θlepteff and their combination are shown in Table 12.4 and in Figure 12.4.The combinations based on the leptonic results plus Aℓ(SLD) and on the hadronic forward-backwardasymmetries differ by 3.3 standard deviations, mainly caused by the two most precise measurementsof sin2 θlepteff , Aℓ (SLD) dominated by A0
LR, and A0,bFB (LEP). This is the same effect as discussed already
in sections 12.1 and 12.2 and shown in Figures 12.1 and 12.3: the deviation in Ab as extracted fromA0, b
FB discussed above is reflected in the value of sin2 θlepteff extracted from A0, bFB in this analysis.
sin2 θlepteff Average by Group Cumulative
of Observations Average χ2/d.o.f.
A0, ℓFB 0.23099 ± 0.00053
Aℓ (Pτ ) 0.23159 ± 0.00041 0.23137 ± 0.00033
Aℓ (SLD) 0.23098 ± 0.00026 0.23113 ± 0.00021 0.8/1
A0, bFB 0.23226 ± 0.00031
A0, cFB 0.23272 ± 0.00079
〈QFB〉 0.2324 ± 0.0012 0.23230 ± 0.00029 0.23152 ± 0.00017 12.8/5
Table 12.4: Determinations of sin2 θlepteff from asymmetries. The second column lists the sin2 θlepteffvalues derived from the quantities listed in the first column. The third column contains the averagesof these numbers by groups of observations, where the groups are separated by the horizontal lines.The fourth column shows the cumulative averages. The χ2 per degree of freedom for the cumulativeaverages is also given. The averages are performed including the small correlation between A0, b
FB and
A0, cFB.
95

10 2
10 3
0.23 0.232 0.234
Preliminary
sin2θlept
eff
mH [
GeV
]
χ2/d.o.f.: 12.8 / 5
A0,l
fb 0.23099 ± 0.00053
Al(Pτ) 0.23159 ± 0.00041
Al(SLD) 0.23098 ± 0.00026
A0,b
fb 0.23226 ± 0.00031
A0,c
fb 0.23272 ± 0.00079
<Qfb> 0.2324 ± 0.0012
Average 0.23152 ± 0.00017
∆αhad= 0.02761 ± 0.00036∆α(5)
mZ= 91.1875 ± 0.0021 GeVmt= 174.3 ± 5.1 GeV
Figure 12.4: Comparison of several determinations of sin2 θlepteff from asymmetries. In the average,
the small correlation between A0,bFB and A0, c
FB is included. Also shown is the prediction of the StandardModel as a function of mH. The width of the Standard Model band is due to the uncertainties in∆α
(5)had(m2
Z) (see Chapter 13), mZ and mt. The total width of the band is the linear sum of theseeffects.
96

Chapter 13
Constraints on the Standard Model
Updates with respect to summer 2000:
A new determination of the hadronic vacuum polarisation is used. For the first time, the atomic parityviolation parameter measured in cesium is included in the analysis.
13.1 Introduction
The precise electroweak measurements performed at LEP and SLC and elsewhere can be used tocheck the validity of the Standard Model and, within its framework, to infer valuable informationabout its fundamental parameters. The accuracy of the measurements makes them sensitive to themass of the top quark mt, and to the mass of the Higgs boson mH through loop corrections. Whilethe leading mt dependence is quadratic, the leading mH dependence is logarithmic. Therefore, theinferred constraints on mH are much weaker than those on mt.
13.2 Measurements
The LEP and SLD measurements used are summarised in Table 13.1 together with the results of theStandard Model fit. Also shown are the results of measurements of mW from UA2 [202], CDF [203,204],and DØ [205]1, measurements of the top quark mass by CDF [207] and DØ [208]2, measurementsof the neutrino-nucleon neutral to charged current ratios from CCFR [210] and NuTeV [211], andmeasurements of atomic parity violation in cesium [212, 213] with the numerical result taken from[214,215]. Although the combined preliminary3 νN result is quoted in terms of sin2 θW = 1−m2
W/m2Z,
radiative corrections result in smallmt andmH dependences4 that are included in the fit. An additionalinput parameter, not shown in the table, is the Fermi constant GF , determined from the µ lifetime,GF = 1.16637(1) ·10−5GeV−2 [217]. The relative error of GF is comparable to that of mZ; both errorshave negligible effects on the fit results.
1See Reference 206 for a combination of these mW measurements.2 See Reference 209 for a combination of these mt measurements.3The final NuTeV result [216] is not used in this report as it was published only after the 2001 summer conferences.4The formula used is δ sin2 θW = −0.00142
m2t −(175GeV)2
(100GeV)2+ 0.00048 ln( mH
150GeV). See Reference 211 for details.
97

Measurement with Systematic Standard Pull
Total Error Error Model fit
∆α(5)had(m2
Z) [218] 0.02761 ± 0.00036 0.00035 0.02774 −0.3
a) LEP
line-shape and
lepton asymmetries:
mZ [GeV] 91.1875 ± 0.0021 (a)0.0017 91.1874 0.0
ΓZ [GeV] 2.4952 ± 0.0023 (a)0.0012 2.4963 −0.5
σ0h [nb] 41.540 ± 0.037 (b)0.028 41.481 1.6
R0ℓ 20.767 ± 0.025 (b)0.007 20.739 1.1
A0, ℓFB 0.0171 ± 0.0010 (b)0.0003 0.0165 0.7
+ correlation matrix Table 2.3
τ polarisation:
Aℓ (Pτ ) 0.1465 ± 0.0033 0.0016 0.1483 −0.5
qq charge asymmetry:
sin2 θlepteff (〈QFB〉) 0.2324 ± 0.0012 0.0010 0.2314 0.9
mW [GeV] 80.450 ± 0.039 0.030 80.398 1.3
b) SLD [219]
Aℓ (SLD) 0.1513 ± 0.0021 0.0010 0.1483 1.5
c) LEP and SLD Heavy Flavour
R0b 0.21646 ± 0.00065 0.00053 0.215743 1.1
R0c 0.1719 ± 0.0031 0.0022 0.1723 −0.1
A0, bFB 0.0990 ± 0.0017 0.0009 0.1039 −2.9
A0, cFB 0.0685 ± 0.0034 0.0017 0.0743 −1.7
Ab 0.922 ± 0.020 0.016 0.935 −0.6
Ac 0.670 ± 0.026 0.016 0.668 0.1
+ correlation matrix Table 5.3
d) pp and νN
mW [GeV] (pp [206]) 80.454 ± 0.060 0.050 80.398 0.9
sin2 θW (νN [210,211]) 0.2255 ± 0.0021 0.0010 0.2226 1.2
mt [GeV] (pp [209]) 174.3 ± 5.1 4.0 175.8 −0.3
QW(Cs) [215] −72.5 ± 0.7 0.6 −72.9 0.6
Table 13.1: Summary of measurements included in the combined analysis of Standard Model
parameters. Section a) summarises LEP averages, Section b) SLD results (sin2 θlepteff includes ALR andthe polarised lepton asymmetries), Section c) the LEP and SLD heavy flavour results and Section d)electroweak measurements from pp colliders and νN scattering. The total errors in column 2 includethe systematic errors listed in column 3. Although the systematic errors include both correlated anduncorrelated sources, the determination of the systematic part of each error is approximate. TheStandard Model results in column 4 and the pulls (difference between measurement and fit in unitsof the total measurement error) in column 5 are derived from the Standard Model fit including alldata (Table 13.2, column 5) with the Higgs mass treated as a free parameter.(a)The systematic errors on mZ and ΓZ contain the errors arising from the uncertainties in the LEP energyonly.(b)Only common systematic errors are indicated.
98

13.3 Theoretical and Parametric Uncertainties
Detailed studies of the theoretical uncertainties in the Standard Model predictions due to missinghigher-order electroweak corrections and their interplay with QCD corrections are carried out inthe working group on ‘Precision calculations for the Z resonance’ [220], and more recently in [15].Theoretical uncertainties are evaluated by comparing different but, within our present knowledge,equivalent treatments of aspects such as resummation techniques, momentum transfer scales for vertexcorrections and factorisation schemes. The effects of these theoretical uncertainties are reduced by theinclusion of higher-order corrections [221,222] in the electroweak libraries [223].
The recently calculated complete fermionic two-loop corrections on mW [224] are currently onlyused in the determination of the theoretical uncertainty. Their effect on mW is small compared tothe current experimental uncertainty on mW, however, the naive propagation of this new mW tosin2 θlepteff = κ(1 −m2
W/m2Z), keeping the electroweak form-factor κ unmodified, shows a more visible
effect as sin2 θlepteff is measured very precisely. Thus the corresponding calculations for sin2 θlepteff (or κ)and for the partial Z widths are urgently needed; in particular since partial cancellations of these newcorrections in the product κ(1 −m2
W/m2Z) = sin2 θlepteff are expected [225].
The use of the new QCD corrections [222] increases the value of αS(m2Z) by 0.001, as expected. The
effects of missing higher-order QCD corrections on αS(m2Z) covers missing higher-order electroweak
corrections and uncertainties in the interplay of electroweak and QCD corrections and is estimatedto be at least 0.002 [226]. A discussion of theoretical uncertainties in the determination of αS can befound in References 220 and 226. The determination of the size of remaining theoretical uncertaintiesis under continued study.
The theoretical errors discussed above are not included in the results presented in Table 13.2. Atpresent the impact of theoretical uncertainties on the determination of Standard Model parametersfrom the precise electroweak measurements is small compared to the error due to the uncertainty inthe value of α(m2
Z), which is included in the results.
The uncertainty in α(m2Z) arises from the contribution of light quarks to the photon vacuum
polarisation (∆α(5)had(m2
Z)):
α(m2Z) =
α(0)
1 − ∆αℓ(m2Z) − ∆α
(5)had(m2
Z) − ∆αtop(m2Z), (13.1)
where α(0) = 1/137.036. The top contribution, −0.00007(1), depends on the mass of the top quark,and is therefore determined inside the electroweak libraries [223]. The leptonic contribution is calcu-lated to third order [227] to be 0.03150, with negligible uncertainty.
For the hadronic contribution, we no longer use the value 0.02804±0.00065 [228], but rather the newevaluation 0.02761 ± 0.0036 [218] which takes into account the recently published results on electron-positron annihilations into hadrons at low centre-of-mass energies by the BES collaboration [229]. This
reduced uncertainty still causes an error of 0.00013 on the Standard Model prediction of sin2 θlepteff , anderrors of 0.2 GeV and 0.1 on the fitted values of mt and log(mH), all included in the results presentedbelow. The effect on the Standard Model prediction for Γℓℓ is negligible. The αS(m2
Z) values for theStandard Model fits presented in this Section are stable against a variation of α(m2
Z) in the intervalquoted.
There are also several evaluations of ∆α(5)had(m2
Z) [230–237] which are more theory-driven. One ofthe most recent of these (Reference 236) also includes the new results from BES, yielding 0.02738 ±
99

0.00020. To show the effects of the uncertainty of α(m2Z), we also use this evaluation of the hadronic
vacuum polarisation. Note that all these evaluations obtain values for ∆α(5)had(m2
Z) consistently lowerthan - but still in agreement with - the old value of 0.02804 ± 0.00065.
13.4 Selected Results
Figure 13.1 shows a comparison of the leptonic partial width from LEP (Table 2.4) and the effectiveelectroweak mixing angle from asymmetries measured at LEP and SLD (Table 12.4), with the Stan-dard Model. Good agreement with the Standard Model prediction is observed. The point with thearrow shows the prediction if among the electroweak radiative corrections only the photon vacuumpolarisation is included, which shows an that LEP+SLD data are sensitive to non-trivial electroweakcorrections. Note that the error due to the uncertainty on α(m2
Z) (shown as the length of the arrow)
is not much smaller than the experimental error on sin2 θlepteff from LEP and SLD. This underlines thecontinued importance of a precise measurement of σ(e+e− → hadrons) at low centre-of-mass energies.
Of the measurements given in Table 13.1, R0ℓ is one of the most sensitive to QCD corrections. For
mZ = 91.1875 GeV, and imposing mt = 174.3 ± 5.1 GeV as a constraint, αS = 0.1224 ± 0.0038 isobtained. Alternatively, σ0ℓ (see Table 2.4) which has higher sensitivity to QCD corrections and lessdependence on mH yields: αS = 0.1180 ± 0.0030. Typical errors arising from the variation of mH
between 100 GeV and 200 GeV are of the order of 0.001, somewhat smaller for σ0ℓ . These results onαS, as well as those reported in the next section, are in very good agreement with recently determinedworld averages (αS(m2
Z) = 0.118 ± 0.002 [131], or αS(m2Z) = 0.1178 ± 0.0033 based solely on NNLO
QCD results excluding the LEP lineshape results and accounting for correlated errors [238]).
13.5 Standard Model Analyses
In the following, several different Standard Model fits to the data reported in Table 13.2 are discussed.The χ2 minimisation is performed with the program MINUIT [239], and the predictions are calculatedwith TOPAZ0 [240] and ZFITTER [37]. The large χ2/d.o.f. for all of these fits is caused by the sameeffect as discussed in the previous chapter, namely the large dispersion in the values of the leptoniceffective electroweak mixing angle measured through the various asymmetries. For the analyses pre-sented here, this dispersion is interpreted as a fluctuation in one or more of the input measurements,and thus we neither modify nor exclude any of them.
To test the agreement between the LEP data and the Standard Model, a fit to the data (includingthe LEP-II mW determination) leaving the top quark mass and the Higgs mass as free parameters isperformed. The result is shown in Table 13.2, column 1. This fit shows that the LEP data predicts thetop mass in good agreement with the direct measurements. In addition, the data prefer an intermediateHiggs boson mass, albeit with very large errors. The strongly asymmetric errors on mH are due to thefact that to first order, the radiative corrections in the Standard Model are proportional to log(mH).
The data can also be used within the Standard Model to determine the top quark and W massesindirectly, which can be compared to the direct measurements performed at the pp colliders andLEP-II. In the second fit, all the results in Table 13.1, except the LEP-II and pp colliders mW andmt results are used. The results are shown in column 2 of Table 13.2. The indirect measurements ofmW and mt from this data sample are shown in Figure 13.2, compared with the direct measurements.Also shown are the Standard Model predictions for Higgs masses between 114 and 1000 GeV. As can
100

be seen in the figure, the indirect and direct measurements of mW and mt are in good agreement, andboth sets prefer a low value of the Higgs mass.
For the third fit, the direct mt measurement is used to obtain the best indirect determinationof mW. The result is shown in column 3 of Table 13.2 and in Figure 13.3. Also here, the indirectdetermination of W boson mass 80.373 ± 0.023 GeV is in agreement with the combination of directmeasurements from LEP-II and pp colliders [206] of mW = 80.451 ± 0.033 GeV. For the next fit,(column 4 of Table 13.2 and Figure 13.4), the direct mW measurements from LEP and pp collidersare included to obtain mt = 181+11
−9 GeV, in very good agreement with the direct measurement ofmt = 174.3 ± 5.1 GeV. Compared to the second fit, the error on logmH increases due to effects fromhigher-order terms.
Finally, the best constraints on mH are obtained when all data are used in the fit. The resultsof this fit are shown in column 5 of Table 13.2 and Figure 13.5. In Figure 13.5 the observed valueof ∆χ2 ≡ χ2 − χ2
min as a function of mH is plotted for the fit including all data. The solid curveis the result using ZFITTER, and corresponds to the last column of Table 13.2. The shaded bandrepresents the uncertainty due to uncalculated higher-order corrections, as estimated by ZFITTERand TOPAZ0. Compared to previous analyses, its width is enlarged towards lower Higgs-boson massesdue to the effects of the complete fermionic two-loop calculation of mW discussed above. The 95%confidence level upper limit on mH (taking the band into account) is 196 GeV. The lower limit onmH of approximately 114 GeV obtained from direct searches [241] is not used in the determination of
this limit. Also shown is the result (dashed curve) obtained when using ∆α(5)had(m2
Z) of Reference 236.That fit results in log(mH/GeV) = 2.03 ± 0.19 corresponding to mH = 106+57
−38 GeV and an upperlimit on mH of approximately 222 GeV at 95% confidence level.
In Figures 13.6 to 13.8 the sensitivity of the LEP and SLD measurements to the Higgs massis shown. As can be seen, the most sensitive measurements are the asymmetries, i.e., sin2 θlepteff . Areduced uncertainty for the value of α(m2
Z) would therefore result in an improved constraint on logmH
and thus mH, as already shown in Figures 13.1 and 13.5.
101

- 1 - - 2 - - 3 - - 4 - - 5 -
LEP including all data except all data except all data except all dataLEP-II mW mW and mt mW mt
mt [GeV] 186+13−11 169+12
−9 173.3+4.7−4.6 181+11
−9 175.8+4.4−4.3
mH [GeV] 260+404−155 81+109
−40 108+70−44 126+182
−69 88+53−35
log(mH/GeV) 2.42+0.41−0.39 1.91+0.37
−0.29 2.03+0.22−0.23 2.10+0.39
−0.34 1.94+0.21−0.22
αS(m2Z) 0.1201 ± 0.0030 0.1187 ± 0.0027 0.1189 ± 0.0027 0.1186 ± 0.0028 0.1183 ± 0.0027
χ2/d.o.f. 15.5/8 18.9/12 19.1/13 22.6/14 22.9/15
sin2 θlepteff 0.23162 0.23150 0.23151 0.23139 0.23136
±0.00018 ±0.00016 ±0.00016 ±0.00015 ±0.00014
sin2 θW 0.22282 0.22333 0.22313 0.22248 0.22263
±0.00051 ±0.00063 ±0.00045 ±0.00045 ±0.00036
mW [GeV] 80.389 ± 0.026 80.363 ± 0.032 80.373 ± 0.023 80.406 ± 0.023 80.398 ± 0.019
Table 13.2: Results of the fits to: (1) LEP data alone, (2) all data except the direct determinationsof mt and mW (pp collider and LEP-II), (3) all data except direct mW determinations, (4) all dataexcept direct mt determinations, and (5) all data. As the sensitivity to mH is logarithmic, both mH
as well as log(mH/GeV) are quoted. The bottom part of the table lists derived results for sin2 θlepteff ,sin2 θW and mW. See text for a discussion of theoretical errors not included in the errors above.
102

0.231
0.2315
0.232
0.2325
0.233
83.6 83.8 84 84.2
∆αPreliminary 68% CL
Γ l [MeV]
sin2 θle
pt
eff
mt= 174.3 ± 5.1 GeVmH= 114...1000 GeV
mt
mH
Figure 13.1: LEP-I+SLD measurements of sin2 θlepteff (Table 12.4) and Γℓℓ (Table 2.4) and the StandardModel prediction. The point shows the predictions if among the electroweak radiative corrections onlythe photon vacuum polarisation is included. The corresponding arrow shows variation of this predictionif α(m2
Z) is changed by one standard deviation. This variation gives an additional uncertainty to theStandard Model prediction shown in the figure.
103

80.2
80.3
80.4
80.5
80.6
130 150 170 190 210
mH [GeV]114 300 1000
mt [GeV]
mW
[G
eV]
Preliminary
68% CL
∆α
LEP1, SLD, νN, APV Data
LEP2, pp− Data
Figure 13.2: The comparison of the indirect measurements of mW and mt (LEP-I+SLD+νN+APVdata) (solid contour) and the direct measurements (pp colliders and LEP-II data) (dashed contour).In both cases the 68% CL contours are plotted. Also shown is the Standard Model relationship forthe masses as a function of the Higgs mass.
104

80.3
80.4
80.5
10 102
103
mH [GeV]
mW
[G
eV]
Excluded Preliminary
All except mW
68% CL
mW (LEP2, pp−)
Figure 13.3: The 68% confidence level contour in mt and mW for the fit to all data except the directmeasurement of mW, indicated by the shaded horizontal band of ±1 sigma width. The vertical bandshows the 95% CL exclusion limit on mH from the direct search.
105
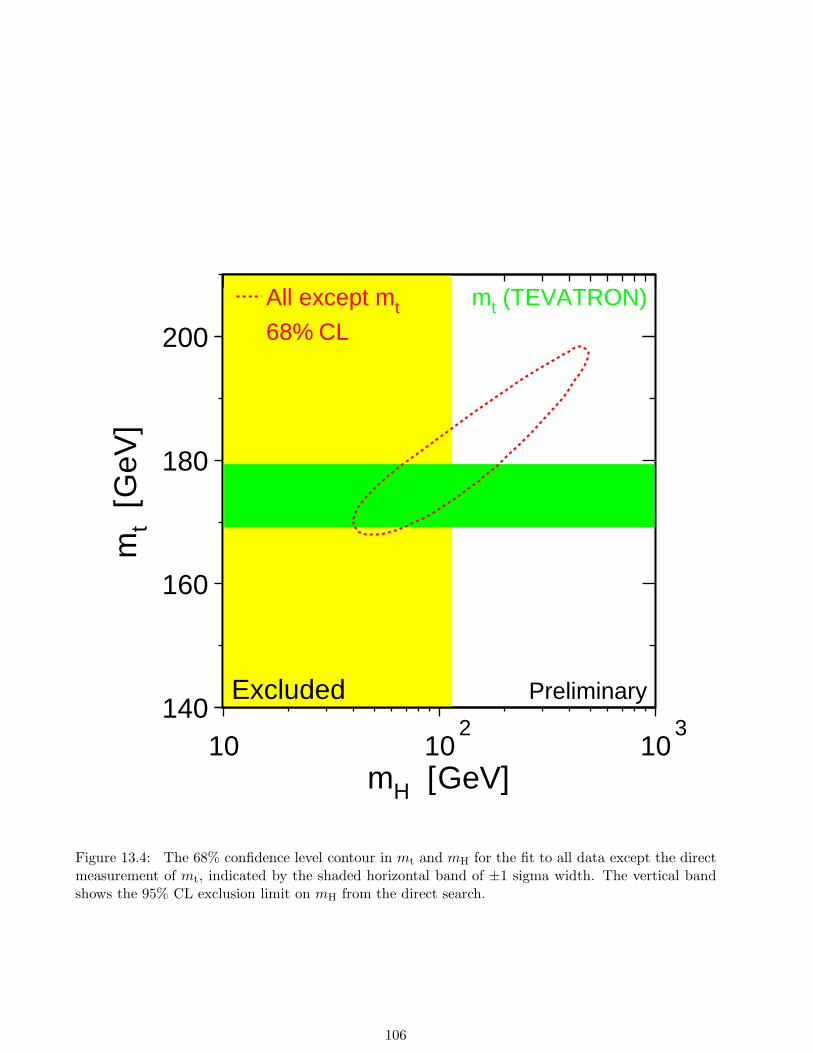
140
160
180
200
10 102
103
mH [GeV]
mt
[GeV
]
Excluded Preliminary
All except mt
68% CL
mt (TEVATRON)
Figure 13.4: The 68% confidence level contour in mt and mH for the fit to all data except the directmeasurement of mt, indicated by the shaded horizontal band of ±1 sigma width. The vertical bandshows the 95% CL exclusion limit on mH from the direct search.
106

0
2
4
6
10020 400
mH [GeV]
∆χ2
Excluded Preliminary
∆αhad =∆α(5)
0.02761±0.00036
0.02738±0.00020
theory uncertainty
Figure 13.5: ∆χ2 = χ2 − χ2min vs. mH curve. The line is the result of the fit using all data (last
column of Table 13.2); the band represents an estimate of the theoretical error due to missing higherorder corrections. The vertical band shows the 95% CL exclusion limit on mH from the direct search.The dashed curve is the result obtained using the evaluation of ∆α
(5)had(m2
Z) from Reference 236.
107

10 2
10 3
2.49 2.5
ΓZ [GeV]
mH [
GeV
]
10 2
10 3
0.015 0.02
A0,lFB
mH [
GeV
]
10 2
10 3
41.4 41.5 41.6
σ0 had [nb]
mH [
GeV
]
10 2
10 3
80.2 80.4
mW (LEP) [GeV]
mH [
GeV
]
10 2
10 3
20.7 20.8
R0l
mH [
GeV
]
Preliminary
Measurement
∆αhad= 0.02761 ± 0.00036∆α(5)
αs= 0.118 ± 0.002
mt= 174.3 ± 5.1 GeV
Figure 13.6: Comparison of LEP-I measurements with the Standard Model prediction as a functionof mH. The measurement with its error is shown as the vertical band. The width of the StandardModel band is due to the uncertainties in ∆α
(5)had(m2
Z), αS(m2Z) and mt. The total width of the band
is the linear sum of these effects.
108

10 2
10 3
0.14 0.15
Al(A0,lFB )
mH [
GeV
]
10 2
10 3
0.095 0.1 0.105
A0,bFB
mH [
GeV
]
10 2
10 3
0.14 0.15
Al(Pτ)
mH [
GeV
]
10 2
10 3
0.06 0.07 0.08
A0,cFB
mH [
GeV
]
10 2
10 3
0.14 0.15
Al (SLD)
mH [
GeV
]
Preliminary
Measurement
∆αhad= 0.02761 ± 0.00036∆α(5)
αs= 0.118 ± 0.002
mt= 174.3 ± 5.1 GeV
Figure 13.7: Comparison of LEP-I measurements with the Standard Model prediction as a function ofmH. The measurement with its error is shown as the vertical band. The width of the Standard Modelband is due to the uncertainties in ∆α
(5)had(m2
Z), αS(m2Z) and mt. The total width of the band is the
linear sum of these effects. Also shown is the comparison of the SLD measurement of Aℓ, dominatedby A0
LR, with the Standard Model.
109

10 2
10 3
0.216 0.218
R0b
mH [
GeV
]
10 2
10 3
0.9 0.95
Ab
mH [
GeV
]
10 2
10 3
0.167 0.173 0.179
R0c
mH [
GeV
]
10 2
10 3
0.62 0.67 0.72
Ac
mH [
GeV
]
10 2
10 3
0.23 0.232 0.234
sin2θlepteff (<QFB>)
mH [
GeV
]
Preliminary
Measurement
∆αhad= 0.02761 ± 0.00036∆α(5)
αs= 0.118 ± 0.002
mt= 174.3 ± 5.1 GeV
Figure 13.8: Comparison of LEP-I and SLD measurements with the Standard Model prediction asa function of mH. The measurement with its error is shown as the vertical band. The width of theStandard Model band is due to the uncertainties in ∆α
(5)had(m2
Z), αS(m2Z) and mt. The total width of
the band is the linear sum of these effects.
110

Chapter 14
Conclusions
The combination of the many precise electroweak results yields stringent constraints on the StandardModel. In addition, the results are sensitive to the Higgs mass. Most measurements agree wellwith the predictions. The spread in values of the various determinations of the effective electroweakmixing angle is larger than expected. Within the Standard Model analysis, this seems to be causedby the measurement of the forward-backward asymmetry in b-quark production, showing the largestdeviation w.r.t. the Standard-Model expectation.
The experiments wish to stress that this report reflects a preliminary status at the time of the2001 summer conferences. A definitive statement on these results must wait for publication by eachcollaboration.
Prospects for the Future
Most of the measurements from data taken at or near the Z resonance, both at LEP as well as atSLC, that are presented in this report are either final or are being finalised. The main improvementswill therefore take place in the high energy data, with more than 700 pb−1 per experiment. Themeasurements of mW are likely to reach a precision not too far from the uncertainty on the predictionobtained via the radiative corrections of the Z data, providing a further important test of the StandardModel. In the measurement of the triple and quartic electroweak gauge boson self couplings, theanalysis of the complete LEP-II statistics, together with the increased sensitivity at higher beamenergies, will lead to an improvement in the current precision.
Acknowledgements
We would like to thank the CERN accelerator divisions for the efficient operation of the LEP accel-erator, the precise information on the absolute energy scale and their close cooperation with the fourexperiments. The SLD collaboration would like to thank the SLAC accelerator department for theefficient operation of the SLC accelerator. We would also like to thank members of the CDF, DØ andNuTeV Collaborations for making preliminary results available to us in advance of the conferencesand for useful discussions concerning their combination. Finally, the results of the section on StandardModel constraints would not be possible without the close collaboration of many theorists.
111

Appendix A
The Measurements used in the Heavy-Flavour
Averages
In the following 20 tables the results used in the combination are listed. In each case an indication ofthe dataset used and the type of analysis is given. Preliminary results are indicated by the symbol “†”.The values of centre-of-mass energy are given where relevant. In each table, the result used as inputto the average procedure is given followed by the statistical error, the correlated and uncorrelatedsystematic errors, the total systematic error, and any dependence on other electroweak parameters.In the case of the asymmetries, the measurement moved to a common energy (89.55 GeV, 91.26 GeVand 92.94 GeV, respectively, for peak−2, peak and peak+2 results) is quoted as corrected asymmetry.
Contributions to the correlated systematic error quoted here are from any sources of error sharedwith one or more other results from different experiments in the same table, and the uncorrelated errorsfrom the remaining sources. In the case of Ac and Ab from SLD the quoted correlated systematicerror has contributions from any source shared with one or more other measurements from LEPexperiments. Constants such as a(x) denote the dependence on the assumed value of xused, which isalso given.
112

ALEPH DELPHI L3 OPAL SLD
92-95 92-95 94-95 92-95 93-98†[24] [25] [26] [27] [28]
R0b 0.2158 0.2163 0.2173 0.2174 0.2164
Statistical 0.0009 0.0007 0.0015 0.0011 0.0009
Uncorrelated 0.0007 0.0004 0.0015 0.0009 0.0006Correlated 0.0006 0.0004 0.0018 0.0008 0.0005
Total Systematic 0.0009 0.0005 0.0023 0.0012 0.0007
a(Rc) -0.0033 -0.0041 -0.0376 -0.0122 -0.0057Rused
c 0.1720 0.1720 0.1734 0.1720 0.1710
a(BR(c → ℓ+)) -0.0133 -0.0067BR(c → ℓ+)used 9.80 9.80
a(f(D+)) -0.0010 -0.0010 -0.0086 -0.0029 -0.0008
f(D+)used
0.2330 0.2330 0.2330 0.2380 0.2370
a(f(Ds)) -0.0001 0.0001 -0.0005 -0.0001 -0.0003
f(Ds)used 0.1020 0.1030 0.1030 0.1020 0.1140
a(f(Λc)) 0.0002 0.0003 0.0008 0.0003 -0.0003
f(Λc)used 0.0650 0.0630 0.0630 0.0650 0.0730
Table A.1: The measurements of R0b. All measurements use a lifetime tag enhanced by other features
like invariant mass cuts or high pT leptons.
ALEPH DELPHI OPAL SLD
91-95 91-95 92-95 92-95 92-95 91-94 90-95 93-97†c-count D meson lepton c-count D meson c-count D meson vtx-mass
[33] [29] [29] [31] [30, 31] [34] [32] [35]
R0c 0.1735 0.1682 0.1670 0.1693 0.1610 0.1642 0.1760 0.1738
Statistical 0.0051 0.0082 0.0062 0.0050 0.0104 0.0122 0.0095 0.0031
Uncorrelated 0.0057 0.0077 0.0059 0.0050 0.0064 0.0126 0.0102 0.0019Correlated 0.0094 0.0028 0.0009 0.0077 0.0060 0.0099 0.0062 0.0008
Total Systematic 0.0110 0.0082 0.0059 0.0092 0.0088 0.0161 0.0120 0.0021
a(Rb) -0.0050 -0.0433Rused
b 0.2159 0.2166
a(BR(c → ℓ+)) -0.1646BR(c → ℓ+)used 9.80
Table A.2: The measurements of R0c . “c-count” denotes the determination of R0
c from the sum ofproduction rates of weakly decaying charmed hadrons. “D meson” denotes any single/double taganalysis using exclusive and/or inclusive D meson reconstruction.
113

ALEPH DELPHI L3 OPAL
90-95 90-95 90-95 91-95 93-95† 92-95 92-95 90-95 91-95 90-95† 90-95lepton lepton lepton multi lepton D-meson jet charge lepton jet charge lepton D-meson
[38] [38] [38] [42] [39] [48] [43] [40] [46] [41] [49]√s (GeV) 88.380 89.380 90.210 89.470 89.433 89.434 89.550 89.500 89.440 89.490 89.490
AbbFB(−2) -3.53 5.47 9.10 4.36 5.90 5.64 6.80 6.15 4.10 3.56 -9.20
AbbFB(−2)Corrected 5.87 4.55 6.18 5.92 6.80 6.27 4.36 3.70 -9.06
Statistical 1.90 1.19 2.20 7.59 1.80 2.93 2.10 1.73 10.80
Uncorrelated 0.39 0.05 0.08 0.91 0.12 0.37 0.25 0.16 2.51Correlated 0.70 0.01 0.08 0.08 0.01 0.19 0.02 0.04 1.41
Total Systematic 0.80 0.05 0.12 0.91 0.13 0.41 0.25 0.16 2.87
a(Rb) -0.3069 -9.5 -1.1543 -0.1962 -1.4467 -0.7300 -0.1000Rused
b 0.2192 0.2150 0.2164 0.2158 0.2170 0.2150 0.2155
a(Rc) 0.0362 0.3100 1.0444 0.3200 0.3612 0.0700 0.1000Rused
c 0.1710 0.1725 0.1671 0.1720 0.1734 0.1730 0.1720
a(AccFB(−2)) -0.2244 -0.2955 -0.1000 -0.3156
AccFB(−2)used -2.34 -2.87 -2.50 -2.81
a(BR(b → ℓ−)) -0.2486 -1.0154 -1.0290 0.3406
BR(b → ℓ−)used
11.34 10.56 10.50 10.90
a(BR(b → c → ℓ+)) -0.1074 -0.1424 -0.1440 -0.5298BR(b → c → ℓ+)used 7.86 8.07 8.00 8.30
a(BR(c → ℓ+)) -0.0474 0.7224 0.5096 0.1960BR(c → ℓ+)used 9.80 9.90 9.80 9.80
a(χ) 5.259 1.3054χused 0.12460 0.11770
a(f(D+)) 0.5083 0.0949
f(D+)used
0.2210 0.2330
a(f(Ds)) 0.1742 0.0035
f(Ds)used 0.1120 0.1020
a(f(Λc)) -0.0191 -0.0225
f(Λc)used 0.0840 0.0630
a(P(c → D∗+) × BR(D∗+ → π+D0)) -0.1100
P(c → D∗+) × BR(D∗+ → π+D0)used
0.1830
Table A.3: The measurements of AbbFB(−2). All numbers are given in %.
114

ALEPH DELPHI OPAL
91-95 93-95† 92-95 90-95† 90-95D-meson lepton D-meson lepton D-meson
[47] [39] [48] [41] [49]√s (GeV) 89.370 89.433 89.434 89.490 89.490
AccFB(−2) -1.10 1.12 -5.02 -6.91 3.90
AccFB(−2)Corrected -0.02 1.82 -4.32 -6.55 4.26
Statistical 4.30 3.60 3.69 2.44 5.10
Uncorrelated 1.00 0.53 0.40 0.38 0.80Correlated 0.09 0.16 0.09 0.23 0.30
Total Systematic 1.00 0.55 0.41 0.44 0.86
a(Rb) -0.2886 -3.4000Rused
b 0.2164 0.2155
a(Rc) 1.0096 3.2000Rused
c 0.1671 0.1720
a(AbbFB(−2)) -1.3365
AbbFB(−2)used 6.13
a(BR(b → ℓ−)) -1.0966 -1.7031
BR(b → ℓ−)used
10.56 10.90
a(BR(b → c → ℓ+)) 1.1156 -1.4128BR(b → c → ℓ+)used 8.07 8.30
a(BR(c → ℓ+)) 1.0703 3.3320BR(c → ℓ+)used 9.90 9.80
a(χ) -0.0856χused 0.11770
a(f(D+)) -0.3868
f(D+)used
0.2210
a(f(Ds)) -0.1742
f(Ds)used 0.1120
a(f(Λc)) -0.0878
f(Λc)used 0.0840
Table A.4: The measurements of AccFB(−2). All numbers are given in %.
115

ALEPH DELPHI L3 OPAL
91-95† 91-95 91-92 93-95† 92-95 92-95 92-95† 91-95 90-95 91-95 90-95† 90-95lepton multi lepton lepton D-meson jet charge multi jet charge lepton multi lepton D-meson
[38] [42] [39] [39] [48] [43] [44] [45] [40] [46] [41] [49]√s (GeV) 91.210 91.230 91.270 91.223 91.235 91.260 91.260 91.240 91.260 91.210 91.240 91.240
AbbFB(pk) 9.71 10.00 10.89 9.86 7.58 9.83 9.72 9.31 9.85 10.06 9.14 9.00
AbbFB(pk)Corrected 9.81 10.06 10.87 9.93 7.63 9.83 9.72 9.35 9.85 10.15 9.18 9.04
Statistical 0.40 0.27 1.30 0.64 1.97 0.47 0.35 1.01 0.67 0.52 0.44 2.70
Uncorrelated 0.16 0.11 0.33 0.15 0.76 0.13 0.21 0.51 0.27 0.41 0.14 2.14Correlated 0.12 0.02 0.27 0.14 0.10 0.06 0.05 0.21 0.14 0.20 0.15 0.45
Total Systematic 0.20 0.11 0.43 0.20 0.77 0.15 0.22 0.55 0.31 0.46 0.20 2.19
a(Rb) -0.9545 -9.5 -2.8933 -2.0201 -0.1962 0.0637 -9.1622 -2.1700 -7.6300 -0.7000Rused
b 0.2172 0.2158 0.2170 0.2164 0.2158 0.2164 0.2170 0.2170 0.2150 0.2155
a(Rc) 0.6450 0.3100 1.0993 1.1488 0.8400 0.0595 1.0831 1.3005 0.4600 0.6000Rused
c 0.1720 0.1715 0.1710 0.1671 0.1720 0.1731 0.1733 0.1734 0.1730 0.1720
a(AccFB(pk)) 0.6849 0.2756 1.1603 0.9262 0.6870
AccFB(pk)used 6.66 6.89 6.91 7.41 6.19
a(BR(b → ℓ−)) -1.8480 -3.8824 -2.0308 -2.0160 -0.3406
BR(b → ℓ−)used
10.78 11.00 10.56 10.50 10.90
a(BR(b → c → ℓ+)) 0.4233 0.4740 -0.3798 -0.1280 -0.3532BR(b → c → ℓ+)used 8.14 7.90 8.07 8.00 8.30
a(BR(c → ℓ+)) 0.5096 0.7840 1.0703 1.5288 0.5880BR(c → ℓ+)used 9.80 9.80 9.90 9.80 9.80
a(χ) 2.9904 3.4467 1.6692χused 0.12460 0.12100 0.11770
a(f(D+)) 0.0442 0.2761 -0.0175
f(D+)used
0.2210 0.2330 0.2330
a(f(Ds)) -0.0788 0.0106 -0.0260
f(Ds)used 0.1120 0.1020 0.1300
a(f(Λc)) -0.0115 -0.0495 0.0221
f(Λc)used 0.0840 0.0630 0.0960
a(P(c → D∗+) × BR(D∗+ → π+D0)) -0.2500P(c → D∗+) × BR(D∗+ → π+D0)
used 0.1830
Table A.5: The measurements of AbbFB(pk). All numbers are given in %.
116

ALEPH DELPHI L3 OPAL
91-95† 91-95 91-92 93-95† 92-95 90-95 90-95† 90-95lepton D-meson lepton lepton D-meson lepton lepton D-meson
[38] [47] [39] [39] [48] [40] [41] [49]√s (GeV) 91.210 91.220 91.270 91.223 91.235 91.240 91.240 91.240
AccFB(pk) 5.68 6.13 8.05 6.29 6.58 7.94 5.95 6.50
AccFB(pk)Corrected 5.93 6.32 8.00 6.47 6.70 8.04 6.05 6.60
Statistical 0.53 0.90 2.26 1.00 0.97 3.70 0.59 1.20
Uncorrelated 0.24 0.23 1.25 0.53 0.25 2.40 0.37 0.49Correlated 0.36 0.17 0.49 0.27 0.04 0.49 0.32 0.23
Total Systematic 0.44 0.28 1.35 0.60 0.25 2.45 0.49 0.54
a(Rb) 1.4318 2.8933 -2.3087 4.3200 4.1000Rused
b 0.2172 0.2170 0.2164 0.2160 0.2155
a(Rc) -2.9383 -6.4736 5.4307 -6.7600 -3.8000Rused
c 0.1720 0.1710 0.1671 0.1690 0.1720
a(AbbFB(pk)) -2.1333 6.4274
AbbFB(pk)used 9.79 8.84
a(BR(b → ℓ−)) 1.8993 4.8529 -2.7618 3.5007 5.1094
BR(b → ℓ−)used
10.78 11.00 10.56 10.50 10.90
a(BR(b → c → ℓ+)) -1.0745 -3.9500 2.2786 -3.2917 -1.7660BR(b → c → ℓ+)used 8.14 7.90 8.07 7.90 8.30
a(BR(c → ℓ+)) -3.2732 -7.2520 4.8965 -6.5327 -3.9200BR(c → ℓ+)used 9.80 9.80 9.90 9.80 9.80
a(χ) 0.0453 0.3852χused 0.12460 0.11770
a(f(D+)) -0.0221
f(D+)used
0.2210
a(f(Ds)) 0.0788
f(Ds)used 0.1120
a(f(Λc)) 0.0115
f(Λc)used 0.0840
Table A.6: The measurements of AccFB(pk). All numbers are given in %.
117

ALEPH DELPHI L3 OPAL
90-95 90-95 90-95 91-95 93-95† 92-95 92-95 90-95 91-95 90-95† 90-95lepton lepton lepton multi lepton D-meson jet charge lepton jet charge lepton D-meson
[38] [38] [38] [42] [39] [48] [43] [40] [46] [41] [49]√s (GeV) 92.050 92.940 93.900 92.950 92.990 92.990 92.940 93.100 92.910 92.950 92.950
AbbFB(+2) 3.93 10.60 9.03 11.72 10.10 8.77 12.30 13.79 14.60 10.76 -3.10
AbbFB(+2)Corrected 10.03 11.71 10.05 8.72 12.30 13.63 14.63 10.75 -3.11
Statistical 1.51 0.98 1.80 6.37 1.60 2.40 1.70 1.43 9.00
Uncorrelated 0.14 0.12 0.14 0.97 0.24 0.34 0.64 0.25 2.03Correlated 0.24 0.02 0.16 0.14 0.08 0.19 0.34 0.28 1.69
Total Systematic 0.28 0.13 0.21 0.98 0.26 0.39 0.73 0.37 2.65
a(Rb) -1.964 -9.5 -2.8859 -0.1962 -3.3756 -12.9000 -0.8000Rused
b 0.2192 0.2156 0.2164 0.2158 0.2170 0.2150 0.2155
a(Rc) 1.575 0.3100 1.3577 1.2000 1.9869 0.6900 0.8000Rused
c 0.1710 0.1719 0.1671 0.1720 0.1734 0.1730 0.1720
a(AccFB(+2)) 1.081 1.2793 0.5206 1.3287
AccFB(+2)used 12.51 12.42 12.39 12.08
a(BR(b → ℓ−)) -1.762 -2.3557 -2.0790 -1.3625
BR(b → ℓ−)used
11.34 10.56 10.50 10.90
a(BR(b → c → ℓ+)) -0.2478 -0.7595 -1.1200 0.7064BR(b → c → ℓ+)used 7.86 8.07 8.00 8.30
a(BR(c → ℓ+)) 1.524 1.0703 1.9796 0.7840BR(c → ℓ+)used 9.80 9.90 9.80 9.80
a(χ) 6.584 1.6050χused 0.12460 0.11770
a(f(D+)) 0.3978 0.4229
f(D+)used
0.2210 0.2330
a(f(Ds)) -0.0788 0.0211
f(Ds)used 0.1120 0.1020
a(f(Λc)) 0.0573 -0.0855
f(Λc)used 0.0840 0.0630
a(P(c → D∗+) × BR(D∗+ → π+D0)) -0.2800
P(c → D∗+) × BR(D∗+ → π+D0)used
0.1830
Table A.7: The measurements of AbbFB(+2). All numbers are given in %.
118

ALEPH DELPHI OPAL
91-95 93-95† 92-95 90-95† 90-95D-meson lepton D-meson lepton D-meson
[47] [39] [48] [41] [49]√s (GeV) 92.960 92.990 92.990 92.950 92.950
AccFB(+2) 10.82 10.50 11.78 15.62 16.50
AccFB(+2)Corrected 10.77 10.37 11.65 15.59 16.47
Statistical 3.30 2.90 3.20 2.02 4.10
Uncorrelated 0.79 0.41 0.52 0.57 0.92Correlated 0.18 0.28 0.07 0.62 0.43
Total Systematic 0.81 0.50 0.52 0.84 1.02
a(Rb) -4.0402 9.6000Rused
b 0.2164 0.2155
a(Rc) 7.5891 -8.9000Rused
c 0.1671 0.1720
a(AbbFB(+2)) -2.6333
AbbFB(+2)used 12.08
a(BR(b → ℓ−)) -3.2492 9.5375
BR(b → ℓ−)used
10.56 10.90
a(BR(b → c → ℓ+)) 1.5191 -1.5894BR(b → c → ℓ+)used 8.07 8.30
a(BR(c → ℓ+)) 8.1341 -9.2120BR(c → ℓ+)used 9.90 9.80
a(χ) -0.2140χused 0.11770
a(f(D+)) -0.2984
f(D+)used
0.2210
a(f(Ds)) 0.0539
f(Ds)used 0.1120
a(f(Λc)) 0.0764
f(Λc)used 0.0840
Table A.8: The measurements of AccFB(+2). All numbers are given in %.
119

SLD
93-98† 93-98† 94-95† 96-98†lepton jet charge K± multi
[50] [52] [53] [54]√s (GeV) 91.280 91.280 91.280 91.280
Ab 0.924 0.907 0.855 0.921
Statistical 0.030 0.020 0.088 0.018
Uncorrelated 0.018 0.023 0.102 0.018Correlated 0.008 0.001 0.006 0.001
Total Systematic 0.020 0.023 0.102 0.018
a(Rb) -0.1237 -0.0139 -0.7283Rused
b 0.2164 0.2180 0.2158
a(Rc) 0.0308 0.0060 0.0359Rused
c 0.1674 0.1710 0.1722
a(Ac) 0.0534 0.0211 -0.0112 0.0095Aused
c 0.667 0.670 0.666 0.667
a(BR(b → ℓ−)) -0.1999
BR(b → ℓ−)used
10.62
a(BR(b → c → ℓ+)) 0.0968BR(b → c → ℓ+)used 8.07
a(BR(c → ℓ+)) 0.0369BR(c → ℓ+)used 9.85
a(χ) 0.2951χused 0.11860
Table A.9: The measurements of Ab.
120

SLD
93-98† 93-98† 96-98†lepton D-meson K+vertex
[50] [51] [55]√s (GeV) 91.280 91.280 91.280
Ac 0.589 0.688 0.673
Statistical 0.055 0.035 0.029
Uncorrelated 0.045 0.020 0.024Correlated 0.021 0.003 0.002
Total Systematic 0.050 0.021 0.024
a(Rb) 0.1855 0.5395Rused
b 0.2164 0.2158
a(Rc) -0.4053 -0.0682Rused
c 0.1674 0.1722
a(Ab) 0.2137 -0.0673 -0.0187Aused
b 0.935 0.935 0.935
a(BR(b → ℓ−)) 0.2874
BR(b → ℓ−)used
10.62
a(BR(b → c → ℓ+)) -0.1743BR(b → c → ℓ+)used 8.07
a(BR(c → ℓ+)) -0.3971BR(c → ℓ+)used 9.85
a(χ) 0.0717χused 0.11860
Table A.10: The measurements of Ac.
121

ALEPH DELPHI L3 OPAL
91-95† 94-95† 92 94-95† 92-95multi multi lepton multi multi[56] [57] [58] [26] [59]
BR(b → ℓ−) 10.70 10.70 10.68 10.22 10.85
Statistical 0.10 0.08 0.11 0.13 0.10
Uncorrelated 0.16 0.20 0.36 0.19 0.20Correlated 0.23 0.45 0.22 0.31 0.21
Total Systematic 0.28 0.49 0.42 0.36 0.29
a(Rb) -9.2571 -0.1808Rused
b 0.2160 0.2169
a(Rc) 1.4450 0.4867Rused
c 0.1734 0.1770
a(BR(b → c → ℓ+)) -1.1700 0.1618BR(b → c → ℓ+)used 9.00 8.09
a(BR(c → ℓ+)) -0.3078 -0.1960 -2.5480 0.9212BR(c → ℓ+)used 9.85 9.80 9.80 9.80
a(χ) 0.7683χused 0.1178
a(f(D+)) 0.5523 0.1445
f(D+)used
0.2330 0.2380
a(f(Ds)) 0.0213 0.0055
f(Ds)used 0.1030 0.1020
a(f(Λc)) -0.0427 -0.0157
f(Λc)used 0.0630 0.0650
Table A.11: The measurements of BR(b → ℓ−). All numbers are given in %.
122

ALEPH DELPHI OPAL
91-95† 94-95† 92-95multi multi multi[56] [57] [59]
BR(b → c → ℓ+) 8.18 7.98 8.41
Statistical 0.15 0.22 0.16
Uncorrelated 0.19 0.21 0.19Correlated 0.15 0.19 0.34
Total Systematic 0.24 0.28 0.39
a(Rb) -0.1808Rused
b 0.2169
a(Rc) 0.5026 0.3761Rused
c 0.1709 0.1770
a(BR(c → ℓ+)) 0.3078BR(c → ℓ+)used 9.85
a(χ) -1.3884χused 0.11940
a(f(D+)) 0.1190
f(D+)used
0.2380
a(f(Ds)) 0.0028
f(Ds)used 0.1020
a(f(Λc)) -0.0110
f(Λc)used 0.0660
Table A.12: The measurements of BR(b → c → ℓ+). All numbers are given in %.
DELPHI OPAL
92-95 90-95D+lepton D+lepton
[30] [60]
BR(c → ℓ+) 9.64 9.58
Statistical 0.42 0.60
Uncorrelated 0.24 0.49Correlated 0.13 0.43
Total Systematic 0.27 0.65
a(BR(b → ℓ−)) -0.5600 -1.4335
BR(b → ℓ−)used
11.20 10.99
a(BR(b → c → ℓ+)) -0.4100 -0.7800BR(b → c → ℓ+)used 8.20 7.80
Table A.13: The measurements of BR(c → ℓ+). All numbers are given in %.
123

ALEPH DELPHI L3 OPAL
90-95 94-95† 90-95 90-95†multi multi lepton lepton[38] [57] [40] [41]
χ 0.12446 0.12700 0.11920 0.11380
Statistical 0.00515 0.01300 0.00680 0.00540
Uncorrelated 0.00252 0.00484 0.00214 0.00306Correlated 0.00394 0.00431 0.00252 0.00324
Total Systematic 0.00468 0.00648 0.00330 0.00445
a(Rb) 0.0341Rused
b 0.2192
a(Rc) 0.0009 0.0004Rused
c 0.1710 0.1734
a(BR(b → ℓ−)) 0.0524 0.0550 0.0170
BR(b → ℓ−)used
11.34 10.50 10.90
a(BR(b → c → ℓ+)) -0.0440 -0.0466 -0.0318BR(b → c → ℓ+)used 7.86 8.00 8.30
a(BR(c → ℓ+)) 0.0035 -0.0020 0.0006 0.0039BR(c → ℓ+)used 9.80 9.80 9.80 9.80
Table A.14: The measurements of χ.
DELPHI OPAL
92-95 90-95D-meson D-meson
[30] [32]
P(c → D∗+) × BR(D∗+ → π+D0) 0.1740 0.1514
Statistical 0.0100 0.0096
Uncorrelated 0.0040 0.0088Correlated 0.0007 0.0011
Total Systematic 0.0041 0.0089
a(Rb) 0.0293Rused
b 0.2166
a(Rc) -0.0158Rused
c 0.1735
Table A.15: The measurements of P(c → D∗+) × BR(D∗+ → π+D0).
124

ALEPH DELPHI OPAL
91-95 92-95 91-94D meson D meson D meson
[33] [31] [34]
RcfD+ 0.0406 0.0384 0.0391
Statistical 0.0013 0.0013 0.0050
Uncorrelated 0.0014 0.0015 0.0042Correlated 0.0032 0.0025 0.0031
Total Systematic 0.0035 0.0030 0.0052
a(f(D+)) 0.0008
f(D+)used
0.2210
a(f(Ds)) -0.0002
f(Ds)used 0.1120
Table A.16: The measurements of RcfD+ .
ALEPH DELPHI OPAL
91-95 92-95 91-94D meson D meson D meson
[33] [31] [34]
RcfDs 0.0207 0.0213 0.0160
Statistical 0.0033 0.0017 0.0042
Uncorrelated 0.0011 0.0010 0.0016Correlated 0.0053 0.0054 0.0043
Total Systematic 0.0054 0.0055 0.0046
a(f(D+)) 0.0007
f(D+)used
0.2210
a(f(Ds)) -0.0009
f(Ds)used 0.1120
a(f(Λc)) -0.0001
f(Λc)used 0.0840
Table A.17: The measurements of RcfDs .
125

ALEPH DELPHI OPAL
91-95 92-95 91-94D meson D meson D meson
[33] [31] [34]
RcfΛc 0.0157 0.0170 0.0091
Statistical 0.0016 0.0035 0.0050
Uncorrelated 0.0005 0.0016 0.0015Correlated 0.0044 0.0045 0.0035
Total Systematic 0.0045 0.0048 0.0038
a(f(D+)) 0.0002
f(D+)used
0.2210
a(f(Ds)) -0.0001
f(Ds)used 0.1120
a(f(Λc)) -0.0002
f(Λc)used 0.0840
Table A.18: The measurements of RcfΛc .
ALEPH DELPHI OPAL
91-95 92-95 91-94D meson D meson D meson
[33] [31] [34]
RcfD0 0.0965 0.0928 0.1000
Statistical 0.0029 0.0026 0.0070
Uncorrelated 0.0040 0.0038 0.0057Correlated 0.0045 0.0023 0.0041
Total Systematic 0.0060 0.0044 0.0070
a(f(D+)) 0.0021
f(D+)used
0.2210
a(f(Ds)) -0.0004
f(Ds)used 0.1120
a(f(Λc)) -0.0004
f(Λc)used 0.0840
Table A.19: The measurements of RcfD0 .
126

DELPHI OPAL
92-95 90-95D meson D-meson
[31] [32]
RcP(c → D∗+) × BR(D∗+ → π+D0) 0.0282 0.0268
Statistical 0.0007 0.0005
Uncorrelated 0.0010 0.0010Correlated 0.0007 0.0009
Total Systematic 0.0012 0.0013
a(f(D+)) 0.0006
f(D+)used
0.2210
a(f(Ds)) -0.0001
f(Ds)used 0.1120
a(f(Λc)) -0.0004
f(Λc)used 0.0840
Table A.20: The measurements of RcP(c → D∗+) × BR(D∗+ → π+D0).
127

Appendix B
Heavy-Flavour Fit including Off-Peak
Asymmetries
The full 18 parameter fit to the LEP and SLD data gave the following results:
R0b = 0.21647 ± 0.00068
R0c = 0.1719 ± 0.0031
AbbFB(−2) = 0.0508 ± 0.0068
AccFB(−2) = −0.035 ± 0.017
AbbFB(pk) = 0.0975 ± 0.0018
AccFB(pk) = 0.0620 ± 0.0036
AbbFB(+2) = 0.1150 ± 0.0057
AccFB(+2) = 0.130 ± 0.013
Ab = 0.922 ± 0.020
Ac = 0.670 ± 0.026
BR(b → ℓ−) = 0.1067 ± 0.0021
BR(b → c → ℓ+) = 0.0807 ± 0.0017
BR(c → ℓ+) = 0.0979 ± 0.0031
χ = 0.1195 ± 0.0040
f(D+) = 0.234 ± 0.016
f(Ds) = 0.125 ± 0.023
f(cbaryon) = 0.096 ± 0.023
P(c → D∗+) × BR(D∗+ → π+D0) = 0.1620 ± 0.0048
with a χ2/d.o.f. of 43/(99 − 18). The corresponding correlation matrix is given in Table B.1. Theenergy for the peak−2, peak and peak+2 results are respectively 89.55 GeV, 91.26 GeV and 92.94 GeV.Note that the asymmetry results shown here are not the pole asymmetries shown in Section 5.3.2.The non-electroweak parameters do not depend on the treatment of the asymmetries.
128

1) 2) 3) 4) 5) 6) 7) 8) 9) 10) 11) 12) 13) 14) 15) 16) 17) 18)
Rb Rc AbbFB Acc
FB AbbFB Acc
FB AbbFB Acc
FB Ab Ac BR BR BR χ f(D+) f(Ds) f(cbar.) PcDst(−2) (−2) (pk) (pk) (+2) (+2) (1) (2) (3)
1) 1.00 −0.14 −0.02 0.00 −0.07 0.01 −0.03 0.00 −0.08 0.04 −0.09 −0.02 −0.01 −0.03 −0.16 −0.04 0.13 0.102) −0.14 1.00 0.01 0.01 0.04 −0.01 0.02 −0.01 0.03 −0.05 0.06 −0.03 −0.30 0.04 −0.13 0.17 0.16 −0.443) −0.02 0.01 1.00 0.16 0.03 0.01 0.01 0.00 0.00 0.00 0.02 −0.02 0.00 0.05 0.00 0.00 0.00 −0.014) 0.00 0.01 0.16 1.00 0.01 0.01 0.00 0.00 0.00 0.00 0.02 −0.01 0.02 0.01 0.00 0.01 0.00 0.005) −0.07 0.04 0.03 0.01 1.00 0.15 0.07 0.01 0.01 0.00 0.04 −0.08 0.00 0.13 0.01 0.02 0.00 −0.036) 0.01 −0.01 0.01 0.01 0.15 1.00 0.01 0.09 0.00 0.01 0.13 −0.14 −0.08 0.15 0.00 0.00 −0.01 0.007) −0.03 0.02 0.01 0.00 0.07 0.01 1.00 0.17 0.01 0.00 0.01 −0.03 0.01 0.06 0.01 0.01 −0.01 −0.018) 0.00 −0.01 0.00 0.00 0.01 0.09 0.17 1.00 0.00 0.00 0.02 −0.04 −0.03 0.02 0.00 −0.01 0.00 0.019) −0.08 0.03 0.00 0.00 0.01 0.00 0.01 0.00 1.00 0.13 −0.02 0.01 0.03 0.06 0.00 0.00 0.00 −0.0210) 0.04 −0.05 0.00 0.00 0.00 0.01 0.00 0.00 0.13 1.00 0.02 −0.04 −0.02 0.01 0.00 0.00 0.00 0.0211) −0.09 0.06 0.02 0.02 0.04 0.13 0.01 0.02 −0.02 0.02 1.00 −0.21 0.01 0.37 0.03 0.01 −0.01 −0.0112) −0.02 −0.03 −0.02 −0.01 −0.08 −0.14 −0.03 −0.04 0.01 −0.04 −0.21 1.00 0.08 −0.31 0.02 −0.01 −0.01 0.0113) −0.01 −0.30 0.00 0.02 0.00 −0.08 0.01 −0.03 0.03 −0.02 0.01 0.08 1.00 0.14 0.01 −0.03 −0.02 0.1314) −0.03 0.04 0.05 0.01 0.13 0.15 0.06 0.02 0.06 0.01 0.37 −0.31 0.14 1.00 0.01 0.01 0.00 −0.0315) −0.16 −0.13 0.00 0.00 0.01 0.00 0.01 0.00 0.00 0.00 0.03 0.02 0.01 0.01 1.00 −0.39 −0.26 0.1016) −0.04 0.17 0.00 0.01 0.02 0.00 0.01 −0.01 0.00 0.00 0.01 −0.01 −0.03 0.01 −0.39 1.00 −0.50 −0.0817) 0.13 0.16 0.00 0.00 0.00 −0.01 −0.01 0.00 0.00 0.00 −0.01 −0.01 −0.02 0.00 −0.26 −0.50 1.00 −0.1418) 0.10 −0.44 −0.01 0.00 −0.03 0.00 −0.01 0.01 −0.02 0.02 −0.01 0.01 0.13 −0.03 0.10 −0.08 −0.14 1.00
Table B.1: The correlation matrix for the set of the 18 heavy flavour parameters. BR(1), BR(2) and BR(3) denote BR(b → ℓ−), BR(b → c → ℓ+)and BR(c → ℓ+) respectively, PcDst denotes P(c → D∗+) × BR(D∗+ → π+D0).
129

Appendix C
Detailed inputs and results on W-boson and
four-fermion averages
Tables C.1, C.2, C.3, C.4, C.5, C.6, C.7 and C.8 give the details of the inputs and of the results for thecalculation of LEP averages of the WW cross section, of the WW cross section ratio RWW, of W decaybranching fractions, of the ZZ cross section, and of the total and hadronic single W cross sections. Forboth inputs and results, whenever relevant, the splitup of the errors into their various components isgiven in the table. For each measurement, the Collaborations provide additional information which isnecessary for the combination of LEP results, such as the expected statistical error or the splitup ofthe systematic uncertainty into its correlated and uncorrelated components.
130

(LCEC) (LUEU) (LUEC)√s σWW ∆σstat
WW ∆σsystWW ∆σsyst
WW ∆σsystWW ∆σsyst
WW ∆σWW
ALEPH [102,106, 110, 115]182.7 GeV 15.57 ±0.62 ±0.09 ±0.09 ±0.26 ±0.29 ±0.68188.6 GeV 15.71 ±0.34 ±0.05 ±0.09 ±0.15 ±0.18 ±0.38191.6 GeV 17.23 ±0.89 ±0.05 ±0.09 ±0.15 ±0.18 ±0.91195.5 GeV 17.00 ±0.54 ±0.05 ±0.09 ±0.15 ±0.18 ±0.57199.5 GeV 16.98 ±0.53 ±0.05 ±0.09 ±0.15 ±0.18 ±0.56201.6 GeV 16.16 ±0.74 ±0.05 ±0.09 ±0.15 ±0.18 ±0.76204.9 GeV 16.57 ±0.52 ±0.05 ±0.09 ±0.15 ±0.18 ±0.55206.6 GeV 17.32 ±0.41 ±0.05 ±0.09 ±0.15 ±0.18 ±0.45
DELPHI [103, 107, 111, 116]182.7 GeV 15.86 ±0.69 ±0.09 ±0.07 ±0.24 ±0.27 ±0.74188.6 GeV 15.83 ±0.38 ±0.07 ±0.05 ±0.18 ±0.20 ±0.43191.6 GeV 16.90 ±1.00 ±0.07 ±0.06 ±0.20 ±0.22 ±1.02195.5 GeV 17.86 ±0.59 ±0.07 ±0.06 ±0.20 ±0.22 ±0.63199.5 GeV 17.35 ±0.56 ±0.07 ±0.06 ±0.20 ±0.22 ±0.60201.6 GeV 17.67 ±0.81 ±0.08 ±0.07 ±0.21 ±0.23 ±0.84204.9 GeV 17.44 ±0.60 ±0.06 ±0.05 ±0.21 ±0.22 ±0.64206.6 GeV 16.50 ±0.43 ±0.06 ±0.05 ±0.20 ±0.21 ±0.48
L3 [104, 108, 114, 117]182.7 GeV 16.53 ±0.67 ±0.08 ±0.14 ±0.21 ±0.26 ±0.72188.6 GeV 16.24 ±0.37 ±0.04 ±0.08 ±0.20 ±0.22 ±0.43191.6 GeV 16.39 ±0.90 ±0.08 ±0.08 ±0.21 ±0.24 ±0.93195.5 GeV 16.67 ±0.55 ±0.08 ±0.08 ±0.21 ±0.24 ±0.60199.5 GeV 16.94 ±0.57 ±0.08 ±0.08 ±0.21 ±0.24 ±0.62201.6 GeV 16.95 ±0.85 ±0.08 ±0.08 ±0.21 ±0.24 ±0.88204.9 GeV 17.35 ±0.59 ±0.08 ±0.08 ±0.21 ±0.24 ±0.64206.6 GeV 17.96 ±0.45 ±0.08 ±0.08 ±0.21 ±0.24 ±0.51
OPAL [105,109, 112, 113,118]182.7 GeV 15.43 ±0.61 ±0.14 ±0.00 ±0.22 ±0.26 ±0.66188.6 GeV 16.30 ±0.34 ±0.07 ±0.00 ±0.17 ±0.18 ±0.38191.6 GeV 16.60 ±0.88 ±0.12 ±0.00 ±0.40 ±0.42 ±0.98195.5 GeV 18.59 ±0.60 ±0.12 ±0.00 ±0.41 ±0.43 ±0.74199.5 GeV 16.32 ±0.54 ±0.10 ±0.00 ±0.37 ±0.38 ±0.66201.6 GeV 18.48 ±0.81 ±0.12 ±0.00 ±0.40 ±0.42 ±0.91204.9 GeV 15.97 ±0.52 ±0.10 ±0.00 ±0.36 ±0.37 ±0.64206.6 GeV 17.77 ±0.42 ±0.09 ±0.00 ±0.37 ±0.38 ±0.57
LEP Averages χ2/d.o.f.182.7 GeV 15.79 ±0.32 ±0.10 ±0.04 ±0.11 ±0.15 ±0.36
27.42/24
188.6 GeV 16.00 ±0.18 ±0.05 ±0.03 ±0.08 ±0.10 ±0.21191.6 GeV 16.72 ±0.46 ±0.07 ±0.03 ±0.11 ±0.13 ±0.48195.5 GeV 17.43 ±0.29 ±0.07 ±0.04 ±0.10 ±0.13 ±0.32199.5 GeV 16.84 ±0.28 ±0.07 ±0.04 ±0.10 ±0.13 ±0.31201.6 GeV 17.23 ±0.40 ±0.07 ±0.04 ±0.10 ±0.13 ±0.42204.9 GeV 16.71 ±0.28 ±0.07 ±0.04 ±0.10 ±0.13 ±0.31206.6 GeV 17.33 ±0.22 ±0.06 ±0.04 ±0.10 ±0.12 ±0.25
Table C.1: W-pair production cross section (in pb) for different centre–of–mass energies. The first columncontains the centre–of–mass energy, and the second, the measurements. Observed statistical uncertainties areused in the fit and are listed in the third column; when asymmetric errors are quoted by the Collaborations,the positive error is listed in the table and used in the fit. The fourth, fifth and sixth columns contain thecomponents of the systematic errors, as subdivided by the Collaborations into LEP-correlated energy-correlated(LCEC), LEP-uncorrelated energy-uncorrelated (LUEU), LEP-uncorrelated energy-correlated (LUEC). Thetotal systematic error is given in the seventh column, the total error in the eighth. For the LEP averages, theχ2 of the fit is also given in the ninth column.
131

√s/ GeV 182.7 188.6 191.6 195.5 199.5 201.6 204.9 206.6
182.7 1.000 0.197 0.113 0.169 0.169 0.128 0.166 0.201
188.6 0.197 1.000 0.134 0.200 0.200 0.150 0.196 0.239
191.6 0.113 0.134 1.000 0.119 0.119 0.090 0.118 0.143
195.5 0.169 0.200 0.119 1.000 0.177 0.133 0.174 0.211
199.5 0.169 0.200 0.119 0.177 1.000 0.133 0.175 0.212
201.6 0.128 0.150 0.090 0.133 0.133 1.000 0.131 0.159
204.9 0.166 0.196 0.118 0.174 0.175 0.131 1.000 0.209
206.6 0.201 0.239 0.143 0.211 0.212 0.159 0.209 1.000
Table C.2: Correlation matrix for the LEP combined W-pair cross sections listed at the bottom of Table C.1.Correlations are all positive and range from 9% to 24%.
√s WW cross section (pb)
(GeV) σGENTLEWW σKORALW
WW σYFSWWWW σRACOONWW
WW
182.7 15.710 ± 0.020 15.619 ± 0.002 15.361 ± 0.005 15.368 ± 0.008
188.6 16.647 ± 0.020 16.554 ± 0.002 16.266 ± 0.005 16.249 ± 0.011
191.6 16.961 ± 0.020 16.865 ± 0.002 16.568 ± 0.006 16.519 ± 0.009
195.5 17.262 ± 0.020 17.165 ± 0.002 16.841 ± 0.006 16.801 ± 0.009
199.5 17.462 ± 0.020 17.361 ± 0.002 17.017 ± 0.007 16.979 ± 0.009
201.6 17.532 ± 0.020 17.428 ± 0.002 17.076 ± 0.006 17.032 ± 0.009
204.9 17.602 ± 0.020 17.497 ± 0.002 17.128 ± 0.006 17.079 ± 0.009
206.6 17.621 ± 0.020 17.516 ± 0.001 17.145 ± 0.006 17.087 ± 0.009
Table C.3: W-pair cross section predictions (in pb) for different centre–of–mass energies, according toGENTLE [126], KORALW [127], YFSWW [122] and RACOONWW [123], for mW = 80.35 GeV. The errorslisted in the table are only the statistical errors from the numerical integration of the cross section.
132

(LCEU) (LCEC) (LUEU) (LUEC)√s RWW ∆Rstat
WW ∆RsystWW ∆Rsyst
WW ∆RsystWW ∆Rsyst
WW ∆RWW χ2/d.o.f.
GENTLE [126]182.7 GeV 1.005 ±0.021 ±0.001 ±0.006 ±0.003 ±0.007 ±0.023
27.42/24
188.6 GeV 0.961 ±0.011 ±0.001 ±0.003 ±0.002 ±0.005 ±0.013191.6 GeV 0.986 ±0.027 ±0.001 ±0.004 ±0.002 ±0.006 ±0.028195.5 GeV 1.010 ±0.017 ±0.001 ±0.004 ±0.002 ±0.006 ±0.018199.5 GeV 0.964 ±0.016 ±0.001 ±0.004 ±0.002 ±0.006 ±0.018201.6 GeV 0.983 ±0.023 ±0.001 ±0.004 ±0.002 ±0.006 ±0.024204.9 GeV 0.949 ±0.016 ±0.001 ±0.004 ±0.002 ±0.006 ±0.018206.6 GeV 0.984 ±0.012 ±0.001 ±0.004 ±0.002 ±0.006 ±0.014Average 0.973 ±0.006 ±0.001 ±0.004 ±0.001 ±0.006 ±0.009 39.16/31
KORALW [127]182.7 GeV 1.011 ±0.021 ±0.000 ±0.006 ±0.003 ±0.007 ±0.023
27.42/24
188.6 GeV 0.967 ±0.011 ±0.000 ±0.003 ±0.002 ±0.005 ±0.013191.6 GeV 0.991 ±0.027 ±0.000 ±0.004 ±0.002 ±0.006 ±0.028195.5 GeV 1.015 ±0.017 ±0.000 ±0.004 ±0.002 ±0.006 ±0.018199.5 GeV 0.970 ±0.016 ±0.000 ±0.004 ±0.002 ±0.006 ±0.018201.6 GeV 0.989 ±0.023 ±0.000 ±0.004 ±0.002 ±0.006 ±0.024204.9 GeV 0.955 ±0.016 ±0.000 ±0.004 ±0.002 ±0.006 ±0.018206.6 GeV 0.989 ±0.012 ±0.000 ±0.004 ±0.002 ±0.006 ±0.014Average 0.979 ±0.006 ±0.000 ±0.004 ±0.001 ±0.006 ±0.009 39.20/31
YFSWW [122]182.7 GeV 1.028 ±0.021 ±0.000 ±0.006 ±0.003 ±0.007 ±0.023
27.42/24
188.6 GeV 0.984 ±0.011 ±0.000 ±0.003 ±0.002 ±0.005 ±0.013191.6 GeV 1.009 ±0.028 ±0.000 ±0.004 ±0.002 ±0.006 ±0.029195.5 GeV 1.035 ±0.017 ±0.000 ±0.004 ±0.002 ±0.006 ±0.019199.5 GeV 0.990 ±0.016 ±0.000 ±0.004 ±0.002 ±0.006 ±0.018201.6 GeV 1.009 ±0.024 ±0.000 ±0.004 ±0.002 ±0.006 ±0.025204.9 GeV 0.976 ±0.016 ±0.000 ±0.004 ±0.002 ±0.006 ±0.018206.6 GeV 1.011 ±0.013 ±0.000 ±0.004 ±0.002 ±0.006 ±0.015Average 0.998 ±0.006 ±0.000 ±0.004 ±0.001 ±0.006 ±0.009 39.04/31
RACOONWW [123]182.7 GeV 1.028 ±0.021 ±0.001 ±0.006 ±0.003 ±0.007 ±0.023
27.42/24
188.6 GeV 0.985 ±0.011 ±0.001 ±0.003 ±0.002 ±0.005 ±0.013191.6 GeV 1.012 ±0.028 ±0.001 ±0.004 ±0.002 ±0.006 ±0.029195.5 GeV 1.037 ±0.017 ±0.001 ±0.004 ±0.002 ±0.006 ±0.019199.5 GeV 0.992 ±0.016 ±0.001 ±0.004 ±0.002 ±0.006 ±0.018201.6 GeV 1.012 ±0.024 ±0.001 ±0.004 ±0.002 ±0.006 ±0.025204.9 GeV 0.978 ±0.016 ±0.001 ±0.004 ±0.002 ±0.006 ±0.018206.6 GeV 1.014 ±0.013 ±0.001 ±0.004 ±0.002 ±0.006 ±0.015Average 1.000 ±0.006 ±0.000 ±0.004 ±0.001 ±0.006 ±0.009 39.14/31
Table C.4: Ratios of LEP combined W-pair cross section measurements to the expectations of the four theo-retical models considered, for different centre–of–mass energies and for all energies combined. The first columncontains the centre–of–mass energy, the second the combined ratios, the third the statistical errors. The fourth,fifth, sixth and seventh columns contain the sources of systematic errors that are considered as LEP-correlatedenergy-uncorrelated (LCEU), LEP-correlated energy-correlated (LCEC), LEP-uncorrelated energy-uncorrelated(LUEU), LEP-uncorrelated energy-correlated (LUEC). The total error is given in the eighth column. The onlyLCEU systematic sources considered are the statistical errors on the cross section theoretical predictions, whilethe LCEC, LUEU and LUEC sources are those coming from the corresponding errors on the cross sectionmeasurements.
133

Decay (unc) (cor) 3×3 correlation
channel B ∆Bstat ∆Bsyst ∆Bsyst ∆Bsyst ∆B for ∆B
ALEPH [115]
B(W → eνe) 10.95 ±0.27 ±0.15 ±0.04 ±0.16 ±0.31 ( 1.000 -0.048 -0.271
-0.048 1.000 -0.253
-0.271 -0.253 1.000
)
B(W → µνµ) 11.11 ±0.25 ±0.14 ±0.04 ±0.15 ±0.29
B(W → τντ ) 10.57 ±0.32 ±0.20 ±0.04 ±0.20 ±0.38
DELPHI [116]
B(W → eνe) 10.36 ±0.30 ±0.15 ±0.05 ±0.16 ±0.34 ( 1.000 -0.050 -0.330
-0.050 1.000 -0.250
-0.330 -0.250 1.000
)
B(W → µνµ) 10.62 ±0.26 ±0.09 ±0.05 ±0.10 ±0.28
B(W → τντ ) 10.99 ±0.39 ±0.26 ±0.03 ±0.26 ±0.47
L3 [117]
B(W → eνe) 10.40 ±0.26 ±0.13 ±0.06 ±0.14 ±0.30 ( 1.000 -0.016 -0.279
-0.016 1.000 -0.295
-0.279 -0.295 1.000
)
B(W → µνµ) 9.72 ±0.27 ±0.14 ±0.06 ±0.15 ±0.31
B(W → τντ ) 11.78 ±0.38 ±0.20 ±0.06 ±0.21 ±0.43
OPAL [118]
B(W → eνe) 10.40 ±0.25 ±0.24 ±0.05 ±0.25 ±0.35 ( 1.000 0.141 -0.179
0.141 1.000 -0.174
-0.179 -0.174 1.000
)
B(W → µνµ) 10.61 ±0.25 ±0.23 ±0.06 ±0.24 ±0.35
B(W → τντ ) 11.18 ±0.31 ±0.37 ±0.05 ±0.37 ±0.48
LEP Average (without lepton universality assumption)
B(W → eνe) 10.54 ±0.13 ±0.08 ±0.05 ±0.10 ±0.17 ( 1.000 0.066 -0.214
0.066 1.000 -0.189
-0.214 -0.189 1.000
)
B(W → µνµ) 10.54 ±0.13 ±0.08 ±0.05 ±0.09 ±0.16
B(W → τντ ) 11.09 ±0.17 ±0.13 ±0.04 ±0.14 ±0.22
χ2/d.o.f. 14.9/9
LEP Average (with lepton universality assumption)
B(W → ℓνℓ) 10.69 ±0.06 ±0.05 ±0.05 ±0.07 ±0.09
B(W → had.) 67.92 ±0.17 ±0.15 ±0.15 ±0.21 ±0.27
χ2/d.o.f. 18.8/11
Table C.5: W branching fraction measurements (in %). The first column contains the decay channel, the secondthe measurements, the third the statistical uncertainty. The fourth and fifth column list the uncorrelated andcorrelated components of the systematic errors, as provided by the Collaborations. The total systematic erroris given in the sixth column and the total error in the seventh. Correlation matrices for the three leptonicbranching fractions are given in the last column. This table is identical to Table 7 of Ref. [95], because resultsare not updated with respect to those presented for the winter 2001 conferences.
134

√s σZZ ∆σstat
ZZ ∆σsyst (unc)ZZ ∆σ
syst (cor)ZZ ∆σsyst
ZZ ∆σZZ ∆σstat (exp)ZZ
ALEPH [132,141, 142]
182.7 GeV 0.11 +0.16−0.11 ±0.04 ±0.01 ±0.04 +0.16
−0.12 ±0.14188.6 GeV 0.67 +0.13
−0.12 ±0.04 ±0.01 ±0.04 +0.14−0.13 ±0.13
191.6 GeV 0.53 +0.34−0.27 ±0.02 ±0.01 ±0.02 +0.34
−0.27 ±0.33195.5 GeV 0.69 +0.23
−0.20 ±0.03 ±0.01 ±0.03 +0.23−0.20 ±0.23
199.5 GeV 0.70 +0.22−0.20 ±0.03 ±0.01 ±0.03 +0.22
−0.20 ±0.23201.6 GeV 0.70 +0.33
−0.28 ±0.02 ±0.01 ±0.02 +0.33−0.28 ±0.35
204.9 GeV 1.21 +0.26−0.23 ±0.03 ±0.01 ±0.03 +0.26
−0.23 ±0.27206.6 GeV 1.01 +0.19
−0.17 ±0.02 ±0.01 ±0.02 +0.19−0.17 ±0.18
DELPHI [133, 143–145]182.7 GeV 0.38 ±0.18 ±0.04 ±0.01 ±0.04 ±0.18 ±0.15188.6 GeV 0.60 ±0.13 ±0.07 ±0.02 ±0.07 ±0.15 ±0.14191.6 GeV 0.55 ±0.33 ±0.08 ±0.02 ±0.08 ±0.34 ±0.40195.5 GeV 1.17 ±0.27 ±0.09 ±0.03 ±0.10 ±0.29 ±0.24199.5 GeV 1.08 ±0.24 ±0.10 ±0.03 ±0.11 ±0.26 ±0.23201.6 GeV 0.87 ±0.31 ±0.11 ±0.03 ±0.11 ±0.33 ±0.34204.9 GeV 1.05 ±0.23 ±0.12 ±0.04 ±0.12 ±0.26 ±0.23206.6 GeV 0.98 ±0.18 ±0.11 ±0.03 ±0.12 ±0.22 ±0.19
L3 [134–136,138, 146]
182.7 GeV 0.31 +0.16−0.15 ±0.05 ±0.01 ±0.05 +0.17
−0.15 ±0.16188.6 GeV 0.73 +0.15
−0.14 ±0.03 ±0.02 ±0.04 +0.15−0.14 ±0.15
191.6 GeV 0.29 ±0.22 ±0.01 ±0.02 ±0.02 ±0.22 ±0.34195.5 GeV 1.18 ±0.24 ±0.06 ±0.07 ±0.09 ±0.26 ±0.22199.5 GeV 1.25 ±0.25 ±0.06 ±0.07 ±0.09 ±0.27 ±0.24201.6 GeV 0.95 ±0.38 ±0.05 ±0.05 ±0.07 ±0.39 ±0.35204.9 GeV 0.84 ±0.22 ±0.05 ±0.05 ±0.07 ±0.23 ±0.23206.6 GeV 1.20 ±0.18 ±0.07 ±0.07 ±0.10 ±0.21 ±0.17
OPAL [137,139]
182.7 GeV 0.12 +0.20−0.18 ±0.03 ±0.01 ±0.03 +0.20
−0.18 ±0.19188.6 GeV 0.80 +0.14
−0.13 ±0.06 ±0.02 ±0.06 +0.15−0.14 ±0.14
191.6 GeV 1.13 +0.46−0.39 ±0.11 ±0.03 ±0.11 +0.47
−0.41 ±0.36195.5 GeV 1.19 +0.27
−0.24 ±0.09 ±0.03 ±0.09 +0.28−0.26 ±0.25
199.5 GeV 1.09 +0.25−0.23 ±0.08 ±0.02 ±0.08 +0.26
−0.24 ±0.25201.6 GeV 0.94 +0.37
−0.32 ±0.07 ±0.03 ±0.08 +0.38−0.33 ±0.37
204.9 GeV 1.07 +0.26−0.24 ±0.09 ±0.03 ±0.09 +0.28
−0.26 ±0.26206.6 GeV 1.07 +0.20
−0.19 ±0.07 ±0.03 ±0.08 +0.22−0.21 ±0.21
LEP Averages χ2/d.o.f.182.7 GeV 0.23 ±0.08 ±0.02 ±0.01 ±0.02 ±0.08 2.28/3188.6 GeV 0.70 ±0.07 ±0.03 ±0.02 ±0.03 ±0.08 0.97/3191.6 GeV 0.60 ±0.18 ±0.03 ±0.02 ±0.04 ±0.18 2.88/3195.5 GeV 1.04 ±0.12 ±0.03 ±0.03 ±0.05 ±0.13 3.23/3199.5 GeV 1.01 ±0.12 ±0.04 ±0.03 ±0.05 ±0.13 2.80/3201.6 GeV 0.86 ±0.18 ±0.04 ±0.03 ±0.05 ±0.18 0.32/3204.9 GeV 1.03 ±0.12 ±0.04 ±0.03 ±0.05 ±0.13 1.11/3206.6 GeV 1.06 ±0.09 ±0.04 ±0.03 ±0.05 ±0.11 0.76/3
Table C.6: Z-pair production cross section (in pb) at different energies. The first column contains the LEPcentre–of–mass energy, the second the measurements and the third the statistical uncertainty. The fourth andthe fifth columns list the uncorrelated and correlated components of the systematic errors, as provided by theCollaborations. The total systematic error is given in the sixth column, the total error in the seventh. Theeighth column lists, for the four LEP measurements, the symmetrized expected statistical error, and for theLEP combined value, the χ2 of the fit.
135

√s σWeν (tot) ∆σstat
Weν (tot) ∆σsystWeν (tot) ∆σWeν (tot) ∆σ
stat (exp)Weν (tot)
ALEPH [149,152, 155]
182.7 GeV 0.61 ±0.26 ±0.06 ±0.27 ±0.25
188.6 GeV 0.45 ±0.14 ±0.04 ±0.15 ±0.16
191.6 GeV 1.31 ±0.47 ±0.11 ±0.48 ±0.40
195.5 GeV 0.65 ±0.24 ±0.06 ±0.25 ±0.25
199.5 GeV 0.99 ±0.25 ±0.10 ±0.27 ±0.24
201.6 GeV 0.75 ±0.35 ±0.08 ±0.36 ±0.36
204.9 GeV 0.78 ±0.26 ±0.07 ±0.27 ±0.26
206.6 GeV 1.19 ±0.22 ±0.12 ±0.25 ±0.21
DELPHI [150, 157]
188.6 GeV 0.75 +0.29−0.25 ±0.07 +0.30
−0.26 ±0.26
191.6 GeV 0.17 +0.33−0.17 ±0.07 +0.34
−0.18 ±0.61
195.5 GeV 0.94 +0.40−0.35 ±0.07 +0.41
−0.36 ±0.36
199.5 GeV 0.51 +0.32−0.31 ±0.07 +0.33
−0.32 ±0.30
201.6 GeV 1.15 +0.55−0.45 ±0.07 +0.55
−0.46 ±0.47
204.9 GeV 0.56 +0.36−0.31 ±0.06 +0.36
−0.32 ±0.35
206.6 GeV 0.58 +0.25−0.22 ±0.06 +0.26
−0.23 ±0.28
L3 [151, 153, 154, 158]
182.7 GeV 0.80 +0.28−0.25 ±0.05 +0.28
−0.25 ±0.26
188.6 GeV 0.69 +0.16−0.14 ±0.04 +0.16
−0.15 ±0.15
191.6 GeV 1.06 +0.48−0.41 ±0.09 +0.49
−0.42 ±0.45
195.5 GeV 0.98 +0.27−0.25 ±0.09 +0.28
−0.27 ±0.24
199.5 GeV 0.79 +0.26−0.23 ±0.06 +0.27
−0.24 ±0.25
201.6 GeV 1.38 +0.45−0.40 ±0.13 +0.47
−0.42 ±0.38
OPAL [159]
188.6 GeV 0.67 +0.16−0.14 ±0.06 +0.17
−0.15 ±0.16
LEP Averages χ2/d.o.f.
182.7 GeV 0.70 ±0.18 ±0.04 ±0.19 0.26/1
188.6 GeV 0.62 ±0.09 ±0.03 ±0.09 1.60/3
191.6 GeV 0.99 ±0.27 ±0.06 ±0.28 2.38/2
195.5 GeV 0.84 ±0.16 ±0.05 ±0.16 0.92/2
199.5 GeV 0.79 ±0.15 ±0.05 ±0.16 1.40/2
201.6 GeV 1.06 ±0.23 ±0.06 ±0.24 1.38/2
204.9 GeV 0.70 ±0.21 ±0.05 ±0.22 0.24/1
206.6 GeV 0.94 ±0.17 ±0.08 ±0.18 2.71/1
Table C.7: Single-W total production cross section (in pb) at different energies. The first column containsthe LEP centre–of–mass energy, and the second the measurements. The third and fourth column list thestatistical and systematic uncertainties, and the fifth the total error. The sixth column lists, for the four LEPmeasurements, the symmetrized expected statistical error, and for the LEP combined value, the χ2 of the fit.
136

√s σWeν (had) ∆σstat
Weν (had) ∆σsystWeν (had) ∆σWeν (had) ∆σ
stat (exp)Weν (had)
ALEPH [149,152, 155]
182.7 GeV 0.40 ±0.23 ±0.06 ±0.24 ±0.23
188.6 GeV 0.31 ±0.13 ±0.04 ±0.14 ±0.14
191.6 GeV 0.94 ±0.43 ±0.11 ±0.44 ±0.37
195.5 GeV 0.45 ±0.22 ±0.06 ±0.23 ±0.23
199.5 GeV 0.82 ±0.24 ±0.10 ±0.26 ±0.22
201.6 GeV 0.68 ±0.34 ±0.08 ±0.35 ±0.33
204.9 GeV 0.50 ±0.24 ±0.07 ±0.25 ±0.24
206.6 GeV 0.95 ±0.21 ±0.12 ±0.24 ±0.19
DELPHI [150, 157]
188.6 GeV 0.44 +0.27−0.24 ±0.07 +0.28
−0.25 ±0.25
191.6 GeV 0.01 +0.18−0.01 ±0.07 +0.19
−0.07 ±0.57
195.5 GeV 0.78 +0.37−0.33 ±0.07 +0.38
−0.34 ±0.33
199.5 GeV 0.16 +0.28−0.16 ±0.07 +0.29
−0.17 ±0.27
201.6 GeV 0.55 +0.46−0.39 ±0.07 +0.47
−0.40 ±0.43
204.9 GeV 0.50 +0.34−0.30 ±0.06 +0.35
−0.31 ±0.33
206.6 GeV 0.37 +0.23−0.20 ±0.06 +0.24
−0.21 ±0.26
L3 [151, 153, 154, 158]
182.7 GeV 0.58 +0.23−0.20 ±0.04 +0.23
−0.20 ±0.21
188.6 GeV 0.52 +0.14−0.13 ±0.03 +0.14
−0.13 ±0.14
191.6 GeV 0.85 +0.45−0.37 ±0.06 +0.45
−0.37 ±0.41
195.5 GeV 0.66 +0.24−0.22 ±0.05 +0.25
−0.23 ±0.21
199.5 GeV 0.34 +0.23−0.20 ±0.03 +0.23
−0.20 ±0.22
201.6 GeV 1.09 +0.41−0.36 ±0.08 +0.42
−0.37 ±0.35
OPAL [159]
188.6 GeV 0.53 +0.13−0.12 ±0.05 +0.14
−0.13 ±0.13
LEP Averages χ2/d.o.f.
182.7 GeV 0.50 ±0.16 ±0.04 ±0.16 0.31/1
188.6 GeV 0.46 ±0.08 ±0.02 ±0.08 1.47/3
191.6 GeV 0.73 ±0.25 ±0.06 ±0.25 1.94/2
195.5 GeV 0.60 ±0.14 ±0.03 ±0.15 0.77/2
199.5 GeV 0.46 ±0.14 ±0.04 ±0.14 3.60/2
201.6 GeV 0.80 ±0.21 ±0.05 ±0.21 1.13/2
204.9 GeV 0.50 ±0.20 ±0.05 ±0.20 0.00/1
206.6 GeV 0.71 ±0.15 ±0.08 ±0.17 2.77/1
Table C.8: Single-W hadronic production cross section (in pb) at different energies. The first column containsthe LEP centre–of–mass energy, and the second the measurements. The third and fourth column list thestatistical and systematic uncertainties, and the fifth the total error. The sixth column lists, for the four LEPmeasurements, the symmetrized expected statistical error, and for the LEP combined value, the χ2 of the fit.
137

Bibliography
[1] The LEP Collaborations ALEPH, DELPHI, L3, OPAL and the LEP Electroweak WorkingGroup, and the SLD Heavy Flavour and Electroweak Groups, A Combination of PreliminaryElectroweak Measurements and Constraints on the Standard Model, CERN–EP-2001-21, hep-ex/0103048.
[2] The LEP Collaborations ALEPH, DELPHI, L3 and OPAL and the LEP Electroweak workinggroup, Combination procedure for the precise determination of Z boson parameters from resultsof the LEP experiments, CERN–EP-2000-153, hep-ex/0101027.
[3] The LEP Experiments: ALEPH, DELPHI, L3 and OPAL, Nucl. Inst. Meth. A378 (1996) 101.
[4] ALEPH Collaboration, D. Decamp et al., Z. Phys. C48 (1990) 365;ALEPH Collaboration, D. Decamp et al., Z. Phys. C53 (1992) 1;ALEPH Collaboration, D. Buskulic et al., Z. Phys. C60 (1993) 71;ALEPH Collaboration, D. Buskulic et al., Z. Phys. C62 (1994) 539;ALEPH Collaboration, R. Barate et al., Eur. Phys. J. C 14 (2000) 1.
[5] DELPHI Collaboration, P. Aarnio et al., Nucl. Phys. B367 (1991) 511;DELPHI Collaboration, P. Abreu et al., Nucl. Phys. B417 (1994) 3;DELPHI Collaboration, P. Abreu et al., Nucl. Phys. B418 (1994) 403;DELPHI Collaboration, P. Abreu et al., Eur. Phys. J. C 16 (2000) 371.
[6] L3 Collaboration, B. Adeva et al., Z. Phys. C51 (1991) 179;L3 Collaboration, O. Adriani et al., Phys. Rep. 236 (1993) 1;L3 Collaboration, M. Acciarri et al., Z. Phys. C62 (1994) 551;L3 Collaboration, M. Acciarri et al., Eur. Phys. J. C16 (2000) 1-40.
[7] OPAL Collaboration, G. Alexander et al., Z. Phys. C52 (1991) 175;OPAL Collaboration, P.D. Acton et al., Z. Phys. C58 (1993) 219;OPAL Collaboration, R. Akers et al., Z. Phys. C61 (1994) 19;OPAL Collaboration, G. Abbiendi et al., Eur. Phys. J. C14 (2000) 373;OPAL Collaboration, G. Abbiendi et al., Eur. Phys. J. C19 (2001) 587.
[8] F.A. Berends et al., in Z Physics at LEP 1, Vol. 1, ed. G. Altarelli, R. Kleiss and C. Verzegnassi,(CERN Report: CERN 89-08, 1989), p. 89.M. Bohm et al., in Z Physics at LEP 1, Vol. 1, ed. G. Altarelli, R. Kleiss and C. Verzegnassi,(CERN Report: CERN 89-08, 1989), p. 203.
[9] See, for example, M. Consoli et al., in Z Physics at LEP 1, Vol. 1, ed G. Altarelli, R. Kleiss andC. Verzegnassi, (CERN Report: CERN 89-08, 1989), p. 7.
[10] S. Jadach, et al., Phys. Lett. B257 (1991) 173.
[11] M. Skrzypek, Acta Phys. Pol. B23 (1992) 135.
138

[12] G. Montagna, et al., Phys. Lett. B406 (1997) 243.
[13] G. Montagna et al., Nucl. Phys. B547 (1999) 39;G. Montagna et al., Phys. Rev. Lett. 459 (1999) 649.
[14] B.F.L Ward et al., Phys. Lett. B450 (1999) 262.
[15] D. Bardin, M. Grunewald and G. Passarino, Precision Calculation Project Report, hep-ph/9902452.
[16] ALEPH Collaboration, D. Buskulic et al., Zeit. Phys. C69 (1996) 183;ALEPH Collaboration, A. Heister et al., CERN-EP/2001-027 and Eur. Phys. J. C20 (2001)401.
[17] DELPHI Collaboration, P. Abreu et al., Eur. Phys. J. C14 (2000) 585.
[18] L3 Collaboration, M. Acciarri et al., Phys. Lett. B429 (1998) 387.
[19] OPAL Collaboration, G. Abbiendi et al., Precision Neutral Current Asymmetry Parameter Mea-surements from the Tau Polarization at LEP, CERN-EP-2001-023, Submitted to Eur. Phys. J.C.
[20] The LEP Collaborations ALEPH, DELPHI, L3, OPAL and the LEP Electroweak WorkingGroup, Combined Preliminary Data on Z Parameters from the LEP Experiments and Con-straints on the Standard Model, CERN–PPE/94-187.
[21] SLD Collaboration, K. Abe et al., Phys. Rev. Lett. 84 (2000) 5945.
[22] SLD Collaboration, K. Abe et al., SLAC-PUB-8618, (2000). Submitted to Phys.Rev.Lett.
[23] The LEP Heavy Flavour Group, Final input parameters for the LEP/SLD heavy flavour analyses,LEPHF/01-01,http://www.cern.ch/LEPEWWG/heavy/lephf0101.ps.gz.
[24] ALEPH Collaboration, R. Barate et al., Physics Letters B 401 (1997) 150;ALEPH Collaboration, R. Barate et al., Physics Letters B 401 (1997) 163.
[25] DELPHI Collaboration, P.Abreu et al., Eur. Phys. J. C10 (1999) 415.
[26] L3 Collaboration, M. Acciarri et al., Eur. Phys. J. C13 (2000) 47.
[27] OPAL Collaboration, G. Abbiendi et al., Eur. Phys. J. C8 (1999) 217.
[28] SLD Collaboration, K. Abe et al., Phys. Rev. Lett. 80 (1998) 660;see also [242].
[29] ALEPH Collaboration, R. Barate et al., Eur. Phys. J. C4 (1998) 557.
[30] DELPHI Collaboration, P.Abreu et al., Eur. Phys. J. C12 (2000) 209.
[31] DELPHI Collaboration, P.Abreu et al., Eur. Phys. J. C12 (2000) 225.
[32] OPAL Collaboration, K. Ackerstaff et al., Eur. Phys. J. C1 (1998) 439.
[33] ALEPH Collaboration, R. Barate et al., Eur. Phys. J. C16 (2000) 597.
[34] OPAL Collaboration, G. Alexander et al., Z. Phys. C72 (1996) 1.
139

[35] SLD Collaboration, A Measurement of Rc with the SLD Detector SLAC–PUB–7880, contributedpaper to ICHEP 98 Vancouver ICHEP’98 #174 ;see also [242].
[36] D. Abbaneo et al., Eur. Phys. J. C4 (1998) 185.
[37] D. Bardin et al., Z. Phys. C44 (1989) 493; Comp. Phys. Comm. 59 (1990) 303; Nucl. Phys.B351(1991) 1; Phys. Lett. B255 (1991) 290 and CERN-TH 6443/92 (May 1992); the mostrecent version of ZFITTER (6.21) is described in DESY 99-070, hep-ph/9908433 (Aug 1999)published in Comp. Phys. Comm. 133 (2001) 229.
[38] ALEPH Collaboration, D. Buskulic et al., Phys. Lett. B384 (1996)414;ALEPH Collaboration, Measurement of the b and c forward-backward asymmetries using leptonsALEPH 99-076 CONF 99-048, contributed paper to EPS 99 Tampere HEP’99 #6-65.
[39] DELPHI Collaboration, P.Abreu et al., Z. Phys C65 (1995) 569;DELPHI Collaboration, Measurement of the Forward-Backward Asymmetries of e+e− → Z →bb and e+e− → Z → cc using prompt leptons DELPHI 2000-101 CONF 400, contributedpaper to ICHEP 2000 Osaka ICHEP’00 #377 .Delphi notes are available at http://wwwcn.cern.ch/˜pubxx/www/delsec/delnote/.
[40] L3 Collaboration, O. Adriani et al., Phys. Lett. B292 (1992) 454;
L3 Collaboration, L3 Results on AbbFB, A
ccFBand χ for the Glasgow Conference, L3 Note 1624;
L3 Collaboration, M. Acciarri et al., Phys. Lett. B448 (1999) 152.
[41] OPAL Collaboration, G. Alexander et al., Z. Phys. C70 (1996) 357;OPAL Collaboration, R. Akers et al., Updated Measurement of the Heavy Quark Forward-Backward Asymmetries and Average B Mixing Using Leptons in Multihadronic Events, OPALPhysics Note PN226 contributed paper to ICHEP96, Warsaw, 25-31 July 1996 PA05-007
OPAL Collaboration, R. Akers et al., QCD corrections to the bottom and charm forward-backward asymmetries OPAL Physics Note PN284.
[42] ALEPH Collaboration, A. Heister et al., Measurement of AbFB using Inclusive b-hadron Decays,
CERN-EP/2001-047 and Eur. Phys. J. C DOI 10.1007/s100520100812.
[43] DELPHI Collaboration, P.Abreu et al., Eur. Phys. J. C9 (1999) 367.
[44] DELPHI Collaboration, Determination of AbFB using inclusive charge reconstruction and lifetime
tagging at LEP 1, DELPHI 2001-027 CONF 468.
[45] L3 Collaboration, M. Acciarri et al., Phys. Lett. B439 (1998) 225.
[46] OPAL Collaboration, K.Ackerstaff et al., Z. Phys. C75 (1997) 385.
[47] ALEPH Collaboration, R. Barate et al., Phys. Lett. B434 (1998) 415.
[48] DELPHI Collaboration, P.Abreu et al., Eur. Phys. J. C10 (1999) 219.
[49] OPAL Collaboration, G. Alexander et al., Z. Phys. C73 (1996) 379.
[50] SLD Collaboration, K. Abe et al., Phys. Rev. Lett. 30 (1999) 3384; SLD Collaboration, K. Abeet al., SLAC-PUB-8951, to be submitted to Phys. Rev. Lett.
[51] SLD Collaboration, K. Abe, et al., Phys Rev. D63 032005 (2001);see also [242].
140

[52] SLD Collaboration, K. Abe, et al., Phys Rev. Lett. 81 942 (1998);see also [242].
[53] SLD Collaboration, K. Abe et al, Phys. Rev. Lett. 83, 1902 (1999).
[54] SLD Collaboration, Direct measurement of Ab using charged kaons at the SLD detector, SLAC-PUB-8200, contributed paper to EPS 99 Tampere HEP’99 #6 473 ;SLD Collaboration, Direct measurement of Ab using charged vertices, SLAC-PUB-8542, Con-tributed Paper to ICHEP2000 , # 743;see also [242].
[55] SLD Collaboration, Direct measurement of Ac using inclusive charm tagging at the SLD detector,SLAC-PUB-8199, contributed paper to EPS 99 Tampere HEP’99 #6 474 ;see also [242].
[56] ALEPH Collaboration. , Inclusive semileptonic branching ratios of b hadrons produced in Zdecays, CERN-EP/2001-057.
[57] DELPHI Collaboration, Measurement of the semileptonic b branching ratios in Z decays DEL-PHI 99-111 CONF 298, contributed paper to EPS 99 Tampere HEP’99 #5 522 .
[58] L3 Collaboration, M. Acciarri et al., Z Phys. C71 379 (1996).
[59] OPAL Collaboration, G. Abbiendi et al., Eur. Phys. J. C13 (2000) 225.
[60] OPAL Collaboration, G. Abbiendi et al., Eur. Phys. J. C8 (1999) 573.
[61] ALEPH Collaboration, D. Buskulic et al., Z. Phys. C71 (1996) 357.
[62] DELPHI Collaboration, P. Abreu et al., Phys. Lett. B277 (1992) 371.
[63] OPAL Collaboration, P. D. Acton et al., Phys. Lett. B294 (1992) 436.
[64] T. Sjostrand, Comp. Phys. Comm. 82 (1994) 74.
[65] G. Marchesini et al., Comp. Phys. Comm. 67 (1992) 465.
[66] ALEPH Collab., ALEPH 2000-008 CONF 2000-005 and ref. therein;DELPHI Collab., DELPHI 2001-093 CONF 521 and ref. therein;L3 Collab., L3 Note 2650 and ref. therein;OPAL Collab. OPAL PN469.
[67] S. D. Drell, Ann. Phys. 4 (1958) 75.
[68] F. E. Low, Phys. Rev. Lett. 14 (1965) 238.
[69] O. J. P. Eboli, A. A. Natale, and S. F. Novaes, Phys. Lett. B271 (1991) 274.
[70] K. Agashe and N. G. Deshpande, Phys. Lett. B456 (1999) 60.
[71] B. Vachon. Excited electron contribution to the e+e− → γγ cross-section. hep-ph/0103132,2001.
[72] LEPEWWG ff Subgroup, D. Bourilkov et. al., LEP2FF/01-01,ALEPH 2001-039 PHYSIC 2000-013, DELPHI 2001-108 PHYS 896, L3 note 2663, OPAL TN690.
[73] LEPEWWG ff Subgroup, C. Geweniger et. al., LEP2FF/00-03,ALEPH 2000-088 PHYSIC 2000-034, DELPHI 2000-168 PHYS 881, L3 note 2624, OPAL TN673.
141

[74] LEPEWWG ff Subgroup, D. Bourilkov et. al., LEP2FF/00-01,ALEPH 2000-026 PHYSIC 2000-005, DELPHI 2000-046 PHYS 855, L3 note 2527, OPAL TN647.
[75] LEPEWWG ff Subgroup, D. Bourilkov et. al., LEP2FF/99-01,ALEPH 99-082 PHYSIC 99-030,DELPHI 99-143 PHYS 829, L3 note 2443, OPAL TN616.
[76] LEPEWWG ff subgroup: http://www.cern.ch/LEPEWWG/lep2/ .
[77] ALEPH Collaboration “Study of Fermion Pair Production in e+e− Collisions at 130-183 GeV”,Eur. Phys. J. C12 (2000) 183;ALEPH Collaboration, “Fermion Pair Production in e+e− Collisions at 189 GeV and Limits onPhysics Beyond the Standard Model”, ALEPH 99-018 CONF 99-013;ALEPH Collaboration, “Fermion Pair Production in e+e− Collisions from 192 to 202 GeV”,ALEPH 2000-025 CONF 2000-021;ALEPH Collaboration, “Fermion Pair Production in e+e− Collisions at high energy and Limitson Physics beyond the Standard Model ”, ALEPH 2001-019 CONF 2001-016;DELPHI Collaboration,“Measurement and Interpretation of Fermion-Pair Production at LEPenergies from 130 to 172 GeV”, Eur. Phys. J. C11 (1999), 383;DELPHI Collaboration, “Measurement and Interpretation of Fermion-Pair Production at LEPEnergies from 183 to 189 GeV”, Phys.Lett. B485 (2000), 45;DELPHI Collaboration, “Results on Fermion-Pair Production at LEP running from 192 to 202GeV”, DELPHI 2000-128 OSAKA CONF 427;DELPHI Collaboration, “Results on Fermion-Pair Production at LEP running in 2000”, DEL-PHI 2001-094 CONF 522;L3 Collaboration, “Measurement of Hadron and Lepton-Pair Production at 161 GeV <
√s <
172 GeV at LEP”, Phys. Lett. B407 (1997) 361;L3 Collaboration, “Measurement of Hadron and Lepton-Pair Production at 130 GeV <
√s <
189 GeV at LEP”, Phys. Lett. B479 (2000), 101.L3 Collaboration, “Preliminary L3 Results on Fermion-Pair Production in 1999”, L3 note 2563;L3 Collaboration,“Preliminary L3 Results on Fermion-Pair Production in 2000”, L3 note 2648;OPAL Collaboration, “Tests of the Standard Model and Constraints on New Physics from Mea-surements of Fermion Pair Production at 130 - 172 GeV at LEP”, Euro. Phys. J. C2 (1998)441;OPAL Collaboration, “Tests of the Standard Model and Constraints on New Physics from Mea-surements of Fermion Pair Production at 183 GeV at LEP”, Euro. Phys. J. C6 (1999) 1;OPAL Collaboration, “Tests of the Standard Model and Constraints on New Physics from Mea-surements of Fermion Pair Production at 189 GeV at LEP”, Euro. Phys. J. C13 (2000) 553;OPAL Collaboration, “Tests of the Standard Model and Constraints on New Physics from Mea-surements of Fermion Pair Production at 192-202 GeV at LEP”, OPAL PN424 (2000);OPAL Collaboration, “Measurement of Standard Model Processes in e+e- Collisions at sqrts 203-209 GeV”, OPAL PN469 (2001).
[78] D. Bardin et al., CERN-TH 6443/92; http://www.ifh.de/∼riemann/Zfitter/zf.html .Predictions are from ZFITTER versions 6.04 or later.Definition 1 corresponds to the ZFITTER flags FINR=0 and INTF=0; definition 2 correspondsto FINR=0 and INTF=1 for hadrons, FINR=1 and INTF=1 for leptons.
[79] G. Montagna et al., Comput. Phys. Commun. 117 (1999) 278.
[80] S. Jadach et al., http://home.cern.ch/∼jadach/KKindex.html .
[81] M. Kobel et al., “Two-Fermion Production in Electron Positron Collisions” in S. Jadach et al.[eds] , “Reports of the Working Groups on Precision Calculations for LEP2 Physics: proceedings”CERN 2000-009, hep-ph/0007180.
142

[82] L. Lyons, D. Gibaut and P. Clifford, Nucl. Instr. Meth. A270 (1988) 110.
[83] ALEPH Collaboration, Euro. Phys J. C12 (2000) 183;DELPHI Collaboration, P.Abreu et al., Euro. Phys J. C11(1999);L3 Collaboration, M.Acciarri et al., Phys. Lett. B485 (2000) 71;OPAL Collaboration, G.Abbiendi et al., Euro. Phys. J. C16 (2000) 41.
[84] ALEPH Collaboration, ALEPH 99-018 CONF 99-013;ALEPH Collaboration, ALEPH 2000-046 CONF 2000-029;ALEPH Collaboration, ALEPH 2000-047 CONF 2000-030;ALEPH Collaboration, ALEPH 2001-019 CONF 2001-016;DELPHI Collaboration, DELPHI 2001-095 CONF 523;L3 Collaboration, L3 Internal Note 2640, 1 March 2001.
[85] LEPEWWG Heavy Flavour at LEP2 Subgroup, “Combination of Heavy Flavour Measurementsat LEP2”, LEP2FF/00-02.
[86] ZFITTER V6.23 is used.D. Bardin et al., Preprint hep-ph/9908433.Relevant ZFITTER settings used are FINR=0 and INTF=1.
[87] DELPHI Collaboration, P.Abreu et al., Euro Phys J. C10(1999) 415.The LEP collaborations et al., CERN-EP/2000-016.
[88] P. Langacker, R.W. Robinett and J.L. Rosner, Phys. Rev. D30 (1984) 1470;D. London and J.L. Rosner, Phys. Rev. D34 (1986) 1530;J.C. Pati and A. Salam, Phys. Rev. D10 (1974) 275;R.N. Mohapatra and J.C. Pati, Phys. Rev. D11 (1975) 566.
[89] G. Altarelli et al., Z. Phys. C45 (1989) 109;erratum Z. Phys. C47 (1990) 676.
[90] DELPHI Collaboration, P. Abreu et al., Zeit. Phys. C65 (1995) 603.
[91] E. Eichten, K. Lane, and M. Peskin, Phys. Rev. Lett. 50 (1983) 811.
[92] H. Kroha, Phys. Rev. D46 (1992) 58.
[93] The LEP WW Working Group, LEPEWWG/XSEC/2001-03, note prepared for the summer2001 conferences, http://lepewwg.web.cern.ch/LEPEWWG/lepww/4f/Summer01.
[94] The LEP WW Working Group, LEPEWWG/XSEC/2000-01, note prepared for the summer2000 conferences, http://lepewwg.web.cern.ch/LEPEWWG/lepww/4f/Summer00.
[95] The LEP WW Working Group, LEPEWWG/XSEC/2001-01, note prepared for the winter 2001conferences, http://lepewwg.web.cern.ch/LEPEWWG/lepww/4f/Winter01.
[96] M.W. Grunewald, G. Passarino et al., “Four fermion production in electron positron colli-sions”, Four fermion working group report of the LEP2 Monte Carlo Workshop 1999/2000,in “Reports of the working groups on precision calculations for LEP2 Physics” CERN 2000–009,http://arXiv.org/abs/hep-ph/0005309.
[97] ALEPH Collaboration, R. Barate et al., Phys. Lett. B401 (1997) 347.DELPHI Collaboration, P. Abreu et al., Phys. Lett. B397 (1997) 158.L3 Collaboration, M. Acciarri et al., Phys. Lett. B398 (1997) 223.OPAL Collaboration, K. Ackerstaff et al., Phys. Lett. B389 (1996) 416.
143

[98] ALEPH Collaboration, R. Barate et al., Phys. Lett. B415 (1997) 435.
[99] DELPHI Collaboration, P. Abreu et al., Eur. Phys. J. C2 (1998) 581.
[100] L3 Collaboration, M. Acciarri et al., Phys. Lett. B407 (1997) 419.
[101] OPAL Collaboration, K. Ackerstaff et al., Eur. Phys. J. C1 (1998) 395.
[102] ALEPH Collaboration, R. Barate et al., Phys. Lett. B453 (1999) 107.
[103] DELPHI Collaboration, P. Abreu et al., Phys. Lett. B456 (1999) 310.
[104] L3 Collaboration, M. Acciarri et al., Phys. Lett. B436 (1998) 437.
[105] OPAL Collaboration, G. Abbiendi et al., Eur. Phys. Jour. C8 (1999) 191.
[106] ALEPH Collaboration, R. Barate et al., Phys. Lett. B484 (2000) 205.
[107] DELPHI Collaboration, P. Abreu et al., Phys. Lett. B479 (2000) 89.
[108] L3 Collaboration, M. Acciarri et al., Phys. Lett. B496 (2000) 19.
[109] OPAL Collaboration, G. Abbiendi et al., Phys. Lett. B493 (2000) 249.
[110] ALEPH Collaboration, ALEPH 2000–005 CONF 2000–002, ICHEP 2000 abstract 288.
[111] DELPHI Collaboration, DELPHI 2000–140 CONF 439, ICHEP 2000 abstract 458.
[112] OPAL Collaboration, OPAL Physics Note PN420, ICHEP 2000 abstract 184. The W-pair pro-duction cross sections at
√s = 200–202 GeV results have been updated in [113].
[113] OPAL Collaboration, OPAL Physics Note PN437, ICHEP 2000 abstract 168.
[114] L3 Collaboration, L3 Note 2514, ICHEP 2000 abstract 512.
[115] ALEPH Collaboration, ALEPH 2001–013 CONF 2001–010, submitted to the Winter 2001 Con-ferences.
[116] DELPHI Collaboration, DELPHI 2001–024 CONF 465, submitted to the Winter 2001 Confer-ences.
[117] L3 Collaboration, L3 Note 2638, submitted to the Winter 2001 Conferences.
[118] OPAL Collaboration, OPAL Physics Note PN469, submitted to the Winter 2001 Conferences.
[119] The LEP WW Working Group, LEPEWWG/XSEC/2001-02, note prepared for the 2001 updateof the PDG Review, http://lepewwg.web.cern.ch/LEPEWWG/lepww/4f/PDG01.
[120] The LEP Collaborations ALEPH, DELPHI, L3, OPAL, the LEP Electroweak Working Groupand the SLD Heavy Flavour Working Group, “A Combination of Preliminary Electroweak Mea-surements and Constraints on the Standard Model”, CERN–PPE/97–154.
[121] The LEP Collaborations ALEPH, DELPHI, L3, OPAL, the LEP Electroweak Working Groupand the SLD Heavy Flavour Working Group, “A Combination of Preliminary Electroweak Mea-surements and Constraints on the Standard Model”, CERN–EP/99–15.
144

[122] S. Jadach, W. P laczek, M. Skrzypek, B.F.L. Ward, Phys. Rev. D54 (1996) 5434.S. Jadach, W. P laczek, M. Skrzypek, B.F.L. Ward, Z. Was, Phys. Lett. B417 (1998) 326.S. Jadach, W. P laczek, M. Skrzypek, B.F.L. Ward, Z. Was, Phys. Rev. D61 (2000) 113010;preprint CERN-TH-99-222, hep-ph/9907346.S. Jadach, W. P laczek, M. Skrzypek, B.F.L. Ward, Z. Was, preprint CERN-TH/2000-337, hep-ph/0007012; submitted to Phys. Lett. B.S. Jadach, W. P laczek, M. Skrzypek, B.F.L. Ward, Z. Was, The Monte Carlo Event GeneratorYFSWW3 version 1.16 for W-Pair Production and Decay at LEP2/LC Energies, preprint CERN-TH/2001-017, UTHEP-01-0101, hep-ph/0103163, accepted for publication by Comput. Phys.Commun.The YFSWW cross-sections at 155–215 GeV have been kindly provided by the authors.
[123] A. Denner, S. Dittmaier, M. Roth and D. Wackeroth, Nucl. Phys. B560 (1999) 33.A. Denner, S. Dittmaier, M. Roth and D. Wackeroth, Nucl. Phys. B587 (2000) 67.A. Denner, S. Dittmaier, M. Roth and D. Wackeroth, Phys. Lett. B475 (2000) 127.A. Denner, S. Dittmaier, M. Roth and D. Wackeroth, hep-ph/0101257.The RACOONWW cross-sections at 155–215 GeV have been kindly provided by the authors.
[124] See [96] and references therein for a discussion of complete O(α) radiative corrections to W-pairproduction in the LPA/DPA approximations.
[125] The theoretical uncertainty ∆σ/σ on the W-pair production cross section calculated in theLPA/DPA above 170 GeV can be parametrised as ∆σ/σ = 0.4 ⊕ 0.072 · t1 · t2, where t1 =(200 − 2 ·mW)/(
√s− 2 ·mW) and t2 = (1 − (2·MW
200 )2)/(1 − (2·MW√s
)2). In the threshold region, a
2% uncertainty is assigned. Private communication from the authors of [122,123], March 2001.
[126] D. Bardin, J. Biebel, D. Lehner, A. Leike, A. Olchevski and T. Riemann, Comp. Phys. Comm.104 (1997) 161. See also [96].The GENTLE cross-sections at 155–215 GeV have been kindly provided by E. Lancon andA. Ealet.
[127] M. Skrzypek, S. Jadach, M. Martinez, W. P laczek, Z. Was, Phys. Lett. B372 (1996) 289.S. Jadach, W. P laczek, M. Skrzypek, Z. Was, Comput. Phys. Commun. 94 (1996) 216.S. Jadach, W. P laczek, M. Skrzypek, B.F.L. Ward, Z. Was, Comput. Phys. Commun. 119 (1999)272.S. Jadach, W. P laczek, M. Skrzypek, B.F.L. Ward, Z. Was, preprint hep-ph/0104049, submittedto Comput. Phys. Commun.The “KORALW” cross-sections at 155–215 GeV have been kindly provided by the authors. Theyhave actually been computed using YFSWW [122], switching off non-leading O(α) radiativecorrections and the screening of the Coulomb correction, to reproduce the calculation fromKORALW.
[128] A. P. Chapovsky and V. A. Khoze, Eur. Phys. J. C9 (1999) 449.
[129] K. Melnikov and O. Yakovlev, Phys. Lett. B324 (1994) 217;V. S. Fadin, V. A. Khoze and A. D. Martin, Phys. Rev. D49 (1994) 2247.
[130] W. Beenakker et al., “WW Cross-Sections and Distributions”, in “Physics at LEP2”,eds. G. Altarelli et al., CERN 96-01.
[131] Particle Data Group, D.E. Groom et al., E. Phys. J. 1520001.
[132] ALEPH Collaboration, R. Barate et al., Phys. Lett. B469 (1999) 287.
[133] DELPHI Collaboration, P. Abreu et al., Phys. Lett. B497 (2001) 199.
145

[134] L3 Collaboration, M. Acciarri et al., Phys. Lett. B450 (1999) 281. The Z-pair cross-sectionat 183 GeV therein follows the L3 definition: the corresponding NC02 cross-section is givenin [135].
[135] L3 Collaboration, L3 Note 2366, submitted to the Winter 1999 Conferences.
[136] L3 Collaboration, M. Acciarri et al., Phys. Lett. B465 (1999) 363.
[137] OPAL Collaboration, G. Abbiendi et al., Phys. Lett. B476 (2000) 256.
[138] L3 Collaboration, M. Acciarri et al., Phys. Lett. B497 (2001) 23.
[139] OPAL Collaboration, OPAL Physics Note PN482, submitted to the Summer 2001 Conferences.
[140] OPAL Collaboration, OPAL Physics Note PN423, ICHEP 2000 abstract 154.
[141] ALEPH Collaboration, ALEPH 2000–004 CONF 2000–001, ICHEP 2000 abstract 287. System-atic errors on the measurement were not quoted in this note and have only been made availablein [142].
[142] ALEPH Collaboration, ALEPH 2001–006 CONF 2001–003, submitted to the Winter 2001 Con-ferences.
[143] DELPHI Collaboration, DELPHI 2000–145 CONF 444, ICHEP 2000 abstract 659. Systematicerrors on the ZZ measurement at 192–202 GeV, not quoted in this note, are scaled linearly [144]from those estimated at 189 GeV.
[144] DELPHI Collaboration, private communication by P. Bambade, March 2001.
[145] DELPHI Collaboration, DELPHI 2001-015 CONF 456, submitted to the Winter 2001 Confer-ences.
[146] L3 Collaboration, L3 Note 2696, submitted to the Summer 2001 Conferences.
[147] S. Jadach, W. P laczek, B.F.L. Ward, Phys. Rev. D56 (1997) 6939.
[148] G. Passarino, in [96].
[149] ALEPH Collaboration, ALEPH 2001–017 CONF 2001–014, submitted to the Winter 2001 Con-ferences.
[150] DELPHI Collaboration, DELPHI 2001–099 CONF 527, submitted to the Summer 2001 Confer-ences.
[151] L3 Collaboration, M. Acciarri et al., Phys. Lett. B487 (2000) 229. See also [153].
[152] ALEPH Collaboration, R. Barate et al., Phys. Lett. B462 (1999) 389. The single W cross sectionat 183 GeV therein follows the ALEPH definition: the corresponding value using the commonLEP definition is given in [155].
[153] L3 Collaboration, private communication by S. Schmidt-Kaerst, March 2001. The single Wcross-sections at 183, 189 and 192–202 GeV in [151, 154, 158] all follow the L3 definition. Thecorresponding values using the common LEP definition, computed by applying a conversionfactor determined for each result with grc4f [164], have all been provided in private communi-cations.
[154] L3 Collaboration, M. Acciarri et al., Phys. Lett. B436 (1998) 417. See also [153].
146

[155] ALEPH Collaboration, ALEPH 2000–022 CONF 2000–019, submitted to the Winter 2000 Con-ferences.
[156] DELPHI Collaboration, DELPHI 2000-047 CONF 362, submitted to the Winter 2000 Confer-ences. The decays of the W boson to taus are not included in the total single W cross sectionat 189–202 GeV. A new definition has been adopted in [157].
[157] DELPHI Collaboration, DELPHI 2000-143 CONF 442/2, contributed paper for ICHEP 2000.The decays of the W boson to taus are here included in the total single W cross section at189–202 GeV. A different definition was used in [156].
[158] L3 Collaboration, L3 Note 2518, submitted to the Winter 2000 Conferences. See also [153].
[159] OPAL Collaboration, OPAL Physics Note PN427, March 2000.
[160] The LEP WW Working Group, LEPEWWG/WW/00–02, LEP Single W Cross Section forWinter 2000 Conferences,http://lepewwg.web.cern.ch/LEPEWWG/lepww/4f/Winter00/ww-0002.ps.
[161] L3 Collaboration, M. Acciarri et al., Phys. Lett. B403 (1997) 168. This measurement of thesingle W cross-section at 161–172 GeV is superseded by that published for 130–183 GeV [154].
[162] G. Passarino, Nucl. Phys. B578 (2000) 3.G. Passarino, Nucl. Phys. B574 (2000) 451.The WTO cross-sections at 160–210 GeV have been kindly provided by the author.
[163] E. Accomando and A. Ballestrero, Comp. Phys. Comm. 99 (1999) 270.The WPHACT cross-sections at 160–210 GeV have been kindly provided by A. Ballestrero.
[164] J. Fujimoto et al., Comp. Phys. Comm. 100 (1997) 74.Y. Kurihara et al., Prog. Theor. Phys. 103 (2000) 1199.The grc4f cross-sections at 160–210 GeV have been kindly computed by R. Tanaka.
[165] G. Montagna et al., “Higher–order QED corrections to single W production in electron–positroncollisions”, FNT/T–2000/08, http://arXiv.org/abs/hep-ph/0006307.
[166] G. Gounaris et al., in Physics at LEP 2, Report CERN 96-01 (1996), eds G. Altarelli, T.Sjostrand, F. Zwirner, Vol. 1, p. 525.
[167] ALEPH Collaboration, Measurement of Triple Gauge-Boson Couplings in e+e− collisions up to208GeV, ALEPH 2001-027 CONF 2001-021.
[168] G. Montagna, M. Moretti, O. Nicrosini, M. Osmo, and F. Piccinini, Phys. Lett. B515 (2001)197–205.
[169] K. Hagiwara, R. D. Peccei, D. Zeppenfeld, and K. Hikasa, Nucl. Phys. B282 (1987) 253.
[170] G. J. Gounaris, J. Layssac, and F. M. Renard, Phys. Rev. D62 (2000) 073013.
[171] G. Belanger and F. Boudjema, Phys. Lett. B288 (1992) 210–220.
[172] W. J. Stirling and A. Werthenbach, Eur. Phys. J. C14 (2000) 103–110.
[173] W. J. Stirling and A. Werthenbach, Phys. Lett. B466 (1999) 369.
[174] G. Belanger, F. Boudjema, Y. Kurihara, D. Perret-Gallix, and A. Semenov, Eur. Phys. J. C13
(2000) 283–293.
147

[175] ALEPH Collaboration, Limits on anomalous neutral gauge couplings using data from ZZ andZγ production between 183-208 GeV, ALEPH 2001-061 (July 2001) CONF 2001-041.
[176] DELPHI Collaboration, Study of Trilinear Gauge Boson Couplings ZZZ, ZZγ and Zγγ, DEL-PHI 2001-097 (July 2001) CONF 525.
[177] L3 Collaboration, M. Acciari et al., Phys. Lett. B 436 (1999) 187;L3 Collaboration, M. Acciari et al., Phys. Lett. B 489 (2000) 55.L3 Collaboration, Search for anomalous ZZg and Zgg couplings in the process ee→Zg at LEP,L3 Note 2672 (July 2001).
[178] OPAL Collaboration, G. Abbiendi et al., Eur. Phys. J. C 17 (2000) 13.
[179] See references [134,136,146].
[180] See references [137,139].
[181] ALEPH Collaboration, Constraints on Anomalous Quartic Gauge Boson Couplings, ALEPH2001-069 CONF 2001-049.
[182] Collaboration, M.Acciarri et al., Phys. Lett. B 490 (2000) 187;L3 Collaboration, Measurement of the W+W−g Cross Section and Direct Limits on AnomalousQuartic Gauge Boson Couplings at LEP, L3 Note 2675 (June 2001).
[183] OPAL Collaboration, G. Abbiendi et al., Phys. Lett. B 471 (1999) 293.
[184] The LEP-TGC combination group, LEPEWWG/TGC/2001-01, March 2001.
[185] ALEPH Collaboration, R. Barate et al., Phys. Lett. B453 (1999) 121–137.
[186] ALEPH Collaboration, R. Barate et al., Eur. Phys. J. C17 (2000) 241–261.
[187] ALEPH Collaboration, Measurement of the W Mass and Width in e+e− Collisions at√s ∼
192 − 208 GeV, ALEPH note 2001-020 CONF 2001-017.
[188] DELPHI Collaboration, P. Abreu et al., Phys. Lett. B462 (1999) 410–424.
[189] DELPHI Collaboration, P. Abreu et al., Phys. Lett. B511 (2001) 159–177.
[190] DELPHI Collaboration, Measurement of the mass and width of the W Boson in e+e− collisionsat
√s = 192 − 209 GeV, DELPHI 2001-103 CONF 531.
[191] L3 Collaboration, M. Acciarri et al., Phys. Lett. B454 (1999) 386–398.
[192] L3 Collaboration, Preliminary Results on the Measurement of Mass and Width of the W Bosonat LEP, L3 Note 2377, March 1999.
[193] L3 Collaboration, Preliminary Results on the Measurement of Mass and Width of the W Bosonat LEP, L3 Note 2575, July 2000.
[194] L3 Collaboration, Preliminary Results on the Measurement of Mass and Width of the W Bosonat LEP, L3 Note 2637, February 2001.
[195] OPAL Collaboration, G. Abbiendi et al., Phys. Lett. B453 (1999) 138–152.
[196] OPAL Collaboration, G. Abbiendi et al., Phys. Lett. B507 (2001) 29.
[197] OPAL Collaboration, Measurement of the Mass of the W Boson in e+e− annihilations at 192-202GeV, OPAL Physics Note PN422 (updated July 2000).
148

[198] OPAL Collaboration, Determination of the W mass in the fully leptonic channel using an un-binned maximum likelihood fit, OPAL Physics Note PN480, July 2001.
[199] LEP Energy Working Group, LEPEWG 01/01, March 2001.
[200] Torbjorn Sjostrand and Valery A. Khoze, Z. Phys. C62 (1994) 281–310.
[201] CHARM II Collaboration, P. Vilain et al., Phys. Lett. B335 (1994) 246.
[202] UA2 Collaboration, J. Alitti et al., Phys. Lett. B276 (1992) 354.
[203] CDF Collaboration, F. Abe et al., Phys. Rev. Lett. 65 (1990) 2243;CDF Collaboration, F. Abe et al., Phys. Rev. D43 (1991) 2070.
[204] CDF Collaboration, F. Abe et al., Phys. Rev. Lett. 75 (1995) 11;CDF Collaboration, F. Abe et al., Phys. Rev. D52 (1995) 4784.A. Gordon, talk presented at XXXIInd Rencontres de Moriond, Les Arcs, 16-22 March 1997, toappear in the proceedings.
[205] DØ Collaboration, S. Abachi et al., Phys. Rev. Lett. 842000222.
[206] http://www-cdf.fnal.gov/physics/ewk/wmass new.htm.
[207] CDF Collaboration, W. Yao, t Mass at CDF, talk presented at ICHEP 98, Vancouver, B.C.,Canada, 23-29 July, 1998.
[208] DØ Collaboration, B. Abbott et al., Phys. Rev. Lett. 842000222.
[209] The Top Averaging Group, L. Demortier et al., for the CDF and DØ Collaborations,FERMILAB-TM-2084 (1999).
[210] CCFR/NuTeV Collaboration, K. McFarland et al., Eur. Phys. Jour. C1 (1998) 509.
[211] NuTeV Collaboration, K. McFarland, talk presented at the XXXIIIth Rencontres de Moriond,Les Arcs, France, 15-21 March, 1998, hep-ex/9806013. The preliminary result quoted is a com-bination of the NuTeV and CCFR results.
[212] C. S. Wood et al., Science 275 (1997) 1759.
[213] S. C. Bennett and C. E. Wieman, Phys. Rev. Lett. 82 (1999) 2484–2487.
[214] A. Derevianko, Phys. Rev. Lett. 85 (2000) 1618.
[215] S. G. Porsev M. G. Kozlov and I. I. Tupitsyn, Phys. Rev. Lett. 86 (2001) 3260.
[216] NuTeV Collaboration, G.P. Zeller et al., A Precise Determination of Electroweak Parameters inNeutrino-Nucleon Scattering, preprint hep-ex/0110059.
[217] T. van Ritbergen and R.G. Stuart, Phys. Rev. Lett. 82 (1999) 488.
[218] H. Burkhardt and B. Pietrzyk, Phys. Lett. B513 (2001) 46.
[219] SLD Collaboration, J. Brau, Electroweak Precision Measurements with Leptons, talk presentedat EPS-HEP-99, Tampere, Finland, 15-21 July 1999.
[220] Reports of the working group on precision calculations for the Z resonance, eds. D. Bardin,W. Hollik and G. Passarino, CERN Yellow Report 95-03, Geneva, 31 March 1995.
149

[221] G. Degrassi, S. Fanchiotti and A. Sirlin, Nucl. Phys. B351 (1991) 49;G. Degrassi and A. Sirlin, Nucl. Phys. B352 (1991) 342;G. Degrassi, P. Gambino and A. Vicini, Phys. Lett. B383 (1996) 219;G. Degrassi, P. Gambino and A. Sirlin, Phys. Lett. B394 (1997) 188;G. Degrassi and P. Gambino, Nucl. Phys. B567 (2000) 3.
[222] A. Czarnecki and J. Kuhn, Phys. Rev. Lett. 77 (1996) 3955;R. Harlander, T. Seidensticker and M. Steinhauser, Phys. Lett. B426 (1998) 125.
[223] Electroweak libraries:ZFITTER: see Reference 37;BHM (G. Burgers, W. Hollik and M. Martinez): W. Hollik, Fortschr. Phys. 38 (1990) 3, 165;M. Consoli, W. Hollik and F. Jegerlehner: Proceedings of the Workshop on Z physics at LEP I,CERN Report 89-08 Vol.I,7 and G. Burgers, F. Jegerlehner, B. Kniehl and J. Kuhn: the sameproceedings, CERN Report 89-08 Vol.I, 55;TOPAZ0 Version 4.0i: G. Montagna, O. Nicrosini, G. Passarino, F. Piccinni and R. Pittau,Nucl. Phys. B401 (1993) 3; Comp. Phys. Comm. 76 (1993) 328.These computer codes have upgraded by including the results of [220] and references therein.ZFITTER and TOPAZ0 have been further updated using the results of references 221 and 222.See, D. Bardin and G. Passarino, Upgrading of Precision Calculations for Electroweak Observ-ables, CERN-TH/98-92, hep-ph/9803425.
[224] A. Freitas, W. Hollik, W. Walter and G. Weiglein, Phys. Lett. B495 (2000) 338.
[225] D. Bardin, P. Gambino, G. Passarino, G. Weiglein, private communication, spring 2001.
[226] T. Hebbeker, M. Martinez, G. Passarino and G. Quast, Phys. Lett. B331 (1994) 165;P.A. Raczka and A. Szymacha, Phys. Rev. D54 (1996) 3073;D.E. Soper and L.R. Surguladze, Phys. Rev. D54 (1996) 4566.
[227] M. Steinhauser, Phys. Lett. B429 (1998) 158.
[228] S. Eidelmann and F. Jegerlehner, Z. Phys. C67 (1995) 585.
[229] The BES Collaboration, J.Z.Bai et al., Measurements of the Cross Section for e+e− → hadronsat Center-of-Mass Energies from 2 to 5 GeV, hep-ex/0102003.
[230] M. L. Swartz, Phys. Rev. D53 (1996) 5268.
[231] A.D. Martin and D. Zeppenfeld, Phys. Lett. B345 (1994) 558.
[232] R. Alemany, et al., Eur. Phys. J. C2 (1998) 123.
[233] M. Davier and A. Hocker, Phys. Lett. B419 (1998) 419.
[234] J.H. Kuhn and M. Steinhauser, Phys. Lett. B437 (1998) 425.
[235] J. Erler, Phys. Rev. D59, (1999) 054008.
[236] A. D. Martin, J. Outhwaite and M. G. Ryskin, Phys. Lett. B492 (2000) 69.
[237] F. Jegerlehner, Hadronic Effects in (g-2) and αQED(MZ) : Status and Perspectives, Proc. ofInt. Symp. on Radiative Corrections, Barcelona, Sept. 1998, page 75.
[238] S. Bethke, hep-ex/0004021, J. Phys. G26 (2000) R27.
[239] F. James and M. Roos, Comput. Phys. Commun. 10 (1975) 343.
150

[240] G. Montagna et al., Comput. Phys. Commun. 117 (1999) 278;http://www.to.infn.it/∼giampier/topaz0.html .
[241] K.Hoffman, Year 2000 update for OPAL and LEP HIGGSWG results”, talk presented atICHEP2000, Osaka, July 27 - August 2,2000, to appear in the proceedings.
[242] N. De Groot Electroweak results from SLD, talk presented at XXXVIth Rencontres de Moriond,Electroweak Interactions and Unified Theories, Les Arcs, March 2001, hep-ex/0105058;Serbo V. Presented at Int. Europhys. Conf. High Energy Phys., July 2001, Budapest, Hungary.
Links to LEP results on the World Wide Web
The physics notes describing the preliminary results of the four LEP experiments submitted to thesummer 2001 conferences, as well as additional documentation from the LEP electroweak workinggroup are available on the World Wide Web at:
ALEPH: http://alephwww.cern.ch/ALPUB/oldconf/summer01/summer.html
DELPHI: http://delphiwww.cern.ch/~pubxx/www/delsec/conferences/summer01/
L3: http://l3www.cern.ch/conferences/Budapest2001/
OPAL: http://opal.web.cern.ch/Opal/physnote.html
LEP-EWWG: http://lepewwg.web.cern.ch/LEPEWWG/
151