a commercial loan risk classification system - ideals - university of
TRANSCRIPT


UNIVERSITY OFILLINOIS LIBRARY
AT URBANA-CHAMPAIGNBOOKSTACKS

/—
' ^- I
Digitized by the Internet Archive
in 2011 with funding from
University of Illinois Urbana-Champaign
http://www.archive.org/details/commercialloanri1586gent


ST> BEBRFACULTY WORKINGPAPER NO. 89-1586
A Commercial Loan Risk
Classification System
James A. Gentry
Michael J. ShawDavid T. Whitford
College of Commerce and Business Administration
Bureau of Economic and Business ResearchUniversity of Illinois Urbana-Champaign


FACULTY WORKING PAPER NO. 89-1586
College of Commerce and Business Administration
University of Illinois at Urbana- Champaign
August 1989
A Commercial Loan Risk Classification System
James A. Gentry, ProfessorDepartment of Finance
Michael J. Shaw, Associate ProfessorDepartment of Business Administration
and
David T. Whitford, Associate ProfessorDepartment of Finance


ABSTRACT
Cash flow components are used in a statistical model to predict
loan risk ratings. The risk ratings were assigned by a large regional
bank staff. In general, the statistical model tended to underestimate
the risk ratings of the low risk loans and to overstate the ratings of
the higher risk loans. The predictive accuracy of the statistical
model was tested using a holdout sample. Using cash flow components
and qualitative information, the model was 64 percent accurate in pre-
dicting the loan ratings assigned by the bank. Additionally, 98 per-
cent of the predicted ratings were either correct or within one rating
class of the actual rating when the second highest probability was the
correct rating.


A COMMERCIAL LOAN RISK CLASSIFICATION SYSTEM 1
The purpose of this study is to provide a research based educa-
tional reference to aid lending officers, credit analysts and loan
review committee members to understand and evaluate expert systems
that are designed to classify loan applicants. The study is sub-
divided into two phases. Phase I uses cash flow components in a
polytomous probit model to develop a loan risk classification system.
Phase II uses information learned in Phase I to create an educational
version of an expert system that evaluates the risk characteristics
of commercial loan applicants. This paper is designed to provide an
overview of the progress that has been accomplished in Phase I.
One objective of the paper is to review the loan risk classifica-
tion literature which serves as a basis for the findings presented in
this paper. A second objective is to present a cash flow model that
provides the inputs used in a statistical classification system. The
third objective is to present and interpret the results of an empiri-
cal study that classifies and predicts the risk ratings of industrial
commercial loans.
LITERATURE
Orgler [1970] developed a multiple regression model for classify-
ing loan risk. The objective of the model was to use one financial
ratio, net working capital/total current assets, and five dummy vari-
ables to predict if bank examiner ratings of a loan are good, bad or
marginal. The dummy variables related to each loan were: (1) un-
secured or secured, (2) past due or current in payment, (3) clean

-2-
audit opinion or not, (4) net loss or net profit and (5) criticized or
not criticized by the examiner in the last period. The model quite
accurately predicted the ratings of 56 of the 59 good loans correctly;
was reasonably accurate in predicting marginal loans, 123/135, and not
too accurate for bad loans, 60/106. Haslera and Longbrake [1972] were
critical of Orgler using outside examiner ratings rather than using
the rating of an insider, such as the lending officer. Also Haslera
and Longbrake objected to the use of past information to explain a
current rating. However, they did not offer an alternative.
The two recent loan risk classification studies are by Dietrich
and Kaplan (DK) [1979] and Marais, Patell and Wolf son (MPW) [1984].
An objective of these studies is to develop statistical models for
classifying loan risk that are based on accounting information. Both
studies developed polytomous probit models which generated conditional
probabilities for determining the risk rating of each loan.
The DK analysis was based on 140 companies whose financial data
were on Compustat. Of the 140 companies used in determining the
parameters, approximately 78 percent (109/140) were classified by the
bank as being current, Category I, which means normal acceptable bank-
ing risk as defined by the Office of the Comptroller of the Currency
(OCC). They found three variables—debt/equity, fixed charge coverage
and number of consecutive years of sales decline—classified 85 per-
cent of all loans correctly. However, they found the loans not rated
current by the bank were correctly classified less than 60 percent of
the time, while the classification accuracy of the Category 1 loans
was 93 percent. A validation test provided similar test results.

-3-
The study by MPW was based on financial data from 205 public com-
panies and 716 private companies. They started with 20 financial vari-
ables and six nonfinancial variables for the public firms. Although
approximately 93 percent of all loans were classified correctly, 90
percent of the total sample were initially rated as Category I loans
by the bank staff. The results showed the raisclassif ications as being
relatively high for loans rated other than Category I.
An empirical research project by von Stein and Ziegler [1984]
focused on the prognosis and surveillance of corporate credit risks.
The authors used both quantitative and qualitative measures. They
presented a three part approach that incorporated an early warning
system, an evaluation of a bank-accounts information system and a
system to assess the management.
Other authors have made contributions that were tangential to the
loan risk prediction models. Altraan [1980, 1985] has written exten-
sively in relation to the commercial lending process, credit scoring
and the costs of errors in lending. Dickerson [1987] and Kehlbeck
[1980] made substantive contributions to the loan review process and
the grading of commercial loans. Recently Udell [1989] focused on the
use of the loan review process as an agency cost issue. He contrasted
the loan review process as being an early warning system vis-a-vis
acting as a system to monitor loan officers performance. Lev [1989]
has synthesized the research related to the usefulness of earnings
that has direct implications to financial statement analysis. Foster
[1986] has a chapter devoted to loan risk classification where he
evaluated the research related to the topic.

-4-
The lessons from the literature on loan risk, classification high-
light a few dimensions. First, because public data sources are readily
available, there are a large number of studies that predict bankruptcy
and bond ratings. However, there are only a few loan risk classifica-
tion studies because loan information and data are private. Second,
the accuracy in predicting the rating of low risk, Category I, type
loans is quite high, but the models are only modestly successful in
predicting the ratings of higher risk loans. Third, the studies all
commented on the need to use both quantitative and qualitative infor-
mation in the prediction process. Finally, the financial information
used was primarily balance sheet and income statement based ratios and
only a few funds flow measures were included.
A REVISED CASH FLOW MODEL
One of the most useful financial tools for analyzing the per-
formance of management is the statement of cash flows. The cash flow
model integrates accounting information from the balance sheet and the
income statement, and it provides a unique interpretation of the allo-
cation of a firm's resources. The cash flow statement is a basic
financial analysis tool for evaluating the performance of management
related to the strategic use of corporate resources. The cash flow
analysis reflects the subtleties and nuances of management trade-offs,
and it provides chronological benchmarks for measuring and judging
management effectiveness.
In 1972 Erich Helfert developed a unique format for presenting a
funds flow statement. The Helfert technique integrates balance sheet

-5-
and income statement variables and subdivides the funds flow into
three natural decision areas of management. These three resource
decisions are investment, operations, and financing . The Helfert
technique closely resembles the FASB 95 Statement of Cash Flows which
utilizes the direct method for reporting operating cash receipts and
disbursements.
The statement of cash flows presents a summary of changes in the
financial position of the firm between two time periods. It is widely
used by corporate executives, credit analysts, investors, and other
outside parties to evaluate the financial changes occurring in a firm
and to identify the trend of major cash receipts and payments. It is
computed by measuring changes in each of the balance sheet items be-
tween two periods and using the income statement items for the period
under study.
After extensive use of the Helfert funds flow analysis statement,
we restructured it to have 12 major components. These 12 cash flow
components are operating, receivables, inventories, other current
assets, payables, other current liabilities, financial, fixed coverage
expenditures, investment, dividends, other asset and liability flows,
and change in cash and marketable securities. A net flow is deter-
mined for four of the components, namely operating, other assets and
liabilities, financing, and investment. \ cash inflow has a positive
sign and a payment has a negative sign. The algebraic sum of the com-
ponents are equal to the change in cash and marketable securities.
The revised format for the cash flow analysis and the acronyms for
each variable are presented below.

-6-
OperaLing Flows
Inflows (01)
minus: Outflows (00)
equals: Net Operating Flow (NOF)
Working Capital Components (WC C
)
Determine if each WCC is either an inflow or outflow:
Inflow (I) Outflow (0)
ARF ARFI ARFOINVF INVFI INVFOOCAF OCAFI OCAFO
APF APFI APFOOCLF OCLFI OCLFO
Other A&L Flows
Inf lows (OA&LI)
minus: Outflows (OA&LO)equals: Net Other A&L Funds
•
Flow (1
Financial Flows
Inflows (FI)
minus: Outflows (FO)
equals: Net Financial Flow (NFF)
Investment Flows
(II)
(10)equals: Net Investment Flow (NIF)
Inf lows
minus: Outflows
Dividend Outflows (DIV)
(FCE)Fixed Coverage Expenditure Outflows
Net Inflow (-) or Net Outflow (+)
Sum of the above cash flow components
minus: Change in Cash (CC)(Ending Cash-Beginning Cash,
where a - = Outflow and a + = Inflow)
equals : zero

•7-
The interrelationship among the components is complex, therefore,
equation (1) is presented in a sources and uses format of a most
likely case. Excepting changes in cash and marketable securities, a
source (S) would be a positive number and a use (U) would be negative,
NOF + ARF + 1NVF + OCAF + APF + OCLF + NFF + FCEt t t
+ ---+++-(S) (U) (U) (U) (S) (S) (S) (U)
+ NIF + DIV + NOTHER - CC - (1)t t t t
- +
(a) (a) (a) (s)
Cash Flow Components
Exhibit 1 presents the percentage contribution each cash flow com-
ponent makes to the total cash flow. The percentage contribution of
each component is based on the concept that the sura of the inflows
equals the absolute value of the sura of the outflows. The revised
cash flow model is based on the overall accounting relationship that
results in the sura of flows being equal to zero as shown in equation
(1).
The percentage contribution is calculated by dividing each com-
ponent by the total cash flow (TCF), which is equal to either the
total inflow (Tl) or the absolute value of the total outflow (TO).
The total inflows of $90 million equals the absolute value of the
total outflows as shown in Exhibit 1. Each inflow and outflow com-
ponent is divided by $90 million. For example, the net operating cash
flow contributed 44.4 percent of the total inflows, while net invest-
ment cash flow composed 42.2 percent of the total outflows. Exhibit 1

presents the percentage contribution of each of the 12 components.
The contribution of each component takes on special interpretative
significance when a time series of each component is developed over
several periods. The stability and level of contribution reflects the
results of management decisions.
Summary of Key Relationships
In evaluating management performance with cash flow components, a
hierarchy of relationships emerge. First, a basic economic relation-
ship is the investment coverage ratio (ICR), which is the number of
times that net operating inflows cover capital investment outflows.
The higher the ICR the stronger the financial health of a company.
2In equation form *
NOF/TNFNIF/TNF
= ICR. (2)
The size of the cash outflow going to discretionary expenditures
is another fundamental economic relationship. The discretionary
coverage ratio (DCR) is
N0F/TNF= DCR. (3)
NIF DIV+
'TNF TNF 1
The higher the DCR the stronger the financial health of a company.
A third important relationship in measuring financial health with
cash flow components is the discretionary and fixed coverage expendi-
tures ratio (DFCER). The DFCER measures the number of times net
operating inflows cover the cash outflows to discretionary and fixed
coverage expenditures. That is,

NOF/TNF(NIF) ( DIV ) (FCE)
TNF TNF TNF
-9-
= DFCER. (4)
Free cash flow (FCF) is a concept widely used in financial valuation
models and it is closely related to the DFCER coverage ratio. By
definition FCF before net investment in working capital components is
net operating cash flow minus net capital investment, dividends and
fixed coverage expenditures, i.e., FCF = NOF - (NIF+DIV+FCE) . A FCF
coverage ratio is the equivalent of DFCER. That is
FCF/TNFNIF _ DIV_ FCE
TNF+
TNF+
TNF
+ 1 = FCF coverage before working capital = DFCER (5)
The FCF coverage ratio is shown as free cash flow (before working
capital) in Exhibit 2. Naturally, the larger the free cash flow
coverage ratio before working capital investment the lower the finan-
cial risk and vice versa.
The next level of coverage in the hierarchy is free cash flow
coverage after working capital. Experience shows that scwne working
capital components are users of cash while others are suppliers of
cash. The free cash flow coverage ratio after working capital incor-
porates the five working capital (WC ) components in the denominator.
The FCF coverage ratio after working capital is defined in 6.
FCF/TNF
.DTV
TNF TNF TNF+ E
WC OUTFLOWS „WC INFLOWS
+ 1 = FCF afterworking capital.
TNF- - EJ
TNF
(6)
-10-
The FCF coverage ratio is shown as free cash flow (after working
capital) in Exhibit 2. The larger the free cash flow coverage ratio
after taking the commitment to working capital into account the lower
the financial risk and vice versa.
Finally, the strongest financial health position occurs when the
total coverage ratio (TCR) equals 1. That happens when net operating
cash inflows cover the expenditures for the 11 remaining outflow com-
ponents. Specifically,
NOF/TNF „„„ ,_.- = TCR. (5)
(2!II) + (1LV) + (
FCEx+ + (
CC_xTNF TNF TNF TNF
Companies that experience large total coverage ratios are generally
recognized as being the leading competitor within their industry, e.g.,
IBM, R. R. Donnelley or Procter and Gamble. Conversely, companies
with a small TCR are generally in a financially weak position.
Exhibit 2 presents a brief example of the cash flow coverage
ratios for five different hypothetical companies. The example com-
panies are arranged according to financial risk, with Company A having
the lowest risk characteristics and Company E having the highest risk
characteristics. Company A is an example of a firm that is a recog-
nized industry leader and has a strategic competitive advantage over
its industry rivals. The net operating cash flows represent 100 per-
cent of all cash inflows. Company A's strong financial position shows
in all of its coverage ratios from investment to total coverage. In
contrast the cash flow measures and the coverage ratios in Exhibit 2
portray Company E as a firm that is in a weak position both com-
petitively and financially.

-11-
Analyzing the chronological trend of the cash flow components and
evaluating the hierarchy of their interrelationships provide financial
analysts a solid basis for interpreting the financial health of a
firm. In turn the flows reflect the success of management strategies
and policies during the period of analysis.
DATA ACQUISITION
The acquisition of the data started when a large regional bank
agreed to share balance sheet and income statement data for a large
sample of industrial companies with whom they had an ongoing lending
relationship. The bank provided complete annual data for 44 companies
for the period 1985-1986 and complete annual data for 103 companies in
1986-1987. In addition to the accounting information, the bank pro-
vided a loan risk ranking for each firm. These rankings fell into
one of five categories, with category one being the lowest risk level
and category five the highest risk. The data were provided on sheets
of paper, therefore, it was necessary to prepare a computerized file
for each company. In addition to the financial data, the bank
provided qualitative information that indicated if the loan was
secured or unsecured, guaranteed or not guaranteed, and the liquidity
status of the collateral.
STATISTICAL TESTS
The balance sheet and income statement Information for the 147
companies was used to determine the cash flow components for 44
companies in 1986 and 103 companies in 1987. The means and standard

-12-
deviations for each of the 12 cash flow components are presented in
Exhibit 3.
Previous loan risk classification studies by Dietrich and Kaplan
[1982] and Marais, Patell and Wolfson [1984], and bond rating classi-
fication studies by Kaplan and Urwitz [1979] and Gentry, Newbold and
Whitford [1988] have utilized a polytoraous probit technique to predict
loan and bond ratings. Because probit has broad acceptance as a pre-
dictive model when several ratings are being studied, it is used in
this study. Polytoraous probit provides an estimate of the conditional
probability that a firm is a member of each rating class. The condi-
tional probabilities are based on the cash flow components and addi-
tional qualitative information for 1986, 1987 and 1986-1987 combined.
The highest probability determines the predicted rating (PrPl) of the
loan. When PrPl is the same as the actual bank rating, the loan is
correctly classified by the model, (PrPl = PrA) . When the probability
of the predicted rating is greater than the probability of the actual
bank rating (PrPl > PrA), there is a misclassif ication of the rating.
Initially, only cash flow components were used in the probit model
to determine the ratings for each borrower. These ratings were com-
pared to the actual bank ratings of the borrower. The objective of
the test is to determine the accuracy of the cash flow components in
classifying the loan risk rating. That is, does the model generate
loan ratings that match the rating assigned by the bank staff? The
probit coefficients for the cash flow components are reported in
Exhibit 4 for 1986, 1987 and for 1986-1987 combined. The change in
cash component was omitted from the analysis to avoid statistical

-13-
overidentif ication. The tests used 11 cash flow components and a
scale measure, total cash flows/total assets (TCF/TA).
Several cash flow components were statistically significant in
classifying the loan's risk class. Net operating cash flow and divi-
dends were significant at either the .01 or .05 level of significance
for all three periods. The fixed coverage expenditures component was
significant at the .01 level for all three periods. The inventory
component was significant at the .05 level of significance for the
1987 data.
The classification accuracy is reported in Exhibit 5 for the 1986
loans and in Exhibit 6 for the 1987 loans. Exhibit 7 shows the
classification results when the 1986 and 1987 data are combined. The
classification accuracy results were 56.82% in 1986, 61.16% in 1987
and 56.46% when 1986 and 1987 data were combined.
Interpretation of Misclassif ication
There is a distinct pattern of misclassif ication evident in
Exhibits 5, 6 and 7. In 1986, for the lower risk loans, probit clas-
sified two of the three loans rated 1 by the bank staff as having a 2
rating and six of the 11 loans rated 2 by the bank were classified as
3s. In 1987 only one of the eight loans rated as 1 by the bank was
correctly classified and none of the 14 loans rated 2 were correctly
classified. In general the probit ratings of these loans were lower
than the bank ratings. That is, the cash flow components indicated
the financial based risks were greater than the risk class assigned by
the bank staff.
-14-
The raisclassif icat ion of the 3 rated loans is markedly smaller.
In 1986, 17 of the 23 loans were correctly classified, while in 1987,
56 of the 60 loans were correctly classified. The raisclassif ications
were about equally distributed on either side of the 3 rating. In
both years the loans rated 4 by the bank were found to have a 3 rating
by the probit model. In 1986 all five loans rated 4 by the bank were
classified as 3s by the model, and 13 of the 19 loans in 1987 rated a
4 by the bank were classified as 3s by probit. The 5 rated loans in
1986 were correctly classified by probit, but two loans rated 5 in
1987 were rated higher by probit.
In general, the pattern that emerges is that when using cash flow
components in a probit model, the actual ratings by the bank staff
appear to overstate the rating of the lower risk loans and understate
the rating of the higher risk loans. This type of raisclassif ication
was not observed in previous studies by DK or MPS because their
samples did not contain a large proportion of higher risk loans. In
an attempt to better explain the ratings, qualitative information on
each loan was introduced into the analysis.
As noted earlier three qualitative pieces of information were pro-
vided by the bank for each loan. Each loan was shown to be either
secured or unsecured, and either guaranteed or not guaranteed. Of the
147 loans, 44 were secured and the remainder unsecured. The liquidity
of the collateral for the secured loans was also rated. The distribu-
tions of the collateral ratings are presented in Exhibit 8.
The qualitative factors were added as dummy variables to the cash
flow components in order to determine if the classification accuracy

-15-
of a revised probit model would improve. These classification
accuracy results are shown at the bottom of Exhibits 5, 6 and 7.
There was a substantive increase in the classification accuracy for
the 1986 data, that is from 57 percent to 75 percent. The classifica-
tion accuracy increased modestly for the 1987 data and the combined
1986-1987 data.
The coefficients for these tests that included the qualitative
factors are shown in Exhibit 4. The results in Exhibit 4 show the
same cash flow variables were significant, and in 1986 the guarantee
dummy variable was significant. Exhibit 9 provides the distributions
of the guarantee/no guarantee variable by bank rating class. In 1986
Exhibit 9 shows the guaranteed loans are concentrated in the higher
risk 3, 4 and 5 ratings and the nonguaranteed loans are concentrated
in the lower risk 1, 2 and 3 rated loans. This distribution of the
guarantee and no guarantee information resulted in improving the
ability of the model to match the rating assigned by the bank staff.
The secured/unsecured dummy variable was significant in 1987 as
shown in Exhibit 4. In 1987 Exhibit 10 shows the secured loans were
concentrated in the 3, 4 and 5 ratings and the unsecured were concen-
trated in the 1, 2 and 3 ratings. This distribution of the secured
and unsecured loans improved the ability of the probit model to match
the ratings assigned by the bank staff from 61 percent to 63 percent,
as shown in Exhibit 6.
When the data for 1986 and 1987 were combined, both the guarantee
and the secured dummies were significant in classifying the loan risk
class. The lower portion of Exhibit 10 shows the loans that were both

-16-
secured and guaranteed were heavily concentrated in the 3, 4 and 5
risk classification. It is apparent that these dummy variables add
value to the understanding of the loan risk classification system.
The liquidity of the collateral did not contribute to the analysis
primarily because it was concentrated in the less liquid collateral
categories as shown in Exhibit 8. Exhibit 11 shows that the qualita-
tive information improved the accuracy of the ratings for 10 of the
1986-1987 loans. It also shows qualitative factors raisclassif ied six
loans and, the classification of six loans was improved, but not
enough to match the ratings assigned by the bank staff.
Further analysis shows that the probit raisclassif ication of the 1
and 2 rated loans was related to the dividend cash flow component.
Exhibit 12 shows that there was a substantive difference in the cash
outflow going to dividends for the 1 and 2 rated loans. In both
rating classes the companies selected by the probit model were distri-
buting a much higher percent of their total cash outflow to dividends
than the companies rated 1 and 2 by the bank staff. For the 4 rated
companies, Exhibit 12 shows a marked difference in the operating,
investment and fixed coverage components. Unfortunately there are
only four companies that probit determined as being rated a 4.
Therefore, it is not possible to make a generalized observation
concerning the differences between the 4 rated companies.
Pred iction Results
A holdout sample technique was used to test the predictive
accuracy of the probit model. The two samples of 147 companies were

-17-
combined and a random sample of 100 companies was selected. The cash
flow components and the qualitative measures for the 100 companies
were used to determine the probit model coefficients. These coeffi-
cients are used to predict the loan risk ratings of the 47 companies
in the holdout sample. The coefficients are reported in Exhibit 13.
The dividend component was significant at the .01 level in predicting
the loan risk ratings. The higher the dividend components the lower
the risk rating and vice versa. Likewise, the net operating flow
(NOF) , other current assets (OCA), and fixed coverage expenditures
(FCE) were significant at the .05 level. The higher the net operating
flow or the lower the fixed coverage expenditure the lower the loan
risk rating, or vice versa, as shown in Exhibit 13. Also other
current assets are positively related to loan risk, e.g., prepaid
expenses such as prepaid insurance, rent and operating-administrative
expenses. None of the qualitative variables were significant in the
prediction model.
The probit model correctly predicted approximately 64 percent of
the bank loan risk ratings for the holdout sample, as shown in Exhibit
14. The 64 percent success rate is at the top of the accuracy results
found in previous studies that predicted Moody's bond ratings for five
separate categories, Aa to B, Horrigan [1966], Pinches and Mingo [1973],
Belkaoui [1983], Gentry, Newbold and Whitford [1988]. As previously
indicated, Dietrich and Kaplan [1979] and Marais , Patell and Wolfson
[1984] had markedly higher accuracy in predicting loan risk ratings,
but their samples were heavily weighted with low risk loans, which is

-18-
unl ike the risk distribution of the sample companies included in this
study.
Exhibit 15 indicates that approximately 64 percent (30/47) of the
loan ratings in the holdout sample were accurately predicted and an
additional 34 percent (16/47) of the predicted ratings were in a cell
that was adjacent to the actual rating. Thus 98 percent (46/47) of
the predicted ratings are either correct or within one rating class of
the actual, where the model's second highest conditional probability
classification was the correct rating. To acquire additional insight
into the prediction quality Exhibit 14 shows that of the 47 loans in
the holdout sample, 39 had ratings that were either a 2 or a 3. Thus,
a naive predictor that classified all loans a 3 would be correct or
within one rating class of a 2 rating 39 times out of 47. The null
hypothesis that our predictor performs at this level can be tested
through a chi-square goodness of fit test. Since 46 of the 47 loans
were predicted correctly or within one class, the calculated test
statistic is (46-39) /39 + (l-7)2/7 = 6.40. Compared with tabulated
values of the chi-square distribution with one degree of freedom, the
null hypothesis that our predictor performs at the level of the naive
predictor can be rejected at the 5 percent significance level.
CONCLUSION
The accuracy of a probit model using cash flow components in
classifying loan risks ranged from 57 to 61 percent. The qualitative
information related to the loans modestly improved the accuracy of the
loan risk classification to be between 60 and 75 percent. The

-19-
significant cash flow components in the analysis were operating,
dividends and fixed coverage expenditures in all periods and inventory
in 1987.
The predictive accuracy of the model was tested using a holdout
sample. A probit model using cash flow components and qualitative
information was 64 percent accurate in predicting the loan ratings
assigned by the bank staff. Additionally, 98 percent of the predicted
ratings were either correct or within one rating class of the actual
rating where the second highest probability was the correct rating.
By comparison, the predictive accuracy in this study is equal to the
best results found in previous studies that predicted five categories
of bond ratings. However, the predictive accuracy of loan classifica-
tion models by Dietrich and Kaplan [1979] and Marais, Patell and
Wolf son [1984] are markedly higher than the results in this study,
but, unlike this study, their samples were heavily weighted with low
risk loans.
In conclusion, the prediction model was reasonably successful, but
the loan risk rating process incorporates other variables and/or dimen-
sions that our study was unable to measure or detect. The challenge
of our next study, that uses inductive learning in an expert system,
is to capture more information and improve the predictive accuracy of
the model.

-20-
FOOTNOTE
The authors are very appreciative of the financial support pro-vided by the Prochnow Educational Foundation in sponsoring thisresearch project. Also the authors are grateful for the very capableresearch assistance of Fuh-Jiun Kuo, Hsing-Yao Chen and Chau Chen Yangin conjunction with this research project.
2In the spirit of consistency, the following ratios are reported
as cash flow components. However, it is not necessary to have TNF in
the denominator.

-21-
REFERENCES
Altman, E. I., R. B. Avery, R. A. Eisenbeis and J. F. Sinkey, Jr.,
Application of Classification Techniques in Business, Banking and
Finance , Greenwich, CT: JAI Press, Inc., 1981.
Altman, E. I., "Commercial Bank Lending: Process, Credit Scoring, and
Costs of Errors in Lending," Journal of Financial and Quantitative
Analysis , Vol. 15 (November 1980), pp. 813-832.
, "Managing the Commercial Lending Process," in Handbook for
Banking Strategy , R. C. Aspinwall and R. A. Eisenbeis, editors,
New York: Wiley & Sons, Inc., 1985, pp. 473-510.
Belkaoui, Ahmed, Industrial Bonds and the Rating Process . Westport,CT: Quorum Books, 1983.
Dietrich, R. and R. Kaplan, "Empirical Analysis of the Commercial LoanClassification Decision," The Accounting Review , Vol. 57 (January
1982), pp. 18-38.
Dickerson, C. S., Current Approaches to Grading Commercial Loans,
Philadelphia, PA: Robert Morris Associates, 1987.
Foster, G. , Financial Statement Analysis , Second Edition, EnglewoodCliffs, NJ: Prentice-Hall, 1986.
Gentry, J., P. Newbold, and D. T. Whitford, "Classifying BankruptFirms with Funds Flow Components," Journal of Accountancy Research
,
Vol. 23 (Spring 1985a), pp. 146-160.
, "If Cash Flow's Not the Bottom Line, What Is?" FinancialAnalysts Journal , Vol. 41 (September/October 1985b), pp. 47-56.
, "Predicting Industrial Bank Ratings with a Probit Modeland Funds Flow Components," Financial Review , (August 1988), pp.
269-236.
Haslem, J. and W. Longbrake, "A Credit Scoring Model for CommercialLoans, A Comment," Journal of Money, Credit and Banking , (Spring1972), pp. 733-734.
Horrigan, James D. , "The Determination of Long-Term Credit Standingwith Financial Ratios," in Empirical Research in Accounting:Selected Studies , Vol. 62 (1966), pp. 44-62.
Kaplan, R. and G. Urwitz, "Statistical Model of Bank Ratings: A
Methodological Inquiry," Journal of Business , Vol. 52 (April 1979),
pp. 231-261.

-22-
Kehlbeck, K. A., "An Effective Loan Review Program: Some Options and
Some Musts," The Journal of Commercial Bank Lending , (October 1980),
pp. 2-9.
Lev, B. , "On the Usefulness of Earnings: Lessons and Directions from
Two Decades of Empirical Research," Working Paper (April 1989),48 pages.
Marais, M. L. , J. Patell and M. Wolfson, "The Experimental Design of
Classification Models: An Application of Recursive Partitioningto Commercial Loan Classifications," Journal of Accounting Research
,
Vol. 22 (Supplement 1984), pp. 87-114.
Orgler, Y. E. , "A Credit Scoring Model for Commercial Loans," Journalof Money, Credit and Banking , (November 1970), pp. 435-445.
Pinches, George E. and Kent A. Mingo, "A Multivariate Analysis of
Industrial Bond Ratings," Journal of Finance , Vol. 23 (March 1973),
pp. 1-18.
Udell, G. F., "Loan Quality, Commercial Loan Review and Loan OfficerContracting," Journal of Banking and Finance , forthcoming.
, "Collateral, Loan Quality, and Bank Risk," Working Paper,(December 1988), 19 pages.
von Stein, J. H. and W. Ziegler, "The Prognosis and Surveillance of
Risks from Commercial Credit Borrowers," Journal of Banking and
Finance, Vol. 8 (1984), pp. 249-268.
D/54

EXHIBIT 1
CONTRIBUTION OF EACH CASH FLOW COMPONENT TO THE TOTAL FLOW
(in millions of dollars)
INFLOWS OUTFLOWS
Net Operating $40 Net Investment $-38
Receivables 5 Inventories -13
Payables 15 Other CA - 2
Other CI 8 Dividends - 8
Net Other A&L 12 Fixed Coverage Expenses - 3
Net Financial 10 Changes in Cash -26
Total Inflow (TI) $90 Total Outflow (TO) $-90
TI = TO = TCF
Percentage Contribution of Each Cash Flow Component
Cash Flow Component/TCF
Net OperatingReceivablesPayables
Other CLNet Other ^&LNet Financial
Total Inflow
Net InvestmentInventoriesOther CADividendsFixed Coverage ExpensesChange in Cash
Total Outflows
Percent of
Total Inflow (TI)
or Total Outflow (TO)
+ 44,,4
+ 5.,6
+ 16.,7
+ 8,,9
+ 13..3
+ 11..1
+100,.0
- 42,,2- 14..5- 2,,2- 8..9
- 3.,3
- 28,.9
-100.0

EXHIBIT 2
AN EXAMPLE OF THE HIERARCHY OF CASH FLOW COVERAGE RATIOS FORCOMPANIES WITH INCREASING FINANCIAL RISK CHARACTERISTICS
Lowest Company HighestCash Flow Component Risk RiskTotal Net Flow
A B C D E
nof/|tnf| 100 60 50 40 20
NIF/ |TNF -40 -35 -30 -26 -14
DIV/ TNF -10 -15 -15 -10 -0
FCE/|TNF -5 -10 -15 -20 -30
NWC*/ |tnf| -10 -8 -5 +5
to/|tnf -100 -100 -100 -100 -100
Lowest Company Highest
Coverage Ratios Risk Risk
[nof/|tnf|v |x**|/ |tnf| ] A B C D E
Investment (ICR) 2.5 1.71 1.67 1.54 1.43
Discretionary (DCR) 2.0 1.2 1.11 1.11 1.43
Free Cash Flow(before workingcapital)*** 1.82 1.0 .83 .71 .46
Free Cash Flow(after workingcapital) 1.54 .83 .77 .71 .51
Total Coverage (TCR) 1.0 .60 .50 .40 .20
*NWC = E w.c. components (outflows) - £ w.c. components (inflows)
**X = outflow component
***Discretionary & Fixed Coverage Expenditures (DFCER)

EXHIBIT 3
MEANS AND STANDARD DEVIATIONS OF THE CASH FLOW COMPONENTS,1986, 1987 and 1986-1987
Cash Flow Component
Total Cash Flow
Operating
Receivables
Inventories
Other CA
Payables
Other CL
Other 4. & L
Financing
Fixed Coverage
Investment
Dividend
Change in Cash
TCF/TA
N
1986Mean S.D.
1987Mean S.D.
1986-1987Mean S.D.
.4930 .2272
-.0943 .1661
-.0904 .2258
.0243 .0985
-.0789 .1594
.0075 .1153
-.0973 .2135
.1406 .2816
-.0979 .0889
-.2311 .2074
-.0842 .1241
-.0006 .2198
.2779 .1204
44
.4701 .2640
.0826 .2142
-.0221 .1838
.0032 .0949
.0502 .1718
.0336 .1272
-.0300 -.2140
.0082 .3248
-.1029 .0943
-.2522 .1949
-.0684 .1145
-.0072 .2351
.2958 .1507
103
.4770 .2538
-.0861 .2010
-.0425 .1997
.0050 .0990
.0588 .1606
.0258 .1249
-.0501 .2161
-.0479 .3133
-.1014 .0927
-.2459 .1990
-.0731 .1175
-.0052 .2306
.2904 .1425
147

EXHIBIT 4
PROBIT COEFFICIENTS FOR CASH FLOW COMPONENTS AND
FOR CASH FLOW COMPONENTS WITH QUALITATIVE FACTORS,1986, 1987, 1986 AND 1987
1986 1987 1986 & 1987
1.47 1.02 -1.97** -1.55* -0.69 -0.38
4.52 4.88 1.70 0.92 1.87* 1.51
2.37 2.05 0.52 0.87 0.57 0.62
-2.5L -2.90 -1. 16 -0.62 -1.05 -0.85
-1.24 -1.44 -0. 19 -0. 52 0.31 -0.64
1.16 1.17 -0.81 -0.76 -0.21 -0. 13
Cash Flow Component CFC CFC+Q CFC CFC+Q CFC CFC+Q
Constant 4.15*** 5.26*** 1.88*** 2.30*** 2.34*** 2.69***
Operating -4.34** -4.47** -1.81** -2.22*** -1.93*** -2.10***
Receivables -1.00 -0.94 -0.49 -0.34 -0.49 -0.39
Inventories
Other CA
Payables
Other CL
Other A & L
Financing
Fixed Coverage Exp. -10.88*** -8.42** -5.62*** -4.70*** -5.44*** -3.79**
Investments -0.12 -0.18 -0.32 -0.35 -0.07 -0.22
Dividends 6.02*** 9.39*** 3.06** 2.29* 3.61*** 3.54***
TCF/TA 0.15 2.08 1.41 0.06 0.72 -0.66
Dummy Variables
Secured/Unsecured -1.76 1.79** 1.67**
Guarantee/ 1.62** -0.05 0.47**No Guarantee
Liquidity of 0.52 -0.09 -0.15Collateral
n 44 44 103 103 147 147
*Signif icant at .10 level of confidence.**Signif icant at .05 level of confidence.
***Signif icant at .01 level of confidence.

EXHIBIT 5
CLASSIFICATION OF LOAN RISK RATINGS WITHCASH FLOW COMPONENTS, 1986
Bank CJLassi.1r ied Rat Ings
Rating 1 2 3 4 5 Total
1 1 2 3
2 5 6 11
3 3 17 2 1 23
4 5 5
5 2 2
TOTAL 1 10 28 2 1 44
56.82 percent of bank loan risk ratings are classified correctly.
CLASSIFICATION OF LOAN RISK RATINGS WITH CASH FLOWCOMPONENTS AND QUALITATIVE FACTORS, 1986
Bank
Rating
1
2
3
4
5
TOTAL
Classified Ratings2 3 4
2
9 2
2 19
3
Total
3
11
23
5
2
13 24 44
75 percent of bank loan risk ratings are classified correctly,

EXHIBIT 6
CLASSIFICATION OF LOAN RISK RATINGS WITHCASH FLOW COMPONENTS, 1987
Bank c;Lassi:fied Rat ing;
Rating 1 2 3 4 5 Total
1 1 1 6 8
2 3 11 14
3 2 56 2 60
4 13 6 19
5
1
1 1 2
TOTAL 6 87 9 103
61.16 percent of bank loan risk ratings are classified correctly.
CLASSIFICATION OF LOAN RISK RATING WITH CASH FLOW
COMPONENTS AND QUALITATIVE FACTORS, 1987
Bank CI assi fied Rat ingsRating 1 2 3 4 5 Total
1 1 7 8
2 2 2 10 14
3 'l 53 6 60
4 11 8 19
5 2 2
TOTAL 4 2 81 16 103
63.11 percent of bank loan risk ratings are classified correctly.

EXHIBIT 7
CLASSIFICATION OF LOAN RISK RATINGS WITH CASH
FLOW COMPONENTS, 1986-1987
Bank. Classified RatingsRating 1 2 3 4 5 Total
11
25
1 83
24
4
1 2 2 7
2 3 3 19
3 2 1 77 2
4 23 1
5 3 1
TOTAL 7 6 129 4 1 147
56.46 percent of bank. loan risk ratings are classified correctly.
CLASSIFICATION OF LOANS BY RISK RATINGS WITH CASH FLOWCOMPONENTS AND QUALITATIVE FACTORS, 1986-1987
Bank Classified RatingsRating 1 2 3 4 5 Total12 5 4 11
2 4 2 19 25
3 1 2 76 5 83
4 16 8 24
5 2_ _2_ _k_
TOTAL 7 8 117 15 14 7
59.86 percent of bank loan risk ratings are classified correctly.
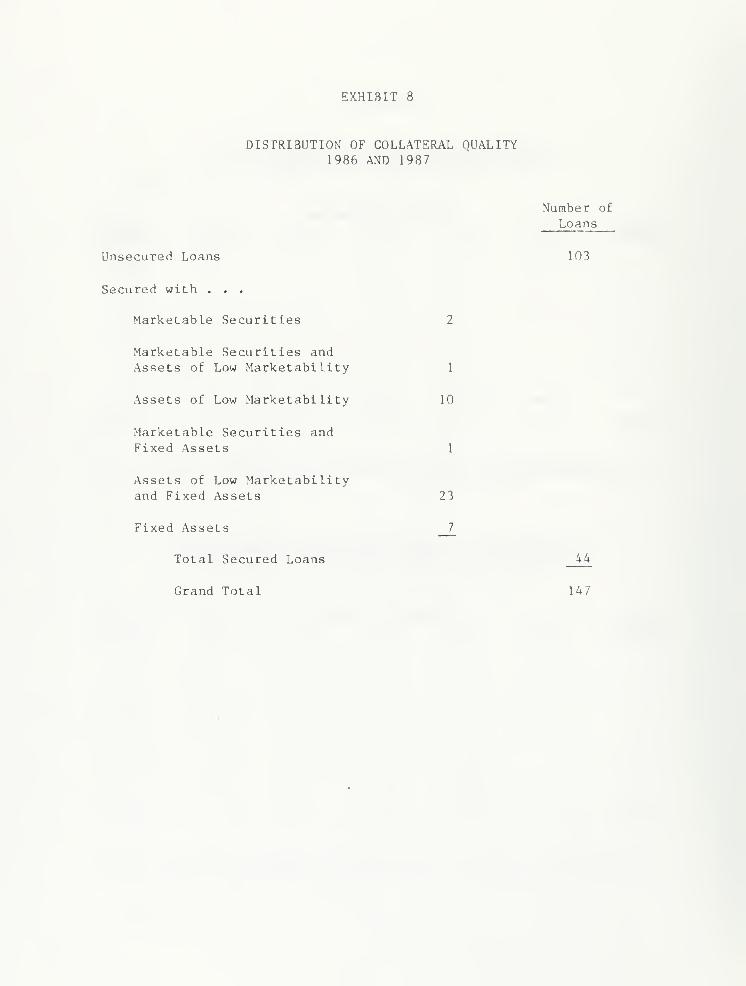
EXHIBIT 8
DISTRIBUTION OF COLLATERAL QUALITY1986 AND 1987
Unsecured Loans
Secured with . . .
Marketable Securities
Marketable Securities andAssets of Low Marketability
Assets of Low Marketability
Marketable Securities andFixed Assets
Assets of Low Marketabilityand Fixed Assets
Fixed Assets
Total Secured Loans
Grand Total
1
10
1
23
7
Number of
Loans
103
147

EXHIBIT 9
FREQUENCY DISTRIBUTION OF GUARANTEED AND NON GUARANTEED LOANS
L986 1987
Bank Not NotRating Total Guaranteed Guaranteed Total Guaranteed Guaranteed
1 3 3 8 8
2 1L 1 10 14 3 11
3 23 8 15 60 20 40
4 5 4 1 19 9 10
5 _1_ _2 _0 2 _1_ _1
44 15 29 103 33 70

EXHIBIT 10
FREQUENCY DISTRIBUTION OF SECURED AND
UNSECURED LOANS BY LOAN RISK CLASS 1986 AND 1987AND SECURED/GUARANTEED COMBINATIONS BY LOAN RISK CLASS
1986 1987
BankRating Total Secured Unsecure d Total Secured Unsecured
1 3 3 8 8
2 11 I 10 14 14
3 23 8 15 60 16 44
4 5 2 3 19 14 5
5 2 1 1 2 2
44 12 32 103 32 • 71
SECURED AND GUARANTEED COMBINATIONS
1986 1987 Total
8
8
_1_
17
1
12
10
_2_
25

EXHIBIT II
CHANGE IN CLASSIFIED LOAN RISK RATINGBY ADDING QUALITATIVE INFORMATION,
1986-1987
Number of Ratings that Changed
CFC Ratings
Were Less RiskyThan CFC+Q
CFC RatingsWere More RiskyThan CFC+Q
CFC+Q RatingsWere Less RiskyThan CFC
CFC+Q RatingsWere More RiskyThan CFC
Ratings by .
CFC RatingsWere Improvedto Match BankRating by
Adding Quali-tative Factors
CFC RatingsMatched BankRating, But
Did Not MatchWhen Qualita-tive Factors
Added
CFC RatingsDid Not
Match BankRatings, ButWere Improved
by One LevelWhen Qualita-tive Factors
Added
Total 10
Bank CF CFO
a.
b.
c.
d.
e.
f.

EXHIBIT 12
MEAN AND STANDARD DEVIATION OF SELECTED CASK FLOWCOMPONENTS BY RISK RATING CLASS DETERMINED
BY BANK AND PROBIT, 1986 AND 1987
Rating Determined by . . .
Selected 12 3 4
Cash FlowComponents Bank Probit Bank Probi t Bank Probit Bank Prob it
N 11 7 25 6 84 129 24 4
Operating Mean .6706 .7347 .6224 .6350 .4354 .4729 .4337 .0702S.D. .1062 .1637 .1485 .1113 .2587 .2405 .2420 .1672
Investment Mean -.3074 -.3109 -.2615 -.2006 -.2539 -.2522 -.2061 -.0584S.D. .1653 .1109 .2195 .1496 .2014 .2036 .1715 .0310
Dividends Mean -.1822 -.3981 -.1789 -.3468 -.0480 -.0456 .0097S.D. .1193 .1066 .1573 .1191 .0893 .0655 .0196
Fixed Coverage Mean -.0572 -.0318 -.0845 -.0642 .0987 -.1075 .1464 -.0695S.D. .0367 .0253 .0652 .0635 .0998 .0946 .0931 .0902

EXHIBIT 13
PROBIT COEFFICIENTS FOR CASH FLOW COMPONENTS
AND QUALITATIVE FACTORS FOR THE PREDICTION OF
LOAN RISK RATINGS, 1986 AND 1987 COMBINED
Cash FlowComponent:
Constant
Operating
Receivables
Inventories
Other CA
Payables
Other CL
Other A&L
Financing
Fixed Coverage Expenditures
Investments
Dividends
TCF/TA
Probit Coefficients
2.518***
-2.006**
0.453
-0.371
2.484**
1.006
-0.792
-0.880
-0.416
-3.77 2**
0.117
3.748***
-0.430
Dummy Variables
Secured /Unsecured
Guarantee/No Guarantee
Liquidity of Collateral
*Significant at .10 level of confidence.**Signif icant at .05 level of confidence.
***Signif icant at .01 level of confidence.
0.382
0.168
0.130
100

EXHIBIT 14
PREDICTION OF LOAN RISK RATINGS IN THE HOLDOUT SAMPLE WITHCASH FLOW COMPONENTS AND QUALITATIVE FACTORS, 1986-1987
BankRatings 1
1 —
2 3
3 1
4
5.
TOTAL 4
Predicted Ratings
2 3 4 5 TOTAL
1 1
7 10
28 29
5 2 7
41 2 47
63.83 percent of bank loan risk ratings are predicted correctly.

EXHIBIT 15
SUMMARY OF HOLDOUT SAMPLE RESULTS FOR
LOAN RISK RATING MODEL 1986-1987
Bank Correct Adjacent Nonadjacent
Rating Rating Rating Rating*** Total
(1) (2)* (3)** (4) (5) = (2+3+4)10 1**** 1
2 10 10
3 28 1 29
4 2 5 7
5 _0 _0 _0 _0
TOTAL 30 16 1 47
% OF TOTAL 63.83 34.04 2.13 100.0
*Number of model-determined ratings that were correct.
**Number of model-determined ratings that were In a rating class
adjacent to the actual bank rating.
***Number of model-determined ratings that had the highest probabili-ties but were not adjacent to the actual bank rating.
****Nuinber of ratings in which the probabilities for the actual bankratings were not second in size to the predicted rating.


->
HECKMAN —
1
BINDERY INC. |§|
JUN95Bmnd-To-lW N MANCHESTER.
INDIANA 46962
