a comparative analysis of chemical · a study entitled "a comparative analysis of chemical...
TRANSCRIPT

RADC-TR-88-31Final Technical Report
S April 1988I
A COMPARATIVE ANALYSIS OF CHEMICALVAPOR DEPOSITION TECHNIQUES FOR THEGROWTH OF III-V EPITAXIAL FILMS
University of Florida DTICQY-.-CTE
Timothy J. Anderson and Kenneth P. Quinlan SEP 2 2 1988
AIPRAOJEDFOR' J/ .C AELFASE," D/STA'/8U770N UNLIMIT
ROME AIR DEVELOPMENT CENTERAir Force Systems Command
Griffiss Air Force Base, NY 13441-5700
88 ~> ')2

This report has been reviewed by the RADC Public Affairs Office (PA) and
is releasable to the National Technical Information Service (NTIS). At NTIS
it will be releasable to the general public, including foreign nations.
RADC-TR-88-31 has been reviewed and is approved for public release.
APPROVED: X
KENNETH P. QUINLANProject Engineer
0 ~~APPROVED: 2 ~ iHAROLD ROTHDirector of Solid State Sciences
d
FOR THE COMMANDER:
JOHN A. RITZDirectorate of Plans & Programs
If your address has changed or if you wish to be removed from the RADC mailinglist, or if the addressee is no longer employed by your organization, please
notify RADC (ESME) Hanscom AFB MA 01731-5000. This will assist us in main-taining a current mailing list.
Do not return copies of this report unless contractual obligations or noticeon a specific document requires that it be returned.

UNCLASSIFIEDSECURITY CLASSIFICATION OF THIS PAGE
Form ApprovedREPORT DOCUMENTATION PAGE OMBNo. 0704-0188
la. REPORT SECURITY CLASSIFICATION lb. RESTRICTIVE MARKINGS
UNCLASSIFIED N/A2a. SECURITY CLASSIFICATION AUTHORITY 3. DISTRIBUTION /AVAILABILITY OF REPORT
N/A Approved for public release; distribution2b. DECLASSIFICAT;ON I DOWNGRADING SCHEDULE unlimited.
4. PERFORMING ORGANIZATION REPORT NUMBER(S) S. MONITORING ORGANIZATION REPORT NUMBER(S)
N/A RADC-TR-88-31
6a. NAME OF PERFORMING ORGANIZATION 6b. OFFICE SYMBOL 7a. NAME OF MONITORING ORGANIZATIONif applicable)
University of Florida Rome Air Development Center (ESME)
6c. ADDRESS (City, State, and ZIP Code) 7b. ADDRESS (City, State, and ZIP Code)
Chemical Engineering Department Hanscom AFB MA 01731-5000Gainesville FL 32611
Sa. NAME OF FUNDING/SPONSORING 8b. OFFICE SYMBOL 9 PROCUREMENT INSTRUMENT IDENTIFICATION NUMBERORGANIZATION (If applicable)
Rome Air Development Center ESM F19628-82-K-0008
8c. ADDRESS (City, State, and ZIP Code) 10. SOURCE OF FUNDING NUMBERS
j PROGRAM PROJECT TASK WORK uNIT
Hanscom AFB MA 01731-5000 ELEMENT NO NO NO ACCESSION NO
________________________ 61102F 2306 Jl 39 J11 TITLE (Include Security Classifi.ajon)
A COMPARATIVE ANALYS'3 OF CHEMICAL VAPOR DEPOSITION TECHNIQUES FOR THE GROWTH OF
III-V EPITAXIAL FILMS12. PERSONAL AUTHOR(S)
Timothy J. Anderson, Kenneth P. Quinlan
13a. TYPE OF REPORT 13b. TIME COVERED 14. DATE OF REPORT (Year, Month, Day) 15. PAGE COUNT'
Final IFROM _A2r 82 TO Jul 85 April 1988 26016. SUPPLEMENTARY NOTATION
N/A
17, COSATI CODES I&. S'JCT TERMS (Continue on reverse if necessary and idenviy by block number)FIELD GROUP SUB-GROUP Vapor Phase Epitaxy 1 )07 02 II-V Semiconductors ,
20 12 o Thin Films i . " .' " "9. ABSTRACT (Continue on reverse if necessary and identify by block number)
A program to compare the chloride, hydride and metal organic chemical vapor depositiontechniques is described. A deposition system capable of depositing films by all threetechniques was constructed and equipped with a modulated molecular beam mass spectrometer
A and, more recently, a Raman spectrometer. The thermal decomposition kinetics of NH3, PH 3and AsH3 were measured and the results applied to reactor operation. The hydride sourceregion was analyzed and design procedure established. The unintentional incorporation ofSi in GaAs and InP with the MOCVD process was investigated and methods of reducing theselevels suggested. Substrates preparat'ion procedures were compared using UTHV surfaceanalysis tools. A significant amount of H2 was found in GaAs (100) substrates.
20. DISTRIBUTION /AVAILABILITY OF ABSTRACT 21. ABSTRACT SECURITY CLASSIFICATION
CUNCLASSIFIED/UNLMITEO C3 SAME AS RPT C3 OTIC USERS UNCLASSIFIED
22a NAME OF RESPONSIBLE INDIVIDUAL 22b TELEPHONE (Include Area Code) 22c OFI"CE SYMBOL
Kenneth P. Quinlan (617) 377-4015 RADC (ESME)
0 DO Form 1473, JUN 86 Previous editions are obsolete. SECURITY CLASSIFICATION OF THIS PAGE
UNCLASSIFIED
a . , = ==m= i - .. ,,ii ,.. . a t. l

TABLE OF CONTENTS
PAGE
Acknowledgement .................................................. iv
Project Summary ................................................... 1
A. Reactor Characteristics and Hydride ThermalDecomposition Studies .................................. 2
B. Unintentional Si Incorporation in Chlorideand Hydride CVD of GaAs and InP .......................... 5
C. Complex Chemical Equilibrium Calculations forDeposition of Ga InI As ................................. 11
D. Complex Chemical EquT ibrium Calculations ofMOCVD of GaAs and InP .................................... 12
E. Point Defect Structure of GaAs ........................... 12* F. Hydride Source Boat Design ............................... 13
G. Substrate Preparation .................................... 15
Publications and Presentations .................................... 17
Appendix A
The Thermal Decomposition of Group V Hydrides asApplied to CVD Compound Semiconductors ........................ 18
Review of Literature ........................................ 18
The Thermal Decomposition of NH3 .. ... ... ... ... ... .. ... ... 18The Thermal Decomposition of PH ......................... 21The Thermal Decomposition of As ........................ 22
Experimental ................................................ 24
* Experimental Apparatus and Method ........................ 26
Results ..................................................... 37
Analysis of Uncertainties in the Rate Data ............... 47Determination of Activation Energies ..................... 54
a Implication of the Measurements on Other Reactionsin the Decomposition Chain ............................... 58Comparison Between Equilibrium and Kinetic Modelsfor VH3 Decomposition .................................... 64
.,., S ~ , w w m m u m

Appendix B
Gas Sampling System and Mass Spectrometer ...................... 72
Appendix C
Unintentional Si Incorporation in Chloride and HydrideCVD of GaAs and InP ............................................ 87
Review of Literature ......................................... 90
Impurities in InP Epitaxial Films Grown bythe Chloride Process ...................................... 90Impurities in GaAs Epitaxial Films Grown bythe Hydride Process ....................................... 93Impurities in InP Epitaxial Films Grown bythe Hydride Process ....................................... 95
Formulation of an Equilibrium Model for the Hydrideand Chloride Processes ......................................... 98
SIntroduction ................................................. 98
Method of Calculation of Complex Chemical Equilibrium ........ 99
Thermodynamic Models of CVD ................................... 103
Models for CVD Source and Pre-source Zones ................ 103Models for CVD Mixing and Deposition Zones ................ 106
Solid State Defect Chemistry ................................. 112
Thermochemical Properties .................................... .117
Introduction .............................................. .117Pseudo-Steady State Constraint for Liquid Source Boat ..... 1-18The Ga-As-Cl-H System ..................................... 122The In-P-Cl-H System ...................................... 125The Si-Cl-H System ........................................ 129
Results and Discussion ....................................... 141
Chemical Equilibrium Investigation ........................ 141The GaAs Chloride System .................................. 142
* The GaAs Hydride System ...................... ............ 167The InP Chloride System ................................... 176The InP Hydride System .................................... 185

iii
Appendix 0
Chemical Equilibrium Analysis of Gax InlixAs ChemicalVapor Deposition ............................................... 189
Alloy Source ................................................. 192
Influence of HCl Addition in the Mixing Zone ................. 197
Influence of PLH 3 Addition on the Solid SolutionComposition .................................................. 199
Comparison with Experimental Result .......................... 201
Appendix E
Steady State Analysis of the Source Zone in the HydrideProcess ........................................................ 206
Appendix F
An ESD (Electron Stimulated Desorption) Study of theinteraction of H2 , 02 and 02 with GaAs (100) ................... /15
Experimental ................................................. z
A. Sample ................ ........................... 219B. Equipment and Procedures ............................ 220
Results and Discussion ....................................... 22 '
Conclusion ..................................................
References ....................................................... . .
Aoession For
NTIS GRA&IDTIC TABUnannounced ElJustificatio
By_Distribution/Availability Codes
'I and/orDist Special
.. ... _______mmmm u i

iv
ACKNOWLEDGE fI.N'r
The research described in this report .as performed by DougLas Meyer, Ph.D.(1984), James Edgar, Ph.D. (1986), and Julian Hsieh, Ph.D. ([987) at theUniversity of Florida, Gainesville, FL. The principal. i.vestigaturs aredeeply iadebted to John Kennedy, RADC/ESM, Rome Air Development Center,Hanscom AFB, ',A for his advice and encouragement. The research wassupported by the Solid State Sciences Directorate, Rome Air DevelopmentCenter, Hanscom AFB, MA 01731.
A
Si
SB
a
.0

.I
PROJECT SUMMARY
A study entitled "A Comparative Analysis of Chemical Vapor
Deposition Techniques for the Growth of III-V Epitaxial Films"
was initiated in April, 1982 at the University of Florida. The
objective of this investigation was to perform a comparative
analysis of the three principal CVD chemistries used to grow III-
V epitaxial films (chloride, hydride, and metalorganic). Much of
the work previous to this study was devoted to tedious parametric
studies. In these studies the value of operating parameters were
systematically varied and correlated to the resulting film
properties. The philosophical approach adopted in this
investigation was to first gain an understanding of the detailed
chemistry of the deposition methods, then use this in conjunction
with engineering models describing the heat, momentum and mass
transport processes to efficiently optimize the reactor operation
and design.
Described below are the main accomplishments of this effort
to date. These studies included a complex chemical equilibrium
analysis of unintentional Si incorporation in GaAs and InP
deposited by the chloride and hydride methods. The calculation
included a more realistic pseudo-steady state constraint for the
chloride source zone and also addressed the point defect
structure. The calculations suggested several methods for
reducing the background Si levels. As an ancillary study, the
point defect model developed was used to explain the EL2 trap in
GaAs grown with various techniques. A research CVD reactor
system was constructed and contains two novel features. First,

the system has the capability of performing all three reaction
chemistries with the same gas delivery system and in the same
reactor, thus permitting a direct comparison of the processes.
In addition, the reactor is equipped with a modulated molecular
beam mass spectrometer for quantitative chemical analysis of the gas
phase. The initial efforts were directed at understanding the
source zone operation anid included an examination of the thermal
decomposition kinetics of arsine, phosphine and ammonia. This
kinetic data permitted the prediction of hydride decomposition
extent during laminar flow in a tube under isothermal conditions,
i.e., in typical delivery systems. The reactions are sluggish
and heterogeneous in nature and under conditions of high flowrate
and low temperatures give significant amounts of unreacted
hydride in the deposition zone. The source zone in the chloride
was also addressed and design criteria were developed. The model
developed will now be verified experimentally with use of the
modulated molecular beam mass spectrometer. Initial studies
comparing the MOCVD of GaAs with trimethyl and triethyl gallium
are also in progress. A more detailed summary of each of these
studies is given below. This initial period of investigation has
largely been devoted to the construction of a significant
research reactor.
A. Reactor Characteristics and Hydride Thermal Decomposition
Studies
The major portion of our effort was directed at constructing
a versatile researcn III-V CVD system. The novel apsects of the

3
experimental apparatus are the ability to grow films by the three
CVD techniques and the ability to perform
quantitative analysis with a modulated molecular beam mass
spectrometer. The system is equipped with a resistance furnace
for hot-wall operation which carn be rolled away to permit a rf
generator to be positioned for cold-wall MOCVD. The modulated
molecular beam mass spectrometer uses three pumping stages to
differentially reduce the pressure from atmospheric to - 10- 8
torr. In this way molecular beam is formed very quickly and in
flight reaction is eliminated. The molecular beam is chopped at
a constant frequency which is synchronized with the sampling to
reduce the background level. A more detailed description of the
gas sampling system and mass spectrometer is given in Appendix
B. The system includes four bubbler systems, pneumatic bellows
valves, automatic mass flow controllers, VCR fittings and much of
the electronics were designed and constructed in-house.
The modulated molecular beam mass spectrometer became fully
operational in July, 1984. The first study completed was an
examination of the thermal decomposition kinetics of NH 3, PH3 -rd
AsH 3 in a batch reactor and the full results are presented in
Appendix A. Based on the results of these investigations, theV
following conclusions can be made:
1. The mechanisms of decomposition for all three species
appear to be identical and heterogeneous in nature (i.e.,
reaction occurs at the quartz reactor wall). Based on more
detailed studies of NH 3 decomposition, the following mechanism is
proposed:

-~ 4
VH(g)" S K VH3 (ad) Langmuir adsorption
k ,
VH,(ad) VH(ad) + H2 (g)
VH(ad) , Products (H2 , V2 , V.)
The second step in the VH 3 decomposition is rate limiting
and the rneversibility of the reaction must be included at
temperatures less than 1048 K (NH3 ), 850 K (FH3 ) and 780 K
(AsH 3 ) .
2. The decomposition rate of AsH is greater than that of
PH3 which is greater than that of NH The apparent activation
energies for these decomposition reactions were determined to be
60.2, 36.5 and 29.2 kcal/mol for NH 3, PH 3 and AsH 3 ,
respectively. Indirect evidence supports the assumption that
reactions between the products of these decomposition reactions
(V, V2 and V4 ) can be considered to be fast.
3. The kinetic data was used to determine concentration
profiles for conditions commonly used in hydride III-V CVD. As a
first step, the energy balance was solved to give temperature
profiles for the flow of H2 in a tube of constant wall
temperature. The .'umerical results indicated that the average
gas temperature increased from room temperature to the wall
temperature very quickly (within 2 reactor diameters of the tube
entrance). Next, the two-dimensional convective diffusion
equation with reaction at the wall was solved. The results of
these calculations indicated that, under some conditions

appropriate to CVD, the decomposition reaction was not
complete'. For example, at 973 K and a tube diameter of 5 cm the
residence time required for 990 decomposition was 17 sec for AsH 3
and 50 sec for PH 3. Axial dispersion was also found to be
important in most applications. In addition significant radial
concentration variations are present when the conversions are not
complete. These results suggest incomplete reaction in the MOCVD
4process, since the rate of homogeneous reaction is slower than
the heterogeneous one, the temperature is generally lower, and
the residence time is smaller.
This study represents a good example of the importance of
fundamental kinetic studies. Once kinetic data is available, the
performance of a given reactor design can be predicted in a
comparatively simple manner and the problems of scale-up and new
reacto design can be addressed with more confidence. For
example, since the surface to volume ratio scales inversely to
the radius, incomplete hydride thermal decomposition will be more
important.
B. Unintentional Si Incorporation in Chloride and Hydride CVD of
GaAs and InP
A rigorous solution of the mass, energy, and momentum
balance -quatlons .4ith variable properties and reaction 4s not
possible at this point. The chloride and hydride processes
Lnolve nigh temperature reversible homogeneous and heterogeneous
A react :n-s and are ideally suited for an equilibrium analysis.
Calculation of equilibrium compositions and deposition rates is
.8

67
j relatively simple, provides limits on the operation of the
reactors and gives semi-quantitative results for the influence of
operating parameters on growth conditions. This study included
the development of a computer code for the calculation of
multiphase equilibrium in systems having many species, models for
each zone of the CVD processes which are constrained to account
for actual mass transfer or kinetic limitations, a model for the
impurity incorporation mechanism and defect structure, and a
consistent thermodynamic data base.
* Two fundamental approaches exist for numerically determining an
equilibrium condition; a non-stoichiomet-ic method which
minimizes the total Gibbs energy of the system and a
stoichiometric technique that solves the non-linear law of mass
action equations. The popular Rand algorithm (non-
soichiometric) was extended to include multicomponent solution
and pure condensed phases and applied to this problem. This
method, however, was found to be susceptible to becoming trapped
in local minima because component mole fractions were being
sought as low as 0.1 ppb. A stoichiometric algorithm was
therefore developed and was found to perform well for all systems
studied.
* Three different models were examined for the deposition of
GaAs and InP. The first model addressed the hydride chemistry
and consisted of the following calculations:
* 1. HCl/hydrogen mixture is equilibrated with excess quartz
(presource zone).
2. The equilibrium gas mixture from (1) is equilibrated with

7
excess pure liquid group III and quartz (group III source
zone).
3. Group V hydride/hydrogen is equilibrated with excess quartz
(group V source zone).
4. The equilibrium gas mixtures from (2) and (3) are combined
and equilibrated with excess quartz (mixing zone).
5. The equilibrium gas mixture from the mixing zone is next
equilibrated at the deposition zone temperature and not in
the presence of excess quartz or solid substrate. This gas
mixture is supersaturated and represents a driving force for
* deposition.
With regard to the Si concentration, the activity of Si in a
solid solution which is in equilibrium with the gas phase
composition was determined in each calculation. This activity is
proportional to the amount of Si incorporated in the growing
film; the magnitude being calculated from the point defect
structure. For the deposition of GaAs and InP from the hydride
process the calculations suggested the following conclusions:
1. The Si activity in the presource zone is several orders of
_ magnitude below that in either of the two source zones. The
Si activity in the group V hydride source is always larger,
but only slightly, than the group III source zone and the
* activity increases with increasing temperature. This
suggests that the source zones should be operated at a lower
temperature or with a high hydride partial pressure because
* of the subsequent dilution effect in the mixing zone.
2. Decreasing the system pressure was found to increase the Si

*
8
activity and thus the advantage of lowering the pressure to
reduce mass transfer limitations would be countered by
increased Si incorporation.
3. The concentration of hydride in the feed gas was found to
have no effect on the condensed phase activity, though it
will influence the Si incorporation extent through the
defect structure.
4. Increasing the concentration of HCI in the feed stream of
the group III source zone significantly decreased the
activity of Si. One method of decreasing the Si content
while maintaining a constant vapor III/V ratio i5 to
increase both the HCI and hydride partial pressures in the
feed streams. The degree of supersaturation, and therefore
the deposition rate, can be controlled by the deposition
zone temperature.
5. The addition of HCI or an oxygen source (e.g. water) to the
mixing zone was found to reduce the Si activity considerai).y
once a critical amount was added (for the conditions
studied, on the order of 100 ppm HCI and 10 ppb water).
6. The exchange of hydrogen for an inert as the carrier gas
greatly reduced the SI activity. Given the group V sou-rce
zone as the main producer of Si, this would suggest
replacing the group V source hydrogen carrier gas with an
inert. This would also slightly increase the decomposition
rate and, with hydrogen still used as a carrier gas in the
group III source zone, sufficient hydrogen would be present
in the deposition zone to participate in the deposition

reaction.
7. Comparing the deposition of InP with that of GaAs, the
variation of the Si activity is similar in both systems
under all analogous conditions, except the value of the
activity in the InP system was about half of that in the
GaAs case. This was because GaCl was slightly more stable
than InCl, thus giving less Cl available to stabilize Si.
Similar calculations were performed for the chloride process and
the equilibrium model was staged as:
1. Group V trichloride/hydrogen gas mixture was equilibrated
with excess quartz (presource zone).
2. The gas mixture from the presource zone was equilibrated
with excess quartz and either solid compound or a saturated
liquid mixture.
3. The remaining calculations were the same as in the hydride
process since the two techniques have identical equilibrium'
chemistries beyond the source zone (except for the III/V
ratio).
The main conclusion of these investigations were:
1. The presource zone Si activity is at least three orders of
magnitude below that in either source zone.
2. The Si activity in the source and mixing zones increasea
with increasing temperature. It is therefore desirable to
operate the deposition zone at a temperature equal to or
less than (but not so low as to produce extraneous
deposition) the source zone. Longer residence times can be
used to achieve the same degree of mixing and reaction.

10
3. The Si activity can be decreased by adding group V
trichloride, HCl or water to the mixing zone, by using an
inert carrier gas, and by increasing the pressure (not
practical).
4. Increasing the mole fraction of group V trichloride in the
feed stream to the source zone had very little effect on the
Si activity when the liquid source was used. For the solid
compound source, however, increasing the group V trichloride
input mole fraction gave a marked decrease in the Si
5. The use of a solid compound source gave predicted values of
Si activity lower than use of the liquid source. These
calculations assumed that the source materials were pure.
6. The deposition of InP showed similar behavior to the
deposition of GaAs except for the following differences:
The InP system gave less supersaturation for the same base
operating conditions. The Si activity in the InP system was
slightly less than that determined for deposition of GaAs
and using a liquid source. The results for the compound
source were just the opposite, with Si activity much larger
for InP deposition.
The details of these calculations are fully described in
Appendix C. These calculations are relatively easy to perform
and have been very useful for interpreting the general trends in
0 chloride and hydride CVD of I11-V materials.
6-

C. Complex Chemical Equilibrium Calculations for Deposition of
GaXI nxAs
Complex chemical equilibrium calculations were also
performed for the deposition of Gax In,_xAs in the hydride
process. Two different source arrangements were considered: A
single alloy source and two independent pure metal sources. As
described in Appendix D, for the single alloy source the main
conclusions were:
1. The influence of temperature, pressure and HCI partial
pressure on the vapor phase composition in equilibrium
with the alloy boat was negligible. This is a result of
the fact that the dominant volatile In-and Ga species
are the mono-chlorides- and the standard enthalpy of
formation of these species are nearly identical.
2. The fraction of Ga in the vapor was slightly greater than
the fraction of Ga in the liquid alloy boat. This is a
result of GaCl being 6.8% more stable than InCl. The vapor
fraction versus liquid fraction plot was not symetric about
the y - x line because of the slight positive deviations in
the melt.
In the deposition region the influence of AsH 3 partial
pressure and HC1 addition to the mixing zone was investigateO-
As the AsH 3 partial pressure was increased, the Ga mole fraction
in the solid ternary was found to decrease and this conclusion is
in agreement with experimental measurements. As HCl was added to
the mixing zone the Ga mole fraction in the solid increased,
again in agreement with experiment.

A12
D. Complex Chemical Equilibrium Calculations of MOCVD GaAs and
InP
Finally, complex chemical equilibrium calculations were
performed for the deposition of GaAs and InP from trimethyl metal
organic sources (MOCVD). The base conditions consisted of an
excess of VH 3 (20 times the stoichiometric amount) and the metal
alkyl in H 2 introduced at 1 atm and with a substrate temperature
of 650 0 C. Complete decomposition of TMG and TMIn was calculated
at all temperatures in the range 450OC to 1050 0 C while the
deposition rate was constant at lower temperatures, in agreement
with experiment. As the temperature was increased the deposition
rate decreased as a thermodynamic limit was approached and
eventually etching conditions were established. The influence
pressure and VH 3 partial pressure were also studied and the
results were similar to those discovered in Appendix C. ."
hoped to gain insight into carbon incorporation .with these
calculations. Ten different hydrocarbon species were included
the calculation and the results indicated that CH 4 was the only
* significant (>10-10 atm) decomposition product at the conditi.:-
investigated.
* E. Point Defect Structure of GaAs
The native defect structure used to determine the Si
unintentional doping levels in GaAs was also used to suggest thr
* origin of the EL2 electron trap. This trap is observed in
Bridgman, LEC, chloride, hydride and MOCVD grown material and not
in LPE or MBE material. One obvious difference between these two

13
groups of growth techniques is the As partial pressure that is
maintained during growth; LPE and MOCVD using a low partial
pressure.
The postulated native point defect structure included
Schottky pairs and Frenkel disorder on the As sublattice. In the
model, the defect structure is assur %d to be in equilibrium at
growth temperature. Upon cooling, the equilibrium native point
defect concentrations decrease and the atomic defects require
atom motion to achieve the new equilibrium. As the temperature
decreases, kinetic limitations will define a metastable defect
structure. Evidence indicates the EL2 center is associated with
a gallium vacancy (e.g., AsGa). Two different dependencies of
the EL2 center on the III/V ratio were suggested and showed
quantitative agreement with experimental data. The experimental
work was performed by Dr. Li and Mr. Wang in the E.E. department-
at Florida.
F. Hydride Source Boat Design
During the construction of the experimental apparatus
several analytical studies were performed. One such study was
the development of a model to describe the operation of the group
III source region in the hydride system, i.e. the reaction of HC1.
flowing in a tube with liquid group III element placed in a
horizontal boat. The two dimensional convective diffusion
equation was solved for rectangular geometry and conformal
mapping techniques were used to render the solution applicable to
our geometry. Details of the work are given in Appendix E and
IJ

a 14
the conclusions of this study were:
1.) The results of previous investigators could not be
explained with a simple diffusion process, i.e. the diffusion of
HCl to the liquid surface. Rather, the data suggested a first
order reaction term at the gas liquid interface Is also important
at the conditions investigated.
2.) The axial dispersion (back-diffusion) term is important
under typical operating conditions. Thus, at the cold wall
inlet, a flow restriction should be introduced so that back
a diffusion and deposition is prevented. This is insured if the
dimensionless number vd/D is greater than 5. Here, v is the
average velocity, d Is the restricted tube diameter and D is the
gas phase diffusion coefficient.
3.) To give growth results that are insensitive to small
fluctuations in process parameters (e.g., temperature, flow ratc)
the source region should be operated under conditions which giv--
equilibrium conversion. Such conversion is not reached under
normal operation. This will increase the HCI concentration in
A the source zone and influence impurity incorporation and
deposition rates.
4.) For some operating conditions and fixed boat length, the
* conversion depends strongly upon the height of the liquid, Thuz
In this range of operation, the conversion from run to run can
change as the height changes.
* Calculations such as these are helpful in designing future
source boats and in interpreting results from CVD systems using
non-equilibrium source boat designs. A more effective source
B , m m, mm m lm nlmmmmmmm mmmmmmm m mmmm ri m- -

15
boat would contain a bubbler arrangement or baffle system to
enhance mass transfer. Research directions are now proceeding to
let nature calculate the conversions by using the modulated
molecular beam mass spectrometer to verify this model for In and
Ga reaction with HCl in H2 .
G. Substrate Preparation
Procedures for preparing GaAs and InP substrates were
developed and verified with the UHV analytical surface
techniques. A hydroplane chem-mechanical polisher was
constructed and successfully used to polish both substrates. The
etching fluid viscosity was found to be critical for producing
sufficient drag to give hydroplaning conditions.
Auger electron spectroscopy.(AES) of solvent cleaned
(acetone/TCE/methanol) substrates revealed the presence of carbu'
and oxygen contamination. A substrate could be cleaned in the
UHV chamber by argon ion bombardment and annealing at 500 0C. Ortz
interesting result was the presence of a considerable amount of
hydrogen in GaAs. Most surface analytical tools are not
sensitive to hydrogen, but electron stimulated desorption (ESD)
can detect hydrogen. The energies and masses of these ions were
determined with a cylindrical mirror analyzer in a time-of-fliig '.
mass spectrometer.
After cleaning GaAs substrates with Ar ion bombardment and
sputtering a substantial amount of hydrogen was present. The
surface was then dosed with oxygen (12,000 L at room
temperature). This was followed by deuterium dosing at various
a

M 16
A temperatures. Gas phase D2 was not adsorbed at room temperature
but was readily adsorbed at temperatures above 2000C. It is
interesting to note that deuterium was adsorbed more readily on a
freshly oxidized surface than-on a surface which had not been
oxidized immediately before dosing. It was found that, not only
could D2 be adsorbed onto an oxidizing surface, it was also
adsorbed onto a clean GaAs surface. Thermal programmed
desorption (TPD) studies showed that H2 , HD, and D2 can be
desorbed by heating to 5500C. The presence of HD is evidence
dh that D2 dissociates upon chemisorption. Hydrogen plays an
important role in the passivation of Si and may likewise be
important in compound semiconductors. These results are
presented in Appendix F.
*
e
0 , m m m m,~mIma~m mu n m anam r -

17
Publications and Presentations
1. "Chemical Vapor Deposition of Electronic Materials,"
Accepted by Reviews Chem. Eng. (1985).
2. "An ESD Study of the Interaction of Hydrogen, Deuterium andOxygen with GaAs(100)," Presented at AVS Meeting,Clearwater, Florida Accepted by Thin Solid Films (1985).
3. "Complex Chemical Equilibrium Analysis of the Ga-As-H-CI-Si-OSystem as Applied to CVD of GaAs," Presented to CALPHAD XIVConf., Cambridge MA (1985).
4. "Complex Chemical Equilibrium in the In-P-H-Cl-Si-O System asApplied in InP CVD," Presented at National AIChE Meeting,Orlando, Florida To be submitted to High Temp. Sci. (1985).
5. "Unintentional Doping in GaAs Deposited by Hydride andChloride CVD," Presented to American Vacuum Society,
I Anaheim, CA. To be submitted to J. Crystal Growth (1985).
6. "Design of the Group III Source Zone in III-V CVD Processes,"Presented at National AIChE Meeting, Anaheim, CA. To besubmitted to J. Crystal Growth (1985).
7. "A Mechanism and Kinetics of Si Growth," Accepted by J.Crystal Growth (1985).
8. "Thermal Decomposition Kinetics of Group V Hydrides on Quartzas Determined Mass Spectrometrically, " Presented at AnnualAIChE Meeting, Chicago, IL. To be submitted to J.
roElectrochem. Soc. (1985).
9. "Axial Diffusion in a Plug Flow Reactor with Catalytic WallReaction as Applied to Group V Hydride ThermalDecomposition." In Preparation
10. "A Thermodynamic Analysis of CVD of Ge-Si in the Ge-Si-Cl-HSystem," To be submitted to J. Crystal Growth (1985).

18
Appendix A
The Thermal Decomposition of GroupV_)ydrides as Appliedto CVD of Compound Semiconductors
Review of Literature
The Thermal Oecomoosition of NH3
The thermal decomposition of the trihydrides of N, P and As have
been studied by many investigators and, for temperatures below 1500 K,
a general consensus exists that these reactions are almost entirely
heterogeneous in nature. Bamford and Tipper [ Z] have reviewed the
literature relevant to the homogeneous pyrolysis of ammonia at temper-
ature above 2000 K and found the reaction to be characterized by an
activation energy of approximately 100 kcal/mole. Based on the ob-
served activation energy and the results of experiments with deuterated
arnmonia, the initiating step in the pyrolysis reaction sequence was
proposed to be:
NH3 + M ---> NH + H2 + M A-I
where M represents any gas molecule. They also found evidence that- .:.
reaction which forms NH3 is likely to be present in the decompositioi
chain reaction sequence, but were unable to identify the nature of
this reaction.
£ The decomposition of NH3 in a quartz vessel was first studied by
Bodenstain and Kranendieck C2 I using a manometric method. The amount
of surface area present in the reactor was varied by the addition of
quartz fibers. They concluded that within the temperature range of
their study (1063 K to ll3 K), the reaction appeared to be first order
and was zntirely heteroceneous in nature. Further, they found no
change in the reaction rate when H or N2 additions were made to the
system.
BI

19
Hinshelwood and Burke [3 I investigated NH3 decomposition in a
quartz vessel for temperatures as high as 1323 K. They also concluded
that the reaction was dominated by the heterogeneous component an.d
demonstrated a first order dependence on NH3 . Additions of H2 to the
reactor decreased the reaction rate while N2 additions were ineffective.
Christiansen. and Knuth [4 ] suggested the following mechanism
for the heteroceneous pyrolysis of NH3 in a quartz vessel:
NH3 +S < NH + H + S A-2
NH < NH* A-3
NH* - NH3 <-- N2 + 2H A-4
where S represents a surface site. Their experiments were carried out
in a reactor vessel having a surface to volume ratio (S/V) of 1 and a
Surface area of 0.02 M2 . They concluded that the forward component of
reaction 2-2 was the rate limi.ting step and over the temperature range
of 1062 K to 1132 K, this reaction was characterized by an activation
enercy of 43 + 5 kcal/mole with an Arrhenius type frequency factor of
4.E x IO S
The investigation of Russow and Pewsner [5,] into the deccmposi-
tion of NH3 in a quartz reactor demonstrated that the reactihn follc'.ed
33a first order dependence with respect to NH 3 partial pressure. They
reported an activation energy of 38.2 kcal/mole for the pyrolysis
reaction.
The decomposition of NH3 on quartz was reported by Szabo and
Ordogh [6 ] to follow a 1/2 order dependence with NH- pressure at 913 K
and a first order dependence at 10i3 K. The reduced order of reaction
at 912 K was reported to be a result of H2 competing with NH3 for ad-
....i m • m mlm m ml Iml " l 1 I

20
sorption sites on the quartz reactor wall. The presence of H2 or 02
in the system was found to decrease the reaction rate while no reaction
rate changes were observed when N2 was added. Initial partial pressures
of NH3 ranoin. from 6.6 X 10³ Pa to 2.5 10 4 Pa were tried, but no
chances were observed in the order of reaction over this range.
An activation energy of 34 + 2 kcal/mole for the decomposition of
aNH on quarz7 was reported by Voelter and Schoen C 7]. The frequency
factor associated with an Arrhenius type temoerature.dependence was
560 s-, but they did not report the surface area of the reactor used.
*'m Over the temperature range of 1023 K to 1173 K, the reaction was found
to be first order with respect to NH3 pressure.
Kelvin C 8" utilized an infrared spectrometer to measure the out-
let NH3 composition from a plug flow quartz reactor over the tempera-
ture range 833 K to 1373 K. He found that the reaction rate varied
with the reactor S/V to the 0.75 power, confirminq the heterogeneou.
nature of the reaction. Hydrogen was found to exhibit a strong in-
hibitory effect on the decomposition reaction nature due, primarily,
to a reaction between NH radicals and H2 , which forms 1H 3. Additoinq-
of N2, Ar or He to the reactor resulted only in a diiutent effect.
.2'
II

21
The Thermal Decomoosition of PH3
The decomposition of PH3 in a quartz reactor was first studied by
van't Hoff and Kooj C 9]. They found the reaction to be first order
in PH3 pressure over the temperature range 310 K to 512 K. The reac-
tion was believed to be heterogeneous as a result of the increase in
reaction rate, which occurred upon the addition of ouartz fibers to the
system. An activation energy of 46.4 kcal/mole was reported.
Trautz and Bhandarkar 0iol reported a transition from hetero-
ceneous to homogeneous reaction kinetics at 940 K for the decomposition
of PH, in a porcelain bulb. They reported activation energies of 59
kcal/mole for temperatures below 940'K and 116 kcal/mole for tempera-
tures above 940 K. Based on t~he larce decree of scatter in their re-
sults.and the fac, that other investigators have not seen this transi-
tion, it is doubtful that a homogeneous decomposition reaction was
actually observed.
Hinshelwood and Topley Cllj studied the decomposition of PH3 in
3 22155 cm quartz bulb with surface areas of ZO cm- to 1600 cm2 . They
concluded that in the temperature ranoe 8L9 K to 1042 K, the reaction
was first order and behaved in a heterogeneous manner with an acti-
vation energy of 46 + 4 kcal/mole. The reaction rate was found to in-
crease with increasing S/V to the 0.8 power.
Oevyatykh et al. C12] studied the decomposition of PH3 on glass
and Si over the temperature range 740 K < T < 822 K. They found PH3
decomposition to be first order with activation energies of 4'..2 kcal/
mole and 5E.3 kcal/mole on the class and Si surfaces, respectively.
The deccmoosition of SbH 3 was studied on an antimony surface and was
found to have an activation ener-v of 7.7 kcal/mole. The SbH3 decom-
position reaction was investicaed o,- the temperature range 298 K <
Lk mm n a a n g I lOI INB B B " l

* 22
T < 364 K and the reaction order was observed to change from half or-
der at 298 K to first order at 364 K.
The Thermal Decomoosition of AsH3
The decomposition of AsH 3 on glass, As and Sb has been studied by
Tamaru C13]. The reaction was found to proceed most rapidly on the Sb
surface and slowest on glass. Adding H2 to the system had no effect
on reaction rate and no isotopic exchange was observed when 02 was
added. Tamaru proposed that the reaction mechanism consisted of AsH 3
adsorbing on the surface followed by sequential stripping of the hydro-
gen atoms off of the As atom. He believed the rate determining step
to be the removal o. the first H atom and assigned an activation energy
of 23.2 kcal/mole to this reaction. Tamaru C141 later attempted the
calculation of the reaction rate constants for AsH_ and SbHJ decompo: i-
tion on As and Sb surfaces using a model based on activated complex
theory. His predicted rate constant for AsH 3 decomposition was iix
orders of magnitude below the observed value while the predicted rak-r,
cznstant for SbH 3 was two orders of magnitude low. The restrictive
assumptions, which recuired all of the hydrogen bond energies to be the
* same and all partition functions to have the value of one, were puba.
bly the reasons for the poor results.
Oevyatykh et al. C15] found that the decomposition of AsS 3 on a
*Si surface obeyed first order kinetics and was characterized by an
activation energy of 50.9 kcal/mole. Their experiments were condLlctJ(;
from a temperature of 650 K to 707 K(.
*• Kedyarkin and Zorin (16] reported an activation energy of 25.5
kcal/mole, in acod agreement with that of Tamaru C131, for- the decom-
Position of AsH 3 on As. They found the reaction to be first order with
nS, wm mmmammu mum ~ m ummlU|

23A
respect to AsH3 pressure and heterogeneous in nature. The tempera-m3
ture range of their study, however, was somewhat restricted (543 < T <
583 K).
The only reported study of AsH 3 decomposition on a quartz sur-
face was undertaken by Froiov et al. C17]. Their investigations were
carried out on quartz, Ge, Ga and GaAs surfaces over a temperature
rance of 699 K to 909 K. The activation energy for AsH 3 decomposition
on quartz was found to be 32.6 kcal/mole with an Arrhenius frequency-1 -
factor of 513 s . The activation energies for AsH 3 decomposition on
Ge, Ga, Te doped GaAs and Cr doped GaAs were reported as 54, 30, 45
and 27 kcal/mole, respectively, in the presence of H2 . When He was
used as the carrier gas in place of H2 , these activation energies in-
creased slightly. No explanation was provided for this observation.
Their experimiental apparatus consisted of an open tube coupled to an
infrared spectrometer. The surface area or surface to volume ratio of
the reactor was not reported.
i
a
24
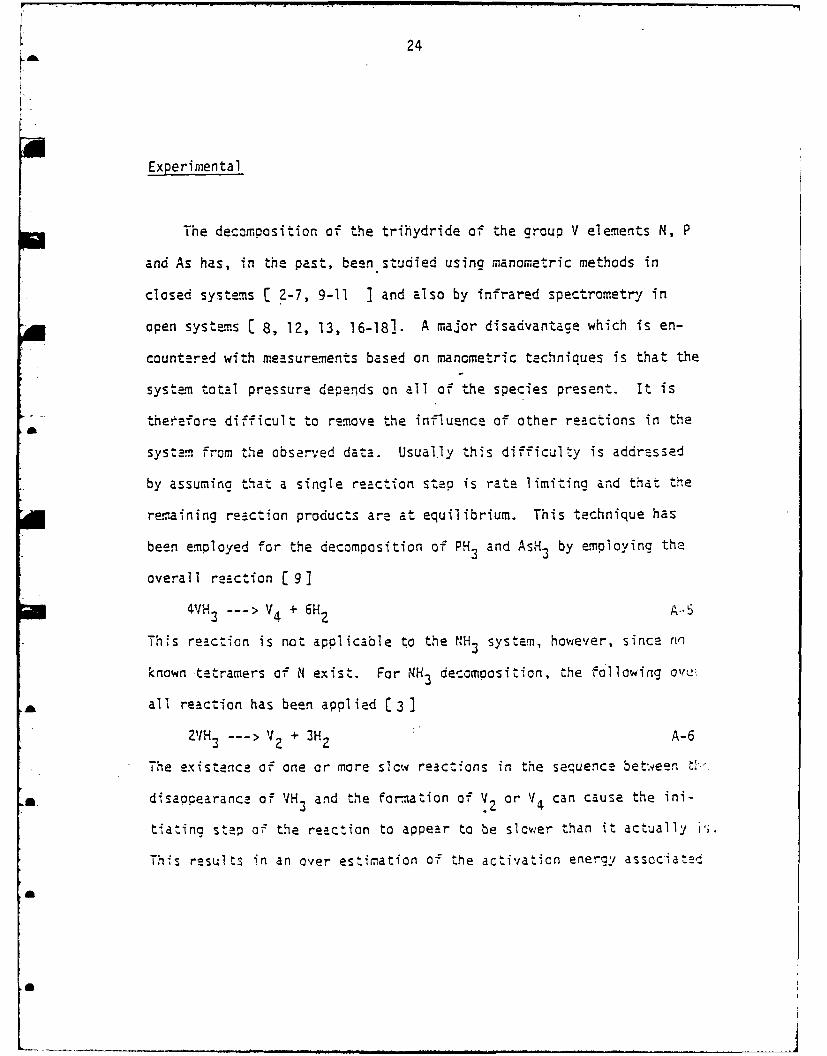
Experimental
The decomposition of the trihydride of the group V elements N, P
and As has, in the past, been studied using manometric methods in
closed systems C 2-7, 9-11 1 and also by infrared spectrometrj in
open systems [ 8, 12, 13, 16-181. A major disadvantace which is en-
countered with measurements based on manometric techniques is that the
system total pressure depends on all of the species present. It is
therefore difficult to remove the influence of other reactions in the*
system from the observed data. Usual.ly this difficulty is addressed
by assuming that a single reaction step is rate limiting and that the
remaining reaction products are at equilibrium. This technique has
been employed for the decomposition of PH3 and AsH 3 by employing the
overall ree-ction C 9 ]
4VH 3 ---> V4 +6-
Ths reaction is not applicable to the NH3 system, however, since (n
known tetramers of N exist. For NH3 decomposition, the following ovc2
* all reaction has been applied C3 ]
2VH3 ---> V2 + 3H2 A-6
The existence of one or more slow reactions in the sequence bet.qeen t-
* disappearance of VH3 and the formation of V2 or V. can cause the ini-
tiating step of the reaction to appear to be slower than it actually iU;.
This results in an over estimation of the activation energy associated
a
ai
25
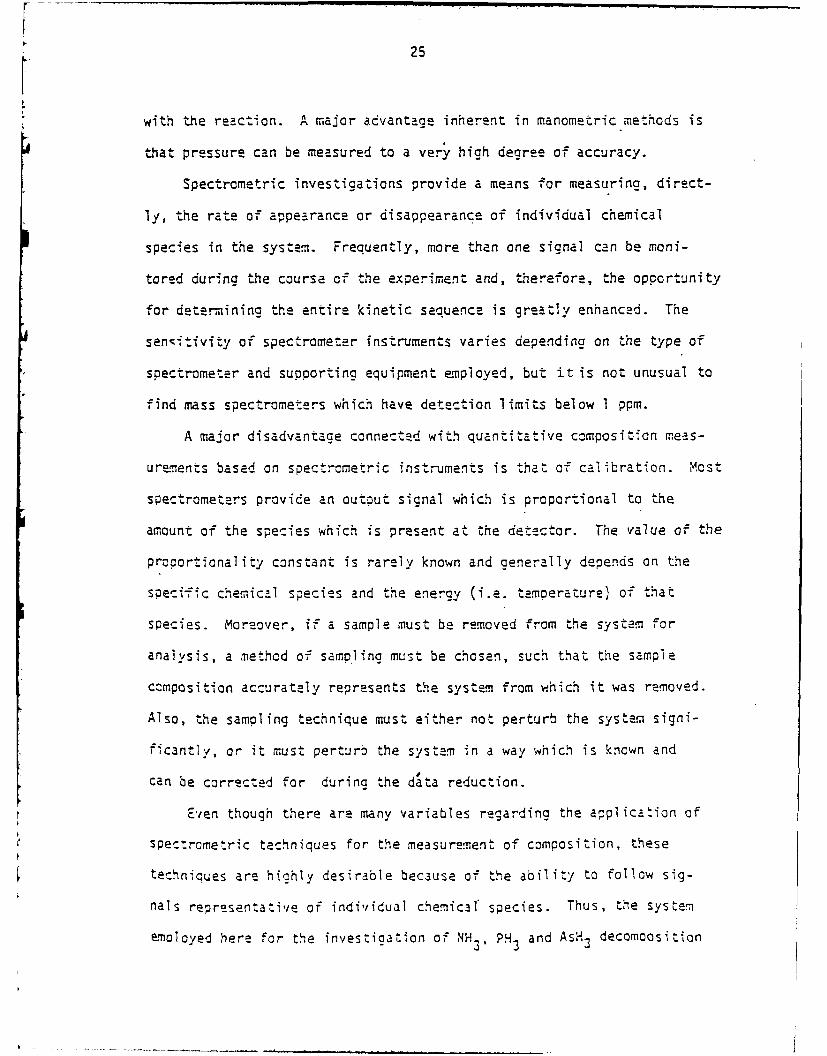
with the reaction. A major advantage inherent in manometric methods is
that pressure can be measured to a very high degree of accuracy.
Spectrometric investigations provide a means for measuring, direct-
ly, the rate of appearance or disappearance of individual chemical
species in the system. Frequently, more than one signal can be moni-
tored during the course of the experiment and, therefore, the opportunity
for determining the entire kinetic sequence is greatly enhanced. The
sensitivity of spectrometer instruments varies depending on the type of
spectrometer and supporting equipment employed, but it is not unusual to
find mass spectrometers which have detection limits below 1 ppm.
A major disadvantage connected with quantitative composition meas-
urements based on spectrcmertric instruments is that of calibration. Most
spectrometers provide an outpu t signal which is proportional to the
amount of the species which is present at the detector. The value of the
proportionality constant is rarely known and generally depends on the
speci-fic chemical species and the energy (i.e. temperature) of that
species. Moreover, if a sample must be removed from the system for
analysis, a method of sampling must be chosen, such that the sample
composition accurately represents the system from which it was removed.
Also, the sampling technique must either not perturb the system signi-
ficantly, or it must perturb the system in a way which is known and
can be corrected for during the data reduction.
Even though there are many variables regarding the application of
spec trometric techniques for the measurement of composition, these
techniques are highly desirable because of the ability to follow sig-
nals representative of individual chemical' species. Thus, the system
emoloyed here for the investigation of NH3 , PH3 and AsH 3 decomoositionPH3an s

& 26
is based on a quadrupole mass spectrometer coupled to a constant
volume reaction tube through a sampling orifice. This technique
provided real time monitoring of the reaction gas phase composition
while perturbing the reacting system in a known manner which was
easily corrected for during data analysis.
Excerimental Aooaratus and Method
A schematic representation of the equipment used during the in-
vestigation of NH3, PU3 and AsH 3 thermal decomposition is shown in
Figure A-1. Due to the extremely toxic and flammable nature of the
oases involved, hooded enclosures were constructed around the storace
area for the cas cylinders and the reaction chamber. These enclosures,
along with the vacuum pump exhaust from the gas sampling system, were
vented through the laboratory exhaust hood. The exhaust gas from the
reaction tube was first passed through a Draeger class 83-P filter
before being vented through the laboratory exhaust hood. This was Th':
to remove any residual VH3 and its toxic reaction products from the
vented cases.
High pressure gas cylinders containing 4.3' NH3 , 10.07, PH3 aiid
10.03' AsH 3 in HZ were connected to a common stainless steel gas lint:
and solenoid operated valve for inlet to the reaction tube. Hydrogen
was provided as an additionl inlet to the reaction tube through a
separate gas line and valve. This arrangement allowed the reactor Lo
be charged with any of the available gases and allowed the gas in the
reaction chamber to be diluted with H if desired. Purge gas consisting
B of N2 or He was available through the AsH., PH3 or H2 purge assemblies
and gas lines. A capacitance manometer was used to monitor the pressure
in the reaction tube over a range of 100 Pa to l0 5 Pa with a precision
o W.l .

a 27
0 M~
S.- c 1
U'.U
-S-
ae
A- '
ai
a c
'a-

28
The reaction tube consisted of a 54 cm long by 6 cm O.D. quartz
tube placed inside of a three zone Marshall furnace (model 1169-5) and
is shown in greater detail in Figure A-2. A temperature profile
which was constant to within 2 K across the length of the reaction
tube was obtained by placing the tube inside of two Dynathernm liquid
sodium furnace liners and by controlling each of the electrically
heated furnace zones with individual Linberg Model 5944 heater con-
trollers. The flatest temperature profiles were obtained when furnace
zones 2 and 3 were operated with identical setpoints and zone I was
operated at a setpoint 20 K below that of the other two zones.
Thermocouples were located at positions 12 cm, 25 cm, 50 cm and 62
cm into the furnace. These positions were chosen based on previous
measurements which demonstrated that the temperature profile from 16 cm
thrvuch 54 cm was flat to within 0.5 K. At positions less than 16 cm
into the furnace, the temperature drops off due to heat losses near
this end of the furnace. Positions from 54 cm to the end of the re-
action tube typically showed the highest temperatures in the furnaci:,
but this was compensated for by lowering the setpo.int in zone I. Fi;-
brick insulation was placed at each end of the furnace in order to
minimize the heat losses. The system was limited to an operating ' -of 673 K to 1273 K due to functional and safety constraints imposed by
the furnace liners.
The inlet tube to the reactor consisted of a 40 cm lona, 6 mn o.rI.
quartz tube which extended outside of the furnace and was mated to a
stainless steel tube through a stainless steel fitting using viton a-
rin-s as seals. Sampling of the gas in the reaction tube was accom-
Plished by continuously drawing a sample through a small orifice

29
CAC
*1 U
'44 J
C 14-j
olU

30
(nominally 0.1 n in diameter) at the end of the reaction tube.AMFurther discussion of the gas sampling system and mass spectrometer
is provided in Appendix S.
The use of an orifice for obtaining continuous gas samples from
the reaction tube represents a significant perturbation on the re-
acting system and, therefore, must be considered in the data analysis.
As is described in Appendix B, the mass spectrometer provides an output
signal which is proportional to the partial pressure of the chemical
species present in the reaction chamber. The partial pressure of each
species changes due to participation in chemical reactions and the
continual bleed on the reactor caused by the gas sampling system. A
species balance on the reaction volume yields the following equation
dP= RT A-7-d iV i-dt
where: Pi = pressure of species i
Lr, = chemical reaction rate for species i
ni = rate of molar loss of species i through the sampling
orifice
V = system volume
Coulson et al. C19 ] have analyzed the flow of a compressible fluid
through an orifice and have shown that for an isentropic process, crit-
ical flow is obtained when
Pd 2 k/(!<-l) A-
u
* where Pd is the downstream pressure, Pu is the upstream pressure and k
is the ratio of the heat capacity at constant pressure to the heat
capacity at constant volume. The heat capacity ratio ranges frcm 1.13

* 31
(PH3) to 1.6 (He) for the gases used in these experiments. Therefore,
keeping the ratio of the reaction tube pressure to the first vacuum
stage pressure below 0.49 will assure that all of the gases flowing
through the sample orifice are at critical flow. During the experi-
ments, the partial pressure of any measurable gas in the reaction
chamber was greater than 500 Pa. As is described in Appendix B, the
operating pressure of the first vacuum stage was between 10 and 50 Pa.
Thus, the requirement for critical flow was always met.
Applying the results of Coulson et al. r 19] to equation 5-3
yields the following relationship
dP. A Ke e (RT )/2A= ri - Mq. ' iA- 9
where A = CDA0
C0 = orifice discharce coefficient
A0 = orifice diameter
M. = molecular weight of species i
and
Ke =Ck( kI2)(kl)/(k-l) 1/2 A-10
The variable Ae, which represents the product of the orifice dia-
meter and discharge coefficient, is unknown since a sufficiently accu-
rate value for the orifice diameter is not known and the discharge co-
efficient is a function of the orifice Reynolds number. A relationship
between A., gas molecular weight and system temperature was therefore
determined exerimentaily using H2 , He, N2 and CO2.
It has long been recgonized that catalytic surfaces become less
active the longer they are in use, but usually e.xhibit a relatively

A32
constant period of activity following an initial period of deactivation.
The quartz reactor surface was pretreated prior to the experiments by
pressurizing the tube to 130000 Pa with hydrogen at a temperature of
1073 K for 48 hours. The NH3 and AsH 3 decomposition experiments were
repeated several times (days apart) in order to look for chances in the
catalytic activity. No chances in activity were observed. Between ex-
periments, the reaction tube was either maintained under vacuum or a
helium pressure of approximately 105 Pa.
The procedure employed for the collection of rate data was the same
* for each g roup V trihydride. Each trihydride was investigated over a
full range of temperatures before the next was admitted to the system.
Anonia was studied first followed by phosphine and finally arsine.
The desire to obtain a temperature profile which was as flat as
possible along the length of the reaction tube required the suppression
of all of the heat losses in the system. Thus, increasing the temper-
ature of the reactor could be accomplished quickly (-200. K/hr) while
decreasing the reactor temperature was a slow process. Therefore, mros:"
of the data taken for each trihydride was acquired in increasing order
*of temperature. This procedure was not strictly adhered to however,
since eventually, the next higher temperature investigated resulted in
reaction rates too fast to be followed with the current mass spectro-
meter configuration. It was therefore not unusual to allow the reacti-
to cool so that rate data at interrMediate temperatures could be gatheweL
This occurred most frequently for AsH 3 and occasionally for PH3 .
The laboratory did not have the capability for automated control
Of the mass ,ooctrcmeter. Each scan of mass to charge ratio, there-
fore, wias intiated manually. The fastest rate at which data could be
0

33
reliably scanned and averaged by the mass spectrometer and chart re-
corder was one scan every 10 seconds. This made it difficult to follow
reactions with half lives less than 30 seconds since relatively few
data points could be collected before the species signal was comparable
to the background signal or instrument noise.
The decomposition of NH3 was monitored by following the NH2 peak
at m/e = 16. This peak was followed rather than NH3 since the desorp-
tion of H20 off the walls of the second vacuum stage in the mass spec-
trometer caused a large OH' background peak to be present at m/e = 17.
The decomposition of PH3 and AsH 3 were followed by observing the
entire fragment ion pattern V*, VH', VH2 and VH3 at m/e = 31, 32, 33
and 34 for PH 3 and m/e = 75, 76, 77 and 78 for AsH 3. Io significant
background was observed at these mass -to charge ratios. The levels
of confidence for the PH3 and AsH 3 results are, therefore, much hicher
than that for NH3.
Tie procedure employed for these experiments was to first evacuate
the reaction tube and then bring the reactor to the desired temperature.
The reactor was then charged with the desired trihydride by opening the
appropriate solenoid operated valves and monitoring the system pressure
by means of the capacitance manometer. The system was charged to a
5 3 4 3pressure of 1.3x10 + l0 Pa for the M!3 experiments and 9.Zx1O + 103
Pa for the PH3 and AsH 3 experiments. The amcunt of time required to
charge the reactor was between 3 and S seconds. The first mass spec-
trometer scan was begun 15 seconds after the valves were closed. This
delay was primarily due to the restricticns imposed by manual operaticn
of the system (time required to close valves, start the chart recorder
and initiate the mass spectrometer scan), but also provided sufficient
time for the,al equ'librium to be established.

34
The amounz of time required for the radial temperature profile
in the reaction tube to be flat within 0.1 K may be estimated from
the following analysis. Neglecting natural convection and heat losses
from the ends of the reaction tube, the radial temperature profile
as a function of time is found from the solution of
1 oT d2T 1 CT A-1
radr
where a is the thermal diffusivity of the gas in the reaction tube.
Carslaw and Jaeger [20 ] have solved equation A-fi subject to the
boundary condition of zero initial temperature, constant wall temper-a
ature and radial symmetry. The result is
0T(l 2 J(anr) e 2 at A-12SnJl anR)
In this equation, Tw is the re-ctor wall temperature, R is the reactor
tube radius and the eiQenvalues, an, are the roots of the equationJ (an R) = 0 A-13
Since t.he reaction tube contained at least 90' H2 at all times, h-
thermai diffusivity of H2 was used to evaluate equation A-i. A furthe.
assuPtion inherent in equation A-12is thatais invariant with respect
to temperature. This is not true for H2 as a goes as approximately T2
£21]. Hcwever, a worse case calculation cAn be perfo ed by evaluating
a at the initial temperature (300 K) of the gas. The average and can-
terline temperatures in the reaction tube are shown in Figure A-3.
Five eigenvalues were used in the evaluation of equation A-12 to achieve
this result. The reaczor centerline temperature was found to be within
Q.Ql of the wall temperature (e.g. 0.1 K at Tw = 1000 K) for times
gre ter than 7 seconds. Evaluating a at' higher temperatures decreased

A 35
0.8
0.6C.) f-
0.4.,
0.2
010 24 68
T i me (s)
Ficure A-3Reaction 7ute 7emoerature Ouring Heating

Cm 36
this time sharply (e.g., evaluating a at 1000 K required only 1.9 s to
achieve the same results). The inFluence exerted on the thermal dif-
fusivity by the presence of VH3 in the system is on the order of 10%
to 15"0. This is considered insignificant relative to the choice of
an appropriate temperature for evaluating a. Thus, based on the re-
sults depicted in Figure A-3, it is concluded that the IS s delay,
between charging the reactor and the initiation of data collection,
was sufficient to allow the gas in the tube to reach thermal equilibrium.
Mass spectrometer scans were made every 10, 30, 60 or 120 seconds,
depending on the reaction rate, and data was taken either for 1200 se-a
conds or until the signal was too small to be reliably measured. Back-
around signal measurements were made before and after the decomposition
data were acquired at each temperature in order to determine whether or
not the VH3 backaround signals were increasing with system exposure to
the VH3 species. A slight increase in PH3 and AsH 3 background was no--
ticed over the course of the experiments, but the change at any one
data gathering session was insignificant. Changes in the NF, backgrouno.;
could not be observed due to the larqe Hz0 background signals present.
£d
B
• 0• i | I " i i

37
Results
Before the thermal deccmposition rate data could be taken, it was
necessary to characterize the parameter Aes which represents the sample
orifice area and orifice discharge coefficient, in equation A-9. As
this parameter was expected to be dependent upon molecular weight and
temperature, the gases H2 , He, N2 and-CO 2 were used to determine,
epirically, a correlation for.Ae over the temperature range 600 K <
T < 1300 K. For a nonreacting system equation A-9 can be integrated to
yield Ailn(P/P$) - e Ke (RT )1/2t .-
A-14V (M t -1 tA1
w
where Pi is the initial pressure of species i. The heat capacity ratio,
k, which is needed to evaluate K was calculated from the correlationse
shown in Table A-I and from using the relationship C. = Cp - R for an
ideal gas. From equation A-14, it is apparent that one merely needs to
follow the decay of pressure in the reaction tube in order to obtain
a value for A This was done for the gases in Table A-i over the
temperature range previously mentioned and the results are shown in
A Figure A-4. The lines in this figure represent the correlation-9 0.07 -13-
Ae = 3.99 x 10- (Mw) - 5.6. x 101T A-15
where Ae has units of I2 . This correlation predicted values of Ae which
were lower than the actual values for high molecular weight gases.
However, as will be discussed in the error analysis, this shortcmir
was crnl/ imccrtant for -t;e lovest temperature AsH3 data.
LO

38
Table A-i
Hest Caoacitv Correlations for the Gases Used in these Exceriments
Gas C (Cal/mole - K)
p
F. 15.256 + 0.00212T - 59060/T 2 - 1.462 mT
He 4.992
N2 6.524 + 0.00125T - IxIO -T2
CO2 6.214 0.01047 - 3.545042-6T 2
NOTES: The correlation for H2 is from Table C-6The other correlationZ are fits to data from the
JANAF Tables C21].
-I• m u, .W imd k mawd((k- mmml i mm mam~~iillI " ' . .

h-A 39
2.0
CO
< -i
1.0600 700 800 900 1000 1100 1200 1300
Temperature (K)
Figure A-4Ori-Fica Calibration Results
(H 2 , He, N a21 CO2)

40
The decomposition of the group V trihydrides was followed in
accordance with the procedure outlined in Chapter Five. The compos-
Ition versus time data were similar for all of the group V trihydrides
studied, thus succesting a ccamon mechanism for their deczmrccsiticn.
This contrasts with the results of previous investigators C 9-13, 17]
who concluded that the decomposition of AsH. and PH. were strictly.3 a
first order and were unaffected by the presence of H2 in the system.
The results presented in this chapter clearly indicate that the pre-
sence of H2 strongly influences the decomposition rate of NH3, PH3 and
a AsHS.
The data taken was insufficient to identify all of the reactions
taking place in the decomposition of VH3 into V 2 and V4. However, the
following segment of a mechanism suggested by Kelvin C8 ] for NH3 de-
composition adequately described the loss of VH3 from the system.
VH3 (g) + S K VH3 (ad)
VH3 (ad) -- VH(ad) + H2 (g) A--17
VH(ad) k! Products (H2, V2, V4 )
Equation A-16 represents a Langmuir adsorption isotherm C 22]
impl-ies that the concentration of VH3 adsorbed on the surface of U:c
vessel is at equilibrium with the vapor phase. The fraction of sur.
face sites covered by VH3 molecules is given by f 22]
KPVH 3 % =A-1 1T+K?~iH 3 A-9
where K is the equilibrium constant for reaction A-16. From reaction
A-17, the rate of VH3 decomposition is
r k 1'<P'IH3k -KPH3 + k PHC'H(ad)] A-20

41
where [VH(ad)] is the concentration of adsorbed VH molecules. Assum-
ing that [VH(ad)] is at steady state equation A-20 becomes
kI KPVHp kI k KPIH3 PA?I KPVH1 (i KPVH3) (k3 +k2PH2 )
The results of other investigators have demonstrated that first orderkinetics are often observed for NH3 , PH3 and AsH 3 decompositicn under
the conditions of constant H2 pressure C 2-17]. Based on the reaction
rate expression in equation A-21, apparent first order behavior can be
observed only if KPVHZ<<l. Thus,
r = kIKPVH3 (,.2 P. 2 + 1)- A-22
Combining equation A-22 with equation A-9 produces the following ex-pression for the total loss rate of VH3 from the reaction tube
dPVH3 3k2 AeK e
d----- KPVH k PH2 + l) - (RT1)/2] A-23V Mw
The pressure of Hz in the system waz controlled by the bleed im-
posed on the reactor by the gas sampling system. Therefore, applying
equation A-14
& PH2 = P,2 e-H2t A-24
,mhere al 2 represents the constants in equation A-14 evaluated for H2 at
the system temperature and P*2 is the initial pressure of H2 in the
reactor. Strictly speaking, equation A-24should contain a term for the
production of H2 resulting from the decomposition of VH3. This term was
nelect'ted since most of the hydrogen in the system was present as a re-
sult of the initial gas charge (>90% H2 ) and the gas sampling system
removed H sruch faster than it was produced by the decomposition reaction.

A= 42
Substituting equation A-24 into A-23 and integrating gives the result
nPIH3) 'IK i+k3' H12 2- = (kiK + 4H3 )t -. In l 2 A-25
-k3' HZ
Equation A-25 employs four reaction constants (K, kl, k2, k3 ),
however, only two parameters ( kIv and k2/k,) are separable for fitting
the rate data to the model. For all t > 0, the argument of the logo-
rithm in the second term of equation A-25 is always less than unity.
Therefore, this tern causes the rate of change of ln(P°/P) to be less
than that due to the first term alone. At long times, the second term
* in equation A-25 becomes approximately constant and a linear relation-
ship between ln(,°/P) and t is obtained.
ihe observed rate data are plotted.in Figures A-5 , A-6 and A-7
for NH3 , PH3 and As.3 , respectively. These data were fit to equation
A-25 using a maximum likelihood generalized least squares algorithm.
The solid lines represent equation A-25 with the parameters listed in
Table A-2. For an irreversible first order reaction, a plot of In(P>iP')
acainst time would yield a straight line. This type of relationship
was observed for AsH 3 and PH3 at high temperatures, but not for XH3
over the temperature range studied. All three systems studied yielded
straight line relationships at long times due to the hydrogen partial
pressure becoming small as a result of the gas sampling system. Gener-
* ally, as the forward reaction rate increased (i.e. kIK increased), Lhe
amount of curvature in the plots decreased due to the dominance of the
first term in equation A-25. It is clear from Figures A-6 and A-7
* that for temoeratures in e.xcess of 850 K for PH3 and 780 K for AsH 3,
these decomposition reactions may be accurately represented by an ir-
reversible first order reaction. Since the source zones of the GaAs

00
0 0 0 9210
Tie.s
Fiue -NH ec-os~a
7 oO 2 ",A8911 KU 92,C 0

44
3
aI I 1, , ,_.,
I-
C"-
0
a 0 300 600 900 1200Time (s)
Fiqure A-6PH.3 Oeccmcosition
7 712K, o 815K, 2A8K =-K, C2909K)

LL
2
0 5 3045 0
Tie-s
Figre A-
AS ecrtosto
71K 0 2K'-7IK" 6K M 79 , 76 ,<>3 K

a. 46
Table A-2
Reaction Rate Curve Fittino Results
I8 1T(K) klK(s - ) '2 x 10⁸(Pa - I s - ') Gas
k3
750 0.00284 3.37 NH3848 0.00336 3.85 NH3
898 0.00406 3.31 NH3949 0.00602 4.88 NH3
992 0.0115 10.8 NH31023 0.0292 27.8 NH3
1048 0.0843 82.5 NH3
712 0.00167 1.60 PH3
815 0.003 3.35 PH3
846 0.00933 2.54 PH3
855 0.0108 PH3
909 0 .043 PH3
712 0.00157 1.41 AsH 3
725 0.00314 2.67 AsH 3
748 0.00526 3.85 AsH 3
762 0.00812 4.41 AsH3
a 779 0.0C881 AsH3
796 0.0147 AsH 3
816 0.0288 AsH 3
fj

.47
and InP hydride CVD systems are always operated above 873 K, a model
using first order reaction kinetics is acceptable in these systems.
Analysis of Uncertainties in the Rate Data
The next it E which must be accounted for during analysis of the
rate data is the fact that the sample drawn from the reaction tube may
not acCurately represent the average concentration in the tube. Since
these decomposition reactions are believed to be heterogeneous in na-
ture, a sample obtained from the vicinity of the reactor wall may be
expected to show a areater decree of conversion than one in the center
of the reactor. Additionally, if a mass transfer barrier is present,a
the reaction may appear to be first order due to the rate of diffusion
being proportional to the ccncentration gradient. This latter concern
is investigated by considering the radial profile in an infini-tely long
cylinder with reaction at the tube wall. The analogous heat transfer
problem has been solved by Carslaw and Jaeger [20 ]. The result, trans-
•ormed to apply to a mass transport process is
J (a r) e-Oia 62
C (rc) 2C oan 2A-26n1l (bn + A2) dl(anR)
*where
A = Rkrn/0
b n = Ran
and the eigenvalues, an, are the roots to the equation
bJ1(b) - AJo(b) = 0 A-27
Oiffusion coefficients for NH3 , PH3 and AsH 3 in H2 , Di, may be
* calculazed using the Chapman-Enskog relaticn C 23] and viscosity in-
for.ation C 24]. The diffusion coefficients for these gases at 700 K

- 48
were determined to be 9.5, 6.7 and 3.9 c.-n/s, respectively. These
values may be corrected for other temperatures by assuming a T3 / 2 de-
pendence C 23 ].
In order to transform the reaction rate coefficients obtained in
this study to heterogeneous rate coefficients, they must be divided
by the reaction tube surface to volume ratio
krxn = k IK/7E.l A-28
Usinc the first 10 terms of equation A-26, the radial composition
profiles for NH', PH3 and AsH 3 were calculated for experimental con-
ditions listed in Tabie A-2. Since the reaction rate coefficient in-
creased much faster than did the diffusion coefficients, the greatest
amount of curvature in the radial composition profiles was found to
occur at the highest temperatures studied. Further, the curvature in
the comositions was areatest at times close to zero due to the cx.T-
position deoendenc2 of the reaction rate. Figure A-8 shows the cal -
culated radial composition profiles for AsH3, PH3 and NH3 at the
hichest temperature investigated for each of the species, for a tiiue
Es into each experiment. As is shown, the reaction tube centerline
* composition was approximately 1% larger than the composition at tkh
wall. This small disparity between the centerline and wall composikiol-..
indicates that mass transport was not a limiting factor in these ex-
* periments. Further, the composition profiles shown in Figure A-8
represent the greatest deviations from uniform radial compositions fm
all of the experi.ental conditions encountered.
* The difference in composition between a sample drawn frcm the end
of the reaction tube and the average composition in the reaction tube
is investiGated by determining the axial composition profile in the
S

49
AS. (816K)
PH3 (909K)
- 0.8
II
N.13 (1078K)
0 0.5 1.0
Dimensionless Radius
Figure A--8Radial Composition Profiles in the Reaction Tube
Ss into the Reaction

50
tube. This model assumes that only diffusion exists in the tube
(i.e. flow due to the sample orifice is neglected), the radial com-
position profile is flat, the reactor is isothermal and reaction
occurs only at the walls (and ends) of the tube. The analogous heat
transfer problem has been solved by Carslaw and Jaeger [20 J and the
result is presented here with the appropriate mass transport proper-
tiesg2h2h cos(az. e- (oa n + V)t
C(z,t) = C.l A-296l (h2 + a2)1 - h] cos(la n)
where: h = k rxn/Da
V = Zkrxn/R
1 = 1/2 reactor lenoth
The eicenvalues represented by an are the roots of the implicit
equation
an tan(lan) = h A-3f1
Fiure A-9 shows the axial composition profiles for AsH3 , PH3
and NH3 at 816 K in the reaction tube as calculated from equation A--'
usino the first 10 eigenvaiues. The average composition in the tube
corresponds to 99% conversion of the VH3 initially present in the Luk2.
The time required to reach this level of decomposition was determined
to be 190 s for AsH 3, 1127 s for PH3 and 2.08xi0 5 s for NH.. The laic2
gradient in AsH3 composition is due to the high rate of reaction aL
this temperature and the small diffusion coefficient for VH3 relati,, "
to PH3 and NH... The calculated PH3 and NH axial composition profiles
at 0 9 K and lOd8 K were much more exaggerated than those shown in
Ficure A-7 , but were less dramatic than that of AsH3 at 816 K.
.0

055:
50.
0iesols Oit.nc nt Raco
Fiur A-9
Axa cLsto rfl t36Kad91 eopsto
52
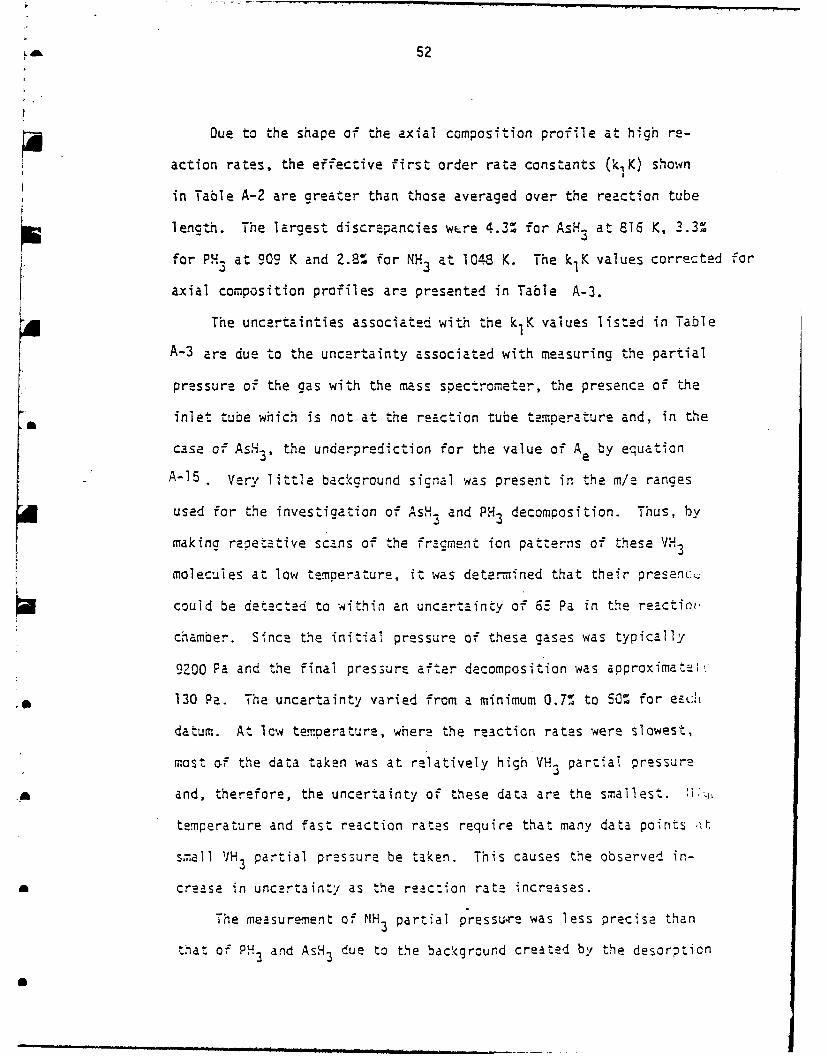
Due to the shape of the axial composition profile at high re-
action rates, the effective first order rate constants (k1K) shown
in Table A-2 are greater than those averaged over the reaction tube
lencth. The largest discrepancies were 4.3% for AsH 3 at 816 K, 3.3%
for PH- at 909 K and 2.8% for NH3 at 1048 K. The klK values corrected for
axial composition profiles are presented in Table A-3.
The uncertainties associated with the k1K values listed in Table
A-3 are due to the uncertainty associated with measuring the partial
pressure of the gas with the mass spectrometer, the presence of the
Ba inlet tube which is not at the reaction tube temperature and, in the
case of AsH 3, the underprediction for the value of A. by equation
A-15 Very little background signal was present in the m/e ranges
used for the investigation of AsHX and PH decomposition. Thus, by
making repetative scans of the fragment ion patterns of these VH3
molecules at low temperature, it was determined that their presenc,
could be detected to within an uncertainty of 65 Pa in the reactint,
chamber. Since the initial pressure of these gases was typically
9200 Pa and the final pressure after decomposition was approximate1 .
130 Pa. The uncertainty varied from a minimum 0.7% to 50% for ea:ih
datum. At lcw temperature, where the reaction rates were slowest,
most of the data taken was at relatively high VH3 partial pressure
and, therefore, the uncertainty of these data are the smallest. :1'.
temperature and fast reaction rates require that many data points i..
small VH3 partial pressure be taken. This causes the observed in-
a crease in uncertainty as the reaction rate increases.
The measurement of NH3 partial pressure was less precise than
tnat of PH3 and AsH 3 due to the background created by the desorption
B o m ~Um~l mlwNi. ~mwl| m

53
Table A-3
Corrected Rate Coefficient Results
T(K) k1 K(s- ) Uncertainty (:) Gas
750 0.0024 1z NI3
848 0.00336 13 NH3
898 0.00405 15 NH3
949 0.0060 16 NH3.
992 0.0114 16 NH3
1023 0.288 18 NH3
10483 0.0827 26 NH3
71Z 0.00167 4 PH3
815 0.00336 5 PH3
846 0.00929 7 PH3
855 0.0107 8 PH3
909 0.0424 14 PH3
712 0.00155 6 AsH 3
726 0.00311 4 AsH 3
748 0.00519 5 AsH3.I
762 0.00798 5 AsH 3
779 0.0C862 6 AsH 3
796 0.0144 8 AsH 3
816 0.0276 12 AsH 3
I

54
of H2 0 frcm the. walls of the second stage of the vacuum system.
Fluctuation in the background signal caused the uncertainty in the
measurement of NH3 partial pressure to be 130 Pa. This uncertainty
is exacerbated by the smaller concentration of NH3 in the cas cylin-
der (4.3%) compared to that of PH and AsH 3 (10%). Tne maximum.3
measured partial pressure of NH3 in the reaction tube was 5500 Pa
which yields an uncertainty of 2.40. The measure.mnent of 130 Pa of
NH3 carries with it an uncertainty of 100%. Therefore, the uncertaint'es
associated with determining the NH3 compositions are much hicher than
those for PH3 and As"3.
The tube provided for inlet of the cases to the reaction chamber
contained a volume of cas which was 0.4. of the volume of the reaction
chamber. The surface area of the tube was approximately 5Q of that in
the reaction chamber. An uncertainty of 2% was assigned to each rate
constant as a result of the presence of this tube.
The failure of equation A-15 to accurately predict Ae for high
molecular weight gases causes additional umcertainty in the kIK valteafor AsH 3. Based on the results for CO2 shown in Figure A-4 , it
appears that the predicted Ae value for AsH 3 should be at most 10%
low. The loss of gas due to the sampling orifice represents 1/3 of
the first te, m in equation A-20 for AsH decomposition at 712 K and
A even less at the higher temperatures. An uncertainty of 34 was
added to the uncertainty at 712 K and l% was added to the uncertain-
ties at 725 K, 748 K, 762 K, and 779 K.
A Oetermination of Activation Eneroies
The temperature dependence of the constant k1K is determined by
assuming an Ar-henlus type dependence for k
kAkI- ke~'E A-31

55
and relating the equilibrium constant K to the enthalpy and entropy
of adsorption through the Gibbs energy
K = e(AFadT Sad)/RT A-32
Thus, the temperature dependence becomes
k1K = (k e6Sad/R)e-(ca - wad)/RT A-33
where Ea is the activation energy of the forward reaction A-17 . The
data in Table A-3 were fit to equation A-33 and the result is shown
in Figure A-10 and Table A-4. Due to the strong influence the pre-
sence of H had on the decomposition reactions for Nku3 and PH3, tIe
low temperature rate constants were in poor agreement with equation
a A-32. Therefore, only the four highest temperature reaction rate con-
stants were included in the fit for these gases.
The apparent activation energies found by other investigators for
the dec:mposition of N.H3 , P, and AsH 3 on quartz are sunqn.arized in
Table A-5. The apparent activation energy found for AsH 3 in these
experiments is in reasonable agreemenc with that of Frolov et al. [17]
who used an open system and infrared spectrophotometer. The apparent
activation energy found for PH is approximately 10 kcal/moie lower
than that found by other investigators. The results of van't Hoff and
Kooj C 9] and Hinshelwood and Tooley CI1] were based on manometric
met.hods and, therefore, are expected to over estimate the activation
energy. This is due to reactions in the decomposition sequence whicha
may not have achieved equilibrium. The method employed by Devyatykh
et al. C12] was not presented.
The apparent activaticn energy found for the decomposition of0
NH- was significantly greater than that found by previous investi-
gators [ 4, 5, 7]. All of these investigators emoloyed manometric

56
-3 -- , ..
-7
-6 -
0.001 0.0012 0.0014
T- (K 1 )
Figure A-10Det ..ination of Activation Energies for Decomposition
NH3, 0 PH31 a AsH 3 ).

__ 57
Table A-4
Pre-exoonential Factors and Anarent Activation Ener es
Gas koe6S.-d/R(s - l) Ea &H (kcal/mole) Uncertainty (%)0 ad
N. 3 2 . 9Zxi 1 60.2 19
PH3 2.42xl07 36.5 9
AsH3 1.62x10 29.2 7
B
Table A-5
Aooarent Activation Eneries for VH, Decomoosition on Quartz
Gas Ea + 6Had(kcal/mole) Reference
AsH 3 32.6 17
PH3 46.4 9
PH3 46 ± 4 11
PH3 44.2 12
NH3 43 ±: 5 4
NH3 38.2 "5
NH3 33.7 2 7
0

58
methods for their experiments, but, sirce N2 and H2 are the only ex-
pected products of the decomposition reaction, it is doubtful that
their values are systematically high. Only 4 data points were used
to determine the apparent activation energy for NH3 decomposition in
this study and the highest point had a very large uncertainty (260).
Thus, the uncertainty associated with the NH3 results may be larger
than was estimated.
Assuming that the rate constants k. and k3 have Arrhenius type
temperature dependencies, it is expected that a plot of In(k 2/k3 )
versus time would yield a straight line. Further, the slope of this
line should be the difference between the activation energies for
the two reactions. This plot is shown in Figure A-I1. The AsH3
results and the high temperature NH3 results show reasonable agree-
ment with the suggested model. The PH3 results and low temperature
NH3 results are anomlous. eased on Figure A-l1, the activation
energy differences were 59.6, 8.0 and 22 kcal/mole for NH3 , PH3 and
AsH3 , respectively.
tmoiication of the Measurements on Other Reactions in the Decom-.
£ position Chain
The relative peak intensities for the mass spectrometer Fraq-.
ment ion pa-ttern of NH3 , PH3 and AsH 3 are shown in Table A-6. The
-A PH3 and AsH3 patterns found in this study agree reasonably well witi
those in the reference C25]. The poor agreement for the NH3 result-,
is due to the presence of the H20 background which dominates the sig-
nal at m/e = 17 due to the OH' fragment ion. Generally, some dis-
crepancies are expected in the relative peak intensities reported by
differenz insituticns due to the differences in operating parameters
* and geametrics of each mass spectrcmeter.

59
-13
-15B
c..
-16-
00
0.001 0.0012 0.0014
T-1 (:-)
Figure A-11Oeter-mination of Activation Energies
( NH3 , 0 PH3, A AsH 3 )
a

60
Tabl e A-6
Relative Peak Intensities for NH PHz, AsH 3
Ion m/e This Study Reference [25 J
N" 1 0. Z.2
NH' 15 18. 7.5
SNH 2 16 43. 80.
NH3 17 100. 100.
P, 31 32. 27.
PH+ 32 100. 100.
PH 33 25. 25.
PH+ 34 73. 77.
As- 75 54. 39.
AsM4 76 100. 100.-L
-
AsH 77 23. 29.
A
AsH+ 78 62. 92.
0
Ob,,Wa ,,,m, , l - ~ m ml

61
The mass spectrometer signals for PH , P, P2 and P4 are shown in
Ficure A-12 for the decomposition of PH3 at 855 K. Since the fragment
ion pattern of PH3 was known, the signal for P + was corrected for the
presence of PH 3' Unfortunately, the fragment ion patterns for P4 and
P were not known and therefore, it was not possible to correct the P
and P' signals for the presence of P4 and the P signals for the pre-
snece of P" If these patterns were known, it would be possible to
determine the rates of formation of P, P2 and P4 from the decomposi-
tion of PH3. Only a very small signal corresponding to P+ was ob-3" 3
served.
Figure A-13depicts the decomposition of AsH3 at 779 K and shows
the mass spectrometer signals for Asu', As', As' and As . The signals
in the As system are smaller than those in the P system due to the de-
creased electron multilplier gain at large m/e values. This is clearly
decnstrated for As+ (m/e = 300) where the maximum signal observed
(ZmV) was barely recognizable over the noise at the baseline. As in
the P system, the As signal was corrected for the presence of AsH 3,
but the influence of As2 was not accounted for since its fragment ion
pattern was unknown. No signal corresponding to As was observed.
In both the As and P systems, the V', V and V signals reach
maxima at the same time. This may be due to the V and V+ signals
being fragments of V since V4 is thermodynamically favored a" thp,
temperatures and pressures employed in the reaction tube. If thes.'
maxima did not occur in coincidence, one would be compelled to con-
clude that additional rate influential reactions may exist in the
formation of V and V4 from the deccm osition of VH Since this is
not the case, it aopears reasonable to assume that the decomposition of
e m m mmmmm mmmd im lll ~ am mmhm

62
600
IS0 0 0 0
00
0
-~400
p 2
10
0
300 300 ki-
Fiur A-1PH ecm-s -in t 55
200 P (xl3

-k 63
80
0s
00
00
0 0
600
40
2040
AsAs (O)AA A &A A, ,' ._
150 300 450 600
.0 rime (s)
Figure A -U1AsH 3 Decomposition at 779K

a
64
VH3 (ad) into VH(ad) is the rate limitinc step in the reaction se-
quenca and that V, V2 and V4 may be assumed to be at equilibrium.
Comoarison Between Ecuilibrium and Kinetic Models
for VH_ Oeccmcosition
The applicability of an equflibrium model to describe the de-
composition of VH3 in a hydride system reactor can best be investi-
gatad by modelling the group V source zone. Assuming an isothenal
reactor, cylinder geometry, plug flow and reaction only at the re-
actor wall, the steady state axial and radial VH3 composition pro-
files are found by solving [23]
dO 2C + dc = 0 d dCd v- Cr rd- A-34
dZ OZ r dr dr
where C is the concentration of VH3, v is the velocity of the plug and
0 is the diffusion coefficient for IH3 in H2. Assuming that C may be
separated into r and z components (C = CrC z) the partial differenziai
equation 6-35 may be written as two ordinary differential equations
d2C t dCz z = 0 A-35dzTz-- Dz-
a,
r2d2C dC- + avr2 A-35+ Z - - = 0 A-r
drZd
subjec: to the boundary conditfons:B
C = C. at z=O, 0 < r < R A-3Y
C is finite as z A-38z
&Z= k Cat r=R A-39dr rxn r
dr = 0 at r=O A-40
aQ

h65
A The axial composition profile, represented by equation 6-26, has the
solution
erZ Cr - z A-41=~C =i '.- (I a Izl* 4a0 /
where r. = v., ± (I A-422D
Applying equation A-38 requires C1 = 0 therefore,
Cz = C2Prz A-43
where the constant C2 is evaluated in conjunction with the radial
solution.
Equation A-36 is Bessel's equation which has the solution
Cr = AiJo(ar) + A Yo(ar) A-44
where J and Y are the Bessel functions of the first and second kind,
respectively. Since Y becomes infinite at r:O, the boundary condition
represented by equation A-40 requires that A2 vanish. Thus,
Cr = AIJo(ar) A-45
where the eigenvalue, a, is det-ermined from the solution of equation
6-40
dJ0 (ar) akrxn Jo(aR) A-46
dr 0 0 ~R)A4r=R
Equation A-46 is rewritten asakrx n
J -(oR Jo(aR) = 0 A-47
* which has an infinite number of roots. Thus, the solution to equation
A-34 is
C(r,z) : A.j (air) e - r - z A-48
where the constant C2 has been included into Ai . The constants Ai are
evaluated by applying the principal of orthogonality which yields the
* result

4 66
A. = a. R () di- A-49.ifrJ0(a r) dr
which was evaluated by numerical integration. Using five terms of
the series in equation A-48allowed the solution to converge to with-
in at least three significant figures for all of the cases studied.
Figures A-14 and A-15 show the residence time required to achieve
99' decomposition of AsH 3 and PH for various reactor diameters. This
degree of decomposition was chosen because the equilibrium compositions
of V2 and V4 remain essentially unaffected by any further decomposition
of VH3. Thus, if a hydride CVD systE is designed which yields a VH
decomposition of at least 99.', an analysis of the gas phase based on
the assumption of equilihrium will provide accurate results for the V2
and.V 4 conoositions. As is shown, hicher temoeratures require shorter
tube lencths in order to reach this level of conversion. Also, AsH 3
decomposes much faster than PH3 for a given temperature and tube dia-
meter. The increase in residence time with tube diameter is due to Ku
fact that the volume of gas per unit length of tube increases faster
than the surface area as the tube diameter increases (i.e., for a cyl W
der the surface to volume ratio goes as I/radius). Thus, the reactin.i
rate per volume decreases and therefore longer times are required to
reach the same degree of decomposition.The importance of including axial diffusion in the model is alsu
demonstrated by Figures A-14 and A-15 . The second derivative with
respect to axial position in equation A-34was set to zero and the
residence times were calculated at 873 K as functions of tube diameter.
As shown, the model neglecting axial diffusion grossly underpredicts
the residence time ( and therefore the reactor length) necessary to0

& 67
100 II
600
a)
0-0
....... ..
~ 0
0 2.5 s.0 7. in.
0 Tube Diameter (c7m)
Figure A-14Residence Tir,-e Required to AChijve 99'j AsH3 Decomposition

68
loo
80
C-
CUC
w -i
N
= 40 C!
aC
0 -0 2.5 5.0 7.5 1(J.
Tube Diameter (cm)
Figure A-15Residence Time Required to Achi&*ve 99, PH3 Oecomcosition
m3

69
achieve the desired decree of decomposition. These results were cal-
culated at a velocity of I cm/s which corresponds to 0.1 <Pe < Z
(Pe = 2Rv/0). At these Peclet numbers axial diffusion is extremely
im por taZnt . For systErns employing hicher velocities, and therefore
laraer Peclet numbers (e.q. Pe > 10), the irnportance of including axial
diffusion is dfiminished f 256
Hsieh C27 ] has studied the Graetz problem for heat transfer [28
(which includes a parabolic velocity profile) and compared the results
to a model using plua flow. He found that the plug flow model cave re-
sults which were conservative (i.e. predicted longer reactor tenat-hs
to achieve the same averace radial temperature) when compared to the
solution to the Graetz problem. Based on these results, -it is belileved
that Fioures A-14 and A-15 are also conservative in nature. Typical
hydride system CVO reactors emplocy a tube f-or the group V source zone
which is approximately 2 cnm in diameter and use a gas velocity of 1
cm/ s. Based on Figure A-14 and A-15, tube lengths o--1 10 cm and 30 cm
are req~uired to reach 9G9' VH3 deccopositi:on at 973 K for As' and PH,
respectively. At 873 K, these tube lenoths must be increased by
approximately a factor of three. Many hydri&: systemn reactors are be-
tween 50 cm and 100 cm- long. Therefore, it is ex pected that- an equi-
librium anatysis' for a systemn using AsH3 will yield acceptable- results
1:the source and mixing zone temnperatures are above-872 K. Source aiid
mixIng zone temperatures greater than 973 K are necessary in order for
an ecuilibrium analysis to apply to a system using PH,.
The AsH3 radial composition prof-Liles, 99Z. decomposed, are shown
forteperatures of- 872 K, 972 K and 1073 K in Fioure A-16 in a 10 cm
dilame'er reactor. The large diamete-r reactor was used in this
.6

70
1.5
0.5
0 1 2 3 4
Tube Radius (cm)
Figure A-16AsH 3Radial Composition Profile at 9901 Decompoosition

71
caiculation in order that some curvature in the radial composition
profile might be observed. The more pronounced curvature at high
temperatures -is due to the reaction rate increasing faster than the
diffusion coefficient with increasing temperature. Thus, at high
temperatures in large diameter tubes, mass transport limitations are
expected to become increasincly important.
S
te
p.

72
APPENDIX 8GAS SAMPLING SYSTEM AND MASS SPECTROMETER
A schematic representation of the mass spectrometer and gas sampl-
ing system coupled to the reaction tube used for the decomposition Ex-
periments is shown in Figure 6-1. The overall system consisted of a
three stace differentially pumped vacuum system which allowed a quadra-
pole mass spectrometer (which must be operated at pressure <lO- 5 torr)
to be used for the measurement of the gas phase composition in the
reaction tube (normally operated at 7DO-1000 torr). The objective of
the design was to provide a facility which would draw continuous gas
samples from the reaction tube in the form of a molecular beam. The
formation of a molecular beam precludes the opportunity for intermclecu-
lar collisions or wall interactions while the molecules travel from the
sampling orifice to the mass spectrometer ionizer. This condition
causes the composition of the beam to be "frozen in" at the compositi ,,
present just after the sampling orifice and, therefore, can be relate6
to the composition within the reactor. Due to conductance limitatioi7
in the tube leading to the skimmer orifice, the pressure was too hiy .
this tube to achieve the long mean free paths required for the form,,0.
of a molecular beam. This Appendix, therefore, discusses the desic,
philosophy and operating parameters cf the system and suggests desion
L. modifications which will result in a functional modulated molecular
beam facility. It should be noted that even though a molecular beaT,,
was not present for the decomposition experiments in this work, the
large signal intensities for AsH3 and PH3 combined with the extremely
small background signals at these mass to charge ratios, allowed very
accurate determinations of the vapor phase AsH 3 and PH3 compositions to
Sk
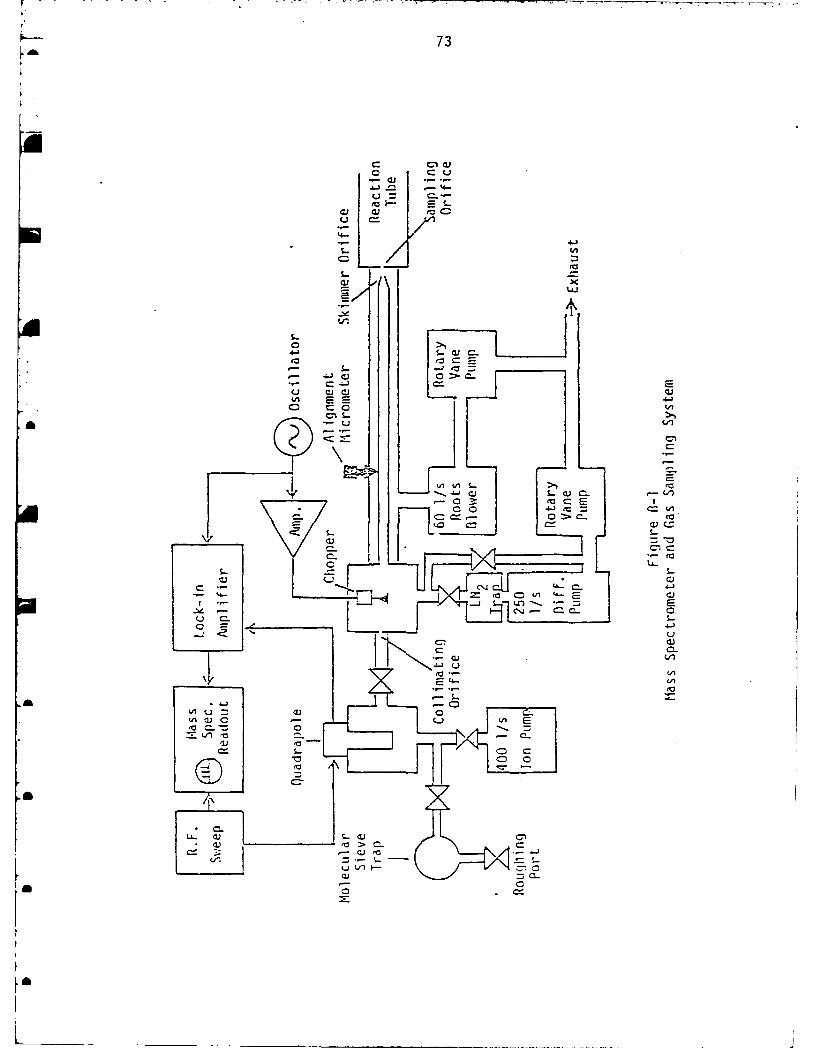
K 73
CC
g~- EL, cu a
a C- c
I-u
ea CMv 4-Ea
l.JJ
eC ~ ~ C-- -VI C i- i -
C7 C
LZ
u v,

74
be made. This was not the case for the NH3 decomposition experiments,
since a large background due to the fragment ions of H20 and N., which
were desorbing off the vacuum system walls, were present. A mc%'-uted
molecular beam facility would be expected to greatly improve the results
of the NH3 experiments.
The application of a modulated molecular beam mass spectrometer for
the measurement of gas phase compositions fn reactors operating at high
pressure (>ltorr) has received considerable interest and two of the most
complete publications regarding these systems have been presented by
* Dun et al. [29 ] and Foxon et al. [30 ]. Basically, the technique em-
ploys a very small sampling orifice (-0.1 mm diameter) across which
gases are expanded from the high pressure reactor into the first stage
of a vacuum system operating at a pressure of approximately 10-3 torr.
The pressure ratio across this orifice is very high which results in a
supersonic jet of gas in the first vacuum system stage with the orifice
being at critical flow. A second orifice, known as the skimmer orifir:2,
is then aligned with this gas jet not more than 0.5 mm downstream of thn
sampling orifice. The skimmer orifice, which is frequently conically
A shaped. and has a diameter approximately equal to that of the sampling
orifice, allows a fraction of the gas jet to pass into the second sLaye
This skimning effect causes the angular velocity distribution of the
Amolecules to be highly peaked in the direction of the mass spectrome
and therefore, the probability that these molecules will collide with
the vacuum system walls and participate in heterogeneous reactions is
* small. Furthermiore, the pressure in the second vacuum stage is usually
on the order of 10- torr. The long molecular mean free paths (500 M
for ,12 ) at this pressure preclude the chance for homogeneous gas phase
reactions to occur.

_75
During passage through the second vacuum stage, the molecular beam
is modulated by a motor driven chopper blade. The chopped beam then
passes through a collimating orifice (nominally 2 mm in diameter) and
finally into the ultrahigh vacuum system (operating at a pressure on
the order of 108 torr) where it encounters the ionizer of the quadra-
pole mass spectrometer.
The signal from the mass spectrometer is sent to a lock-in ampli-
fier which is locked to the frequency of the chopper. The output of
the lock-in amplifier therefore represents a frequency and phase corre-
lated signal which, in principal, contains information only abouta
species present in the molecular beam. In practice, however, molecular
species desorbing from the vacuum system walls which arrive in coinci-
dence with the modulated molecular beam are also detected. The objec-
tive of using a phase and frequency lock detection technique is to
markedly increase the signal to noise ratio (or signal to background
ratio) over that which is possible by an unmodulated measurement. This
greatly enhances the ability of the instrument to make quantitative
measurements down to very low levels of concentration (I ppm or below).
The mass spectrometer and gas sampling system shown in Figure B-1
was mated to the 60 mm quartz reactor by .fusing a 38 mm quartz tube
to the end of the reaction tube. The 38 mm tube was then connected to
the vacuum system using a compression type viton o-ring fitting.
The skiner orifice was fabricated from 10 mm quartz tubing. One
end was draw:n to a point and then scribed and broken. The desired dia-
meter of the skimmer orifice was obtained by sanding the drawn end of
the skimmer tube back until a channel was clearly visible and a thin
stream of alcohol was able to pass through it. A micrometer and lens
a f

76
was used to estimate the orifice diameter at 0.1 mm, but no method
of accurately determining the diameter was available. The skimmer
orifice was mated to the vacuum system using a compression type viton
o-rina fitting. Adjustment of the distance between the skimmer orifice
and the sampling orifice was accomplished by varying the amount of
skimmer tube which was inserted into the o-ring fitting. Alignment oF
the skimmer and sampling orifices was made possible by two micrometers
mounted through the walls of the first vacuum stace resting at richt
angles to each other on the skimmer tube mount. The reaction tube was
* filled with helium and the position of the skimmer orifice was rastered
until a maximum in the mass spectrometer signal for He (m/e = 4) was
observed.
A A chopper motor cooled by a water jacket was mounted inside the
secbnd vacuum stage. The motor (Globe model FC-75AI003-2) was desioned
to operate from 120 VAC at 400 HZ. An audio oscillator driving a poiel-
amolifier was used to vary the speed of the motor. The chopper hlade
was fabricated from 29 mm diameter brass by drilling a 7 mn hole in the
base for the motor shaft and cutting a slot 19 mm wide through the bra,
* This formed a chopper blade with a 50' duty cycle. Set-screws ,--re used
to hold the chopper blade onto the motor shar.
The UHV system was isolated from the first two vacuum system stages
A by a 2 mm collimating orifice and a gate valve. The background pressure
in tre UHV system when isolated from the second vacuum stage was 7xi0-
tr.
SThe quadrapoe mass spectromete2 head was an E.A QUAD 25C- using a
cross beam electron ionizer and dynode style electron multiplier. This
mass sectrometer has a sensitivity of 1C A/ton for N2 and resolution

77
of M/II>2M up to m/e = 500. The .electronics used to drive the mass
spectrometer head were those of a modified Finnican 3000.
The operating parameters for the mass spectrometer are shown in
Table B-1. These parameters are in accord with those suggested in the
Finnigan operator's manual except that the ion energy was increased to
7.1 V. This value of ion energy was chosen based on a maximum in peak
height which was observed for all m/e values. The peak height was also
found to be very sensitive to the emission current and electron multi-
plier voltage.
The first vacuum stace in the system was pumped by a 60 I/s roots
blower backed by a 12 I/s rotary vane pump. The pressure in this stage
was monitored using a thermal conductivity guage.
The second vacuum stage was pumped by a 280 I/s diffusion pump
backed by a 6 I/s rotary vane pump. A liquid nitrogen cryogenic tra'p
was placed between the diffusion pump and the vacuum system in order t:
rM prevent the diffusion pump oil from backstreaming into the vacuum sys-
tem. Pressure in the second vacuum stage was monitored using a tubu-
lated ion guage connected to a Granville Phillips series 260 contr iC1
A thermal conductivity guage was used to monitor the foreline pressure
of the diffusion pump.
The UHV system was pumped by a 400 I/s triode ion pump. A triode
style pump was chosen due to its increased ability to pump inert gasei
when compared to diode pumps. Pressure in the UHV system was monitored
using a nude ion guage connected to a Granville Phillips series 271 con-
troller. A thermal conductivity guage was located in the roughing line
for monitoring the pressure during rough pumping.

La 78
Tabl e B-1
Mass Soectrometer Oceratino Parameters
Ion Energy: 7.1 eV
db Electron Energy: 70.0 eV
Lens Voltage: 10.3 V
Extractor Voltage: 4.3 V
Collector Voltage: 29.0 V
Electron Multiplier High Voltage, -2.06 kVI
Emission Current: 1.05 mA
Preampli-fier Sensitivity: 10- A/V
Filter: 300 AMU/s

79
Pressure tapers in each of the vacuum stages are shown in
Figure B-2 for a reaction tube pressurized to 760 to.rrwith N2 at 300
K. These pressure tapers were determined by noting the pressures in-
dicated by the ion guages and first stage thermal conductivity guage
and then back calculating the tapers using standard conductivity cal-
culations [31 1.
The first stage is seen to operate at a pressure of 0.05 torrin
the region near the sample orifice and 0.03 torrat the flange leading
to the roots blower. The second stage pressure at the outlet of the
skimmer orifice is 1.4xlO- 3 torrfalling to 2xlO- 6 tarrat the end of
the skimmer tube. The high pressure region following the skimmer
orifice is due to the large pressure just upstream of this orifice
and the poor conductance offered by the 10 mm skimmer tube. It is
this initial high pressure region which makes the formation of a mole-
cular beam impossible in the present system. From the kinetic theory
of gases, an expression for the mean free path of nitrogen at 300 K
is [ 31 ]
X = 5xlO-/P 8-1
where: X = mean free path (M)
P = pressure (torr)
Thus, at 0.001 torr the mean free path is on the order of 5 cm which
suggests that many intermolecular collisions will occur in the upstream.a
section of the skimmer tube. These collisions will cause the molecules
to be scattered and the molecular beam will be lost.
Table 3-2 summarizes the pumping speeds and conductances for eachao
stage in the vacuum system. A severe conductance limitation is caused
by the use of a 1 M length of 50 mm tubing to connect the roots blower

A& 80
10-1
ori ficeS cutlet+
skme ori-Flce outlet
10*
c.10-
0 t~r0) 70 03
Distn 0owriic olet c (~
00-

81
to the first stage of the-vacuum system. Shortening this piece of
tubing and increasing its diameter would greatly increase the pumping
capacity of the first stage and consequently lower the pressure up-
stream of the skimmer orifice.
A drastic conductance limitation is also present in the second
vacuum stage due to the small diameter of the skifmmer tube. Increasing
the diameter of the skimmer tube would greatly reduce the pressure near
the skimmer orifice. This in turn would increase the molecular mean
free path and allow the formation of a molecular beam.
The following improvements are suggested for upgrading the first
two vacuum stages in order to attain the proper operating conditions
for a molecular beam:
1) Raise the mount for the roots blower such that a line
less than 0.5 M long can be used to connect it to the
first vacuum stage.
2) Increase the diameter of the line between the roots blower
and the first vacuum stage from 50 mm to 100 mm.
3) Increase the diameter of the entire first vacuum stage
to 100 am.
4) Increase the diameter of the skimmer tube from 10 mm
to 38 mm.
A summary of the predicted pumping speeds and ccnductances in thf_
vacuum system incorporating the previously mentioned improvements is
presented in Table B-3. Figure B-3 shows the predicted pressure tapers
'or the upgraded system under the same conditions as Figure 8-2. Much
lower pressures and a smaller pressure taper are predicted to exist in
the skimmer tube cue to the lower pressure at the inlet to the skimmer

a82
Table B-2
Vacuum System Pumoing Soeed and Conductance Summary
Pumoino Soeeds Ist Stage 2nd Stace UHV Stace
At pump flange 60. 280. 400.
At vacuum stage flange 7.7 130. 310.
At orifice outlet 4.7 0.2 14.
Conductances
From .pump flange to 8.9 240. 1400.vacuum system flange
From vacuum system flange 12. 0.2 15.to orifice
Orifice -0.0003 -0.005 -0.4
a
6

83
'AG
Table B-3
Vacuum System Pumoing Speed and Conductance
Summ arv for the Imoroved Desion
Pumoina Soeeds Ist Stace 2nd Staae UHV Staae
: At pump flange 60. 280. 400.
At vacuum system flance 33. 130. 310.
At orifice outlet 24. 17. 14.
* Conductances
From pump flange to 74. 240. 1400.vacuum system flange
From vacuum system flange 92. 20. 15.to orifice
Orifice -0.0003 -0.0G5 -0.4
*•

84
IC-i
sample orifice outlet
10-2 1 5t ste (Ouimo at Ax10-3 torr)
skimmer orifice outlet
2 nd
S tt r
10
collimating orifice outlet
0 10 20 30
Distance Downstream from Orifice
Fiqure a-30 Predicted Vacuum Stage Pre ssure Taoers AfrConductince Upgrade
... .....

£ 85
orifice and the increased conductivity in the skimmer tube. The mean
free path of a 300 K N2 molecule exiting the skimmer orifice is expected
to be on the order of 10 M. Since the length of the skimmer orifice is
approximately 0.3 M, it is expected that these conditions will be very
favorable for the formation of a molecular beam.
Foxon et al . [ 30] have developed a sophisticated modulated mole-
cular beam mass spectrometer system and have used it to study the
effusion products of GaAs, GaP and InP. They found that a cryogenic
baffle located directly behind the cross beam ionizer of the mass
spectrometer greatly reduced the background signals which were present
due to species desorbing from this vacuum system wall. The observation
of chemical species produced as a result of wall interactions upstream
of the mass soectrometer was reduced by varying.the chopper motor fre-
quency and applying Fourier transforms to the data analysis. A photo-
diode was coupled to their chopper blade in order to provide a reference
Osignal for the lock-in amplifier since the chopper motor was unable to
remain syncronized with the rapidly changing oscillator frequency.
Practically, the use of Fourier transforms during data analysis
suggests that computer controlled data acquisition and mass spectromete,a
control should be instituted. Also, pulse counting instead of analog
signal measurements should be employed. These improvements would result
in the data being immediately available to the computer for the appli.B
cation of signal averaging and data reduction techniques.
Finally, it is recommended that a quadrapole mass spectrometer
head containing a Faraday cup and channel type electron multiplier be
used. Electron multipliers which employ a channel structure yield
higher electron gains and the outputs are more amenable for pulse
a

86
counting since all of the output pulses are nearly of the same ampli-
tude C 32]. The presence of a Faraday cup allows the electron multi-
plier gain to be determined on a day to day basis, This is a very im-
portantk piece of information if a library of fragment ion patterns is
to be collected for quantitative investigations.
a
0
a

87
Appendix C
Unintentional Si Incorporation in Chloride and HydrideCVD or GaAs and InP
The feasibility of apolying the chloride system CVD technique to
the epitaxial growth of high purity GaAs was first demonstrated by
Knight et al.[33] and Effer [34]. Initially, the commercially avail-
able AsCl 3 contained sufficient impurities to cause significant con-
tamination of the epitaxial layers and therefore the purity of the
feed materials was believed to be the controlling factor for this
system [35]. As better quality AsCI 3 became available, Cairns and Fair-
man [36,37] and DiLorenzo et al. 38] found that an increase in the
AsCI 3 mole fraction in the inlet gas stream resulted in a decrease in
unintentional impurity incorporation in the epitaxial layer.
For materials arown in their laboratory, OiLorenzo and Moore [39]
identified the primary unintentional dopant as being silicon, through
the use of photoluminescence spectra. Further, they proposed a thermo-
dynamic model for the generation of vapor phase chlorosilanes as aa
result of the interaction of HCl with the quartz (Si02) reactor wall
and presented an expression for the activity of solid silicon (i.e. as
an impurity) as a function of the partial pressures of the chloro-A
silanes. Their model showed that increasing the vapor HCl concentra-
tion (e.g. as a result of AsCI 3 decomposition) decreased the condensed
phase silicon activity by Further stabilizin- te silicon species in
the vapor phase in the form of chlorosilanes. Additionally, their
•

88
mpdel predicted that the generation of vapor phase silicon species
could be supressed by the introduction of H2 0 vapor into the system.
Rai-Choudhury [40] performed a thermodynamic analysis on the in-
corporation of silicon into GaAs epitaxial layers. His results reflected
those of OiLorenzo and Moore [39] when considering the effects of HZ 0
and HCI, but he also showed that higher temperatures increased the
amount of vapor phase silicon species.
The work of Ashen et -l. [41] further supported the conclusion that
silicon was an impurity in GaAs. A BN lined reactor was used to grow
epitaxial layers from liquid Ga sources which were doped with Si. Com-
paring the electrical characteristics of these epitaxial layers to layers
crown from pure Ga sources provided qualitative evidence for the presence
of Si in GaAs. The effect of AsCl 3 concentration on the amount of Si in-
corporated into the epitaxial layer was also verified by their experiments.
Additionally, these studies provided evidence which indicated that Si was
much more likely to reside on a Ga site than an As site and therefore,
behaves as a donor. This conclusion was also supported by Beiden et a'
[42].
Wolfe, Stillman and Korn [43] have identified, through int to-al
doping and determination of ionization energies, three unintentional
impurities, Si, C and one unknown (possibly 7e), in GaAs grown by the
chloride C10 system. Also, due to the results of Solomon C44] whic.'
showed that oxygen may be a shallow donor in GaAs, they attempted to Iooe
the epitaxial layer with oxygen by adding Ga203 to the liquid galliumr
source. The cx',/en, however, was not incorporated into the epitaxial
layer, but did reduce the amount of silicon which was incorporated into
the layer. This reduction in background doping due to the presence0

89
of oxygen was also investigated by Palm et al. [45] by injectino a
hydrogen-oxygen mixture into the mixing zone of a chloride system
CVD reactor. Using silane as an intentional dopant, the presence of
oxygen was found to reduce the incorporation of silicon in the ePitaxial
layers by as much as four orders of magnitude.
Seki et al. [461 performed a thermodynamic analysis of the GaAs
chloride process in order to identify the effects of inerts, HCl and
substrate temperature on the activity of silicon in the epitaxial
layers. The analysis predicted that increasing the HCI content or de-
creasino the substrate temperature lowered t e silicon activity. In
addition, replacing the hydrogen carrier gas with an inert gas caused
a very large reduction in the silicon activity.
The effect of replacing the hydrogen carrier cas with an inert was
investiaated by Ozeki et al. [47]. Through far infrared photocon-
ductivity measurements, it was determined that sulfur was the dominant
residual donor present in epitaxial GaAs when N2 was used in place of
Hz as the carrier gas. It was also found that the dominant residual
donor when H2 was used as the carrier oas was sometimes Si and snmp-
times S. A possible source of S in the system was not discusseda
(although it was presumably in the feed gases) and elaboration on the
growth conditions which caused Si or S to be dominant was not provided.
A thernodynamic analysis of the chloride C11 system performed by
Boucher and Hollan [48] assumed solid GaAs as the group III source
material. By comoarison with experiment, it was found that the
dominant grcuo [I! and group V species present in -. vapor were GaC!
and As Under the experimental conditions investigated, the deposition
process was kinetically controlled with an activation energy of -40
a

90
kcal/mole, and reproducible growth conditions could be attained only
if 10% or less of the thermodynamically available GaAs was deposited
from the vapor phase.
Gentner et al. C49] also studied the chloride process experimertal!.
and presented a thernodynamic analysis over a greater range of tempera-
ture, pressure and inlet AsCl 3 composition than did previous investica-
tors. They found that As2 became the dominant group V species below
10 kPa pressure and that GaCl was always the dominant group III species.
At larae AsCl- inlet compositions, the higher gallium chlorides became
more pronounced but never competed with the monochloride as the dominant
species.. They concluded, based on a kinetic model C50], a mass transfer
model and experimental results, that the deposition of GaAs was kinet-
ically rather than mass transfer controlled.
Shaw [51] studied the transport kinetics of the GaAs chloride system
in the source and deposition zones. He found an activation energy of
49.1 kcal/mole in reasonable agreement with that of Boucher and Hollan
[48], for a surface reaction associated with the deposition process.
REVIEW OF LITERATURE
Imourities in [nP Epitaxial Films Grown by the Chloride Procesv
The epitaxial growth of tnP using a chloride CVO system was first
demonstrated by Clark ec al. [52] and later by Hales et al . B53]- oth
groups of investicators reported limitations on the purity of their
epitaxial layers due to unintentional dopants. Joyce and Williams L54]
tentatively identified the imourities as being Si and Zn acceptors.
They also found evidence of a donor which was thoughz to be amphotaric
Si.

91
The dependence of unintentional doping on PC13 mole fraction in
dI the InP chloride system was first reported by Clark [55]. The simi-
larity betWeen the GaAs and InP chloride system reactors combined with
the anaioous dependencies on the group V hydride mole fraction supported
the belief that Si was an impurity in InP epitaxial layers. Clarke [56]
later studied the effect of UTI/V ratio in the vapor phase on the un-
intentional doping of InP epi-layers and found p-type conductivity for
ITI/V < 3 and n-type for III/V > 3, with a minimum in the free carrier
concentration at III/V 3. No explanation was offered for these
observations.
Easton [57] investigated the unintentional doping of InP epitaxial
1ayers crown by the chloride system and concluded that S (acting as a
donor) was the major impurity and that the origin of the S was the PC13J3liquid source. Using mass spectrometric analysis, Easton found Si, S
and Zn present in the PC1 source at levels between 1 ppm and 10 ppm3
(atomic) and Fe, Cu, Cd and Sn at -0.7 ppm. These same elements were
found in the unused bulk In liquid at levels below 0.1 ppm. Analysis
o zrne used In source liquid revealed impurity levels approximately 10
times larger than those in the unused liquid.
These results supoort the work of Weiner [58] who proposed models
f-r the contamination of a Ga liquid source by Si in the GaAs and GaP
systems. Weiner's results showed that the liquid group III metal im-
;Jrity level increased as the exposure to the CV10 environment increased.
He asio found the level of Si contamination 'o be inversely related to
"e -,r-ial pressure of H20 in the system.
rairhurst et al. [59] studied the InP halide system using both
PCI, and PSr 3. They found that oxyhalide salts were present in both3

a 92
phosphorous liquids at approximately the 100 ppm level. The presence
of oxygen was expected to decrease the level of impurity incorporation
in the epitaxial layers. This effect was not observed however, pre-
sumably due to this level of oxygen contamination being too low to be
significant. Ecuilibrium calculations were performed which showed
InCl and P4 to be the dominant group III and V species in the vapor
over a temperature rance of 8_0 K to 1150 K and an inlet PC13 mole
fraction range of 0.1' to 6'. These results agreed with those of
Boucher and Hollan [48] for the analocous GaAs system.
* Hales and Knight C60] investicated the effect of introducing
oxygen into the system in order to reduce the level of impurities in
InP. They observed a monotonic decrease in free electron density for
additions of 02 up to 24 ppm. The electron mobility (measured at
77 K) however reached a very broad maximum at approximately 16 ppm
of added 02, which sugcests that oxygen was becoming incorporated
into the epitaxial layer and that there is a limit to the degree of
benefit which may be obtained through oxygen addition. They also
observed POC1 3 to be an impurity in the liquid PC13 used in the
a chloride system.
Investigations of the dependence of impurity incorporation on
PC1 3 inlet composition, total flowrate and deposition zone temperatuFre
* were carried out by Chevrier et al. C61] . They observed a decrease
in free carrier concentration with increasing PC1 3 concentration,
as did other investigators, but also found that the imcurit, concen-
tration increased w-th increasing total flowrate. This velocity ef:
had not been reported before and suggests the presence of a mass
transfer resistance at the group rii source (if impurties are picke,.

93
uo from the licuid me.a-i) -or at the substrate in the deocsitior -ne.
They also studied the intentional doping of InP as a furction of
deposition zone temperature using SnC1 Loyer free electrn con-4.cenzretions and higher electron mobil ities were observed when the
deposition zone temperature was decreased from 950 K to 910 K. Th Us
the uptcake of group IV impurities (Sn, Si, etc.) was aoparent"v re-
duced by lowering the deposition zone temperature.
Cardwell et al . [62] found kinetic limitations in beth the surce
and deposition zones. The previously reported effect of PCI 3 rnoale
fraction on impurity levels in the epitaxial layers was observed.
Intentional doping of TnP using Sn followed the same beh.v,'ior as that
of unintenticnal dopants and therefore supports the use of Sn for
studies recarding the reduction of unintentional impurities. Tn c-n-
trast to Chevrier et al . [61], no dependence of impurity uptJZ. on
total flovirate was found.
A themocdynam;c analysis comparing the GaAs and ,nr .- crd_
systems usina the stoichiometric 11-V4 solid as the orcuc -1 scurce
material was reoorted by Shaw [631. His results also corfi -. '-
As4 , InCl and P4 to be the dominant group III and V vapor species in
these systems. Further, the degree of supersaturation in the p-si-
tion zone was calculated to be less for [nP than for GaA ,n.er
* analocous condiiions. Since solid I[I-V source materials
played etchinq conditions were predicted whenever the depos;t:,:n .ce,
27m-erature was greater than that of the source zone.
T 7. -'ie in GaAS Esitaxial Films Grown b,/ t ,e Hlo: '2=
The aes:iiit. of applying a hydride C'1O system -or . . .:r, ., of
hi(h pu ri t.' GaA; ',oas demonstrated by Enstrom and Pe'ersc'.F Since

94
the hydride syszem ccnsiszs of a hot-wall quartz reactor with the
elements H, Cl, Ga and As present in the vapor, one would expect it
to show an unintentional impurity incorporation problemi similar to that
o-F the chloride system. Pogge and Kemlage [651 investigated the
effects of HCI , JAsH 3 a nd PH~ o n the unintentional doping of GaAs
and GaP crown by the hydride system. They found that the free carrierconcentration decreased with increasing url, s r~ opsto
Tne effect of HCl was less than that o-f the aroup V hydrides and
chances in PH' showed larger efIFects than did AsH3. Te ocue"33'Tecocue
that t-he HCl effect on the vapor phase composition was simnilar to that4k
o-f the chloride system. Further, they concluded that As 4 and P4caused
blorkace o-F the available surfiace sites on the substri-te due to the
large size of these molecules. The unintentional dopant was assumed
to be Si generated from reactions with the auartz w all.
Kennedy et al. [661 investigated the effect o-F HCl inlet com-
posiltion and additions of HCl downstream of the source zone on the un-
intantional doping of GaAs grown in a hydride OVO re-Actor. increasing
the H~l mnet composition greatly reduced the frae carr-er density in
the eq.taxiai" layer. In contrast to this result, however, -when HC1
was added _ cwnstream of the source zone the free carrier density was
found t.o increase. This led to the conclusion 'hat the equilibrium
model Es prooosed by OiLorenzo and Moore C39] lfor the chloride sys~efc.
wds not appl icable to the hydride. systemn. However, th ! HC11 which was
njec:ed.ay not have been as pure as that which -.was cenerated 1frcm
the .ezcstino s nte hoiE system arc th erefore may
have 41.roduced additional impurities into the ep-aer. these elffects
.,er-e als~o observed by Enstrom and Appert [671.

A 95
The work of Skromme et al. C68] identified some ef tc e unintentional
donors and acceptors present in GaAs and InP prepar- by the hydride
CVO system. They found C, Zn, Cu and Mn as acceptors and Si, S and Ge
as donors in GaAs. Epitaxial InP was found to contain Zn, C or Mg and
an unidentifiable acceptor along with Si and S as doncrs. Additionally,
in one of t:.e laboratories (Honeywell) where the epi-7aVers were grcwn,
an increase in the impurity concentration in epitaxial Ga.As was noted as
the HCl gas cylinders "aged". This effect, however, was not observed
at the other laboratory (Hanscom AFB).
The effect of pressure was studied experimentally by Putz et al.
[69] from I kPa to 100 kPa. They found that the uninentional doping
of GaAs was reduced at pressures below 100 kPa.
,mDurities in InP Eoitaxial Films Grown bv the H,'Ydrid Process
Growth of InP epitaxial layers using the hydride sz-ystem has been
demonstrated by Olsen [70] and Hyder [71] among other,. Eoch of these
investicators observed unintentional impurity incorporation similar to
that occurring in the GaAs system. Hyder also found that for the ter-
nary [n G a As (x=0.53}, a maximum in electron mobil ity .ccurred whenI-x.
the [.1/V ratio in the vapor phase was approximately 2, but the effect
of 111/11 ratio on free carrier corcentration was not discussed.
Zinkiewicz e?. al. [72] also studied the growth of :nP -nd the ternary
InGal As in the hydride system. They found Zn, Cj nd Hg to be pre-
sent as unintentional donors.
Anderson [73] studied the hydride system for rnP crcvth In order
t de-er7,ine the effect of HCl mole fraction, H2 .ci.:_e and mixing
0 Zcne tetoerature on unintentional impurity incor~or'tir,. He found that
these pararmeters caused only minor changes in the electrical behavior
a\

96
OF the InP epitaxial layers. This s at that the 1nP hydride sys-
tEm may perfom,- somewhat differently than the GaAs hydride system.
Jones [74] performed a thermodynamic analy.sis of the InP hydride
system in ordler to understand the Ef-FECt Of Process parameters on unin-
tentona Siincrooatin. he aiciatcns predicted that decreasing
tempoeratures lowered the silicon activi1ty in the epitaxial layer. Addi-
t-ionally, the silicon activity was decreased by i ncreasing the PH3 and/or
KC1 inlet composition. Very little etffect asnoted when HCl was added
downst'ream of the source zone. His analvsis used' liquid in as the arouo
III source material and showed TnCl and P4 zo be the dominant croup !!I
and V vapor species.
Ban and Ettenbera [75] coupled a imass setcetrto a h ydride
system reactor used for the growth o-F irG; P They compared measured
vapor species to those predicted by a the!-7cdynamic model and concluded
t.hat the model yielded an acceptable repraseritati on of' the system. Thne
major shortcomings of the model were an ovzrpredicticn of the amount of
1nCl generated from the heteroceneous r- act":on of NRCl and lIn liquid, an.
a predicted greater degree of diss,,*.;ixti o for PH3 tha. was meured
Due to the slow decomposition kinetfcs ullP and the potential mass
transfer and kinetic limitations associaitedk w-ith heterogeneous reactions,
these di screpancies were not surpris.n'. rhpr mass spectrometric
neasuremnents identiie the mao r . sp.- ecies as being EnCl,
GaCl, Hcl, PH,, P2 1 P 4 and H2
Usui and Watanate C76~ Investi.:Z. c 1a2 fects of temperature and
Oxcen addiltions on ChE unnertnJ-~F hvdride Crown 1nP. Ad-
ditions of 0 2 in the 1 ppm to 10 porn ronco Zu2creased the Free carrier
C~ncentrat-ion about one order of mci* further addi14tions cauSed

97
,a fre- c-=rr-er concentr-atilon 't increase, prasumabl" due tc uctake
I oc- oxyaen by the epitaxial layer. ine liquid in source that was used
in these exoeriments was found to have a cetterino effect on ir-ouri-
ties ,n tne inlet cases. Unused in showed less than 1 .omn levels cf
iSi, 5, Sn, Te, Zn, Fe and Cu, while In exposed to the CV, em,%.'irnment
ccnta,,ied increased levels (-2 ppn) of Fe, Cu and Sn. 7ncre_-- n the
source :on2 temperature caused a decrease in the free carrier concen-
t-=tions in 1nP epi-layers due to an increased ability of the In
l'auic,o_ .- t zer imourities at high temperature. Tius, t.he jrt. of
source zases still appears to be a major problem in the hvcric(e system.
d
i
.I

98
FORMULATION OF AN EQUILIBRIUM MODELFOR THE HYORIDE AND CHLORIDE PROCESSES
Introduction
Performing a detailed analysis on CVO processes as complex as the
hydride and chloride processes presents a formidable task if results
which allow direct comparison of the systems are desired. A rigorous
* treat.menc would require the solution of the mass, energy and momentum
equations with variable properties and kinetic expressions for many of
the hcnioceneous and heteroceneous reactions which are present. The
current lack of knowled.e surrounding the fundamental chemistry which
underlies these processes precludes this type of analysis. Many of
the essential differences between these- processes may, however, be
elucidated by the application of a model based on the assumption of
chemical equilibrium. Cue to the high temperatures employed in these
processes, it is expected that many of the chemical reactions proceed
a at a very high rate. Therefore, homogeneous reactions are expected to
be near equilibrium. Heterogeneous reactions may be impeded by the
existence of mass transfer barriers. These barriers may be approxi-
""! mated by either allowing the reaction to reach equilibrium or by ne-
glecting the reaction. The results related to heterogeneous reactions
are therefore exoected to be semiquantitative in nature in that they
p Provide limi:s to the system composition. These results may then be
comoared to experiments in order to determine the degree of influence
exerted by the heteroaenecus r-actions on the systems.

L 99
The rescurce=S an'zol -adin orcier tLo arr-eCt the anal ys is per-
formed in this study incluZde a comoutler code for the calculation
of multiphase e-,uilibria in systems having many chemical species
(typically more than 10), m~odels for each zone of these CVO processes
which are ba7sec- on cremca quflikbrium constrained to account for
actual mass zransfar cr kinetic li-mitations, a model for the point
dEfeCt chemistry in the solid epitaxi al layer and, finally, a set
of consisteint zhe--mcdyn=mic prooer ties for each chemical species in
the system. The ccomout=er ccde, reactor zone models and solid state
defect chemistry ara discusse-Z in this section. The choice --d
analyisis of' a sat or ther-ncdyramic properties are descri .bed- r
next section.
Method o: Cal cul Etion -For Comolex Chemical Eauilibrium
The calculatilon o-f comolex chemical equilibrium in multicomponent,
multiphase systEms asbeen reviewed moast completely by Smith [18].
Essentially, thPere are tw-o Stl.taments of the solution to this problem.
Nonstoichiornetric methods, such as the popular Rand algorithm [77],
directly miknimize -..e Gibbs Znergy of the total system in order to ob-
taina soutio witout recourse To a specific set-of formation re-
action equations. StoiChicmetric methods [78] require that an inde-
pendent set or: c, i2miczl reacticns be in equilibrium. Generally, a
'or atbcn react~on is '~itnfzr each species present in the system
a and the corrEspondfnq eqii-brium constant for each reaction is gen-
er3 ed fom h~ G~s rern onrCe o the reaction.
An extcens-'cn o tre av:.ortmto include not only a -as
Pnase 4 -h an i ne: cucis cu also a rul ticomponent sol-ution and
pure coc7s' *cK :v e:_ by Anderson C79 ]. This alaorithm

A 100
was initially applied to the hydride and chloride CVO systems, but
was susceptible to finding local minima. In particular, some com-
ponent mole fractions souoht were as low as 0.1 ppb. The contribu-
tion to the system Gibbs energy for these components was quite small
and the resultina component mole changes were not capable of releasing
the Gibbs energy of the system from the local minima.
A stoichiometric algorithm, was therefore developed which
was superior to the extended Rand algorithm since
a linearized Gibbs enercv function was not required. The stoichio-
metric algorithm pe-oned well for all of tne systems studied (the
results were comoarzd to other investicator's calculations and were
found to be indecendent -,ith respect to initial guesses) arid yielded
results which were in agreement with those of the extended Rand al-
gorithm, when it could be successfully applied. The amount of com-
puter memory required for the szoichiometric algorithm was found to
be much less than that required by the extended Rand algorithm in
order to solve identical systems.
The input data which was required in order to perform the cat-
culations consisted of the standard enthalpy and entropy of formation-
and heat capacity for each species alona with the system temperature,
pressure and inlet ccmposition.
Aside from numerical difficulties, the two major factors, which
must be considered in determining the overall accuracy of the calct-
lated ecuilibrium comoositicns, are the choice of scecies postulated
to be present in rhe systarm ant the accuracy of the thermodynamic
data c osen to r_ rsent each species. Choosing an 3ppropriate
o soecies, ,hic acnur~ta represent the system at equilibrium, ,s

101
an inherent difficulty in the caIculation of multiccmoonent equilib-
rium. A true calculation of equilibrium in a given system must in-
clude any chemical species which is formed from any combination of
the elements present in the system. The compilation o'f such a com-
plete thermodynamic dat = base can represent a nearly impossible task,
even fr systems consisting of only a few elements.
It is important to realize that anytime a possible species is
not included in the data set, a constrained equilibrium calculation
v-ill result. This is most easily understood if the calculation of
cnemic=i equilibrium is considered from the viewpoint of the Rand
a,:,orithm. In the Rand algorithm, multicomponent equilibrium repre-
-ent, the optimal distribution of a given quantitv c- f elements amono
a set of chemical species. The optimizing function for a constant
pressure system is the minimization of the total Gibbs energy. There-
fore, as the number of available chemical species is decreased, the
elements are constrained to reside in a smaller selection of mole-
cules. This causes a shift in the calculated compositions in order
to sa-.isf,/ the atom balance while keeping the Gibbs energy of the
svstari as low as possible. In general, the exclusion of a speciesa
will inoact the equilibrium composition of the remaining species con-
_a~nlng similar atoms that are in the vicinity or below the equilib-I
ri m composition of the excluded species.
The procedure for developing a species list first excludes those
:pecles not expected to be present because o: severe kinetic limita-
. n pr3ctice, this species set is developen by including only
:2.cse species which have been experimentally observed in the system or
:or)ora~e subs/stems. As an examole, ras speczroscopic work in

102
the CVD of GaAs has indica=ted aooroximateiv 10 s~ecIes. bu t cbser-va-
tions in the subsystem Si-H-Cl indicates approximiatelY 15 atditional
szecies. The next step consists of generating an initial 7hei-odynamic
data base tzar all species. Tis includes themrocvnamlc comnpiiations
(such as the JANAF tables), data basEs ofl other ;nvesziaators fcor sim-
ilar systEmis and cr-ide estimates for the renainn species. Initial
eoquilibrium calculations are then perfor-ed at the exeelfimits of
the study and those speciias whose compositions are imore than three or-
ders o-Frimacnitude in mole fraction below the rance of interest are ex-
cl uded-. Finally, the initial thermodynamic data base i: ccrn eted by
ra-~rn 7-o the li terature and the results of i_-na o-sistenlcy
The sensitivity of the results subjected to errors in the thermodynamic
data was investigated by Smith [80] in terms of a Jacobian, which relates
the changes in the calculated results to changes ii, the input paramneters.
The first order approximation to the result was
N Sn.
,.ere, n. is the number of: moles of specie i present, pois2j the standardi 2
h .l c alI potential of specie j and N is the total of component-s. This
e~oressi n il siple in farmm, is extremely orr'.cult to evaluate
due to the complicated and implicit nature of th.-e f1 unction n.Qi for
-ill values of i. If problems seem apparent, for some species, this
,unct-:on can be numerically evaluate-i. The e4 or,, of Hurt nd Siirtl [8l]
~-~a s~nr ca Icu 1,a t 4, os per -- rned here showed' tv r;eI1a
S:cul tad examol e the ef fects ofz chances i n 7,..,~a:- of ITf: ma tic n
s i-HC1 on the predicted equil ibrium ratio o-, CiC Ill .3 Ths

103
ratio was found to ch-anae by apprcximazaly t'.:o orders OT magnitude
for a 10'. chance in the standard enthail- of formnation. The shape
of the curve relatinc this ratio to temperature w.as elso found to
chance markedly. There-Fore, '.t is ernlvimoorzant to critically
review the thermodynamic data set in order to perform meaningful
equilibrium ca=lculations. The absolute ccmpositicn of the calculated
solution can be no better than the data se-- employed. Extreme care
must also be used when comparing calculated equilibrium compositions
to experimental Process compositions as the latter include possible
kinetic limitations. However, these calculations are of great valued
in predictino the directions of compositigonal chances, particularly
at the hich temperatures and low pressures encocuntered in this study.
Thermo-ndynamic llodels of CVO
A ~ Mo dels for the U10 Source and Pre-Source Zones
Each of the CVO systems under investigat ion may be separated,
based on temperature or composition, i-nto the pre-source, source, mixinq
and deposition zones. The ore-source= zone was investigated as a source
Of Si by considering the equilibrium g.~s phase Si-content in the sys-
t~em: Sio2(c) in excess, carrier cas (H 2 or inert) and vapor reactant
('1H3, VCl 3 or HCl).
Historically, the chlcride process ha~s employed two different
group III source materials (711-V(c) and 17(l)) and thus required
twqo separate model formulations. the 111-1(c) chloride source zone
model considered the system: Si0 2(c) i~i excess, ttt-V(c) in excess,
carrier gas (H2 or inert) _ nd 1C1?aZ
The chloride prnocess ,qnich used a qrnup jill) as the group III
Scurce mnaterial %Mas a :-,cre ccmol ic.2,': s-izja'-cn. Shaw [51] has

104
studied this source zone and Fcunc tha.., following an initial transient,
a constant rate of mass loss of mazerial occurred. An overall mass
balance on the source boat yiesid the foilowing expression:
d =- -Mv) - (x +d,. L Ln E"li[ (I
V(yMi I + (l-y)M) constant C-Z
while a group III component mass balance on the source boat produces the
constraint:
d [1, nci I It~'U +l = I[l C-3
In these expressions: nC and n are the moles of atoms in the solid
GaAs crust and the liquid ITT-V nixture, M and are the molecular
weights of the group III and V elements, x and y are the mole fractionsV
of the group Ill element in the liquid and vapor phase, and n is the
molar rate at which vapor species are formed. If it is assumed that the
solid and liquid phases are in equilibrium, the liquid phase mole frac-
tion is a function of temperature only and therefore constant for a
given process condition. Furthermore, if the actual kinetic processes
produce a steady state value of the crust thickness, the first term ona
the left side of both equatior, s is zero. With these assumptions, equa-
.V dn l
tions C-2 and C-3 can be solved to show that n = dt and x=y. That
is, the rate at whichugroup LII and V/ atoms are introduced into the
vapor phase is equal to he rate of loss for the melt and the Ill/V
vapor atom ratio is the same as that in the melt. Another way of view-
ing the situation is to consider .he three phase equilibrium problem.
The aczi'ity of the group r2 1.d i elemencs in the solid compound can
vary greatly even thouqh t zc -icn(rrecry (-1:1) can be very small
0I

L 105
and therc; :ra the sum of these tao acziviti:es is -early constznt. 7h e
larce amocunt --,T meit in equilibriun with the sclid qill , hco.,ever, fix
tine activity of each element in the sciid1l with the croup Ell activity
teina cor.-si darabl1y hi'ie thnta of the orcu'P V, %S'hc1'n in turn fixes
the vapor phase fjcacitv. Tn the event tha~t the -z-r-:ion o constant
crust t cres ic not Vali4d , t he d n c/dt t=_rms in equaz';,.ns C-2 n C-3
must be retai'ned and the resul " is
V(2x-l ) dn C =(2x-l) dn1 C-4n cnsan =2(x-y) dt Zy-1 dF
-n = 0 j,._ L." cu e ca e - _1-
*sidered to be pure solid compound. This liimit is sim,-ply the frst case
e xa m41in ed f c i id c cm co und sourcez). Thus , an i nves :lo= z -;n of the tw. o
source zones descri;;bed here shoul d establ ish the 1limi ts 0f -1OPeration for
the liquid source in the chloride process. In practice, the conditions
0-t operati4,on may i e scmewhere i n between wi th the observed IT /11 ratio
providing an indicator of the relative rates. Ho,..ever, if x is a can-
stant as determined by the condition of solid-Ii iauid equilibrium and y
iS also a ccnstant as witnessed by a constant arowth rate, it follows
that both a- and L are constanz. if' dnl/dt is de:,ndrcent upon thedt
At crust thickness, nc, (i.e. a dilffusion li:mited proceiss), then it is
imossi.le For dnl/dt to be constant for a finite value of dn0 /dt,.
"hich cmi> perat-ion at cre of ' e limits.
*Th2 a aove considerations motivated a model for th-e liquid croup
sourca zcne to consist of an ideal vapor phase in e'quil ibrium with
2.ss Si< and tr ,l. The oas inle'. szr2am: contained ';CI,
it* c _ 1r I as ('A or inert). T1he develo.:mer.- of a ~'d'ni
-.O 2:~; -h,! hypoctieticl specie Ut 1~) is pr~n~dlatar in tLhis

106
anjx , Thus, wi t., this relation, the compo r;d crust does :.,., cct,-
bute erenents to the system.
T,,,o source zones, one for the ther-nal decomposition of tha group
V hydride and one for volatilization of the group III liquid, ars fourid
in the hydrida CVO F-ccess. Tne group V source zone was mcdeled as an
idEa= vapor Phase n equilibrium with excess SiOZ(c). The inle. Sas
r.ctants._ ere the hydride (VH3 ) and carrier as (L2 or Inert) at r-on.-
stant te.,perature and pressure. The group III source zore inciudei
excess pure croup [-7 liouid in equilibrium with excess Sl (,) and an
ideal vapor pha se (HCl plus carrier gas).
S"Yodels for the CVO iixino and Oecosition Zones
Since the only differences between the chloride and hvdri't sis-
t-.s exis in the source regions, the mixing and deposition mode.s
,er=. dentica7 in 6oth systems. An ideal vapor phase in ecurn
'th excess S:10 2 was used for the mixing zone model. r. -,7,e_- of
-olid I : -V comp cund was postulated to be kinetically hi nderd .nd thus
assumEd not to exist in the mixing zone. As a result, it w- s a
for this region to be supersaturated. The model also alloed ->z addi-
tion, of varicus species (i.e. HCI, H20, VCl 3, VH3 ) in order tu
their effects on silicon activity. The gas reactant input for th- "
g .ore '.as identica21 to that calculated from the equilibrium :curc
2). Consist--n with the source and mixing zone model,
1 o t£the -pcs-tion zone was assumed to be an ideal mi.. C
to te l --;e v -Ltric flowrate cf gases and the relativcy" -Ial
.,n t>se CVO processes, the deqletlion o- :u "
70-;o I .,d ;i; icon species in the vapor phase as a res j 71
,i -r,sit in a" w-all inzeraction was neglected. The equili i, n

All 107
Zone Cas mixzure serve_ a1s t;-e i oiuc zo the decs :t-ion 7one. Essen-
tially, the above assumozion f-,xed :h= moles c-F eAch eliement in the
vapor and the new equilibrium c.om-pos:tf-jn was calcutated as a resul t
of temoerature change only- This mode! provided an upper bound for
the computed value of the Si activity Since zhe lower temperatures
found in the deposition zone shited the wall interaction towards
iO()fo ration' an-, in. unc te 'II-' compound dep~osition with
Si incorporation would re.mc.ove Si from the cas pha=se. This model,
therefore., assunnes that the ep-imcrows from a Supersaturated vapor
mixture of pseudo-stEady st-ate cc-poition. Furthermore., this pro-
*cedure avoided having kn0'WlE*di;e OF the. sol id sil icon activity co-
efficient. In order to imi~etti oete T7T-V Solid phase
was not included in the dEp-csitiOn ZC'Te, thus allowing calculation of
th e de :7r ee o - s up e rsa tu r a t -:c tS z ore.
The effect ofL not aczcuritinc for doeinof the croup IIt and I
atoms from the vapor phase cazn he teste'i by the following simple anal-
ysis. The molar earcowth rate of- an 11iipar, layer i
qhe re
o I moa r g rowth ra te (mG1es/te)
l inear growth ra:-(ln./tre
compound molar de;,,oi-ty o'nt
A substrate area (iergtn2)
A tYpical set of opirati e- for d 'iydride CVO process
Wculd Specif:y " oa'*''-: TDCCYtrounlh each
0 ~~source zone hav.'nc an ir)Ce 10.. K ~l~Hi to the group III
Source zone and I., '/H1 cr~vui'r, to gr-oup V source zone. Assuming

108
that atl c f the XCI reacts to- -Form 111-ClT result s -fM 3.7 u!-moles/s
of croup 1EU atoms transported. The molar 11loirrte of grouo V atoms
would also be 3.7 l.wmoles/s. Choosing as typical deposition parameters
a 2.5d ci diameter circular substrate, a I near orowth rE"z oIf I -m/miin
and given the molar density of Gasa1.37 oe/mE32J t e
su'tina molar crowth rate is 0.31 l-moles/s. T71hus, in the orst case,
less chiar 70% of- the 11-7 and V atomns are depleted. The smaller the
growth rate and substrate surface area or the larcer the .-. iurretricIflowrate, the better the approximation becomes. frctodplin
were indeed important, highly non-uniformn film thickness -aould occur.
kHcvevEr, this is not experimentally observed. Similar analyses applied
to the GaAs chloride system and the analogous InP syst-eM y-i;_-d ecqu-;v-
aleit, results.
The activity of silicon in the epi-layer 4as further studiled in
the presanca and absence of' the SiO2 reactor wall. Sincea the deposition
zone is typically operated at a lower temperature than the source and
rnixinq zones, inclusion: of the reactor wall .-ould be -r pected to de-
C-r .:-:a theP sil icon activlity as some of "he sil icon i-2 t':e vaPor .
* i - e;s~e on the reactor wall in the depositio n 7ie, therefcoi-,
providing an additional method of bounding the imaximum va'~lue of ;h a
Si ic.n act.ivity in the epitaxial layer. Justif~caltion fornectg
_Lthte reactor wail lies in the heterogeneous natkur-: of rbi a5.hii*_
aczi1cn. O:je to the lower temperature of the dep--itilon zone (.3 K),
it is expeczed -.hat this heterogeneous reacticn r c-Is nct e-q:l ibrate
* ~ ~o~las it S~ioud 4,1 the source and mixino :ornE, (-9.73 .T'h i s
SCoec:ation arises from the fact that adsorpti on r.iac.icn ratas de-
crneasp strongliy, and to a lesser extent molecular 4iffUsivi"2 s, wth
L

a 109
decreasing temperature. Additionally, the m-rs ridace time is
typically much smaller in the deposition zone. Thu;s, the reactor wall
in the deposition zone should not interact with the vapor phase as
strongly as it does in the source and mixinC zones.
In order to carry out parametric anlyses of the two processes,
"base cases" were chosen for ech system around which each Parameter
could be varied. The base cases were chosen from commonly used oper-
ating parameters reported in the literature shown in Tables C-1 and
C-2, thus providing results which ma/ be compared to experimental
results. The chloride system base case param.eters were as follows.
Source Zone Temperature = Mixing Zone Temperature : 973 K
Qeposition Zone Tem:erature : 373 K
Inlet VCi Composition " 1%3
Carrier Gas : H2
Pressure : 100 kPa
For the hydride system the following base case was chosen.
Source Zone Temperature = Mixing Zone Tempcrature : 973 K
Oeposition 7one Tem.r.er.ture : 873 K
Inlet HCl Concentra..ion = Inlet VH3 Concertration : 1%
Carrier Gas : H2
Pressure : 100 kPa
Typically, the source zone of che hydride system is c-erated at
a hicher temperature than that of the chlirice sysr:em in order to aug-
ient the decomposition oQ VH 3 ue to the strong infl.ence of temper-
itjre on the species present, the tme temzer3tures ',,ee used in both
systems in order to provide direct comparisor bet:.een the chloride and
hydride VC systems.

110
CD
Lfl '~ .-,- ~ ~ 0 --\ -f - -~ t-. -~ -~ - .-
cn
cnCD C:) C cO cn cCC CC
"n 0-1 " " ~ cn-cn(nmfl cnd "J n = =c - ncnc a i
1a a, 1., C, CNJ C' -, C - A~ A IQ = _n = Cc',c' C e~ r icnf
2!- ., -o NJ(JCJ'4 . - N N N(4C- co ~C~
S-~ - Ci
CAI E: \J c-, c- rNJ (NJ C--. r'. (J '4 - N JC-( r-...<) Ci I = C) =' ' C, C C' -) C', C) C C-- C, - .- 'raI I = ----- - - - - - r - - - C. NJC
cKli -~
CC C~icirf- C, 00 C\JCJ(-CJr CC)-- CD C 0 C , - %C0C~--0CCM CN M'C .CN
- C)CC) ) C)*0 0 (= nC)
c.~ C-0- AA C CC) 4(= ('4
CCr
kc-- C O CC Z~COC0C-_ .CCCD a% %a
U --- ---- - 1-- -l --l
Nl I'-1C~i C ~ . -
>11

-I M.. Il'Ln CO~ CO CO
c-i o " IDQ0 Q r-fl "4-~ - - - -
-7 q=
=1 -I %
en2 f- Ol 11e~-) cjr-e-, c-
Qj c-~
AQ1U =I r- " 4- LL
CU.
CO CD
12I M I I C -w -I
I -I c- I
c" C\4 .- 0000
CD C- ILI C
"C~j C\.i c,4~ 4 0 .
viJ 'A~u~~ C Lm

dk 112
Solid State Defect Chemistry
The model developed for the deposition zone specified that reactant
depletion was not a significant phenomenon. During steady state growth,
the compound film is exposed to a vapor phase that is invariant with
respect to composition. It follows directly that the vapor phase fu-
gacity of silicon must also be constant and therefore, at equilibrium,
the activity of solid silicon in the epitaxial layer must be constant.
Thus, prediction of the amount of silicon deposited in an epitaxial
layer may be accomolished by determining the solid state silicon con-
centration as functions of the fixed vapor composition and temperature.
A model which relates the point defect structure of the solid to the
solid state silicon concentration must therefore be developed and cou-
pled to the calculated vapor phase composition.
Hurle C83-86] has prcoosed models for native defects in GaAs and
for Te, Sn and Ge doped GaAs. These models are extended here to in-
clude the formation of antisite defects and to account for the doping
of GaAs by Si. The native point defect model allows for the formation
of Frenkel and Schottky disorder on both the group III and group V sub-
lattices. Silicon is allowed to reside either on group III or group V*
lattice sites or as an interstitial. Furthermore, Si substituted on a
group III si5e is allowed to form a'complex with a group III vacancy
or a Si atom on a group V site.
A set of independent formation reactions for neutral species is
Shown below.1/2 AsZ(g) + V. = As. C-6
a 1
1/2 AsZ(g) + "Ga = AsGa C-7
ASAs + Vi = Asi + VAs C-8

113
Gaa + Vi =Ga + VGa C -9
GaG + VAs = GaAs+ Va C -10
0 = VGa + VAs C-l1
Si(S) + VGa = SiGa C -lZ
Si(g) + VIs= SiAs C -13
Si(g) + Vi = Si i C -14
The notation used is consistent with that of Hurle C861. As an
example of this notation, equation C-6 combines arsenic dimer in the
vapor with a vacancy on an interstitial site to yield an arsenic atom
on an interstitial site. Thus, in the solid state, the subscripts de-
note whether an atom (or vacancy) is residing on the Ga or As sublattice
or in an interstitial location. Equation C-6 couples the point defect
structure to the vapor phase via the formation of As interstitials.
Frenkel defects are accounted for through equations C-8 and C-9.
Schot:ky defect fornation is given by equation C-11 and the formation
of antisite defects is represented by equations C-7 and C-10. Silicon
incorporation is shown in equations C-12, C-13 and C-14.
Consistent with Hurle's model C86], the interstitial species are
assumed to remain electrically neutral while the other defects may
ionize. The following set of formation reactions may be written to re-
present the ionized species.
AsG = As+a + e C -15
VAs As + e C -16
GaAs = Ga-s + h+ C -17.
S V_" h + C -13Ga Ga
SiG = Si+ + e C -19
SiA : Si-s + h+ C -20
A sa

*114
Si a + Va = Si aV + h C-71Ga Ga Ga GaC-1
SiGa As SiGaSiAs C-22
0 = e + h+ C-23
The ionization of native point defects is illustrated by equations
C-15 through C-18 while the amphoteric behavior of silicon is represented
by equations C-12 and C-20. Equations C-21 and C-22 represent silicon
complex formation and equation C-23 accounts for the generation and re-
combination of electrons and holes.
All that is needed to complete the model is to couple the arsenic
partial pressure to that of callium through the sublimation reactiona
GaAs(c) = Ga(g) + 1/2 As Z C-24
and to write the electroneutrality condition
Eh ) + [SiG] + LV ++ [AsGa = Ce-I + ASi] + I +a]
GGa As Ga As[Gas + [SiGaV Gal C-25
where [ ] denotas concentration.
Expressions for the equilibrium constants for equations C-6 through
C-24 may be written in the usual manner. As examples, the equilibrium
constants for equations C-6 and C-7 are
K As.] P_1 / 2 C-26o YAs. I "Asy
K7 C A ASGa] -Ia CVGa]- 1 p-1 / 2 C-27
Ga Ga s2
where y, represents the activity coefficient for species j in the solid
solution.
The model represented by equations C-6 through C -25 may be simpli-
tfed by considering the electroneutrality condition. Hurle C86] has
Shown that, at the temperature of growth, the Frenkel defect on the ar-
Senic sublattice dominates the electron concentration. Thus, the
B w mmm m ~ m m m ~ m~ am mmm mm mlm mm mf - m- -. . .

115
eleCtroneutraiity cCndILtion becomes
Ce-] :CyrI C -28
and the electron concentration at the growth temperature is given by the
a /2 r w i defined
e-] : _As2 c-29
Assuming that the defect structure of the epitaxial layer is
"rozen-in" at the growth temperature, the electron concentration given
by equation C-29 is used to determine the concentration of each defect
present. At room temperature, the compensation ratio, which is defined
* as the ratio of donors to acceptors (No/NA), is dominated by the ionized
silicon impuri.ties. Using the equilibrium constant expressions for
equations C-6 through C-24 along with equation C-29 yields
-2 CS iG] I C-30A SIAs] [SiGaVGa ap- 3/2 b°-- As 2 b
K- KK .- where a 3 3 3 16 y e - YSir,,q
K60 1KI "< 19 "yi YvAs As
b = K1IK16K18K 2 1Ye'YSi~a2A K23 (5 i V_
Ga Ga As
The dependence of the compensation ratio upon As2 partial pressure
for VPE grown GaAs has been found to be very small (No/NA=3). Thus,
consistent with Hurle's results for Sn and Ge doped material, equation
C-20 indicates that the dcminant acceptor in IPE GaAs is the Si GaVGa
Ccmolex.
An expression for the total silicon present in the epitaxial layer
is given by
B

116
[S]Total [SiGa ] +sa] + [S i ] + + S'Si ]
+SiGa VG + 2[SiGaSiAs C -31-3/2 + d-5/4 +e_ 1I/4 +b+IP3/4+
[Si]Total =(aPAs 2 dPAs + .As 2 As '
f + ca, j a S i C -3Z
where: d : (K ,, K / 2..... 1 Y_.. y -)/(K 2 K K K Y
8 131 taGa As As
I(K K I/lKI K + Y8 16YSi 're- 0 1 ZYV s9S i.a
Ga As Asf ,=(K3/2 .... 1/2. +I /2,.,/2.' K v
= S16 Si Ga e" a 11 Z"19ySi iAsg = K3/Z. K KI/2 ... K 1/2,,,(K3/2K2~ . .
1Ga~ a As As
aSi : activity of silicon in the solid phase.
Currently, the thermodynamic data necessary for the evaluation of
the equilibrium constants and activit, _Jfficients is not available.
Therefore, a quantitative :piication of equation C-32 is not possible.
It can be seen, hcwevcr, that the incorporation of Si into an epitaxial
layer increases with increasing aSi and depends, in a complicated way,
upon As2 partial pressure.
This model was developed for GaAs in order to keep the notation
manaceble. An analogous model can, of course, be constructed for InP,
which would yield identical dependencies upor Si and the group V dimer
partial pressure.

117
THERMOCHEMICAL PROPERTIES
INTRODUCTION
Summarized in this chapter are the thermochemical properties
used for the complex chemical equilibrium analysis. The proper se-
lection of a consistent data set is of extreme importance as a small
error in a property value can greatly influence the eventual calcu-
lated equilibrium composition. That this sensitivity can be important
is nicely illustrated in the Si-Cl-H subsystem as discussed later.
Essentially, what is required for these calculations is a means of
specifying the partial molar Gibbs energy of each species believed to
be present as a function of temperature, pressure and composition.
Approximately 150 species were initially examined while only those
Species that would be present at a mole fraction > 10- were included
in the analysis. The scheme of representing the data was to fix the
zero enthalpy scale at 298 K and I atm with the pure components (stan-
dard states) Ga(c), As(c), In(c), white P(c), HYg), Si(c), Cl2 (g) and
00(). The enthalpy of formation of the remaining components at the
standard conditions from the reference components was then determined.
In addition, the absolute entropy at the standard conditions for each
species was selected which allowed a calculation of the standard Gibbs
energy change for all possible reactions at 298 K and 1 atm. Finally,
knowledge of the constant pressure heat capacity and assuming ideal gas
behavior allows the Gibbs energy to be determined at any temperature and
Pressure. The jas phase was assumed to be a solution of ideal gases due

118
to the low pressure and hich temperatures investicatad. -For the con-
densed solutions, the pressure dependence of the thermochemical pro-
perties was neglected. However, the moderate negative deviations from
ideal behavior in composition dependence for the liquid source mixtures
was accounted for and represents one of the significant refineents
contained in these calculations.
Three pieces of information were required for each species with
the standard enthalpy of formation being the most critical, particularly
at the lower te.nperatures. It is for this quantity that the most un-
cartainty exists in the reported value. On the other hand, the standard
entropy is generally quite accurately known, either from low-temperature
heat capacity measurements or spectroscopic studies. The hioh tenpera-
ture heat capacities were sometimes estimated, but there exists a par-
tial cancellation of its effect when calculating Gibbs energy changes.
Presented below is a discussion of the properties selected. It is noted
that in many instances the thermochemical data presented in the JANIAF
tables [21,87-88] were used and are discussed in these tables, th're-
fore precluding a discussion here.
Psuedo-Steadv State Constraint for Liquid Source Boat
It has been observed that during VPE of GaAs and InP using a liquid
source boat of pure group III metal in the chloride process, an initial
transient period exists in which the composition of the gas stream
leavine the source region is a function of time. Initially, the pure
metal boat is dissolving group V atoms thus producing an excess of group
r:! chloride. As the metal becomes saturated with the croup V element,
a thin crust of the co-mocund is formed at the top surface since the
densit.y of the compound is less than that of the saturated liquid. It

£A 119
is observed that the crust thickness reaches a steady state value and
therefore, from a simple mass balance, the vapor phase will contain
all of the group V atoms in the input stream plus the amount of group
V atoms cenerated from the saturated liquid (due to reaction of chlorine
with the group III atom). The exact amount of group V element pro-
duced frcm the source boat is therefore a function of the temperature
(i.e. the equilibrium group V mole fraction in the liquid is a function
of temperature and the amount of group III atoms leaving depends on the
form in which they leave (e.g. IIICl, IICI3 , III, et.)) and the flow
rate (i.e. mass transfer efficiency). The mechanism by which the group
III and V atoms reach the gas/solid interface is not known but is not
required for the thermodynamic model presented here as mass transfer
barriers (e.g. the crust) are assumed not to be present. *All that is
required is to assume a ne. species exists having a stoichiometry
equivalent to the saturated liquid composition.
The thermodynamic properties of the hypothetical liquid species,
A lxB (1), can be estimated in the following manner. Letting A repre-
sent the group tI atom and B the group V atom, consider the reaction
sequence
(1-x) A(c) (l-x) A(l) C-33
x B(c)= x B(1) C-34
(l-x) A(l) + xB(l) = AI1 XB (1) C-35
all occurring at the source temperature, T. Since A(c) and B(c) are in
the pure state, the Gibbs energy changes for reactions C-33 andC-34 are
te Gibbs enercies of formation for the liquid species and can be cal-B
culated frcm the the mcdynamic sequence: solid element A or B is taken
frcm T to its meltino temoerature T or T the solid element is melted," ' l m
ai

120
the liquid elemenz is taken -from the me7-ti;nc tsrnoeralture to the ori-
ginal teiperature of interest. Approximating the heat capacity
dif-ference betWeen the pure liquid and pure solid, AC p, as a constant.,
the Gibbs energy chance for reac-tions C-33andC- 34 are
AG1 = (l-x)CAHA ( L - .) + AC (T - TA- T In C-3
and
AG2 -= x fan, (I Ac8 T; - T I n C--3I P T M
The Gibbs energy change of the third reaction is simply the Gibbs energy
* of mixing. Assuming that a simple solution model describes the liquid
behavior results in
AG 3 = (a + bT) x (l-x) . RTixlnx- + (l-,x) ln(I-x)] C-38
where a and b are adjustable parameters determined in conjunction with
solid-liquid equilibrium data.
The sum of reactions 0-33 to C-35 is the desired formation reaction
(I-x)A(c) + x 8(c) = A 1- a (l) C-39
while the corresponding Gibbs energy of formation of A 1 - 8 (1) is the
sum ofi AG 1 to 41G 3 Given the source temnperature, T, the procedure is
to first calculate the liquidus composition, x, from the implicit
equation
T HA - R InCdx(l-x)] + b1 - 2-(-)2] AS* ~TAB m bCi - lx M
m
a!- x' C lx 2 -40
" -ASwhere , _ and T sare the enthalpy o-f Ilusion and melting temperature ofM m
the solid ccm-pound AS and R is the gas constant. Once the equilibrium
group V/ ccmoositfon is decermined the standard Gibbs energy of for7-ation

121
Table C-3
Thermochemical Prooerties of GaAs and InP Recuired
for Calculating _GA, B (1), T]
Prooerty GaAs Reference InP Reference
TAB (K) 1511 82 1332 81,82,84
1AI (kcal/mole) 25.14 82 14.4 81-83
a (cal/mole) 4666 see text 5055 85
b (c-l/mole - K) -8.74 see text -5.0 85
B
Table C-4
Themochemical Procerties of the Elements Ga. In, As and P
Recuired for Calculating AG*4AIxB(1l), T
£ Prooert/ Ga Ref. rn Ref. As Ref. P Ref.
T (K) 302.9 93 429.76 93 1090 45 313.3 57
AH (kcal/mol e) 1.336 93 0.78 93 5.123 45 0.157 57
AC p(Cal/mole - K) 0.27 93 -0.2 93 1.0 estimated 0.472 93
ap

122
of A1 _ BX(1) can be calculated from equationsC-36 to C-38given T, x
and the required thermochemical properties. Tables C-3 and C-4 summia-
rize the thermochemical properties used in these calculations. The
adjustable parame-ers a and b for GaAs were determined by reduction of
the liquidus measurements of Clariou et al. [89', Hall [901, Muszynski
and Riabeev [91] and Osamura et al. [92] using a maximum likelihood
algorithm.
The Ga-As-Cl-H Syste=m
The enthalpy of vaporization of As(c) has been investigated quite
extensively with a reported range [93-108] at 298 K of 34.4 to 38.54
kcal/mole corresponding to the standard enthalpy of formation for
As4 (g). The literature has been surwarized by Hultgren et al. C931
to 1973, while a more recent measurement of Rusin et al. [94] by a
Static method produced a value of Ht(As g, 298 K) = 38.14 kcal/mole.r 4'
In addition, Rau C1092 has measured the total vapor pressure over solid
and liquid arsenic from 8S0 to 1400 K with a 8ourdon gauge. Analysis
of the low temoerature results indicated H(As4, g, 298 K) = 37.34 +
0.? kcal/mole. The value selected was 37.5 kcal/mole on the 'basis
a that the static methods are believed to be more reliable.
The dissociation enthalpy, H!(As4 2As2, 298 K), has received
considerable investigation with early mass spectrometric studies pro-
a ducing values in the range of 61.5 to 73.5 kcal/mole CllO-114]. These
measurements are suspected of overestimating the As4 partial pressure
as a resul of the use of a low condensation coefficient for As4 . Mcre
re-ent de-ern.inations using MoAs2 , r0o2As,, GaAs, InAs and InAs + InSb
SOurces wizh improved Knudsen-call mass-spectrometer designs Cll5-117
and reduction of PVT measurements C1091 have indicated much lower values

L123
for the dissociation enthalpy (54.21 : 1.5, 54.26 1.1, 54.2 " l. and
W54.8 + 1.0 kcal/mole, respectively). The value selected here is the
average of these four measurements, 54.4 + 1.5 kcal/mole. Using the
selected values of the standard enthalpies, AHM(GaAs, c, 298 K) = -19.52
kcal/mole, AH,(As4, g, 298 K)'= 37.5 kcal/mole and the above dissociation
enthalpy yields &H0 (GaAs(c) = Ga(c) + T As2 (g), 298 K) = 42.5 kcal/mole.
This can be compared to the experimentally determined values of 44.85
£115], 45.06 £116] and 45.4 £118] kcal/mole.
The value adopted for 8H°(GaAs, c, 298 K) it -19.52 kcal/mole as
determined by Martosudirdjo and Pratt £119] with a precipitation calori-
0 metric technique. This value can be compared to the enf work of Abbasov
[120] and Sirota and Yushevich [121] in which values of -19.4 and -20.96
kcal/mole were reported, respectively. These latter two values are expected
to include uncertainties due to the assumed valencyof Ga in the gal-
vanic cell and the inability to accurately determine the full te_,mpera-
ture dependence over the relatively small temperature range of measure-
ment. rn addition, a considerable number of dissociation pressure
stuides C111-116,122-i27 ] and flow equilibration investigations with
rCactive gases £118,128 ] have been performed which contain information
about solid GaAs. However, knowledge of the thermodynamic properites of
other species is required (i.e. As2 (g), As4 (g), GaCl(g), etc.)-to speci-
fy the properi tes of GaAs(c). Thus, the uncertatfty tn thase'proper-
ties must be considered in addition to those associated with the measure-
ments. This work was, however, used as a test of inter7,al consistency
in the toc1 da:_a set. The standard entropy of GaAs, S (GaAs,c,298 K)
was taken from the low temperature heat capacity measurements of Pies-
bergen C1291 while the high temoerature heat capacity was ta:ken from the
• B w. i w m mmm m mmNmm m n lf m..
124
measureents of Lichter and Sonmeiet 130] and are in cood agreement
with the work of Cox and Pool [131] and the estimates of Marina et al.
[132] and Maslov ana Naslov [133].
Very little experimental information is available for the arsenic
chlorides. The reported range for the enthalpy of formation of AsCl3 (g)
is -52 to -72 kcal/mole [106,108,134-139]. The value adopted was
&H*(AsCl3, g, 298 K) = -02.7 kcal/mole, taken from the enthalpy of
formation of the liquid and the enthalpy of vaporization. The enthalpy
of formation of the mono and dichlorides were taken from the estimates
of Shauiov and Mosin [136] as was the standard entropy and heat capacity.
The enthalpy of formation of arsine was taken as 6Ht(AsH., g, 298 K) =
16.0 1.5 kcal/mole based on the work of Gunn C140] and reported tabu-
lations [106-108].Finally, the thermochemical properties of the remain-
ing arsenic hydrides were estimated by comparison with the hydrides of
N, P and Sb [21,87-88].
The thermodynamic information available for the chlorides of gallium
is some,:what scarce and inconsistent. The enthalpy of formation for
GaCl3 (g) was determined from aH*(GaCI3, c, 293 K) = -IZ.0 kcal/mole
*(141) and the enthalpy of sublimation taken from the vapor pressure
measureaments of Kuniya et al. C142], aHl(GaCI 3 , g, 298 K) = -107.3 + 3
kcal/mole. The enthalpy of formation of gallium monochloride ha's the
A reported value aHl(GaCl, g, 298 K) = -19.5 kcal/mole and is taken from
the dissociation energy of Barrow C143]. However, a value of ,HI(GaCl,
rr9, 298 K) =-12.0 kcal/mole is obtained using AH!(GaAs(c) + HCI(g)
GaCl(g) + As (g) +. H2 (g). 950 K) = 37.52 + 3 kcal/mole determined
by Battat et al. C128] and the ther-nochemical data selected for the other
scecies. These results are in sharp czntrast to the vapor pressurea\

125
measurements of Kuniya et al. 142] who repocrt a second law L,,f(GaCl 3 (g)
= GaCl(g) + Cl2 (g), 1083 K) : 45.912 kcal/moie. The value selected was
AH_-(GaCI, a, 298 K) = -17.0 5 kcal/mole based on the first two re-
ports, considering the value of Barrow [143] slightly more due to the
uncertainties found in the enthalpy of formation for the other species
in the reaction studied by Battat et al. 028]. The enthalpy of forma-
tion for gallium dichloride was taken from the measurements of Battat
et al. 028] using the thermochne-nical data selected here and correcting
the second law entropy to that calculated by Shaulov and Mosin 044 ]-
The enthalpy of dimerization has been investigated by several authors
C142,145-148 I with the reported enthalpy and entropy of dimerization
in the range, AIH'(ZGaCl3 (a) = Ga Cl() 293 K) = -22.6 to -20.9 kcal/
mole and S°(2GaCl3 (g) = Ga2Cl6 (g), 298 K) = -31.66. to -36.0 cal/mole-K.
Acceptina the enthalpy and entropy of dimerization as -21.0 kcal/mole
and -33.0 cal/mole-K, respectively, and combining these results withthe selected thermochemical data for GaCI produces AH 2(Ga , g, 298
GC3 1H(Ga l
K) = -235.6 + 10 kcal/mole and S°(Ga CI, a, 298 K) = 127 + 6.0 cal/
mole-K. The standard entropy and heat capacity for GaCl, GaCI 2 and
GaCl 3 were taken from Shaulov and Mosin C144] while the heat capacity
of Ga2Cl6 was approximated by the value for Al 2Cl 6 C21 ] . In addition,
other species are expected to exist (i.e. Ga2 Cl4, Ga2Cl2 ) [9-49,150 ],
but no thermochemical data is available.
The tn-P-Cl-H System
The standard entropy at 298 K and the constant pressure heat capac-
ity of solid and vapor In were taken from Hult*.ren et al. [93" . As sum-
marized by Hultgren et al . C93], the standard enthalpy of vaporization
o solid In at 298 K that results from application of the third law
L
126
to the vapor pressure measurements produces the range of 49.8 to 58.1kcal/mole for &Ht(ln, g, 298 K). More recent mass spectrometric re-
sults of Panish and Arthur [141] and Farrow [151] suggest the values
of 56.6 and 58.03 kcal/mole, respectively, with the average of these
two values adopted here. In a similar fashion, the thermochemical
properties of phosphorous selected by Hultgren et al. C93] or the
JANAF tables [21] are in agreement with the more recent results [141]
and were adopted fdr this study. However, there exists a small dif-
ference in the reported &H°(298 K) of the reaction: P4(g) = 2P2(g).
Foxon et al. [152] report a value of &H°(298 K) = 57.9 + 1 kcal/mole
while Panish and Arthur [141] reported aH°(298 K) = 53.8 - 0:8 kcal/
mole frcm third law calculations of their mass spectrometric results.
The third law reduction of the mass spectrometric results of Farrow
051] produc.: - value of AH°(298 K) = 58.04 - 0.3 kcal/mole, while
the JANAF ables [21] suggest AH°(2S8 K) = 54.6 - 1.1 kcal/mole. An
average value was selected of aH*(298 K) = 56.1 + 2.0 kcal/mole.
A rather wide rance in the reported values for the standard en-
thalpy of formation of solid [nP exists (-13.52 to -22.3 kcal/mole).
As shown in Table 4-3, the value selected was the average of the two
solution calorimetric determinations as this is a direct determination
of the property. The results from the vapor pressure measurements arer
,41 subject to uncertainties in the properties of the vapor phase species
and also the heat capacity of solid InP (e.g. Punish and Arthur C141]
used C for A!Sb which produces a decrease in 6H'(InP, c, 298 K) ofp
0 0.5 kcal/mole, when compared to Cp (nP, c, T) of Pankratz [153]). The
s5andard entropy of InP(c) was taken from the low temperature heat
capacity measure.ments of Piesbergen [129] while the heat capacity

127
Table C-5
The Recorted Standard Enthaloy of Formation of
InP(c), 6HIH(InP, c, 298 K)
&H , [InP(c)] Method Reference
kcal/mole
-18.83 ( (b) flow equilibration 141-18.-8 + 0. mass spectrometry 141-22.3 1 5 , mass spectroretry 113-19.33-- 6.l d vapor pressure 118, 154-17.83 + 1 .4(d) calculated 118
-21.f (e) calculated 155-20.33 mass spectrometry 151, 152
-13.52 + 0.26 solution calorimetry 119-71.0 2 bomb calorimetry 156
* -21.5 .T-.5 bomb calorimetry 153, 157-14.5 + 0.44 solution calorimetry referenced in
119
(a) InP(c) = In(c) +1 P(g), H'08 = 360 kcal/mole
I H, 2%8CP2 g)J taken as 34.34 kcal/moleI° = 22.1 k2l/m)l
(b) InP(c) = In(c) + P,(g), H1 8 = 22.1 kcal/mole
Ht ( taken as 14.08 kcai/moler ,298C4()
(c) InP(c) = In(c) + P2 (g), H238 = 36.5 kcal/mole
H ,298P (g)] taken as 34.34 kcal/mole
(d) InP(c) = In(c) +- P2 (g), H2. = 35.0 kcal/mole
H! 2 8 CP2 (g)] taken as 34.34 kcal/mole
(e) InP(c) = In(c) +l P (g), H°0 8 = 37.50 + 0.1 kcal/Mole
H! 2 98CP2 (g)] taken as 34.34 kcal/mole
a
a128
a.ooted was that measured by Pankratz [153]. The result is in good
agreement with the 298 K value of Piesbergen [129] and in fair agree-
ment with the high temperature measurements of Cox and Pool C1311
and the suggested value of Maslov and Maslov 033].
Barrow £143] reports the dissociation energy of InCl to be 102.5
kcal/mole and combining this with the value of the enthalpy of fcrma-
tion of In(g) and Cl(g) yields AH*,(InCl, g, 298 K) = -16.21 kcal/mole.
However, the atomic fluorescence value for the dissociation energy
also reported by Barrow C143] (00 = 104.6 kcal/mole) yields &H!(rnCI,
a g, 298 K) = -18.31 kcal/mole. Kle.m and Brautigan [158] reported
&H*(InCl, c, 273 K) = -44.6 kcal/mole and when combined with the
enthalpy of sublimation, .Hs(InCi, c, 298 K) = 27.8 kcal/mole [159]s
gives &HI(InCl, a, 298 K) = -16.8kcal/mole and is the value adopted
here. The standard entropy of EnCl was taken from the calculations
of Malakova and Pashinkin [160] while the heat capacity is that
recomiended by Kelly £161]. The standard enthalpy of formation and
entropy of nCl 2 was taken from the estimate of Glassner C162] and the
heat capacity is the same as that listed for GaCl The standard en-
a thalpy of formation and entropy of GaCl, was taken to be the values
suggested by Mullin and Hurle [106]and the constant pressure heat ca-
pacity estimated by Shaw £107]. The thermochemical properties of the
dimer, in2Cl6 , were taken from the values suggested by Schafer and
Binnewies 0148].
The standard enthalpy of formation of phosphine was taken from
S the deccmposftion studies of Gunn and Green £163] and the remaining
properties f the JANAF tables [21, 883. The JAM1AF tables were also
used for the other phosphorous hydrides, chlorides and oxide vapor
S phase species.

__ 129
The Si-Cl-H Svste.m
The thermochemical properties of Si have been reviewed by Hultgren
et al. C93] and the JANAF tables [21]. In particular, there exists a
rather large rance in the reported third law values of the standard en-
thalpy of vaporization, &H_(Si, g, 298 K) = 86.75 to 109.06 kcal/mole.
The value selected was in between the Knudsen studies of Davis et al.
C164] and Grieveson and Alcock [165].
The Si-CI-H system has received considerable attention due to its
importance in the semiconductor industry. An excellent review of the
literature for this system with equilibrium calculations presented is
given by Hunt and Sirtl 01661 and Sirtl et al. 0672. The posture taken
here is to assume that SiCl4 has the most reliable the-,odynamic data
with these values being fixed by the JANAF tables [211. The reaction
Si(g) + SiCl4 (g) = 2SiCI2 (g) C-42
has been investigated extensively [168-1731. Employing the thermo-
che-.ical data for the three species in reaction C-42from the JANAF
tables [21], third law values of AH,'(SiCI 2 , g, 298 K) were calculated
from the experimental data. The effusion-mass spectrometric deternin-
ation of Farber and Srivastava [168] over the temperature range of
1593 K to 1792 K produced the value, AH!(SiCIZ , g, 298 K) = -40.39 +
0.3 kcal/mole and showed no temperature dependence. This result is
in good agreement with flow equilibration data of Schafer et al. C169]
(1273 K to 1473 K), Teichmann and Wolf C1701 (1223 K to 1575 K) and the
stat.ic measur=.ments of Schafer and Nicki l71] (1398 K to 1573 K), with
third law values of --'0.52, -40.54 and -40L.4a kcal/mole, respectively.
The flow equilibrium values of Antipin and Serceev [172] (1273 K to
1673 K) and the s:ztic values of Eshino et al. [17j (14-3 K to 1573 K)

a 130
were more necative and exhibited a marked temperature dependence. On
the basis of these calculations, the value AHe(SiCi g 298 K) =
-40.4 kcal/mole was selected. The values for the standard enthalpies
WN of formation of the less stable chlorine SiCl and SiCl3 were computed
from the high temperature flow equilibrium studies of Farber and Srivas-
tava [168]. In the third law analysis, the data previously discussed
was used in conjunction with the heat capacity for SiCl and SiCl3 ,
suggested by the JANAF tables C21] and produced the value of 47.4 + 0.6
and -93.3 + 0.5 kcal/mole, respectively. These results are in agreement
* with the analysis of Rusin et ai. C174-176] on the total pressure meas-
urements of Schafer and Nicki C172i. No additional thermodynamic
studies of Si2Cl6 are known to exist and thus the properties suggested
by Hunt and Sirtl 066] were adopted.It was pointed out by Hunt and Sirtl 0166 ] that the mole ratio of
SiC14 to SiHCI3 is very sensitive to the assumed value of the standard
~enthal py of formation of SiHC13 . Indeed, this ratio is seen to vary
by nearly four orders of magnitude at 1000 K when bounded by the ex-
perimental determinations of IH0 (SiHCI, g, 298 K). Since the work of
-- Hunt and Sirtl C173] was published, two additional experimental in-
vestications of the thermodynamic properties of SiHCl3 have been per-
formed. Farber and Srivastava C177], from effusion-mass spectrometric
am measurements, determined the reaction enthalpy for
SiCl4(g) + H (g) = SiHCI 3 (g) + HCI(g) C-42
over the temperature range 115-4 K to 1500 K. Employing the thermo-
* dynamic data listed in Table C-6 and these results, a relative temper-
ature insensitive third law value for -H f(SiHCI3, g, 298 K) = -119.30
+ 1.0 kcal/mole is obtained. Using both static and dynamic methods,

131
Woif and Teichmann 078] investigated reaction C-42 and the reaction
4SiHCl3 (g) = 3SiCl4(g) + Si(c) + 2H2(g) C-43
Third law values for L-H(SiHCI1 g, 298 K) were calculated from the
original results of these authors. The values obtained for reaction
C-43 and for the three data sets with reaction C-42 were -119.47 +
0.4, -119.83 + 0.9, -119.5a + 0.2 and -119. 0 + 0.6 kcal/mole and the
results are seen to be in good agreement with the measurements of
Farber and Srivastava C177]. Since these values were nearly 3 kcai/mole
more negative than those developed by Hunt and Sirtl [166], values of
Mx(SiHCl3, g, 298 K) were calculated for various experimental SiCl./
SiHCl 3 ratios in a fashion similar to Hunt and Sirtl. The experimental
data consisted of a variety of feed mixtures (e.g. SiCl4/H2, H2/HCl,
SiHCl%/H 2 ) whichwere contacted with Si(c) at different temperatures
during a deposition/etching process. The results of these c-lculations
for 14 data sets suggested 4!(SiHCI3 , a, 298 K) = -118.16 + 1.70 kcal/
mole. Based on these results and the new experimental determinations,
the value adopted was L.Hr(SiHCI 3 , g, 298 K) = -119.5 + 1.5 kcal/mole.
The standard enthalpy of formation of the di- and mono-chloro-
silanes was taken from the recent measurements of Farber and Srivastava
C177]. In order to obtain a consistent data set, third law values of
these quantities were calculated frcm the original experimental data
while using the data base adopted here. The adopted values were
d-H!(SiH 2Ci2 , g, 298 K) = -75.5 + 2 kcal/mole and 6Ht(SiH3 Cl, g, 298 K)
-32.7 + 2.5 kcal/mole.
No additional experimental infor-,atian on the thermcchemistry of
SfH4 and SiH exists and thus the JANAF tables recommendation was adopted.
The standard enthaipy of formation of disilane was taken frcm the

.AL 132
cal ici lations of Po tzi ncer et al.[7) H(iHg 298 K) =17.1 +
3 kcalfmole and is compared with the calculations of O'Neal and Ring
C1761, AHO(Si 46 , g, 298 K) = 19.1 kcal/mole and the value of 16.0 kcal/
mole obtained from the estimated enthalpy of formation for SiH, (-25
kcal/mole) and Si-Si (-54 kcalmole). The standard entropy and heat
capacity of Si 2H6 were obtained by comparison with C 2 .6.
A surmary of the selected ther-moche-mical properties (wtth two
additional references [181, 182)) is presented in Table C-6. In or-
der that the stabil ity of the various species might easily be compared,
the standard molar Gibbs energies of formation are plotted in Figures
C-1 throuch C-5.
iAb

133
M ~ec c km t.o~ t.0 , M cn -z -:-C, C
C -l CC C -,
S a I
Ln % C C en %a 'm -un-, C%.J C ~ ~J ~Cl4 t
t C C" ~C %,X: r O~0 C C14 aC C.
4A c4C C
Ln C, Ln c c
en C " %0 U,, L .J - C -* C I~ ~r=~- r a~ C .r-. ej IJ
n a )
'C~ ~ ~~ =- to '
L) 'C~t. C C C%-' Ca 'C 4= 'CCC -,U
cnc a c Q '' - -L ' C C Cj ca :1 a C% rn~ C% C -c-
.-7 -c -- CrU-' C
-g I- - I C CI Ct *C CCC
-CC~~~~ CC C **'
a- C~ r- ac- Q Cn C CCt C
2- en- -aI-- -a-
C 4 r" CcC C,4
-l.1'A . 1 wr4 ::- -a-

4A 1 3 4
M M- M~-~*r C C -n -- - ., - -- -,m~ c0cto) %. Z to cc CC. Cjj csi Ce'J to c~c j c o CjC4CjC
a, -- -C -CC
I I a~ to c'. a % n ia
o C O
C -t %a gr 1 -ne " ct n C1
"to , IC en a a C-to en ena C % ICi I, C-4 a- a
m m )* j k C t M o * r,- - 0 -
2 (Z C%(m-c
tOc C t
" =" I= rJo -Cr Io -C, t_, C% f- ~ .
00 C) C * C C C C C-J C C', t0 00 CC-cu Ic ICt- I* a
+.. C.j to C - Cto+o +1 +1 o 1. 41t- I -I C CC - to + ;-I-
C' n I I I r I I
C.IC to CJ*. Ct'n~tbg to 4XI C C C c o %C Is en .N C.J toC, n~t C .- CJ . C C
k .- - . a- -C JI
ci~~~C 0- - -
IL t

1.35
r- r-o - -j - - - ,.0 2 c I--) c'
=. C C
C% INS m
-l -- en C= I I=2~
- - -" % a -'J C C C%;-a Ln I e
(U -'. o Ci IN~ CI Ci Li co t. ic I
+ I~ .- I
C's I-. C- C% C~
I;-C InI I I a
c 0
+0 1- 4.1 Iv. I i i 1 1 +
- ' 1c C= 01! r "~i ul '"2 cl IZ -1 - In C 1 mI'a~ a% a C- a %n " Ic- aI
C% U, C- a Is If~
& I Owa l
Cc
- --
vi %m - k C C i V v

136
40
Ga (c)
Innc
Gaa
060
Fiair C-I
GiosEeri5 fFaiat~l a- alifl n IdumSe2e
(an lO~~ rsu

Vm 137
20
AA
Figur C-
(TemO~peatr P(Ks)
Fiue -
Gibb Enrgie ofFornatin fr Aseni Spcie
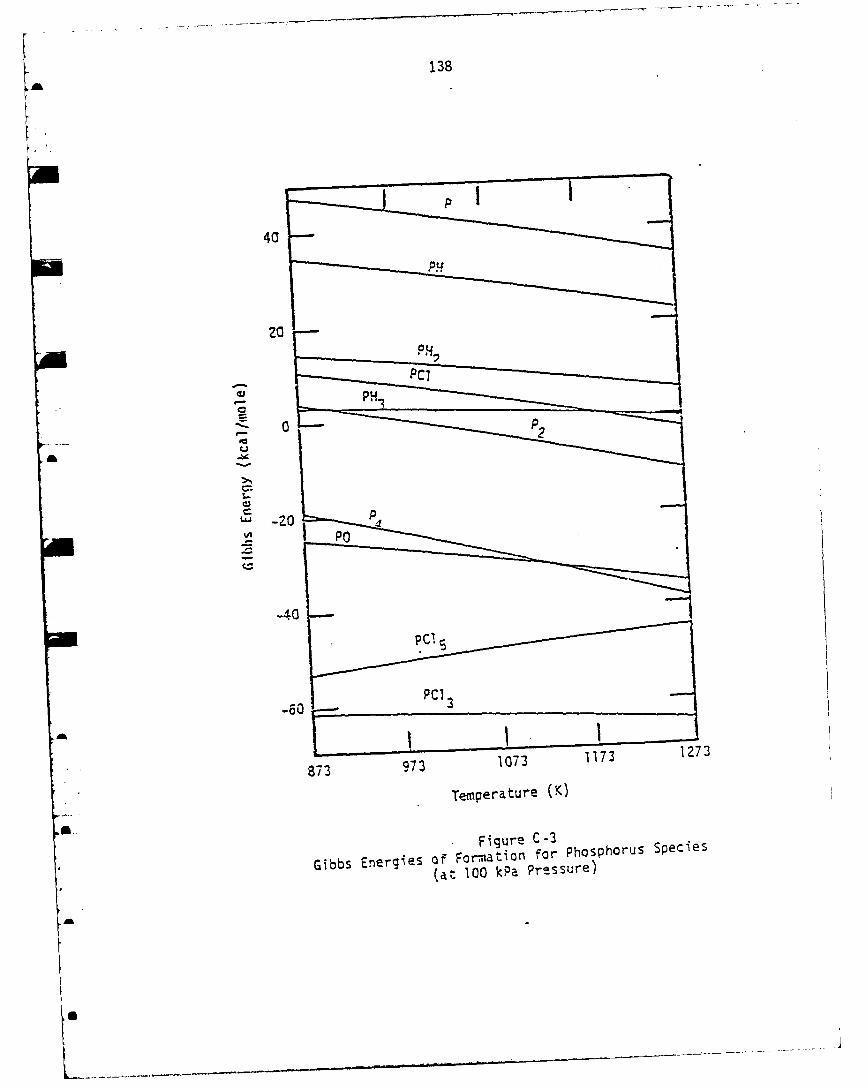
138
I P140
z0
4,1
CC
0
a - 40
I
973 1073 1173 1273
Temperature (K)
Figure C-3
Gibbs Energies of Formnatiofl for Phosphorus Species
(at 100 kPa Pressure)

AL 139
Si~cf
SiHiCH
22
SiH9 C1.d
I ~ ~SilCl3 -jIIIIiC SiHCI 3l
SiC~l
Siis(C
a -120L
873 973 S 1073 1173 1273
Temnperature (K)
Ejoure C-4Giobs En~ergies of For-ration for Silicon Spce
(at 100 kPa Pressure)

140
400
20
C-C7
0H
HG 2
-40
873 973 1073 11713 1273
Temperature (K)
Ficure C-5*Gibbs Energies a-- For-maticn in the H-Cl-O System
(at 100 kPa Pressure)

141
RESULTS AND DISCUSSION
Chemical Ecuilibrium Investication
The product of the equilibrium calculations was the composition
of the vapcr phase in the presence of excess condensed phases. The
composition was investicated as a function of temperature, pressure
* and inlet cas composition. The usual procedure was to vary one of
the operating conditions while holding the remaining ones at their
base values. The graphical representation of these results illustrates
the equilibrium vapor mole fraction of each of the species versus the
parameter varied. Since the primary objective of this study was to
examine unintentional Si incorporation levels, mole fractions are
10shown typically down to a level of 10 (0.1 ppb). The Si species
were always found to be below 10-5 mole fraction. Therefore, only
the lower five orders of magnitude were shown in many cases unless the
& Upper range was necessary to understand the results. A full parametric
analysis was performed and over 160 plots were generated. In many
Cases, the results were similar to analogous system, thus, this chap-
ter includes only those graphs necessary for understanding the prin-
cipal phenomena predicted. In interpreting these plots, it should be
re Cjz that an excess specie serves to hold the act.ivity of that
s Scecie at a c-nsc2nt value. For example, with solid SiO 2 present, the
acti.,ity of 5O2 is fixed at unity and therefore the product of the Si
L A

142
and 0 partial pressures is aiso fixed. thus, changes*in operating
parameters that alter the OZ fugacity will alter the Si activity by
the same degree in an inverse fashion.
The GaAs Chloride System
The effect of te.perature on the species present in the GaAs
chloride system source zone (100 kPa pressure, inlet composition:
1% AsCl3 in H2) is shown in Figures C-6 through C-9. Figures C-6 and
G-7 apply to the systemn which used a liquid group III source, GaXAsl1 X
and Figures C-8 and C-9 represent the results for the system which em-
ployed GaAs(c) as the group III source material. At low temperatures,
GaCl 2 and GaCl3 became relatively important callium vapor species along
with GaCl in the solid source system. In the liquid source system,
GaCl is the dominant callium species over the entire temperature range
examined (373 <T <1173 K). In both systems, As4 was the dominant
arsenic species at low temperature while As2 became important at hightemperatures. In contrast to previous studies C48-49 ], the trimer,
As3, mole fraction was not negligible. In general, comparison of the
silicon activity for the two source zones revealed that the silicon
activity associated with the GaAs(c) source material was much lower
than that which resulted when a liquid source material was employed.
The predominant silicon species in the vapor phase of the system which
used a solid source were the hicher silicon chlorides in contrast to
the hydrogen rich silicon species found in the system which used a li-
quid source. An additional interesting feature is that the total mole
frac-ion of silicon compounds in the vapor for the system which employed
a solid source was greater than that for the system which employed a
liquid source. At first glance, this fact seems contradictory to the
lower observed silicon activity.

AL 143
10-
GaCi
c 10-
HC
Gec
"L AS4
0-4
10
873 973 1073 1173
Temperatura (K)
Figure C-6Evea: of Tem.ceraturs in the GaAs Chioride System Source Zone
* (Liquid Scurce)
a .d. ._. r w.. m m m m .. -w. m g . w

144
.00-1
S 10
10 10
CC
10- 10083973 1073 1173
Temperature (K)
Figure C-7Effect of' Te!7cerature in the Ga.As Chloride Syvsteri Source Zone
.0 (Licuid Source)

145
10-1-
HCJ -Gar,'
C
10-3
1-41
10-
873 931073 1173
Trmpera ture (K)
Fioure C-8Effect of Ternerature in the Ga.'s Chloride Systemn Source Zone
(Solid-- Source)

146
10-7 310
o 4 J
10 10
873 973 1073 1173
* Temperature (K)
Figure C-9E 0-c o Temoeratura in the GaAs Chloride System Source Zone
(Solid Source)

147
The foilowinc reaction equations may be written to describe the
formation of silicon chlorides, chlorosiianes and silane resulting
from reactions with the quartz reactor wall.
SiO 2(c) + nHCi + (4-n)X, = 2H20 + SiHCl n=0,1,2,3,4 C-44
k~iO2(c) + kIaHCl + k(2--n/2) 2 = ZkH20 + SikClkm
k=1,2 m=0,1,2,3 C-45
Reactions C-41 and C-42 represent a set of independent formation reactions
which describe the interplay between the dominant vapor phase silicon
species present in the system. Assuming ideal gas behavior, the equili-
* brium constants for these reactions are as follows:
-2 n n C-46Kl,n= YH YSH / . YHcl T0n i H4_nCl n YH"Z'H T
and
2k pl-km/2 /yk(2-m/2) --2'k m'm= H 20 YSikClkm T H Ykm-'2~~~ k rHCl 4
where yi= vapor phase mole fraction of species i
P-= system total pressure ratio (total pressure/reference
state pressure)
The activity of silicon residina in a condensed phase which is ata
equilibrium with the vapor phase may be calculated from any reaction
using a vapor Si species reactant and solid Si product. For example,
£ consider the following reactions and subsequent equilibrium expressions
for the activity of Si(c)YSiH¢
Si(c) + 2H2 Sip a,,= C-48
K.Y_ P_
2Si(c) + 4HCI SiC 4 - 2H2 a YSCl H C-49
4 Si 4 2 C4
6 Y C 1dN

148
Here K. is the equilibrium constant for reaction (i=5,6). Other equi-
valent relations may be written in order to calculate the condensed
phase silicon activity but the models suggested in equations C-47and
C-48 serve as convenient points of focus since either SiH 4 or SiCl4 is
usually a significant silicon vapor species in the systems studied.
In particular, for those systems using HZ as the carrier gas, the mole
fraction of H2 is nearly constant with a value close to unity. There-
fore, asi will track the SiH 4 mole fraction and is inversely propor-
tional to the system pressure. Both models of course yield identical
a values for the silicon activity when applied to the same situation. The
activity of Si presented in these plots can be viewed as the value found
in a solid phase in equilibrium with a vapor having the composition
shown. In order to translate this into a solubility, the nature of the
solid phase must be considered (i.e. the activity coefficient must be
known). Due to the low degree of doping encountered in these systems,
(e.g. typically < 1015 cm-1 which is <100 ppb), the activity coeffi-
cient can be represented by Henry's constant, which is invariant with
respect to composition. Therefore, an increase in Si activity corre-
sponds to an increase in solubility. Thus, the models provided by
equationsC-47 and C-48may be used to predict the direction of change
in the silicon concentration based on the knowledge of the vapor phase
equilibrium composition.
The lower silicon activity associated with the solid GaAs source
can therefore be viewed as due to a suppressed SiH concentration when
ccmoar'd to the liquid source (equation C-47). In the source zone,
which employed solid GaAs, the presence of primarily higher chlorides
and chlorosilanes at the lcwer source zone temperatures was a result0

Id 149
F less 2allium being present in the vapor phase than was present when
a liquid source was employed. Since Ga was in excess in both the li-
quid and solid source systems, the activity of Ga was constrained with
the liquid source exhibiting a higher Ga activity. Thus, sufficient
HCl was available due to the decomposition of AsCl3 and the absence of
enough Ga to consume it to enhance reactions C-44 and C-45 for large k
and m values. Figure C-1C which shows the chloride system pre-source
zone (1' AsCl3 in H2, no group III source material present), further
supports this analysis. The absence of group III chlorides caused the
total amount of silicon in the vapor to increase above the level ob-
served in the solid source system while the condensed phase silicon
activity decreased even further.
Table C-7 lists the enthaloy of formation at 298 K and the Gibbs
energy of reaction at 973 K for some of the vapor species described by
reactjionsC-44andC-55. The large negative enthalpies of formation are
indicative of strong interatomic bonds and therefore stable species.
Since equilibrium represents the state having the lowest value for the
Gibbs energy of the system, species with a lower Gibbs energy of re-
action are favored. Therefore, providing sufficient chlorine to react
with the silicon species results in a higher total sil'icon concentration
in the vapor phase but, due to the stability of these species, a lower
activity of solid silicon in the condensed phase. The relative stability
of silicon halides, when compared to silicon hydrides was also recog-
nized by Rai-Choudhury [4,0].
• The outlet equilibrium compositions of the source zones using
solid or liquid source .aterials at 973 K were used as input to the
mixing zone and the effect of mixing zone temperature was investigated.
i m~ mmd ml ~m m 4m mm . mmmmmmmm~mwj

150
110
10~ / 10
0- I0
Figur C10E'etc Trprtiei heG~ hlrd yse r/oreZn

151
Tabl e C-7
Enthalcies of Formation and Gibbs Enercies of Reaction
far Somre Silicon Vacor Soecies
.j98K* C298K*
Vapor Specie (kcal/rnole) (kcaT/rnole)
*SiCl 4 -158.4 51.4
SiHC1 3 -1.19.5 60.5
SiC1 3 -93.3 69.8
SiH 2 C12 -75.5 76.9
SiC12 -40.3 81.8
SiH 3 C -32.7 94.0
SiXli4 8.2 111.5
SiCi 47.4 129.8
Si 2 C16 -236.0 139.5
*Ref'arenca state: Si(c), Cl2(v), H2(Y) at Z98 K and 10.0 kPa

152
The system usina a licuid scurce material displayed behavior which
was nearly identical to the source zone behavior. This supports
Weiner's model [58] which suggeszed using the outlet composition of
the source zone as the inlet composition to the deposition zone. This
model is only applicable, of course, if the source and'mixing zones
are operated at the same temperature. Justification for isothermal
Poperation of the source and mixing zones comes from noting that the
condensed phase silicon activity increases with temperature. There-
fore, it is desirable to operate the mixing zone at the source zone
* temperature in order to minimize the silicon activity and at the same
time prevent deposition of GaAs in this zone.
The behavior of the mixing zone, when fed from a source zone using
solid GaAs as the source material, differed from that of the source
zone alone in that the mole fractions of all of the chlorinated vapor
phase silicon species increased with temperature, as did the condensed
phase silicon activity. Although the silicon activity in the mixing
zone increased more slowly with temperature than it did in the source
zone, the results of this analysis suggests operating the mixing zone
at a temperature equal to or less than that of the source zone, in or-
der to attain the lowest possible silicon activity.
The effect of temperature on the deposition zone, which was fed
from source and mixing zones using temperatures of 973 K, pressures of
100 kPa, a liquid source material and 1% AsCl 3 in H2 as inlet into the
reactor, has shcwn GaCI and As4 to be the dominant group III and V
species. A measure of the supersaturazion of the vapor was defined
based on the reaction
GaAs(c) Ga(g) + As(g) C-50

153
L'sing the ecuilibriu. relationship, the sat-Uration ratio, , is de-
fined asPGa PAs
RSa G Ks= C-51
where KSa t = exp(-aG /RT) C-52rxn
This saturation ratio was observed to decrease from 4xl05 at 773 K to
700 at 973 K, which shows that the vapor phase was highly supersaturated.
When SiO2(c) was not included in the deposition zone, the condensed
phase silicon activity changed only slightly frcr 9x1O- at 773 K to
6xI0 -3 at 973 K. Including Si02 (c) in the deposition zone c-lculation
resulted in the condensed phase silicon activity becoming a strong
function of temperature (due to reversal of reactions C-44and C-4 with
the activity value at 973 K re.aining unchanged and the 773 K value
fallina to 9x70 5 .
When solid GaAs was used as the group III source material, the
following results were obtained for the deposition zone. The saturation
ratio fell from a value of 200 at 773 K to the expected value of I at
973 K, thus revealing the system to be much less supersaturated than
the liquid source material counterpart. This lower degree of super-
saturation was due to much less GaCI being present in the vapor. The
dominant grouo V specie .as As4 , but GaCl, GaCl2 and GaCl3 were all im-
portant contributors to the group III vapor species. The condensed
phase silicon activity was found to increase with temperature from
9xl0 - 8 at 773 K to 7xl0 -7 at 973 K for the case where SiO2 (c) was not
included in the deposition zone. When SiO(C) was included, the sili-79
co:n activfty at 773 K 1:eil to 2xi 0-.

154
The effect of pressure was investicated over the rance of 1 to
1000 kPa (temperature 973 K, inlet composition: 1% AsCl3 in H2) for
both the solid and liquid group III source materials. Over the en-
tire rance studied GaCI was the dominant group III vapor specie in
the system using a liquid source material, while for the system using
solid GaAs as the source material, GaCl became the dominant croup IIl
specie at pressures below 100 kPa, but competed with GaCl2 and GaCl3
at the hicher pressures. The dominant group V vapor specie was As4
at pressures above 10 kPa with As2 becoming important below this pres-
a sure, in agreement with Gentner et al. [49], in both the licuid and solid
source systems.
Ficures C-11and C-12show the lower five orders of macnitude in
mole fraction and the condensed phase silicon activities in the liquid
and solid material source zones. The silicon activity in the system,
which used a liquid source material, reached a maximum at a pressure
of 4 kPa and then decreased with increasing pressure. This behavior
has not previously been reported in the literature presumably due to
the constrained nature of previous equilibrium calculations. Referring
to equation C-48reveals that the maximum in the silicon activity was
due to the SiH 4 mole fraction rising faster than PT in the 1 to 10 kPa
range. Applying equation C-46to the specie SiH 4 (n=O) and referring
.i to Figure C-llshows that the Si4 mole fraction dependence on pressure
deviates from linear behavior due to the H20 mole fraction chances in
t"his range (yu =l). The change in H20 mole fraction was due to"2
chances in the total amcunt of SiO( Cc) which reacted with the vapor.
Reaction C-44was important in this system and, as the pressure in-
creased, caused mcre SiOZ(c) to react which generated more H20.
a i il l i•a l H l

155
10~ 110- 3
-4--
lo- - 10
L4L
H 0
1010 100 1000
Pressure (kPa)
Figure C-11Effect of Pressure on the GaAs Chloride Systemn Source Zone
(Liquid Source)
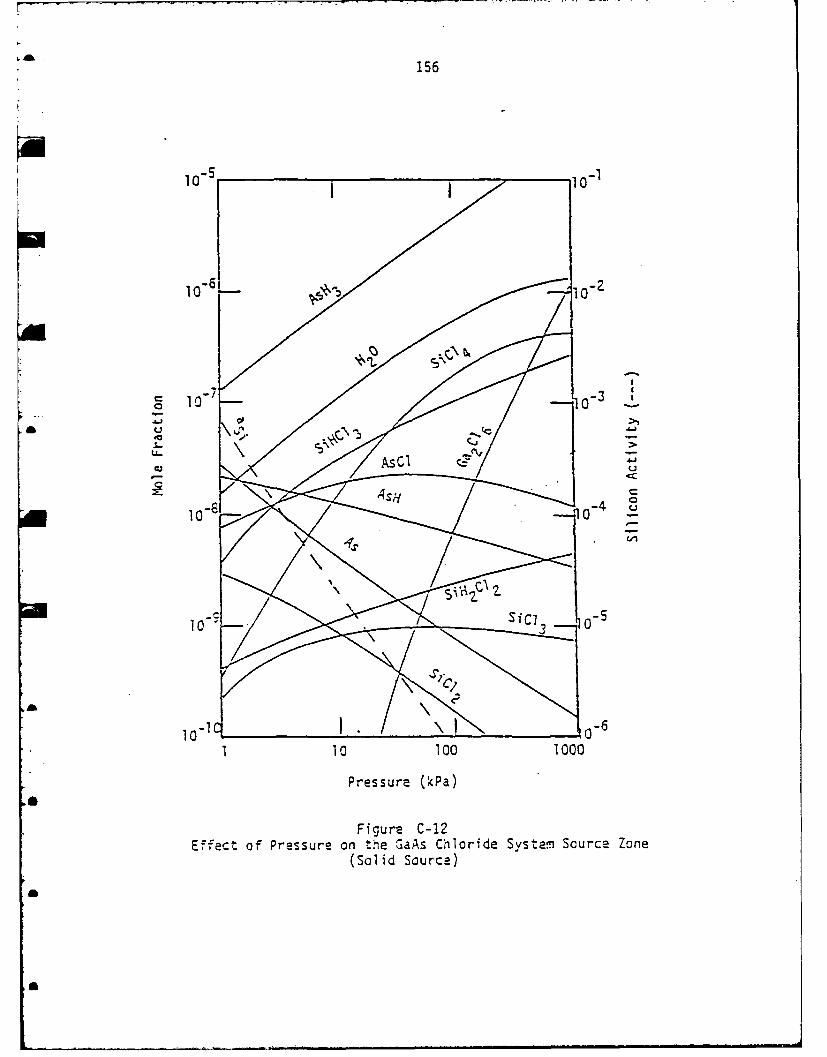
156
10-s 10 i-1
100
SASH
10-8 0-
1 10 100 1000
Pressure (kPa)
Figure C-12Eifect of Pressure on the GaAs Chloride System Source Zone
(Solid Source)

157a
The dominant silicon vapor species present at the low end of the
pressure rance was SiG which was formed via the reaction
2SiO 2(c) + H2 = 2SiO + H20 C-53
with the corresponding equilibrium relationship
K=2 P /3 YSiO YHO 0 HZ C-54
Thus, the observed minimum in the K20 mole fraction was due to the
interaction between-the decreasing mole fraction of SiO with the in-
creasing system pressure from rcaction C-50.along with H20 generationfrom reaction C-44. Reaction C45was not important in this situation.
The source zone which used sdlid GaAs as the group. EU source
material showed a strictly decreasing condensed phase silicon activity
with increasing system pressure and is best described via reactions. C-44
and C-45in conjunction with the silicon activity model provided by equa-
tionC-49. The decrease in silicon activity was due to the 3 order of
macnitude increase in SiCl4 mole fraction being offset by an order of
S- 4 p- 1magnitude increase in sI mole fraction (a Y) and the depen-
dence of the silicon activity. Once again, the activity of silicon in
the system usino solid GaAs as a source material was much less than
the ac:ivity resulting from using liquid GaX Asl_ as the group UII
source material.
The mixinA and deposition zones were studied using only the liquid
group [EU source material in the source zone. The mixing zone results
were again essentially the same as those of the source zone (operated
at te same temcerature) and therefore do not require further discussion.
The deoasition zone, shown in Figures C-13and C-14 exhibited a
saturation ra:Io of approximatael 2:<103 at a pressure of 1 kPa rising
d

1587
1-1 10
C 10 54a 10
a ea.-
10 ).\O0
10~
110To1 100 1000
Pressure (kPa)
Figure C-K13EF-ect or Pressure on the GaAs Chloride System Deposition Zone

159
10-s 5 '10 1
NJN,
10 0
100
1 1U102'13
Pressu~re (Pa)
A Figure C-14Effect 01 Pressure on the GaAs Chloride System Deposition Zone

160
4to approxim.ately W0 at IOCC kPa. Thus, the deposition zone was
supersaturated over the entire pressure range investicated-
The maximum value of the condensed phase silicon activity ob-
served for the source and mixina zones was not prevalent in the de-
position zone since Si0.(c) was not included in the deposition zone
model. Therefore, the silicon activity decreased with increasino
pressure in accord with equation C-48.
The mole fraction of AsCl. present in the feed stream was varied
from 0.1a to 10' in order to determine its effect on the condensed
phase silicon activity. For the source zone utilizing a liquid group
III source material most of the chlorine atoms provided by the decom-
position of AsCl3 were used to cenerate GaCl. Therefore, the condensed
phase silicon activity was not appreciably affected until large concen-
trations of AsCi3 were reached. The silicon activity was found to de-
crease from 7x10 - 3 at 0.1% AsCl 3 to 6xO_3 at 12 AsC 3 and finally to
7x0 at 10% AsCl 3 . These results acree qualitatively with previous
calculations [39, 40] and observations [36,37,38,41].
A very marked effect on the silicon activity was observed as the
AsCl 3 inlet concentration was varied in the system using solid GaAs as
the group III source material. Since less GaCl was generated in this
system when compared to the system using a liquid group III source,
* more HCl was available from the decomposition of AsCl 3 to react with the
silicon vApor species. Thus, the condensed phase silicon activity was
found to decrease "nifcrmly from 9xlO - at 0.1% AsCl3 to 1.Sx10 - 8 at
M 10: AsCl, inlet concentration.
The reason less GaCl was generated in the system using solid GaAs
as t. e cr:up H!E scurce is expiafned by the following reactions.
.... . . . . . .

L 161
GaAs(c) + HCg) GaCl(q) + As,(g) + HZ(g) C-si Ga Asl _x( l) + HC1(g) = GaCl(g) + 1H 2 (g) + l-x As4(9) C-56
Reaction refers to the system using the solid source and, at 973 K,
has a Gibbs energy change of 3.2 kcal/mole while reaction C-56, repre-
senting the system with a liquid source, undergoes a Gibbs energy change
Of -12.5 kcal/mole. The negative Gibbs energy change of reaction C-56
causes the products of the reaction to be favored.
The influence of temperature and pressure on the vapor phase III/V
ratio for solid and liquid group III sources is shown in Figure C-15.
When a liquid source is used, the II/V ratio is limited to a maximum
of 3. This is due to most of the Ga being transported as GaCi and the
3 to 1 ratio of Cl atoms to As atoms in AsCl 3. Increasing temperatures
cause the III/V ratio to decrease when a liquid source is used due to
the increased amount of As present in the liquid. The lII/V ratio in-
creases with increasing temperature for solid sources due to a lowering
of the Gibbs energy (due to entropic effects) of reaction C-55. In-
creasing pressure causes a decrease in the III/V ratio for both the
solid and liquid source systems due to reversal of reactions C-55 and
a C-56.
The source zone results were carried through the mixing zone and
deposition zone for the system using a liquid group [II source. The
* mixing zone yielded the same results as did the source zone (both zones
operating at a temperature of 973 K) and the deposition zone showed the
same trends as were observed in the source and mixing zones except that
* the values of silicon activity were slichdy higher due to the lower
deposition zone temperature (373 K).

AL
162
2.0
uoid source
0
373 973 1073 1173
£ Tem~perature (K)
Figure C-15Temperature and Pressure Effects "an the Vanor tIl/V Ratio
in the GaAs Chloride System Source Zones (Solid and Liqu~id Sources)
AL
L

163
A very effective way to reduce the silicon activity in syst-ms
using a liquid group III source is to add HCI (or AsCl 3) downstream
of the source zone. This allows the chlorine atoms to react with the
silicon species instead of generatino additional GaCl.
Figure C-16 shows the effect of adding small quantities of HCI
to the mixing zone on the condensed phase silicon activity in the
deposition zone (basis: 1 mole of vapor in the mixing zone). The
initial HCI mole fraction in the deposition zone prior to the addi-
tion of any HC1 was 4.SxIO-O. In accord with reactions C-4A C-45, C-48
and C-49 the silicon compounds shifted from being hydrogen rich to
chlorine rich and the silicon activity decreased markedly. The addi-
ticn of AsCl 3 had the same effect except that the activity decrease
is slightly more pronounced since there are three chtorine atoms per
molecule of AsCl 3 compared to one for HCI.
Another method of decreasing the condensed phase silicon activity
is to add H20 to the system. This causes a decrease in the total amount
of silicon in the vapor by shifting reactions C-44 and C-45 in favor of
SiOQ(c). This effect is demonstrated in Fioure C-17 for small addi-
tions of H20 to the mixing zone (basis: 1 mole of vapor in the mixing
zone) where the mole fraction of H20 prior to the additions was 5.5xlO-.
This effect was predicted by Rai-Choudhury C40] and observed by Palm
et al. C45].
Replacing the hydrogen carrier gas with an inert gas is yet
another method of reducina the condensed phase silicon activity. This
rre:hcc also retuces the tcz:i arcunt of silicon in the vapor by shift-
ing reacticns C-44 and C-45 in favor of SiO2Cc) as shown in Figure C-18
Reduction of silicon incorporation using an inert to replace H2 was
Wm~mm~mmmm m~ lwN~ mlmim ml mmummmmm m m2 m

164
106
07 a initial F-Cl before additions 10-2
10-8 10
N. 9-S
1 - 10
100
11~ 10
105 104 a 3o 10-2
Moles of HC1 Added to Mixing Zone
Figure C-16Effect of Adding HCI on the GaAs Chloride System Deposition Zone

165
10-6 10-
10- L. initial H 20 before additions lo-2
10-o8 10-3
Cl-
C 0
lo-~ 111-
10 1 10 6
M~oles of H2Q0 Added to Mixina. Zone
L aFiaure C-17Efec:t of Addinq HO o n the GaAs Chloride System Deposition Zone
Lz

1 66
10-0 101
10- N a- - - - N i
(-310-L~..I4.
a A *o .41
0 04 0 0
Percent Iner-cs Replacing H.
Figure C-18*Eff16ect of Replacing'H2 with. Inerts an the GaAs
Chloride System Oeposition Zone

167
s zudied by Saki et al. [46] and observed by Ozeki et al. C47]. The
curvature in the silicon activity is best understood by referring to
reac-tion C-48. As the hydrogen carrier gas is replaced by an inert,
the mole fractions of H2 and SiH 4 decrease. The competing nature of
these t.qo mole fractions causes a maximum in the condensed phase sili-
con activity to occur at approximately 90d inerts after which the si-
lane mole fraction rapidly goes to zero and the silicon activity de-
creases to a very small value. The silicon activity will never reach
zero as predicted by C49 since reactions C-44, C-45, C-48 and C-49 are not
valid models in systems devoid of hydrogen. Instead, small concen-
trations of Si(g), SiO(g), etc. will remain in the vapor to provide a
nonzero but very small condensed phase silicon activity.
The use of solid GaAs as the group III source material appears to
offer an advantage over the liquid group III source in that lcwer con-
densed phase silicon activities were predicted by these thermodynamic
models. It must be emphasized, however, that the solid GaAs source
was assumed to be pure (i.e. devoid of Si and other contaminants) and,
from a the-modynamic point of view, that the purity of an epitaxial
layer can be no better than that of the source material unless methods
are employed to improve the purity (e.g. additions of HCI, H 20, etc.)
during the CV0 process:
The GaAs Hydride System
The effect of temperature on the silicon species present in the
group IUI and group V source zones of the GaAs hydride system is shcwn
in Ficures C-19 and C-20. The condensed phase silicon activity for the
group '1 source zone was essentially the same as that which would be
obsear,. in the crouo 11 pre-sCurce zone (AsH. absent) since arsine didaJ

168
10, 0 -
AsH 3 .
10 6 10 - 2
7 -3 ,
0 1
10 - -10 -5
A10 6
10-0 0873 973 1073 1173
Temperature (K)
Figure C-19Effect cf Temoerature on the Group V Source Zone of the GaAs Hydride System

At 169
10~ I0
10-
C/
-1 -
10 10
873 973 1073 1173
Temperature (K)
Figure C-20cFfect of 7en~perazure on the Group ii Source Zone of the
GaAs Hydride System
A

170
.ot corpete with silicon for any atoms in the vapor other than hydro-
gen. The group III source zone showed a much greater silicon activity
than the croup IIi pre-source zone (Ga(l) absent), shown in Figure C-21
since the liquid gallium source reacted strongly with HCl to form GaCl.
This forced the silicon species to be rich in hydrogen and therefore
the condensed phase silicon activity was larger. As can be seen from
Figures C-19 and C-20, the group V source zone was primarily responsible
for the silicon activity at low temperatures while at high temperatures,
the group III source zone contribution to the silicon activity also
Sbec-ame iniportant. As was observed in the chloride system for the li-
quid GaXAs1 source, the dominant group IiI vapor species was GaCl
with As€ beina the dominant group V vapor species at temperatures below
1073 K and As2 dominant above this temperature.
The results of these group III and V source zone calculations at
973 K were thren combined and the effect of temperature in the mixing
zone was investicated. Figure C-22 shows this effect on the silicon
activity and species in the lower five orders of magnitude in mole
fraction. The silicon activity and silane mole fraction were found
£ to be lower than the values for the group V source zone alone at low
temperatures due to the dilution effect of adding the two source zone
streams together (equal molar flowrates were assumed in each source
zone). Since the silane mole fraction, and therefore the silicon
activit,/, in each source zone was approximately the same at 1173 K,
the resultinc silicon activity in the mixing zone was the same as that
. at the cuzie, of either source zone.
Using th.e results from the mixing zone at 973 K, the deposition
zone aas szudied in the absence of SiOz(c). The saturation ratio, as

a 171
10-~ I /
710
eC
L.-
A 10
-10 -810 .
873 973 1073 1173
* Temperature (K)
Figure C-21E f- ct of Te:7cpratuire an tte Group III Presource Zone of the
GaAs Hydride S,'strn

£h 172
10- C As.
10 100
10 3 -
c 101
10- 10- 6
973 1073 1173
Temperature (K)
Ficure C-22Effect oC, Temaerature on the Mixinq Zone of thP GaAs Hydride Systemn
.. ..0. ..... .. .. .

173
ae i n d bv equatlcn C-51,was found to dcrea=se from WO 4 a t 773 K
to 100 at 973 K, indicating that the vapor was supersaturated over
the entire temnperature range. The condensed phase silicon activity
varied only slightly, increasing from 2xlQ_ a' 773 K to E7xlO- at
973 K, which is consistent with the e-ects observed in the chloride
system using a liquid Ga XAs1 I- group !I! source. The lesser degree
of suestrtion found for the hydride system, when compared to the
chloride system, was due to the lesser amounts o-F group III and V
species present in the vapor. The dilution effect of adding the two
source zone streams tooether causes the group V vapor species to be
one-half the mole fraction observed in the chloride system. The use
of HCl coupled with this dilution ef-fect reducedi the amcunt of group
ITT. species transport to one-sixth of that in the chloride system.
The croup III and V source zones were investigated as a f:unct.ion
of pressure at a temperature of 973 K. The silicon activity in the
group V source zone remained constant to 10 kPa then fell from a value
OT :XI0 o x0 4 a 1000 kPa. The group III source zone exhibited
a maxlmunn in the condensed phase silicon activity at a pressure of 4
kPa, as did the chloride system source and mixing zones using a liquid
group III source. Upon combining the tw.o hydride system source zones
and per-forming the mixing zone equil ibrium calculation, the silicon
activity in the mixing zone became a decreasing function of pressure.
The ef-Fect of pressure on the deposition zone of the hydride
Sysz=e7 very closely matched that of the chloride system. in'.s resul't
was e~c since the source zcnes of tetosystems are the only
dif-,rences betw--een the twoi and oncz downstream of th e source zones,
theecil~rum heisryofthe hydride and chloride s-/stzms are the
Sarne.

174
The concEntration of AsAX3 in the feed gas stream of the croup
V source zone was found to have no effect on the condensed phase sili-
con activity. This was due to the silicon species being rich in hydro-
cen and, in the presence of a large fraction of hydrogen carrier gas
(> 90'1), the hydrogen atoms released from the decompos'tion o-f AsH 3 did
not con-6ribute sicni-fica=ntly to the overall system hydrogen content.
Therefore, the s ilane mole -Fraction was not sianiFicantly af-fected. In
contrast, Pocce and KEmiace [65] found that increased AsH 3 concentra-
tions decrez-sad the f1ree carrier concentrations in epitaxial GaAs.
aThey cited kinetic effects, howev.er, not thermodynamic Ilimi tations as
the reason for their obser-vations.
Increasing the concentration of HC1 -in the'-feed strea=m to %the
group III source considerably decreased the condensed phase silicon
activity by Forminig chlorine rich, as opposed to hydrogen rich, silicon
species. Thus, one method of decreasing the silicon activity while
maintaining a constant vapor Ill/V ratio is to increase both the HCl
and AsH 3mole fractions in the feed streams to each source zcne to-
gether. This effect is demonstrated for the deposition zone in
*Ficure C-23 . Additionally, if various 111/V ratios are desired, it
is advisable to operate the system with a large HCl concentration in
order to real ize a lowq sil icon ac tivi ty and vary the AsH3 corncentra-
r tion until the appropriate [i/V ratio is attained.
As was discussed for the chloride system, a very ef-fective method
fo- .ie sIcc-n activ/ity is to make simall additions of HC1 or
H 0 to -ni xing zone. This preservies the systemn 1l/11 ratio from
t e hydride system source zsnes and shifts reactions C-44and 0-45 in
ive.or cf ~ (c). The rzsults for t ,e hydride system ,oere essentially
L

175
10-s 10-
10~ -2-,10
-!N
7 '-310- 10
CU
- -\
Cz
\U
10" 10-N l 08 0-4 C
44
10 ., 10610 1 1 10
Percent HCI and AsH 3
A
Figure C-23EUfec: of Addirng HCI on the GaAs Hydride System Ceposition Zone
a
a

176
the same as those obtained for the chloride system and will not be
discussed further.
Replacement of the hydrogen carrier gas by an inert gas was less
effective in the hydride system than it was in the chloride system
since hydrogen was provided by the decomposition of HC1 and AsH 3.
Figure C-24 shows this effect for the hydride system deposition zone.
Although a very sharp bend is observed in the silicon activity even
when all of the hydrogen was replaced by inerts, the condensed phasesilicon activity was approximately 4xl0 - Therefore, relacing the
a hydrogen carrier gas by an inert gas was not an acceptable method to
achieve low silicon activities. The addition of small amounts of HCl
or - 0 to the mixing zone appears to be the most promising method of
attaining very low silicon activities in the hydride system.
The InP Chloride System
The rnP chloride system was investigated under the same conditions
as the GaAs chloride system and was found to behave similarly in many
respects. The source zone using liquid InxPl x as the group III source
material was quite similar to the GaAs system in that InCl and P4 were
the dominant group III and V vapor species. One difference observed
was that P2 was not as significant in the InP system as As2 was in the
GaAs system. This may be due, however, to the equilibrium calculation
being constrained as a result of the lack of a thermodynamic data set
for the species P3" The condensed phase silicon activities for the
GaAs and [nP systems were found to be essentially the same. These same
0 cc,, --:-nents also acoly to the mixing zone which was fed frcm this scurce
Zone.
a

L 177
10i 10-
A ea
C 0 i.C -105
U2 2
c- 1010
0 20 40 60 80 100
Percent Inerts Replacing H 2
Figure C-24Effet o Relacng 2 with Inerts on the GaAs Hydride System Oeposit'on
Zone

A
178
Consistent with the calcuiational technique employed for the
GaAs chloride system, the vapor phase inlet composition to the depo-
sition zone was determined by the equilibrium composition of the mixing
zone. The mixing zone inlet composition was determined by the equilibrium
source zone composition. The deposition zone of the InP chloride system
was studied for a source zone usina a liquid group III source (InxPi x )
with a vapor inlet composition of I% PCI 3 in H2., The source and mixing
zone tmperatures were both 973 K and the pressures in the source,
mixing and deposition zones were 100 kPa.
The deposition zone, shown in Figures C-25 and C-26 for the sit-
uation where SiO2(c) was not included in the calculation, demonstrates
several differences between the GaAs and InP chloride systems. First,
the saturation ratio for the InP system, defined in analogy with equa-
tions C-50and C-51, was much smaller than that of the GaAs system. This
is due to the Gibbs energy change for reaction C-Sat 873K being 95.2
kcal/mole for GaAs while the Gibbs energy change for the analogous [nP
system is only 69.5 kcal/mole. The value of the equilibrium constant
for the [nP syste-m is, therefore, much larger than that for the GaAs
system. Thus, larcer vapor phase In and P partial pressures must be
present in order to attain equal degrees of supersaturation in the two
systems. Since the saturation ratio definition is independer of the
process to which it is applied, it is expected that the inP hydride sys-
tem will also show a lesser decree of supersaturation than the GaAs hydride
system. These results are consistent with those of Shaw C51] who also0
found, thr-uch thermcdynamic calculations, that InP systems are less super-
Satjrated than GaAs systems.

* 179
10
In l
a 10- 0
P4
10-80 0
PH3 -
10-9 nCl 2 N /
10 -
10- 1
773 873 973
Temperature (K)
* Figure C-25Effect af Temperature on the rnP Chloride System Deposition Zone

180
10-s 10-1
10 -6 -
a, 10
-.3 10- >.
9b0
10-8i H02 00
-10 ____ ___ ____ ___ ____ ___ ____ ___ ____ __7
l0 ___ ___ __ ___ ___ __ ___ ___ __ ___ ___ __
773 873 97
TEmnperature (K)
Figure C-26*EffIect of Temperature on the InP Chloride System Deposition Zone

a 181
The c:ndensed phase silicon activity fcr the InP system was
sliightly lower than that of the GaAs system, due to the lower SiH,
mole fraction, but increased slightly with temperature. Recall that
the silicon activity in the GaAs system displayed a slight decrease
in temperature when SiO,(c) was not included in the calculation.
The InP source zone usino solid InP as the group III source
material is shown in Ficures C-27 and C-28. The behavior of this
system was markedly different than that of the analogous GaAs system
in that [nCl was clearly the dominant group III vapor specie due to thefavorable Gibbs energy change (-8 kcel/mole at 973 K) of the following
re73io K)e o'mp - 6-low
reaction when compared to reaction C-55 (3.2 kcal/mole at 973 K).
InP(c) + HCI(g) = InCl(g) +i P( g 1 H2( C-57
The formation of a larcer amount of group III monochloride consumed much
of the HCI initially present in the system and caused the vapor phase
silicon species to be higher in hydrogen content than those species in
the analogous GaAs system. As a result, the condensed phase silicon
activity in the EnP chloride system, using solid InP in the source zone,
was found to be much larger than that of the GaAs system. These same
ccmments also apply to the mixing and deposition zones of the InP sys-
Atem which follow the source zone using solid InP as the group III source
material.
The effect of pressure on the InP chloride system followed closely
that observed for the GaAs system, relative to the previous discussed
differences. Thus, for the syst-a;,, employing liquid InP x as the group
::7 :cur:e, the crndensed phase silicon activity in each zone was
sl icn-ly lower than cha: of the GaAs systeih and the EnP saturation ratio
in :he depcsiticn zone was much less than that of the GaAs s:'stem. As
a\

182
10-1
InCl
PP
00
873 973 1073 1173
Ter-perature (K)
Figure C-27---fr ofTmeaueo the triO Chord Ssam c e Zone
* (Solid Source)

183
S10- '
0 010
10- 0 0
Cj
10 -Q10
873 973 1073 1173
a, Temperature (K)
Figure~ C-287 at e!mcer-ature on the InP Chloride System Source Zone
(Solid Source)

in the GaAs system, maxima were observed in the condensed phase
silicon activities at 4 kPa in the source and mixing zones. The
chloride system, using solid InP as the group III source, also dis-
played a pressure dependence which was similar to that of the anal-
ogcus GaAs system. The major differences being that InCl was clearly
the dominant group III species and the condensed phase silicon acti-
vity was much hicher in the rnP system, due to reasons previously
discussed for GaAs.
The influence of PCI 3 inlet concentration on the InP system wasS
similar to that of AsCl3 in the GaAs system with the following differ-
ences. When liquid Inx P _ was used as the group III source material,
the condensed phase silicon activity was always 20% to 50'a less than
that of the corresponding GaAs syst-m. This was due to InCl 3 being
present in a smaller amount in the InP system than GaCl 3 was in the
GaAs system. Thus, more chlorine was available to react with the sili-
con vapor species. When solid InP was used as the group III source
material, the silicon activity in the InP system was greater than
that of the corresponding GaAs system due to the large amount of InCl
formed.
The replacement of the hydrogen carrier gas by an inert gas was
also investigated in the InP system with the results following the
same trends as did the analogous GaAs system. The differences be-
tween the systems were consistent with the previous discussions, i.e.
the csndensed phase silicon activity for the tnP system using solid
EnP for a source ,was lar-.er than the GaAs system and the liquid source
1nP system showed a slightly reduced silicon activity in the deposition
• zsne r-aiative to the GaAs system.

185
Additions of HCI H 20 and PC13 to the mixina zone of the InP
system were also studied. The trends observed were the same as those
in the GaAs system.
The nP HvdIde System
The results of a parametric analysis of the InP hydride systemwere similar to those of the Ga.s hydride system discussed previously.
The condensed phase silicon activity in the InP system was found to
be consistently less than that in the GaAs system under all analogous
conditions. At very low inlet HCl concentrations (-0.1%) the silicon
activities were nearly the same while at large inlet concentrations
(-10%), the InP system exhibited silicon activities which were half
the value of those in the GaAs system. This was primarily due to the
more negative Gibbs energy of formation of GaCl (-41.5 kcai/mole at
973 K), which caused a greater production of GaCd via reaction C-56,
than lr l in the analogous reaction where In is the group III species.
The differences in the Gibbs energy of formation at 973 K for Ga(l) and
In(l) were not significant. Thus, more HCl was available in the InP
System to form chiorine rich silicon vapor species via reaction C-44,
which in turn lowered the condensed phase silicon activity relative
to the GaAs system.
Figures C-29 and C-30 show the effect of temperature on the de-
Position zone of the tnP system. As observed in the chloride systems,
the saturation ratio for tnP was much smaller than that for GaAs. The
hydride system shcwed that, for the source zone conditions, shown in
the fiqures, the tnP system did not become supersaturzted until tne
temperatnre was below 860 K. Aiternatively, supersaturation at 373 K
C3n be ach.ieved by increasing the system pressure frcm 100 ka to

186
10-1 -10
4-
p 14
1- -10-3773 873 973
Temperature (K)
Figure C-29Ef-fect of Temperature an the InP Hydride Syst4em Oeposition Zone

110
10- H 20 04
109"SiHC1
10-10 -1-773 873 973
Temperature (K)
* Figure C-30Efect of TemPerature on the InP Hydride System Deposition Zone

188
200 kPa or by increasing the PH3 and HCI inlet compositions. These results
are in contrast to those observed in the In? chloride system and both GaAs
-systems which displayed supersaturated conditions in the deposition zone
under all situations studied.
aN
a
aO

189
APPENDIX D
Chemical Equilibrium Analysis of Ga.In 1 _ As
Chemical Vapor Deposition
The group IIIA elements Al, Ga, and In combine with the
group VA elements P, As, and Sb to form a class of semiconductors
appropriately termed III-V compounds. These "second generation"
semiconductor materials are isoelectronic analogous to the "first
generation" group IV elemental semiconductors (e.g., Si) and
offer distinct advantages for solid state device applications.
For devices which require high operating speeds or frequencies,
several III-V materials offer a significantly larger electron
mobility than Si. Because of the more complex native point
defect structure of these materials compared to Si, most III-V
compounds can be made semi-insulating by controlled processing.
In integrated circuits this results in lower power
consumption and reduced parasitic capacitance. Perhaps the most
important property of III-V materials is the ability to form
completely miscible solid solutions for most of the
£multicomponent systems. This is accomplished either by the
substitution of an atom on the group III sublattice, e.g., Ga, by
another group III element, e.g. In, or by the substitution of an
atom on the group V sublattice by another group V element. By
the variation of the solid solution composition, the electrical
properties of the solid are affected. This affords the device
designer the ability to tune the electrical properties of the
solid to fit the particular device requirements.
In most applications, the designer will specify the bandgap

190
-energy to give the desired electrical characteristics and the
lattice parameter to permit the growth of device quality
epitaxial layers. To independently vary both of these material
parameters often requires a quaternary system. Primarily because
of simpler processing, certain group III-V ternary solid
compositions have received attention. The example reported here
is the Ga.47In. 5 3 As ternary material which has a lattice
parameter that is matched to the available substrate InP
(bandgap energy corresponds to wavelengths important in optical communi-
cations). The energy bandgap is direct at this composition and the elec-
tron mobility is more than ten times greater than that in Si. These
properties have suggested the ternary system be used in microwave device
applications.
One of the most successful techniques for the growth of
epitaxial films has been chemical vapor deposition (CVD). The
major advantages of CVD are relatively fast growth rates, the
availability of a variety of source gases, and the ease in which
dopants may be changed during the deposition proce53. The
£ hydride process is an important technique in the CVD of Ga xIni _
xAs. The process is made up of three zones: source, mixing and
deposition. The source zone consists of three mass transfer
1 isolated inlets, two of which are for the group III species (one
for Ga and one for In), and one for the group V species (As).
Hydrogen is used as a carrier gas in all three inlets. HCI is
contacted with the group IIT species and generates volatile
species predominantly by the following reaction:

A 191
HC1 + 111(i) - 1/2 H2 + IICI D-
Arsine is added separately and allowed to decompose, primarily to
the elemental dimer and tetramer. The resulting gases are mixed
in the mixing zone where epitaxial growth occurs at the substrate
primarily by the following overall reaction:
IIICI + 1/4 As 4 + 1/2 H2 - IIIAs + HCI D-2
The hydride process is generally operated with an
* equilibrium group III source boat so that more reproducible
transport rates are achieved. In.a similar manner, equilibrium
conversion of arsine is desirable from a reproducibility point of
view, though the reaction efficiency of AsH 3 versus As 2 in the
deposition process is not clear. The decomposition of arsine is
discussed in Appendix A and is a function of the flow rate, tube
diameter, surface condition, temperature and reactor length. As
suggested in Appendix A, the elemental reactions (e.g.,
As 4 1 As ) are rapid and thus the elemental species2 2 4I
& concentrations should only be a function of temperature if
decomposition of arsine is complete. Under typical deposition
conditions the deposition process Is limited by chemical reaction
though the specific limiting reaction(s) is not clear (adsorption
of the group III chloride has been suggested though the limiting
reaction can easily change with different operating
* cOnditiions). Operating with reaction limitations insures growth
rates which are uniform.

192
Despite the fact that the source zone can have mass transfer
and reaction limitations and the deposition process is reaction
limited, equilibrim calculations for this process have shown
-qualitative agreement with experimental results. Reported here
are the results of complex chemical equilibrium calculations on
the deposition of GaxlnixAs. The calculational procedure and
equilibrium model are the same as that described in Appendix C.
First, the use of an alloy source boat for the generation of
volatile In and Ga species is examined. Next the effect of
addition of HCl to the mixing zone on the solid composition is!a
studied. Finally, the influence of inlet AsH 3 partial pressure
on the deposited film composition is discussed.
Alloy Source
The value of the Gibbs energy of formation of GaAs from the
chloride is more negative than the corresponding value for
inAs. This differential stability requires that the In transport
rate be approximately a factor of 10 greater than the Ga
-transport rate. Since the total transport rate is small,
extreme y, fine control of the HCl flowrate over the Ga source
boat is required. The required flow control approaches the limit
of practical operation, even when dilute HC1 sources are used.
Primarily for this reason, a single source boat containing an
alloy of Ga and In is sometimes used (183-185). GaCI is
s'. 3ttly more stable than InCl but the value of the differe.ce in
Gibbs energy of formation between these two chlorides is smaller
than that between GaAs and InAs. Thus the value of the

193
compositicn ratio tetween the solid solution and the liquid
source boat is smaller than the value of the ratio between the
solid solution and the gas phase composition. This fact and the
ability to precisely fix the alloy composition promise better
process control. The major drawback with the alloy source is the
batch nature, with inherent changes in composition as reaction
takes place.
Complex chemical equilibrium calculations were performed on
the operation of the alloy source boat. The main control
variable is the gas phase composition. Figure D-1 shows the
* variation of the gas phase species mole fraction as a function of
the source boat composition. The temperature and pressure were
fixed at typical operating values of 1073 K and 1 atm. The inlet
gas stream contains H2 and HCl and since the solubility of H and,
to a lesser extent, Cl species in the alloy is small, the total H
and Cl atoms in the equilibrium gas phase is identical to the
inlet amounts. Thus a convenient variable to fix is the Cl/H
ratio and this variable was fixed at 0.0023 in the calculation.
The chlorides of Ga and In are only slightly soluble in the
* aliquid metals and should not affect the calculated compositions
since the Ga and In activities will change very little. The
results in Figure D-1 show that the monochlorides of Ga and In
A are the dominant species and reflect the slightly higher
stability or GaCi over InCl. This figure also shows that the
conversion of HOI to transportable species is large (-990). The
* imnits of x = 0 and I represent the pure sources and the HCl
conversion is higher for Ga than for In.

K 194
Gui-I = C23
HCL
io-6 N
0 .2 .4 6810
xclxIN1-x
Figure D-1 Equilibrium vapor phase mole fractions versus liquidalloy compositions at Cl/H-Q0.0025, T =10 > 3 K andP = 1 atm.

195
The results of these calculations are shown in a different
manner in Figure D-2 where the Ga/(Ga + In) ratio in the vapor
phase is plotted versus the alloy composition. The vapor phase
Ga mole fraction is always larger than the liquid phase mole
fraction because of the higher stability of GaCl. The figure
shows the results for two different solution mo~els for the
alloy, an ideal solution and a simple solution which reflects the
slight positive deviations from ideal behavior in the melt. The
curves are seen to intersect at x - 0.5 because of the symetric
nature of the simple solution model. For In-rich solutions, the
positive deviations give higher Ga vapor phase mole fractions
than the ideal solution assumption, which would require lower Ga
melt compositions to give the same transport rate. For Ga-rich
solutions the opposite behavior is seen.
The effect of source temperature, Cl/H ratio and pressure
were also investigated. Increasing the temperature produced a
slight increase in the conversion of HCl but the vapor phase
composition changed slightly. This was expected since the
standard entropy of formation of GaCI and InCl are almost
identical. Increasing the Cl/H ratio produce a small change in
th',e resulting vapor phase composition, though the amount of
transportable Ga and In species increased in almost direct
proportion (slight decrease from direct proportionality because
of increased higher chloride production). Pressure also had a
small effect until pressures greater than 1000 ka were
reached, where the Ga/(Ga + In) ra' io increased with increasing
pressure. These pressures are outside the range of practical
reactor operation.

196
1.0
.8
GA N
0 1"0 .2 .4 .6 810
x
am
Figure D-2 Ga Vapor phase mole fraction versus liquid alloycomposition at Cl/H 0.0023, T = 1073 K and P I atm:-2 simple solution; --- , ideal solution.copstoatC/ .03 03KadP=1am
0 ,sml ouin -- da ouin

197
Influence of HCI Addition in the Mixing Zone
The addition of HC1 to the mi-xing zone in a hydride process
has several advantages. As suggested in Appendix C, increasing
the Cl content will shift Si vapor phase species to the more
stable chlorides and thus lower SI unintentional doping levels.
Addition of HCI also serves as an etchant which can reduce
extraneous deposits and lower the growth rate. The lower growth
rate can lead to improved surface morphologies. Shown in Figure
D-3 is a plot of the solid solution composition as a function of
the HC1 added, expressed as a partial pressure. In this
calculation, the group III species were generated from an alloy
source boat of composition xGa - 0.118 by passing 4.473 moles of
H2 + HCI over it (PHCI = 2.3 x 10- 3 atm). The inlet AsH 3 and
additional HCl amounts were determined such that the inlet
partial pressure of AsH 3 was 10 - 2 atm and the mixing zone partial
pressure varied from the equilibrium value at the source zone
with no added HCl to the prescribed value in the Figure. The
deposition temperature was 948.2 K while the source temperaturea
was 1073 K. The pressure in all calculations was 1 atm. The
solid solution was modeled as a single solution. As HCI is added
to the mixing zone, the solid composition increased in Ga content
a' a significant rate. This is a result of the higher stability
of GaAs versus InAs relative to their chlorides so that
aizna. HCI w,*Il preferentially keep In in the vapor phase.
Also shown in Figure D-3 are the results of experimental solid
compositions with added HCI (186). These results also show an
co ps s w t a d dH 1 ( 8)
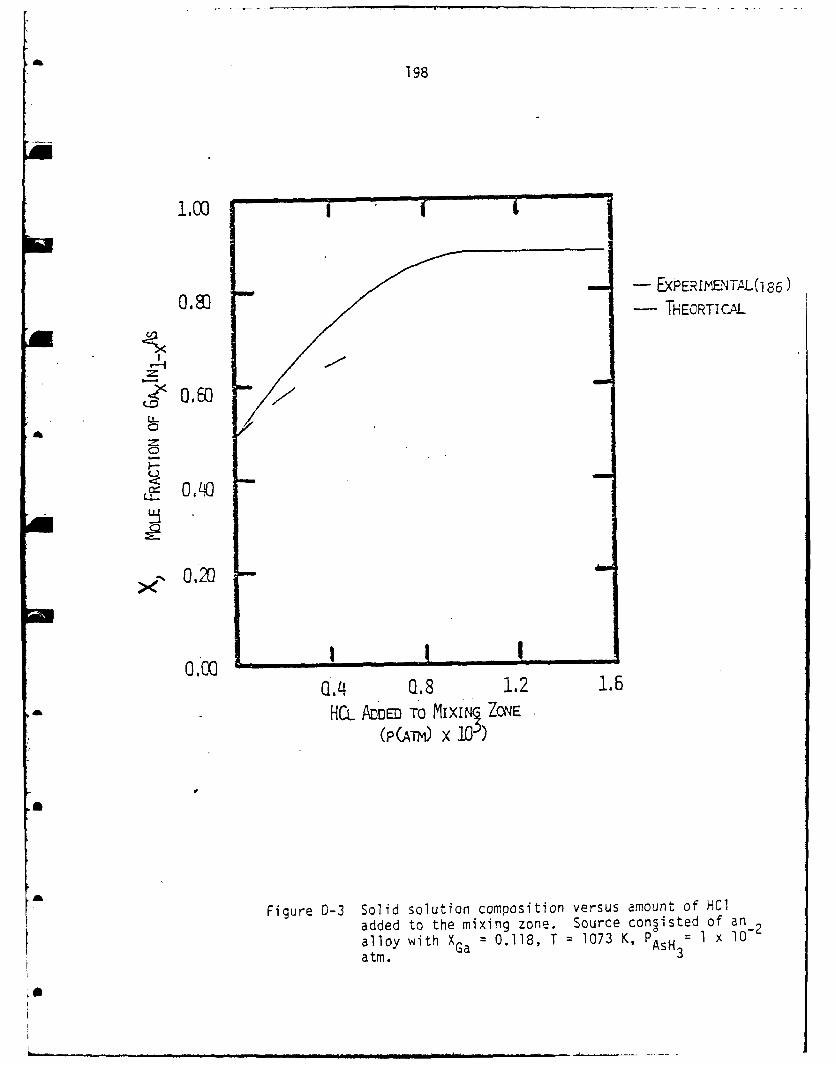
198
- EXPERIMENT L(186)
- THEORTICAL
0--t
U-
0 ,4.-
-., 0, Fm
I0 .00 Q 4 Q .8 1 .2 1 .6
HL ADDED TO MIXINS ZONE(P (ATM) X 10-
a
Figure 0-3 Solid solution composition versus amount of HCladded to the mixing zone. Source consisted of an_
alloy with XGa 0.118, T = 1073 K, PAsH 1 x 10a tmn.
am

Ak 199
increase in Ga content initially, with the Ga content saturatingaas more HCi was added. The equilibrium calculatLons could not be
extended into this region because convergence problems were
encountered and the deposition rate was approaching zero at the
last converged calculation.
Influence of AsHl Addition on the Solid Solution Composition
The III-V ratio is very important in determining the
electrical properties of films grown by CVD. This quantity
essentially controls the defect chemistry of the growing
material. A first observation might suggest that the amount AsH 3
in the inlet to the reactor should not effect the solid
composition since the ternary compound has no degrees of freedom
on the V sublattice and no vapor phase compounds are formed
between Ga and As or In and As. Figure D-4 shows the variation
of the solid solution composition with the inlet AsH 3 partial
pressure. In this calculation, two source boats were used to
generate the group III vapor phase species. The source zone
temperature was fixed at 1123.2 K and the deposition zonea
temperature at 973.2 K. The In source was equilibrated with 2.0
moles of H2 /HC1 at PO 3.5 x 10 - 3 atm and the Ga source boat2 HCIW
also with 2.0 moles of H2 /HCl at P = 10 x 103 atm. The arsine
inlet partial pressure was varied over 4 orders of magnitude and
produced a 35% change in the solid composition; decreasing Ga
content wi th increasing AsH 3 partial pressure.
As the arsine partial pressure was increased the deposition
extent also increased, simply because the deposition reaction was
, Ua am i B H mi H H H

200
SCURCE C2t4ITIOMST = 1123,20KP = !ATMEM
Q 16 TOTAL MCLES: H2 + HCL -3 .6EsI(.) CE XES CA.HCL PARTIAL PRESSURE 3.5 X 10.P ATM 1,0 X I0 - 3 ATIM
0.55
0.L5
0,40
_M-4 io-3 1M-2
Figure 0-4 The influence of arsine partial pressure on thesolid solution composition at a deposition temper-ature of 973.2 K.
,B

201
shif'ted to more solid, particularly at these relatively high
III/V ratios. The increase in the amount deposited also depletes
the group III amounts in the vapor phase which increases the HCl
content of the vapor phase and serves to moderate the amount of
increased deposition. Since the amount of In in the vapor is
greater than the amount of Ga and nearly equal amounts of each
element are being deposited, the effect of increased deposition
is stronger on the Ga vapor phase content and produces more
extensive Ga depletion which is compensated by increased In
content in the solid solution.
Comparison with Experimental Results
Table D-1 summarizes the influence of process variables on
the solid solution composition as determined by several
investigators. The deposition temperature is reported to have no
influence or to cause a slight increase in the Ga content and is
in agreement with equilibrium calculations (183). The deposition
rate, however, increases with temperature suggesting a kinetic
process controlling the deposition. Since the composition does
not change, the limiting reaction(s) would not involve Ga or In
alone. This suggests that either another species is involved in
the limiting reaction (e.g., HCl desorption, AsH 3 decomposition)
or the remote possibility or two limiting reactLons, one each
involving Ga and In, with the same activation energy.
As the AsH 3 partial pressure is increased the two
experimental observations show opposite behavior. The
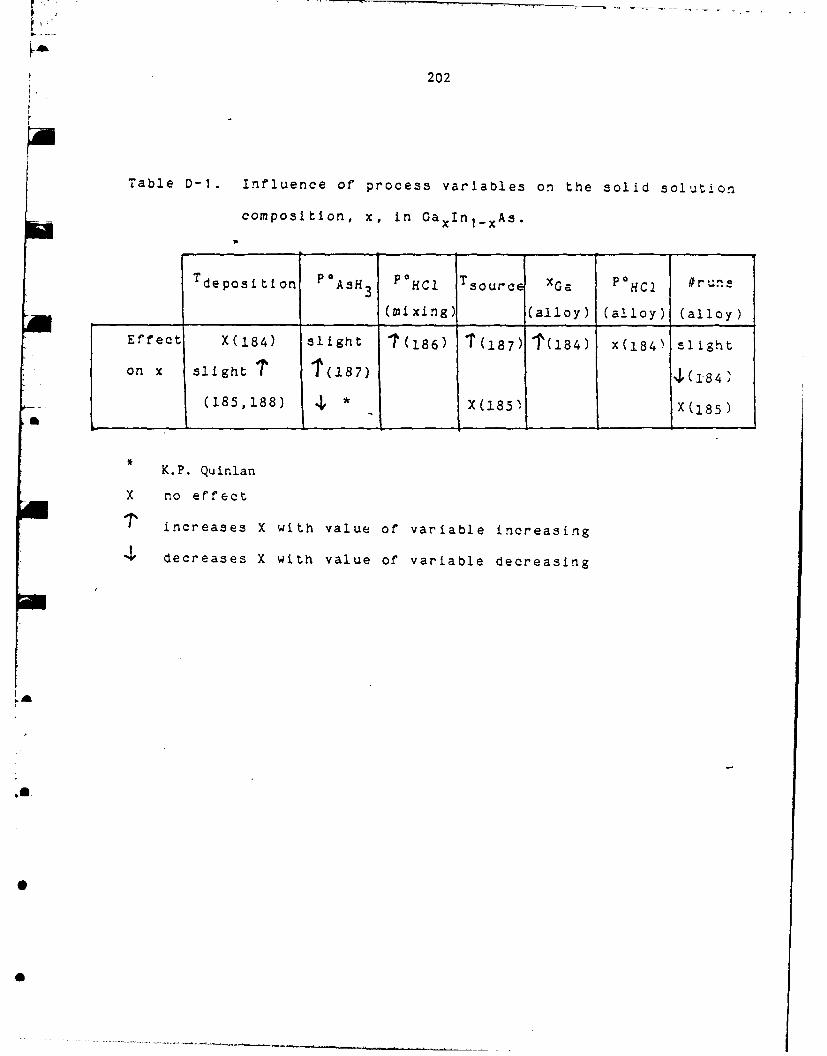
L
202
Table D-1. Influence of process variables on the solid solution
composition, x, in GaxIn1 _xAs.Mp
Tdeposition POAsH 3 HC1 Tsource xGa PHCI ru!ns
i (mixing) (alloy) (alloy) (alloy)
Effect X(184) slight 1(186) T(187) 1T(184) x(184) slight
on x slight 1( 187) 4(1.84)
(185,188) 4 * X(185) X(1 85 )
K.P. Quinlan
X no effect
increases X with value of variable increasing
4" decreases X with value of variable decreasing

203
thermodynamic results of this study suggest a decrease in the Ga
composition with a corresponding increase in growth rate. Also,
as discussed previously, the thermodynamic model gives increased
Ga content w~lth increasing HCl addition and agrees with the
experimental observation. The saturation phenomena reported has
been explained with kinetic arguments. The growth rate variation
with time reported in ref. 186 might possibly be explained with
transient processes occurring in the source boat. Initially, HCI
is added to both the mixing zone and source boats. However, a
* 10-20 minute transient has been reported (187) in the liquid
metal source boat which gives an initial deposition mixture that
is at etching conditions. Again at shutdown, the HCl is turned
off in both zones, but the source boats may degas during cool-
down with AsH 3 flow to give deposition conditions.
According to equilibrium calculations, the source zone
temperature should have a small influence on the solid solution
composition and this is in agreement with the experimental
results of ref. 185. An increase in the Ga content with
* increasing source temperature was reported in ref. 188 and was
attributed to kinetic effects in the In source boat. Increasing
the temperature should increase the approach to equilibrium and
A thus the HCl conversion efficiency. However, increasing the
vapor phase In content would also increase the solid solution
composition, in contrast to the reported result.
* Increasing the alloy source boat composition gives increased
solid solution composition and is in agreement with
experiments. Likewise, increasing the POHC1 produced no change

a 204
in the solid solution composition and an identical result is
given by equilibrium considerations. Increasing the source P°HC 1
is reported to effect the growth rate (184); the growth rate
exhibiting a maximum with increasing P*HC I . The increase in
growth rate at low POHC 1 is due to increase transport rates as
suggested by equilibrium considerations. At large POHCI, the
growth rate decrease is probably due to kinetic effects.
The alloy composition required for lattice matched growth of
GaxIn1_xAs and InP is reported at x - 0.07 (185) and x - 0.122
a (184). Comparing the experimental growth conditions of these two
studies, the lower composition was used with a much lower source
temperature and a slightly increased PoHCl (shows a neglible
influence on solid composition). The lower operating temperature
might imply non-equilibrium source operation (the source area and
geometry were not reported in ref. 185). If this is assumed to
be the reason for lower required melt composition, increasing the
melt temperature should require more Ga-rich melts to agree with
the results of ref 184. Assuming a constant transport rate of Ga
and In is required to give the lattice-matched composition, this
implies that increasing the temperature of the source boat (i.e.,
approaching equilibrium) at constant source composition should
increase the In flux relative to the Ga flux, which would
increase the In content of solid solution. To return to the
lattice matched composition at higher temperature, the Ga melt
* mole fraction would have to be increased. Thus the kinetic
limitation must be more severe on InCl generation than on GaCl
generation. The presence of a diffusion limitation in the melt
S

205
(i.e., the flux of Ga into the vapor relative to in is greater
than the relative melt composition, can be eliminated since the
solid composition does not vary with time, the flux due to
reaction is smaller than the characteristic diffusion flux (this
problem is znalogous to the problem examined in Appendix E,) and,
if equal diffu:ion coefficients are assumed, the surface would be
depleted in Ga to give increased In flux which is opposite of
that required. It is also known that Ga-In melts show surface
segregation, with the In concentration being greater at the
surface than in the back melt. This would also suggest an
increased In flux during non-eqi:librium operation, again
opposite to that observed. The exAct nature of the kinetic
limitation is not clear, but future s~-udies with the modulated
molecular bean mass spectrometer should iharify this point.
In summary, the equilibrium calculations presented here are
in qualitative agreement with the available experimental
results. The operation of an alloy source boat has been
characterized. The addition of HCl to the mixing zone leads to
an increase in the Ga composition of the solid solution, while*
increasing the AsH 3 input produces the opposite effect.
a3
a
a

a206
Appendix E
Steady State Analysis of the Source Zone in the Hydride Process
In the interests of reproducibility it is highly desirable to achieve near
equilibrium conversions off!:HCI to IIIC x such that changes in process variables suchx
as liquid level height and exposed surface area do not affect the gas phase
c=n=siticn and such that the composition is easily determined as a function
of par-tial pressure and vcluretric flcwrate (via an equilibrium calculation).
The obvious soluticn to this reactor design problem, given the ccramn con-
straints asscciated with boat lenoths -nd flcwrrates, is the use of either a
bubbler arrangement or turbulent flow system. Hcwever, the laminar flow tubu-
lar reactor still rermains the accented source boat design. In the interests
of evaluating the conversion of these conventional source designs an initial
analytical solution was sought. The first model develcoed -assured the
licuid-cas interface was at equilibrium and the rate limitina process was dif-
fusion of the HCI to the liquid surface. Furthermre, a rectangular shaped
source zone and flat velocity profile were required for the achieve..ent of an
analytical solution and axial dispersion (back diffusion) was neglected. The
nature of these assumptions lead to a prediction of conversions for a given
boat length that is conservative (i.e. less conversion predicted than actually
occurs). Subsequently, two of these assumptions were relaxed.
First the axial dispersion term can be important, particularly at low veloci-ties. This situation is obvious by the experimental observation of a IIICl
x
*condensaticn prcduct in the cold segment of the reactor upstream of the sourcea
zone. In addition the rectangular geometry solution should contain the prin-
cipal phenomena occurring during the process, except that the height of the
retangle (liacid metal is located on the bottom of the rectangular channel)
is not the acprccriate maxi rm diffusion lengh-. Usina geometrical argtrents,
an equaivalent rectangle height was determined for the case of a reczangular
bcat located in a cylindrical tube.

_k 207
As a test of the model, a correlation of the mass spectroscopy
data of Ban [1891 for the Ga-HCI system was attempted. However, it
was discovered that the correct functionality was not present. The
form of the data suggested that the equilibrium boundary condition
was not a true description and therefore some kinetic process at or
near the interface must also be important. A variety of mechanisms
can be postulated which lead to pseudo first order kinetics as an
appropriate boundary condition. Thus, an analytical solution was
determined for a kinetic boundary condition at the liquid surface
and was found to correlate the results of Ban [1893.
In dirnernsicnless fcrm, the convective-diffusion equation is
2 2"x 3 x E-
2 -~ + *21Oz Pe Mz Ox
Here, the dimensicnless variables z , x , X and Fe are defined by:
• zZ = dPe E-2
m
x = x/d E-3.
a
x c _C E-4
v daPe- am D E-5
where z is the distance alcnc the bcat, x is the distance above the bcat, C is
:..e cc.cnat cn of either ECI or GaC, Ce - is the ecjilibriu ccnversicn
a m wmNm ~ mmm mamm mmmmm m m" i. . .

~208
concs:,trazicn, CF is the inlet concentraticn, va is the cas velccity, d is the
heiht. Cf the rectangle and D is the diffusion ccefficient. The bcundary ccn-
ditions used include:
1) At tne liquid-gas interface the flux is propcrticnal to the conversion,
X:
* X kdx =0 * - d(l-X) E-6
ax D
where k is the propcrtionali-ty constant.
2) There is no flux at the gas-reactor wall interface
x ; x 0 E-7
ax
3) There is no conversion at the inlet and complete conversion for infinite
contacting length.
z =0 X=0 E-8
z = X=1 E-9
An analytical solution to the elliptic partial differential equation was
deter.mined. The conversion was evaluated at the exit of the boat of lencth T,
(z=L) and integrated over the cross sectional area to give
n
X= X(=L) = 1 - n ex2 z E10
L n'Pe2
Here X are the eicenvalues and are deter.ined by the transcendental ecuaticn:

209
tan = k/(D/d) = E-I1
and
4 sin 2 E-12Sb n=-1
n 2 + Xn sin Xn
Thus the conversion is a functicn of the following four design variables: (1)
The source zone length, L, (2) the velocity of the z-directicn convective
flow, va , (3) the velocity of the vertical diffusive flow, D/d, and (4) the
rate of reaction at the interface, or k.
In order to apply this result to the typical source zone design an
ecuivale-nt diffusion lenorth for a cylindrical tube of cross secticnal area,
Acs, with a liquid rectangular boat of width, W, and height, a , is defined
according to
(A 2/3d1 ! E-13
These dimensions are given in FigureE-1 and the result was verified by cnmpar-
ing an analytical solution developed for a hemi-circular gecmetry.
&
Ban (192) measured the conversion of HC in a liquid Ga source boat as
a function of temperature and velocity for a given geometry. Taking the
values of DHCIH2 estimated by Gurchenok (190) the only remaining parameter
in Equation E-1O is the proportionality constant, k. Shown in Figure E-2 is
the value of lnk as a function of I/T(K) for the three velocities by Ban (192).
4 Empirically k is found to be given by
a

210
heq E) ad
d Acs = shape facto
G Ac , 2/ 3
Figure E-1. Geometry used to calculate shape factor.
T(C)800 700 600
70
6o
STP velocity50 A 5 cm/sec
a 10 cm/sac40 0 15 cm/sec
U 0 -3
A
20
A
109 10 11 12
10 /T(K)
Figure E-2. First order constant vs I/T calculated fromresults of Ban [189].

211
k = K expa(----a/RT)-
As can be seen the value of k has the range 10 < k < 40 (=n/sec) while the
carrespcnding values of D/he q has the range 2.2 < D/he( < 3.2 cm/sec. Thus.
g-as phase diffusion l.imitatiCn s ccncarable in magnitude to the kinetic
effecz at the licjid-gas interface.
-Given the reaction te-rnerature and qecetry (he q ) , the conversion of HC1
can be calculated as a function of reactor length and flcwrate. Since it is
desirable for equilibriun conversion tc be achieved, the design criteria to
reach 99% conversion were examined. Figure E-3shews a plot of dirrensicnless
* boat lentr-h, L/hPe m , versus the mass Peclet number, Pem with X0 = 0.99. The
term in the dencminatcr, hPe , is simoly the volumtric flow rate divided by
the diffusion ccefficient, which is essentially constant. Thus the crdinate
is procprtional to the boat length and inversely proportional to the
vclumetric flow rate. The dimensionless cuantity a is a ratio of the reaction
velocity to the diffusive velocity and FigureE-3 shows the result for three
different values of a. As a t the reaction rate becomes extremely fast and
the liquid-cas interface can be assumed to be in equilibrium. The term Pe is
a measure of the imoortance cf the axial dispersion or back mixing in the sys-
£t-n. The imcrtance of this term becomes small for values of Pe > 5.m -
Plotted in Figure E-4 is the dimensionless length, z , versus the dimen-I
sionless parameter a for xb fixed to 0.99 and for 3 different values of Pem .
Using the values of DHCIH2 estimated and the values for k determined by fitting
the data of Ban (189), a is seen to be largely determined by the height above
the liquid, h. Two conclusions can be made about the conventional boat design.
First, the dimensionless length is often on the order of 0.2 to 2 in
_ _

212
NN O
x0
III
Figue E3. imenionessreator engh vrsu Pe fo vaiou
valus ofthe V, nmbe at 9% cnverion

213
6X'
LI 0
II
Figure E-4. Dimensionless reactor length versus Pe for variousvalues of the CVO number at 99,. conver'~ion.

a" 214
value while a is on the order cf 2 to 10 and thus equilibritn conver=_icn is
often nct reached under ncrmal cperaticn. This will increase the HCI concen-
tratin in the source zone and interact with impurity incorporation and de.o-
sition rates. Secondly, the required length is seen to be a strong function
of -( in this range. Alternatively, for fixed boat length, the ccnversicn
depends strongly upon the height, h. Thus, the conversion from run to run as
h changes can change significantly.
Calculations such as these should be helpful in designing future source
boats and in interpreting results obtained from CVD systems enplcying non-
ecuilibriun source boat designs. Research directions should ncw proceed toa
letting nature calculate the conversions. The modulated molecular beam mass
spectrcmeter will be used to verify this model for In, Ga and the alloy
interactions with HC1. In addition, an analysis of the transient behavior of
the system will be addressed and is important for both startup and formation
of abrupt junctions.
a

215
Appendix F
An ESD (Electron Stimulated Desorption) Study of the Interaction ofH2, D2 and 02 with GaAs (100)
I. Introduction
The interaction between GaAs and hydrogen is an important topic which
has been discussed in relatively few studies. Studies of this interaction
may provide information which is useful in the growth of epilayers or passi-
vating layers on semiconductor surfaces. It is possible that the presence
of surface and/or bulk hydrogen alters the electrical properties of III-V
semiconducting materials. Studies of this type are particularly important
with regard to the growth of GaAs films using molecular beam epitaxy (MBE)
(191) and chemical vapor deposition (CVD). In the CVD process, hydrogen is
typically present either as a carrier gas (193) or in the compounds used to
form the GaAs (194-196); i.e. AsH 3, GaH 3 or Ga(CH 3)3, etc. It has also been
shown that exposures of GaAs surfaces to hydrogen plasmas provides an effective
means of removing contamination (197-199). For these reasons the role of
hydrogen in the formation and preparation of GaAs and its effects on the
properties of GaAs should be considered.
An early study by Pretzer and Hafgstrum (200) used ion neutralization
spectroscopy (INS) to study the (111), (111) and (110) GaAs surfaces before
and after a room temperature exposure to different gases including 02' N2,
H2 and CO. A 3 x 10⁵ L exposure of a clean GaAs surface to H2 causes no
change in the INS spectrum. The authors conclude that molecular hydrogen does
not adsorb at significant rates at room temperature on GaAs surfaces.
This finding was reaffirmed in the UPS study of Gregory and Spicer
(201) who investigated the adsorption of 02, CO and H2 on
21

216
n- and p-type, single crystal, cleaned GaAs (110) surfaces. They
find that atomic hydrogen readily adsorbs on p-type surfaces at
room temperature causing a large change in the electron energy
distribution curve (EDC) between 1.6 and 5.5 eV below the valence
band maximum. For low exposures, this adsorption is reversible
in that heating the sample to about 235 0 C results in an EDC which
is quite similar to that of clean GaAs (110). By comparing these
spectra with results of a study of Cs-covered GaAs (119,202), theO9authors assert that adsorbed atomic hydrogen behaves like an
a alkali metal .adsorbed on GaAs. Although room temperature adsorp-
tion of molecular hydrogen is not observed, a 3 x 10⁷ L exposure
to H2 with tt.e sample heated to about 4150C results in
adsorption. UPS shows that this adsorbed hydrogen is different
than the atomically adsorbed hydrogen. Heating the sample to
about 700 0 C does not result in an EDC equivalent to an EDC from a
clean surface. Gregory and Spicer (201,202) suggest that a chemical
compound may form or that hydrogen diffuses into the GaAs.
Luth and Matyz (203) used high resolution electron energy loss
spectroscopy (HREELS) to study atomically adsorbed hydrogen and
deuterium on both n- and p-type GaAs (110). They assign loss
features to H and D bonded to both Ga annd As atoms and were ablea
to construct Morse functions which adequately describe the elec-
tronic potential energy curves and a rate expression which
describes thermal desorption of molecular hydrogen. Another
HREELS study by Dubois and Schwartz (204) also identifies hydrogen
atoms bonded to both Ga and As atoms on a (100)surface of
chromium-doped GaAs. A lengthy anneal forms a Ga-rich surface,
db

A217
and the HREELS peak due to H bonded to As disappears. An
electron energy loss spectroscopy (ELS) study by Bartels,
Surkamp, Clemens and Monch (205) and Monch (206) finds that hydrogen
atoms initially bond to the As. Several studies (201,203,205,206)
agree that a dipole or depletion layer forms at these surfaces
upon adsorption of atomic hydrogen.
The polar (100) surface of GaAs is more complex than the
(110) cleavage surface because it reconstructs in numerous ways
resulting in a variable ratio of surface Ga-to-As atoms. The
relationship between structure and composition has been
examined (207,208) finding that the As coverage varies from about
0.27 to 1.00 as the surface reconstructs with LEED patterns: (4 x
6), (1 x 6), c(8 x 2), c(2 x 8) and c(4 x 4). Bringans and
Bachrach (209-211) have used angle-resolved UPS to study atomically
adsorbed hydrogen on GaAs (100) and (111). They find that the
hydride surface always exhibits the sam-e LEED pattern regardless
of the original structure of the clean GaAs(100) and (111)
surface before adsorption. The hydrided structure of GaAs(100)
lies between the c(4 x 4) and c(2 x 8) structures, and annealing
always yields the c(2 x 8) pattern. The GaAs (TTT) reverts to a
1 x 1) symmetry after saturation exposure to hydrogen. The
authors conclude that atomically adsorbed hydrogen on a GaAs(100)
surface results in an As-rich surface which does not agree with
the results of Dubois and Schwartz (204). The UPS results show
tnat adsorption of atomic hydrogen removes states from near the
top of the valence band and introduces new states 4.3 to 5.2 eV
lower. A surface state exists on this surface, and the fact that
218
it does not disperse in the Q T K direction suggests that it does
not participate in bonding with the hydrogen.
Friedel, Demay and Gourrier (197) demonstrated that exposing a
GaAs surface to a hydrogen plasma is an effective way to remove
carbon and nitrogen contamination but is somewhat less effective
for removing oxygen. Chang and Darack(198)have shown that a high
frequency hydrogen plasma can easily,etch GaAs at a rate of about
20A/sec and that this rate is proportional to both the hydrogen
pressure and the Qf power of the discharge. A surface study of
* the effects of exposing a GaAs (001) surface to a hydrogen plasma
has been reported by Freidel, Larsen, Gourrier, Cabanie and
Gerits (199). In this study variations in the surface structure,
high lying core levels of As and Ga and valence band were
examined using angle-resolved UPS and reflective high energy
electron diffraction (RHEED) as a function of exposure to the
plasma. By curve resolving the As 3d and Ga 3d levels, they find
that hydrogen induces a new peak on the Ga spectrum and possibly
two on the As spectrum. They also believe that hydrogen
initially bonds to the As atoms and then to the Ga atoms at
higher exposures. The Ga/As ratio increases with plasma
exposure, and the surface becomes more disordered.
Many surface techniques including ESCA, UPS, AES, ELS and
ion scattering spectroscopy (ISS) are relatively insensitive to
hydrogen or can observe hydrogen only indirectly through its
influences on other spectral features. This is usually due to
its small cross sections, light mass or lack of core-level elec-
trons. HREELS is an example of a techniques in which features
219
due specifically to hydrogen are observed. Techniques which rely
upon a mass spectrometric determination of hydrogen are also
directly sensitive to hydrogen. In this study the usefulness of
electron stimulated desortion (ESD) in studying the interaction
of hydrogen with GaAs(100) and oxidized GaAs(100) is
investigated. This represents an initial attempt at using ESD
to examine hydrogen on GaAs surfaces in which the following ques-
tions are considered. Under what conditions does hydrogen adsorb
on GaAs surfaces? Can ESD provide a measure of the amount of
adsorbed hydrogen? It it possible to distinguish between
different adsorbed states of hydrogen using ESD? The preliminary
results presented here demonstrate that ESD is a useful
technique for studying the interaction of hydrogen with GaAs and
most likely with other III-V materials.
II. Experimental
A. Sample
A cut and polished, undoped single crystal GaAs sample fur-
nished by MACOM was used in this study. It was produced using
the Czschralski crystal growth method and the liquid
* encapsulation technique. A room temperature chemical etch with a
weak sodium hypochlorite solution was used to produce a mirror
finish of the (100) surface. After solvent cleaning the sample
* in an ultrasonic bath of electronic grade acetone followed by
trichlorethylene and then methanol, the sample (10 x 1610.5mm)
was mechanically supported by a copper holder. A 0.5mm diameter
a220
tungsten filament was mounted behind the sample for radiant heat-
ing. The temperature of the sample was measured using an iron-
constantan thermocouple, which was mechanically pressed against
the sample, and an optical pyrometer over the range of 230 to
5600C. After inserting the sample the vacuum system was baked
for 24 hours at 200 0 C and pumped down to a base pressure of 2 x
A 10-10 Torr. The sample was cleaned using cycles of room temper-
ature, argon-ion bombardment followed by annealing (iba).
Specific conditions used were an Ar-ion sputter at a beam energy
* of 1.0 KeV at a beam current of 1 uA over an area of approximate-
ly 2mm diameter for 15 minutes; a 5-minute anneal at 5000C; an
Ar-ion sputter at a beam energy of. 1.0 KeV and a current of 1.5
uA for 30 minutes concluding with a 500 0 C anneal for 5 minutes.
This procedure resulted in a clean surface as determined by
AES. AES spectra taken from the contaminated and clean sample
are shown in FigureF-laand F-lbrespectively.
B. Equipment and Procedures
The vacuum system used in these experiments has been
described previously (213). AES and ESD were performed using a
double-pass cylindrical mirror analyzer (CMA)(PHI Model 15-255
AGAR) with an internal coaxial electron gun and a moveable
aperture. AES spectra were taken in the nonretarding mode using
an oscillation of 0.5 Vpp, a primary beam energy of 3 KeV and aS
current of 25 uA over a spot size of approximately 0.1mm in dia-
meter.
S

AL 221
M~~~1 ET Il C 4E G 0V
-- A

222
ESD data were taken using the CMA as a time-of-flight mass
spectrometer as discussed by Traum and Woodruff (214). Electronic
control and data collection were performed using a PDP 11/02
computer system and a computer-interfaced, digital pulse counting
circuit (215). In these experiments energy analysis of low energy
(<20 eV) positive ions was accomplished by operating the CMA in
the retarding mode with a pass energy of 50 eV. The ions were
first accelerated by a negative potential placed on the 2nd grid
and inner cylinder. The outer cylinder was maintained at a more
positive potential (but negative potential with respect to
ground) than the inner cylinder. The complete set of operating
voltages has been published previously (216). For mass analysis
the electron beam was pulsed onto the sample for 300 ns using the
electron gun deflector plates on the CMA. After an appropriate
delay period (4.2 us for H , 5.8 us for D+ or 16.8 us for 0 )
pulses were counted for a 300 ns period. A primary beam energy
of 140 eV and primary beam current of about 500 nA were used.
The sample was biased at -10.0 V. It was mounted at an angle of
450 with respect to the slectron beam, and ions desorbing in the
direction normal to the sample were selected with the moveable
aperture.
Three different types of ESD spectra were taken in this
study. A mass spectrum of the desorbing ions was obtained by
selecting an ion kinetic energy and scanning the delay time. An
ion energy distribution (ESDIED spectrum) was obtained by select-
ing a delay time appropriate for the ion of interest and scanning
kinetic energy with the CMA. The total ion energy distribution
was obtained by scanning ion kinetic energy without time gating.

223
111 Results and Discussion
In ESD electrons impact a surface creating localized excita-
tions which can decay causing desorption of ions, neutrals and
metastatles. Thus ESO is a destructive process in that it alters
the composition and structure of the surface. Beam exposures
were minimized in these experiments to reduce surface damage
while still obtaining reasonable S/N ratios. In many cases a
second scan was taken, and since these duplicated the initial
scan, it is assumed that effects due to beam damage are
negligible.{a
ESD is a complicated technique in that it can be performed
Iin many different ways to obtain various types of information
about bonding at a surface and/or the mechanism of excitation and
desorption. These topics have been discussed in several review
articles (216-227) and are only considered when they are directly
related to the results presented here. Several points regarding
ESD which do relate to this study are its surface sensitivity,
the isotope effect. and cross section determination.
In ESD a low energy ion can desorb only from the topa
monolayer. Ions which are created below the top monolayer have a
nearly 100% probability of being neutralized during the
desorption process. However, excitations created beneath thea
surface can emit secondary electrons which can create excitations
at the surface and then cause emission of ions (228). Thus ESD is
highly (outermost monolayer) sensitive with respect to the
emitted ionic signal but not so surface specific with respect to
the primary electron beam.

224
The ESD mass spectrum shown in FigureF-2was taken from the
contaminated surface corresponding to FigureF-a. The peak at 4.2
us reveals the presence of hydrogen, but ESD peaks due to
- positive ions containing carbon or oxygen do not appear although
the surface is heavily contaminated with these species. After
iba cleaning the ESD mass spectrum appears the same except that
the total counts due to H is reduced by a factor of 8 using the
same scan parameters. This indicates that hydrogen is present as
a surface species even on a "clean" GaAs surface. Drawing an
analogy between GaAs and Si, which readily chemisorbs hydrogen
and forms a hydride, may be useful in understanding the interac-
tion between hydrogen and GaAs. GaAs is both isoelectronic and
isostructural with Si except GaAs has a slightly larger lattice
constant and its bonding structure is less covalent. These facts
suggest that a hydride of GaAs may form and support the
suggestion of Gregory and Spicer (201)that hydrogen diffuses into
GaAs forming a compound. The changes in the chemical and
electrical properties of GaAs due to the incorporation of
hydrogen have not been thoroughly investigated.
The surface concentration of hydrogen present in these
experiments is not known. In order to determine the surface
concentration of hydrogen using ESD, it is necessary to know the
total cross ection for desorption. ESD cross sections of
adsorbed species vary over a large range but generally are orders
* of magnitude smaller than the corresponding gas phase cross
secton due to a high reneutralization probability of the escaping
ion. However, an independent measurement of the surface concen-

AM 225
ISO
5.; 35
Figure F-2. ESO mass spectrum taken from the contaminated surfaceof Figure E-la.

226
tration is required to determine the ESD cross section. As
pointed out above, this is difficult with hydrogen. An attempt
was made to use temperature programmed desorption to estimate the
amount of hydrogen and deuterium present, but the sample mount
was too massive to perform high quality TPD. A very crude esti-
mate from the TPD results suggest that tenths of a monolayer of
deuterium were adsorbed during dosing. Efforts are being made to
improve the quantification of these results.
Regardless of the cleaning procedure used, hydrogen is
always present on the surface. It is possible that the surface
hydrogen originally present is not completely removed, that the
surface adsorbs background hydrogen during the cleaning process
or that hydrogen in the bulk diffuses to. the surface during
annealing. In order to distinguish between surface hydrogen
which Is always present and hydrogen which is adsorbed under
particular conditions, deuterium was used in these experiments.
It was verified that molecular deuterium does not adsorb on GaAs
at significant rates at room temperature. A hot tungsten
afilament was used to radiantly heat the sample. It is known that
this dissociates deuterium which effuses to the surface even
though the filament is not in line-of-sight of the surface (211).
B It is assumed in these studies that the adsorbed deuterium is due
to adsorption of dissociated deuterium but the adsorption of some
molecular deuterium cannot be ruled out. The dose rate of
* Ceu~erlum atoms in these studies is only known in a relative
sense.

227
.igure F-3 shows an ESD mass spectrum after exposing the clean
A surface to a 2000 L dose of D2 while maintaining the sample at
2000C. In addition to the H peak, which is the typical height
from a clean surface, a peak due to D appears at a flight time
I of 5.8 us. Determining the relative amounts of adsorbed hydrogen
and deuterium from this data is not straightforward because ESD
exhibits an isotope effect which is particularly large for hydro-
gen. The desorption cross section is proportional to exp(-c[M)
where c is a constant and M is the ..:ass of the desorbing
ion (226). An isotopic ion of higher mass leaves the surface with
* approximately the same kinetic energy as a lower mass isotopic
ion. Thus, the heavier ion desorbs with a lower velocity and has
a greater probability for reneutralization. This has been
verified experimentially. The ratio of the ionic desorption
cross sections for H+ and D + desorbing from a W surface is above
100:1 (229,231). By this reasoning Figure F-3suggests that the
surface concentration of deuterium is greater than the surface
concentration of hydrogen by a factor of. approximately 50.
The total ion energy spectrum and ESDIED spectra of H' and
D are shown in FiguresF-4-a,b and c respectively. Due to the
similarities of b and c, it is believed that hydrogen and
deuterium are desorbing from the same adsorbed state by the same
mechanism. Unfortunately, it is not known if hydrogen desorbed
from states bound to Ga or As atoms or both. The spectra were
:aken in order: c,b,a. Comparing the high energy tails of th'.ese
spectra suggests that with increased exposure to the primary
beam, a higher kinetic energy state may become important. This
a

228
Zo-
to
surface shown in Figure F-lb to a 2000L dose of D whileheating the sample at 200'C.2

229
0- 0-0
0 1c2-0 is- ~ o s
ION Y~tITtC ENJI3FGy (tV)
Figure F-4. (a) Total ion (H +and D + energy distribution spectrumand ESUIED spectra of (b) H' and (c)O'r. These spectracorrespond to the mass spectrum shown in Figure F-3.

230
is seen most readily by comparing the widths of the H"+ and D+
spectra with the width of the total ion spectrum. This secont
state would have a lower desorption cross section than the more
prominent state, and it would require a larger beam exposure to
build up a significant count.
Following the 2000 L D2 dose at 2000C, the sample was heated
to 5000C for 10 minutes. ESDIED scans taken before and after
heating are quite similar in shape. However, after heating the
D+ signal of the ESD mass spectrum is reduced by a factor of 2
* with respect to the H+ signal which essentially remains
unchanged. This result agrees with the results of Gregory and
Spicer (201) in which adsorbed hydrogen could not be totally
removed from the surface after a 3 x 10⁷ L exposure to molecular
hydrogen with the sample heated to 4150C. As stated above, it is
possible that deuterium adsorbed from both atomic and molecular
states during dosing at elevated temperatures in this study . It
was also found that dosing the sample at 400 0C rather than 2000C
results in spectra identical to those shown in Figures F-3and F-4.
a In order to examine the influence of surface oxygen on the
interaction between hydrogen and GaAs, the clean surface was
oxidized by dosing with 12,000 L of 02 at room temperature. The
resulting AES spectrum is shown in Figure F-S Again, an ESD mass
spectrum taken after a 2,000 L dose of D2 at room temperature
show3 no evidence of deuterium adsorption. However, heating the
sample atove 2000C causes adsorption of deuterium. The H and D
counts are about 50' greater from the oxidized surface than from
the clean surface and the ratio of D+ to H is similar for both

231
I I f I i I f 1 I 1 1 1Ica 13oo
N(E&0.
Figure F-S. AES spectrum taken from GaAs (100) after a 12,000 Ldose of 0 2 at room temperature.

232
surfaces. It was also found that deuterium adsorbs more readily
on a freshly oxidiized surface than on a vacuum-aged (I week at
l0- 10 Torr) oxidized surface. Also, the normalized I-i counts from
a vacuum-aged surface is 3 times as large as the counts from a
freshly oxidized surface. A possible expl.anation for this
behavior is that an oxidized surface adsorbs water molecules
during a long exposure to the background gas in the UHV system.
ESDIED spectra of the oxided surface after exposure to 2000
L of D while heating the surface at 200 0 C are shown in figure
6. The total ion energy spectrum shown in Figure F-6a clearly
reveals the presence of a high kinetic energy shoulder. The
presence of two states is also exibited by Figures F-6b and c for
H and D* respectively. However, the relative ratios of ions
from the two states are different for hydrogen and deuterium.
ESD mass spectra taken at ion kinetic energies of 0.8 and 2.7 eV
are shown in FiguresF-7aand b respectively and are summarized in
Table F-i. The surface concentration ratio (D/ H) for ions desorb-
ing at 0.8 eV is 33 while it is 20 for ions desorbing at 2.7
eV. This assumes that the cross section for H desorption by a
factor of 100. The large difference in concentration ratios is
consistent with the interpretation that at least two different
binding states of hydrogen are present. The precise nature of
these states remains to be investigated.
Vasquez, Lewis and Grunthaner (232) have suggested that
Sihydroxyl groups on GaAs surfaces decompose according to the reac-
tion

233
(Co) cJ-
II I I I I I I I
\?2o0oi -o I ' : c s
A
Figure F-6. (a) Total ion (H+ and D+) eqergy distrIbution spectrumand ESOIED spectra of (b) H and (c) 0 taken after
* exposing the oxided surface shown in Figure F-5 to 2000LAof D2 while heating the sample at 2000C.
d
-.

234
-J-
S
to0 L I Ia
Figure F-7. ESO mass spectra corresponding to the ESDIED spectrashown in Figure F-6. (a) is at an ion kinetic energyof 0.8 eV and (b) is at an ion kinetic energy of 2.7 ev.
a H
I

235
Table I
Comparison of' ESD mass spectra shown in FigureF-7
Ion K.E. Ion Normalized Counts Cone Ratio
0.8ev H + 36 33
D + 12
2.7eV H +72 20
D + 15

236
2Ga (OH) 3--,Ga 2 0 3 + 3H20 F-I
at high temperature thereby reducing the oxygen content in the
- surface region. This was considered in this study. Firstly, it
was found that heating the deuterated and oxide-covered surface
to 5000C results in a very large decrease in the ESD D+ signal.
Secondly, monitoring the desorbing species with a quadrupole mass
spectrometer while increasing the sample temperature shows that
D2, HD and H2 desorb and that no H20 or other oxygen-containing
* species desorb. If hydroxyl groups form under the dosing condi-
tions used in this stu 4y, then heating causes them to form mole-
cular hydrogen leaving the oxygen on the surface. This
observation is also consistent with the fact that surface cxygen
on GaAs is more resistant to removal by a hydrogen plasma (197)
than the contaminants.
Conclusion
AES and ESD have been used to study the interaction between
* deuterium and both clean and oxided GaAs (100). Cleaning was
oerformed using iba cycles, but it was not possible to remove the
surface hydrogen completely. Molecular deuterium does not adsorb
on either surface at significant rates at room temperature, but
heating the samples radiantly between 200 and 400 0 C with a hot
filament causes adsorption of deuterium. A partially successful
attempt to use TPD to quantify the amounts of adsorbed deuterium
indicates that a few tenths of a monolayer probably adsorb during
the dosing period. Taking the ESD isotope effect into account,
B

237
it is estimated that the amount of adsorbed deuterium is about 50
times the amount of residual hydrogen. Energy analysis of the
desorbing ions indicates that one and possibly two adsorbed
states are present on the clean GaAs (100) surface, but the
nature of the adsorption states is not known. Heating the sample
at 5000C causes most of the adsorbed deuterium to desorb, but
some may diffuse into the bulk.
The ESD H* and D' signals from the oxided surface are about
50' greater than from the clean surface after dosing under the
same conditions. ESDIED clearly demonstrates that at least two
adsorption states of hydrogen are present on the oxided
surface. Heating the sample to 500 0C causes desorption of D2 , HD
and H2 , but no oxygen or oxygen-containing species desorb from
the deuterium-dosed, oxided GaAs (100) surface.
Although much remains to be done in characterizing the
interaction of hydrogen with GaAs surfaces and, more generally,
III-V semiconductor surfaces, the results presented in this paper
demonstrate that ESD provides a very useful techniques for this
type of study. It is now important to quantify the ESD results
more accurately and to characterize the adsorbed states of hydro-
gen. Both are possible through the combined use of other surface
tec-.niques with ESD.
'a
L J
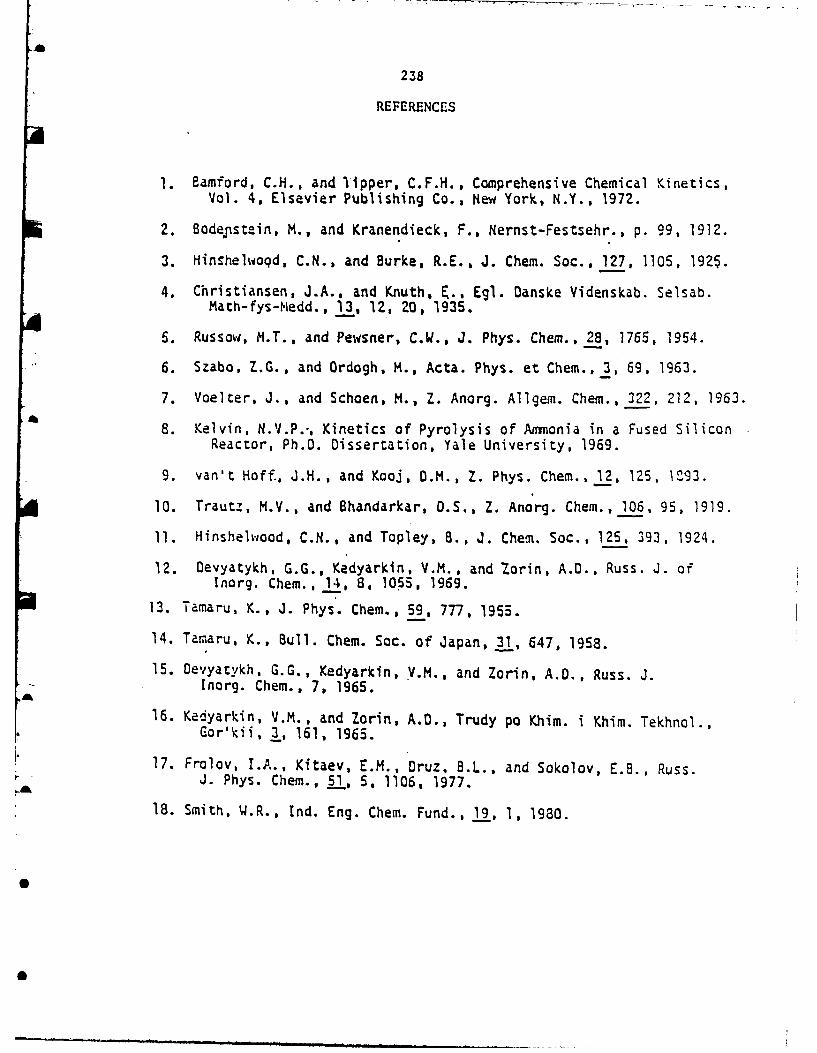
*
238
REFERENCES
1. Eamford, C.H., and lipper, C.F.H., Comprehensive Chemical Kinetics,
Vol. 4, Elsevier Publishing Co., New York, N.Y., 1972.
2. Bodejnstein, M., and Kranendieck, F., Nernst-Festsehr., p. 99, 1912.
3. HinShelwoqd, C.N., and Burke, R.E., J. Chem. Soc., 127, 1105, 1925.
4. Christiansen, J.A., and Knuth, E., Eg1. Danske Videnskab. Selsab.Math-fys-Medd., 13, 1Z, 20, 1935.
5. Russow, M.T., and Pewsner, C.W., J. Phys. Chem., 28, 1765, 1954.
6. Szabo, Z.G., and Ordogh, M., Acta. Phys. et Chem., 3, 69, 1963.
7. Voelter, J., and Schoen, M., Z. Anorg. Allgem. Chem., 322, 212, 1963.
8. Kelvin, N.V.P.-, Kinetics of Pyrolysis of Ammonia in a Fused SiliconReactor, Ph.D. Dissertation, Yale University, 1969.
9. van't Hoff., J.H., and Kooj, D.M., Z. Phys. Chem., 12, 125, gZ93.
10. Trautz, M.V., and Bhandarkar, 0.S., Z. Anorg. Chem., 106, 95, 1919.
11. Hinshelwood, C.N., and Topley, B., J. Chem. Soc., 125, 393, 1924.
12. Devyatykh, G.G., Kedyarkin, V.M., and 'Zorin, A.D., Russ. J. ofInorg. Chem., 14, 8, 1055, 1969.
13. Tamaru, K., J. Phys. Chem., 59, 777, 1955.
14. Tamaru, K., Bull. Chem. Soc. of Japan, 31, 647, 1958.
15. Oevyatykh, G.G., Kedyarkin, V.M., and Zorin, A.D., Russ. J.Inorg. Chem., 7, 1965.
16. Kecyarkin, V.M., and Zorin, A.D., Trudy po Khim. i Khim. Tekhnol.,Gor'kii, 3, 161, 1965.
17. Frolov, I.A., Kitaev, E.M., Druz, B.L., and Sokolov, E.B., Russ.J. Phys. Chem., 5j, 5, 1106, 1977.
18. Smith, W.R., Ind. Eng. Chem. Fund., 19, 1, 1980.

239
19. Coulson, J.M.,-Richardson, J.F., Bockhurst, J.R., Harker, J.H.,Chemical Engineering, Vol. I. .3rd, ed., Permagon Pres4, London,1977.
20. Carslaw, H.S., and Jaeger, J.C., Conduction of Heat in Solids,2nd ed., Oxford University Press, Oxford, 1959.
21. JANAF Thermochemical Tables, National Standard Reference DataSeries 37, U.S. Bureau of Standards, Washington, D.C., 1971.
22. Laidler, K.J., Chemical Kinetics, 2nd ed., McGraw-Hill, New York,1965.
23. Bird, R.B., Stewart, W.E., Lig'htfoot, E.N., Transport Phenomena,John Wiley and Sons, New York, 1960.
24. Robert C. Weast, Editor, Handbook of Chemistry and Physics, 51sted., The Chemical Rubber Co., Cleveland, OH, 1971.
a "25. Constance W. Haas, Editor, Selected Mass Spectal Data. AmericanPetroleum Institute Research Project 44, Texas A & M University,1977.
26. Dang, V.D., and Steinberg,M., J. Phys. Chem., 84, 214, 1980.
27. Hsieh, J., Private Communication.
28. Graetz, L., Ann. Phys., 25, 337, 1885.
29. Dun, H., Mattes, B.L., and Stevenson, D.A., Proc. 10th Mat. Res.Symp. on Charac. of High Temp. Vapors and Gases, NBS SpecialPub. 561, Gaithersburg, MD, 1978.
30. Foxon, C.T., Joyce, B.A., Farrow, R.F.C., and Griffiths, R.M., J.Phys. 0.: Apply. Phys., 7, 2422, 1974;
31. O'Hanlon, J.F., A User's Guide to Vacuum Technology, John Wiley£and Sons, New York, 1980.
32. Yeliin, E., Yin, L.I., and Adler, I., Rev. of Sci. Instr., 41,1, 18, 1970.
33. Kniahz, J.R., Effer, 0., and Evans, P.R., Solid State Electron., 8,
178, 96S.
34. E fer, D., J. Electrochem. Soc., 112, 1020, 1965.
35. Wolfe, C.M., and Stillman, G.E., 1970 Syrp. on GaAs, 3.
36. C-:irns, 8., and Faiman, R., J. Electrochem. Soc., 115, 3276, 1963.

240
37. Cairns, B., and Friman, R., J. Electrochem. Soc., 11.7, 197C, 1970.
I. 38. DiLoranzo, J.V., Moore, G.E., and Machala, A.E., J. Electrochem.Soc., 117, 102C, 1970.
39. OiLorenzo, J.V., and Moore, G.E., J. Electrochem. Soc., 113, 11,1823, 1971.
40. Rai-Choudhury, P., J. Crystal Growth, 11, 113, 1971.
41. Ashen, D.J., Dean, P.J., Hurle, 0.T.J., Mullin, J.B., Royle, A., andWhite, A.M., Proc. 5th Intl. Syrp. on GaAs, Inst. Phys. Conf. Ser.34, 1975.
42. Beiden, V.E., Oyachkova, N.M., Ivanyatin, L.A., and Nishanov, 0.,Izves. Akad. Nauk SSSR, Neorgan. Mat., 12, 8, 1114, 1974.
43.. Wolfe, C.M., Stillman, G.E., and Korn, D.M., Inst. Phys. Conf. Ser.,S~-33b, 120, 1977.
44. Solomon, R., Gallium Arsenide and Related Compounds, Inst. Phys.Conf. Ser. 7, 1963.
45. Palm, L., Bruch, H., Bachem, K., and Balk, D.J., Electronic Mat., 8,, 555, 1979.
46. Seki, H., Koukito, A., Seki, H., and Fujimoto, M., J. Crystal Gro~yth,43, 159, 1973.
47. Ozeki, M., Ki tahara, K., Nakai, K., Shibatomi, A., Dazai, K., Okawaa,S., and Ryuzan, 0., Japan. J. Applied Physics, 16, 9, 1617, 1977.
48. Boucher, A., and Hollan, L., J. Electrochem. Soc., 117, 932, 1970.
49. Gentner, J.L., Bernard, C., and Cadoret, R., J. Crystal Growth, 56,332, 1982.
50. Cadoret, R., Current Topics in Mat. Sci., Vol. 5, Editor E. Kaldic,1 980.
51. Shaw, 0.W., J. Crystal Growth, -3, 117, 1971.
52. Clarke, R.C., Joyce, B.D., and Wilgloss, W.H.E., Solid State Corm.,8, 1125, 1970.
53. Hales, H.C., Knight, J.R., and Wilkins, C.W., 1970 Symposium onGaAs, 57.
54. Joyce, S.D., and Williams, E.W., 1970 Symposium on GaAs, 57.

£ 241
55. Clarke, R.C., J. Crystal Growth, 23, 166, 1974.
56. Clarke, R.C., Inst. Phys. Conf. Ser. No. 45, 1977.
57. Easton, B.C., Acta Electronica, 21, 2, 151, 1978.
58. Weine , M.E., J. Electrochem. Soc., 119, 4, 496, 1972.
59. Fairhurst, K., Lee, D., Robertson, 0.S., Parfitt, H.T., andWilgloss, W.H.E., Proc. 1980 NATO Sponsored InP Workshop,313, RADC-TM-80-07.
60. Hales, M.C., and Knight, J.R., J. Crystal Growth, 46, 582, 1979.
61. Chevrier, J., Huber, A., and Linh, N.T., J. Crystal Growth, 47,267, 1979.
62. Cardwell, H.J., Giles, P.L., Hales, M.C., and Stirland, O.J.,Proc. 1980 NATO InP Workshop, Hascom AFB, 235 RADC-TM-80-07.
63. Shaw, 0.W., J. Phys. Chem. Solids, 36, 111, 1975.
64. Enstrom, R.E., and Peterson, C.C., Trans. Metall. Soc., AI.IE239, 418, 1967.
65. Pogge; H.S., and Kemlage, B.M., J. Crystal Growth, 31, 183,1975"
66. Kennedy, J.K., Potter, W.D., and Davies, D.E., J. Crystal Growth,24/24, 233, 1974.
67. Enstrom, R.E., and Appert, J., Electrgchem. Soc., 129, 11, 2566,1982.
68. Skrofrre, B.J., Low, T.J., Roth, T.J., Scillman, G.E., Kennedy, J.K.,and Abrovkah, J.K., J. Electronic Mar., 12. 2, 433, 1983.
69. Putz, N., Venhoff, E., Bachen, K-H., Balk, P., and Luth, H., J.Electrochem. Soc., 128, 10, 2202, 1981.
70. Olsen, G.H., Proc. 1980 NATO InP Workshop, Hascom AFB, RADC-T.I-80-07.
A 71. Hyder, S.B., Proc. 1980 NATO InP Workshop, Hascom AFB, RADC-TM-80-07.
72. Zinkiewicz, L.M., Roth, T.J., Skromme, B.J., and Stillma6, G.E.,Ins'. Phys. Conf. Ser., 56, 19., 1981.

242
73. Anderson, T.J., Research Report, USAF Rome Air Development Center,F49620-79-C-C038.
74. Jones, K.A., J. Crystal Growth, 60, 313, 1982.
75. Ban, V.S., and Ettenberg, M.J., J. Phys. Chem. Solids, 34, 1119,1973. ,
76. Usui, A., and Watanabe, H., J. Electronic Mat., 12, 5, 891, 1983.
77. Clasen, R.J., Memorandum RM-4345-PR, The Rand Corporation, Santa
Monica, CA, 1965.
.78. Cruise, D.R., J. Phys. Chem., 68, 12, 3797, 1964.
79. Anderson, T.J., University of Florida, Proposal to the Departmentof the Air Force, 1979.
80. Smith, W.R., Theoretical Chemistry: Advances and Perspectives,Vol. 5, 1980, Academic Press, New York.
81. Hunt, L.P., and Sirtl, E., J. Electrochem. Soc., 119, 12, 1741, 1972.
82. Blakemore, J.S., J. Appl. Phys., 53, 10, 1982.
83. Hurle, D.T.J., J. Phys. Chem. Solids, 40, 613, 1979.
84. Hurle, 0.T.J., J. Phys. Chem. Solids, 40, 627, 1979.
85. Hurle, O.T.J., J. Phys. Chem. Solids, 40, 639, 1979.
86. Hurle, D.T.J., J. Phys. Chem. Solids, 40, 647, 1979.
87. JANAF Thermochemical Tables, J. Phys. Chem. Ref. Data, 3, 311, 1974.
88. JANAF Thermochemical Tables, J. Phys. Chem. Ref. Data, 4, 1, 1975.
89. Clair ou, N., Sol, J.P., Linh, N.T., and Moulin, M., J. CrystalGrcwth, 27, 325, 1975.
9. Hall, R.N., J. Electrochem. Soc., 110, 385, 1963.
'91. Muzynski, Z., and Riabeev, N.G., J. Crystal Growth, 36, 335, 1976.
92. Osamura, K., Inoue, J., and Murakami, Y., J. Elec. Soc., 119, 103,1972.
*€
0

243
93. Hultgren, R., Desia, P.D., Hawkins; D.T., Gleiser, M., Kelley,K.K., and Wagman, D.D., Selected Values of the ThermodynamicProperties of the Elements, Am. Soc. Metals, Metals Park, Ohio,1973.
94. Rus4n, A.D., Agamirova, L.M., Zhukov, E.G., and Kalinnikov, V.T.,
Vestn. Mosk. Univ., Ser. .2; Khim, 23, 104, 1982.
95. Herrick, C.C., and Feber, R.C., "J. Phys. Chem., 72, 1102, .1968.
96. Rosenblatt, G.M., and Lee, P.K., J. Chem. Phys., 49, 2995, 1968.
97. Nesmayanov, A.N., Ph.D. Dissertation, Moscow State Univ., USSR,1963.
98. Strathdee, B.A., and Pidgeon, L.M., Trans. Can. Inst. Mining Met.,64, 506, 1961.
99. Brewer, L., and Kane, J.S., J. Phys. Chem., 59, 105, 1955.Ii
100. Wiechmann, F., Heimburg, M., and Blitz, W., Z. Anorg. Allgein.Chem., 240, 129, 1938.
101. Horiba, S., Z. Physik. Chem., 106, 295, 1932.
102. Ruff, 0., and Mugdon, S., Z. Anorg. Allgem. Chem., 117, 147, 1921.
103. Ruff, 0., and Bergdahl, B., Z. Anorg. Allgem. Chem., 106, 76, 1919.
104. Preuner, G., and Brockmoller, I., Z. Physik. Chem., 81, 129, 1912.
r 105. Gibbson, G.E., Doctoral Dissertation, Univ. of Breslau, Poland, 1911.
106. Mullin, J.B., and Hurle, D.J.T., J. Luminescence, 7, 176, 1973.
107. Foxon, C.T., Harvey, J.A., and Joyce, B.A., J. Phys. Chem. Solids,34, 1693, 1973.
d108. Richman, D., and Hockings, E.F., J. Electrochem. Soc., 112, 461,
1965.
109. Rau, H., J. Chem. Thermo. 7, 27, 1975.
S110. Goldfinger, P., and Jeuhehomie, M., Advan. Mass. Spectrometry, 1,534, 1959.
111. Arthur, J.R., J. Phys. Chem. Solids, 28, 2257, 1967.
112. Drowart, J., and Goldfinger, P., J. Chem. Phys., 55, 721, 1958.
4 113. Gutbier, H., Z. Naturf., ]6a, 26a, 1961.
114. De;.taria, G., Malaspina, L., and Piacente, V., J. Chem. Phys.,52, 1019, 1970.

244
115. Pupp, C., Murray, J.J., and Pottie, R.F., J. Chem. Thermodynamics,6, 123, 1974.
116. Murray, J.J., Pupp, C., and Pottie, R.F., J. Chem. Phys., 58,2569, 1973.
117. Orowart, J., Smoes, S., and Vanderauwere-Mahieu, A., J. Chem.
Thermodynamics, 10, 453, 197a.
118. Panish, M.B., J. Crystal Growth, 27, 6, 1974.
119. Martosudirdjo, S., and Pratt, J.N., Thermochim. Acta., 10,23, 1974.
120. Abbasov, A.S., Ph.D. Dissertation, Univ. of Moscow, USSR, 1974.
a 121. Sirota, N.N., and Yushevich, N.N., Chemical Bonds in Semiconductorsand Solids, N.N. Sirota. ed., Consultants Bureau, New York, 1967.
122. Rakov, V.V., Lainer, B.D., and Milvidiskii, M.G., Russ. J. Phys.Chem., 44, 922, 1970.
123. Golodushko, V.Z., and Sirota, M.N., Chemical Bonds in Semiconductorsand Solids, l.N. Sirota, ed., Consultants Bureau, New York, 1967.
124. Richman, 0., J. Phys. Chem. Solids, 24, 1131, 1963.
125. Folberth, O.G., J. Phys. Chem. Solids, 7, 295, 1958.
126. Boomcard, J., and Schol, K., Phillips Res. Rep., 12, 127, 1957.
127. Khukhryanskii, Y.P., Kondaurov, V.P., Nikolaeva, F.P., Pantelev,V.I., and Schevelev, M.I., Izv. Akad. Nauk. SSSR, Neorg. Mat.,10, 1877, 1974.
a
128. Battat, D., Faktor, M.M., Garrett, I., and Moss, R.H., Far. Trans. 1,12, 2302, 1974.
129. Piesbergen, H., Z. Naturf., 16a, 268, 1961.
* 130. Lichter, B.D., and Sommelet, P., Trans. AIME, 245, 1021. 1969.
131. Cox, R.H., and Pool, M.J., J. Chem. Eng. Data, 12, 247, 1967.
132. Marina, L.I., Nashelskii, A.Y., and Sakharov, B.A., ChemicalBonds in Semiconductors and Solids, N.N. Sirota, ed., 3, 124, 1972.
133. Maslov, P.G., and Maslov, Y.P.,Chemical Bonds in Semiconductorsand Solids, N.N. Sirota, ed., 3,191, 1972.
134. Yushin, A.S., and Osipova, L.I., Russ. J. Phys. Chem., 50, 895,1976.
L

245
135. Chen, Y., Chung-nan K'uang Yeh Hsueh Yuan Hsueh Pao, 19. 125,d1980.
136. Shaulov, U.K., and Mosin, A.M., Russ. J. Phys. Chem., 47, 844.1973.
137. Steinmetz, E., and Roth, H., J. Less-Coammon Metals, 16, 295, 1968.
1 138. Glassner, A., The Thermochemicai Properties of the Oxides,Fluorides and Chlorides to 2500 K, Argonne, National Lab. ReportANL-5760, 1968.
139. Wicks, C.E., and Block, F.E., Bureau of Mines Bulletin, 605, 1983.
m 140. Gunn, S.R., Ihorg. Chem., 11. 796, 1972.
141. Panish, M.B., and Arthur, J.R., J. Chem. Thermodynamics, 2, 299,1970.
142. Kuniva, Y., Hosaka, M., and Shindo, I., Denki Kagaku, 43, 372,1975.
143. Barrow, R.F., Trans. Faraday Soc., 56, 952, 1960.
144. Shaulov, Y.K., and Mosin, A.M., Russ. J. Phys. Chem., 47, 642,1973.
145. Komshilova, O.N., Polyachehok, O.G., and Novikov, G.I., Russ. J.Inorg. Chem., 15, 129, 1970.
146. Fischer, W., and Jubermann, 0., Z. Anorg. Allg. Chem., 227, 227,1938.
147. Laubengayer, A.W., and Schirmer, F.B., J. Am. Chem. Soc., 62,1578, 1940.
148. Schafer, H., and Binnewies, M., Z. Anorg. Alg. Chem., 410. 251,1974.
149. Polyachehok, O.G., and Komshilova, O.N., Russ. J. Phys. Chem.,45, 555, 1971.
150. Kuniya, Y., and Hosaka, M.", J. Crystal Growth, 28, 385, 1975.
151. Farrow,;R.F.C., J. Phys. 0., 7j 2436, 1974.
152. Foxon, C.T., Joyce, B.A., Farrow, R.F.C., and Griffiths, R.M.,J. Phys. 0., 7, 2422, 1974.
153. Pankratz, L.B., U.S. Bureau Mines Report of Investigation 6592,1965.
154. Bachman, K.J., and Buehler, E., J. Electrochem. Soc., 121, 835,1974.

246
155. Phillips, J.C., ahd Van Vecten, J.A., Phys. Rev., B2, 2147, 1970.
156. Sharifov, K.A., and Gahzhiev, S.N., Russ. J. Phys., Chem., 38,1122, 1964.
157. Ennolenko, E.N., and Sirota, N.N., Chemical Bonds in Semicon-ductors and Solids, N.N. Sirota, ed., Consultants Bureau, NewYork, 101, 1967.
158. Klemm, W., and Brautigan, M., Z..Anorg. Allgem. Chem., 163, 225,
1927.
159. Smith, F.J., and Barrow, R.F., Trans. Faraday Sac., 54, 826, 1958.
160. Ila]kova, A.S., and Pashinkin, A.S., Russ. J. Phys. Chem., 51,1414, 1977.a
161. Kelley, K.K., U.S. Bur. Mines, Bull., 584, 1961.
162. Glassner, A., Argonne Nat. Lab. Report ANL-5750, 1957.
163. Gunn, S.R., and Green, L.G., J. Phys,. Chem., 65, 779, 1961.
164. Davis, S.G., Anthrop, D.F., and Searcy, A.W., J. Chem. Phys.,34, 659, 1961.
165. Grieveson, P. and Alcock, C.B., Special Ceramics, P. Popper,.ed.,Heywood and Co., London, 183, 1960.
166. Hunt, L.P., and Sirti, E., J. Electrochem. Sac., 119, 1741, 1972.
167. Sirtl, E., Hunt, L.P., and Sawyer, O.H., J. Electrochem. Sac.,121, 920. 1974.
169. Schafer, H., Bruderreck, H., and Marcher, B., Z. Anorg. Allq.
Chem., 352, 122. 1967.
170. Teichmann, R., and Wolf, E., Z. Anorg. Al1g. Chem., 347, 145, 1966.
172. Antipin, P.F., and Sergeev, V.V., Russ. J. Appi. Chem., 27, 737,* 1954.
173. Ishino, T., Matsumoto, A., and Yamagishi, S., Kogyo Kagaku Zasshi,68, 262, 1965.
171. Schafer, H., and Nicki, J.. :Z. Anorg. Allg. Chem., 274, 250, 1953.
168. Farber, M., and Srivastava, R.D., J. Chem. Sac., Faraday Trans. 1,73, 1672, 1977.
174. Rusin, A.D., and Yakaviev, O.P., J..Moscow Univ., Ser. 2, Chem.,13, 70, 1972.
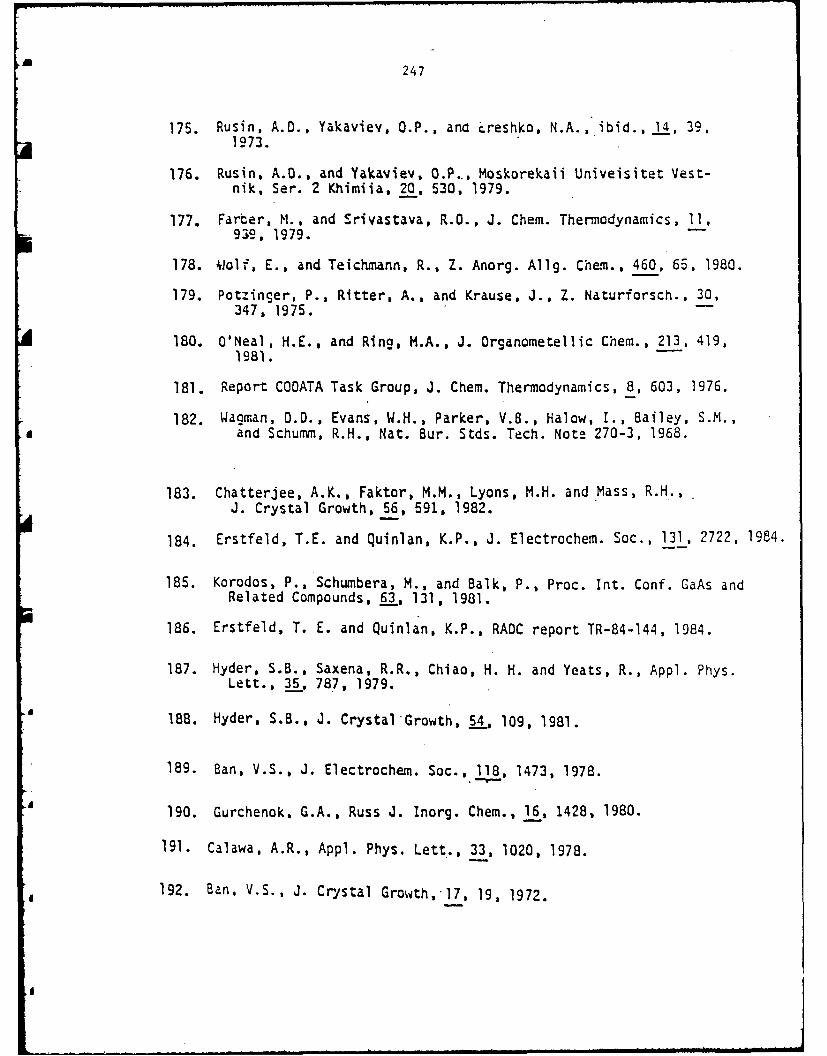
,A 247
175. Rusin, A.D., Yakaviev, O.P., and 'reshko, N.A., ibid., I4, 39,1973.
176. Rusin, A.D., and Yakaviev, O.P., Moskorekaii Univeisitet Vest-nik, Ser. 2 Khimiia, 20, 530, 1979.
177. Farber, M., and Scrivastava, R.O., J. Chem. Thermodynamics, 11,939, 1979.
178. iolf, E., and Teichmann, R., Z. Anorg. Allg. Chem., 460, 65, 1980.
179. Potzinger, P., Ritter, A., and Krause, J., Z. Naturforsch., 30,347, 1975. w
180. O'Neal, H.E., and Rina, M.A., J. Organometellic Chem., 213, 419,1981.
181. Report COATA Task Group, J. Chem. Thermodynamics, 8, 603, 1976.
182. Wagman, 0.D., Evans, W.H., Parker, V.8., Halow, r., Bailey, S.M.,and Schumm, R.H., Nat. Bur. Stds. Tech. Note 270-3, 1968.
183. Chatterjee, A.K., Faktor, M.M., Lyons, M.H. and Mass, R.H.,
J. Crystal Growth, 56, 591, 1982.
184. Erstfeld, T.E. and Quinlan, K.P., J. Electrochem. Soc., 131, 2722, 1984.
185. Korodos, P., Schumbera, M., and Balk, P., Proc. Int. Conf. GaAs andRelated Compounds, 63, 131, 1981.
186. Erstfeld, T. E. and Quinlan, K.P., RADC report TR-84-144, 1984.
187. Hyder, S.B., Saxena, R.R., Chiao, H. H. and Yeats, R., Appl. Phys.Lett., 35, 787, 1979.
188. Hyder, S.B., J. Crystal Growth, 54- 109, 1981.
189. Ban, V.S., J. Electrochem. Soc., 118, 1473, 1978.
190. Gurchenok, G.A., Russ J. Inorg. Chem., 16, 1428, 1980.
191. Calawa, A.R., Appl. Phys. Lett., 33, 1020, 1978.
192. Ban, V.S., J. Crystal Growth, 17, 19, 1972.
,I
-Am -- m ., -. l~

248
193. Mori, H., and Takagishi, S., Jap. J. Appl. Phys.23, L877, 1984.
194.. Dapkus, P.OD., Manasevit, H. M. and Hess, K.L., J. Cryst. Growth,55, 10, 1981.
195. Vehoff, E., Pletsheu, W., Balk, P., and Luth, H., J. Cryst.Growth, 55, 30, 1981.
196. Fraas, L. M., J. Appl. Phys., 52, 6939, 1981.
197. Friedel, P., Thesede 3 eme cycle, Orsay (France), 1982: Oemay, Y.,Thesedrbcteur ingenieur, Orsay (France), 1983; Friedel, P. andGourrier, S., Appl. Phys. Lett 7 509, 1983.
198. Chang, R. P. H., and Darack, S., Appl. Phys. Lett. 38, 898, 1981.
199. Friedel, P., Larsen, P.K., Gourrier, A., Cabanie, J. P., andGerits, W. M.., J. Vac. Sci. Technol. B2, 675, 1984.
200. Pretzer, D. D., and Hagstrum, H. D., Surface Sci. 4, 265, 1966.
201. Gregory, P.E. and Spicer, W.E., Surface Sci. 54, 229, 1976.
202. Gregory, P.E. and Spicer, W.E., Phys. Rev B12, 2370, 1975.
203. Luth, H., and Motz, R., Phys Rev. Lett. 46, 1652, 1981.
204. Dubois, L.H., and Schwartz, G. P. Phys. Rev. B26, 794, 1982.
205. Bartels, L. Surkamp, Chemens, H. J. and Mouch, W., J. Vac. Sci.Technol. 81, 756, 1983.
206. Monch, W., Thin Solid Films 104, 285, 1983.
a 207. Bachrach, R. Z., Bauer, R. S. Chiaradia, P., and Hansson, G. V.,J. Vac. Sci. Technol. 18, 797, 1981.
208. Orathen, P., Ranke, W., and Jacobi, K., Surface Sci. 77, 1162, 1978.
aA
I
a
u - ~ m mmmmu lmmm~dmmmmmmm m m m mmm mmm~m~mmm mmmmmwmmmmmmammlml mlm lmm m a - | • m

249
'209. Bringaus, R. D.. and Ba chrach. R. Z.. Physica 117B 1188, 854,1983.
210. Bringans, R.D., and-Bachrach, R.Z., Solid State Commun. 45, 83,1983.
211. Bringans, R.D. and. Bachrach, R.Z., J. Vac. Sci. Technol. Al, 676,1983.
212. Bachrach, R.Z. and Bringans, R-.D*., J. de Physique C, 145, 1982.
213. Hoflund, G.B., Cox,'D.F., Woodson, G.L., and Laitinen, H.A., ThinSolid Films 78,-357. 1981.
214. Traum, M.M., and !Woodruff, D.P., J. Va. Sci. Technol. 17, 1202,1980.
215. Gilbert, R.E., Cox, D.F.., and Hoflund, G.B., Ref. Sci. Instrurn.,a 53, 14, 1982.
216. Hoflund, G.B., SE.M Journal 00.,00, 1985..
217. Madey, T.E., and Yates, J1. T., Jr., J. Vac. Sci. Techno. 8,525, 1971.
218. Menzel, 0., Surface Sdi 47, 370,-1975.,
21.Menzel, D., in: Topics in Applied Physics, Vol 4, Ed. R. Gomer,Springer-Verla, Brln, 975, p.1 01.
220. Ageev, V.. N., and Ionov, N.I., in Progress in Surface Sci. 5,Part 1, Ed. S. G. Davison. Pergamon Press, New York, l947,pl.
221. Drinkwine, M. J., Shapiro, V., and Lichtman, 0., in Adv. ChemistrySeries. No. 158, Radiation Effects on Solid Surfaces, Ed. 0. Kamninsky,American Chemical Society, 1976, p. 171.
222. Drinkwine, M.J.. and Zichtman, D., in Progress in Surface Science 8.,Pergamon Press, New York, 1977, p.123.
223. Madey, T.E., and Yates, J. T., Surface Sci. 637 203, 1977.
224. Bauer, J. Elec. Spectrosc. Rel. Pheno. 15, 119, 1979.
225. Menzel, D. . J. Vac. Xci. Technol. 2,, 538, 1982.
226. Bnotek, M.L., Phys. Tdday, Sept.,24, 1984.
*227. Proceeding of the First International Workshop on Desorption Inducedby Electronic Transitions DIET 1, Eds. N. H. Tok, Trau., M.M.,Tully, J.C., and Mady, T.E., Springer-Verlaq, New York, 1983.
28 J ,.,

250
229. Madey, T.E., Surface Sci.. 36, 281, 1973.
230. Jelend, W., and Menzel, 0., Chgm. Phys. J.. tt. 21, 178, 1973.
231. Kir~g, D.A., and Menzel, D., Surface Sci. 40, 399. 1973.
232. Vasquez, R.P., Lewis, B.F., and Grunthauer, F.J., Appi. Phys.
Lett. 42, 293, 1983.

=1I ANMISSION
A !Of
Rome Air Development Center
_ RADC plans and executes research, development, test and selectedacquisition programs in support of Command, Control, Communicationsand Intelligence (d) activities. Technical and engineering support withinareas of competence is provided to ESD Program Offices (POs) and otherESD elements to perform effective acquisition of &I systems. The areasof technical competence include communications, command and control,battle management, information processing, surveillance sensors,
.* intelligence data collection and handling, solid state sciences,electromagnetics, and propagation, and electronic, maintainabili, andcompatibility.