a comparative study of erosion wear rate of conventional
TRANSCRIPT

A comparative study of erosion wear rate of conventionaland nonconventional thermal barrier coatings on IN800 superalloys
DIPAK KUMAR1,* and K NPANDEY2
1Mechanical Engineering Department, Raj Kumar Goel Institute of Technology (RKGIT), Ghaziabad 201 003,
India2Mechanical Engineering Department, Motilal Nehru National Institute of Technology (MNNIT), Allahabad,,
Prayagraj 211 004, India
e-mail: [email protected]
MS received 18 December 2020; revised 20 April 2021; accepted 27 May 2021
Abstract. Air plasma sprayed (APS) 7weight percent yttria stabilized zirconia (7YSZ) typical thermal barrier
coatings are commonly used in aero engine components to protect against thermal fatigue, corrosion, erosion,
corrosion-erosion and oxidation phenomenon. In spite of extensive industrial application of 7YSZ coatings, very
few works are there on erosion wear performance and its mechanisms on these coatings. In the present work,
comparative inspection of the erosion wear behaviors of air plasma sprayed 7YSZ thermal barrier coatings and
dip-coated sol-gel processed 7YSZ thermal barrier coatings are carried out. For the sake of comparison erosion
of uncoated Inconel 800 superalloys substrate was also studied. Erosion tests were conducted on air jet erosion
conditions with alumina erodent materials and process parameters determined as per Taguchi design of
experiments at room and high temperature of 850�C. Erosion wear resistance of non-conventional dip-coating of
sol-gel derived 7YSZTBC was found better in comparison to conventional APS YSZ coatings.
Keywords. Erosion; air plasma spray; thermal barrier coatings; Taguchi methods; Inconel800.
1. Introduction
With the increasing demand of gas turbine proficiency and
CO2 discharge reduction it is required to grow the turbine
inlet temperature (TIT). To fulfill this requirement thermal
barrier coatings (TBCs) are typically used on components,
used in hot zone environments, to make them more heat
resistant superalloys. The TBC deposited superalloys are
used in the gas turbine components along the hot path with
suitable cooling arrangements. The thermal barrier coatings
get degraded by impact of particles produced by the engine
itself restricting the life of the TBCs [1]. Effect of erosion
in high temperature ambiance to the metallic parts of the
blades and vanes is more severely observed against
expectation [2–5]. As it is very renowned that ceramic
materials possess refractoriness and hardness, so air plasma
spraying (APS) technique for the deposition of it is pre-
ferred, unlike to Electron Beam-Physical Vapor Deposition
(EB-PVD) [6–10], for various areas, such as in coal and
biomass-fired boiler tubes [11, 12], turbine blades and
vanes run in a sandy atmosphere [13, 14] and have good
particle erosion resistance [15–18]. The erosion of the
ceramic coating is affected whether how much coating
resists and what is environment surrounding coating, such
as, impact such as size of erodent, impact particle velocity,
impact angle, erodent flow rate, properties of erodent and
the bulk material [19].
Study of erosion behavior of TBCs was subject matter of
interact among the researchers but most of the works are
related to study of erosion behavior of conventional TBCs
[13, 20–25, 28]. Nicholls et al [20] worked on the com-
parative study of two different techniques, APS and EB-
PVD, for erosion behavior of 8YSZ/Ni based superalloy
TBC system. The erosion studies were done using alumina
(particle size 80–120 nm) as erodent particle at room
temperature (20�C) and high temperature of 910�C with
two different impact velocities of 140 m/s and 230 m/s.
Under the test conditions, both at room temperature and
high temperature, erosion resistance of EB-PVD 8YSZ
TBCs was found more than the APS 8YSZ TBCs. It was
also found that erosion occurred with the removal of
material due to generation of cracks near the surface for the
case of EB-PVD TBCs whereas the removal of material for
APS TBCs occurred alongside poorly bonded splat
boundaries. A linear relationship in between erosion rate
and impact velocity was found for both coating techniques
at both room temperature and high temperature with com-
mon phenomenon, i.e., peak erosion rate under normal
impact condition for both techniques. With a view to study,
severity of erosion rate was obtained at high temperature. In*For correspondence
Sådhanå (2021) 46:133 � Indian Academy of Sciences
https://doi.org/10.1007/s12046-021-01653-w Sadhana(0123456789().,-volV)FT3](0123456789().,-volV)

addition to this, considerable effect of porosity and pre
heat-treatment on erosion rate was reported on by Janos
et al [13] in their study on APS 7YSZ TBC at elevated
temperature of 1093�C and preheated at 1482�C. Heat-
treated substrate was having low erosion rate. Pi-Chuen
et al [21] studied on the effects of CO2 pulsed laser treat-
ment on APS deposited TBCs microstructure before and
after erosion as a comparison under the conditions of nor-
mal temperature, 50 lm SiO2 as erodent particles, and
impact velocity of 50 m/s. The micro-hardness of laser
treated samples increased from 550 HV to 1550 HV. They
found one common phenomenon as a linear alteration of
erosion rate with the impact angle for both the condition,
before and after laser treatment, of plasma sprayed TBCs. It
was also found that erosion resistance of APS TBCs
increased by 1.5–3 times after laser treatment with impact
angle between 30� and 75�, while no more improvement in
erosion resistance was found when the impact angle
reached 90� [21]. Cernushi et al [22] studied on erosion
rates for various coating microstructures features obtained
by one standard porous APS, two segmented APS, one EB-
PVD and plasma sprayed PVD YSZ coatings with an
assumption of EB-PVD and standard porous APS YSZ
coating as reference. Tests were conducted at temperature
700�C, impact angle of 30� and 90�, impact velocity of 40
± 5 m/s and 2 g/min of erodent flow rate. Micro-quartz
SiO2 powder was used as erodent particle considering
quartz as one of the core erosive constituents in sand and fly
volcanic ashes. Comparatively, PS-PVD and highly seg-
mented TBCs were observed more or less similar erosion
rates than EB-PVD TBCs [22]. Chang-Jiu Li et al [23]
studied on erosion mechanism of plasma-based alumina
ceramic coatings deposited on mild steel with alumina
powder of average grain size 330 lm under constant impact
velocity, 63 m/s and impact angle, 90� and found layer-by-
layer spallation as a failure mode of erosion mode of
plasma-sprayed alumina coatings. Chwa and Ohmori [24]
studied erosion behavior of heat treated 8YSZ APS TBCs at
room temperature with constant velocity of 60 m/s and
impact angle of 60� using 330 lm size of alumina powder
as erodent. Erosion resistance of post-treated TBC with
dense coatings was found to be more at early stage of
erosion but gradually decreased due to continuous
impacting [24]. Ramachandran et al [25] worked on the
comparative erosion wear behavior of with coatings, APS
Yttria Stabilized Zirconia (YSZ) coatings and Lanthanum
Zirconate (LZ) coatings, and without coating, metallic
Inconel 738 base material (BM); however, no bond coat
was applied for coatings. It was commonly observed
excellent wear resistance at low porosity volume (4%) for
both YSZ and LZ coatings and was decreased if volume of
porosity is above 4%, indicating porosity as the leading
affecting reason for the erosion wear. Response surface
methodology was applied to find erosion constraints cor-
responding to loss of eroded particle. However, excellent
erosion wear resistance was found for without coatings,
metallic substrate, if they are tested to normal angle against
impact conditions.
Some authors have reported sol-gel derived TBC as a
state-of-the-art technique for the safety purposes of metallic
substrate against high temperature gradient [26, 27]. Pro-
posed Sol-gel that has been used for coating over to
metallic substrate for anti-corrosive is established on
hydrolysis and condensation reaction of metal alkoxide via
metal-oxaen chain [28, 29]. In spite of an effective method
of coating, there are only few works reported related on
solid particle erosive wear to sol-gel coating whether it can
act as a traditional TBCs or not. Viazzi et al did a good
effort on sol-gel technique for utilizing as top-coat on
Hastelloy-X substrate in the area of erosion [30]. With a
larger erosion of sol-gel based coatings, due to limited
thickness of only 25 lm thickness of top-coat, if it com-
pares with conventional coating techniques, [30] coating
thickness was found to be felt to increase for improvement
of erosion wear resistance.
In the present paper comparative investigation of solid
particle erosion behavior of a conventional 7YSZ APS
TBCs with the sol-gel derived dip-coated TBC and
uncoated superalloys Inconel 800 (IN800) is presented.
Taguchi [31] based design of experiment was used to find
optimal test settings, e.g., impact velocity of erodent par-
ticles, impact angle of erodent particle relative to the coated
surface, air jet erodent flow rate and temperature.
2. Experimental methods
2.1 Base material and conventional coating (CC)of top-coat
The substrate selected was Ni-based superalloys Inconel
800 in square shape with a dimension of 25 mm 9 25
mm 9 3 mm. Grit blasted was carried out on substrate with
a 24-micron mesh size of brown fused alumina particles
under the pressure of 2.53 bars and 200 mm distance to
eliminate surface impurities, and to obtain various physico-
mechanical properties in-between the coating and the
metallic substrate [32]. A bond-coat of CoNiCrAlY was
deposited on the substrate by APS of 150 ± 30 lm thick-
ness. A top coat of 7YSZ was sprayed onto the as-sprayed
APS bond coat using top-coat process parameters applied
by Taguchi-Grey Relation Analysis (GRA) [31]. The APS
coatings techniques were performed at M/s Sai Surface
Coatings and Technology, Patencheru, Hyderabad, India.
The chemical composition of substrate materials, Inconel
800 is referred in table 1. The bond coat material CoN-
iCrAlY powder was having chemical composition as per
AMDRY 9951, make M/s Oerlikon Metco. The nominal
particle size distribution range was—38 ? 5.5 lm. The
top-coat was made from 7 weight % yttria-stabilized zir-
conia (7YSZ) commercial powder (Chemical composition
as AMPERIT No. 827-054, yellow color, make H.C. Stark,
133 Page 2 of 17 Sådhanå (2021) 46:133

Germany) with nominal particle size distribution range
having—45 ? 10 lm. The bond-coat (BC) parameters for
coatings are shown in table 2 and Taguchi-Grey Relation
Analysis (GRA) based optimal parameters for top-coat
(TC) are shown in table 3 [31].
2.2 Non-conventional dip-coating of sol-gelprocessed top-coat
For the case of non-conventional coating, CoNiCrAlY
metallic powder, which was used for bond coat by APS
with process parameters as given in table 2 and sol-gel
processed 7YSZ was used for top-coat applied by dip
coating method. Here, two precursors, zirconium (IV)
propoxide (Zr(OPr)4) (Aldrich), and yttrium (III) nitrates
hexahydrate (Y(NO3)3.6H2O) (Alfa Aesar), were taken
while 1-propanol was used as a solvent. For avoiding
untoward chemical complexity, acetylacetone (AcAc) and
concentrated suphuric acid were taken as chelating mate-
rials. Zirconium (IV)propoxide-1-propanol complex ((C3-
H7O)4Zr–C3H7OH) was made at [Zr] = 0.4M. Accordingly,
to get 7 weight% of Yttrium, solution was made by mixing
0.91 gram of Y(NO3)3.6H2O is mixed into zirconium
solution for several hours. Thereafter, 2 weight% Polyvinyl
alcohol (PVA) was added with obtained 7YSZ composite
sol to make them more viscous. The resulting sols were
deposited on IN800 by dip-coating method at a controlled
dipping and withdrawal speed of 250 mm/min [26]. With a
25- minutes dipping and 15-min heating time at 60�C,coating processes were cyclically done till obtained desired
thickness of top-coat [33, 34].
2.3 Erosion test samples preparation
2.3a Preparation of samples of uncoated superalloysInconel 800 (IN800) substrate: Uncoated Inconel 800 were
grounded using SiC abrasive papers from 220 to 2000.
Then, surface finishing was performed and obtained a
glassy mirror image, surface roughness Ra 0.023–0.029
lm. Finally, superfinished samples, refers to figure 1, were
washed, dried and weighed using an electronic balance,
Make: CONTECH, 224D on a resolution of 0.01 mg.
2.3b Samples of conventional air plasma sprayed 7YSZTBC on IN800 (APSTBC): Grinding was done on Top-coat
of APS 7YSZTBCs with SiC paper from 600 to 2000.
Afterward it was undergone to surface finish, surface
roughness Ra 0.023–0.029 lm. Finally, finished samples, as
in figure 2 were washed, dried and weighed on same res-
olution electronic balance, Make: CONTECH, 224D.
2.3c Samples of unconventional sol-gel synthesized 7YSZTBC on IN800 (SGTBC): Sol-gel coated TBC samples were
fired at 550�C for several hours to improve the mechanical
interlocking of coating and, observed roughness was of 3–4
lm Ra. Furthermore, these ones were polished by superfine
emery paper No. 2400 and, it was obtained the roughness of
around 1–2 lm Ra. Lastly, weighing were done using an
electronic balance, make: CONTECH, 224D, on resolution
0.01mg, finished samples are given in figure 3a.
XRD of SGTBC is validated with APS TBCs which
would help substantiate the purity of as-developed coating
and their corresponding value was considered as crystal
structure, i.e., tetragonal, shown in figure 3b. Thickness of
the as deposited layer of thermal barrier coating for Sol-gel
TBC and APS TBC is shown in optical micrograph as
figures 3c and 3d respectively.
2.4 Taguchi design of experiments
Since actual plan of orthogonal arrays (OAs) is the basic
theme for evaluation the design of experiments (DOEs) and
experiments are to be performed accordingly. Further, it is
evaluated through signal-to noise ratio (SNR) [31, 35]. In
the current examination, erosion wear rate of the TBC
derived by conventional APS process and dip coating
process of 7YSZ sol-gel is considered as the quality char-
acteristic. For this quality characteristic, smaller-the-better
Table 1. Chemical composition (wt. %) of superni IN800 substrate.
C Si Mn S P Cr Mo Co Ni
0.078 0.390 0.641 0.012 0.021 19.966 0.086 0.036 Balance
Table 2. Air plasma spraying process parameters for bond-coat of CoNiCrAlY.
Current
(A)
Voltage
(V)
Primary gas (Ar) (l/
min)
Secondary gas (H2) (l/
min)
Powder feed rate (g/
min)
Spray distance
(mm)
Power
(kW)
550 67 43 9.5 20 102 30
Sådhanå (2021) 46:133 Page 3 of 17 133

is selected as smaller values of erosion wear rate is desired.
Before making the OAs, here, four control factors as an
experimental parameter were taken. Each one control fac-
tor, i.e., experimental parameters, consists of four level.
The selected constraints were Temperature, Impact angle,
Impact velocity and Erodent flow rate, see in table 3. Based
on those factors and levels, L16 orthogonal array is opted
for conducting experiments. The SNR for each level of
erosion wear tests was computed by equation (1) that is
valid for smaller-the-better type of quality characteristics.
The optimal levels of the erosive testing conditions are the
levels with the highest SNR.
Table 3. Optimized Air plasma spraying process parameters for 7YSZ top-coat.
Current
(A)
Voltage
(V)
Primary gas, Ar (l/
min)
Secondary gas H2 (l/
min)
Powder feed rate (g/
min)
Spray distance
(mm)
Travel speed
(mm/s)
550 75 60 6 30 100 30
Figure 1. Superni 800 samples mirror finished samples for
erosiontest.
Figure 2. Air plasma sprayed bond-coated samples.
Figure 3. (a) Dip coated Sol-gel 7YSZ (SGTBC), (b) XRD
graph of SGTC and APSTBC, (c) Cross sectional Image of SG
TBCs, and (d) Cross-sectional Image of APSTBCs.
133 Page 4 of 17 Sådhanå (2021) 46:133

S/R ¼ �10 log 1/nð Þ R y2i� �� � ð1Þ
where n is the number of test runs; yi is the observed data.
Further, statistical analysis of variance (ANOVA) was
executed to check the significance of the erosion wear test
conditions. The optimum testing conditions obtained from
this analysis for IN800, APSTBC and SGTBC were con-
firmed by confirmation tests also.
The control factors for erosion wear test and their levels
for substrate IN800, conventional coating (CC) and non-
conventional coating (NC) of substrate IN800 is given in
table 3. Different levels of control factors for different
experimental runs as per L16 orthogonal arrays (OAs) are
summarized in table 4. Examination of effect of individu-
ally solid particle erosion parameters was examined by
Statistical tool box MINITAB 16.0. The erosion wear rate
corresponding to each test run for uncoated IN800 sub-
strate, SGTBC and APS TBC are also given in table 4.
2.5 Erosion wear test
For current erosion testing, Air Jet Erosion Testing
Machine, Make: DUCOM; India, Model: TR 471-900, as
per ASTM standard G76-07. As erodent particle, Alumina
powder having 50 lm mesh size were taken from M/s
Ducom, India. In Air Jet Erosion, erodent particles are
mixed and consequently moved with air stream coming out
from the air compressor and then it is entered into alumina
nozzle. Due to this mechanism, erodent particles are getting
accelerated and is impacted over the substrate’s surface,
which is held inclined to sample holder, after coming out
from the nozzle. The impact velocity was determined by the
double-disc technique as per ASTM standard G211-14 [36].
Erosion testing parameters for coated and uncoated samples
as erodent flow rates, impact particle velocities, tempera-
tures and impact angles are given in tables 3 and 4. Coated
samples were tested for erosion till penetration of coating
by erodent and re-weighted. The above procedure was
repeated thrice (table 4) and their average values were
selected. Solid particle eroded uncoated IN800 substrates,
APS coated substrates (APSTBC) and dip-coated substrates
(SGTBC) are shown in figures 4a, 4b and 4c, respectively.
3. Result and discussion
3.1 Effects and interactions of experimentalparameters (control factors)
Solid particle erosion tests were performed to obtain the
erosion rates shown in table 4. Erosion rate under different
test conditions for uncoated (IN800) samples and two types
of coated samples (APSTBC and SGTBC) are given in
table 4. Effect of variation of experimental parameters on
erosion rate for uncoated IN800 is presented in figures 5(a–
c) and for coated samples is given in figures 6(a–c). Fig-
ure 5a shows the effect of variation of temperature at dif-
ferent values of other experimental parameters as per
table 4. At room temperature (25�C) and 300�C, erosionwear rate is minimum for test run conditions of 1, 2, 3 and
4. With the increase in temperature and other parameters as
per table 4, erosion rate increases. At maximum tempera-
ture of 850�C, erosion rate is maximized for test run 13 or
14. Therefore, erosion rate of uncoated IN800 is maximized
when temperature and flow velocity are maximum i.e.,
850�C and 100 m/s respectively. Under this condition the
impact angle is either 30� or 45� and flow rate is either 3
g/min or 2 g/min. Figure 5a is drawn by considering tem-
perature or impact angles and other parameters were as per
table 4. Similarly, figures 5b and 5c are drawn by consid-
ering temperature and flow velocity, and temperature and
flow rates only.
The erosion wear behavior of both APS coated and dip
coated sol-gel 7YSZ samples are presented in figures 6(a–
c). For both APS coated and dip coated sol-gel samples,
erosion rate is small for experimental conditions 1, 2, 3 and
4 (table 4). The erosion rate is almost same under these
experimental conditions. Under test condition 16, erosion
wear is maximized for both APSTBC and SGTBC but
under this test condition erosion rate of APSTBC is more in
comparison to SGTBC. At this condition, temperature was
found to be maximum (850�C), Impact angle was 90�,impact velocity was 40 m/s and flow rate were 4 g/min. At
high temperature (850�C) erosion rate was found to be
minimum for test condition 13 with impact angle 30�,impact velocity of 100 m/s and flow rate of 3 g/min. Under
this condition also erosion wear rate of APSTBC was more
in comparison to SGTBC. This shows the superior erosion
resistance of dip coated sol-gel of 7YSZ (SGTBC) at high
temperature.
3.2 Analysis of control factors
Figures 5 and 6 are plotted by fixing one of the parameters
and varying others as per L16 OA and interpretation of
results are not very clear. There are interactions of
parameters also. For better understanding the effects of
parameters (i.e., control factors) on erosion rate of uncoated
IN800 superalloys and coated IN800 superalloys (both
Table 4. Control factors and their levels for erosion.
Control factors Control factors code
Levels
1 2 3 4
Temperature (�C) A 25 300 575 850
Impact angle (�) B 30 45 60 90
Impact velocity (m/sec) C 40 60 80 100
Erodent flow rate (g/min) D 2 3 4 5
Sådhanå (2021) 46:133 Page 5 of 17 133

Figure 4. (a) Uncoated superni800 (IN800) after erosion tests. (b) APSTBC samples after erosion tests, and (c) SGTBC samples after
erosion tests.
133 Page 6 of 17 Sådhanå (2021) 46:133

APSTBC and SGTBC), optimization analysis of control
factors is carried out by using Taguchi Design of experi-
ments. The smaller-the-better types of signal-to-noise ratios
(SNR) were calculated by equation (1) for each test run
(table 4) and for uncoated IN800, APSTBC and SGTBC.
The SNR for all cases is also presented in table 4. The
average SNR under different levels of control factors were
also obtained. For example, for first level of temperature A1
(25�C), the average SNR was obtained by averaging SNR
of test runs 1, 2, 3 and 4 which are for temperature 25�C.Similarly, for first level of impact angle B1 (30�) averageSNR is average of SNR for test runs 1, 5, 9 and 13 which
are impact angle of 30�. Average SNR for different levels
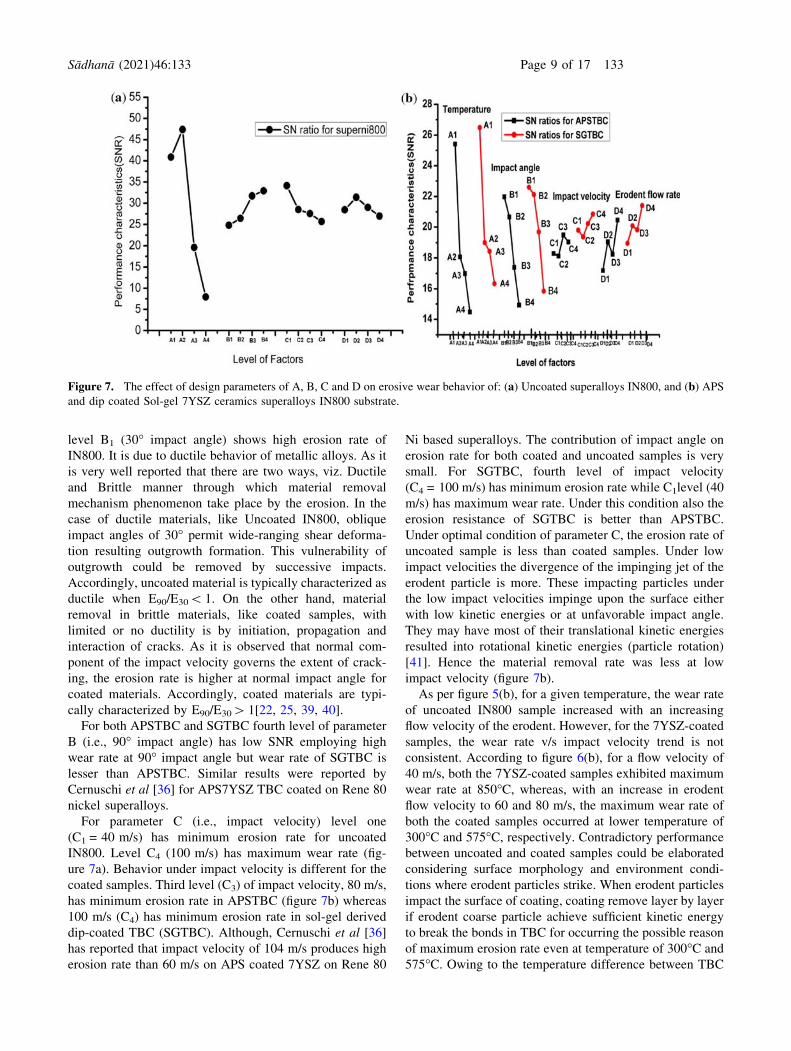
of control factors is plotted in figures 7(a, b) for both
uncoated and coated samples. The highest performance
characteristic is for temperature for both coated and
uncoated samples indicating that temperature is the domi-
nant parameter in all other factors. For uncoated IN800, the
optimal parameters are A2-B4-C1-D2. For APSTBC, it is
A1-B1-C3-D4 and for SGTBC optimal parameters are A1-
B1-C4-D4 (figure 7b). A1 is room temperature testing con-
dition but erosion rate of uncoated IN800 is minimum for
A2 which is 300�C temperature, resulting into the layer
formation of NiFe2O4 spinel and Cr2O3 through oxygen
Figure 5.. Effect of variation of experimental parameters on erosion rate in uncoated IN800 substrate for: (a) Impact angle, (b) Impact
velocity, and (c) Erodent flow rate.
Sådhanå (2021) 46:133 Page 7 of 17 133

activity particularly in the temperature range of 300–500�Cfor the case of superalloys [37]. With the increase in tem-
perature 500�C onwards, isothermal stresses are induced
during the growth of oxide layers [38] which can lead to
affect the material strength. Therefore, performance char-
acteristic of IN800 metallic substrates is low at levels A3
and A4 (figure 7a). In the case of coating (figure 7b),
comparatively better performance characteristics are
observed at higher temperature of 850�C as compared to
metallic substrate. Erosion rates for both conventional and
non-conventional TBC at high temperature were found
higher at high temperature as compared to room tempera-
ture. Similar results were obtained by Cernuschi et al [36].Fourth level of impact angle (B4) i.e., 90� is the best
performance characteristics for parameter B (i.e., impact
angle) for erosion rate of uncoated superalloys and first
level B1 i.e., 30� impact angle is most influential factor for
coated superalloy substrates. Low value of parameter B at
Figure 6. Effect of variation of experimental parameters on erosion rate in APS and sol-gel coated IN800 substrate for: (a) Impact
angle, (b) Impact velocity, and (c) Erodent flow rate.
133 Page 8 of 17 Sådhanå (2021) 46:133
level B1 (30� impact angle) shows high erosion rate of
IN800. It is due to ductile behavior of metallic alloys. As it
is very well reported that there are two ways, viz. Ductile
and Brittle manner through which material removal
mechanism phenomenon take place by the erosion. In the
case of ductile materials, like Uncoated IN800, oblique
impact angles of 30� permit wide-ranging shear deforma-
tion resulting outgrowth formation. This vulnerability of
outgrowth could be removed by successive impacts.
Accordingly, uncoated material is typically characterized as
ductile when E90/E30\ 1. On the other hand, material
removal in brittle materials, like coated samples, with
limited or no ductility is by initiation, propagation and
interaction of cracks. As it is observed that normal com-
ponent of the impact velocity governs the extent of crack-
ing, the erosion rate is higher at normal impact angle for
coated materials. Accordingly, coated materials are typi-
cally characterized by E90/E30[ 1[22, 25, 39, 40].
For both APSTBC and SGTBC fourth level of parameter
B (i.e., 90� impact angle) has low SNR employing high
wear rate at 90� impact angle but wear rate of SGTBC is
lesser than APSTBC. Similar results were reported by
Cernuschi et al [36] for APS7YSZ TBC coated on Rene 80
nickel superalloys.
For parameter C (i.e., impact velocity) level one
(C1 = 40 m/s) has minimum erosion rate for uncoated
IN800. Level C4 (100 m/s) has maximum wear rate (fig-
ure 7a). Behavior under impact velocity is different for the
coated samples. Third level (C3) of impact velocity, 80 m/s,
has minimum erosion rate in APSTBC (figure 7b) whereas
100 m/s (C4) has minimum erosion rate in sol-gel derived
dip-coated TBC (SGTBC). Although, Cernuschi et al [36]has reported that impact velocity of 104 m/s produces high
erosion rate than 60 m/s on APS coated 7YSZ on Rene 80
Ni based superalloys. The contribution of impact angle on
erosion rate for both coated and uncoated samples is very
small. For SGTBC, fourth level of impact velocity
(C4 = 100 m/s) has minimum erosion rate while C1level (40
m/s) has maximum wear rate. Under this condition also the
erosion resistance of SGTBC is better than APSTBC.
Under optimal condition of parameter C, the erosion rate of
uncoated sample is less than coated samples. Under low
impact velocities the divergence of the impinging jet of the
erodent particle is more. These impacting particles under
the low impact velocities impinge upon the surface either
with low kinetic energies or at unfavorable impact angle.
They may have most of their translational kinetic energies
resulted into rotational kinetic energies (particle rotation)
[41]. Hence the material removal rate was less at low
impact velocity (figure 7b).
As per figure 5(b), for a given temperature, the wear rate
of uncoated IN800 sample increased with an increasing
flow velocity of the erodent. However, for the 7YSZ-coated
samples, the wear rate v/s impact velocity trend is not
consistent. According to figure 6(b), for a flow velocity of
40 m/s, both the 7YSZ-coated samples exhibited maximum
wear rate at 850�C, whereas, with an increase in erodent
flow velocity to 60 and 80 m/s, the maximum wear rate of
both the coated samples occurred at lower temperature of
300�C and 575�C, respectively. Contradictory performance
between uncoated and coated samples could be elaborated
considering surface morphology and environment condi-
tions where erodent particles strike. When erodent particles
impact the surface of coating, coating remove layer by layer
if erodent coarse particle achieve sufficient kinetic energy
to break the bonds in TBC for occurring the possible reason
of maximum erosion rate even at temperature of 300�C and
575�C. Owing to the temperature difference between TBC
Figure 7. The effect of design parameters of A, B, C and D on erosive wear behavior of: (a) Uncoated superalloys IN800, and (b) APSand dip coated Sol-gel 7YSZ ceramics superalloys IN800 substrate.
Sådhanå (2021) 46:133 Page 9 of 17 133

and erodent powder at high temperature i.e., 850�C, hard-ness of target material usually decreases more than that of
the erosive powder resulting in higher erosive rate at high
temperature [13], even at lower erodent flow velocity of 40
m/s is sufficient to remove coating easily.
The performance characteristics (Average SNR) for
control factor D is maximum (therefore minimum erosion
rate) for level D2 (3 g/min) for uncoated IN800 superalloys.
For the case of coated samples, erosion rate is minimum
(i.e., performance characteristics is maximum) for levels D4
(5g/min) for both APSTBC and SGTBC. Among the two
coated samples, erosion rate of SGTBC is minimum.
Therefore, erosion wear rate is minimum at high erodent
flow rate for coated samples (figure 7b). The low erosion
rate in coated samples at high erodent flow rate is due to the
loss of some kinetic energy in collision of powder erodent
before impacting the coated sample as number of powder
particle increases at high flow rate [42]. This hypothesis
suggests that the energy will be not sufficient to deform and
fracture the coated material at high impact velocity as well
as high erodent flow rate and high temperature.
According to figure 6(c), the erosion rate of SGTBC
sample at 300�C was higher for an erodent flow rate of 3g/
m, as compared to that for 2g/m. Furthermore, at 850�C, themaximum erosion rate of both APSTBC as well as SGTBC
occurred at an erodent flow rate of 4 g/m. As per hypothesis
of shielding mechanism proposed by Andrews and Hors-
field [43], if the quantity of erodent particles in tube rises,
the additional particle-tube exchanges take place which
should result in a drop in particle velocity as some of their
kinetic energy loses in each collision with increase of
erodent flow rate before impacting the coated surface.
Unlike the proposed hypothesis, the current observations
realize higher erodent rate for flow rate of 3g/m in com-
parison to flow rate of 2g/m due to the effect of tempera-
ture. It could be possibly explained that as the temperature
increases translational kinetic energy have gathered a suf-
ficient time to strike the surface of coating in spite of flow
rate increases from 2 g/m to 3 g/m, as a resultant of
momentum effect on larger areas of target surface. There-
fore, at very high temperature of 850�C flow rate of 4 g/m
of solid particles causes an increase in translational kinetic
energy which is transmitted to the individual particle can
result in higher erosion rate.
So as to find the effect of each design parameters on
erosion wear rate on uncoated superalloys IN800 and
coated IN800 substrates, a systematic analysis of variance
(ANOVA) was carried out. It provided a contribution of
each control factors and the response under optimal con-
ditions. The results of ANOVA for the erosion rate mea-
surements of uncoated superalloys IN800 and coated 7YSZ
superalloys (both APSTBC and SGTBC) are shown in
table 5, using the statistical tool Minitab 16. Based on the
analysis of variance, most significant parameter is temper-
ature for IN800 and SGTBC (table 5) while it is significant
for APSTBC (table 5). Impact angle and Impact velocity
are significant parameters for IN800 while Impact angle is
only significant for SGTBC. For APSTBC, impact angle,
impact velocity and flow rate are all non-significant
parameters.
The delta factors for each control factors were derived
from the SNR values of uncoated super alloys IN800, SG
coated 7YSZ IN800 substrate (SGTBC), APS coated 7YSZ
IN800 substrate (APSTBC) and are shown in S/N response
tables 6, 7 and 8, respectively. The highest difference of
delta factor (Dfactor) for uncoated superalloys, APS and SG
coated 7YSZ is for temperature indicating temperature as
highest influencing parameter. Based on the contribution
ratio which is the ratio of delta factor and sum of delta
factors, temperature is the highest ranked control factors
followed by impact velocity, impact angle and flow rate for
IN800. For APSTBC and SGTBC, temperature in ranked
first, thereafter impact angle, flow rate and impact velocity
are ranked second, third and fourth respectively (tables 7
and 8). For coated superalloys substrates the order of
contributions is temperature as most contributing factor
followed by impact angle, erodent flow rate and impact
velocity. The parameter A (temperature) is again most
effective parameter for erosion wear rate with a contribu-
tion ratio of 48.79% and 48.36% for APSTBC and SGTBC
specimen, respectively. The factors B, D, C for SGTBC has
contribution of 32.38%, 11.76%, 7.07% respectively. For
APS TBC control factor B, D and C contributes to 31.10%,
14.48%, 6.05% respectively. The optimum level of control
factors for uncoated superalloys IN800 substrate and dip-
coated super alloys SGTBC and APS coated superalloys
APSTBC substrate are A21, B4
3, C12, D2
4; A11, B1
2, C44,
D43 and A1
1, B12, C3
4, D43 respectively as shown in
tables 9, 10 and 11. The superscripts 1, 2, 3 and 4 represent
the rank of contributions (as per tables 6, 7 and 8) and
subscripts represent level of each control factors as per
table 3. For example, the meaning of A21 is that the controls
factor A (temperature), its contribution is ranked first and
level is second (300�C).
3.3 Confirmation experiment
Through confirmation test, optimized control factors (ex-
perimental parameters) are validated. The confirmation test
was performed with the optimal set of control factors
A2B4C1D2, A1B1C4D4 and A1B1C3D4 to forecast the ero-
sion rate of uncoated superalloys IN800 substrate, SGTBC
and APSTBC substrates, respectively. The evaluated S/N
ratio for erosive wear rate in uncoated nickel-based
superalloys IN800 substrate, gIN800 can also be calculated
with the help of predictive equation (2) [44]
133 Page 10 of 17 Sådhanå (2021) 46:133

gIN800 ¼ �T þ ð �A2 � �TÞ þ ð �B4 � �TÞ þ ð �C1 � �TÞ þ ð �D2 � �TÞð2Þ
where �T is average of SNRs of L16 test run, �A2, �B4, �C1 and�D2 are average SNR for these level of control factors.
Therefore, �A2 = 47.393; �B4 = 32.900; �C1 = 34.123;�D2 = 31.388; �T = 28.959dB (table 6).
Similarly, the estimated SNR for erosion rate in
SGTBC,gSGTBC can be calculated by the predictive equation
(3) [44]
gSGTBC ¼ �T þ ð �A1 � �TÞ þ ð �B1 � �TÞ þ ð �C4 � �TÞ þ ð �D4
� �TÞð3Þ
Table 5. Experimental design matrix using L16 orthogonal array.
Test run
Levels Erosion rate (mg/g) Smaller-the-better S/N ratios (SNR)
A B C D IN800 SGTBC APSTBC IN800 SGTBC APSTBC
1 25 30 40 2 0.00937 0.04189 0.05145 40.565 27.557 25.7722 25 45 60 3 0.00836 0.04589 0.05244 41.556 26.766 25.607
3 25 60 80 4 0.00764 0.04789 0.05295 42.338 26.395 25.523
4 25 90 100 5 0.01122 0.05491 0.05767 39.000 25.206 24.781
5 300 30 60 4 0.00766 0.08499 0.08586 42.315 21.413 21.324
6 300 45 40 5 0.00394 0.07493 0.07523 48.090 22.506 22.472
7 300 60 100 2 0.00417 0.13790 0.19862 47.597 17.208 14.039
8 300 90 80 3 0.00264 0.17985 0.18942 51.568 14.902 14.451
9 575 30 80 5 0.21654 0.08554 0.08649 13.289 21.356 21.261
10 575 45 100 4 0.22113 0.08963 0.12833 13.107 20.951 17.833
11 575 60 40 3 0.03367 0.11715 0.14701 29.455 18.625 16.653
12 575 90 60 2 0.07369 0.22899 0.24510 22.652 12.804 12.213
13 850 30 100 3 0.71011 0.09959 0.10551 2.974 20.036 19.534
14 850 45 80 2 0.70942 0.12235 0.14566 2.982 18.248 16.733
15 850 60 60 5 0.42237 0.14899 0.21499 7.486 16.536 13.352
16 850 90 40 4 0.12050 0.29865 0.38466 18.380 10.496 8.298
Average 28.959 20.063 18.740
Table 6. Analysis of variance (ANOVA) for S/N ratios for Erosion wear rate of IN800 substrate.
Factors DOF Sum of square Variance F-ratios Percentage contribution P-values Importance
Temperature 3 4039.19 1346.40 415.10 91.25 0.000 Most significant
Impact angle 3 187.77 62.59 19.30 4.24 0.018 Significant
Impact velocity 3 158.77 52.92 16.32 3.59 0.023 Significant
Flow rate 3 40.55 13.52 4.17 0.92 0.136 Not significant
Error 3 9.73 3.24
Total 15 4436.01 454.89
Table 7. Analysis of variance (ANOVA) for S/N ratios for Erosion wear rate of IN800 SGTBC.
Factors DOF Sum of square Variance F-ratios Percentage contribution P-values Importance
Temperature 3 235.607 78.536 29.09 64.27 0.010 Most significant
Impact angle 3 113.925 37.975 14.07 31.09 0.028 Significant
Impact velocity 3 4.737 1.579 0.58 1.28 0.665 Not significant
Flow rate 3 12.328 4.109 1.52 3.36 0.369 Not significant
Error 3 8.099 2.700
Total 15 374.696 45.26
Sådhanå (2021) 46:133 Page 11 of 17 133

�A1 = 26.481; �B1 = 22.591; �C4 = 20.850; �D4 = 21.401;�T = 20.063 dB (table 7).
The estimated SNR for erosion rate in APSTBC,gAPSTBCcan be calculated by the predictive equation (4) [44]
gSGTBC ¼ �T þ ð �A1 � �TÞ þ ð �B1 � �TÞ þ ð �C3 � �TÞ þ ð �D4
� �TÞð4Þ
�A1 = 25.421; �B1 = 21.973; �C3 = 19.492; �D4 = 20.466;�T = 18.740 dB (table 8).
The new values of control factors (tables 9, 10, 11) for
uncoated superalloys IN800, A2, B4, C1, D2, was used to
predict erosion wear rate through prediction equation (2)
and the SNR value was found to be 58.927dB, while A1,
B1, C4, D4 and A1, B1, C3, D4 was used to predict erosion
wear rate in coated SGTBC and APSTBC superalloys
through prediction equations (3) and (4) respectively. The
SNR value was found to be 31.134dB and 31.132dB for
SGTBC and APSTBC, respectively. Confirmation experi-
ments were performed on the basis of optimal level of
experimental parameters as shown in table 12 for IN800,
APSTBC and SGTBC. Accordingly, contribution, in terms
Table 8. Analysis of variance (ANOVA) for S/N ratios for Erosion wear rate of IN800 APSTBC.
Factors DOF Sum of square Variance F-ratios Percentage contribution P-values Importance
Temperature 3 265.183 88.394 11.90 63.94 0.036 Most significant
Impact angle 3 121.728 40.576 5.46 29.34 0.098 Significant
Impact velocity 3 4.935 1.645 0.22 1.18 0.876 Not significant
Flow rate 3 22.937 7.646 1.03 5.53 0.491 Not significant
Error 3 22.284 7.428
Total 15 437.067 18.61
Table 9. Response table for average SNR for Erosion wear rate (EWR) of IN800.
Level
Control factors
Temperature Impact angle Impact velocity Flow rate
1 40.865 24.785 34.123 28.449
2 47.393 26.434 28.502 31.388
3 19.625 31.719 27.544 29.035
4 7.955 32.900 25.669 26.966
DFactor 39.438 8.115 8.454 4.422 (Dfactor)
total = 60.429
Contribution ratios (%) = DFactor/DTotal 65.26 13.43 13.98 7.26
Rank 1 3 2 4
Table 10. Response table for average SNR for erosion wear rate of IN800 SGTBC.
Level
Control factors
Temperature Impact angle Impact velocity Flow rate
1 26.481 22.591 19.796 18.954
2 19.007 22.117 19.379 20.082
3 18.434 19.691 20.225 19.814
4 16.329 15.852 20.850 21.401
DFactor 10.152 6.739 1.471 2.447 (Dfactor)
Total = 20.809
Contribution ratios (%)= DFactor/DTotal 48.79 32.38 7.07 11.76
Rank 1 2 4 3
133 Page 12 of 17 Sådhanå (2021) 46:133
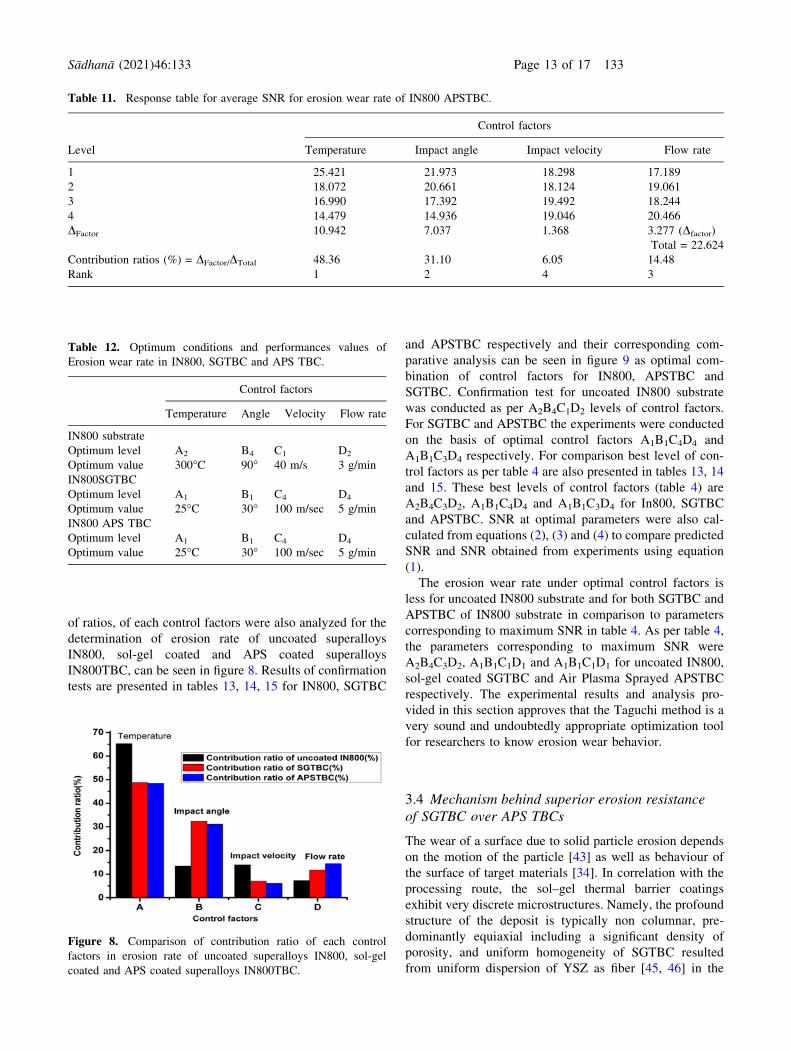
of ratios, of each control factors were also analyzed for the
determination of erosion rate of uncoated superalloys
IN800, sol-gel coated and APS coated superalloys
IN800TBC, can be seen in figure 8. Results of confirmation
tests are presented in tables 13, 14, 15 for IN800, SGTBC
and APSTBC respectively and their corresponding com-
parative analysis can be seen in figure 9 as optimal com-
bination of control factors for IN800, APSTBC and
SGTBC. Confirmation test for uncoated IN800 substrate
was conducted as per A2B4C1D2 levels of control factors.
For SGTBC and APSTBC the experiments were conducted
on the basis of optimal control factors A1B1C4D4 and
A1B1C3D4 respectively. For comparison best level of con-
trol factors as per table 4 are also presented in tables 13, 14
and 15. These best levels of control factors (table 4) are
A2B4C3D2, A1B1C4D4 and A1B1C3D4 for In800, SGTBC
and APSTBC. SNR at optimal parameters were also cal-
culated from equations (2), (3) and (4) to compare predicted
SNR and SNR obtained from experiments using equation
(1).
The erosion wear rate under optimal control factors is
less for uncoated IN800 substrate and for both SGTBC and
APSTBC of IN800 substrate in comparison to parameters
corresponding to maximum SNR in table 4. As per table 4,
the parameters corresponding to maximum SNR were
A2B4C3D2, A1B1C1D1 and A1B1C1D1 for uncoated IN800,
sol-gel coated SGTBC and Air Plasma Sprayed APSTBC
respectively. The experimental results and analysis pro-
vided in this section approves that the Taguchi method is a
very sound and undoubtedly appropriate optimization tool
for researchers to know erosion wear behavior.
3.4 Mechanism behind superior erosion resistanceof SGTBC over APS TBCs
The wear of a surface due to solid particle erosion depends
on the motion of the particle [43] as well as behaviour of
the surface of target materials [34]. In correlation with the
processing route, the sol–gel thermal barrier coatings
exhibit very discrete microstructures. Namely, the profound
structure of the deposit is typically non columnar, pre-
dominantly equiaxial including a significant density of
porosity, and uniform homogeneity of SGTBC resulted
from uniform dispersion of YSZ as fiber [45, 46] in the
Table 11. Response table for average SNR for erosion wear rate of IN800 APSTBC.
Level
Control factors
Temperature Impact angle Impact velocity Flow rate
1 25.421 21.973 18.298 17.189
2 18.072 20.661 18.124 19.061
3 16.990 17.392 19.492 18.244
4 14.479 14.936 19.046 20.466
DFactor 10.942 7.037 1.368 3.277 (Dfactor)
Total = 22.624
Contribution ratios (%) = DFactor/DTotal 48.36 31.10 6.05 14.48
Rank 1 2 4 3
Table 12. Optimum conditions and performances values of
Erosion wear rate in IN800, SGTBC and APS TBC.
Control factors
Temperature Angle Velocity Flow rate
IN800 substrate
Optimum level A2 B4 C1 D2
Optimum value 300�C 90� 40 m/s 3 g/min
IN800SGTBC
Optimum level A1 B1 C4 D4
Optimum value 25�C 30� 100 m/sec 5 g/min
IN800 APS TBC
Optimum level A1 B1 C4 D4
Optimum value 25�C 30� 100 m/sec 5 g/min
Figure 8. Comparison of contribution ratio of each control
factors in erosion rate of uncoated superalloys IN800, sol-gel
coated and APS coated superalloys IN800TBC.
Sådhanå (2021) 46:133 Page 13 of 17 133

coatings. Whereas, TBCs made-up by APS has lamellar
dense microstructure causing a weaker strain tolerance. It
seems that the composite sol-gel TBC allow finding better
resistance to erosion resulted from nanostructured bimodal
structure of SGTBC. With the sol-gel TBCs, development
of mechanical properties [47–49] was observed, due to
blocking or deviating of cracks as a mud of cracks, which
causing the higher fracture toughness [48] and the better
thermomechanical stress accommodability [48–51]. In
terms of kinetics and morphology, in-built initial crack
network (heat checking) on nanostructure was also benefi-
cial to the more mechanical strength of the barrier while
erosion taking place [26]. The densification and adherence
were found one of the reasons to give better erosion
resistance [52–56]. This correlation could be attributed with
this fact that higher fracture toughness permits more kinetic
energy from the erodent particles to be absorbed by the
coating before it fails, as previously realized by Lima et al[56] and Algenaid et al [57].
Table 13. Result of the confirmation experiments for erosion wear rate in IN800.
Parameters corresponding maximum SNR (Table 5)Optimum parameters
Level A2B4C3D2 A2B4C1D2 (calculated) A2B4C1D2 (experimental)
Erosion wear rate 0.00264 (mg/g) – 0.00239 (mg/g)
SNR(dB) 51.568 58.927 (From Eq.2) 52.430
Improvement of S–N ratio for erosive wear rate = 52.430 – 51.568 = 0.862 dB
Table 14. Results of the confirmation experiments for erosion wear rate in IN800 SGTBC.
Parameters corresponding maximum SNR (Table 5)Optimum parameters
Level A1B1C1D1 A1B1C4D4 (calculated) A1B1C4D4(experimental)
Erosion wear rate 0.04189 (mg/g) – 0.04125 (mg/g)
SNR(dB) 27.557 31.134 (From Eq. 3) 27.692
Improvement of S–N ratio for erosive wear rate = 27.692 - 27.557 = 0.135 dB
Table 15. Result of the confirmation experiments for erosion wear rate in IN800 APSTBC.
Parameters corresponding maximum
SNR (Table 5)Optimum parameters
Level A1B1C1D1
A1B1C3D4
(calculated)
A2B1C3D4
(experimental)
Erosion wear rate 0.05145 (mg/g) – 0.04659 (mg/g)
SNR (dB) 25.772 31.132 (from Eq.4) 26.634
Improvement of S–N ratio for erosive wear
rate = 26.634 - 25.772 = 0.862 dB
Figure 9 . Optimal combination of control factors for uncoated
IN800, Sol-gel coated and APS coated IN800 TBC.
133 Page 14 of 17 Sådhanå (2021) 46:133

4. Conclusions
The selected design parameters as control factors for the
prediction of coating performance to evaluate erosion rate
are temperature (�C), impact angle (�), impact velocity (m/
s) and erodent flow rate (g/min). Based on current exami-
nations, following conclusions of the work are presented:
• Temperature was observed as the dominant criterion
for erosion rate along with percentage contribution
ratio of 65.26%, 48.79% and 48.36% in uncoated
superalloys IN800 substrate, sol-gel derived dip-coated
IN800 (SGTBC) and APS-coated IN800 (APSTBC),
respectively. The optimum condition of experimental
design parameters for uncoated superalloys substrate,
dip-coated SGTBC and APS- coated APSTBC are
A2B4C1D2, A1B1C4D4 and A1B2C3D4, respectively.
• The analysis of variance ANOVA was done to study
the variance of each control factor of erosion rate and,
Temperature and Impact angle was observed as two
significant parameters.
• The SG dip-coaed7YSZ thermal barrier coatings
(SGTBC) really reveal a satisfactory erosion resistance
under the selected design parameters of erosive wear
rate against high temperature application. In compar-
ison to coated samples, higher performance character-
istics for uncoated substrate compared to coated
substrate was ultimate, under normal impact angle.
• Implementation of Taguchi’s Design of Experiment for
analyzing erosion wear characteristics was fruitful. For
extreme erosion environments, SGTBCs will be suit-
able substitute. The results error associated with the
experiments and calculated one for erosion rate are
within the confidential interval range as discussed in
confirmation tests.
References
[1] Steenbakker R J L, Wellman R G and Nicholls J R 2006
Erosion of gadolinia doped EB-PVD TBCs. Surf. Coat.Technol. 201: 2140–2146
[2] Eaton H E and Novak R C 1987 Particulate erosion of
plasma sprayed porous ceramic. Surf. Coat. Technol. 30:
41–50
[3] Tabakoff W 1992 High temperature erosion resistance of
coatings for use in gas turbine engines. Surf. Coat. Technol.52: 65–79
[4] Tabakoff W and Shanov V 1995 Erosion rate testing at high
temperature for turbomachinery use. Surf. Coat. Technol.76–77: 75–80
[5] Vaßen R, Jarligo M O, Steinke T, Mack D E and Stover D
2010 Overview on advanced thermal barrier coatings. Surf.Coat. Technol. 205: 938–942
[6] Sirohi S, Kumar P, Gupta A, Kumar S and Pandey C 2021
Role of Ni-based filler on Charpy impact toughness of the
P91 welds joints. Mat. Today Proceed. 44: 1043–1049
[7] Westergard R, Erickson L C, Axen N, Hawthorne H M and
Hogmark S 1998 The erosion and abrasion characteristics of
alumina coatings plasma sprayed under different spraying
conditions. Tribol. Int. 31: 271–279[8] Toma D, Brandl W and Marginean G 2001 Wear and
corrosion behaviour of thermally sprayed cermet coatings.
Surf. Coat. Technol. 138: 149–158[9] Fu Y Q, Batchelor A W, Wang Y and Khor K A 1998
Fretting wear behaviors of thermal sprayed hydroxyapatite
(HA) coating under unlubricated conditions. Wear 217:
132–139
[10] Liao H, Normand B and Coddet C 2000 Influence of coating
microstructure on the abrasive wear resistance of WC/Co
cermet coatings. Surf. Coat. Technol. 124: 235–242[11] Wang B Q 1995 Erosion-corrosion of coatings by biomass-
fired boiler fly ash. Wear 188: 40–48[12] Zhao H X, Yabuki A, Matsumura M, Takahashi T and
Yamamoto M 1999 Slurry erosion properties of ceramic
coatings. Wear 233–235: 608–614[13] Janos B Z, Lugscheider E and Remer P 1999 Effect of
thermal aging on the erosion resistance of air plasma sprayed
zirconia thermal barrier coating. Surf. Coat. Technol. 113:278–285
[14] Kumar D and Pandey K N 2020 Study on sol-gel synthesized
IN800 thermal barrier coatings (TBCs) subjected to thermal
cyclic loading: effect of Metallic Substrates. Met. Mater. Int.26: 1–13
[15] Slamecka K, Jech D, Klakurkova L, Tkachenko S, Remesova
M, Gejdos P and Celko L 2019 Thermal cycling behaviour of
plasma-sprayed thermal barrier coatings with pre-oxidized
NiCrAlY and NiCoCrAlY bond-coats. Procedia Str. Integ.23: 439–444
[16] Lathabai S, Ottmuller M and Fernandez I 1998 Solid particle
erosion behaviour of thermal sprayed ceramic, metallic and
polymer coatings. Wear 221: 93–108[17] Westergard R, Axen N, Wiklund U and Hogmark S 2000 An
evaluation of plasma sprayed ceramic coatings by erosion,
abrasion and bend testing. Wear 246: 12–19[18] Mcl H, Clark H M, Hawthorne H and Xie Y 1999 Wear rates
and specific energies of some ceramic, cermet and metallic
coatings determined in the coriolis erosion tester. Wear233–235: 319–327
[19] Engel P A 1976 Elsevier Scientific Publishing Company.
Elsevier, Amsterdam
[20] Nicholls J R, Deakin M J and Rickerby D S 1999 A
comparison between the erosion behavior of thermal spray
and electron beam physical vapour deposition thermal barrier
coatings. Wear 233–235: 352–361[21] Jiing-Herng Tsai, Pi-Chuen Lee and Chi-Lung Chang 2007
Improving the erosion resistance of plasma-sprayed zirconia
thermal barrier coatings by laser glazing. Surf. Coat.Technol. 202: 719–724
[22] Cernuschi F, Lorenzoni L, Capelli S, Guardamagna C,
Karger M, Vaben R, Niessen K V, Markocsan N, Menuey J
and Giolli C 2011 Soild particle erosion of thermal spray and
physical vapour deposition thermal barrier coatings. Wear271: 2909–2918
[23] Chang-Jiu L, Guan-Jun Y and Ohmori A 2006 Relationship
between particle erosion and lamellar microstructure for
plasma-sprayed alumina coatings. Wear 260: 1166–1172
Sådhanå (2021) 46:133 Page 15 of 17 133

[24] Ok Chwa S and Ohmori A 2002 Thermal diffusivity and
erosion resistance of ZrO2–8wt.%Y2O3 coatings prepared by
a laser hybrid spraying technique. Thin Solid Films 415:
160–166
[25] Ramachandran C S, Balasubramanian V and Ananthapad-
manabhan P V 2013 Erosion of atmospheric plasma sprayed
rare earth oxide coatings under air suspended corundum
particles. Ceram. Int. 39: 649–672[26] Sniezewski J, Lemaoult Y, Lours P, Pin L, Bekale V M,
Monceau D, Oquab D, Fenech J, Ansart F and Bonino J
P 2010 Sol-gel thermal barrier coatings: Optimization of the
manufacturing route and durability under cyclic oxidation.
Surf. Coat. Technol. 205: 1256–1261[27] Farhadi-Khouzani M, Fereshteh Z, Loghman-Estarki M R
and Razavi R S 2012 Different morphologies of ZnO
nanostructures via polymeric complex sol-gel method:
synthesis and characterization. J. Sol-gel Sci. Technol. 64:193–199
[28] Certhoux E, Ansart F, Turq V, Bonino J P, Sobrino J M,
Garcia J and Reby J 2013 New sol–gel formulations to
increase the barrier effect of a protective coating against the
corrosion of steels. Prog. Org. Coat. 76: 165–172[29] Tiwari S K, Tripathi M and Singh R R 2012 Electrochemical
behavior of zirconia based coatings on mild steel prepared by
sol–gel method. Corr. Sci. 63: 334–341[30] Viazzi C, Wellman R, Oquab D, Nicholls J, Monceau D,
Bonino J-P and Ansart F 2008 Erosion and high temperature
resistance of new coatings fabricated by a sol-gel route for a
TBC application. Mat. Sci. Forum. 595–598: 3–10[31] Kumar D and Pandey K N 2017 Optimization of the process
parameters in generic thermal barrier coatings using the
Taguchi method and grey relational analysis. Proc IMechEPart L JOM: Des. Appl. 231: 600–610
[32] Kumar D and Pandey and Das D K, 2018 Characterization of
air plasma based 7YSZ aluminum alloys thermal barrier
systems for hot zone. Proc IMechE Part L JOM: Des. Appl.232: 582–591
[33] Loghman-Estarki M R, Razavi R S, Edris H, Jamali H and
Ghasemi R 2014 Life time of new SYSZ thermal barrier
coatings produced by plasma spraying method under thermal
shock test and high temperature treatment. Ceram. Inter. 40:1405–1414
[34] Kumar D and Pandey K N 2020 Experimental investigations
of sol-gel process parameters for wear reduction on thermal
barrier coated AA2024 aluminum alloys with the use of
Taguchi-based optimization. Sadhana 45: 1–12
[35] Roy R K 2001 DOE using the Taguchi approach. Wiley
[36] Cernuschi F, Guardamagna C, Capelli S, Lorenzoni L, Mack
D E and Moscatelli A 2016 Solid particle erosion of standard
and advanced thermal barrier coatings. Wear 348–349:
43–51
[37] McIntyre N S, Zetaruk D G and Owen D 1978 XPS study of
the initial growth of oxide films on Incnel600 alloy. Appl.Surf. Sci. 2: 55–73
[38] Moulin G, Huntz A M and Rousselet J M 1989 Stresses
associated with Inconel 600 oxidation. Mat. Sci. Eng. A 120:
221–228
[39] Venkatesha L, Venkataraman B, Tak M, Sivakumar G,
Gundakaram R C, Joshi S V and Samajdar I 2019 Room
temperature and 600�C erosion behaviour of various
chromium carbide composite coatings. Wear 422–423:
44–53
[40] Venkatesh L, Pitchuka S, Sivakumar G, Gundakaram R C,
Joshi S V and Samajdar I 2017 Microstructural response of
various chromium carbide-based coatings to erosion and
nano impact testing. Wear 386–387: 72–79[41] Doyle R A and Ball A 1991 On thermomechanical effects
during solid particle erosion. Wear 151: 87–95[42] Wang Q, Melaaen M C, DeSilva T S and Tong G 2005
Experimental and computational studies of gas–particle flow
in a ‘sand-blast’ type of erosion tester. Powder Technol. 160:93–102
[43] Andrew D R and Horsefield A 1983 Particle collisions in the
vicinity of an eroding surface. J. Phy. D Appl. Phys. 16:525–530
[44] Koksal F, Ficici F, Kayikci R and Savas O 2012 Experi-
mental optimization of dry sliding wear behavior of in situ
AlB2/Al composite based on Taguchi’s method. Mat. Des.42: 124–130
[45] Delon E, Ansart F, Duluard S, Bonino J P, Monceau D,
Rouaix A, Mainguy R, Thouron C, Malie A, Joulia A,
Bianchi L and Gomez P 2018 J. Eur. Ceram. Soc. 38: 4719[46] Kumar D 2019 Comparison of thermal fatigue of superni
718SGTBCs and APS TBCs . Trans. Indian Inst. Met. 72:1927–1939
[47] Gangopadhyay S, Acharya R, Chattopadhyay A K and Paul
S 2009 Pulsed DC magnetron sputtered MoSx–TiN com-
posite coating for improved mechanical properties and
tribological performance. Surf. Coat. Technol. 203:
3297–3305
[48] Kar S, Kumar S, Bandyopadhyay P P and Paul S 2020
Grindability of plasma sprayed thermal barrier coating using
super abrasive wheel. Trans. IMF 98: 30–36
[49] Sargade V G, Gangopadhyay S, Paul S and Chattopadhyay A
K 2011 Effect of coating thickness on the characteristics and
dry machining performance of TiN film deposited on
cemented carbide inserts using CFUBMS. Mater. Manuf.Process. 26: 1028–1033
[50] Viazzi C, Bonino J P and Ansart F 2006 Synthesis by sol-gel
route and characterization of Yttria stabilized Zirconia
coatings for thermal barrier application . Surf. Coat. Technol.201: 3889–3893
[51] Kumar D and Pandey K N 2017 Thermo-structural analysis
of sol-gel route based yttria stabilized zirconia tetragonal
zirconia (YSTZ) powders for thermal barrier applications.
Indian J. Chem. Technol. 24: 153–161[52] Pin L, Ansart F, Bonino J-P, Le Maoult Y, Va Vidal and
Lours P 2011 Processing, repairing and cyclic oxidation
behavior of sol-gel thermal barrier coatings. Surf. CoatTechnol. 206: 1609–1614
[53] Zhang K C, Ren C, He Y D and Gao W 2011 Preparation of
YSZ coatings by thermal pressure and filtration of sol-gel
paint (TPSP) for thermal barrier application. Surf. CoatTechnol. 205: 4343–4348
[54] Pin L, Ansart F, Bonino J-P, Le Maoult Y, Va Vidal and
Lours P 2013 Reinforced sol-gel thermal barrier coatings and
their cyclic oxidation life. J. Eur. Ceram. Soc. 33: 269–276[55] Das P, Paul S and Bandyopadhyay P P 2018 HVOF sprayed
diamond reinforced nano-structured bronze coatings. J. AlloyComp. 746: 361–369
133 Page 16 of 17 Sådhanå (2021) 46:133

[56] Lima R S, Guerreiro B M H and Aghasibeig M 2019
Microstructural characterization and room-temperature ero-
sion behavior of as-deposited SPS, EB-PVD and APS YSZ-
based TBCs. J. Therm. Spray Technol. 28: 223–232
[57] Algenaida W, Ganvirb A, Calinas R F and Johny Varghesed
J 2019 Influence of microstructure on the erosion behaviour
of suspension plasma sprayed thermal barrier coatings. Surf.Coat. Technol. 375: 86–89
Sådhanå (2021) 46:133 Page 17 of 17 133