a comparative study of local autonomy levels of global
TRANSCRIPT
A Comparative Study of Local Autonomy Levels of
Global/World Cities in Developing Economies
— Cases from China, India and Vietnam
A dissertation submitted to the
Department of Political and Social Sciences, Freie Universität Berlin
in partial fulfillment of the requirements
for the academic degree of Dr. phil.
Lu, Xin
Berlin, 2019

ii
Supervisor: Prof. Dr. Klaus Segbers
Second Examiner: Prof. Dr. Oliver Ibert
Date of Defense: Dec. 4th, 2018

iii
Abstract
This dissertation studies local autonomy levels of leading global/world cities (GWC) in
major developing economies. Four cities in three countries are selected: Shanghai and
Guangzhou, China; Mumbai, India; Ho Chi Minh City, Vietnam. These countries are either
of significant size or occupy unique positions in the world’s shifting economic landscape.
They embarked on economic liberalization and started to actively integrate into global
economy at least since the early 1990s, when the observation starts. During this period,
their national economies integrated into global economy to different extents, strengthening
their comprehensive national power while shifting the world’s economic center of gravity.
In this process, the four cities not only acted as leading GWCs critical to their national
economies, but also as important nodes in the world GWC network, articulating their
national economy with world economy. Against similar domestic and international
backgrounds, however, the four cities’ local autonomy level have changed very differently
through more than two decades. This research investigates causes for this puzzle.
GWCs need territorial states to fully function, while territorial states (especially less-
developed ones) tend to use GWCs as a platform to attract investment, accumulate
resources, and strengthen national power—creating a mutuality between the territorial state
and the GWC. On the other hand, as a GWC becomes more global, it faces conditions and
generates demands quite different from ordinary cities. The territorial state also needs to
ensure a balanced development across the country, rather than spoiling certain cities. This
generates contradictions between the two parties. The level of local autonomy is a
settlement on power allocation between the central (territorial state) and the local (GWCs)
levels of government. Whether a GWC gets more or less local autonomy is determined by
whether mutuality or contradiction between the territorial state and the GWC prevails.
Three sets of relations are identified, each generating one independent variable and a
corresponding hypothesis. First, between global economy and the territorial state (IV-1: the
GWC’s national economy’s global integration); second, between global economy and a
certain GWC in a territorial state (IV-2: inter-city competition in a GWC’s neighborhood);
third, the GWC’s position inside its own territorial state (IV-3: how concentrated in a GWC
iv
a territorial state’s foreign economic activities are). The three hypotheses are therefore: a)
the more globally integrated a national economy is, its leading GWC would enjoy greater
local autonomy; b) the more intense competition a GWC faces from its neighbors, this city
is more likely to get greater local autonomy; c) if a territorial state’s foreign economic
activities are more concentrated in a GWC, this city would enjoy greater local autonomy.
Using a most-similar research design, this dissertation produces three findings: first,
global integration of national economy does not have a strong relation with a GWC’s local
autonomy level. It may need to pass a certain limit before it starts to make an effect.
Otherwise, it has limited impact. Specifically, FDI flow, especially outflow, are of higher
relevance than goods and service flows. Neither mutuality or contradiction between the
territorial state and the GWC clearly prevails. The relation is an intricate one.
Second, competition among neighboring GWCs are omnipresent, but at different
intensities. More intense competitions usually lead to a higher likelihood of power
transition from the territorial state to its leading GWC. This confirms mainstream GWC
scholarship’s claims on intercity competitions. The territorial state and the GWC find a
mutuality in helping the GWC win the competition. However, if a GWC is situated in a
highly integrated city-region, the response to competition would be different.
Third, if a territorial state’s foreign economic activities are more concentrated in a
GWC, it would transit more power to that GWC, because doing so benefits the overall
national growth and development. But the territorial state should take caution not to
excessively invest in a single GWC, in order to avoid an overly unbalanced national urban
system.
Altogether, emerging developing countries tend to use their leading GWCs as a tool for
national growth. They usually find more mutuality than contradictions with its home-grown
GWCs. In fostering their champion cities, developing countries expect their national
economy to benefit as a whole. The extent of such dynamics depends on how the territorial
state and its GWC are situated globally, and how are they situated vis-à-vis each other.

v
This research aims at contributing to the political aspect of GWC formation, especially
GWCs in countries that are more dynamically integrating into world economy. By studying
cases from three important developing economies, it brings new insights into the territorial
state’s response to globalization with regard to its home-grown GWCs, as well as GWCs’
reactions to their situations in the global city network, and whether and under what
circumstance that leads to power transition to the local level.

vi
List of Tables
Table 1.1: Main theoretical approaches in the GWC research
Table 3.1: Clark's four types of local autonomy
Table 3.2: Decentralization dimensions and indicators
Table 3.3: Population of cases
Table 3.4: The four cases' values on each IV
Table 4.1: Levels, actors and their role in the provision of basic services in Mumbai
Table 4.2: Indian General Governments' Consumption, 1993-2013
Table 4.3: Mumbai public income 1993-2016
Table 4.4: State of Maharashtra revenue and grants from central government
Table 4.5: Mumbai Intercity Competition, GaWC Source, 2000-2018
Table 4.6: Stock Exchanges based in Mumbai as of 2018
Table 4.7: Largest Stock Exchanges in Mumbai's Neighborhood
Table 4.8: India and Mumbai's Forbes 500 TNCs, 1995-2017
Table 4.9: ISB-VCC Ranking of 24 Selected Indian Multinationals, 2006
Table 4.10: Top 20 Indian Companies as per Foreign Assets, 2013
Table 4.11: FDI inflow of Mumbai and All-India, 2000-2017
Table 4.12: Mumbai's and Maharashtra's GDP in selected industries
Table 5.1: Shanghai Municipal Revenue and Expenditure, 1989-2016
Table 5.2: Shanghai's Neighboring GWCs According to GaWC, 2000-2018
Table 5.3: Largest Stock Markets around Shanghai (billion USD)
Table 5.4: China's and Shanghai's Forbes 500 Companies, 1995-2017
Table 5.5: Shanghai's Share of China, Selected Indicators
Table 6.1: Guangzhou Municipal Revenue and Expenditure 1998-2016
Table 6.2: Guangzhou Intercity Competition as per GaWC, 2000-2018
Table 6.3: Guangzhou's Share of China's Actualized FDI
Table 6.4: China and Guangzhou's Forbes 500, 1995-2017
Table 7.1: Ho Chi Minh City Local Public Finance, 2005-2016
Table 7.2: HCMC's Neighboring GWCs According to GaWC
Table 7.3: HCMC's Share of Largest Enterprises in Vietnam, 2007-2017

vii
List of Figures
Figure 1.1: Case Countries’ GDP Share of the World (Current US$)
Figure 1.2: Case Countries’ and World’s GNI per capita, PPP (Current Int’l US$)
Figure 1.3: Case Countries’ HDI Compared with Germany and Japan (1990-2017)
Figure 1.4: Case Countries’ GDP Growth Rate (Annual %)
Figure 2.1: Theoretical Structure
Figure 2.2: China’s, India’s and Vietnam’s urbanization rate, 1994-2017
Figure 2.3: Four successful relations between national government and world city
Figure 4.1: Indian imports and exports of goods and services, % of GDP
Figure 4.2: World’s Export and Import of Goods and Services, % of GDP
Figure 4.3: India’s FDI net inflow and outflow, % of GDP
Figure 4.4: Intercity Competition for Mumbai According to GaWC (international)
Figure 4.5: Intercity Competition for Mumbai According to GaWC (domestic)
Figure 4.6: Market Capitalization of Stock Markets, Mumbai and Neighboring Cities
Figure 4.7: Mumbai’s Share of Maharashtra, 2004-2014
Figure 4.8, 4.9: Mumbai ports’ share of Indian imports and exports
Figure 5.1: China’s Central and Local Shares of Total Fiscal Revenue
Figure 5.2: China’s Local and Central Shares in Governmental Expenditure
Figure 5.3: Shanghai’s Local Revenue and Expenditure % of Total Revenue
Figure 5.4: China’s Import and Export of Goods and Services, % of GDP
Figure 5.5: China’s FDI Net Inflow and Outflow, % of GDP
Figure 5.6: Intercity Competition for Shanghai According to GaWC (International)
Figure 5.7: Number of Chinese Cities at HS Level or above in the GaWC Lists
Figure 5.8: Intercity Competition for Shanghai According to GaWC (Domestic)
Figure 5.9: Market Capitalization of Stock Markets around Shanghai, May 2018
Figure 5.10: Shanghai’s Share of China’s Forbes 500 Companies, 1995-2017
Figure 6.1: Trajectory of Guangzhou Local Autonomy Change
Figure 6.2: Intercity Competition for Guangzhou According to GaWC (International)
Figure 6.3: Intercity Competition for Guangzhou According to GaWC (Domestic)
Figure 7.1: GDP Growth Rate of Some ASEAN Countries, 1993-2016
Figure 7.2: FDI Inflow’s % of GDP of Some ASEAN Countries, 1993-2016

viii
Figure 7.3: Vietnamese Fiscal Decentralization 1996-2013
Figure 7.4: Vienamese Import and Export of Goods and Services, % of GDP
Figure 7.5: Vietnamese FDI Net Inflow and Outflow, % of GDP
Figure 7.6: Number of Same-Country Cities in GaWC Lists, HCMC
Figure 7.7: Intercity Competition for HCMC According to GaWC

ix
List of Abbreviations
ASEAN Association of Southeast Asian Nations
BRICS Brazil, Russia, India, China, and South Africa
CBD Central Business District
CNY Chinese Yuan
FDI Foreign Direct Investment
GFC Global Financial Center
GWC Global/World City
GaWC The Globalization and World Cities Research Network
GoI Government of India
GoM Government of Maharashtra
GNI Gross National Income
HCMC Ho Chi Minh City
H.K. Hong Kong
HKMT Hong Kong, Macao and Taiwan
HQ Headquarter
IFC International Financial Center
INR Indian Rupee
IR International Relations
JNNURM Jawaharlal Nehru National Urban Renewal Mission
MCGM Municipal Corporation of Greater Mumbai
MMR Mumbai Metropolitan Region
MMRDA Mumbai Metropolitan Region Development Authority
MNC Multinational Company
NIDL New International Division of Labor
PPP Purchasing Power Parity
PRDR Pearl River Delta Region
RBI Reserve Bank of India
SAR Special Administrative Region
SOE State-Owned Enterprise
TNC Transnational Company
TNI Transnationality Index
UNCTAD United Nations Conference on Trade and Development
UNDP United Nations Development Programme
WCN World City Network

x

xi
Table of Contents
ABSTRACT ................................................................................................................................................ III
LIST OF TABLES ........................................................................................................................................ VI
LIST OF FIGURES ...................................................................................................................................... VII
LIST OF ABBREVIATIONS ........................................................................................................................... IX
CHAPTER 1: INTRODUCTION ...................................................................................................................... 1
1.1 Background ................................................................................................................................... 1
1.2 Research puzzle ............................................................................................................................. 8
1.3 Main points of the Global/World City research ............................................................................. 10
1.4 Criticisms / shortcomings of GWC research ................................................................................. 15
1.4.1 Ontological vagueness .......................................................................................................................... 15
1.4.2 Empirical weakness .............................................................................................................................. 16
1.4.3 “Political deficit” ................................................................................................................................... 17
1.4.4 Unsettled incorporation into IR studies ................................................................................................. 19
1.5 Basic Arguments and Explaining Variables .................................................................................. 21
1.5.1 IV1: Global integration of the national economy .................................................................................... 22
1.5.2 IV2: Intercity competition from neighboring GWCs ................................................................................ 23
1.5.3 IV3: Concentration of the territorial state’s foreign economy in a GWC .................................................. 24
1.6 Relevance of the research............................................................................................................. 25
CHAPTER 2: THEORETICAL FRAMEWORK ................................................................................................. 29
2.1 The territorial state and the GWC ................................................................................................ 30
2.2 The territorial state in globalization ............................................................................................. 32
2.3 The GWC in globalization ............................................................................................................ 34
2.4 Mutuality between GWC and territorial state................................................................................ 36
2.5 Contradictions between GWC and territorial state........................................................................ 39
2.6 Mutuality or contradiction? ......................................................................................................... 42
CHAPTER 3: VARIABLES AND METHODOLOGY .......................................................................................... 44
3.1 Dependent variable: Local autonomy level of GWC ...................................................................... 44
3.1.1 Conceptualization of local autonomy .................................................................................................... 45
3.1.2 Current Explanations on Level of Autonomy .......................................................................................... 50
3.1.3 GWC scholarship on local autonomy ................................................................................................... 53
3.1.4 Measuring local autonomy level............................................................................................................ 56
3.1.5 Indicators of local autonomy level ......................................................................................................... 58
3.2 Independent variable 1: Global integration of the national economy of a GWC ............................. 60
3.2.1 Hypothesis 1......................................................................................................................................... 61
3.2.2 Operationalize global integration of national economy .......................................................................... 62

xii
3.3 Independent variable 2: Intercity competition from neighboring GWCs ........................................ 62
3.3.1 Hypothesis 2......................................................................................................................................... 63
3.3.2 Operationalize intercity competition ..................................................................................................... 64
3.3.3 Scope of competition ............................................................................................................................ 68
3.4 Independent variable 3: Concentration of a country’s foreign economy in the GWC ..................... 69
3.4.1 Conceptualize “foreign economy concentration” ................................................................................... 69
3.4.2 Hypothesis 3......................................................................................................................................... 72
3.4.3 Operationalize “foreign economy concentration” .................................................................................. 73
3.5 Case selection .............................................................................................................................. 75
3.6 Small-N study .............................................................................................................................. 83
3.7 Time span .................................................................................................................................... 84
3.8 Data source ................................................................................................................................. 86
CHAPTER 4: CASE OF MUMBAI, INDIA...................................................................................................... 88
4.1 Introduction ................................................................................................................................. 88
4.2 Mumbai’s urban structure and politics ......................................................................................... 89
4.3 India’s decentralization and local autonomy ................................................................................ 91
4.4 Mumbai’s local autonomy level, the early 1990s to 2016 .............................................................. 94
4.5 Mumbai’s local autonomy level from the angle of Maharashtra .................................................... 97
4.6 Indian economy’s global integration and Mumbai’s local autonomy ............................................. 99
4.6.1 Indian import and export’s share in its GDP and Mumbai’s local autonomy ............................................ 99
4.6.2 India’s FDI inflow and outflow and Mumbai’s local autonomy level ...................................................... 101
4.6.3 Summary ............................................................................................................................................ 103
4.7 Intercity competition and Mumbai’s GWC’s local autonomy ....................................................... 103
4.7.1 Intercity competition as per the World According to GaWC ................................................................. 104
4.7.2 Intercity competition as per stock exchanges ...................................................................................... 107
4.7.3 Summary ............................................................................................................................................ 109
4.8 Concentration of the Indian foreign economy in Mumbai ............................................................ 110
4.8.1 Largest Indian companies’ concentration in Mumbai ........................................................................... 110
4.8.2 FDI inflow to India through Mumbai .................................................................................................... 114
4.8.3 India’s export and import through Mumbai ......................................................................................... 117
4.9 Chapter conclusion .................................................................................................................... 118
4.9.1 Performance of hypotheses ................................................................................................................ 118
4.9.2 Known deficiencies of the empirical test ............................................................................................. 119
4.9.3 General assessment of the GWC of Mumbai ........................................................................................ 120
CHAPTER 5: CASE OF SHANGHAI, CHINA................................................................................................ 122
5.1 Introduction ............................................................................................................................... 122
5.2 China’s decentralization since 1990 ........................................................................................... 123

xiii
5.3 Shanghai’s local autonomy change 1990-2016 ........................................................................... 126
5.4 Global integration of China’s national economy and Shanghai’s autonomy change .................... 128
5.4.1 China’s imports’ and exports’ shares ................................................................................................... 128
5.4.2 China’s FDI inflow and outflow ............................................................................................................ 130
5.4.3 Summary ............................................................................................................................................ 132
5.5 Intercity competition and Shanghai’s autonomy level.................................................................. 132
5.5.1 Intercity competition against Shanghai according to GaWC.................................................................. 132
5.5.2 Interurban competition as per stock markets ...................................................................................... 138
5.5.3 Summary ............................................................................................................................................ 140
5.6 Shanghai’s weight in China’s foreign economy and the city’s autonomy level ............................. 141
5.6.1 China’s largest TNCs in Shanghai as per Forbes500 .............................................................................. 141
5.6.2 China’s FDI inflow through Shanghai ................................................................................................... 144
5.6.3 China’s import and export through Shanghai ....................................................................................... 147
5.6.4 Summary ............................................................................................................................................ 148
5.7 Chapter conclusion .................................................................................................................... 148
5.7.1 Performances of hypotheses ............................................................................................................... 149
5.7.2 Known deficiencies of the empirical test ............................................................................................. 150
5.7.3 General assessment of the GWC of Shanghai....................................................................................... 151
CHAPTER 6: CASE OF GUANGZHOU, CHINA ............................................................................................ 153
6.1 Introduction ............................................................................................................................... 153
6.2 Guangzhou’s local autonomy 1998-2016 .................................................................................... 154
6.3 Global integration of China’s national economy and Guangzhou’s local autonomy change......... 157
6.4 Intercity competition and Guangzhou’s local autonomy change .................................................. 158
6.5 Concentration of China’s foreign economy in Guangzhou and Guangzhou’s local autonomy change
....................................................................................................................................................... 163
6.6 Chapter Conclusion ................................................................................................................... 167
6.6.1 Performance of hypotheses ................................................................................................................ 167
6.6.2 Known deficiencies of empirical test ................................................................................................... 168
6.6.3 General assessment of Guangzhou ...................................................................................................... 169
CHAPTER 7: CASE OF HO CHI MINH CITY, VIETNAM .............................................................................. 171
7.1 Introduction ............................................................................................................................... 171
7.2 Decentralization in Vietnam since Doi Moi ................................................................................ 173
7.3 HCMC’s local autonomy change, 2005-2016.............................................................................. 175
7.4 Global integration of Vietnamese economy and HCMC’s local autonomy ................................... 178
7.5 Intercity competition and HCMC’s local autonomy level ............................................................ 181
7.6 Concentration of Vietnam’s foreign economy in HCMC .............................................................. 185
7.7 Chapter Conclusion ................................................................................................................... 187

xiv
CHAPTER 8: CONCLUSION ..................................................................................................................... 190
8.1 Summary ................................................................................................................................... 190
8.2 Main findings and discussion ..................................................................................................... 193
8.3 Policy implications and further research .................................................................................... 196
BIBLIOGRAPHY ..................................................................................................................................... 200
ACKNOWLEDGEMENTS .......................................................................................................................... 219

1
Chapter 1: Introduction
1.1 Background
This thesis compares the autonomy levels of global/world cities (GWC)1 in three
developing countries: China (Shanghai and Guangzhou), India (Mumbai) and Vietnam
(Ho Chi Minh City, HCMC). By studying these cities’ local autonomy vis-à-vis their
central governments in the context of globalization and these countries’
internationalization, I unpack the macro rhetoric of globalization and inquire how such
trend is affecting actors on different scales—the territorial state and GWCs, and on the
power relations between them.
As central economic cities in their countries, Mumbai, Shanghai, Guangzhou and
HCMC have displayed sharply different levels of local autonomy in reaction to
globalization—and with varying levels of success in building up their GWC capability.
Shanghai has made considerable progress in improving its infrastructures, public service,
and investment environment, etc. It has risen fast as a prominent GWC in Asia. While
Mumbai’s progress, despite its (perhaps) most favorable position in India and South Asia,
has been less prominent. Guangzhou, another major GWC in South China, is faring less
successfully than Shanghai but better than Mumbai. In Vietnam, HCMC is also showing
signs of expedited GWC formation2. Since the four cities all play a central role
domestically, all come from a major globalizing economy, they should exhibit similar traits
on local autonomy. Taking polity structures into consideration, even if their status vs.
1 Unless specified, concepts of “global city”, “world city” and “global city region” are considered
interchangeable in this dissertation and substituted with “GWC” (global/world city). I am aware of the
nuances among them (see Table 1.1).
2 “Ho Chi Minh City overtakes Silicon Valley in global ranking of city momentum”, JLL, Jan. 20, 2017,
<http://www.ap.jll.com/asia-pacific/en-gb/news/378/ho-chi-minh-city-overtakes-silicon-valley-in-global-
ranking-of-city-momentum>, last access Aug. 20, 2018.

2
territorial state is bound by systemic differences therefore non-comparable horizontally,
their trajectories of change should be similar. This does not seem to be the case. Why?
Against the globalization background and large-scale industrialization and economic
deregulation especially since the late 1980s and early 1990s, China, India and Vietnam
have embarked on a new phase of economic liberalization and political reform. Globally,
trade and economy are getting increasingly internationalized and even globalized in the
post-Cold War world. The case countries’ domestic reforms and societal changes largely
echoed such trend. In 1990, China reaffirmed its commitment to open up and established
the Pudong New Area in Shanghai, which has since become a showcase for the country’s
achievements in economic modernization; while India revised its constitution at the same
time and lifted a great number of restrictions on economic freedom. Vietnam’s Doi Moi
(reformation) started in the mid 1980’s and in the 1990s it started to show meaningful
effects on modernization and internationalization of its national economy. Now China and
India are the two fastest-growing mega economies in the world, while Vietnam is widely
considered a regional growth engine in Southeast Asia (see figure 1.4).
In terms of national transformation, all countries are evolving from a rural to an urban
society (see figure 2.2). In this process, the importance of central cities becomes
increasingly crucial—especially their functions of articulating national economy with world
economy and promote overall growth. China made the development of Shanghai’s Pudong
New Area—together with nineteen other national new (urban) areas3 established
afterwards—its national strategy and requires central revision and approval of master plans
for all important cities and urban clusters; India rolled out the Mega City Scheme in 1993-
2007 (Ministry of Urban Affairs and Employment 1993), the Jawaharlal Nehru National
3 The other nineteen new areas are (in order of date of establishment): Binghai New Area (Tianjin), Hengqin
New Area (Zhuhai), Liangjiang New Area (Chongqing), Zhoushan Archipelago New Area (Zhoushan),
Lanzhou New Area (Lanzhou), Nansha New Area (Guangzhou), Xixian New Area (Shaanxi), Gui’an New
Area (Guizhou), West Coast New Area (Qingdao), Jinpu New Area (Dalian), Tianfu New Area (Sichuan),
Xiangjiang New Area (Changsha), Jiangbei New Area (Nanjing), Fuzhou New Area (Fuzhou), Dianzhong
New Area (Kunming), Harbin New Area (Harbin), Changchun New Area (Changchun), Ganjiang New
Area (Jiangxi), Xiong’an New Area (Hebei).

3
Urban Renewal Mission (JNNURM) in 2014, and the Smart Cities program since Modi
took office (Hoelscher 2016). It also evinced interest in transforming Mumbai into a more
successful economic center4. Being the capital and the largest city of Maharashtra, Mumbai
also receives special state-level attention. In mid 1990s, HCMC’s prominence as Vietnam’s
economic hub and “reform leader” was clearly acknowledged in Vietnamese official
documents (Gainsborough 2003, 7). These all manifest the territorial state’s interest in
utilizing key urban engines to propel national growth.
The nearly three decades since 1990 also saw the Chinese, Indian and Vietnamese
economies boom. As of 2017, China and India have become world’s 2nd and 7th largest
economy5, topping many OECD countries. Their economies’ level of internationalization
also rose evidently, with China’s international trade as share of GDP climbed from 24.68%
in 1990 to 37.06% in 2016, with a peak of 65.62% in 2006. That of India also rose from
1990’s 15.67% to 2016’s 39.81%, with a peak of 55.79% in 2012—both exceeding that of
the United States6. Nowadays, they are heavy-weight players in terms of not only size but
also depth of integration into the capitalist world economy. Although significantly smaller,
Vietnam is a major ASEAN member, and one of the fastest-growing country in Southeast
Asia (see Figure 7.1). The smaller size does not diminish its value for research. After all,
most economies would seem light-weighted in front of China and India (see figure 1.1).
However, this does not mean they will soon parallel developed countries—mostly in
the Western world—as equivalent powers. Growth speed and size of economy are just two
aspects of comprehensive national power, not directly translatable into quality of
development or citizen welfare, where the three countries are still lagging. Individual-based
measurements often depict a different picture. These countries’ GNI per capita have been
well below the world average, with China only starting to catch up. India and Vietnam just
reached the world’s 1990 average (Figure 1.2). Their human development indexes (HDI),
4 “Manmohan keen on making Mumbai a Shanghai”, Financial Express, 2004-10-17, New Delhi, last
access 2017-11-10, <http://www.financialexpress.com/archive/manmohan-keen-on-making-mumbai-a-
shanghai/117071/>
5 “GDP (current US$)”, World Development Indicators, World Bank, last access 2018-03-18.
6 “Trade as Share of GDP”, World Development Indicators, World Bank, last access 2018-04-10.

4
reflecting people’s life quality and expectancy, are also well below developed countries
(Figure 1.3). And yet, backwardness in these aspects also implies great future potentials, if
these countries can manage to follow a proper and steady development track. At the
moment the they look well posited to keep up their growth momentum, if no major
domestic or international turmoil hits. This gives us even stronger reasons to pay closer
attention to them.
Figure 1.1: Case Countries’ GDP Share of the World (Current US$)
Source: World Development Indicators, World Bank.
Figure 1.2: Case Countries’ and World’s GNI per capita, PPP (current int’l $)
0.00%
2.00%
4.00%
6.00%
8.00%
10.00%
12.00%
14.00%
16.00%
18.00%
20.00%
19
90
1991
19
92
19
93
19
94
19
95
19
96
19
97
19
98
19
99
20
00
20
01
2002
20
03
20
04
20
05
20
06
20
07
20
08
20
09
2010
20
11
20
12
20
13
20
14
20
15
20
16
20
17
China India Vietnam
0
2000
4000
6000
8000
10000
12000
14000
16000
18000
1990
1991
1992
1993
1994
1995
1996
1997
1998
1999
2000
2001
2002
2003
2004
2005
2006
2007
2008
2009
2010
2011
2012
2013
2014
2015
2016
2017
China India Vietnam World

5
Source: World Development Indicators, World Bank.
As centers for “command and control” in world economy (Sassen 1991a), this period
also saw Shanghai, Guangzhou, Mumbai and HCMC becoming hot-spots for investment
into the three booming economies (and on a much smaller scale, emanating from them).
The four cities’ GWC functions have been receiving more attention and strengthening, as
international capital looking for ways to tap opportunities in these new territories.
According to the Globalization and World Cities (GaWC) research network, both Shanghai
and Mumbai are ranked “Alpha-” level in 20007. In 2018, Shanghai has progressed to the
“Alpha+” level, with Mumbai to the “Alpha” level8. It means both cities’ international
connections and interactions have greatly intensified. Guangzhou and HCMC are also
ascending. Guangzhou almost rocketed from “Gamma-” in 2000 to “Alpha” in 2018; while
HCMC mounted from “Gamma” in 2000 to “Beta+” in 20189.
Figure 1.3: Case Countries’ HDI Compared with Germany and Japan (1990-2017)
7 “The world according to GaWC 2000”, Globalization and World Cities Research Network, 2009-02-20,
last access 2018-01-10, <http://www.lboro.ac.uk/gawc/world2000.html>.
8 “The world according to GaWC 2016”, Globalization and World Cities Research Network, 2017-04-24,
last access 2018-01-10, <http://www.lboro.ac.uk/gawc/world2016.html>.
9 See the intercity competition analysis of each case for detailed rankings in GaWC publications.
0
0.1
0.2
0.3
0.4
0.5
0.6
0.7
0.8
0.9
1
19
90
19
91
1992
19
93
19
94
1995
19
96
19
97
1998
19
99
20
00
2001
20
02
20
03
2004
20
05
20
06
2007
20
08
20
09
2010
20
11
20
12
2013
20
14
20
15
2016
20
17
China Germany India Japan Viet Nam

6
Source: Human Development Reports, UNDP.
Figure 1.4 Case Countries’ GDP Growth Rate (Annual %)
Source: World Development Indicators, World Bank.
However, stark contrasts exist. It has become increasingly evident that they have
achieved different levels of success in terms of becoming a stronger GWC10. Until the early
1990s, Shanghai had been a crumbling industrial center with little change since the
communist rule (1949). Since 1990, the city underwent a massive, comprehensive urban
renewal. China’s central policymakers continuously endorsed the city’s aim to turn itself
into an international center for economy, finance, trade and shipping11. In India, Mumbai
started a similar restructuring project to elevate itself to a “world-class” city and an
emergent international financial center. However, those plans have made little progress
(Chattaraj 2012, 1). The city is still lagging behind in areas like local governance and
10 Although their ranks all see apparent ascent, their local momentum and agency in promoting such change
are different—which is what this dissertation tries to understand. Ascending position of a GWC can be
simply attributed to the growth of the national or regional economy they articulate, in which process the
city itself could as well (intentionally or unintentionally) choose to do little. However, if cities act, their
local momentum and agency would definitely stimulate faster (or better) growth and development.
11 Shanghai Municipal Government, Municipal Masterplan for Shanghai 2017-2035 (上海市城市总体规划
2017-2035) (approved by China State Council), Jan. 2018, in Chinese,
<http://www.shanghai.gov.cn/newshanghai/xxgkfj/2035002.pdf> , last access Jun. 6, 2019.
-4
-2
0
2
4
6
8
10
12
14
16
1990
1991
1992
1993
1994
1995
1996
1997
1998
1999
2000
2001
2002
2003
2004
2005
2006
2007
2008
2009
2010
2011
2012
2013
2014
2015
2016
2017
China India Vietnam World

7
business-friendliness building. Shanghai has clearly achieved more tasks than Mumbai, and
obtained better results in terms of GWC formation. As a municipality, it shows more
willingness, vision, and capability to build up its GWC muscles as well as to negotiate with
Beijing. Mumbai, on the other hand, shows very modest ambition and activeness to further
increase its prominence in front of the Indian central government. The talk of “Shanghai
Dreams” (Chattaraj 2012) or “Shanghai-zation of Mumbai” (Ghadge 2013) is a telltale sign
of the gap between them, and the notion in India that Mumbai should strive harder to
become a more successful GWC.
Another Chinese GWC, Guangzhou, has been much less ambitious and lower-profile
than Shanghai in promoting itself. It only obtained Beijing’s endorsement of the
establishment of the Nansha New Area (南沙新区), another national-level new urban area
administratively equivalent to Pudong, in 2012—two decades after Pudong took off. Even
its priority in Guangdong, where the city serves as the provincial capital, has been seriously
challenged by Shenzhen. Until recently, Chinese officials have been highly sensitive to
their localities’ GDP output—a heavily-used indicator in officials’ performance evaluation.
With a GDP size only after Shanghai and Beijing, and on a par with Shenzhen, favorable
policies for Guangzhou is surprisingly scarce, not to mention GWC-related policies and
measures the city takes. This is apparently not because the city is unimportant—some other
factors are at work.
HCMC, the Vietnamese central metropolis besides Hanoi, has managed to increase its
level of autonomy (Gainsborough 2003), but has never officially labeled itself as a GWC.
Its status in Vietnam seems stable, and there are signs Hanoi is consciously re-balancing the
central-local power relations to equip HCMC with more administrative freedom. Vietnam
has been further integrating into global commodity chains. It is especially trying to
capitalize on its demographic resource and take over labor-intensive industries leaving
advanced countries and even China due to rising costs12. It is logically expected that
advanced producer services and TNC branches (or even headquarters) would follow the
12 See “Vietnam offers companies China alternative”, Financial Times, March 14, 2012,
<https://www.ft.com/content/46d052b8-6446-11e1-b30e-00144feabdc0>, last access Nov. 8, 2018.

8
capital’s footstep and cluster on a good platform in Vietnam—most likely HCMC. Thus,
the city and the territorial state would adopt a more favorable or even accommodating
stance to ensure this to happen. The reality seems so.
Clearly, similar situations did not lead to similar responds, and this triggers us to
wonder why.
1.2 Research puzzle
Against similar globalization and national backdrops, Shanghai, Mumbai, Guangzhou and
HCMC have demonstrated considerably different levels of autonomy vis-à-vis central
government, and such difference has caused their varied levels of efforts at GWC capacity
building. Why?
This puzzle touches upon an important issue in GWC research: a GWC’s relations
with its territorial state, here indicated by the city’s autonomy level. Being an independent
sovereign, a territorial state retains the formal right to all final decisions within its
territory13. By constitution, laws, verdicts, or informal conventions, etc., power is divided
among tiers of government, and statehood is therefore actualized in administrative
practices carried out according to such division. How power is divided defines the
boundaries among tiers of government. What a city can or cannot do consequently depends
on how its boundary is set. Therefore, a GWC’s autonomy or capacity should and must be
viewed together with the territorial state (especially its central government)—how
boundaries are drawn between them—and should not be viewed in isolation.
13 A distinction should be made between national sovereignty and central government. To say a territorial
state enjoys exclusive sovereignty does not mean its central government controls all aspects of
governmental activities on all tiers of government. There is always some level of division of responsibility
between the central and local government, i.e. certain room of local autonomy is always in place, be it a
unitary or a federal system.

9
This would appear unorthodox to people too attuned to the globalization hype, which
often belittle the role of territorial states, if not ignore it in total (e.g. Ohmae 1996). The
territorial state is also sidelined in much of the early discussions of GWC. Friedmann and
Sassen were more interested in the overarching structure of the capitalist world economy
and its bearing on cities, than in the territorial state’s role in it. Only recently have scholars
come to realize that the territorial state has never been totally absent, rather, it has played a
more significant role than previously assumed (e.g. Hill and Kim 2000; Tsukamoto and
Vogel 2007; Ma 2009; G. Clark and Moonen 2017). It has always been the “host” that all
GWCs reside in, and the material base that enables all forms of “flows” to take place. By
taking territorial state and its relations with its GWC into consideration, I expect to expand
the horizon of current GWC research and generate new meaningful insights.
The four chosen cities find themselves in similar positions both internationally as
GWCs and domestically as their country’s champion city. They share similar needs to
transform themselves into better GWCs. In this regard, these cities and their territorial
states find mutual policy targets. Cities aim at higher GWC prominence, while their
territorial states see their own interest in facilitating these cities’ vitality.
However, similar conditions did not translate into similar levels of local autonomy, or
even a similar trend in local autonomy change. It means other factors are at work, and beg
investigation. Is it because of the city’s weight in its national economy? Does its centrality
in world economy really has an effect on its territorial state? Or some factors not on the
international or the national scale, but on the regional scale, should receive closer
attention? This is the main puzzle this research tries to explain: despite similar
international and domestic positions, why GWCs in major emerging economies have very
different levels of local autonomy?
It is apparent that each GWC, however “global” it is, is always embedded in and
bound by its territorial state. To achieve a GWC’s development goals, especially those
tailor-made for GWC functions, it necessitates more power on the local level, which needs
to be created in one way or another. The power for autonomy can be transferred from the
central authority, meaning shifting the responsibility from higher to lower level; it can also

10
be created from below, meaning local governments obtaining new resources and rights and
eventually become stronger in relation to the central government. It is in this sense that we
use “local autonomy” to denote the power balance between a city and its higher
governments.
1.3 Main points of the Global/World City research
The GWC scholarship dates back to the early works of Geddes (1924) and Hall (1966) on
“world cities”. A common feature between them is to view the city as the site of formal
political power control, especially power control by the territorial states. Today’s
conceptualization of GWC, as will be elaborated later, shares the same notion of the city as
a site of central control, yet more in terms of economics than politics.
The version of GWC we use today stems from Friedmann and Wolff (1982; also
Friedmann 1986). They envisaged a class of cities with the power of controlling the
capitalist world economy. The power comes from the city’s position (strongly affected by
the economy it articulates) in the ever-changing international division of labor or the New
International Division of Labor (NIDL) (Fröbel, Heinrichs, and Kreye 1980). The position
is changeable, largely determined by the number and power of multinational corporations
headquartered in the city. The more TNCs in a city, the more decisions are made and
directives issued from there, therefore the city’s position is more central, and accordingly,
the more powerful the city is. A distinction between Friedmann and Wolff’s world city
hypothesis and the older view lies in the interpretation of power. Friedmann and Wolff
focused on the aspect of economic decisions. This is natural, given their theoretical
foundation being Wallerstein’s world-systems theory (Wallerstein 1979); while the older
view emphasized formal political ruling.
Friedmann and Wolff’s conceptualization is a pioneering effort to interpret new
patterns of world economy from a non-state-centered perspective. They rightly draw
people’s attention to the practices of world economy—the large transnational corporations
(TNC) rather than territorial states. These TNCs, in their endless pursuit to maximize

11
profits, boast powers to organize and shape the international commodity chain, which is
continuously expanding into previously unconnected territories. Being platforms where
those TNCs operate, world cities are the basing points where the expansion into and
integration of these territories take place.
However, this hypothesis is not without criticisms. A major one is the lack of empirical
evidence that certain cities are indeed more central and powerful. This deficiency was even
acknowledged by Friedmann and Wolff themselves: “To label them world cities is a matter
of convenience. In each and every instance, their specific role must be determined through
empirical research (1982: 310)”. They jumped from certain cities being basing points of
TNCs directly to those cities’ stronger power to command and control world economy. The
mechanism in between is not clearly shown, which raises doubts.
Subsequent works devised empirical indicators to validate the conceptualization. These
indicators include: air traffic network and flows (Derudder and Witlox 2008), migration of
higher-skilled and -educated talents (e.g. W. Shen 2009), world city network and city
centrality and intercity connectivity (P. J. Taylor 2004; P. J. Taylor et al. 2002). Empirical
evidences gradually reveal a worldwide grid with cities as central nodes. Various flows
connect those nodes and form a coherent web encompassing the whole capitalist world
economy. These efforts certainly carried the world city agenda one substantial step forward.
Cities are no longer simply seen as largely self-contained built-up environments; rather,
they constitute a platform for a series of activities pertaining global capitalist accumulation
to happen. However, paucity of high quality data confirming such relations still persists (see
§1.4.2).
The aim of this thesis is not to solve the data problem. In fact, another important scholar
in the GWC research, Saskia Sassen has tried to address this issue, although not entirely
successfully. Her contributions (Sassen 1991a, 2000a, 2001a, 2002) can be partly seen as a
response to the lack of empirical evidence in Friedmann and Wolff’s theory, as well as a
follow-up on Cohen’s (1981) theory that specialized corporate functions have become
crucial to business operations in a globalized economy. Sassen knowingly chose the term
“global city” to differ from “world city”, because her main attention is on these cities’

12
“capacity to produce” advanced producer services, other than being basing points of TNCs.
Like Friedmann and Wolff, Sassen’s model also stresses agglomeration of TNC
headquarters (among other things), usually clustering at downtown areas called CBDs
(central business district). Sassen’s diversion from Friedmann and Wolff, which is also her
main contribution, is on how the practice of central control is realized.
She starts from the assumption that geographical dispersal of economic activities and
the simultaneous integration of such geographically dispersed activities necessitate stronger
and more coordinated central corporate functions (concurring with the world city
hypothesis). And, that the central functions are becoming so complex and myriad that TNCs
have to outsource them to advanced producer services specialized in accounting, legal
affairs, public relations, etc (some of them collectively abbreviated as FIRE). These service
providers are equally subject to the agglomeration effect and follow TNCs’ footsteps to
cluster in central cities, forming a global cross-border intercity network of TNCs and
advanced service industries (Sassen 2001: Preface). This is, in a way, an effort to provide
more empirical evidence, especially in relation to the missing mechanism between TNC
headquarters and power of command and control in the world city hypothesis. Advanced
producer services and their grouping around TNC headquarters and branches are in essence
to aid TNCs in performing their commanding roles14. (Lin 2016)
Later, regionalism in economic geography started to flourish. Scholars gradually
realized that GWCs are always embedded in specific milieus—most immediately the
city-regions embracing them. New York not only functions on itself, it also functions
together with urban centers around it as a coherent whole. Similarly, Shanghai’s
economic and social functions are shared and mutually strengthened by smaller cities
around it, including Suzhou, Hangzhou, Nantong, etc. To fully understand this
mechanism, one’s scope must expand to cover the entire urban sprawl. Thus, the so-
called “global city-region” (Scott 2001b, 2001a; Segbers 2007; Vogel et al. 2010, etc.)
approach bloomed. These regions constitute “dense polarized masses of capital, labor,
and social life that are bound up in intricate ways... they represent an outgrowth of large
14 Also see (Lin, 2016) for a concise review of Sassen’s works on global city.

13
metropolitan areas—or contiguous sets of metropolitan areas—together with surrounding
hinterlands... (Scott 2001b, 814)” They extend a GWC’s geographical span beyond the
its own administrative boundary. This move is timely and necessary because even
supplementing the territorial state perspective with a GWC perspective has become
insufficient to fully make sense of today’s world. The urban level itself needs
consolidation.
The global city-region approach is more about supra-urban governance and
integration than about the changing structure of world economic geography.
Ramifications of globalization penetrate not only national borders but also city
boundaries into surrounding areas and therefore beg combined efforts between cities as
well as between public and private sectors (Segbers 2005). It contributes to the
theoretical framework of this dissertation in emphasizing the importance of metropolitan
areas in a territorial state, and the demanding governance burdens these city-regions take
on. To efficiently relieve those burdens requires additional resources—part of which
would come from negotiations between the urban area and its higher authorities (Scott
2001b, 820–23; Henton 2001).
Table 1.1: Main theoretical approaches in GWC research
Global cities World cities Global city-regions
Key thinker Sassen Friedmann Scott
Function Advanced producer
service
Power Firms embedded in post-
Fordist production networks
Structure of
network
New geography of
centrality that surpasses
existing territorial states’
boundaries
Reproduces spatial
inequality in the
capitalist world-
system
Archipelago structure replacing
existing core/periphery patterns
Territorial
basis
Traditional CBD, or
agglomeration of intense
business activity in a city
Metropolis in a
territorial state
mega-urban regions that may
transcend municipal or even
territorial state boundaries
Source: (Derudder 2007, 266), with author’s amendments.
14
The aforesaid ascent of emerging economies and their GWCs bring an important
development to world economy and the world GWC network. This development also has
two implications for GWC studies. As a research agenda intrinsically worldwide in scope,
the GWC radar must follow the footsteps of global capital and continuously explore new
territories. This is the primary function of a GWC: to provide speedy and highly
professional central control of geographically dispersed economic activities. It is also the
key factor feeding the growth of central corporate functions in GWCs (Sassen 2001: xix).
Certain advanced producer services are always expected to be available where TNCs
venture. TNCs’ failure to synchronize control with their geographic span inevitably leads
to malfunctioning and eventually profit loss. As for world cities, deemed to be TNCs’
commanding posts, their distribution is equally in tune with the changing patterns of the
world’s uneven development. In the capitalist world-system, there are always regions more
advanced and commanding, regions less advanced and influential, and regions subject to
the former two. The regions’ levels of development and the world city hierarchy mostly
overlap. If a territorial state somehow lifts itself from periphery to semi-periphery level, it
naturally receives more external “command and control” and meanwhile generates its own
“command and control”, with its TNCs venturing abroad by profit motives. It intensifies
connections with the core region and creates new connections with periphery regions.
Thus, presence of the world city system also rises in that area (see Friedmann and Wolff
1982; Friedmann 1986).
Two, as both a requisite and a result of the above dynamic, some cities in these
regions take on increasing GWC functions, articulating and controlling their specific
national or regional economies, while establishing tighter connections with other GWCs
(or the WCN). They don’t enjoy the stature of mature GWCs like New York, London or
Paris yet, but they are basing points of control in their respective areas and global
capital’s top choice when tapping that area. Several such cities have ascended evidently
in the GWC network, including Shanghai and Guangzhou in East Asia, Mumbai in South
Asia, and HCMC in Southeast Asia (see IV2 of each city). These cities, especially
Shanghai and Mumbai, have the potential to meaningfully change the world GWC
landscape (Chen 2009).

15
On the other hand, high levels of independence and affluent resources to run the city
are not a guarantee of the city’s success as a GWC. The two distinct attributes of a same
GWC—the attributes of its GWC-ness and the attributes of being a sub-national
administration body—is crucial to understanding the main puzzle of this research. The
former reflects a centrality in world economy, the latter reflects the status of being
subject to a territorial state—the traditional form of centrality on the world stage.
1.4 Criticisms / shortcomings of GWC research
1.4.1 Ontological vagueness
From an ontological point of view, whether the so-called “global/world city theory” is a
theory about city at all is sometimes called into question. The concept “city” has seldom
been clearly defined. This problem also plagues urban studies in general: “the term ‘city’ is
much overused and is often merely a shorthand designation for these massive areas of
continuous urbanization (Gottdiener and Budd 2005, 4)”. But this problem is more
conspicuous and troubling against the background of globalization, in which people, goods
and information are much less place-bound and much more mobile, often moving in
“flows” across places, forming their own “spaces” (Castells 2010), constituting a network
or a “space” of their own, rendering the “place-ness” of their territorial base porous, thus
making the definition of the city even more problematic. Not to mention the above-said
“global city-regions”, which defies reading urbanity on a city-basis.
In her seminal works, Sassen is more interested in the functioning of global economy
than in the city per se. Friedmann’s world city hypothesis and the subsequent interlocking
“world city network” (WCN) proposed by Taylor (2004) are highly structure-deterministic.
A city’s status as a primary or secondary world city is dependent on how the city and its
national economy fits into the capitalist world-system—it is impossible for a peripheral or
semi-peripheral economy to nurture a top-level world city, unless that economy somehow
joins the core zone. In both approaches, the term “city” is a tool for expression rather than a
meaningful concept in itself. Sassen uses “city” more as a convenient term to denote an

16
unpacked set of relations and events taking place among advanced service producers and
between those advanced service producers and TNCs; for Friedmann and Taylor, the city is
somewhat reduced to a “place-less container” (see R. G. Smith 2014), a node in the
network, leaving the complicated processes and interactions therein unexamined. It was
only in the emerging field of the “global city-region” that scholars started to discuss on-the-
ground mechanisms. But such endeavors are still in the nascent stage and are plagued by
methodology and data difficulties (see below). Truly, taking “city-region” as the key unit of
analysis is better than just the “city”, but again, such attempts face the same logical
dilemma of “sorites paradox” that Taylor faces in his interlocking network model (P. J.
Taylor 2004, see R. G. Smith 2014), i.e. where to draw the proper boundary of a city-
region. Not to mention the lack of high-quality data on intra-city-region activities.
1.4.2 Empirical weakness
Scholars widely acknowledge GWC research’s defect in empirical validation. As Taylor
pointed out, “world city research is strong on idea, but weak on evidence. (P. J. Taylor
2000, 7)” Some even claim the whole body of research following the world city hypothesis
is merely a neo-Marxist myth (R. G. Smith 2014). For those doing GWC research, lack of
high-quality comparative data is an enduring pain. “Common hypotheses are repeated
rather than tested and most draw upon the assumptions of previous papers. The dominance
of London, New York and Tokyo, for example, is more often asserted than demonstrated.
(Short et al. 1996, 698)” Such situation is caused by two problems.
One, too much attributional data but too little relational data is used15. We need
relational data on the intercity basis, i.e. how and how much these cities are interacting,
commanding, and cooperating with each other, thus forming a world-wide network. Such
data should take GWCs, rather than TNCs, regions, or nation states as points of departure
and destination. Unfortunately, this kind of statistics rarely exist, not to mention being
easily accessible. What abounds is attributional data on the corporate basis, the city basis,
the industry basis, and the territorial state basis. They are readily accessible and easily
15 See (Hoornweg 2011) for a review of often-used indicators in GWC rankings.
17
readable because there is a clear body of responsibility behind each of them to collect and
publish such data. But for intercity relational data, especially those pertaining to GWCs,
there is no direct stakeholder in charge. Therefore, unless scholars in this field miraculously
obtain significantly more resources to collect it, such lack of intercity relational data would
probably persist. (Hoornweg 2011)
Two, even when relational data among GWCs is available, the data validity is often
questionable. They do not always reflect the real or truthful status of the research object
(King, Keohane, and Verba 1994, 25). For example, an often-used indicator for intercity
networks among GWCs is the volumes of air traffic among these cities’ airports (e.g.
Rimmer 1996; Derudder et al. 2008; Derudder and Witlox 2008; Ma and Timberlake 2008)
Such data, although helpful in illustrating the network, is seriously flawed and has limited
referential value. It neither differentiates O&D (origin and destination) flows from
connecting flows16, nor distinguishes first and business class passengers (more likely
related to “command and control functions”) from leisure passengers flying economy class.
At least the statistics that are publicly accessible fail to provide specifications, which are
critical for gaining a truthful picture of intercity flows of higher-level TNC executives.
Taylor’s use of intra-firm intercity statistics is also criticized for failing to accurately reflect
his WCN (R. G. Smith 2014).
1.4.3 “Political deficit”
An enduring “political deficit” (Ancien 2011) has long plagued the GWC research. It
started to receive serious academic amendments only recently. All too often, political
structures of the city “are either taken as a ‘given’, or are ignored altogether”, and we need
to “put politics and government back into the world city agenda” (Ward 1995, 298). This is
16 For example, such data gives disproportional weight to cities with operational hubs of major airlines that
adopt a hub-and-spoke network strategy, e.g. Atlanta (Delta), Dubai (The Emirates), Doha (Qatar
Airways), and Istanbul (Turkish Airlines). Although many of them are GWCs on their own right, their
importance will very likely drop if the aviation factor is excluded.

18
partly because the tacit assumption in GWC research that these cities function in a world-
wide economy transcending national boundaries (therefore uncontrollable by national
governments). In this vein, the territorial state is deemed on the wane, if not becoming
irrelevant at all. This echoes the economism mentality and the “retreat of the state” (Strange
1996) rhetoric in much of the globalization studies (see Ohmae 1996 for a somewhat
extreme version). It rightly acknowledges the challenges the territorial state is facing—
many of which are unprecedented in the history of the modern state. However, this notion
fails to recognize the territorial state’s flexibility and the fact that many underlying
mechanisms of globalization are maintained by the territorial state.
Another possible reason is that GWC research was never fully embraced in the political
science realm. An interdisciplinary creation that brings together political science, economic
geography, sociology and even cultural studies, GWC research does not fully belong to any
of them. Papers on GWC can be found in journals of all these subjects, and from all these
subjects they often carelessly borrow concepts or words. More often than not, a same term
is used differently. Interdisciplinary conversations are confusing, sometimes not on the
same page17. This makes it difficult for its theories to attract sympathy from political
science, or for political scientists to join the discussion. Luckily, we are witnessing more
and more works touching upon the political aspect of GWC (e.g. Brenner 1998; Segbers
2007; G. Clark and Moonen 2017). There has been a wave of efforts to make up the
“political deficit”. However, most of such works are produced by scholars already in the
GWC research (many of them geographers), while political scientists entering the GWC
research are still less-seen (Some rare examples include: Alger 1990; Segbers 2007;
Therborn 2011; Curtis 2008, 2011, 2016b).
17 For example, in GWC research, “deterritorialization” means the process that as a city gets globalized, it is
more connected with the global economy and other global cities, whereas its connections with its national
urban system is weakened, making it “de-coupled” or “detached” from its territorial state (Sassen 1991a,
8; Ma and Timberlake 2013). But in traditional urban studies, “deterritorialization” means the process of
migrant people (for example refugees) getting separated from their cultural roots and original places of
living (Gottdiener and Budd 2005, 19–21). In political science, governing a clearly demarcated “territory”
is a hallmark of the modern state, the concept of “deterritorialization” is hardly comprehensible.

19
1.4.4 Unsettled incorporation into IR studies
Globalization—its origin, dynamics, and effects on nation states and global politics—has
been a flourishing sub-field in IR studies. Non-state actors have also received increasing
attention. Then, the GWC, an important non-state actor, center of command and control of
global economy, has no reason to be absent from the IR radar. It certainly is a component of
the comprehensive national power, and sometimes events in New York, Washington D.C.,
London, or Beijing may cause disruptions in world economic, financial and political orders.
Unfortunately, until now, the IR community has been generally blind to the existence and
relevance of GWC. Efforts to incorporate the GWC into IR discussions have been rare
(Curtis 2011, 2016a, 2016b; Amen et al. 2011; Acuto 2013; Nijman 2016; Herrschel and
Newman 2017), nascent, and yet to enter mainstream IR debates.
This situation cannot be explained away by saying (especially by hardcore Realists) that
IR (international relations) should only be inter-“national”, and that the state is the
legitimate player in world affairs. In fact, it was only after the formation of the Westphalia
system (1648) that nation states took a dominating position. Historically, cities played a
bigger role than states did to organize political and social affairs, drive growth and nurture
scientific and technological innovations. For example, from 13th to 14th century, some cities
in the Baltic and North Sea region formed the Hanseatic League. It is a commercial
confederation made up of cities largely autonomous from their feudal affiliations. They
handled diplomatic affairs by themselves and even maintained their own military force. In
mankind history, there had been cities long before there were states.
In IR theories, tools to incorporate cities have long existed. One perspective is how
domestic politics influence IR, on which abundant research has been done. But they mainly
look at effects of domestic institutions, interest groups, media, public attitudes, etc., before
ultimately returning to the nation’s foreign behavior. So they are still highly state-centric
and rarely analyze the role of the city. How the city influences the nation state’s behavior
on the world stage (“second image”), and how a nation state’s foreign environment
influences the cities within its territory (“second image reversed” (Gourevitch 1978)), is

20
scarcely considered, not to mention how cities across nations are affected by interactions
between these nations (“two-level games” (Putnam 1988)).
Another perspective treats the city as a type of international actor, conducting intercity
diplomacy (Pluijm and Melissen 2007; Nijman 2016) and (actively) coping with governance
challenges induced by globalization in parallel to the territorial state (Acuto 2013). The term
“para-diplomacy” is often used here to describe actions by sub-national governments on the
international stage to promote trade, investment, cooperation, and partnership (Aldecoa and
Keating 1999; Tavares 2016; Kuznetsov 2015). These governments also share authority with
national governments or international governmental organizations to deliver governance or
public goods.
Despite these theoretical tools—among other tools—at hand, the GWC is still largely
absent from the IR horizon. It is disappointing and in fact a loss for IR studies in general,
because GWCs experience the dynamics of world politics and economy in a much higher
intensity and urgency than ordinary cities do. They are also much more visible and
responsible than ordinary cities in confronting issues like climate change, civil movement,
refugee, epidemics, etc. Except for very rare cases, all major events in the media take place
in GWCs or highly-internationalized cities. Just consider, how often do journalists use the
name of a city (Washington D.C., Berlin, Moscow, Beijing, Brussels, etc.) to denote world
powers?18 GWCs have provided and will continue to provide platform for international
politics and economy to play out. The explanatory power of IR theories would be weakened
if such blind spot on GWCs remains.
18 These cities’ names are used because they are the capitals of major international powers, not directly
because they are GWCs (in the concept’s original sense). But in actuality, most (if not all) capital cities of
world powers are at the same time important GWCs. The overlap is wide and apparent.

21
1.5 Basic Arguments and Explaining Variables
“... The combination of spatial dispersal and global integration has created a new
strategic role for major cities (Sassen 1991a, 1)”. As a new form of centrality playing the
“command and control” role in world economy, GWCs are critical joints where influences
from and on multiple scales meet and intertwine. Underlying economic dynamics induce
political adjustments, which could take place either on the national or the local level, or
both. The result depends on how authorities on each level perceive of their best reaction.
Their reactions sometimes agree with, and sometimes contradict each other. Agreements
indicate a mutuality between the territorial state and the GWC, leading to a higher level of
local autonomy and capacity at the GWC, so that locally-targeted measures could be taken
to benefit both the city and the nation. Contradiction leads to a need of negotiation or
struggle between the two levels that would also lead to a change (or not) in local autonomy.
Basing on current explanations on GWC and on local/city autonomy, independent
variables are to be selected. Since we are interested in GWCs in major emerging economies
in globalization, variables should reflect two salient characteristics: the dynamics of GWC
formation and the situations territorial states face in globalization. Methodologically, we
must ensure variables offer a contrast in value across cases, so that it is possible to establish
the effect of a study variable (Gerring 2007, 97–101).
In this thesis, three variables are selected: level of the national economy’s integration
into world economy, intercity competition from neighboring GWCs, and concentration of a
territorial state’s foreign economy in a GWC. Many studies, both those on GWC and those
on local autonomy in general, have alluded to the effects of the said factors on the
autonomy and capacity level of a locality, but except for very few researches (e.g. G. Clark
and Moonen 2017), these factors have not been fully explored and discussed in GWC
researches.
The following part briefly introduces the three independent variables and corresponding
hypotheses. Afterwards, I explain why this study is relevant.

22
1.5.1 IV1: Global integration of the national economy
As a central theorem in both the world city hypothesis and the global city model,
articulating national economy with world economy is one of the fundamental functions of
a GWC. After all, the global economy is still made up of some two hundred national
economies. Although they participate in globalization to different degrees, they remain
one of the fundamental—and occasionally the only19—lens to study world economy.
When we speak of globalization and global economy, it is impossible to ignore territorial
states. The performance of some major economies (or disputes/conflicts between major
economies) can potentially disrupt or uphold world economy—this is seldom said of any
single company or organization.
Developing economies of China, India and Vietnam are integrating into the world
economy at a fast pace. GWCs found in these countries are mostly secondary ones below
full-fledged GWCs in the Global North. Their spheres of influence are more national and
regional than global, meaning they function more as a gateway for various flows through
their territorial state and region, as well as TNCs’ basing points of controlling and
commanding that area. For these cities, “their relative importance for international capital
depends very much on the strength and vitality of the national economy which these cities
articulate (Friedmann 1986, 71).” Since their national economy is part of the world
economy, then articulating the national economy is essentially a part of articulating world
economy (Ma and Timberlake 2013).
This creates a mutuality of interest between the GWC and its territorial state.
Therefore, it is hypothesized here that the more globally integrated a national economy is,
it is more likely that its GWC would have a higher level of autonomy.
19 For example, “World Development Indicators” (WDI), a highly helpful and welcome dataset maintained by
the World Bank, still categorizes data items on a national basis.
< https://datacatalog.worldbank.org/dataset/world-development-indicators>, last access May 29, 2019.

23
1.5.2 IV2: Intercity competition from neighboring GWCs
It is widely acknowledged that cities compete with each other. Cities use a variety of policy
tools from low entrance barriers to tax cuts to attract investment and specialists (Begg 1999;
Camagni 2002a). A city left behind in competition or fails to be “competitive” would miss
opportunities and eventually, its economy would stagnate or even deteriorate (this is more
so in a highly mobile world where all factors of production are freer to relocate). All would
in the end take a toll on its own economic and societal well-being. For a GWC, it means
losing central control functions to other GWCs (R. Lee and Schmidt-Marwede 1993).
Emerging GWCs in China, India and Vietnam function more on a regional scale,
articulating mostly their territorial state’s and their region’s economic activities. With
continuous growth, GWCs in the same country or region would inevitably find themselves
striving for the same kinds of business. This motivates them to adopt individualized
measures tailored to the local context and capable of enhancing local advantages. Many of
the measures require additional resources—political or financial. These resources can be
obtained either by devolution from above or by activeness from below. In the end they are
all reflected in a heightened level of local autonomy.
Regionally (above national and below global) speaking, developing countries,
especially those in similar positions in NIDL, also compete for the similar kinds of
investment and market. In order for investments to be carried out and markets to open, TNC
facilitations and advanced producer services are required. They are primarily found in
GWCs. In this sense, a successful GWC not only articulates a national economy, but also
determines whether that national economy can distinguish itself from its neighbors, get hold
of more resources and achieve a higher level of development. Therefore, to aid its
champion GWC’s growth become a viable and even desirable solution for aspiring
developing countries.
Here, we find a potential mutuality of interest between the territorial state and its GWC,
and expect a higher level of GWC autonomy, if competition intensifies in a GWC’s
neighborhood.

24
1.5.3 IV3: Concentration of the territorial state’s foreign economy in a GWC
A large proportion of TNCs, together with advanced service sectors, are clustered in
GWCs. They generate and command a variety of flows. Flows constitute their own space, a
space not necessarily coterminous with any territorial state (which has a defined
geographical boundary) or TNC. GWCs, as central nodes in the network, usually conduct a
substantial part of the flows, compared to “ordinary cities” in the national urban system
(Borja et al. 1997; Castells 2010). In this sense, GWCs gain importance in their territorial
state as “flow conductors” or “flow processors”. A large part of “flows” pertaining to
economic functions and prosperity of a territorial state go through there; it also gains
importance in the world network of cities, with its role of channeling “flows” between a
national economy and the globe. If the territorial state concerns itself with these flows (in
our research they all do), and if global capital concern itself with those territorial states (in
our research it is), flow-conducting GWCs in these territorial states are required and should
be strengthened.
In a more traditional view, cities themselves derive importance from their own size and
concentration of people, assets, knowledge, and information. Even without much
connections elsewhere, a large, thriving metropolis is still a national government’s treasure
in its own right. The more resources and activities of a territorial state are clustered in that
metropolis, its weight in the eye of the central ruler is heavier, therefore it is more likely to
gain privileges and favorable treatment.
Here, we posit the territorial state – GWC mutuality trumps their contradiction,
especially when the former aims to utilize the GWC to propel overall national growth.
Therefore, a higher or lower concentration level of a territorial state’s foreign economy in a
GWC should induce that territorial state and the city itself to make room for larger local
autonomy.
The three independent variables are conceptualized and operationalized in detailed in
Chapter 3. This selection moves beyond the orthodox approach that treats local autonomy
only from a domestic point of view (which has become insufficient), and expands the

25
horizon to non-domestic factors. GWCs simultaneously connect and face pressures from the
national, regional (above national and below global), and global levels. The territorial state,
besides coping with domestic demands, also has to respond to ramifications of
globalization. IV1 (the territorial economy’s global integration) reflects forces on the global
scale; IV2 (neighborhood competition) reflects forces from the regional scale; and IV3
(concentration of foreign economy in a GWC) reflects factors on a national scale.
1.6 Relevance of the research
Being a research connecting political science and GWC, my original contribution is
threefold.
First and foremost, I bring two new insights into a GWC’s relations with its territorial
state. One, I place the relation in a more specific context, rather than in a generalized global
or domestic framework. In the past decade, GWC researches have largely adopted a
relational or network approach (albeit data problems), stressing how those cities derive their
importance from their positions in the network (Alderson and Beckfield 2004; Jonathan V.
Beaverstock, Smith, and Taylor 2000; D. A. Smith and Timberlake 2001). I knowingly
disregard this kind of power, which has already received extensive attention. Instead, I look
at different scales or levels relevant to a GWC. Each GWC, besides being linked with other
global cities, is also dependent on its position in national economy, in regional interurban
dynamics, as well as its national economy’s position in globalization. These factors
profoundly affect urban politics and inter-governmental interactions—how the city
globalizes, how it negotiates or struggles with its territorial state. They certainly deserve
more scholarly attention. Loosely said, it is such numerous instances of “actually existing
neoliberalism” (Brenner and Theodore 2002) that make up the grand picture of global
economy. Each city is unique in its location, history, socio- and economic background, and
domestic status. Although it is helpful and necessary to generalize, cities also deserve to be
investigated individually and more closely.

26
Two, instead of studying how the city’s level of autonomy or “activeness”, affects its
GWC capabilities and prospects, I follow the reverse direction and inquire whether a
GWC’s autonomy level, or its local momentum vis-à-vis national authority, is affected by
globalization. I think this is a helpful contribution to the current GWC discourse, which has
just begun to unravel the intricacies between GWC and territorial states (e.g. Tsukamoto
and Vogel 2007; G. Clark and Moonen 2017). Secondly, by investigating central-local
intergovernmental relations, my work attempts to bring to the GWC research a political
science perspective. Scholars have pointed out that urban studies have been marginalized
from mainstream political science (Judd 2005), and that there has been a “political deficit”
to overcome, especially in GWC studies (see §1.4.3), which “produces a very limited
understanding of the processes and conditions that underlie, enable and constrain the
production and reproduction of global cities” (Ancien 2011, 2477). I wish to increase our
understanding of these dynamics by studying some rising GWCs and their inter-
governmental relations.
Given that the GWC concept evolves around discussions of globalization and its
implications, emphasis has been dominantly placed on economic factors, stressing the city’s
role of “commanding and controlling” world economy. Sassen’s global city model
highlights clustering of advanced producer services that facilitate TNCs’ highly complex
global productions. It is concerned more with “practice of global control” (Sassen 1991a, 6,
original emphasis) than with the city itself, where those practices take place, not to mention
the territorial state behind the city20. Friedmann and Wolff envision the world city as
geographical emanations of the command posts of the capitalist world economy especially
against the NIDL background, their effort is to demonstrate an alternative centrality of
world economy, rather than replicating a world map of nations or in-depth examination of
certain cities. The political perspective in their discussions has been relatively weak. Even
weaker is the treatment of central-local intergovernmental relations. Sassen predicted a
“systematic discontinuity” between global city growth and its national economy (Sassen
1991a, 8), but she did not go deeper on how such “discontinuity” would affect the city’s
20 Although Sassen does acknowledge the territorial state’s importance in the formation of Tokyo as a global
city.

27
status vs. its central government. Just a few scholars (Brenner 1998; P. J. Taylor 2007)
made theoretical endeavors to incorporate GWC formation into state theory. Hill and Kim
(2000) also made an attempt to bring the territorial state into the debate, but only as an
additional type of GWC formation, rather than a generic argument that can be widely
applied and tested. In this study, by studying the GWC’s local autonomy level, the
territorial state is brought back in, which I hope would further the understanding of how
GWCs and territorial states behave in globalization.
Lastly, my work adds to the ongoing efforts of extending GWC research into
developing economies. Theoretically, neither the global city or the world city
conceptualization is exclusive of cities in the Global South. GWCs carry out management
and coordination functions of world economy—much of which take place in the
increasingly internationalizing less-developed world. A central assumption of Sassen’s
global city concept is the geographical dispersal of economic activities. Obviously,
developing economies are a major frontier of such dispersal, and stronger “command and
control” functions are needed for such dispersal. The world city hypothesis, in line with
Wallerstein’s world-systems theory (Wallerstein 1979), puts developing economies in
either the “semi-peripheral” or the “peripheral” zone in the world capitalist system, and
treats them as territorial bases for semi-peripheral world cities. This leaves the door open
for developing countries. If a semi-peripheral region intensifies its connection with the core
and the peripheral regions, or strengthens its own economic might, it naturally demands a
stronger “world city”. Similarly, if a periphery region integrates more deeply into world
economy or rises to a higher rank, a suitable “world city” articulating that region is also
needed.
Sadly, neither the global city or the world city approach has a historical interest in the
developing world21. All prototype GWCs like New York, London, Tokyo, Paris etc. are
located in highly developed economies, or “cores” of the world-system. Cities in
developing economies, despite fast ascent, seldom receive in-depth treatment until recently.
21 Friedmann shifted his interest toward the restructuring of the state about ten years after formulating the
world city hypothesis (Friedmann 1996, 128).

28
This is understandable because studying model cases helps theory-building, yet it is
insufficient because a theory needs to be continuously applied to and tested on not-so-
typical cases. Globalization has brought profound changes to world economy and GWCs.
Old hierarchies are reshuffling. Some formerly critical cities are losing relevance; some
formerly insignificant cities are gaining attention; and some cities who successfully
intensified links with new frontiers are retaining their position. Therefore, it is increasingly
imperative to include more cities into GWC research. Some early works have been
produced (Hill and Kim 2000; Olds and Yeung 2004; Gugler 2004; Segbers 2007, etc). My
work is dedicated to this continuous effort. Furthermore, China and India are two giant
countries on a scale of their own, (re-)emerging at a fast pace, meaningfully changing the
world economic pattern (Winters and Yusuf 2007; Sankhe, Vittal, and Mohan 2011).
Vietnam, on the other hand, represents a vibrant ASEAN with a considerable population
and market size. It is therefore even more compelling to comprehend their leading GWCs.
(Friedmann 1996)

29
Chapter 2: Theoretical framework
This research tries to explain why leading GWCs in major emerging economies have
acquired very different levels of local (city) autonomy. It focuses on the world’s largest two
developing countries, China and India, as well as a fast-ascending ASEAN country of
Vietnam. In this sense, this research is naturally related to the general scholarship of
globalization. More specifically, by comparing case countries’ leading international cities,
or GWCs, it is situated in GWC research, which has drawn increasing attention since the
1990s—approximately when China, India and Vietnam engaged in or renewed major
liberalization reforms to further integrate into the world economy. The GWC is starting to
manifest their role as a new form of centrality in globalization. This analysis is to unravel
pressures on both the territorial state and the GWC. The international, regional, and national
levels are studied individually.
This chapter establishes the theoretical framework of the dissertation. As said above,
given the hybrid nature of the GWC scholarship and the complexity of political- and
economic- changes induced by globalization, it is unnecessary and infeasible to stick to a
single overarching theory. Although frequently referring to seminal GWC works, especially
those by Friedmann and Sassen, I try not to be confined by them and resort to other
theoretical inspirations when needed. For example, I also borrow from Taylor’s thoughts on
state-city relations (P. J. Taylor 1995, 2000), Brenner’s ideas on re-scaling of the territorial
state (Brenner 1998, 2004), etc. Clark and Moonen’s work on GWC-state relations (2017)
are also highly relevant here. The explanation is by no means intended to be conclusive or
exhaustive. Rather, it is an attempt at further understanding of the diverse external pressures
of globalization upon the territorial state and the GWC.

30
2.1 The territorial state and the GWC
In urban studies, the importance of cities for economic growth has long been widely
acknowledged and empirically supported (see Polèse 2005 for a review). Jane Jacobs, a
pioneering urban scholar, refers to the city as “primary economic organs” (Jacobs 1970, 6).
It is suggested that the nation state should treat their central cities more as “wealth of
nations” (Jacobs 1984), instead of merely a branch of the administrative organization, or a
force of decentralization working against central authority. Cities concretely carry out many
state functions and are the immediate interface between the territorial state and (the
majority of) its people. It is even more so in GWCs. GWCs do not simply “hollow out”
nation states by hosting forces that may appear unruly to territorial states, they are also
coherent parts of the national politics, economy, and society. They are places where a
considerable part of the population lives and dies, and platforms where much of the
territorial state’s functions take place.
National interests of the territorial state where a particular GWC is situated are
simultaneously compatible with and opposed to the interests of TNCs—principals of
world economy. This grants GWC (where most TNCs operate from) dual but
contradictory roles, “as they are integrated along both functional and territorial lines”
(Friedmann and Wolff 1982: 329). The functional line is controlling the capitalist world
production and market expansion; the territorial line is to serve national welfare and
articulate their national economy with world economy.
Therefore, there is a possibility of systemic discontinuity between national prosperity
and GWC formation in that national economy. Factors that stimulate growth in one may
not stimulate growth in the other (Sassen 2001: 8-9). In the meantime, GWCs articulate
national economy with world markets. The bulking-up and internationalization of
national economy also enhances that GWC’s status. So there are instances that both sides
share prospects and cross-benefit.
This contradiction is more evident in young globalizing cities, especially those in
emerging economies like China, India and Vietnam, where national economies are
transitioning from peripheral to semi-peripheral positions, in parallel with global forces
31
penetrating into these previously less-integrated areas—areas where huge potentials are
waiting to be unlocked. The two trends combine to make GWCs in emerging economies
unique cases with high academic value: transitions are faster and more drastic in these
cities.
In addition to commanding and controlling world economy, GWCs also face non-
economic restrictions on multiple dimensions. It is important to draw a distinction
between a GWC’s power in the geographically dispersed world economy, and the city’s
power as a branch of its territorial state’s administrative organ. The most powerful GWCs
including New York, London, and Tokyo are not always municipalities with the strongest
administrative power in their territorial states. Economic might is not fully translatable
into domestic political influence or financial resources. In many cases, a GWC’s urban
sprawl is not even coterminous with its jurisdictional boundary. Collaborations with
neighboring towns and higher tiers of governments are needed and sometimes necessary
(e.g. for global city-regions). More often than not, the bigger and more influential a city
becomes, its governance difficulties and challenges intensify too, demanding changes or
innovations in its external relations.
Practically, city governments are able to use special decrees, regulations or public
spending as incentives to attract capital, talents, events, etc. to encourage local growth.
However, bounded in a territorial state, room for a city to do so is limited and must be
negotiated with political bodies with superior and additional resources, namely the
national government. Luckily for a GWC, its function of articulating national economy is
important not only for TNCs and world economy, but also catches its territorial state’s
interest in stimulating overall national growth and strengthening state power. In this way,
the GWC is a component of comprehensive national power. It is hard to envision the U.S.,
without New York as its economic and financial center, to wield the same level of
authority in world economy; or the U.K. without London, or Japan without Tokyo. This
point has been quite often ignored since most discussions situate the GWC in a network of
global cities, diminishing the national dimension. But Friedmann and Wolff have long
pointed out that in order to make the world safer for footloose capital, GWCs also
articulate given national economies with world economy (1982: 312)—suggesting the

32
world city is in the meantime an asset for the nation, if that nation is to benefit from
participation in world economy.
Figure 2.1: Theoretical Structure
Source: author.
2.2 The territorial state in globalization
“GWC formation cannot be adequately understood without an examination of the matrices
of state territorial organization within and through which it occurs. (Brenner 1998, 27)”
Although some hyper-globalists allege the territorial state is no longer relevant in
globalization, the reality is the contrary. Well into the 2010s, the territorial state not only
persists, but also remains a critical category of actor and shaper of the world order. A more
balanced and realistic assessment should be that the territorial state is under profound self-
restructuring and self-reinvention (Brenner 1998, 2004), to counter the complex and ever-
changing dynamics of globalization. The self-restructuring and -reinvention are sometimes
pro-actively taken by the territorial state with a relatively sensible assessment and goals in
mind, but perhaps more often passively taken to adapt to changes, without a complete,
thorough understanding of the situation. Whether the responds are pro-actively or passively
taken is determined by various factors and their countless combinations, and can only be

33
fully appreciated on a case-by-case basis. However, economic factors should never be
ignored, because economic stability and prosperity directly affects the quality of national
power, people’s attitude towards the government and eventually the stability of polity.
With the exception of very few autarkic countries, most countries in the world have
become a part of globalization, finding their positions in various world commodity chains.
This process is fundamentally determined by the intrinsic logic of world capitalism, i.e. to
ceaselessly maximize profit. To do so, ever more labor, resources, and markets must be
found, accessed, and exploited. In this process, some territorial states are partial enablers
with a self-implemented strategy to actively take advantage of globalization and strengthen
their national economic (and further) powers. This strategy is most evident in the Asian
“developmental states” (Hill and Kim 2000; Saito 2003; Olds and Yeung 2004). First in
Japan, then adopted by an array of East- and Southeast Asian economies including South
Korea, Singapore, and Taiwan, such strategy places great emphasis on the national
authority’s role in identifying a “right” path and enhance its national comparative and
competitive advantages. Policies and measures are specifically—sometimes aggressively—
taken for that goal. With a combination of political will and organizing power of the
territorial state, these formerly less-developed areas have successfully jumped to a higher
level of development, and their overall power expanded vastly (see Coe, Kelly, and Yeung
2013, 104–5).
The tenet of the “developmental state” model is to use national political power and
economic organs to facilitate and stimulate growth, which eventually translates into more
general prosperity and stronger national power. Although it is not identified in every
country, or specifically labeled as a national strategy, its underlying reasoning find wide
sympathy across the Global South, including massive emerging economies like China,
India, as well as the mid-sized Vietnam.
However, the other side of the coin is, with deepening involvement in world economy,
the territorial state’s power is being eroded by the market forces that it invites and a
stronger society that feeds on the market (Strange 2004). The territorial state inevitably tries
to stay in control. Some functions are kept by the state and even bolstered, some are

34
transferred to international organizations and institutions, and some are devolved to sub-
national actors like the city. It is important to understand that those transferred power do not
disappear. Rather, they are relocated from the territorial state to other bodies to execute.
Fundamentally, such transfers are temporary and subject to the territorial state’s ratification.
The territorial state can withdraw such power when absolutely necessary, although at
considerable costs. What one witnesses in this process is a reshuffling of functions and
responsibilities of the territorial state. Innovative forms and arrangements are improvised. It
is in this sense that the territorial state is in a process of “restructuring” and “re-invention”.
The gist is: all territorial states strive to cling on to ultimate sovereignty over its
territory. Profound economic and social changes have made many of its previous functions
harder and costlier to maintain, while emerging challenges are pressing for new functions.
The way they protect their sovereignty is in need of change. Such need is arguably more
compelling for less-developed countries, whose overall state capacity is relatively weaker
than developed societies with a robust governance system. On the one hand, they struggle
to reap benefits from globalization and to spur economic prosperity, for which multiple
strategies, including the developmental state model, are adopted. On the other hand, such
process brings various challenges, and a profound restructuring of state functions are being
carried out, either pro-actively or passively. Because of the power reshuffling, new
centralities of power emerge, including supra-national organizations and institutions, and
sub-national entities. Among the sub-national entities, the GWC is of special importance. It
is an emerging form of centrality encased within the territorial state.
2.3 The GWC in globalization
GWCs are where the “command and control” functions of the world economy are
performed (Sassen 1991a; Friedmann and Wolff 1982; Friedmann 1986). Aided by
breakthroughs in telecommunication and transportation technologies, economic activities
are more widely dispersed, embracing farther territories into global circuits. To ensure
effective and efficient functioning of the TNCs that have now been engaged in more places
and markets, enhanced central command and control are required.

35
It is in this sense that GWCs play a significant role in the globalizing world economy. It
is also in this sense that GWCs are considered a form of “centrality” in world economy,
because the majority of TNCs are located in these cities, the majority of decisions—big or
small—are made and sent out from these cities. With TNCs’ global explorations, these
cities are also increasingly connected to farther frontiers and to each other, constituting a
coherent and highly mutually-dependent network of cities (WCN) (P. J. Taylor 2004).
Moreover, some cities take on important political, social and cultural roles. These forms
of activities also require global connections. Cities like New York, London and Paris,
besides being economic giants, also seat prominent international organizations—adding to
their clout. Smaller cities like Washington D.C., Geneva and Brussels also appear on the
GWC map because of their political weight.
What follows is that many (if not most) world-shaping events take place in GWCs.
Such intense clustering of activities attracts—and are meanwhile enabled by—an extensive
pool of diverse, affluent, well-educated specialists. These people further add to the
dynamics and diversity of the city, giving the city a unique international metropolitan
atmosphere.
“The global city generates extreme needs. (Sassen 2016, 98)”. To accommodate these
talents, many basic service laborers (incl. public hygiene, household maintenance, public
transportations, logistics) are also recruited. These basic laborers’ income level and living
conditions contrast sharply with their clients, creating a gap in welfare and living
expectations. “The global city generates a sharp rise in the demand for both high-level
talent and masses of low-wage workers. (Sassen 2016, 98)” One may identify “dual-service
sectors” in one GWC (Abrahamson 2004, 99–100). In the end, the two groups may find
themselves experiencing two completely different urban lives, even though they reside in
the same GWC. Surely such gap and the tension it generates are not peculiar to the GWC,
yet it is in GWCs that they are most striking and risk-prone.
Increased movement and relocation of people is a major feature of a territorial state’s
internationalization, and globalization of the world as a whole. Such flows are often
disproportionately concentrated in a few central cities, or GWCs. “World cities are points of
36
destination for large numbers of both domestic and/or international migrants (Friedmann
1986, 75)”, this may create unique challenges and requires new measures of inclusion and
governance at the local level (Gross 2007). Such challenges are seldom experienced as
much by ordinary cities in the same country.
Altogether, in addition to being a form of centrality in world capitalism, the GWC also
faces unique challenges—some of which may undermine the political or economic
mechanisms predating them—and potential social costs caused by the rich-poor, local-
foreign splits. These are problems no GWC could avoid.
2.4 Mutuality between GWC and territorial state
At the most basic level, the mutuality between GWCs and territorial states is the
“accumulation of capital as a taxable resource for the state in return for the provision of
basic physical security for the city and its capitalists.” (P. J. Taylor 1995, 49). It is the
minimal sense that GWCs (or more generally, all cities) and territorial states need each
other.
To survive and grow, the territorial state financially depends on a solid taxable base.
Such base consists of not only domestic actors and activities, but also foreign actors
operating within its territory, and domestic actors with overseas operations. The more
energetic these activities are, the more revenue the territorial state can accrue, and the more
resources are at its disposal. Nowadays, most of such activities are found in cities. Even in
developing countries like China, India and Vietnam, urbanization has become a salient
economic and social trend (see Figure 2.2). Resources and human activities are increasingly
concentrated in urban areas. A largely balanced and prosperous urban system (including
GWCs in it) is self-evidently in the interest of the territorial state.
On the other hand, for cities to thrive, some indispensable basic services and conditions
are sustained mainly by the territorial state, including national security, diplomacy,
nationwide infrastructure, and most importantly, a stable and vital national economy and

37
society. Even the most prominent cities in modern times meaningfully depend on their
territorial states in various aspects. Needless to say, state policies affect cities in both direct
and indirect ways. Most cities are first and foremost part of their national urban system,
before catering to overseas functions. A coherent, strong national economy is an advantage
for cities to flourish. Some international or regional arrangements with urban effects are
also made by territorial states, rather than by cities themselves. These include free trade
agreements, visa policies, tariff settlements, etc.
Figure 2.2 China’s, India’s and Vietnam’s Urbanization Rates, 1994-2017
Source: World Development Indicators, World Bank.
In this sense, both the territorial state and the GWC are crucial to each other. This form
of mutuality can be traced back to at least the start of the nation state as the primary
component of the international system, or the “nationalization of territoriality” (P. J. Taylor
1995, 54–55). Although globalization caused a relative decrease of the territorial state’s
irreplaceability in organizing political and economic affairs, it does not declare the
outdated-ness of the territorial state. Rather, it means understanding and navigating our
world solely through the national lens has become insufficient and sometimes misleading.
Highly mobile capital flowing across countries and the people, goods, information flows it
enables are making territorial boundaries more permeable, sensitive and vulnerable to the
volatility of world trade and finance. Essentially, it means states are releasing some of their
power to the world capitalist system, a system organized not around nation-states and has
0
10
20
30
40
50
60
70
1994
1995
1996
1997
1998
1999
2000
2001
2002
2003
2004
2005
2006
2007
2008
2009
2010
2011
2012
2013
2014
2015
2016
2017
China India Vietnam

38
its own working logic. To fully grasp the picture, more scales (sub-national, supra-national,
global), mechanisms (between companies, between sub-national units, between individuals,
non-governmental, etc.) and organizing centralities (organizations, online platforms,
religions, etc.) should be taken into consideration.
The global/world city (GWC) is one of the new forms of centrality deserving closer
investigation—not only because they constitute a unique form of centrality in their own
right, but also because an array of other centralities is situated in and depend on GWCs.
The term “global/world city” should not be taken at face value and assume they are
equally “global”. Some have farther global reach, while others less so. Some young GWCs
merely have relatively more international connections than its domestic peers. GWCs’
different levels of globalizing form a “hierarchy” of global cities (Derudder et al. 2003; D.
A. Smith and Timberlake 2001). However, despite this hierarchy, each and every GWC is
embedded in a specific territorial state and therefore highly shaped by and depend on its
national political, social, cultural and geographical environment22. Indeed, globalization has
a unifying power and has made GWCs more like each other, yet each GWC still and will
always retain strong idiosyncrasies of itself and its territorial state, which are not found
elsewhere. The territorial state has left a permanent mark on each GWC.
With their global reach, GWCs help their territorial states connect with the globalizing
world economy, and in return, help the latter tap a specific country or region for new
resources and markets. In this way, GWCs “articulate” their national economies with world
economy (Friedmann 1986). On the other hand, the stronger the national economy a GWC
articulates, the more “turf”, or larger market that GWC represents. It means more profits in
the eye of capital. This GWC therefore gains attraction and stands out in the GWC network.
22 There is a special type of GWC whose geographical span is coterminous with the territorial state that holds
it, for example Singapore and Hong Kong, SAR. In this case the GWC is the territorial state itself.
Although Hong Kong is under the Chinese sovereignty, it retains a distinct executive and judicial system,
and is usually treated separately from Chinese mainland. However, this is a very rare kind. Most GWCs
are located in a territorial state that is much larger and contains other cities (see G. Clark and Moonen
2017, 11).

39
In this sense, there is a tendency of common ascent and decline between the GWC and its
national economy (P. J. Taylor 1995). Most full-fledged GWCs (New York, Tokyo,
London, etc.) have either a vast or a thriving economy behind its back. The success of Hong
Kong and Singapore is also due to their capability of openly articulating a larger regional
(East- and Southeast Asia) economy. They actually take pride in their role of connecting the
vast East- and Southeast Asian markets with the world. It is hard—and strange—to envision
a prominent GWC solely operating on its own, serving only overseas economic activities.
This mutuality necessitates the territorial state giving its GWC certain preferential
treatment—ones with national implications and ones locally-targeted. In reality, such
responds can be seen worldwide. Even top-level GWCs like Tokyo has benefited from a
variety of aids and supports from the Japanese government (Sassen 1991a; Hill and Kim
2000; Saito 2003). Spurring own GWCs would bring national economy competitive
advantages in the global economy. Likewise, a GWC is not expected to (and should not)
adopt measures that would downright undermine its national welfare in the long run. Unless
with compelling reasons, neither should pursue policies that directly contradict the interests
of the other, as that would eventually turn out to be self-defeating.
2.5 Contradictions between GWC and territorial state
The deepening and expansion of globalization also bring changes to the happy mutuality
between the territorial state and its GWC. The “waning” of the nation-state has become a
major theory strand of globalization research (see Held and McGrew 2003). People argue
the territorial state is no longer as coherent as before, and has to relinquish some of its
power and negotiate with the market, the society, and other forms of actors on multiple
levels (Strange 2004). Statecraft is less centered and more pervasive, involving new
elements and begging integration with additional actors. Such situation can be better
understood without the taken-for-granted view of a coherent statehood. No state, however
centralized, authoritarian, or well-organized it may be, can be governed in a perfectly
homogeneous manner—not to mention in the modern world, the majority of states have
initiated certain forms of decentralization. The waning of Keynesian economy and the
40
ascent of neo-liberalism mindsets call for less government intervention and more market
freedom. Territorial states are at pains to treat its sub-divisions the same way, i.e. simply as
bureaucratic agents truthfully, routinely and unimaginatively carrying out orders.
Fundamentally, this is a contradiction of interests on different levels. Globalization
itself, as a supra-national structure and process, needs infrastructure and regulations on
various levels. Supra-nationally, there are IOs dedicated to international trade, finance,
transportation and telecommunication. But they can only partly solve disputes and provide
public goods. Nationally, territorial states still play significant roles. Of equal importance is
the wide varieties of functions carried out sub-nationally, or on the local level of
government—in most cases cities. It is in cities that the abstract notion and grand rhetoric
of globalization become concrete and actualize on the ground (Sassen 2000b). Goods are
manufactured, sold and bought; resources are traded, transported and used; services are
demanded, provided, and enjoyed. These activities—activities that actually constitute
globalization—are mostly taking place in cities, especially GWCs. For these to happen,
basic infrastructures, social security, and public services are must-have. They are either
provided by the territorial state through local authority, or directly by the local authority.
In this process, nations, used to be the relevant level of analysis, no longer manifest
themselves solely in old-fashioned ways. Rather, some powers are lent upwards to
international arrangements and downwards to sub-national authorities—levels the state
cannot fully control. Supra-national arrangements like WTO, World Bank, ASEAN, the
European Union, etc., and private organizations and actors are not the focus of this study—
although their relevance cannot be emphasized enough. Here we are only interested in one
sub-national actor—the city.
Cities have identities and interests of their own. They react to globalization differently
than territorial states. The same as a territorial state, cities may choose to embrace, resist, or
cautiously accept globalization. The actual response is highly shaped by their unique
history, culture, and socio-economic heritages. A reserved or isolated city usually resists
changes and evades challenges brought by globalization; an outward and highly developed
city would understandably be more sensitive and active in seizing or creating opportunities.

41
Globalization treats different parts of a territorial state differently. A special kind of
city, GWCs are where globalization is most instantly experienced and directly processed—
much more so than other parts of the same country. The territorial state’s considerations are
not always in line with the interest of a GWC, because state territory stretches far beyond. It
must keep the overall balance and growth of the national economy in mind when devising
policy and introducing regulations. In other words, the state cares not only about its GWC,
and it cannot afford so, no matter how important that GWC is.
This makes the state’s and the GWC’s attitudes and policies toward globalization often
contradictory. They may pursue conflicting agendas when chasing after footloose capital
and addressing ramifications of globalization. For examples, financial sectors of a GWC
demand less regulations and easier access, so that capital can enjoy greater flexibility. But
for a territorial state, a barrier-free financial market and unchecked flow of capital put the
national monetary stability at the risk of unexpected volatility (e.g. Thailand in the 1998
Financial Crises). If cross-boundary flows are not handled timely and properly, national
economic stability and even government credibility would be put in danger. The territorial
state would understandably seek to retain—if not to enhance—its control of flows through
its boundary. This is apparently not in the best interest of GWC growth. Here, a dilemma
between the territorial state and the GWC is obvious: each, as a scale of their own, responds
to globalization differently, and produces policies and strategies that are often incompatible
to each other.
At the same time, GWCs obtained additional leverage vis-a-vis the state from their
position in globalization and its professionalism with international economy. They are no
longer in the same position as other ordinary cities in the national urban system. Rather,
they acquired certain “power” of connecting, negotiating, and cooperating with world
capital, and with other cities, TNCs, and actors. With this “power”, and to sustain such
power, GWCs generate special demands—demands tailored to its own needs. This “power”
lends GWCs a stronger voice on the national level: they are serious players internationally,
important to the national economy, therefore their needs should be given careful
consideration, even though catering to these needs sometimes contradicts national plans.

42
Moreover, besides positive effects like connecting national hinterland with global
economy, GWCs also bring negative externalities to its territorial state. These include
within-country brain drain from ordinary cities to the few GWCs, over-concentration of
financial, and industrial assets in the GWC at the expense of other regions, high exposure to
fluctuation on the world markets that may cause national disturbances, etc. (G. Clark and
Moonen 2017, 227–29). These are not necessarily due to divergent interests between the
territorial state and the GWC, but they do exist and cause troubles. This need to be squarely
confronted by both the territorial state and the GWC together.
2.6 Mutuality or contradiction?
What follows the mutuality and contradiction scenarios is in effect a reshuffling of the
territorial state’s old-fashioned hierarchy of control. What was supposed to be a coherent
alignment of the local scales under and within the national scale is challenged by the
capitalist world economy’s global expansion and its implications on the territorial states and
bodies within them. The top-down alignment of international→national→local needs
revision and expansion. A parallel global/international→local channel is taking shape. The
more globalized a GWC and a national economy is, the faster a GWC and its territorial state
is internationalizing, it is more so.
Clark and Moonen (2017) provide a very helpful categorization on scenarios of
territorial state—GWC relations (see figure below). It describes “successful” relationships
between the two, or how the two sides may find mutuality. However, what they missed is
the possibility of contradiction. I argue here, that between the territorial state and the GWC,
two kinds of relations are both possible: mutuality and contradiction. When the two’s
interests are identical or compatible, or the well-being of one reinforces the well-being of
the other, a mutuality is found. In this case, the territorial state would accept a more locally
autonomous GWC. On the other hand, when the two have different, incompatible, and even
conflicting objectives, and the further growing in one undermines the other, a contradiction
is formed. In this case, the territorial state would be less inclined to accept a more locally
autonomous GWC. When the territorial state finds more mutuality with the GWC, more

43
power is likely to be obtained by the latter—leading to higher local autonomy. When the
territorial state finds more contradiction than mutuality with the GWC, the latter is less
likely to obtain higher autonomy.
Figure 2.3 Four successful relations between national government and world city
Source: G. Clark and Moonen 2017, 8.
It should be clear by now that whether the territorial state and the GWC could come to
an agreement on more local autonomy depends on pressures from globalization they face,
and how they perceive their responses to be. They are both essential for the other, yet
employ partially different reasoning. “World cities and nation states appear to address
development problems more effectively when there is a culture of partnership rather than
partition between them. (G. Clark and Moonen 2017, 238)” More autonomy at the local
GWC is a reflection of “partnership”, in which the central authority entrusts its GWCs with
more tasks and functions. Whether that would happen depends on the convergence or
divergence of interests between the territorial state and the GWC. Which are more relevant
for them, and which are not? Where do they find more mutuality than contradiction, and
where do they find more contradiction than mutuality? That is what the rest of the
dissertation tries to answer.

44
Chapter 3: Variables and methodology
This chapter explains variables identified and methodology applied in this dissertation, as a
road-map of the research. First, the dependent (DV) and independent variables (IVs) are
conceptualized and operationalized. Afterwards, I briefly explain case selection criteria,
principles for Small-N studies, and time scope of observation. The chapter is wrapped up
with an introduction to data sources used.
3.1 Dependent variable: Local autonomy level of GWC
GWC is a concept studied more in economic geography and sociology than in political
science; while the level of autonomy is more often discussed in political science. To talk
about a GWC’s autonomy is in essence to talk about local autonomy of a municipal
government in a territorial state. It is also closely connected with the concept of
decentralization, as without some form of decentralization of power, there would exist little
local autonomy, in a modern territorial state.
For Shanghai and HCMC, municipalities directly responsible to central authority,
autonomy is decided between the city and the top government. An observation of two
domestic levels is sufficient. In Mumbai and Guangzhou cases, responsibilities of the
urban region are more complicated and fragmented. For Mumbai, it largely rests with the
municipal corporate and various branches of the Maharashtra state, complemented by
some central-government programs. Therefore, its autonomy is a mixture of the Mumbai-
Maharashtra relation, the Maharashtra-New Delhi relation, and the Mumbai-New Delhi
relation. Guangzhou is a municipality under Guangdong Province, yet being a “sub-
provincial level city”23 in China, it retains higher administrative autonomy (one above
normal municipalities but below a province), meaning we cannot observe it the same way
as ordinary Chinese cities. In this study, we are mainly interested in central-local relations,
because the territorial state embodies the traditional form of centrality, facing the
emerging significance of GWCs as a new form of centrality. So the primary concern here
23 This concept is explained in the Guangzhou case (Chapter 6).

45
is globalization’s impacts on the city and the national levels, and the combined outcome of
such impacts. Province/state is less relevant. Therefore, provincial/state-level data is used
only when necessary.
3.1.1 Conceptualization of local autonomy
The concept of autonomy originates from the notion of an individual’s ability to act
according to his/her own will, free from higher directives. Used in discussions of tiers of
government, it is applicable not only to federal, but also to unitary polities. In reality,
autonomy is indispensable to all political systems—all localities in any country enjoy some
level of autonomy. Even in the most autocratic polities, the central authority has neither the
time or knowledge to monopolize decision-making—most of which trivial and repetitious
routines. The central government must relinquish such power to lower, more appropriate
levels of authority. The main difference between federal local autonomy and unitary local
autonomy is perhaps whether such autonomy is achieved mainly through cross-level
interaction and negotiation, or through unilateral dictation. Most countries find themselves
somewhere between the two extremes.
In political science, the traditional and most accepted definition of local autonomy is a
locality’s ability to act according to its independent will without interference from external
forces—a concept closely resembling lawful individual power, established through public-
private struggle. If both or either party feels necessary, it can propose changing the division
of power, therefore change the realm of its rights and responsibilities and accordingly, the
other party’s rights and responsibilities. Early attempts to conceptualize local autonomy
stem from the same rationale.
Clark conceptualizes local autonomy as a quality with two dimensions of power: the
power of initiative and the power of immunity (G. L. Clark 1984). The former is a
locality’s ability to carry out its rightful duties; the latter is the locality’s ability, when
performing its functions, to act without the fear of higher oversight. The two dimensions
combined is local autonomy. The combination can take multiple forms, which Clark

46
summarizes into a fourfold typology, each representing a distinct pair of initiative and
immunity dimensions to different extremes (ibid., 199-201).
Table 3.1 Clark’s four types of local autonomy
Type 1
Initiative, immunity
Type 2
Initiative, no immunity
Type 3
No initiative, immunity
Type 4
No initiative, no immunity
Source: ibid.
Each type is an ideal form for analytic purposes, and in reality every instance of local
autonomy, especially when seen issue-specifically, has characteristics of some types. The
Type 1 autonomy enjoys both the power of initiative and the power of immunity. It could
be summarily labeled as an “autonomous city-state” as found in Singapore and in a way,
Hong Kong. They are entitled to full discretion on how to act; higher governments are
mostly irrelevant. In direct contrast to it, there is Type 4, in which a locality is deprived of
both the power of initiative and the power of immunity. It “must be described as have no
autonomy. (ibid., 200)” This conforms to a “Weberian image of a rationalized,
bureaucratic, rule-oriented instrument. (ibid.)” The locality is expected to faithfully and
uncreatively carry out instructions passed down from its superior.
Real-world variations mostly fall into Type 2 or Type 3. Type 3 bears some similarity
to Type 1, only a Type 3 locality cannot choose what to do but can choose how to do one
task. Task-setting is done by higher authorities. When a task is set, the locality is free to
decide how it fulfills that task. Type 2 is described as “decentralized liberalism” by Clark
(ibid., 201). A locality of this type can decide on its own tasks and priorities, but its
decisions are scrutinized and may be negated by higher authority. Its room and resource to
achieve its goals are limited and subject to superior governments.
Clark’s contribution is a substantive step toward local autonomy theorization and
categorization. Its main merit is defining local autonomy positively (power of initiative), in
addition to merely negatively as being immune to higher authority. This makes it possible
to include many local actions that are meaningfully shaping the locality, but neither

47
dictated nor delegated by higher authorities. To admit the local power of initiative allows
one to recognize those actions and thereby get a fuller picture of local autonomy.
However, the initiative-immunity division is not without its problems. There are
functions that demand neither, e.g. new kinds of instances under an existing item of
government function. The locality need not take an initiative because resources to solve the
novelty are already in place, making it unnecessary to declare new responsibilities; and
because of this, no additional higher review is demanded. Clearly, this is a scenario totally
different from Type 4 (no initiative, no immunity). There are also functions that demand
both powers, e.g. functions with nation-wide implications and carried out by central-local
collaborations. Custom-houses and border controls are of this sort. Their front-line staff
needs some level of discretion to decide upon each case. They rely on locally-provided
facilities and resources. Yet they meanwhile receive directions from their own superior on
a level higher than the locality they work in. There are also issues, especially those brought
by deepening globalization and societal change, that would temporarily stay optional for
localities to address. A proactive local government may choose to act and therefore
“create” new spaces for its local autonomy; a lethargic local government may turn a blind
eye until it (or the higher authority) feels compelled to tackle the problem. This scenario
cannot be comfortably placed in any of Clark’s categorization.
Wolman and Goldsmith (1990) takes one step further from Clark by asking about the
outcome of local autonomy, or, in what sense is local autonomy important and therefore a
meaningful concept? They listed a variety of constrains on local governments and argued
that local autonomy is “the ability of local governments to have an independent impact on
the well-being of their citizens” through taxation arrangements, public services, and
stimulating external demand for local products, etc. They take the pursuit of “well-being”
or “welfare” of local people as the objective of local autonomy. With diverse constraints
imposed upon the local government, the room left for their autonomy is residual and rather
limited. However, it is only in this limited scope that a locality can make a real difference
on their own, promote their residents’ welfare, and thereby realize its autonomy. And it is
only in this sense can people discuss local autonomy meaningfully, because it is the actions
a locality takes to promote its well-being in spite of all constrains that make the locality
unique. It creates its own subjectivity in this process and therefore forms its own autonomy.

48
Wolman and Goldsmith’s theorization is important for our inquiry because it
recognizes, in addition to a polity’s political structure, economic and societal factors also
influence local autonomy—a point that informed some of our crucial hypotheses.
Although they explored to understand local autonomy’s meaningfulness (which is
certainly helpful in defending the utility of this often-used concept), some questions remain
not fully answered, and some new questions are begged. First, even though promoting local
well-being is a reasonable cause for local autonomy, how a locality perceives its well-
being, and how researchers evaluate a locality’s well-being, are still influenced by all the
constrains surrounding that locality (and surrounding the researcher). In this sense, there is
no pure “residuals” left for the local authority. Everything about it—not only what is doable
but also how one thinks about what is doable—is always inevitably bound and shaped by
other factors. Second, their analysis falls short on the length a locality should go: in
promoting local welfare, how much a local government should do, before one can say it has
fulfilled its autonomy, or its autonomy has qualified as “meaningful”? To call attention to
an issue and to take the trouble to allocate resources and tackle that issue are certainly two
levels of effort. They both point to better well-being, but which one is more autonomous?
Which one is more “meaningful”?
Implicit in Clark’s and Wolman and Goldsmith’s theorizations of local autonomy is
that it must be viewed against the higher or central government. Clark’s “power of
immunity” is a locality’s ability to act free from higher authorities’ intervention; while
Wolman and Goldsmith see the residuals left for local governments as the room for their
autonomy. Both theorizations treat autonomy as an entity or commodity that can be
obtained, held, and used. Brown (1993) however, takes Foucault’s relational view of power
and argues that autonomy is not something a political actor can “have” or “hold”. Instead, it
is better understood as the way “a social object is linked to other objects in enabling or
constraining ways (ibid., 263).” Local political bodies “must be viewed as a socially reified
object that is constituted through social relations saturated with power (ibid.)”, or loci of
power exercises, and autonomy is accordingly the codification of all power relations
emanating from it. Autonomy is thus the institutional expression of temporary trade-offs of
central-local relations. With any change to the constrains, the central-local balance shifts, so
will the local autonomy level. Brown’s relational view of power on understanding

49
autonomy is another substantive step forward, and is highly important to this research, as
the level of autonomy of a GWC is now theoretically made possible to change over time.
Changeability is much less possible to fit into conceptualizations and theorizations by
Clark, Wolman and Goldsmith. With Brown’s theorization, higher tiers of government are
now included in the analysis framework, rather than being just the “opposite side” to local
autonomy. Nonetheless, this relational understanding of power does not distinguish among
the other parties: one cannot safely tell higher tiers of government apart from other political
bodies, since they are all intertwined in a net of power relations. This makes it tricky to
measure, or even to delineate the level or scope of local autonomy, which brings us back to
the question Wolman and Goldsmith posed: in what way is local autonomy a meaningful
concept?
Lake (1994) takes a more constructive, bottom-up approach. He suggests local
autonomy is not simply the freedom to act without external directives, it is also the capacity
to define and express local identity through political activities. While not denying the
significance of other factors in shaping local autonomy, he emphasizes that practices and
activities within a locality also define that locality’s identity. Local autonomy can only be
realized through interactions with non-local social, economic, and political forces. “When
understood as a continuing and constitutive relation between the local and the non-local,
autonomy that is blocked by truncated negotiations finds expression through other means
(ibid., 439).” Therefore, the degree of local autonomy depends on what the locality is
striving for and trying to identify itself as in the long process of its interactions with
external forces. In other words, it is formed by the local and non-local negotiations. Neither
is more decisive than the other.
Lake’s effort renewed Brown’s conceptualization and continued to open the chance
of differentiating between localities, providing a complementary perspective that enables
us to treat the varied levels of autonomy from a more contextual perspective. This is
important for our research because in addition to a relational view of autonomy,
locality’s self-identity and pursuit is also acknowledged.
50
3.1.2 Current Explanations on Level of Autonomy
Scholars have identified a wide array of factors relevant to the level of local autonomy.
This part goes them through and identifies those most pertinent to our research question.
Local governments on all levels operate within its country’s political framework. A
country’s constitution and fundamental laws spell out how power is divided among tiers of
government (like which functions should be performed by which tier, which resources
belong to which level of authority, etc.). These delimitations together decide the
institutional aspect of autonomy a local (including city) government can have. How the
constitution is written, and accordingly, how each tiers’ power is delimited is beyond our
research, but it is necessary to state here that local autonomy, even its institutional aspect,
should not be considered a unilateral decision by higher authorities, upon which localities
have little say. Active power devolution by higher governments is indeed one form of
giving/taking autonomy, yet devolution also takes place as a response to local requests, or
as a response to need of change felt by both the central and the local authorities (a mutuality
scenario).
Local governments also operate under a variety of non-institutional constraints. Gurr
and King provided a helpful classification dividing those factors into two categories: those
imposed by local economic and social conditions (Type I) and those imposed by higher
tiers of government (Type II) (Gurr and King 1987, 57–58). These constrains affect local
autonomy to different degrees. Each local government faces a combination of these
constrains, and its local autonomy is formed through different historical periods.
The Type I economic and social constraints mainly include revenue raised at the local
level, important economic actors and powerful social forces able to influence local political
agendas. Revenue determines a local authority’s financial capacity to fulfil its functions. It
is fundamentally limited by the size of economy and population, which determines the size
of the taxable base. Dominant local economic or social groups may seek specific labor,
religious or environmental interests, etc., but usually those pursuing business interests are
more powerful. They are able to substantially influence local authority’s consideration and
decisions on certain agendas. Local authority’s preference may sometimes accord with that
of local business elites, forming a local growth-machine (Molotch 1976a; Logan and

51
Molotch 1987). This way, the local autonomy condition is changed. Other factors of this
type include the structure of local government, e.g. fragmented or consolidated;
demographic factors, e.g. size and composition of population (Boaden 1971; T. N. Clark
1968); and socio-economic factors, e.g. local citizen’s engagement level and willingness
(Boaden 1971; T. N. Clark 1974).
Type II constraints are those imposed by higher governments. Page and Goldsmith
(1987) provided a good account of these factors. Firstly, they include, as just
aforementioned, the constitutional/legal position of municipalities and the way constitutions
affect opportunities for local autonomy, e.g., local autonomy in a unitary system is usually
less than in a federal system. Localities in a federal system can formally retain certain
powers that cannot be deprived of by higher authorities. So are the difference caused by
division of functions, by the legal basis of such functions, etc. (Page & Goldsmith 1987,
Pierre 1990, Page 1991). Second, the kinds of services higher governments expect of local
governments, and the way they oversee the local governments’ performance. Lastly, the
locality’s autonomy is fiscally constrained by the types and levels of taxation allowed for it,
and their legitimacy to issue local public debt or loans. Obviously, the more types of tax a
locality is allowed to collect, the more revenue it generates. Also, the higher level of
taxation, the more revenue it generates. Public debt a locality borrows also adds to its fiscal
budget, although only temporarily, because it has to be paid off in the future. Taxation
largely constitute a locality’s endogenous fiscal capacity. Debts, loans, and transfer
payments from other tiers of government are a locality’s exogenous fiscal capacity. Fiscal
capacity is often deemed the most important, since all forms of autonomy would be
meaningless without resources (money) to carry them out. For this reason, it is frequently
used as an indicator of local autonomy or capacity. This research also greatly relies on
GWCs’ local fiscal figures to assess their autonomy levels.
Gurr and King’s categorization is helpful to identify main relevant factors. It clearly
distinguishes between the local and the central elements, echoing the nature of local
autonomy as the institutionalized central-local power relations.
Another often-used theoretic tool, the Leviathan hypothesis, discusses the inter-locality
dimension of local autonomy level. In a closed environment, a local government is in
essence similar to private sector monopolies (Brennan and Buchanan 2000). It always tends

52
to maximize taxation, rent-seeking, and chooses to slack whenever possible (Niskanen
1971). This is a simplified personalization of local government. The extent to which a local
government can acts in this way varies, and is greatly dependent on the number and type of
competing jurisdictions surrounding it (Schneider 1989). The Leviathan hypothesis posits
that competition from peer local governments reduces this tendency, because citizens are
free to choose among localities, and they tend to opt for the place offering the most
favorable taxation, welfare, and public policies (Tiebout 1956). It is in one way an
application of economic theory in political science. The more competition a locality faces,
the better governance and self-improvement it will produce. There has been no consensus
to date on the validity of the hypothesis (Craw 2008, 665), but its applications abound. And
although it originated as a description of inter-jurisdictional competition within a federal
system, the Leviathan hypothesis can also shed light on other polities, as well as on cross-
country inter-locality dynamics. For example, there is a wide body of research on intercity
competition for investment, talents and tourists enhancing a local government’s provision
of favorable policies, tax incentives, and other of measures to meet the challenge (Duffy
1995; Organization for Economic Co-operation and Development 2006; Anholt 2007;
Kuptsch and Pang 2006; Musterd and Kovács 2013, etc.). By including capital, talents, etc.
into consideration, scholars are able to analyze not only intercity movement of citizens, but
also the movement of “flows”, which are certainly more salient in a more globalizing
world. These are not exact applications of the Leviathan hypothesis, but they to a large
extent share the same mindset and all point to the notion that intercity dynamics also
contribute to a city’s autonomy. In this study, I borrow the idea of the Leviathan
hypothesis, and look at intercity competition’s effects on the case cities’ local autonomy
levels.
In a similar vein, competitions among territorial states can also affect autonomy levels
of their cities. Cities, especially big ones are important growth poles in a national economy.
Territorial states increasingly deem big cities as major centers of national development and
competitiveness (Crouch and Le Galès 2012). These “national champions” are given high
status and favorable resources to compete internationally on behalf of the nation. Their
international success or prominence is seen partly translatable into their territorial states’
success or prominence. The territorial state’s investment in these cities—in order to secure
more footloose capital in global economy and thus advance national prosperity—would
53
make already-successful cities even more successful, but may worsen regional disparity.
Facing competitions, territorial states often choose locally-targeted policies to strengthen
their champion cities, rather than re-distributive measures to alleviate inequalities between
advanced and backward regions (Brenner 2004). The U.K. and French governments’
support for London and Paris is a telling example of how international competition induces
state-level policy changes that bring more autonomy to national champion cities (Crouch
and Le Galès 2012, 415–17). Scholars also noted how the Chinese government has
intentionally invested in Shanghai as a national strategy to spur up national growth (e.g. L.-
Y. Zhang 2014). In this sense, there is a possible mutuality between GWCs and their
territorial states. Both may find common ground in creating more local power at the GWC
to promote that city’s competitiveness.
3.1.3 GWC scholarship on local autonomy
Current GWC scholarship does not provide a coherent explanation on a GWC’s autonomy
or initiation. It could be because local autonomy belongs to the realm of political science,
while most GWC research are conducted through the lenses of economic geography or
sociology. To be sure, even though knowledge on a nation’s domestic politics is helpful to
understand a GWC’s local autonomy, additional attention to globalization, to the city’s and
the territorial state’s positions in globalization, is necessary to develop a more thorough
appreciation. The GWC is under heavy influence of the world economy—much more so
than ordinary cities. The territorial state, especially those trying to benefit from integration
into world economy, also tends to treat their GWCs in a certain special way.
Brenner (1998) argues that the role of the territorial state must be taken into
consideration in GWC formation. No GWC grows in a vacuum. They are always embedded
in and subject to a territorial state. In globalization, the state undergoes a rescaling and
restructuring process at the local level of the GWC—a new form of centrality in world
economy. During this process, one witnesses not a “zero-sum” game between an expanding
global scale and a shrinking national scale. Rather, territorial states are finding new ways to
re-express or re-articulate their power on both the supra- and the sub-national levels,
forming a “glocal” state. The sub-national level would be the GWC (among other entities).

54
The territorial state can make use of its GWC as a new tool for national interests. As a
corollary, it would try to allocate more power to its GWC to promote national competitive
advantages. This is also of great value to this thesis, not only because it is one of the earliest
discussions on the central-local relations between territorial state and GWC, but also it is
possible to draw out testable hypotheses from it. The notion that the territorial state may use
GWCs as a restructuring and rescaling platform to compete in the world economy leads to
two of the main hypotheses in this thesis: one about the territorial state’s integration into
global economy, the other about the competition a GWC faces. Although Brenner’s original
text is based on contemporary Europe, I borrow his ideas for my cases as well.
A widely cited GWC typology proposed by developmentalists (Hill and Kim 2000; Hill
and Fujita 2003) dichotomizes global cities into bourgeois world cities and state-centered
political bureaucratic world cities. The latter mostly adopts a developmentalist ideology and
highly feeds on the recognition and support from state bureaucratic elites and a wide array
of central support. State-centered GWCs are different from market-centered ones by
reflecting more national idiosyncrasies in a globalizing economy, than reflecting increasing
convergence in spatial and social structure of GWCs. The territorial state—from
institutional setting to development strategy—influences GWCs strongly, sometimes
decisively. This widens the theoretical possibility of addressing the relations between a
GWC’s status and its central-local balance, including its autonomy level. Hill and Kim’s
contribution can be seen as a complement to foundational writings by Friedmann and
Sassen. They timely point out the need to identify alternative types of GWC formation with
more awareness of the city-state relations. Global cities “differ from one another in many
salient respects because they are lodged within a non-hegemonic and interdependent world
political economy divided among differently organized national systems and regional
alliances. (Hill and Kim 2000, 2167)” Some cities are strongly dependent on the national
base, spurred and also utilized by their territorial states. Hill and Fujita (2003) later
proposed a “nested city” concept, in which they reaffirmed the role of the territorial state in
a GWC’s autonomy level: “Cities are embedded in multilevel spatial and institutional
configurations... The whole multilevel configuration in which the city is nested, including,
most especially, the nation-state and region of the world, must be taken into account (ibid.,
207).” Clearly, the territorial state has a strong influence on the autonomy level of a city,
including GWCs. Supra-national level factors put additional weight on their politics, but the

55
traditional territorial state is and will never be absent. In this regard, they allegedly differ
from the globalist view-holders like Sassen and Friedmann—as Hill and Kim label them
(2000, 2167)24. (Sassen 2001b)
Later, Olds and Yeung (2004) identified three types of global cities: the hyper global
city, the emerging global city, and the global city-state. They, echoing Robingson (2002),
appealed for better understanding of the “come(-ing) into being” (Olds and Yeung 2004,
492) of GWCs, and proposed three pathways a GWC could be formed. Each pathway
represents a divergent role taken by the territorial state, and accordingly, different possible
levels of city autonomy. Hyper global cities such as New York and London are
comprehensively integrated via thick networks into a nested hierarchy of regional, national,
and global economies, although “they have no formal and particularly coherent political
presence on the national or international level, especially in the U.S. (p. 503).” Emerging
global cities are those that strive to become truly prominent global cities. They coordinate
/control on a relatively more regional level, have limited linkages with global economy
compared to hyper global cities, and depend much more on inward flow of capital, talents,
goods, and services. The third type, global city-states such as Singapore and Hong Kong, is
where “the state25 is contained within a fully urbanized and spatially constrained territorial
unit (p. 507)”. It is in emerging global cities and global city-regions that the territorial state
plays a profound, sometimes decisive role. Emerging global cities depend significantly on
resources and linkages to its hinterland, as well as political fabrics within which they
situate. “They must have institutional will... and political legitimacy to initiate and sustain it
through material and discursive practices. (p. 493)” This clearly points to intergovernmental
relations between the territorial state and the GWC. The institutional will can be the local
urge or perception about its own prospect as an (emerging) GWC, while political
legitimacy is strongly shaped by its relations with higher-tier governments, from whom a
considerable part of power is derived. Their GWC vision predicts a high level of national
24 Although to the author’s understanding, neither Sassen or Friedmann had dismissed national backgrounds
of GWCs. They concentrated their focus on global forces and dynamics mainly for the sake of theory
conciseness. See Sassen’s response to Hill and Kim (Sassen 2001b).
25 In Hong Kong's case, a highly autonomous political and economic entity that resembles a sovereign state.

56
awareness of the significance of GWC, if the nation adopts a developmentalist strategy.
This leads to a raised level of autonomy and of GWCs in these nations.
To sum up, three categories of determinants of local autonomy are identified. First,
institutional configurations that delimit the boundaries of power and responsibility among
tiers of government, and among same-level bodies. In this group, what is relevant to our
study is the boundary between the central (the territorial state) and the local government
(the GWC). We know that these boundaries are not rigid or constant. They are subject to
change depending on different circumstances that local and/or central authorities face.
Second, extra-governmental factors including social, economic and demographic
forces. Business circles in a city can exert influence on a city’s autonomy and capability
level. It can also lobby higher governments for the city’s sake. Meanwhile, the size of urban
economy and its share in national economy also affect that city’s fiscal power and weight in
the national system. I draw on this notion in the formulation of IV3 (concentration of a
territorial state’s foreign economic activities in a GWC).
Third, inter-locality competitions also affect a GWC’s autonomy level. Competitions
take place among cities as well as among territorial states. Competitions intensify when
actors adopt competitive growth strategies to attract footloose capital and other factors of
production. When a territorial state implements a developmentalist strategy, it is more
likely to encourage and facilitate its key cities as central agents. This branch of literature
points to the intensity of competition as a stimulus of local autonomy. This notion is used in
my second hypothesis.
3.1.4 Measuring local autonomy level
Since local autonomy means the local capability and freedom to pursue aims and make
decisions free from higher supervision, it is the flip side of decentralization. Despite
different definitions, they all share the notion that it “includes the transfer of power and
resources away from the central government (A. Schneider 2003, 33).” And
decentralization and local autonomy are often used interchangeably (Fleurke and Willemse
2006). They both mean a state in which central authority loses some power to lower

57
governments, while lower governments obtain power and expand liberty to perform its own
tasks. Viewing a political system as a whole, it is undergoing a “decentralization” process;
while localities within this system are enjoying more local autonomy. In this research, I
also treat the two as the same.
A centralized political system (low local autonomy) is one in which local governments
enjoy very limited discretion, all of their fiscal power is subject to central allocation and
most of their decisions are merely carrying out superior intentions. It is more likely to be
found in unitary states. A decentralized political system (high local autonomy) is one in
which local governments enjoy a large amount of fiscal and political power. They are
seldom constrained by upper authorities, and can independently decide on most of their
policies. It is more likely to be found in federal states. Decentralization is the process of the
former taking on more features of the latter. The outcome of such process is increased local
autonomy.
GWC’s local autonomy level, by our definition, is a status of power allocation between
a territorial state’s central authority and its leading GWC’s local municipal government.
Therefore, it is in essence an inter-governmental relation. To measure it involves at least
two levels: the sub-national or local (GWC) level and the national level.
Table 3.2: Decentralization dimensions and indicators
Dimension Indicator
Fiscal decentralization Subnational expenditure as percentage of total expenditure
Subnational revenues as percentage of total revenues
Administrative
decentralization
Taxation as a percentage of subnational grants and revenues
Transfers as a percentage of subnational grants and
revenues
Political decentralization Municipal elections
State elections
Source: (A. Schneider 2003, 41).

58
Schneider (2003) usefully categorized three spheres of decentralization and how to
measure them. For our study, the focus is on the fiscal and administrative sphere. It is the
most direct reflection of central-local relations. Schneider argues “the best indicator for the
level of fiscal centralization or decentralization is the share of subnational expenditures and
revenues. (ibid., 36)” It is also where reliable data can be found. Polit ical decentralization,
measured by election, is indeed used in some researches (e.g. Mueller 2011), but for our
cases, political election data is difficult to find, and elections at least in China are not a
good indicator of power relations. Therefore, it is not used.
Other studies (e.g. Page and Goldsmith 1987) use division of governmental functions to
assess central-local relations. They suggest local autonomy can be understood in terms of
how tasks are distributed between different levels of government, the discretion each level
has in performing its tasks, and their access to and influence in the center. This is not a
feasible choice for our study because a) the different types of polity (unitary/federal) make
cross-country comparison of division of functions intrinsically problematic (Page and
Goldsmith’s study cases were all European unitary states). b) our time span may not be
long enough to observe sufficient changes in division of functions to generate meaningful
conclusions. c) discretion can take numerous forms and is difficult to identify and measure
(Goldsmith 2012, 137).
3.1.5 Indicators of local autonomy level
In this research, due to the said difficulties in accessing comparable cross-country data, and
the somewhat arbitrary nature of interpreting policies and government papers, I choose to
mainly rely on fiscal data. It is in accordance with most scholarly works on local autonomy
and decentralization. “Despite several shortcomings, the share of sub-national government
expenditure or revenue in consolidated general government expenditure or revenue is
widely used as a proxy for the degree of decentralization of the public sector. (Stegarescu
2004, 1)” Such figures are also used to assess the overall decentralization of the territorial
states of China, India and Vietnam26, in order to control for national backgrounds.
26 At the time of writing I do not have access to Vietnam’s national fiscal statistics. Assessments of the
Vietnamese situation is obtained from other scholars’ works.
59
For the city level of GWCs, “one way to measure levels of local administrative
autonomy is by examining the control exercised over local revenue (A. Schneider 2003,
38)”. For example, Lijphart used this measurement in 1984 (1984). Similarly, I look at how
much revenues or expenditures the city spends and their percentages in the city’s total
revenue and expenditure. This is a good indicator of the degree to which municipals control
over financial resources. If a city collects or spends more money on its own, we can
reasonably say it has a higher level of autonomy. If only a small percentage of fiscal
resource is collected and used by the city, then it has a lower level of autonomy.
In the meantime, I also look at, data permitting, grants and transfers from higher
governments (in our study, from central government). Ideally, we should distinguish
between grants and transfers, but not all case city’s public fiscal data provide such
specification. Therefore, it is only measured in certain GWCs. There are disputes on
whether relying on grants or transfers implies higher or lower autonomy level (Stegarescu
2004, 5). Generally, the outcome is the local government having more fiscal capability to
carry out tasks (although sometimes grants and transfers come with strings attached), so I
deem them both suggesting higher local autonomy. Since the gist of our study is on
mutuality or contradiction of between the territorial state and GWCs, not on assessing local
autonomy in detail, we include grants and transfers into local autonomy as well—because
after all, the eventual effect is more power and resources vested in the locality.
Lastly, if data permits, I observe the GWC’s local loans. To independently issue loans
and owe debts is a sign of local government’s own financial power. It means it can generate
additional source of power without being subject to central restraints. To issue more loans
means the local government is actively performing its tasks and pursuing its objectives. Of
course, debt ceilings are in place in many countries. Ceteris paribus, a higher ceiling
suggests more local autonomy; while a lower ceiling (or inability to issue loans) suggests
less local autonomy.
Due to the complexity of inter-governmental relations and difficulty in cross-country
comparison, measuring decentralization or local autonomy “can hardly be accomplished by
using a single quantitative measure. (Stegarescu 2004, 2)” Our measurement for this
variable is by no means satisfactory or adequate. But it is the most solid source at hand. It is
also the kind most immune to analyzer’s interpretation. In the future, supplementary data

60
like alternative off-budget financing, public-private coordination on public service
provision, details of local initiatives27 on GWC formation should also be considered and
assessed, if time and resources permit. For more in-depth studies, decision-making
processes of local policies and central-local bargains can also bring meaningful insights.
3.2 Independent variable 1: Global integration of the national economy of a
GWC
“Commanding and controlling” world economy is the central function of a GWC. Without
such function a city is not a GWC in its fundamental sense. The world economy is
unevenly developed (N. Smith 2008), with global capital constantly exploring more
lucrative areas and leaving unprofitable ones. Areas’ relative positions in global production
also change constantly. Some are intensifying integration and connection with world
commodity chains, while others’ integration and connections are in decline. The three case
countries in this study, China, India and Vietnam, belong to the former category. Their
national economy is rapidly internationalizing, but to a less extent and quality than the
Global North. The Vietnamese national economy sees most of its economic activities
somehow internationally related, yet obviously this does not indicate the country to be on a
par with developed economies in terms of connectedness and centrality. However, it is
indisputable that they are increasingly involved in world economy in the post-Cold War era
(as shown in IV1 for each case). Since their national economy is more and more part of the
world economy, then articulating national economy is part of articulating the world
economy (Ma and Timberlake 2013). It has been so in established GWCs and their nations.
It is increasingly so for emerging economies rapidly integrating with world economy.
China’s rise has certainly been aided by Shanghai’s “dragonhead” role and Hong Kong’s
gateway function. A powerful GWC within its territory is an edge for a territorial state’s
overall growth.
27 There has been some research on GWC-promoting initiatives by the private sector in Mumbai, like
“Bombay/Mumbai First”. But it is not entirely an inter-governmental mechanism, and its decisions are not
accountable to the government, therefore it is not included into discussion in this study.

61
Faced with this dynamic, the territorial state often finds itself in a paradox between:
growth and prosperity of its national economy, and balanced domestic development among
each region. If the former is given more weight, the territorial state–GWC mutuality has a
bigger effect on inter-governmental relations. In this scenario, the territorial state would opt
for national growth before ensuring balanced development (of course it does not mean
evenness is not important). If the latter consideration overrides the former, then a GWC
growing faster than “ordinary cities” becomes less of an ideal, because it stimulates a “de-
territorialization” or “de-nationalization” process that rips the national urban system apart.
Developing countries, especially countries that adopt a “developmental state” strategy
like China and Vietnam in our case, tend to take the former strategy. Although overall
welfare and balanced growth have been pursued, they tend to attach more importance to
national growth than catering to vulnerable regions and groups. For them, a more globally
integrated economy is desirable, and it is of great importance that such integration is
sustained and deepened, since that would generate more national wealth, leading to stronger
national power, helping them move up in the international hierarchy.
3.2.1 Hypothesis 1
With its national economy more integrated into world markets, a territorial state has a
stronger incentive to ensure its regulatory power retain control, so as to reap more benefits
from the world economy. Therefore, besides what could be done at the national level, it is
also necessary to transfer power to GWCs. This strategy is most telling in state-led GWC
formation in developmental states, e.g. Japan, South Korea and Singapore. GWCs, on the
other hand, more intensely face social and economic implications from globalization, and
demand more local power to address those issues. At the same time, GWCs endeavor to
perform stronger central functions. A strong presence of local and international business
circles in GWC is more willing to influence the government in favor of pro-business
policies. To carry out those policies, more power—some of which used to belong to the
central authority—is required at the GWC local level. Here, we expect a mutuality between
the territorial state and its GWC, when the territorial state’s economy is more globally
integrated.
62
Therefore, I hypothesize: if a national economy is more globally integrated, its leading
GWC is more likely to obtain a higher level of local autonomy. The two phenomenon
should have a positive relation.
3.2.2 Operationalize global integration of national economy
The global integration of a national economy is measured by two indicators. First, a
national economy’s import and export of goods and services, and its ratio to the country’s
total GDP. Second, FDI net inflow and outflow and their ratio to the country’s total GDP.
The two measurements are widely used by consultancies and academics alike to assess
an economy’s development and internationalization level. Both should positively indicate
the country’s global integration. If more good and services are imported or exported, and if
more FDI flow in and out of the country, that country’s economy is more integrated with
world economy, and that country is more globalized.
3.3 Independent variable 2: Intercity competition from neighboring GWCs
“Intercity competition for world city status is keener than ever. Yet this aspect is also
under-theorized and poorly related to world city formations.” (Douglass 2000a, 46) This
variable examines the effects of intercity competition on the GWC’s local autonomy.
“Competitive angst is built into world city politics (Friedmann 1995, 23, original
emphasis).” In academia, there has been a vast and growing literature concerning
competition among GWCs, including those in developing economies. Much research has
been devoted to understanding cities as a potential agent of economic competition and
development (e.g. Camagni 2002b; Kresl and Singh 2012; Lever 1999; Porter 2000, 2003).
Such literature can be roughly divided into two groups: on how these cities could imitate
and catch up with mature Western global cities, in other words, “the chances for
latecomers” (L.-Y. Zhang 2014, 1164–65), and on how cities or city-regions become
competitive in general.

63
The former group is mostly found in discussions on the growing and evolving of
prototype global cities like New York, London, Tokyo and Paris, as well as some
successful second-tier global cities like Berlin and Seoul. Their ways toward success are
generalized into different paths for “emerging global cities” to follow (P. Taylor et al. 2009;
Jessop and Sum 2000; Hill and Kim 2000; Olds and Yeung 2004). Although these
researches seldom talk about competition directly, but they stress the importance of taking
other cities’ positions, strategies, and comparative advantages into consideration, providing
a valuable pool of ideas and blueprints for ambitious urban planners as well as national
strategists who want to foster global cities of their own.
The other group of literature, discussing how cities can enhance their competitiveness,
is much larger and more generic. Such literature saw a boom approaching the late 1980s
and 1990s, possibly because deindustrialization and globalization waves disrupted existing
urban hierarchy, and previously successful industrial cities suddenly found themselves
thrown into world market with their former strong suits no longer as useful. They had to
devise new and innovative strategies to improve or secure their positions (see Garcia and
Judd 2012 for a more detailed review). Into the new century, more concepts have been
advanced to capture the mentality and strategy to enhance urban competitiveness, such as
“urban leadership”, which emphasizes the local-level identity in pushing ahead innovation
and growth agendas (Beal and Pinson 2014; John and Cole 1999; OECD 2015), “city
entrepreneurship”, which stresses the importance of translating urban vision, momentum
and creativity into economic growth (T. Hall and Hubbard 1996; Ács 2002; S. Y. Lee,
Florida, and Acs 2004; Acs and Armington 2004; S. Y. Lee, Florida, and Acs 2004), “city
branding” efforts to promote cities internationally (L. Zhang and Zhao 2009), and so on.
3.3.1 Hypothesis 2
This research hypothesizes that if a GWC is facing more competition from other GWCs, it
is more likely to get increased autonomy vis-a-vis its central government.
To respond to competitions requires local resources and freedom to provide better
infrastructure, business environment, and financial incentives to attract capital and talents.

64
Resources and freedom can only be realized with a stronger financial base and enhanced
autonomy of the municipal government. Facing the changing status of its rivals, each GWC
has a strong impetus to stay ahead of the competition. Therefore, we can expect it to
actively seek higher local autonomy, either by devolution from the central authority or
through its own efforts.
For major emerging economies who attach more importance to national growth, a more
competent and competitive GWC of its own can better facilitate its overall national
economy, therefore is a “national treasure” of sorts. A GWC losing the competition means
its national economy missing chances in the world economy, which would eventually take a
toll on national welfare. Therefore, aiding its own GWC to stay ahead of competition is a
feasible and even natural policy choice. This demands re-allocating some state resources
and functions down to the local level, at the city’s disposal, so that the city can better
respond to intercity competitions. This means less central control. The central authority
weakens itself if deciding to do so. But since none of our case country is especially worried
about national stability, and economic prosperity remains one of their common policy
objectives, we still expect a positive result of this hypothesis.
3.3.2 Operationalize intercity competition
Competition is omnipresent. It happens among individuals, groups, areas, as well as
nations. In world economy, competition is increasingly taking place across national
borders, between inter-national localities (Jensen-Butler 1999, 865). Such localities include
economic clusters, cities, and sometimes city-regions. They all involve the city as the key
platform. Such platforms are smaller than nations in terms of size and (perhaps)
complexity, but they provide immediate environments for “on-the-ground” economic
activities, and meaningfully shape people’s and enterprises’ conceptions and behaviors.
Competition among cities can happen in various domains, take diverse forms, and range in
intensity. Each city’s unique situation and objective also define its specific targets in
competitions. One city can be competing simultaneously for multiple resources or projects,
each with a different rival; it also happens that multiple cities compete for an exclusive
status or position—any city after the same title is a rival. Despite the myriad forms of

65
intercity competition, there are few scholarly definitions to follow. For example, when
Friedmann suggested that world cities compete fiercely in the “hierarchy of spatial
articulations” (Friedmann 1995), he did not specify what exactly those cities were doing.
The complexity and multiplicity of competition makes it difficult to analyze or compare,
e.g. who exactly is competing with whom, and what exactly are they competing for?
To operationalize a comparison, I here define “competition” and explain what to look
for as its indicator. In this research, I see intercity competition as activities taken by a GWC
with the intention to acquire sought-after exhaustible resources that are generally
considered beneficial to a GWC’s development.
Here, I need to emphasize three points. First, such activities should be taken by a
(global/world) city. This excludes efforts solely made by civil society operating in the city,
or interest groups lobbying in the city’s interest. Surely in reality they cannot be completely
separated from urban politics, because they are important local political actors (Stone 1989;
Mossberger and Stoker 2001; Molotch 1976b). However, digging into the interaction
details among them or including private efforts into discussion risks over-complicating the
variable.
Second, the objectives GWCs compete for should be of an exclusive nature. It is not to
say global cities never work together or their competition is always zero-sum. Sassen has
long suggested that New York, London, and Tokyo “do not simply compete with each other
for the same business. They also fulfill distinct roles and functions as a triad” (Sassen
1991a, 327), there is “the possibility of a systematic connection other than competition”
(Sassen 1991a, 169). Other scholars found scenarios where during competition, rival cities
gradually evolve complementary features, e.g. between London and Frankfurt (Hoyler
2004), or among Beijing, Shanghai, and Hong Kong (Lai 2012). The World City Network
model also shows that these cities, while competing with each other, are also interconnected
and cooperating within a global network (J. V. Beaverstock et al. 2002; P. J. Taylor et al.
2001). While acknowledging its significance, such dimension is not taken into account in
the thesis. What interests us here, is just the local efforts to promote the city’s capability to
perform its GWC functions, not the city’s cooperative aspect as a GWC.

66
Third, I only consider competition for objectives generally considered “good” for the
growth and development of a GWC. Special attention should be paid to factors enhancing a
GWC’s central “command and control” functions. These factors include the city’s
investment attraction, business environment, and living amenities for headquarters and
advanced service sectors employees, traffic and telecommunications infrastructure, etc.
Competitions vary in extent. One end is zero competition, when two cities are not in
any way trying to obtain one resource or opportunity at the cost of the other city. This
happens when two GWCs are located very far away, or find themselves on different rungs
on the world economy ladder. For example, although both are GWCs, it is hard to imagine
Bangkok and Frankfurt to be in any sort of serious competition. The other end is total
competition, in which case, in order to acquire one resource or opportunity, two cities are
exhausting their toolbox, both municipal governments try the utmost of their power, sparing
no efforts. These two extremes only occur in theory. In reality, the majority of competitions
fall between the two extremes.
In economic geography, scholars usually measure competition intensity by counting the
number of contestants. It is based on the assumption that more contestants intensify the
game. For example, in testing the impact of competition of local market on policies adopted
by local government, Schneider (1989) measures competition by counting the number of
cities within the area, and the number of municipalities bordering the city. There are also
studies that treat intercity competitions case by case. But more often, intercity competition
is discussed in a sketchy, taken-for-granted fashion, without making any comparison in a
strict sense. This leaves most literature on intercity competition mute on how to determine
competition intensity. For example, the often-cited OECD report on competitive cities in
global economy (2006), despite its vast volume, said nothing on how to tell whether a
competition is intense or mild.
This study is mainly concerned with the pressure on the national and the city
governments. The territorial state and the GWC are both subject to capital’s insatiable
desire for profits. The former tries to take and enjoy a bigger share of global economy;
while the latter tries to integrate further into the GWC network and thus better articulate
and strengthen its national economy. It is just how much competition they face from peer
67
GWCs and nations that changes whether they feel compelled to take actions, and how far
they should go.
It is possible that some territorial states do not deem economic growth as important, or
other aims such as national security or social equality outweigh growth, or have disputes on
the effectiveness of GWCs for national prosperity. It is also possible that on the local level,
a GWC may be overwhelmed by other functional tasks, or trapped in local politics too
fragmented to make important decisions, or simply lacks a governmental organization in
charge of contemplating and promoting the city’s competitiveness. Even so, the above
judgment still holds, although to a lesser extent. Intense competitions still encourage both
the national and the local levels to enhance a GWC’s competitiveness. It is difficult to
envision a territorial state to purposely debilitate its GWC, or a GWC to ignore the
competition from a growing rival on its doorstep. That is to say, the subjective nature of
competition perception does not invalidate its link with the incentive to take
competitiveness-enhancing measures.
To measure the intensity of competition, two indicators are selected. First, the GaWC
rankings of world cities. They have been updating the rankings since 2000 until 2018. All
important or potential GWCs in the world are monitored and classified. The most
prominent two, London and New York, are placed at the “Alpha++” level—a level only of
their own. Less prominent ones (incl. Hong Kong, Beijing, Singapore, etc.) are at the
“Alpha+” level, and so forth. Some cities do not quite qualify as GWCs but still retain
certain international functions are labeled “high sufficiency” (like Dakar, Las Vegas and
Lausanne) or “sufficiency” (like Urumqi, Marseille and Nagoya). GaWC has traced the
performance of world GWCs for almost two decades. When contrasting neighboring
GWCs’ ranking changes, one can get a mostly truthful visualization of the competition
environment around a certain GWC. As mentioned ahead, a GWC generally cares about its
ranking, and it is reasonable to assume ranking changes affect a GWC’s willingness to
enhance its competitiveness. Second, I look at the size of market capitalization in
neighboring countries’ stock markets. “The size of the stock market is also a good indicator
of a city’s financial power and relative position in the global urban hierarchy (Short et al.
1996, 700).”
Indicator 1: Neighboring GWCs’ rankings as per the World According to GaWC.

68
Indicator 2: Number and size of market capitalization of stock markets in
neighboring GWCs/countries.
3.3.3 Scope of competition
Since we also consider other GWCs’ performance in the rankings, it is necessary to delimit
a scope of such observation. I assume a GWC does not compete with any random GWC in
the world. It is more attentive and responsive to a) those geographically close and b) those
whose national economies are on a similar development level with its own.
Such two conditions are important because A) geographical closeness largely
eliminates spatial differences for capital flows. For example, both as emerging GWCs, it is
hard to imagine Dubai to be competing with Manila. Rather, Dubai is much more likely to
compete with Doha. What distance qualifies as “close” has to be decided case by case, as
there are no universal criteria. Conventionally, same-country cities, as well as those in the
same commonly-recognized geo-economic region (like Middle East and Southeast Asia)
are considered “close”. B) More importantly, similar development level of national
economy means the hinterlands these GWCs articulate are more likely to compete for the
same type of business, and the capital is more inclined to consider all of them as a potential
destination.
These two conditions are complied with when defining the scope of competition for
each city. Just which rival nations and cities are examined is determined on a case-by-case
basis by the author, and can only be done so, since real-world economic geography and
capital flows defy a stringent criterion. When selecting potential rivals, caution has been
taken to avoid bias, although, some choices may still be debatable. I see it as an invitation
to more in-depth researches in the future.

69
3.4 Independent variable 3: Concentration of a country’s foreign economy in
the GWC
This part examines the relations between how much a national economy’s foreign economy
is operated through a GWC and the autonomy level that city obtains. First, the concept of
foreign economy concentration is introduced to assess the importance of a GWC to its
national. Some similar and related concepts are explored to shed more light. Second, the
concept is operationalized by selecting indicators and measurement.
3.4.1 Conceptualize “foreign economy concentration”
I use the concept “foreign economy concentration” to evaluate how important a GWC is for
its territorial state in globalization. In other words, how much a national economy’s
interactions with the global economy take place in/through a GWC.
Friedmann and Wolff see the world city as “the junction between the world economy
and the territorial nation state” (Friedmann and Wolff 1982, 312). They articulate the
national economy with world economy. Sassen also points out that a disproportionate share
of producer services cluster in the GWC (Sassen 1991a). This point has two implications.
One, the more globalized a national economy becomes, the more crucial a strong GWC is
for that national economy and the world economy. I have discussed this notion elsewhere
and shall not repeat it here.
Two, not all international elements of a national economy go through a certain GWC.
No matter how disproportionately privileged, no GWC could monopolize a country’s
TNCs, advanced service sectors, and cross-border flows. Rather, it handles a certain
share—admittedly, usually a big share—of the country’s international economic activities.
There are always flows generating from or going to other geographical nodes, i.e. other
cities. It is more so in large economies without a dominating city like the USA, China, and
India. In the meantime, it is also the token of the development level of a national economy.
More-advanced economies tend to rely on service industries rather than traditional
manufacturing and agriculture. International trade of manufactures and agricultural
70
products are more dispersed spatially, while service industries are highly concentrated in
urban centers (Sassen 2000a). In economies transforming from a primordial growth mode
basing on quantitative accumulation of low-end products to a modern growth mode basing
on higher-value products subject to agglomeration effects (like those found in China and
India), the dynamics of change is more striking.
This leaves one wonder, just how disproportionately concentrated in a GWC a
country’s international economic activities must be, can it make a difference to the central-
local political relations? Or even, does this level of concentration matter at all?
It is for this purpose that the concept “foreign economy concentration in a GWC” is
created. It is hereby defined as: the extent to which a national economy’s interactions with
world economy are conducted through one GWC. It focuses on the international aspect of a
national economy with an emphasis on “command and control” functions. It should be
distinguished from how much economic weight a city has in a national economy—a similar
notion, partly overlaps with my concept, but slightly different. By “foreign economy
concentration”, emphasis is placed on economic activities with an international nature. It is
different than general economic activities—including both international and domestic
activities. General economic activities encompass our concept, as well as other contents too
broad to be included in our study variable.
The concept of “foreign economy concentration” is partly inspired by the notion that as
a city becomes more integrated globally, a “systemic discontinuity” appears between that
city and its national urban system (Sassen 1991a; Ma and Timberlake 2013). It means that
city develops more connections with international cities (World City Network, WCN) than
with its home cities, thus creating a tension between territorial state’s ruling power and the
city’s local governance. Sassen sometimes refers to this notion also as “detachment” or
“decouple” of the GWC from its national base. The logic behind it is that the world
capital’s connections with a nation-state is so disproportionately concentrated in a GWC,
that this city derives its functional importance more from its interactions with other GWCs,
than from its interactions with “ordinary cities” in its national urban system.
This concept resembles but differs from the first IV. The first IV, a national economy’s
global integration, measures to what ratio a nation’s GDP is related to the globalized world

71
economy. It takes the national-level statistics as the unit of analysis, regardless of where
these economic activities take place, or through which cities they are managed. While the
third IV, “foreign economy concentration”, opens the national “black box”, and tries to
grasp how much of a national economy’s international economic activities are conducted
through a specific GWC.
It should also be differentiated from another very close concept of “primate city”. The
primate city (Jefferson 1939; Gottdiener and Budd 2005, 104–7; Jung 2010) refers to one
super large city that accounts for a disproportionate share (over twice the size of the second
largest city) of a country’s population. It reflects an ill-formed national urban system which
lacks second- and lower-tier intermediate cities. It is often associated with
underdevelopment, in which “the spatial concentration of resources also creates regional
disparities of wealth and income and political influence (Jung 2010, 609)”. It differs from
our concept in that not all GWCs are primate cities that can be measured in primacy
(although some indeed are). Moreover, in urban studies, such concept mainly reflects
population distribution, not economic activities.
A country’s foreign economic activities can be concentrated in a GWC to different
degrees. Total concentration means all such activities are performed in/through one GWC.
This is rare in reality, although some city-state-like entities like Singapore or Hong Kong
resembles such scenario. The other theoretical extreme is zero concentration, meaning a
GWC handles none of its territorial state’s foreign economic activities. It is also highly
unlikely, because it goes in sharp contradiction with basic assumptions of the whole GWC
scholarship28. It is evident by definition that GWCs tend to concentrate a substantial share
of its national economy’s foreign activities. Actually, this notion has been strongly implied
in the world city hypothesis (Friedmann and Wolff 1982; Friedmann 1986, 1995). But just
how much they concentrate, and does that concentration affect a GWC’s central-local
relations, is not yet established in literature, and is what I try to find out.
28 It is theoretically possible for a GWC in a territorial state to have almost nothing to do with its national
economy, if it engages predominantly in off-shore financial dealings and has placed itself in a critical
junction in the world financial system. Such case does not exist yet but it is not precluded by the global
city approach. However, the world city hypothesis seems contradictory to such notion.

72
3.4.2 Hypothesis 3
I hypothesize that the more foreign economic activities of one nation is concentrated in a
GWC, the GWC is more likely to have a higher local autonomy. Foreign economy
concentration in a GWC is a factor that affects both the territorial state and the city. For the
former, both FDI flow and TNCs’ expansion (foreign TNCs’ entrance and home-grown
TNCs’ overseas expansion) are important to its national prosperity. The deeper integrated
into global economy a country becomes, it is more so. If such activities are highly clustered
in one city, the city becomes very “special” in the eye of the nation, urging the nation to
guarantee the functionality of its local government to create a pro-business environment
and sustain good governance. For the city, intense FDI flow and TNC activities inevitably
brings about externalities of globalization—many of which negative and challenging ones.
New economic, social and even cultural issues arise and beg addressing. The intensity of
which is positively related to the level of concentration. It therefore calls for more resources
to be mobilized locally.
Pro-actively thinking, a developmental state should strive to ameliorate its environment
for business and global capital for the sake of better national welfare. It should not only
recognize the value of GWC as “strategic sites” in world economy, but also look for ways
to facilitate and foster its own GWCs, especially the more competitive and promising ones.
On the city level, effects of FDI attraction can be enhanced by complementary local
measures including labor-market policies, exit and entry policies, trade policies, etc. In the
meantime, diverse people, information, and activities can mix and create chemistry in an
encouraging and stimulating environment of a GWC, making that city an even more
appealing destination.
To achieve this, the territorial state (central government) would be more prone to
reallocate some of its function to the GWC (local government); while the city is more
inclined to acquire additional resources and freedom to carry out governance functions. The
combined outcome of would be an elevated level of autonomy of the GWC.

73
3.4.3 Operationalize “foreign economy concentration”
Some researchers attempted to measure concentration by looking at international air traffic
data (D. A. Smith and Timberlake 2001; Derudder et al. 2008; Derudder and Witlox 2008).
They count the air linkages between GWCs and other cities. An evident concentration of
traffic in major GWCs is observed. This approach has serious flaws in its failure to exclude
non-GWC factors in determining air traffic distribution, e.g. differentiating origin-
destination passengers from connecting passengers, differentiating business travelers from
leisure travelers, and path dependency in choosing an airline’s operational hubs. Some
other research, including Sassen’s seminal work (1991a), counts the number of service
industry companies in a GWC compared to that in a nation-state. It is an aggregate data that
partially reflects the weight of a GWC. How big the firms are, or the strength of their
connections with other GWC and with their nation-state is still unclear29.
I mainly rely on two indicators. First, I look at a GWC’s share of FDI flowing into its
national economy. FDI is investment by one country (usually companies, not government)
in another country in forms of establishing business operations or acquiring stakes or assets
in existing businesses. Compared to similar measurements like international trade and
foreign portfolio investment, FDI strongly implies acquiring or increasing control in a
business—a crucial GWC function. Therefore, I deem it a suitable indicator. If more FDI
into a national economy concentrates in one GWC, it suggests that city is harboring more
command and control functions related to international capital. It is literally what
Friedmann (1986) called the “basing points” feature of the GWC.
INDICATOR 1: The GWC’s share of its national economy’s FDI flow.
The world city hypothesis further adds that “world cities are major sites for the
concentration and accumulation of international capital” (Friedmann 1986, 73). It also
suggests a “corporate structure of capital accumulation” as a key driver of the expansion of
the world economic system. “The transnational corporation is the chief instrument of the
globalization of the economy... there is a marked tendency for concentration of capital in
corporations... (Friedmann and Wolff 1982, 314)”. It implies a tendency of TNCs
29 See (Jon V. Beaverstock et al. 2000) for a critique of several existing measurements.

74
concentrating in world cities, and that these corporations hold an ever-bigger ratio to a
national economy. This echoes the global city approach (Sassen 1991a) that the
geographical dispersal of economic activities necessitates stronger centralized control (by
TNC headquarters). These centralized control functions are facilitated by advanced
producer service providers also clustering in the GWC. TNCs are crucial to global cities
because “the behavior of companies in the global marketplace has served to link cities
through their role as business centers.” (Sassen 2002, 284)
Counting TNC numbers to reflect a city’s economic power has a long history. Hymer
(1982) envisioned a global urban hierarchy according to the hierarchy of TNCs. In framing
the world city hypothesis, Friedmann (1986, 72) included “headquarters for TNCs
(including regional headquarters)” in the criteria for world city hierarchy. Alderson and
Beckfield (2004) counted the world’s 500 largest TNCs’ headquarters and their branches,
thereby analyzing the world city system. Although Sassen did not directly use TNC
quantity to tell a city’s importance in a country, she often cites numbers of TNCs and their
concentration in a certain city or region to help with her arguments (e.g. Sassen 1991a, 170,
178, 2000a, 45, 98).
I also observe how many of a nation-state’s largest home-grown TNCs are located in
one GWC. “Home-grown” means the company should have started its business and
headquartered in that country. It is self-evident that the headquarter of a TNC “commands
and controls” its operations. Given TNCs operate on an international scale and constitute an
integral part of the world economy, seating more TNC headquarters means holding more
“command and control” functions in the world economy. Seating more home-grown TNC
headquarters means playing a bigger role in a country’s foreign economic activities.
I do not count companies of advanced producer service, despite they being an integral
feature of the GWC. This is not because they are not important or irrelevant, but because in
measuring intercity competition, I already used the GaWC rankings, which are based on
such data (P. J. Taylor, Catalano, and Walker 2002). To use it again here would be a
repetition. Moreover, most of the firms in GaWC rankings are Western-based. Their
clustering in one city should be read more as that city’s strategic position for world
(international) capital to enter a national economy, rather than that city’s importance to its
national economy. For the same reason, I disregard the concentration of any random

75
company doing business in a GWC—although any GWC would be teeming with such.
Home-grown TNC headquarters are more relevant because they also stress the territorial
state’s importance to the city. The city functions here as an outward window for home-
grown capital to reap overseas profits.
INDICATOR 2: The GWC’s share of its national economy’s largest enterprises.
The shortcoming of this indicator might be the negligence of the size and
internationalization level of those TNCs. Ceteris paribus, small TNCs are surely less
important than large ones, and more internationally oriented TNCs deserve greater attention
than less internationally oriented ones. These differences are impossible to be reflected by
solely counting the numbers and can only be examined in detail on an individual basis.
The two indicators differ with each other in that the FDI shares measure inward capital
movement, while concentration of home-grown TNCs measures outward capital
movement. Flows in both directions are commanded and controlled by the GWC, reflecting
that city’s weight in a territorial state’s international economy. Of course, these two
indicators are far from being enough to comprehensively capture the very intricate
relationship between a territorial state and its GWC. However, I believe they are among the
most definite and informative ones that are publicly available.
I also use supplementary sources (when available) to aid observations. For examples, a
GWC’s share of its territorial state’s international travelers, for example, is used for China.
It gives a referential piece of information on cross-border people flow. I also used
alternative company rankings other than the Forbes500 (e.g. for Vietnam, who does not
have any company in the Forbes 500 list). Data on exports and imports are available for
Mumbai and Shanghai. With them we can get an idea of goods flow through these two
GWCs.
3.5 Case selection
To identify cases worthy of in-depth study, a population of cases needs to be established
first. The population should cover cases with theoretical relevance to the study question, i.e.

76
level of autonomy of GWCs in emerging economies. Here, two selection criteria need to be
met.
First, these cities should be relatively globalized or internationalized (i.e. GWCs). They
may not enjoy the same worldwide influence like New York, London or Tokyo, but they
must be one of the most influential and the most globally-connected city in their respective
territorial state and region. This excludes “ordinary cities” in any national urban system,
because they lack the dynamics peculiar to GWC; this also excludes non-city actors like
neighbourhoods, communities, provinces/states or even city-regions30. Any case in this
research should be a municipality (city) of critical economic importance to its national
economy, and occupy a critical position in that national or regional sphere. It is the city and
its relations with the territorial state to be focused on, rather than any other set of inter-
governmental relations. This also theoretically excludes countries where no city distinctly
stands out as the central or “champion city”—an unlikely scenario in reality but needs to be
said.
Two, cases should come from emerging economies/markets. This means we are
interested in cities in economies that are of a considerable size, have been growing steadily
at a relatively fast pace for a period of time, and considered an attractive destination for
global capital. It is the post-Cold War period to be observed, when the global economy as
we experience today gradually came into shape and free liberalism became the dominating
ideology. Advanced societies in the West (North America, West Europe, Japan, Australia
and New Zealand) and the least-developed countries are not brought under examination.
Countries growing at an unimpressive pace are not considered either, as the impact of
globalization on their national economy or GWCs may not be drastic enough to make an
impact on the inter-governmental relations. Last but not least, cases should come from a
relatively “large” national economy, for two reasons. One, size does matter for global
capital: the larger the market or resource pool, the greater the chances for profits; two, only
on a certain scale can the central-local relations of a GWC become a meaningful analytical
object: a national system with just one overwhelmingly large metropolis—such as a
30 Although I acknowledge that city-regions surrounding certain GWCs are organically integrated with the
GWC at the core and meaningfully contribute to the GWC’s functions (see global city-regions in section
1.3), but that is not the question at hand in this dissertation.

77
“primate city” scenario—unavoidably tilts the balance towards the city because the
territorial state has little alternative.
With the above criteria, a population of possible cases is derived as below:
Table 3.3: Population of cases
Asia
China’s
Mainland
Beijing, Shanghai,
Guangzhou, Shenzhen Thailand31
Bangkok, Nakhon Ratchasima,
Chiang Mai
Israel Tel Aviv, Jerusalem Malaysia32 Kuala Lumpur, George Town
Vietnam Hanoi, HCMC,
Hai Phong Indonesia Jakarta, Surabaya, Medan
Taiwan Taipei, Kaohsiung India
Mumbai, New Delhi, Chennai,
Bangalore, Hyderabad,
Ahmedabad
Saudi Arabia Riyadh, Jeddah UAE Dubai, Abu Dhabi
Qatar Doha Philippines Manila, Davao, Cebu
Pakistan Karachi, Lahore Bangladesh Dhaka
Kazakhstan Almaty, Astana Myanmar Yangon, Mandalay
Cambodia Phnom Penh
Europe33
Russia Moscow, Novosibirsk,
St. Petersburg Turkey Istanbul, Ankara
Romania Bucharest Ukraine Kiev
Africa
South Africa Johannesburg, Cape Town, Durban
Egypt Cairo, Alexandria
Nigeria Lagos Algeria Algiers
Ethiopia Addis Ababa Morocco Casablanca
31 Nonthaburi is considered part of the Bangkok metropolitan region and not listed here.
32 Quezon City is considered part of the Manila metropolitan region and not listed here.
33 Russia and Turkey are both considered European countries here.
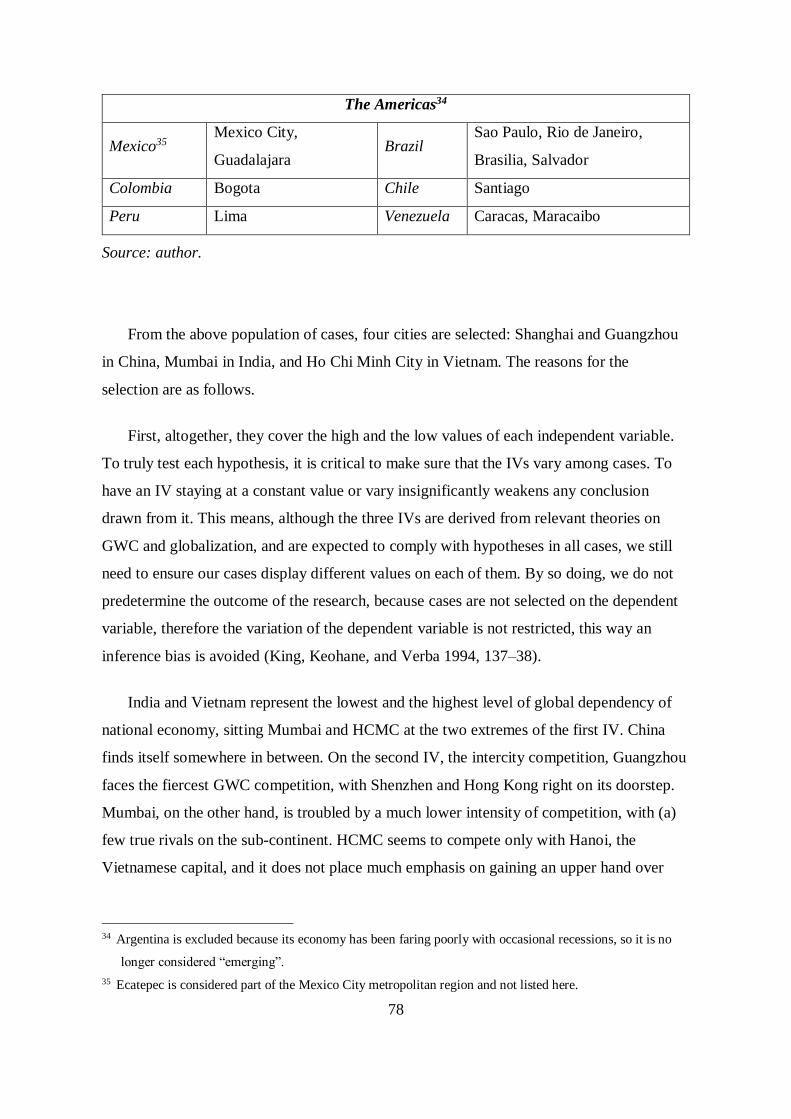
78
The Americas34
Mexico35 Mexico City,
Guadalajara Brazil
Sao Paulo, Rio de Janeiro,
Brasilia, Salvador
Colombia Bogota Chile Santiago
Peru Lima Venezuela Caracas, Maracaibo
Source: author.
From the above population of cases, four cities are selected: Shanghai and Guangzhou
in China, Mumbai in India, and Ho Chi Minh City in Vietnam. The reasons for the
selection are as follows.
First, altogether, they cover the high and the low values of each independent variable.
To truly test each hypothesis, it is critical to make sure that the IVs vary among cases. To
have an IV staying at a constant value or vary insignificantly weakens any conclusion
drawn from it. This means, although the three IVs are derived from relevant theories on
GWC and globalization, and are expected to comply with hypotheses in all cases, we still
need to ensure our cases display different values on each of them. By so doing, we do not
predetermine the outcome of the research, because cases are not selected on the dependent
variable, therefore the variation of the dependent variable is not restricted, this way an
inference bias is avoided (King, Keohane, and Verba 1994, 137–38).
India and Vietnam represent the lowest and the highest level of global dependency of
national economy, sitting Mumbai and HCMC at the two extremes of the first IV. China
finds itself somewhere in between. On the second IV, the intercity competition, Guangzhou
faces the fiercest GWC competition, with Shenzhen and Hong Kong right on its doorstep.
Mumbai, on the other hand, is troubled by a much lower intensity of competition, with (a)
few true rivals on the sub-continent. HCMC seems to compete only with Hanoi, the
Vietnamese capital, and it does not place much emphasis on gaining an upper hand over
34 Argentina is excluded because its economy has been faring poorly with occasional recessions, so it is no
longer considered “emerging”.
35 Ecatepec is considered part of the Mexico City metropolitan region and not listed here.
79
other global cities. Regarding the third IV, concentration of foreign economic activity in the
GWC, we find HCMC taking the lion’s share of its country’s foreign-related economic
activities; Mumbai also takes up a big share of India; Shanghai, and especially Guangzhou,
although being mega international cities in their own right, count for much lower shares of
China’s foreign economic activities. In all, the selection of these four cities can cover both
the high and low values of each IV (see below).
Table 3.4: The four cases’ values on each IV
IV1: national
economy’s global
integration
IV2: intercity
competition
IV3: concentration of
nation’s foreign economic
activity in the city
Shanghai mid high mid
Guangzhou mid very high low
Mumbai below mid low mid
HCMC high mid high
Source: author.
Two, they are all their country’s leading GWCs. Mumbai’s status as India’s most
internationalized city and economic center dates back at least to the British colonial rule.
“Historically, Mumbai has been a focus for global trade around the Arabian Sea and
beyond, owing in large part to its endowment with one of the largest natural harbors in
South Asia. (McFarlane 2010, 530)”. Today, it is still a major financial, economic, and
cultural urban center of India and South Asia, and counts for a large share of India’s
economy and global connections.
Shanghai is mainland China’s most globalized city and the undisputed economic and
financial center of East China and beyond. As early as the Song Dynasty (A.D. 960-1279),
Shanghai had been designated as a market city (Wu 2010). After the signing of the 1812
Treaty of Nanking (Nanjing), Shanghai became a major treaty port in Asia and “played a

80
metaphorical role of the ‘bridgehead’ – a channel through which foreign products were
distributed to the Yangtze River region and domestic agricultural and mineral products
processed and exported. (Wu 2010, 704)” Guangzhou has been popularly considered one of
the three “first-tier cities” of China36. In South China, it is the largest city in terms of
population, and the third largest in terms of economic size (after Hong Kong and
marginally, Shenzhen). It is listed as an “Alpha-” GWC by the GaWC in 201637. The city
has been China’s major seaport since the Qin Dynasty (221-207 B.C.), and was the starting
point of the world’s then longest sea route in the Tang Dynasty (A.D. 618-907)38. Since
1957, Guangzhou has been holding the biannual China Import and Export Fair, or the
Canton Fair, further establishing itself as a center of China’s foreign trade and commerce.
Ho Chi Minh City, formerly known as Saigon, is the largest city and the industrial,
commercial and financial center of Vietnam. The city grew from a small village to a
modern city under the French rule. After the Vietnamese independence in 1945, growth was
disturbed due to warfare and the newly-established Communist government curtailing
foreign investment and tightening social control. In the 1980s and 1990s, with deregulation
and globalization, the city began to revitalize as a vibrant urban center. With the ascending
of the Vietnamese economy, HCMC also gained weight in the GWC network, ranking the
74th in A.T. Kearney’s 2017 list (A.T. Kearney 2017), and became the leader city of FDI
inflow by metric (A.T. Kearney 2017, 5). HCMC is important to watch as the window to a
mid-sized populous country’s integration into global economy in an intense environment—
many of its neighbors like China, Manila, Cambodia, and Thailand have either been newly
industrialized or compete for the same kinds of investment and market.
In the four chosen cities, two (Shanghai and Guangzhou) are from the same country.
But they are located in two distinct economic regions. Shanghai leads the Yangtze River
36 The other two are Beijing and Shanghai. A later variant is the “four first-tier cities”, with the inclusion of
Shenzhen. Recently there has been a hype of so-called “new first-tier cities (新一线城市)”, alleging cities
like Chengdu or Hangzhou have risen to a comparable level to old first-tier cities. None of the new
variation has underwent serious verification or official endorsement and should not be taken seriously.
37 GaWC, The world according to GaWC 2016, <http://www.lboro.ac.uk/gawc/world2016t.html>, last
access Jun. 15, 2018.
38 Guangzhou Municipal Government, 《历史沿革》 (in Chinese),
<http://www.gz.gov.cn/gzgov/s2774/sq_tt.shtml>, last access Jun. 15, 2018.

81
Delta region or the Huninghang Triangle39; while Guangzhou is the northern center of the
Pearl River Delta region, which also consists of Hong Kong, Shenzhen, Macao, and other
smaller municipalities. The two regions are more than 1000 km apart, and have grown into
relatively separate systems. Therefore, although they are both Chinese cities, they are
considered two different GWCs unrelated to each other.
Third, none of them is the capital city of the country. The capital city, in most cases the
seat of the national government, has the closest access to the central authority and
legislature, both in terms of spatial closeness and convenience of contact and interaction.
The city’s challenges are more exposed to the ruler, and its pleas much easier to reach
persons on higher levels. The capital city is also the immediate living space of the people
performing central functions of the territorial state. “National political authority emanates
from them, and they are home to the most important elites. What happens in these locations
not only orients local politics, economics, and culture, but it also sets national trends and
standards. (Myers 2002, 7)” Moreover, mayoralty of the capital city is usually a valuable
political credential, and capital city mayors/mayoresses are more likely to proceed to
prominent positions in the central administration. Therefore, capital cities presumably
would receive some level of special treatment (Goldsmith 2012, 146). This is a factor
irrelevant to our study, which mainly focuses on the nation’s economic globalization and
economic geography. For this reason, all capital cities in the population are omitted.
Besides, all over the world, the capital city is frequently also the largest and most-
developed city of the country (see Kim and Short 2008, chap. 9). Especially in less
developed countries which lack a balanced urban system, the capital city is regularly the
primate city. They are the urban focal points of political, social, cultural, and even tribal
tensions brought by rapid transformations of the economy and society. Such tensions are
not experienced elsewhere in the country. Administrations have to devise special
mechanisms or institutions for these cities, often resulting in changes in those cities’
autonomy level (e.g. Gore and Muwanga 2014). This is also an unwanted intervening
39 Hu=Shanghai; Ning=Nanjing; Hang=Hangzhou. The three cities constitute the three poles of the Yangtze
River Delta region.

82
factor. Therefore, to ensure our study variables are not eclipsed by it, no capital city is
selected, although I admit some of them are also prominent GWCs.
Fourth, they represent major developing economies in globalization. China and India
are the two largest developing countries, both in terms of population and economy size
(translatable into potential human resource and market). Per the World Bank, in 2016,
China and India combined account for a quarter (24.94%) of the world’s total GDP (PPP,
current international $)40. Since the GWC concept is only made possible by the
geographical dispersal of economic activities from the Western hemisphere to the rest of
the world, and the world city hypothesis itself is about the new pattern of international
economic order, it is imperative that China and India be brought into the debate, otherwise
the picture is incomplete. Both countries are playing bigger roles in the global market (and
world politics), able to exert strong influence in certain economic sectors (e.g. India’s IT
and outsourcing industries and China’s electronic manufacturing) and in their own region
(e.g. China in East and Southeast Asia and India in South Asia). Both countries are among
the top destinations for international TNCs’ expansion; their home-grown TNCs such as
Tata, Lenovo and HNA, are also in the process of international expansion and integration
into the world capitalist system. In 2015, these companies are respectively the 29th, the 47th,
and the 98th largest TNCs in terms of TNI in all developing countries, according to
UNCTAD41. It is highly likely that these two economies’ future advancing (or not) will
bring profound changes to the world power landscape. This is a trend neither the GWC
research or the world city hypothesis can afford to omit.
Vietnam, on the other hand, is a key member of ASEAN, one of the fastest growing
economies in the world. Both Vietnam’s GDP growth rate and level of involvement in
NIDL are relatively high, compared to other Southeastern countries (see figures 7.1, 7.2).
With a population of close to 100 million, the country has attracted increasing attention
from both international capital and the academic circle. It seems to have the potential to
become another noteworthy force in world economy in the next two decades or less, and to
40 World Bank, World Development Indicators, <http://databank.worldbank.org>, last access Jun. 18, 2018.
Calculated by author.
41 UNCTAD, the top 100 non-financial MNEs from developing and transition economies, ranked by foreign
assets, 2015.

83
consequently bring changes to the GWC map. HCMC, its undisputed financial center at
Southeast Asia’s geographical center, merits the attention from GWC observers.
3.6 Small-N study
This is a small-n comparative study of four GWCs in three countries. The aim is to explain
why the four cities show different levels of local autonomy. All being the leading GWC in
major developing economies, these cities are selected on three independent variables
derived from relevant theories on GWC, globalization, and local autonomy. They share
similar macro-backgrounds except on the three IVs. Since the objective is to find out causes
of different outcomes in DV, i.e. the level of city autonomy, a most similar research design
is produced following Mill’s method of difference (Mill 1895). The four cases are
considered being “resembling one another in every other respect, but differing in the
presence or absence of the phenomenon we wish to study. (Mill 1895, 255)” Therefore,
changing values on IVs are expected to be accountable for different value of the DV.
The number of cases, four, is not ideal, since one needs at least six cases to ensure the
two extreme (high and low) values of each IV are present and can be contrasted with the
other two IVs. However, suitable cities, as they must fulfill the foregoing case selection
criteria, are not sufficient in the world. To include not-so-suitable cases weakens our
conclusion. Limited time and language barrier further restrain the number of studiable
cases.
However, the deficiency of inadequate case number can be partly compensated for the
long time span of each cases. To look at one case “across-time” is a useful remedy for case
inadequacy in small-n studies (King, Keohane, and Verba 1994, 219–23). As Lijphart put
it, “an alternative way of maximizing comparability is to analyze a single country
diachronically. Such comparison of the same unit at different times generally offers a better
solution to the control problem…” (1971, 689). For each of the four cities, at least ten
years’ span (the HCMC case) is observed. This guarantees at least two instances in one
city, thus multiplying the observation. It is important that all instances “must indeed contain
an observable implication of the theory (King, Keohane, and Verba 1994, 221)”, so that
such observations can add leverage to causal inferences. For the reasons stated in the next
84
section, only the period after the end of the Cold War until now is examined, so all the
instances observed in each case should bear the same theoretical implications.
3.7 Time span
Overall time span of this research is from the early 1990s to 2017/18, for the following
reasons.
First, the early 1990s, with the end of the Cold War, marks the start of a profound
worldwide trend toward economic liberalization and globalization. It is at this time
globalization as we talk about it today started to pick up speed in a meaningful way. Prior
to this, there was no coherent “global economy” to talk about, because political divisions
and tension hindered capital’s expansion. Since the concept of the GWC is based on an
integrated world economy, and must be viewed on such, it is reasonable to start the
observation at when political divisions ended and globalization started a new wave of
geographic expansion. The geographic dispersal of economic activities “is a key factor
feeding the growth and importance of central corporate functions (Sassen 2001a, xix–xx)”,
which is essential to the GWC. To start our analysis from when such dispersal was made
possible is the logical choice. Also, it was since the early 1990s that China, India and
Vietnam further committed to global capital and established themselves as desirable
destinations for international investment. Inclusion of such huge pools of factors of
production and markets rebooted a potential shuffling of the international division of labor.
The classification of core, semi-core, and periphery regions (especially the latter two)
started a renewed wave of reconfiguration. This is critical to the formation and decline of
world cities. As Friedmann put it, “the world city hypothesis is about the spatial
organization of the new international division of labor (1986, 69)”.
Second, the early 1990s is when all the three countries started to, or have been in the
process of liberalization and globalization. Baskets of policies and revisions were taken to
ensure effective liberalization and connection with world capital. China faced a period of
international boycott and pressure after 1989, which stimulated some domestic debate, but
it eventually sustained domestic reforms and kept integrating into global economy. The
85
then retired Deng Xiaoping’s South Tour to southern coastal cities in 1992 reasserted
reform and opening-up as the country’s development guidelines. This keystone was later
endorsed by China’s central authority (see Zhao 1993). India faced rising inflation and a
financial crisis (balance of payment trouble) about the same time. Internationally,
disturbances caused by the Gulf War, the collapse of the Soviet Union, and a fast advancing
Chinese economy together prompted the country to adopt policy measures “as close to the
Washington Consensus as permitted by domestic conditions” (Nagaraj 1997, 2869). Such
measures had profound impacts on the Indian economy and its international performance.
In Vietnam, the 1986 Renovation (Doi Moi) and especially market-oriented reforms in
1989 was considered a turning point in the Vietnamese economic history. Those changes
led to “remarkable achievements in terms of GDP growth, macroeconomic stabilization,
export expansion, foreign direct investment (FDI) attraction, and poverty reduction” (Thanh
2005, 75). Which nation-wide policies and measures exactly were taken or should have
been taken is not the focus of this research. What is important here is that on the national
level, these countries, at least from this period on, have been officially trying to be part of
the world economy. This makes it possible to talk about changes in their central cities’ local
autonomy as a response to globalization impacts.
Three, data availability. As all data used for this research are official publications by
government and scholarly groups (e.g. GaWC). As yet, digitalization and online publishing
of governmental statistics is still work-in-progress in all case countries. The early 1990s is
when some most relevant data became accessible online. The author, short of time or
financial support, cannot personally conduct field trips to those cities and collect data on
paper storage, therefore relies heavily on Internet, i.e. governmental and international
organization’s websites. This does not miss important periods, because as explained above,
before the 1990s, the importance of the GWC was not nearly as high as they are today to
these countries.
The latest figures, i.e. measurements of 2017/18 are seldom available yet. Some are
simply unpublished; some have not been digitalized and made open to public. However,
changes of local autonomy, which is to be determined by central-local interactions, takes
time to be implemented. A trend, if there is one, also takes more than one year to be
discerned. Therefore, lack of the latest figures or figures for certain year does not

86
compromise our conclusions. Admittedly, being restrained by data availability poses the
danger of investigator-induced selection bias (King, Keohane, and Verba 1994, 132–34).
That danger is not serious here, because suitable cases are still investigated. No cases are
excluded solely on the basis of data availability.
3.8 Data source
To ensure the same statistical methodology is applied in all measurements of an indicator,
governmental statistical yearbooks and governmental international organization datasets are
usually referred to. Although they do change gauges occasionally, but they are mostly
consistent in the methods employed. And public statistics is usually trustworthy source of
openly available data. Statistic yearbooks of India (Economic Surveys), China, and
Vietnam, as well as World Bank database are frequently used for national indicators like
national finance, export and import, FDI, etc.
For the cities themselves, all municipal governments (for Mumbai, the municipal
corporate) have published their statistics (or at least part of them) on their websites. These
sources are heavily used for the statistics of their year-by-year public revenue and
expenditure—a critical indicator of local autonomy level. Although openly accessible, the
city-level data is still less complete than the national level. Occasionally, years of one
measurement is missing or not digitalized. For example, the HCMC government only
publicizes about five issues of statistical yearbook, covering only one decade, thus limiting
the time span we can observe.
Occasionally, like for Mumbai, state- or other level figures are used. Because of the
political and financial structure of the country, certain statistics are not maintained on the
city basis. For example, there is no FDI statistics for Mumbai, because it is simply not
monitored (Ghorpade 2005, 47). In this case, statistics on the closest level, if available, is
used. When doing so, caveat is added about the limited validity of the measurement.
For national figures, if not available from the national platform, governmental
international organization datasets are utilized, e.g. those maintained by the World Bank
and the United Nations. Because of their governmental background, we deem their figures

87
mostly trustworthy. Their datasets also provide certain aggregate data that are not available
from national platforms, e.g. the human development index and the national
decentralization index. They are used to aid relevant arguments.
This is not a content-analysis research, but when necessary, governmental documents,
policy papers and consultancy reports are cited to aid arguments.
One scholarly data is intensely utilized: the world according to GaWC42 maintained by
the Geography Department at Loughborough University, mainly to measure IV2 (intercity
competition). Because it has made its methodology and coverage open (P. J. Taylor 2004;
P. J. Taylor, Catalano, and Walker 2002), and they highly match the need of our study, it is
used without additional processing.
To determine each city’s weight in their national economy, the number of the largest
TNCs or corporations headquartered in that city is counted. Such data comes from the
Forbes 500 list, which is widely cited and generally trusted. However, as yet, not a single
Vietnamese company has made the list, making the same measurement inapplicable to
HCMC. Alternative sources have to be found. The VNR 500 list is used instead. It only
ranks the largest companies doing business in Vietnam.
All sources used are open to public, so the data collection and processing are verifiable
and replicable.
42 GaWC Research Network, <http://www.lboro.ac.uk/gawc/group.html>, last access Apr. 17, 2019.

88
Chapter 4: Case of Mumbai, India
4.1 Introduction
From now on I move to the empirical part and study the four chosen cases. This chapter
examines Mumbai. Besides being the economic, financial, and industrial center of the
largest country in South Asia, Mumbai also sits at the regional geographical center,
embraced by the sub-continent in the east and facing the Middle East and Arab World in
the west with a fine natural harbor which easily connects it with East Africa and beyond.
In GWC studies, Mumbai is a frequent topic. Laurenceson and Kamalakanthan (2004)
find both Mumbai and Shanghai are highly interested in becoming IFCs, yet their prospects
are bleak compared to established western IFCs, and that some fatal hindrances can only be
fundamentally removed on the national level; Ghadge suggests the notion of
“Shanghaization of Mumbai” misplaces emphasis merely on economic growth. Rather,
Mumbai’s more inclusive mode of governance has a higher potential in the long run
(Ghadge 2013); Harris uses the assemblage theory and studies transportation
infrastructure’s role in sustaining and boosting Mumbai’s global relations and GWC profile
(Harris 2013); Phadke investigates urban restructuring during MMR’s ascent as a GWC and
how it affects the peri-urban areas of the Mumbai city region socioeconomically, politically
and culturally (Phadke 2014). Clark and Moonen recently provided a thorough analysis on
Mumbai’s strength, challenges and hindrances on GWC formation (G. Clark and Moonen
2014). A large part of GWC attention to Mumbai focus on local inclusive governance rather
than economic or financial aspects of the city, or the city’s relations with the territorial state
of India.
The chapter is organized as follows. First, a short introduction is made on Mumbai’s
urban policy and political structure changes. Second, India’s history of decentralization and
its effects on local autonomy is briefly reviewed. Third, I go through Mumbai’s local
autonomy change since the early 1990s to 2016 based on the city’s fiscal data,
supplemented by that of Maharashtra. The fourth to six sections are devoted respectively to
the three IVs. A conclusion wraps up the chapter.

89
4.2 Mumbai’s urban structure and politics
Unlike Shanghai or HCMC, Mumbai is not directly under the Indian central authority, but
mediated by the state (provincial) government of Maharashtra. This means the city’s
autonomy level should be understood with respect to the city’s position in the state, in the
country, and also with reference to the state’s position in the country. Analysis is thus
complicated, as there is one more tier involved. However, the three IVs are still
theoretically feasible here. As even with an additional layer of authority, the territorial state
of India still needs a strong and vibrant GWC to articulate its national economy.
The following table represents the division of major public service providers for
Mumbai.
Table 4.1: Levels, actors and their role in the provision of basic services in Mumbai
Set-up level Actors/organization Sectoral relation Role
Central
government
Ministry of Urban
Development
Planning commission
Overall urban
development
Oversee implementation of urban
objectives into policy and action
Maharashtra
state government
Urban development Urban development -
state subject, hence
direct role
Direct management, planning and
development of urban development in the
state
Statutory
authorities
a) water MMRDA; MWSSB Metropolitan planning
water supply and
sewerage
Preparation of local and regional level
urban development plans and water
distribution
b) housing MHADA; CIDCO Poor/power middle
class urban population
Social housing/affordable dwelling
c) health Municipal hospitals Poor/lower middle
class
Free/subsidized health care
Private clinics Upper middle and
affluent sections
Emergency and quality health care
Super specialty
hospitals
Affluent customers Advanced and high-cost health care

90
d) transport MSRDC railways
(central gov.)
Road development
catering to a majority
of commuters
Catalyst for public and private transport
augmenting rail services through MU;
MUTP initiative
Municipal/local
government
Local authorities,
BMC, municipal
councils
Urban local areas City administration and development
International
agencies
UNDP, WB, ADB,
etc.
Transportation, slum
redevelopment, etc.
varied
Non-
governmental
organizations
(NGOs) –
state/local
SPARC; YUVA;
CEHAT
Housing and health Persuasive, collaborative and advocacy
role
Private sector
enterprises /
corporate sector
and MNC
Tata, Birla,
Mahindra, Bajaj, etc.
Transportation, health,
education, housing
Fulfilling corporate, social and
community responsibility (?)
Source: (Mohan 2005, 194–95), with author’s alterations.
Central, state and local levels of government all take part in Mumbai’s municipal
governance, but few future-oriented decisions are made at the local level—this already
implies an intrinsic lower level of autonomy. For example, the Indian central government is
in charge of overseeing implementation of urban tasks and objectives, placing the
municipal government in its subordination. Moreover, services highly pertinent to the city’s
future growth (e.g. railway transportation and aviation) are not assigned to the local level.
Moreover, the Indian central government is in charge of overall urban planning of the
territorial state, while the Maharashtra state in charge of state projects, therefore adopts a
more direct role. Much urban-related tasks and measures are carried out by the state. The
city itself holds the Mumbai Metropolitan Region Development Authority (MMRDA).
Other functions are spread among different bodies, including governmental and non-
governmental organizations and private enterprises. The United Nations, World Bank, and
Asian Development Bank have devoted much efforts in slum redevelopment, an enduring

91
problem plaguing the city; and home-grown enterprises like Tata Group also partake in
health and educational sectors, etc.
In sum, the highest-level urban development planning is performed at the national and
the state level. Although Mumbai retains its own agency of development planning
pertaining to GWC growth, its efficacy, however, has been low (Chattaraj 2012). Other
daily services are shared between public and private sectors. These services affect the city’s
image as India’s leading GWC, but are not directly linked to the city’s local autonomy
level, so they are not discussed here. The framework set for Mumbai is a strong-center,
stronger-state, weak-local one. This gives the territorial state more leeway to decide
whether and how much power to devolve; even larger leeway is contained at the
Maharashtra state level. This makes it theoretically more possible to test our hypotheses.
4.3 India’s decentralization and local autonomy
With a federal structure, India inherently has a relatively higher degree of decentralization,
or local autonomy. This is partly a major legacy of British colonial rule, in which colonists
“tried to rule with the minimum necessary use of force, honoring local customs,
accommodating local rulers and transforming local and regional power into props of
imperial rule (Mitra 2011, 35–37)”. Local forces and self-identities are thus partly
recognized and kept until today.
Before the constitutional amendment in 1992, India formally had a two-level
government: the central level and the state level. Local (sub-state) level government merely
existed ad hoc. They were only created in rural areas by state governments and acted as
their agencies. In urban areas, some state governments created urban corporates or
municipalities granted with certain level of power to run local public services. But “the
framework was not adequate and the system was not congenial for the development of local
self-government in most of the States (Rao 2001, 5)”. In this structure, cities had little local
autonomy to speak of: “local government was a state subject and its administration was
entirely left in the control of the state legislature (Aijaz 2008, 150)”. Most local
governments were unable to provide public services adequately and sufficiently, not to
mention devise own development plans. Such plans, if any, were to be devised and carried
out by the state-, cross-state, or higher levels.
92
Local-level government was officially recognized in the 74th constitutional amendment
in 1992, which stipulates states to pass legislation for local panchayat raj institutions and
municipal acts within a certain period. 37 activities are assigned to urban local governments
(Rao 2001, 6). Cities also became able to set up own agencies for some public services.
Contrary to usual expectation of a federal political system, India’s decentralization
below the state level came from the central rather than the local (Rao 2001, 6). This
centralized feature is partly because India’s high level of diversity necessitates central
authority to allow localized treatments, and partly because of the legacy of the colonist rule.
The Indian political system “has attempted to combine elements of a modern state with the
historical legacies of the pre-modern past. (Mitra 2011, 93)” Generally, the constitutional
amendment gives official recognition to more local autonomy. Local powers are formally
expanded and integrated into the constitutional framework. “Municipalities in India are
being slowly empowered to emerge as viable units of governance at the local level and to
be able to discharge their duties and powers in an efficient manner. (Aijaz 2008, 150)”
However, the autonomy is still heavily subject to higher authorities’ discretion. And of
course, each states and centrally controlled territories fare differently in their local level
autonomy.
In terms of division of responsibilities, functions with significant nationwide
ramifications are naturally ascribed to the central authority. These include money supply,
external borrowing, diplomacy, national defense, national transportation systems, etc. Some
functions with implications across states or with certain national importance (preventive
detention, bankruptcy, economic and social planning, etc.) are concurrently ascribed to
states and the center—this is a special feature of Indian federalism (Mitra 2011, 91).
Functions with state-wide implications are ascribed to the states. These include land
revenue, certain taxes, stamp duties, registration fees, etc. Residual functions and tax
powers belong to the center (Rao 2001, 8). Still, the sub-state level of government has no
legal right to exclusive fiscal power. Their power to levy taxes and fees and to invest in
public services are granted by the state government. State governments also transfer
resources or grants-in-aid to local governments.
What is highly relevant to our study is, with the new constitutional amendment that
came into effect in 1992, “the basic objective of an urban local government has changed
from the maintenance of law and order in the early years to the promotion of the welfare of

93
the community...” (Aijaz 2008, 139). Furthermore, the 74th amendment act also grants new
functions to municipalities (through state acts), one of which being “planning for economic
and social development”, enabling local municipalities to tailor-make growth plans and
policies. Also, in 2005, India initiated the Jawaharlal Nehru National Urban Renewal
Mission (JNNURM)43, a massive urban-modernization plan to help Indian cities “to realize
their full potential and become true engines of growth” (JNNURM Directorate, n.d., 1), yet
the program has made little impact (Chattaraj 2012, 28). Ten years later, the program was
updated and renamed as Atal Mission for Rejuvenation and Urban Transformation
(AMRUT)44, and its efficacy remains unclear as yet.
In general, in India, although local autonomy has a long history and has been
constitutionally recognized since the 1990s, unlike conventional federal systems, it is still
strongly influenced by higher authorities. This is also important for our study as such
system plays up the territorial state’s role, partly compensating for a federal system’s
inherently higher levels of local autonomy.
Table 4.2: Indian General Governments’ Consumption, 1993-2013 (Rs. crore)
43 Www.jnnurm.gov.in
44 “JNNURM 2.0 to be named after Vajpayee”, The Times of India, Feb. 3, 2015,
<https://timesofindia.indiatimes.com/india/JNNURM-2-0-to-be-named-after-
Vajpayee/articleshow/46102222.cms>, last access Aug. 1, 2018.
Year Central % State % Local %
1993-1994 34624 40.29% 42035 48.91% 9278 10.80% 85937
1997-1998 45789 41.82% 50893 46.48% 12807 11.70% 109489
1998-1999 52723 42.48% 57648 46.45% 13740 11.07% 124111
1999-2000 88847 40.12% 105449 47.62% 27143 12.26% 221439
2000-2001 85673 38.44% 109232 49.01% 27955 12.54% 222860
2001-2002 88423 38.94% 109885 48.39% 28756 12.66% 227064
2002-2003 88353 39.36% 106347 47.38% 29749 13.25% 224449
2003-2004 83159 36.49% 114479 50.23% 30281 13.29% 227919
2004-2005 90552 28.03% 144752 44.82% 62331 19.30% 322997
2005-2006 96330 27.35% 157847 44.81% 67285 19.10% 352237
2006-2007 96728 26.52% 168313 46.15% 68496 18.78% 364720
2007-2008 107986 26.99% 189451 47.35% 71758 17.94% 400094
2008-2009 124976 28.16% 205179 46.22% 72716 16.38% 443876
2009-2010 158059 31.04% 233015 45.76% 77448 15.21% 509186
2010-2011 158280 29.38% 256361 47.58% 85394 15.85% 538807
2011-2012 162460 28.21% 277596 48.20% 95679 16.61% 575954
Central
government
State
governments
Local
authorities
Total final
consumption
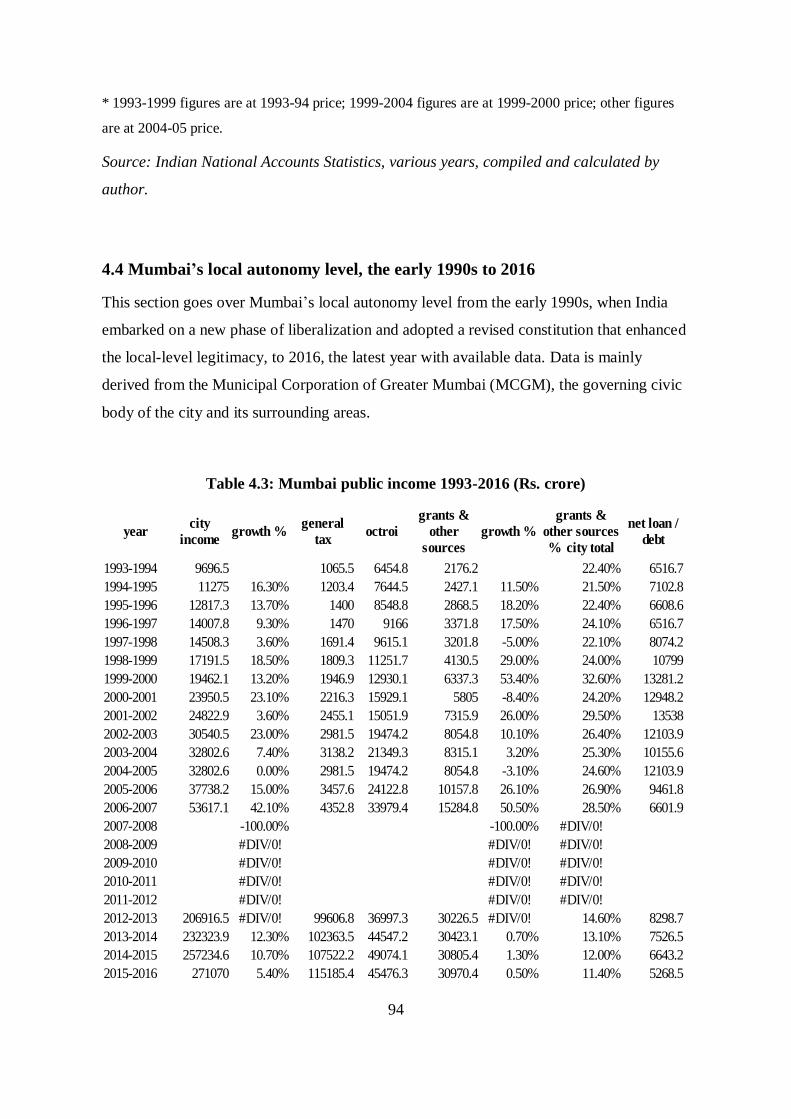
94
* 1993-1999 figures are at 1993-94 price; 1999-2004 figures are at 1999-2000 price; other figures
are at 2004-05 price.
Source: Indian National Accounts Statistics, various years, compiled and calculated by
author.
4.4 Mumbai’s local autonomy level, the early 1990s to 2016
This section goes over Mumbai’s local autonomy level from the early 1990s, when India
embarked on a new phase of liberalization and adopted a revised constitution that enhanced
the local-level legitimacy, to 2016, the latest year with available data. Data is mainly
derived from the Municipal Corporation of Greater Mumbai (MCGM), the governing civic
body of the city and its surrounding areas.
Table 4.3: Mumbai public income 1993-2016 (Rs. crore)
year growth % octroi growth %
1993-1994 9696.5 1065.5 6454.8 2176.2 22.40% 6516.7
1994-1995 11275 16.30% 1203.4 7644.5 2427.1 11.50% 21.50% 7102.8
1995-1996 12817.3 13.70% 1400 8548.8 2868.5 18.20% 22.40% 6608.6
1996-1997 14007.8 9.30% 1470 9166 3371.8 17.50% 24.10% 6516.7
1997-1998 14508.3 3.60% 1691.4 9615.1 3201.8 -5.00% 22.10% 8074.2
1998-1999 17191.5 18.50% 1809.3 11251.7 4130.5 29.00% 24.00% 10799
1999-2000 19462.1 13.20% 1946.9 12930.1 6337.3 53.40% 32.60% 13281.2
2000-2001 23950.5 23.10% 2216.3 15929.1 5805 -8.40% 24.20% 12948.2
2001-2002 24822.9 3.60% 2455.1 15051.9 7315.9 26.00% 29.50% 13538
2002-2003 30540.5 23.00% 2981.5 19474.2 8054.8 10.10% 26.40% 12103.9
2003-2004 32802.6 7.40% 3138.2 21349.3 8315.1 3.20% 25.30% 10155.6
2004-2005 32802.6 0.00% 2981.5 19474.2 8054.8 -3.10% 24.60% 12103.9
2005-2006 37738.2 15.00% 3457.6 24122.8 10157.8 26.10% 26.90% 9461.8
2006-2007 53617.1 42.10% 4352.8 33979.4 15284.8 50.50% 28.50% 6601.9
2007-2008 -100.00% -100.00% #DIV/0!
2008-2009 #DIV/0! #DIV/0! #DIV/0!
2009-2010 #DIV/0! #DIV/0! #DIV/0!
2010-2011 #DIV/0! #DIV/0! #DIV/0!
2011-2012 #DIV/0! #DIV/0! #DIV/0!
2012-2013 206916.5 #DIV/0! 99606.8 36997.3 30226.5 #DIV/0! 14.60% 8298.7
2013-2014 232323.9 12.30% 102363.5 44547.2 30423.1 0.70% 13.10% 7526.5
2014-2015 257234.6 10.70% 107522.2 49074.1 30805.4 1.30% 12.00% 6643.2
2015-2016 271070 5.40% 115185.4 45476.3 30970.4 0.50% 11.40% 5268.5
city
income
general
tax
grants &
other
sources
grants &
other sources
% city total
net loan /
debt

95
Source: Municipal Corporation of Greater Mumbai, author’s calculations.
Since local government was officially recognized in 1992, MCGM only started to
provide public fiscal data since 1993. As per Table 4.3, Mumbai’s municipal income today
is 28 times that of 1993. This means the MCGM’s financial power has grown significantly
during the past two decades. However, we also witness pronounced turbulence in the
trajectory. The author cannot adequately explain this turbulence. Facing such great rises
and falls in the income, an average does not seem necessary or meaningful. What can be
safely drawn is that municipal income has risen significantly through the last two decades,
and that in each fiscal year the city collects more (or relatively the same) revenue than the
last year. There is no income drop during this period45.
One possible cause of such fluctuation is the changes in octroi, a tax levied by a locality
on articles entering its jurisdiction for consumption. It is a tax abandoned by most countries
and regions, but still used in Pakistan, Ethiopia, and the Maharashtra State of India. Octroi
is the main source of revenue (MCGM 2007, 1) and accounts for more than half of
MCGM’s municipal income, and there is a high relevance between Mumbai’s octroi and
fiscal income. E.g. the aforementioned 42.1% income growth in 2016-17 is accompanied
by a 40.9% growth in octroi, while the 3.6% income growth in 2001-02 is accompanied by
a 5.5% fall in octroi. The state of Maharashtra once temporarily replaced octroi with local
body tax (LBT) in 201346, only to reverse the decision the next year, finding the LBT
cannot make up the gap47. The decision to abolish and reinstall octroi is made at the
Maharashtra State level, further illustrating that in some critical areas, Mumbai is still
subject to higher authorities about two decades after the constitutional recognition of local
governments.
45 Except the fiscal years between 2007-2012. Details for these years are not readily readable from the
MCGM fiscal publications.
46 Press Trust of India, “Maha to scrap octroi this year, expand ambit of LBT: Chavan”, Business Standard,
March 18, 2013 <https://www.business-standard.com/article/pti-stories/maha-to-scrap-octroi-this-year-
expand-ambit-of-lbt-chavan-113031800340_1.html>, last access Jul. 20, 2018.
47 Ashish Roy, “Octroi to replace local body tax next week”, The Times of India, Jun 9, 2014
<https://timesofindia.indiatimes.com/city/nagpur/Octroi-to-replace-local-body-tax-next-
week/articleshow/36262057.cms>, last access Jul. 20, 2018.
96
We also observe grants and other sources. This is a part of fiscal transfer from the state
and the national levels to the municipal corporation to carry out tasks and plans made by
the state or the nation. In 1993-1994, the share was 22.4% of total income. The figure
stayed relatively stable until 2006-07, when it read 28.5%. During these 15 years, it
fluctuated between a third (32.6% in 1999-2000) and a fifth (21.5% in 1994-95), but the
change was not as radical as that of the total city income. Exact figures for 2007-2012 is not
available, and in the 2012-13 fiscal year, grants were almost cut in half, dropping to 14.6%.
The later years all saw a gradual decline, which ended at merely a tenth (11.4%) of city
income in 2015-16. Through the years, we see the first peak of governmental grants from
1998 to 2002. Another peak is seen three years later.
Grants and other sources’ share in the city’s total income is more stable. This is because
this sector only accounts for a quarter of the total, and is further shrinking. What can be
read from it? First, no steady trend in grants reflects a possible lack of long-term state and
national level commitment in Mumbai’s development. Two, the share of grants increased
from a fifth to a third between 1993 and 2007, then dropped to a tenth now. Generally, it
means resources transferred from higher levels first rose then fell, so is the local autonomy
enabled by this part of income. In the last years, the money MCGM received remained
relatively the same and did not increase with economic growth, pointing to a possible
shrink of local autonomy.
The third item is the loan or debt the city issues. The power to take out loans and
borrow debts is an important aspect of local autonomy. A city freer to get loans and debts is
certainly more autonomous than a city who cannot or must require higher approvals to do
so. In 1993-94, the city took out 6516.7 crore INR—about 67.2% of its annual income. In
the two decades since then, the figure ranged between 13281.2 crore INR in 1999-2000
(68.2% of total public income) and 5268.5 crore INR in 2015-16 (a mere 1.9% of total
public income). Again, the fluctuations in this item do not seem to follow any clear pattern.
When read together with the city’s total public income, no evident relation emerges.
Neither is there any visible link between debts and loans and inter-governmental grants.

97
4.5 Mumbai’s local autonomy level from the angle of Maharashtra
Mumbai is not directly positioned under the Indian central government, rather, it is also
subordinated to the state of Maharashtra. Therefore, it is also necessary to examine the
state’s fiscal relations with the center. Due to limitations in data categorization, the fiscal
reports by MCGM do not distinguish between grants and transfers from the central
government and those from the state government. The relation reflected by the aggregate
figure is between the city on one side and both Maharashtra and New Delhi on the other. It
renders us unable to tell which level is transferring more power to the city.
To soften the intervening effect, I contrast the grants from central government to the
state and the grants from upper governmental levels to Mumbai. If there is a parallel trend
of increase or decrease between the two, then maybe it is not because of Mumbai’s own
faring, rather, the change is taking place on a grander scale. On the contrary, if the figures
for Maharashtra and that for Mumbai is displaying different trajectories, then it is more
likely that what is happening in Mumbai is not seen elsewhere in the state, and we can draw
more meaningful conclusions from it. If the two display similar trends but with different
intensities, it is also a sign that the difference is caused by Mumbai’s special characteristics.
Due to the availability of the Maharashtra State statistics, we only contrast the state and
the city statistics from 2001 until today. When there was a surge of central grant in 2003-04
(a 50.73% increase) to the state government, grants to MCGM dropped by 16.1%. When
the central grant to Maharashtra almost doubled (+97.48%) in 2006-07, those sent to
Mumbai shrank for 30.2% in the same year. Into the second decade of the century, the
divergence continues. The sharp contrast strongly signals that Mumbai is a special case in
Maharashtra State. Although the state sits between the GWC of Mumbai and the territorial
state of India, Mumbai still retains its special characteristics—at least in terms of fiscal
transfer.

98
Table 4.4: State of Maharashtra revenue and grants from central government, 2001-2017
Source: Annual Fiscal Statement, various years, GoM, calculated by author.

99
4.6 Indian economy’s global integration and Mumbai’s local autonomy
This part analyzes whether India’s integration into global economy influences Mumbai’s
local autonomy level as a GWC. The financial crisis that befell India in the early 1990s led
to broad reforms with the goal to “spur Indian growth by fostering trade, FDI, and portfolio
equity while avoiding debt flows that were perceived as potentially destabilizing (Lane and
Schmukler 2007, 117).” By examining the import and export’s percentages and foreign
direct investment’s percentages to India’s annual GDP, a picture of how much of India’s
national economy is integrated in globalization is generated.
4.6.1 Indian import and export’s share in its GDP and Mumbai’s local autonomy
After independence from the British rule, the Indian economy was largely autarchic. There
was no coherent national strategy regarding international trade and commerce. It was only
in the early 1990s— when the country encountered a fiscal crisis—that India started a new
wave of liberalization and internationalization. In 1990, foreign trade only accounted for
15.7% of GDP. The following decade saw the figure gradually climb to 27.2%—almost
doubled. The peak is recorded in 2012 at 55.8%. It means its international trade is more
than half of the country’s GDP size. The Indian national economy is substantially more
sensible and vulnerable to international markets. The percentage then gradually fell to
39.8% in 2016.
Figure 4.1: Indian imports and exports of goods and services, % of GDP
Source: World Development Indicators, World Bank.
0
10
20
30
40
50
60
1990 1992 1994 1996 1998 2000 2002 2004 2006 2008 2010 2012 2014 2016
Exports % of GDP Imports % of GDP Import+Export % of GDP

100
Through the 26 years, three phases can be discerned. First, from 1990 to 2003, import
and export rose smoothly for more than a decade, from 15.7% to 30.9%. The 1998 Asian
financial crisis did not make a visible impact on India. During this phase, Mumbai’s fiscal
income also saw an upward trend (with occasional dips), with a relative annual growth rate
of approx. 10%. Grants from higher levels saw greater expansion. It suggests an intentional
devolution of power to the municipal level. However, the percentage of such grant in
Mumbai’s municipal total did not change that much, meaning its contribution to the whole
municipal revenue was limited. The local loans and debt, on the other hand, see expanded
less. Nationally, expenditure by local authorities registered a small increase from 10.8% to
13.25% of all governmental expenditure. Read together, there is a slight sign of autonomy
expansion in Mumbai faster than other localities in India.
The next phase is from 2004 to 2013, when the percentage stayed relatively high at
close to a half. This period echoed the prime time of globalization in the 21st century, when
the world’s import and export stayed above 25% of the world’s total GDP size (see figure
4.2). During this period, not only Mumbai’s issuing of local loans descended from 31% of
the city’s total income to just 3.2%, but also the fiscal resource it received from upper
governments fell from 25.3% of the municipal revenue to 13.1%. Both point to absence of
local autonomy increase—the city did not take out more loans, nor did it receive more
money from higher authorities. It is premature to decide whether the seemingly reverse
correlation is the case. But at least there is no convincing evidence of a parallel increase in
local autonomy.
Figure 4.2: World’s Export and Import of Goods and Services, % of GDP
0
10
20
30
40
50
60
70
Imports of goods and services (% of GDP) Exports of goods and services (% of GDP)

101
Source: World Development Indicators, World Bank
The third phase is from 2013 on, when the percentage slowly fell from approx. 54% in
2013 to approx. 40% in 2016. The world’s globalization level did not see a same decline.
This means Indian economy’s domestic expansion was faster than its international
integration. During the last years, increase of Mumbai’s municipal income grew at a slower
place. Grants from higher levels, on the other hand, stayed relatively the same. Mumbai’s
local autonomy during this phase still did not increase or decrease fiscally. The city neither
obtained more fiscal transfer, nor took out more loans. In the meantime, the state of
Maharashtra received much more grants since the 2014-15 fiscal years. This is in contrary
to what is happening on the Mumbai city level—further confirming an absence of local
autonomy raise.
4.6.2 India’s FDI inflow and outflow and Mumbai’s local autonomy level
India’s FDI increased gradually over the period of observation—its percentage to GDP rose
from almost nil to 1.23%. It drastically increased after 2006 and peaked in 2008 to 5.28%
of GDP. The percentage then plummeted to 2.62% in 2010 and stayed below 3% ever
since. Proponents of FDI is popular among developing countries including India and China,
they suggest that “because it embodies technology and know-how as well as foreign capital,
FDI can benefit host economies through knowledge spillovers as well as linkages between
foreign and domestic firms (Alfaro and Johnson 2013, 300).” The more FDI is flowing
to/from a territorial state, its economy is more closely linked with the world.
India discourages external debts. There are barriers to its domestic companies to issue
foreign bonds, or foreign investor to enter Indian domestic bond market. Indian banks are
not allowed to hold external assets except governmental bonds. However, equity inflow
regulations have been loosened significantly since the early 1990s. Restrictions on FDI
inflow and outflow are still in place, although being progressively relaxed. Also, the Indian
authority tries to stabilize the actual exchange rate of INR against UDS, thus imposing a de
facto limitation on capital flows (Lane and Schmukler 2007, 117–18). India displays some
typical attitudes of a developing country toward FDI: increased interest in reaping its
benefits, restrictions abound, yet in a gradual process of relaxation.

102
Figure 4.3: India’s FDI net inflow and outflow (% of GDP), 1990-2017
Source: World Development Indicators, World Bank
As per the figure above, India’s FDI flow rose significantly since 2006. Grants from
higher levels of government to Mumbai seemed to rise too. Nonetheless, as
aforementioned, the percentage of grants in the city’s revenue actually fell, as Mumbai was
collecting drastically more money. In total, the effects of such devolution were mild. In
Maharashtra figures, we also see a great increase in grants. The state’s own revenue’s
percentage in its total revenue decreased significantly, from 22.65% in 2005-06 to 10.44%
in 2006-07. This was accompanied by a doubling of central grants, which went from 2694
crore to 5320 crore INR. It echoed Mumbai’s situation, meaning the trend is at least state-
wide, rather than Mumbai-specific.
After the 2008 financial crisis, FDI flow’s percentage to Indian GDP fell to below 3%
in 2010 and stayed there afterwards. It is reflected in the grants’ share in Mumbai municipal
revenue. There probably was a decrease of local programs initiated by the state and national
governments. However, grants to Maharashtra after 2008 rose evidently. This is in contrary
to Mumbai, confirming our assessment that Mumbai is a special case in Maharashtra.
-1.00
0.00
1.00
2.00
3.00
4.00
5.00
6.00
1990 1992 1994 1996 1998 2000 2002 2004 2006 2008 2010 2012 2014 2016
Foreign direct investment, net inflows (% of GDP)
Foreign direct investment, net outflows (% of GDP)
Foreign direct investment, total (% of GDP)

103
4.6.3 Summary
In this part, I used two indicators to evaluate Indian economy’s global integration: the
percentage of import and export to GDP, and the percentage of FDI inflow and outflow to
GDP. Indicators show a steady deepening of the global integration of the Indian national
economy. However, the integration has gradually declined since the mid-2010s, when
import and export, as well as FDI accounted for less and less share of GDP. Whether such
decline marks the beginning of a new phase in India’s economy, or it is just an occasional
descend, is uncertain yet.
Our hypothesis expects a positive relation between a territorial state’s global integration
and its GWC’s local autonomy. Empirical observations fail to suggest a convincing
relation. Despite the clear trend of global integration (and its slowing down since the mid-
2010s), there was no consistent rise or fall in Mumbai’s local autonomy. There might be a
link between the rapidly increasing FDI and the rise of fiscal grants to lower levels, yet it
does not bear out in all time phases. Moreover, the sum of that increase in grants is
insignificant for the total revenue of the city. Therefore, the first hypothesis is not entirely
validated.
4.7 Intercity competition and Mumbai’s GWC’s local autonomy
This part tests the second hypothesis: competition from neighboring GWCs leads to higher
level of Mumbai’s local autonomy. To determine the level of competition Mumbai faces, I
use the World According to GaWC rankings. I contrast all major South Asian and Middle
Eastern GWCs’ positions and changing trajectories to that of Mumbai. If a city gets closer
to Mumbai in its ranks, it means it poses stronger competition. Also, if a city ascends fast, it
also implies increasing competition from that city.
Since all relevant cities are just GWCs with a regional influence, it is only necessary to
consider Mumbai’s neighborhood. The scope of competition is delimited to South Asian
and Middle Eastern cities. Western African coast cities should also be considered, yet none
of them has qualified as a GWC. Indian cities are given higher attention, as they are more
likely and easier to become genuine competitors to Mumbai as potential GWCs that
articulate the Indian economy. All Indian cities ever made the lists are observed.

104
To complement GaWC, I also look at stock exchanges in the same region. It reflects the
amount of capital circulating in each city’s security platform.
4.7.1 Intercity competition as per the World According to GaWC
For Mumbai, I trace 17 cities as potential competitors. Among them, all Indian cities ever
made the list are included, but not all of them are traced through the whole period, because
many are only rated “S” (sufficient, the lowest level), therefore pose little challenge to
Mumbai.
Table 4.5: Mumbai Intercity Competition, GaWC Source, 2000-2018
City Country/Region 2000 2004 2008 2010 2012 2016 2018
Mumbai India α- α- α α α α α
Dubai UAE β β β+ α+ α+ α+ α+
Istanbul Turkey β+ β α- α- α- α α
New Delhi India β β- β+ α- α- α- α-
Kuwait City Kuwait γ- HS β γ+ β- β- β
Bangalore India γ+ γ+ β β+ β+ β+ β+
Doha Qatar S S γ- γ+ β β β+
Karachi Pakistan γ+ γ β- β β β β
Chennai India γ γ+ γ+ β β β- β
Lahore Pakistan HS S HS γ+ γ+ β- γ+
Calcutta India γ HS γ β- β- β- γ
Hyderabad India / S HS γ+ β- β- γ+
Dhaka Bangladesh HS / HS S HS β- β-
Islamabad Pakistan HS S γ- γ- γ+ β- γ
Colombo Sri Lanka HS HS HS γ- γ γ- γ+
Muscat Oman / / S γ- γ γ+ γ+
Pune India / / S γ- γ- γ γ+
Ahmedabad India / / / HS γ- γ γ
Abu Dhabi UAE γ- γ S β- / β β
Number of same-country cities in HS level and above
5 5 6 8 8 8 9
Source: The World according to GaWC, various issues, GaWC, calculated by author.

105
With the exception of Dubai, UAE, Mumbai has always been the leading GWC in the
region. Karachi, Pakistan is at least two ranks below Mumbai, not to mention all other
competitors. The only real international challenger is Dubai, who started at the beta level
and surpassed Mumbai in 2010, then stayed at the “alpha+” level, among the most
prominent GWCs. Some Middle Eastern cities like Doha and Abu Dhabi also saw
noteworthy rise in the ranks, with Doha steadily climbing from “HS” to “beta+”. Abu
Dhabi came from “gamma” to “beta” in the latest ranking. There is an evident ascent of
Middle Eastern GWCs. Yet most of them are still substantially below Mumbai. The most
successful one, and the only real challenger, is Dubai.
Domestically, New Delhi has always tightly followed Mumbai. The Indian capital has
been only one tier below Mumbai ever since 2010, posing a strong challenge. Many other
Indian cities (e.g. Hyderabad) also rose incrementally. The Telangana state capital grew
significantly in finance, information technologies and pharmaceutical production. Together
with Bangalore, now the third most “global” city of India, they signal a possible changing
pattern of Indian GWCs—the rise of southern metropolises. However, it is still premature
to expect them to shake the Mumbai & New Delhi domination.
Figure 4.4: Intercity Competition for Mumbai According to GaWC (International)
12=α++; 11=α+; 10=α; 9=α-; 8=β+; 7=β; 6=β-; 5=γ+; 4=γ; 3=γ-; 2=high sufficiency;
1=sufficiency; 0=not in the ranking.
0
1
2
3
4
5
6
7
8
9
10
11
12
2000 2004 2008 2010 2012 2016 2018
Mumbai Dubai Istanbul Kuwait City
Doha Karachi Lahore Dhaka
Islambad Colombo Muscat Abu Dhabi
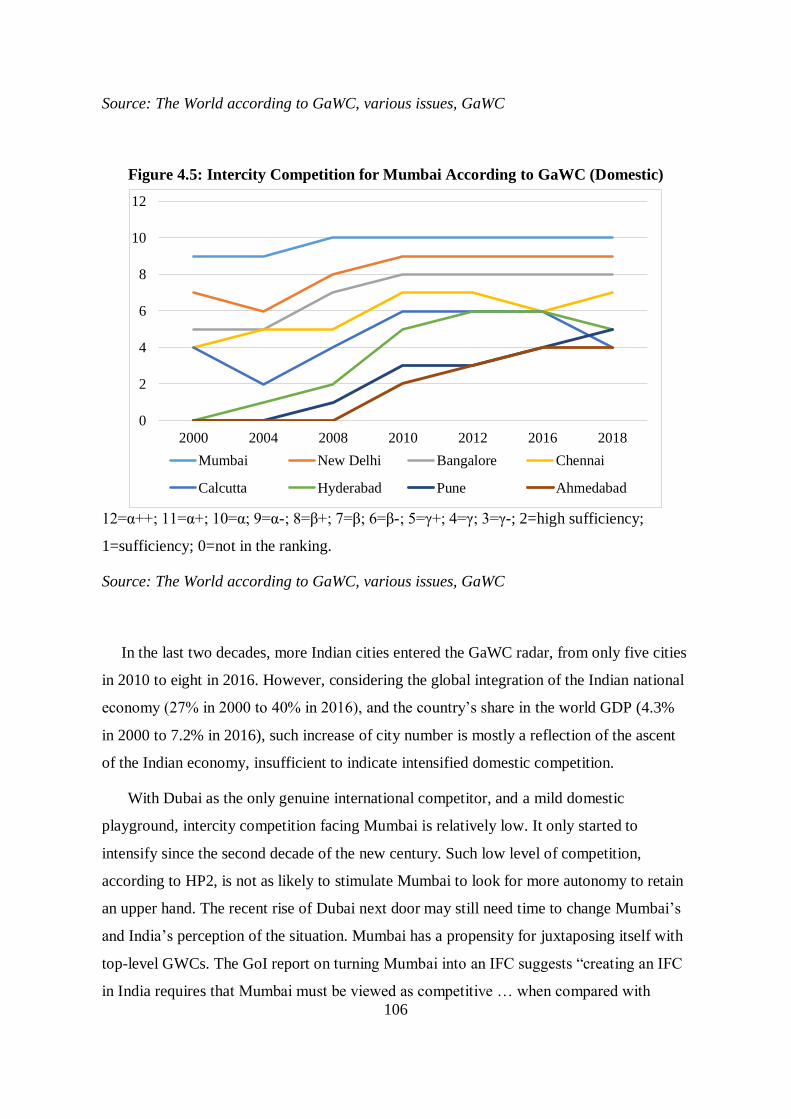
106
Source: The World according to GaWC, various issues, GaWC
Figure 4.5: Intercity Competition for Mumbai According to GaWC (Domestic)
12=α++; 11=α+; 10=α; 9=α-; 8=β+; 7=β; 6=β-; 5=γ+; 4=γ; 3=γ-; 2=high sufficiency;
1=sufficiency; 0=not in the ranking.
Source: The World according to GaWC, various issues, GaWC
In the last two decades, more Indian cities entered the GaWC radar, from only five cities
in 2010 to eight in 2016. However, considering the global integration of the Indian national
economy (27% in 2000 to 40% in 2016), and the country’s share in the world GDP (4.3%
in 2000 to 7.2% in 2016), such increase of city number is mostly a reflection of the ascent
of the Indian economy, insufficient to indicate intensified domestic competition.
With Dubai as the only genuine international competitor, and a mild domestic
playground, intercity competition facing Mumbai is relatively low. It only started to
intensify since the second decade of the new century. Such low level of competition,
according to HP2, is not as likely to stimulate Mumbai to look for more autonomy to retain
an upper hand. The recent rise of Dubai next door may still need time to change Mumbai’s
and India’s perception of the situation. Mumbai has a propensity for juxtaposing itself with
top-level GWCs. The GoI report on turning Mumbai into an IFC suggests “creating an IFC
in India requires that Mumbai must be viewed as competitive … when compared with
0
2
4
6
8
10
12
2000 2004 2008 2010 2012 2016 2018
Mumbai New Delhi Bangalore Chennai
Calcutta Hyderabad Pune Ahmedabad

107
alternatives like Singapore or London” (Ministry of Finance 2007, XIII). The report expects
that “... Mumbai must develop that capacity to compete with the three established GFCs for
global IFS business that goes beyond meeting India’s needs” (Ministry of Finance 2007,
xv, original emphasis). It acknowledges London, New York, and Singapore as the only
three GFCs in the world (Ministry of Finance 2007, XIV). Dubai, in the meantime, was
only considered a regional center. Clearly, there is very high hope and confidence for
Mumbai, and subconsciously Mumbai (and India) may be insensitive to its neighboring
cities’ potentials and the challenge they pose.
4.7.2 Intercity competition as per stock exchanges
Mumbai is the indisputable center of stock trading in India. India’s two largest stock
markets, the Bombay (Mumbai) Stock Exchange (BSE), and the Indian National Stock
Exchange (NSE) are both located in the city, together with some smaller exchanges (see
table below). The Bombay Stock Exchange, set up in 1875, is the oldest in South Asia and
Middle East. Together with NSE, they account for a lion’s share of market capitalization in
all India’s stock exchanges. In terms of center for market capitalization, Mumbai faces little
domestic challenge.
Table 4.6: Stock Exchanges based in Mumbai as of 2018
Name Year of founding
Bombay Stock Exchange 1875
Indian National Stock Exchange 1992
Inter-Connected Stock Exchange 1998
MCX Stock Exchange 2008
OTC Exchange of India 1990
United Stock Exchange of India 2010
Source: author.

108
Regionally, the picture is largely the same. As per table 4.7 and figure 4.6, the two
stock exchanges in Mumbai are also the largest in the whole region. Their market
capitalization is more than double the total market capitalization of all other markets
combined, indicating Mumbai’s unshakable position as the regional financial center. If
there is any challenge, then it is the United Arab Emirates, who set up two new markets in
Abu Dhabi and Dubai in 2000. Shortly prior to that, Qatar set up its own market in Doha in
1995. But the new exchanges are still in a nascent stage, with market capitalization way
smaller than that of Mumbai. I do not have statistics of the growth rate of each stock
markets, so whether the new competitors are rising faster compared to the two in Mumbai
is uncertain. Again, lack of real competition makes Mumbai (and India) relatively
insensitive to other cities’ performances, and somewhat reluctant to make extra efforts to
stay in the lead.
Table 4.7: Largest Stock Exchanges in Mumbai’s Neighborhood (billion US$)
* This indicates the year of actual commencement of operation; if there is a precursor, then
it is the year when the precursor started operations.
Source: compiled by author; market capitalization figures from stockmarketclock.com, last
access Jun. 9, 2018.
Name Symbol City
Bombay (Mumbai) Stock Exchange BSE Mumbai 1875 1660
Indian National Stock Exchange NSE Mumbai 1992 1630
Saudi Stock Exchange TADAWUL Riyadh 1984 442.46
Tel-Aviv Stock Exchange TASE Tel-Aviv 1935 212.28
Qatar Stock Exchange QE Doha 1995 156.3
Abu Dhabi Securities Exchange ADX Abu Dhabi 2000 116.95
Tehran Stock Exchange TSE Tehran 1967 98.57
Dubai Financial Market DFM Dubai 2000 89.18
Dhaka Stock Exchange DSE Dhaka 1954 39.26
Chittagong Stock Exchange CSE Chittagong 1995 37.65
Amman Stock Exchange ASE Amman 1999 24.71
Bahrain Stock Exchange BHB Manama 1989 20.69
Colombo Stock Exchange CSE Colombo 1985 18.18
Year of
Founding*
Market Capitalization
as of May 2018
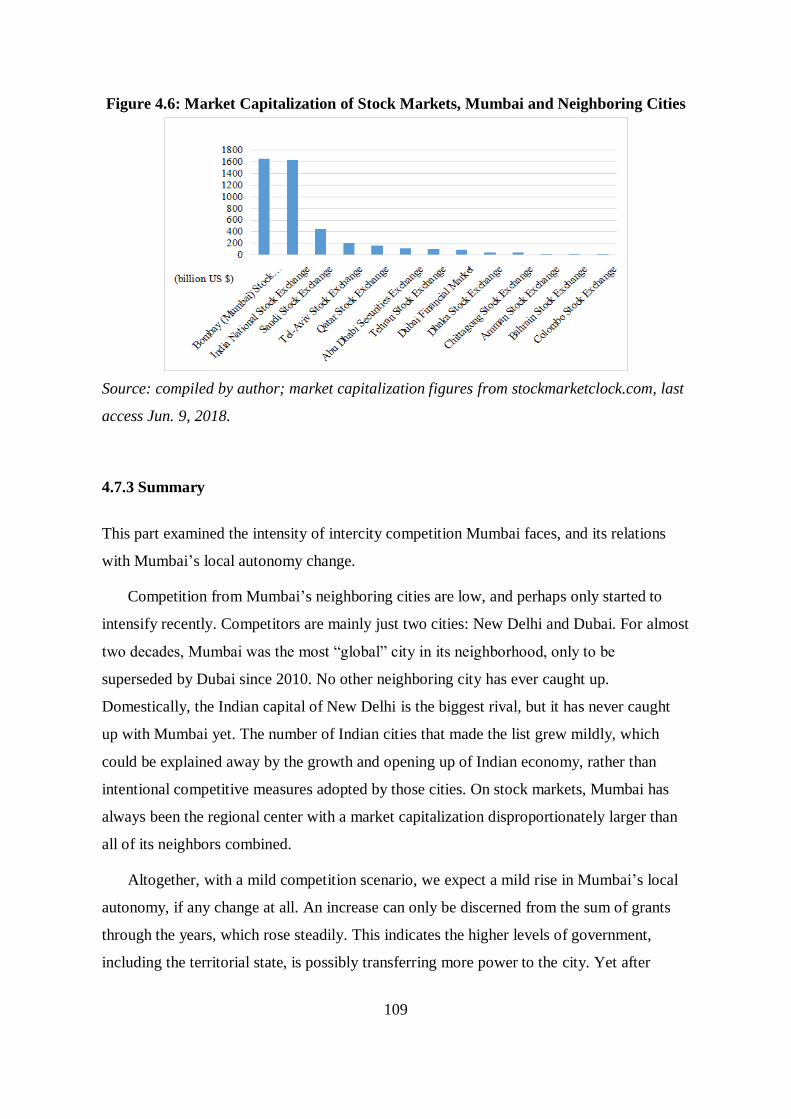
109
Figure 4.6: Market Capitalization of Stock Markets, Mumbai and Neighboring Cities
Source: compiled by author; market capitalization figures from stockmarketclock.com, last
access Jun. 9, 2018.
4.7.3 Summary
This part examined the intensity of intercity competition Mumbai faces, and its relations
with Mumbai’s local autonomy change.
Competition from Mumbai’s neighboring cities are low, and perhaps only started to
intensify recently. Competitors are mainly just two cities: New Delhi and Dubai. For almost
two decades, Mumbai was the most “global” city in its neighborhood, only to be
superseded by Dubai since 2010. No other neighboring city has ever caught up.
Domestically, the Indian capital of New Delhi is the biggest rival, but it has never caught
up with Mumbai yet. The number of Indian cities that made the list grew mildly, which
could be explained away by the growth and opening up of Indian economy, rather than
intentional competitive measures adopted by those cities. On stock markets, Mumbai has
always been the regional center with a market capitalization disproportionately larger than
all of its neighbors combined.
Altogether, with a mild competition scenario, we expect a mild rise in Mumbai’s local
autonomy, if any change at all. An increase can only be discerned from the sum of grants
through the years, which rose steadily. This indicates the higher levels of government,
including the territorial state, is possibly transferring more power to the city. Yet after
110
2010, when competition slightly intensified, the percentage of grants dropped. Also
dropped was the amount of loans the city took out.
In all, the hypothesis fares indecisively in this case. Its credibility can only be better
assessed in comparison with other cities.
4.8 Concentration of the Indian foreign economy in Mumbai
This part examines the concentration of India’s foreign-related economy in Mumbai, and
whether it has led to a change in the city’s local autonomy level. If more of such economic
activities concentrate in one or several central GWCs in a country, the territorial state
would be more inclined to reallocate power to those cities. The hypothesis expects a
positive relation.
4.8.1 Largest Indian companies’ concentration in Mumbai
I first use the Forbes 500 annual lists and count how many of India’s largest TNCs are
located in Mumbai. As per the table below, until 2017, seven Indian companies have
entered the list, of which 5 are headquartered in Mumbai, reflecting Mumbai’s dominating
position. In 1995, only Indian Oil was among the world’s 500 largest, ranking 481. An
SOE, it is understandably headquartered in New Delhi, the capital. However, it is worth
noting that the company is registered in Mumbai48. India’s performance in the lists did not
change until 2004, when three new TNCs (Bharat Petroleum, Hindustan Petroleum, and
Reliance Industries) made the list, all of which headquartered in Mumbai. Afterwards, the
figures see gradual rise, and Mumbai-based Indian TNCs account for a steady 70% of the
nation’s total. It was only in 2016 that a TNC based in a third city (Rajesh Exports,
Bangalore) joined the list, ranking the 423rd, ending the Mumbai and New Delhi monopoly.
48 “Our Locations”, Indian Oil Corporation Ltd., <https://www.iocl.com/AboutUs/MajorUnits.aspx>, last
access Aug. 1, 2018.

111
Table 4.8: India and Mumbai's Forbes 500 TNCs, 1995-2017
Year Total
number
HQ in
Mumbai
Mumbai's % of
India
National largest and
its ranking
1995 1 0 0% Indian Oil 481
1996 1 0 0% Indian Oil 317
1997 1 0 0% Indian Oil 257
1998 1 0 0% Indian Oil 287
1999 1 0 0% Indian Oil 278
2000 1 0 0% Indian Oil 232
2001 1 0 0% Indian Oil 209
2002 1 0 0% Indian Oil 226
2003 1 0 0% Indian Oil 191
2004 4 3 75% Indian Oil 189
2005 5 3 60% Indian Oil 170
2006 5 4 80% Indian Oil 153
2007 6 3 50% Indian Oil 116
2008 7 5 71% Indian Oil 116
2009 7 5 71% Indian Oil 105
2010 8 6 75% Indian Oil 125
2011 8 6 75% Indian Oil 98
2012 8 6 75% Indian Oil 83
2013 8 6 75% Indian Oil 88
2014 8 6 75% Indian Oil 96
2015 7 5 71% Indian Oil 119
2016 7 5 71% Indian Oil 161
2017 7 5 71% Indian Oil 168
Source: Forbes 500, Forbes, various years, counted by author.
If Forbes 500 is too small to comprehensively reflect reality, it is helpful to also read
two other lists compiled by the Indian School of Business (ISB). Per the ISB-VCC ranking
of India’s top TNCs in 2006 (see table below), two fifth of these companies are
headquartered in Mumbai. These companies control 47% of the foreign assets held by all
companies in the list. Foreign assets of a TNC is a meaningful indicator of the globalized
world economy, and headquarters of a TNC with large foreign assets definitely brings
international “command and control” functions to the city. Viewing these companies

112
individually, Mumbai is the only city that seats companies in all industrial sectors, e.g. oil
and gas, IT, auto, pharmaceuticals, and conglomerate. This indicates Mumbai economy’s
high versatility. As per the Top 20 largest Indian companies in terms of foreign assets that
published seven years later, half of the companies are headquartered in Mumbai, with Tata
Motors and Tata Steel taking the lead. Indian Oil disappeared, indicating the company is
more focused on domestic markets now (which leads to lower international “command and
control” needs). Of all the foreign assets held by the 20 companies, 58% belong to
Mumbai-headquartered ones. Both percentages are higher than the previous one, reflecting
Mumbai’s dominating position in terms of the Indian TNC center is even strengthened. No
city, not even New Delhi, comes close.
Table 4.9: ISB-VCC Ranking of 24 Selected Indian Multinationals, 2006 (million USD)
Rank Company Industry Foreign
Assets Headquarter
1 Oil and Natural Gas Corporation Oil and gas operations 4724 New Delhi
2 Tata Group of Companies Conglomerate 4169 Mumbai
3 Videocon Industries Ltd. Conglomerate 1626 Mumbai
4 Ranbaxy Laboratories Ltd. Pharmaceuticals 1077 Gurugram
5 Dr. Reddy's Laboratories Ltd. Pharmaceuticals 869 Hyderabad
6 HCL Technologies Ltd. IT 777 Noida
7 Hindalco Industries Ltd. Aluminum manufacturing 581 Mumbai
8 Sun Pharmaceutical Industries Ltd. Pharmaceuticals 281 Mumbai
9 Reliance Industries Ltd. Oil and gas operations 250 Mumbai
10 Suzlon Energy Ltd. Power and energy 135 Pune
11 Larsen & Toubro (L&T) Ltd.
Engineering &
construction 130 Mumbai
12 Wipro Technologies IT 128 Bangalore
13 Bharat Forge Ltd. Auto component solutions 106 Pune
14 Patni Computer Systems Ltd. IT 81 Bangalore
15 Hexaware Technologies Ltd. IT 69 Mumbai
16 Biocon Ltd. Pharmaceuticals 50 Bangalore
17 i-Gate Global Solutions Ltd.* IT 49 Pune
18 Max India Ltd. Conglomerate 37 New Delhi
19 Mahindra & Mahindra Ltd. Automobile 35 Mumbai
20 NIIT Ltd. IT 31 Gurugram
21 Piramal Healthcare Ltd. Pharmaceuticals 26 Mumbai
22 Birlasoft (India) Ltd. IT 21 Noida
23 Raymond Ltd. Fabric manufacturing 18 Mumbai
24 Infosys Technologies Ltd. IT 9 Bangalore
Number of TNCs headquarterd in Mumbai, % of all list 42%
Mumbai-based TNCs' foreign assets, % of all list 47%

113
* Now Capgemini Technology Service India Ltd.
Source: Indian School of Business - Vale Columbia Center ranking of Indian
multinationals, 2006. Calculated by author.
Seating more than half of India’s largest TNCs and even more of those TNC’s foreign
assets, Mumbai should be performing the highest level of “command and control”. Those
TNCs are organs of Indian national economy and agents of Indian home-grown capital’s
global expansion. Therefore, to successfully and smoothly aid those TNCs is also in the
interest of the Indian territorial state. Except for the Forbes 500, we do not have same-
methodology TNC statistics covering years before 2006. However, the data at hand suffice
to show an upward trajectory of Mumbai-based TNCs. This is in line with more grants from
upper government to Mumbai (although such grants account for smaller shares of the city’s
total revenue, implying local economic growth outruns local autonomy increase).
Table 4.10: Top 20 Indian Companies as per Foreign Assets, 2013 (billion INR)
Rank Company Foreign
Assets
Foreign
Assets % of
Total Assets
Headquarter
1 Tata Motors Ltd. 978 57% Mumbai
2 Tata Steel Ltd. 726 55% Mumbai
3 Bharti Airtel Ltd. 669 40% New Delhi
4 ONGC Videsh Ltd. 576 97% Dehradun
5 Hindalco Industries Ltd. 535 51% Mumbai
6 Suzlon Energy Ltd. 218 75% Pune
7 Tata Consultancy Services Ltd. 160 31% Mumbai
8 Sesa Sterlite Ltd.* 134 6% Mumbai
9 HCL Technologies Ltd. 118 53% Noida
10 Tata Chemicals Ltd. 112 55% Mumbai
11 Motherson Sumi Systems Ltd. 93 72% Noida
12 Tata Communications Ltd. 89 65% Pune
13 Punj Lloyd Ltd. 80 49% Gurgaon
14 Piramal Enterprises Ltd. 60 29% Mumbai
15 Dr. Reddy's Laboratories Ltd. 56 39% Hyderabad
16 Tata Global Beverages Ltd. 51 75% Calcutta
17 Jubilant Life Sciences Ltd. 43 52% Gajraula
18 Godrej Consumer Products Ltd. 36 47% Mumbai
19 Core Education & Technologies 34 78% Mumbai

114
20 Zee Entertainment Enterprises 19 40% Mumbai
Number of TNCs headquarterd in Mumbai, % of all list 50%
Mumbai-based TNCs' foreign assets, % of all list 58%
* Now Vedanta Limited.
Source: Indian School of Business Transnational Companies Survey 2013-14. Calculated
by author.
4.8.2 FDI inflow to India through Mumbai
FDI inflow to India is monitored by the Reserve Bank of India (RBI). Inflow to the city of
Mumbai is not monitored individually. Closest to our research need is the inflow through
RBI’s Mumbai branch, whose jurisdiction includes Maharashtra, Dadra and Nagar Haveli,
and Daman and Diu. Considering the marginal size of the two union territories, most of the
RBI Mumbai branch’s transactions are related to the state of Maharashtra.
As per table 4.11, FDI inflow to India through the Mumbai gateway see tremendous
growth since 2000. Mumbai office’s share increased from 18.81% to 45.25%—almost a
half of all FDI to India in 2016-17 (with a dip to 14% in 2013-14). To better determine how
much of those FDI actually went to Mumbai instead of other cities in Maharashtra, I refer
to Mumbai’s share of Maharashtra State’s GDP, to estimate the city’s weight in the state.
Mumbai accounts for a steady 21-23% of Maharashtra’s GDP output from 2004-2014. In
the banking and insurance sector, which is more closely linked to FDI, Mumbai’s share
stayed shockingly constant at just 30%. Therefore, I roughly assume that about a quarter of
the FDI inflow through RBI’s Mumbai branch eventually go to the city of Mumbai.
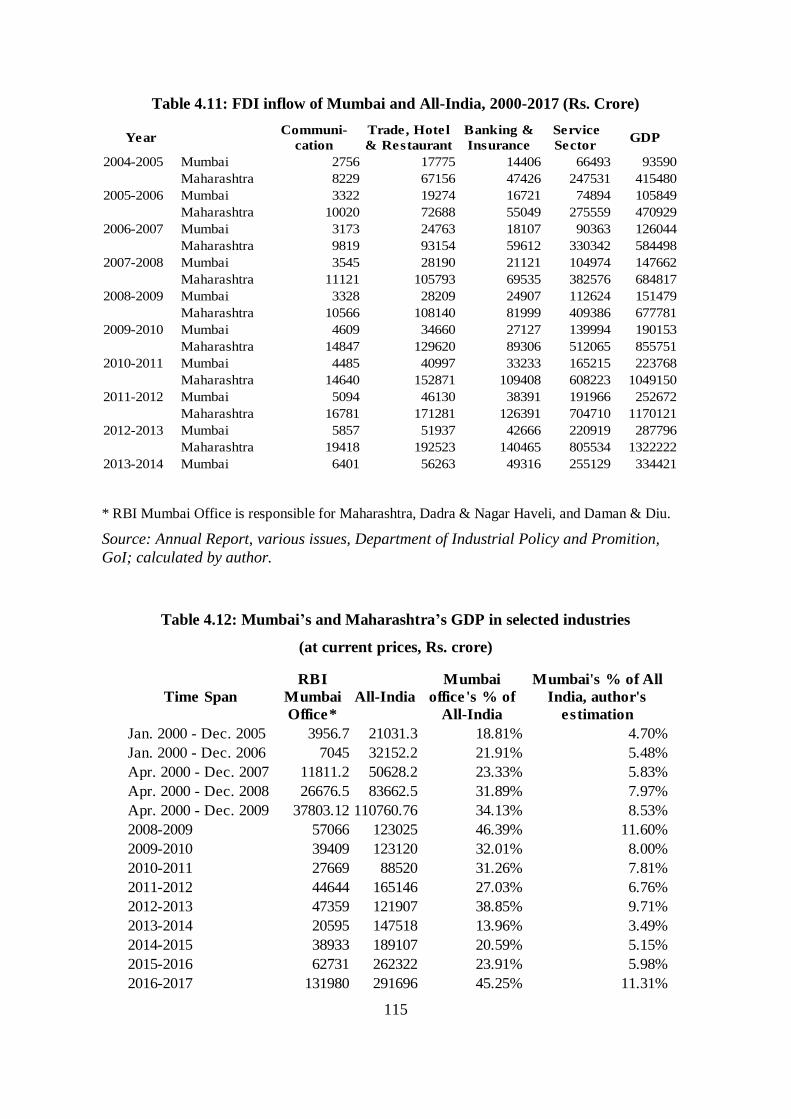
115
Table 4.11: FDI inflow of Mumbai and All-India, 2000-2017 (Rs. Crore)
* RBI Mumbai Office is responsible for Maharashtra, Dadra & Nagar Haveli, and Daman & Diu.
Source: Annual Report, various issues, Department of Industrial Policy and Promition,
GoI; calculated by author.
Table 4.12: Mumbai’s and Maharashtra’s GDP in selected industries
(at current prices, Rs. crore)
Year GDP
2004-2005 Mumbai 2756 17775 14406 66493 93590
Maharashtra 8229 67156 47426 247531 415480
2005-2006 Mumbai 3322 19274 16721 74894 105849
Maharashtra 10020 72688 55049 275559 470929
2006-2007 Mumbai 3173 24763 18107 90363 126044
Maharashtra 9819 93154 59612 330342 584498
2007-2008 Mumbai 3545 28190 21121 104974 147662
Maharashtra 11121 105793 69535 382576 684817
2008-2009 Mumbai 3328 28209 24907 112624 151479
Maharashtra 10566 108140 81999 409386 677781
2009-2010 Mumbai 4609 34660 27127 139994 190153
Maharashtra 14847 129620 89306 512065 855751
2010-2011 Mumbai 4485 40997 33233 165215 223768
Maharashtra 14640 152871 109408 608223 1049150
2011-2012 Mumbai 5094 46130 38391 191966 252672
Maharashtra 16781 171281 126391 704710 1170121
2012-2013 Mumbai 5857 51937 42666 220919 287796
Maharashtra 19418 192523 140465 805534 1322222
2013-2014 Mumbai 6401 56263 49316 255129 334421
Communi-
cation
Trade, Hotel
& Restaurant
Banking &
Insurance
Service
Sector
Time Span All-India
Jan. 2000 - Dec. 2005 3956.7 21031.3 18.81% 4.70%
Jan. 2000 - Dec. 2006 7045 32152.2 21.91% 5.48%
Apr. 2000 - Dec. 2007 11811.2 50628.2 23.33% 5.83%
Apr. 2000 - Dec. 2008 26676.5 83662.5 31.89% 7.97%
Apr. 2000 - Dec. 2009 37803.12 110760.76 34.13% 8.53%
2008-2009 57066 123025 46.39% 11.60%
2009-2010 39409 123120 32.01% 8.00%
2010-2011 27669 88520 31.26% 7.81%
2011-2012 44644 165146 27.03% 6.76%
2012-2013 47359 121907 38.85% 9.71%
2013-2014 20595 147518 13.96% 3.49%
2014-2015 38933 189107 20.59% 5.15%
2015-2016 62731 262322 23.91% 5.98%
2016-2017 131980 291696 45.25% 11.31%
RBI
Mumbai
Office*
Mumbai
office's % of
All-India
Mumbai's % of All
India, author's
estimation
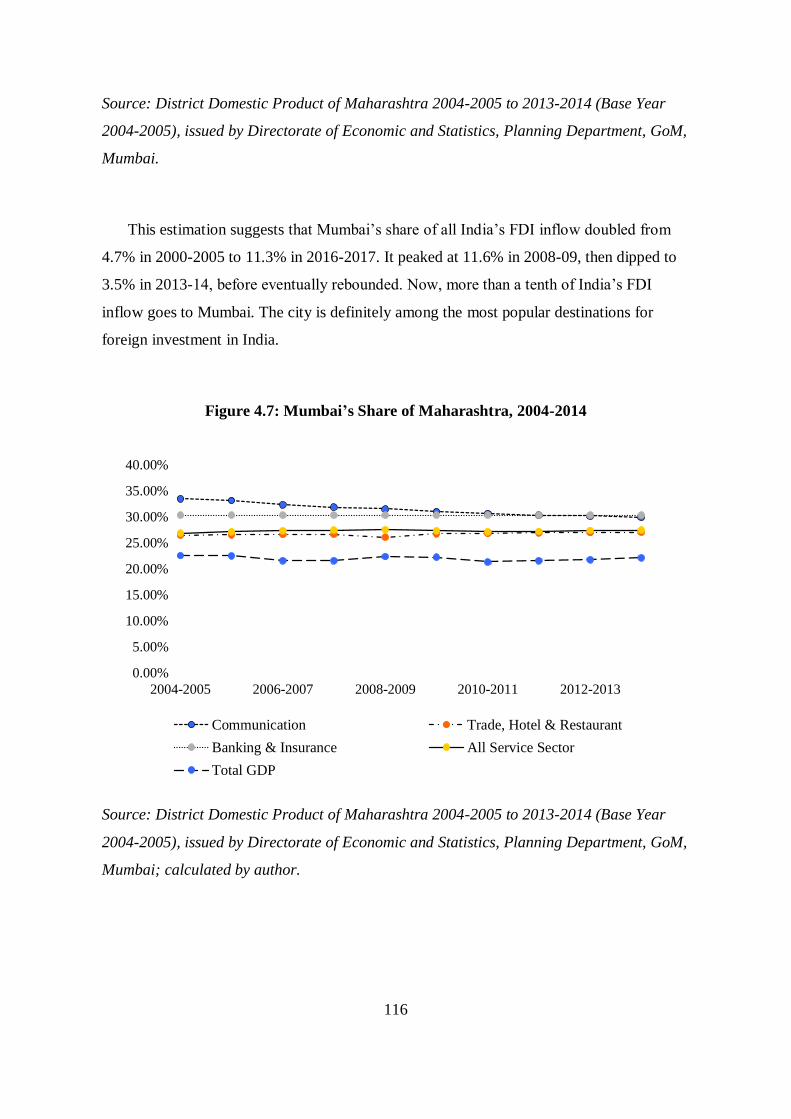
116
Source: District Domestic Product of Maharashtra 2004-2005 to 2013-2014 (Base Year
2004-2005), issued by Directorate of Economic and Statistics, Planning Department, GoM,
Mumbai.
This estimation suggests that Mumbai’s share of all India’s FDI inflow doubled from
4.7% in 2000-2005 to 11.3% in 2016-2017. It peaked at 11.6% in 2008-09, then dipped to
3.5% in 2013-14, before eventually rebounded. Now, more than a tenth of India’s FDI
inflow goes to Mumbai. The city is definitely among the most popular destinations for
foreign investment in India.
Figure 4.7: Mumbai’s Share of Maharashtra, 2004-2014
Source: District Domestic Product of Maharashtra 2004-2005 to 2013-2014 (Base Year
2004-2005), issued by Directorate of Economic and Statistics, Planning Department, GoM,
Mumbai; calculated by author.
0.00%
5.00%
10.00%
15.00%
20.00%
25.00%
30.00%
35.00%
40.00%
2004-2005 2006-2007 2008-2009 2010-2011 2012-2013
Communication Trade, Hotel & Restaurant
Banking & Insurance All Service Sector
Total GDP

117
4.8.3 India’s export and import through Mumbai
Database of the Department of Commerce, Ministry of Commerce and Industry of GoI is
used here. As per figures 4.8 and 4.9, Mumbai processes a lion’s share of India’s total
import and export. The Jawaharlal Nehru Port Trust (JNPT) at Navi Mumbai, formerly
known as Nhava Sheva Port, is India’s largest container port. It is planned as the satellite
port of the Mumbai Port, plagued by traffic overload and deteriorating, out-of-date
infrastructure49. The two ports together account for approx. a quarter of India’s export,
followed by New Delhi and Gujarat. They account for about a third of India’s import,
followed by New Delhi and Chennai. Again, Mumbai is in a dominating position. Yet, such
data is only of Feb. 2017 to Feb. 2018. If statistics of previous years are available, a better
picture could be drawn.
Figure 4.8, 4.9: Mumbai ports’ share of Indian imports and exports
49 “The birth of JNPT”, Jawaharlal Nehru Port Trust, <http://www.jnport.gov.in/History.aspx>, last access
Aug. 1, 2018.
Feb. 2017 ~ Feb. 2018, in Bn US$ Nhava Sheva Sea (Mumbai)
Delhi Air
Chennai Sea
DPCC (Mumbai)
MUNDRA (Gujarat)
Other ports
Feb. 2017 ~ Feb. 2018, in Bn US$ Nhava Sheva Sea (Mumbai)
DPCC (Mumbai)
SEZ Jamnagar (Reliance) (Gujarat)
MUNDRA (Gujarat)
Chennai
Other ports

118
Source: Database of Department of Commerce, Ministry of Commerce and Industry, GoI,
last access Jun. 5, 2018, calculated by author.
As there is incomplete data for each indicator, some indicator is one-off, only a
fragmented picture could be generated. But the picture is revealing enough: Mumbai’s
share of India’s foreign economy is substantial, and may still be increasing. Especially in
terms of TNCs, there is an evident polarizing tendency. Mumbai almost enjoys the
privilege of a primate city, totally eclipsing other cities including the Indian capital. HP3
expects a positive relation between this and the local autonomy Mumbai gets from the
territorial state. The gradually increasing grants seem to confirm this prediction. The
gradual rise until at least 2007 is a clear indication of more local autonomy. Yet, the sudden
drop to just 14.6% in 2012-13 still cannot be satisfactorily explained. But the percentage of
grants in the municipal total still grew at a slightly faster pace than the growth of total
municipal revenue. The city did not take out new loans during this phase. In sum, the
Mumbai case largely confirms the hypothesis. There are some random phenomena that begs
closer examination, but the general trend is as expected.
4.9 Chapter conclusion
This chapter investigates the Indian GWC of Mumbai. I first go through India’s history of
decentralization since the early 1990s as a background to Mumbai’s situation. Then, with
fiscal data of MCGM and GoM, a picture of fiscal grants and loans as well as local revenue
is generated, from which we know how much power higher governments, especially the
territorial state of India, is devolved to Mumbai. Maharashtra data is also used as a control
vector. Then, three hypotheses are tested respectively.
4.9.1 Performance of hypotheses
Unfortunately, the first hypothesis, that a more global Indian economy leads to higher
levels of local autonomy in Mumbai, is not entirely confirmed within the case. The first
indicator, the percentage of imports and exports to the Indian GDP echoes with the change
of grants to Mumbai, although disproportionately—indicating other factors at work. The
119
second indicator, the FDI to GDP percentage, given its great fluctuation, fails to be
reflected in the change of Mumbai’s local autonomy level. Overall, the relation is weak.
Validity of this hypothesis needs to be further compared with other cases.
On IV2, overall, there is a low level of inter-urban competition, with only Dubai and
New Delhi posing real challenges—yet the two cities are still way behind Mumbai with
respect of stock trading. The general trend of decentralization largely echoes the
competition situation: there have been increasing sums of fiscal resource, but not as
significant to make real impacts. Still unexplained is the drop of the percentage of grants in
the city’s revenue. In sum, the hypothesis holds for the most part, yet it still needs to be
compared together with other cases.
On IV3, empirics show a disproportional polarization of India’s foreign economy in
Mumbai, with approx. half of its most prominent TNCs, and over half of the TNCs’ foreign
assets “commanded and controlled” in Mumbai. The city also handles about a third of
India’s imports and exports, and attracts a significant amount of FDI inflow to India. Such
status is unmatched by any other city in the territorial state. The Mumbai monopoly (still on
the rise) has an impact Mumbai’s municipal fiscal figures, as aforementioned. Yet such
increase is marginal in size, poses limited effects on the city’s overall development.
Overall, the hypothesis holds within the case.
4.9.2 Known deficiencies of the empirical test
First, data limitations have prohibited an overall, detailed assessment of fiscal devolution.
For examples, the MCGM data is missing on several years, rendering researchers unable to
grasp a complete trend. The MCGM data do not tell between grants from the central
government and those from the state government, nor do they specify the composition of
such grants, i.e. sum of money from individual programs. This makes it difficult to tell the
actual effects on Mumbai of some urban-related programs like JNNURM. Also, without
data on FDI flow of only Mumbai, we can only estimate the situation50. Moreover,
50 Some sources attribute all FDI inflow registered by RBI's Mumbai office to Mumbai City, and assert the
city takes up close to a half of India's FDI inflow. This is wrong.

120
MMRDA, another organ in charge of MMR development and renewal, should also be
traced in its fiscal status. Unfortunately, their fiscal data for our time span is not available.
Second, Mumbai has a long tradition of combining public and private actors in urban
governance (albeit not very successfully). This adds to the complexity of distinguishing
local autonomy in the public and the private spheres. Some initiatives are started and
propelled mostly by entrepreneurs and civil activists who care about the prosperity and
long-term growth of the city, yet it is problematic to categorize them as “local autonomy”,
which by our definition should be a mutual settlement between the municipal and higher
governments. Such activities manifest a civil interest in promoting Mumbai as a GWC, and
it may be understood better from the theoretical approach of “growth machine” (Molotch
1976a; Logan and Molotch 1987), which is beyond the scope of this research.
Third, although fiscal statistics are “hard data” to reflect actual power change in
governments, it is not the complete reality and must be supplemented by other evidences,
e.g. personnel who hold public posts and their career progresses, negotiation and framing
processes of key programs and policies on each level, and the collective mentality of
Mumbai officials and Indian leadership on the role of Mumbai. Those indicators are hard to
observe, measure, and demand extensive efforts. However, they certainly would contribute
to a much better understanding of our topic.
4.9.3 General assessment of the GWC of Mumbai
Regarding local autonomy, findings in this chapter basically agree with Pinto’s assessment
that neither the 74th constitutional amendment or globalization have “gone far enough to
have a major impact on Mumbai’s governance (Pinto 2005, 347).” Absence of real changes
are also observed in some other researches (Chattaraj 2012; Ghadge 2013, etc.).
Mumbai does not seem to have a clear self-identity and a well-defined goal as a GWC
(Phatak 2007). This is probably due to its very secure status in India and South Asia until
recently. It is also probably because the Indian economy has not undergone a very deep
level of internationalization as seen in other countries (see imports and exports % of Indian
GDP), thus the ramifications of globalization on its economy, society, as well as popular
mentality are still weak. The undecided performance of the first hypothesis reflects a weak

121
theoretical power of the link between internationalization of national economy and the need
of developing a home-grown GWC.
Competition, on the other hand, does have an impact. This agrees with the prevailing
perception in the academia. Businessmen in Mumbai is obviously more sensitive than
politicians on this matter. The private circles in Mumbai is more active than officials in
promoting Mumbai as a GWC. We can expect heightened awareness in the government,
affected by business circles in the city, of Mumbai’s GWC prospects, and this requires
continuous observation.
Mumbai is and has always been “India’s ideal-type of cosmopolitanism (Ghadge 2013,
178)”. This historical heritage and public notion had made Mumbai India’s irreplaceable
GWC candidate. However, lack of a top-level, well thought-out, and down-to-earth strategy
for the city has been but should not be a problem. Existing initiatives about the city still
need to effectively incorporate public and private resources; top-level strategies laid out by
the nation, e.g. the Report on Making Mumbai an IFC (Ministry of Finance 2007), although
rightly acknowledges the need of a stronger GWC for the overall Indian economy, needs to
more realistically determine the best short- and mid-term objectives for the city. Last but
not least, Mumbai and India also need to promote better cooperation between existing
organs, i.e. the MCGM, the legitimate local government, and MMRDA, controlled by the
state government. A better coordination between the two would bring more productive
results in Mumbai’s development as a GWC (see Pethe, Gandhi, and Tandel 2011).
122
Chapter 5: Case of Shanghai, China
5.1 Introduction
Shanghai is the window to China for many foreigners and international capital. As early as
1842, the Treaty of Nanking/Nanjing demanded China to open Shanghai (along with
Canton/Guangzhou and three other coastal cities) as a “treaty port”, making it among the
first Chinese cities to westernize. Today, Shanghai is one of China’s four municipalities
directly under central control51, on the same administrative level as a province, meaning
there is no intermediate level of government between the city and national authority. In this
regard, Shanghai is similar to HCMC, but differs from Mumbai and Guangzhou, whose
links with the central authority go through a provincial/state level authority.
Although it is by no means appropriate or sufficient to understand China by solely
studying Shanghai, in actuality, the city is the most researched urban case of mainland
China (more than half of the scholarly works on China’s GWCs centered on Shanghai) and
a frequent topic in the general GWC research52. For examples: Cai and Sit use a six-
dimensional model to measure Shanghai’s world city status and conclude that the city is of
preeminent position in China but still has a long way to go compared to leading world cities
(Cai and Sit 2003); Wei and Leung find that FDI is of critical importance in Shanghai’s
GWC formation process, and even inside Shanghai’s urban territory it causes disparities
among different areas (Wei and Leung 2005); Wu studies the global and local scales that
intertwine at the Shanghai space and their implications in Shanghai’s growth into a global
city (Wu 2000); Zhang analyzes difficulties and constraints on different scales that
Shanghai faces in its growth as a state-led GWC (L.-Y. Zhang 2014). Shanghai is certainly
51 The other three are Beijing, Tianjin and Chongqing.
52 A preliminary search on Google Scholar using the keyword combination of “global city” OR “world city”
AND “Shanghai” produced about 3620 results, while “global city” OR “world city” AND “China”
produced 5750 results. Other Chinese mainland GWCs like Beijing, Guangzhou and Shenzhen produced
2760, 1270 and 1050 results respectively. For comparison, Hong Kong, Tokyo and Seoul produced 4510,
6610 and 1840 results respectively. Top-level GWCs of New York and London produced 10500 and
10700 results. Searches were conducted on 30 June, 2018.

123
an intensely studied metropolis. Almost all aspects of urban life and politics in the city have
received, in one way or another, some academic attention.
This chapter is organized as follows. First, China’s decentralization history since the
1990s is briefly reviewed as a national background. Second, through fiscal figures from the
early 1990s to 2016, aided by some public policies made by the Chinese government, an
assessment of Shanghai’s autonomy level change is made. Subsequent parts are devoted to
the three IVs and their corresponding hypotheses respectively. A summary section wraps
up the chapter.
5.2 China’s decentralization since 1990
Although politically centralized, China’s administration, especially fiscal arrangements,
have been quite decentralized. Sub-national governments, especially in coastal regions, are
fairly strong and rich. Some scholars even categorize China as a kind of fiscal federalism
(Bahl 1998; Jin, Qian, and Weingast 2005). The central government, however, sometimes
finds itself too poor to carry out tasks in the late 1980s. This is a major reason of the
country’s tax system reform in 1993.
Prior to the reform, the country adopted a “fiscal contracting system” which aimed to
enlarge its local governments’ capabilities, encouraging them to develop local economy and
collect revenues. It probably unleashed local vigor to aid the opening-up policy adopted in
the late 1970s, but it caused the central revenue to decrease severely and worsened inter-
regional disparity (see Su and Zhao 2007). In response, a “tax assignment system reform”
was initiated in 1993 and implemented in 1994. This is the main cause of the drastic
changes in the figures below. The reform had the effect of boosting central revenue, yet it
still left to sub-national governments a large part of the fastest-growing major revenue
source, e.g. VATs, personal and company income taxes (Su and Zhao 2007, 78). Although
the central authority got richer and reclaimed some power, local governments still kept
much of their fiscal resource. After the reform, there has been continuous tinkering of the
system, mostly “in the form of increasing the central government’s portion of shared

124
revenues, increasing tax rates on centrally collected taxes or eliminating various sub-
national taxes and fees (ibid. 79)”. The intention of retaining a central control is clear53.
Figure 5.1: China’s Central and Local Shares of Total Fiscal Revenue
Source: China National Statistics Bureau.
Figure 5.2: China’s Local and Central Shares in Governmental Expenditure
Source: China National Statistics Bureau.
(Z. Wang and Ma 2014)
53 See (Z. Wang and Ma 2014) for a review of China's fiscal decentralization.
local
central
local
central

125
Per Figure 5.2, the local governments have always made more spending than the central
government. In 1990, The local expenditure accounted for 67.4% of the country’s total
expenditure—more than twice of the central expenditure. The percentage then embarked on
a rising trajectory, except for a one-time dip to 65.3% in 2000. In 2016, their share of the
total governmental revenue came to 85.4%. Despite the popular notion of China as highly
centrally controlled, a huge majority of its public spending is carried out not by Beijing, but
by local governments.
Figure 5.1 shows the local and the central shares in China’s total fiscal revenue. Prior to
1993, China’s fiscal revenue growth severely lagged behind its economy growth. The
authority increasingly found itself fiscally weakened. The reform was partly designed to
strengthen the government’s fiscal power, especially at the central level; but it produced
mixed results (S. Wang 1997; Wong 2000). From 1994 to 2010, the central-local split was
generally equal, with central revenue slightly larger than local revenue. Since 2011, local
revenue surpassed the central share, although marginally. In 2016, local governments
collected 54.7% of the country’s total public revenue, while the central collected 45.3%.
Both figures tell us that since the early 1990s, local governments are both collecting
and spending more money than the central government. There has been a clear “strong
localities, weak center” pattern. Such decentralization, despite some centralizing efforts, is
still gradually increasing. The gap between the much larger local expenditure and relatively
equal local-central revenue is made up by inter-governmental transfers and local
governments’ alternative, off-budget, and sometimes off-the-book financing mechanisms—
suggesting downward delegation of power.
The reason to review China’s fiscal decentralization is, in order to evaluate whether
Shanghai or Guangzhou’s local autonomy change is due to their significance as GWCs, we
need to make sure such changes are peculiar to these cities, rather than just a part of the
nationwide trend. One can only safely determine whether Shanghai’s or Guangzhou’s
autonomy level has changed, when its trajectory differs from China’s national trajectory
(either in another direction or at a different pace). If fiscal decentralization (or not) is
observed not only in Shanghai and Guangzhou, but also across China, then our conclusion
on IV2 and IV3 must be tuned down. Only IV1 can be confirmed or rejected.

126
5.3 Shanghai’s local autonomy change 1990-2016
This section traces Shanghai’s local autonomy level from the early 1990s to 2016.
“Shanghai is atypical; it is the most liberal city in China but also has an established
regulatory tradition because of its significance in the planned economy (Wu 2010, 707)”.
To continuously support Shanghai’s growth as the national financial center (among
“centers” of other types) has been a stable commitment from China’s central government.
Yet as a huge unevenly-developed country with an urbanization of just over a half (59% in
2017), China needs to set its prescribed strategy for Shanghai against a broader national
backdrop. This means not all measures or strategies desired by Shanghai are taken.
Shanghai’s interests sometimes have to be sacrificed for the benefit of backward inland
areas or other cities.
We assess Shanghai’s local autonomy level mainly by going through its fiscal
expenditures and revenues. Fiscal power is the main base for a city’s administration to
function. Even if other policies or measures are taken, they must be reflected in fiscal
arrangements to be fiscally able to implement, otherwise they are just hollow slogans. In
the case of Shanghai, we look at the ratio of the city revenue to its total revenue, and the
ratio of city expenditure to its total revenue (including fiscal transfer/return from the central
government to the municipality).
Per Table 5.1, the overall trajectory of both the city revenue to its total revenue ratio
and the city expenditure to its total revenue ratio are on the rise. After the 1994 tax reform,
Shanghai’s own revenue took up 28.47% of its total revenue—less than a third. It came to
43.7%, more than two fifth, in 2016—a 53.4% increase in the percentage. This is evidently
different than China’s overall central-local fiscal separation during the same period, which
largely remained fifty-fifty. In terms of the city expenditure’s ratio to total revenue
collected by the city, the rise is even stronger. In 1990 the percentage was 27%. It came to
40% for the first time in 1997, and reached 47.17% in 2016. It means the city spent just a
quarter of the total sum it accrued more than two decades ago. Today it can spend almost a
half of it. The percentage expanded by 77.5%. Compared with China’s nationwide
expansion of 26.7%, Shanghai’s local autonomy expansion is unmistakably larger.
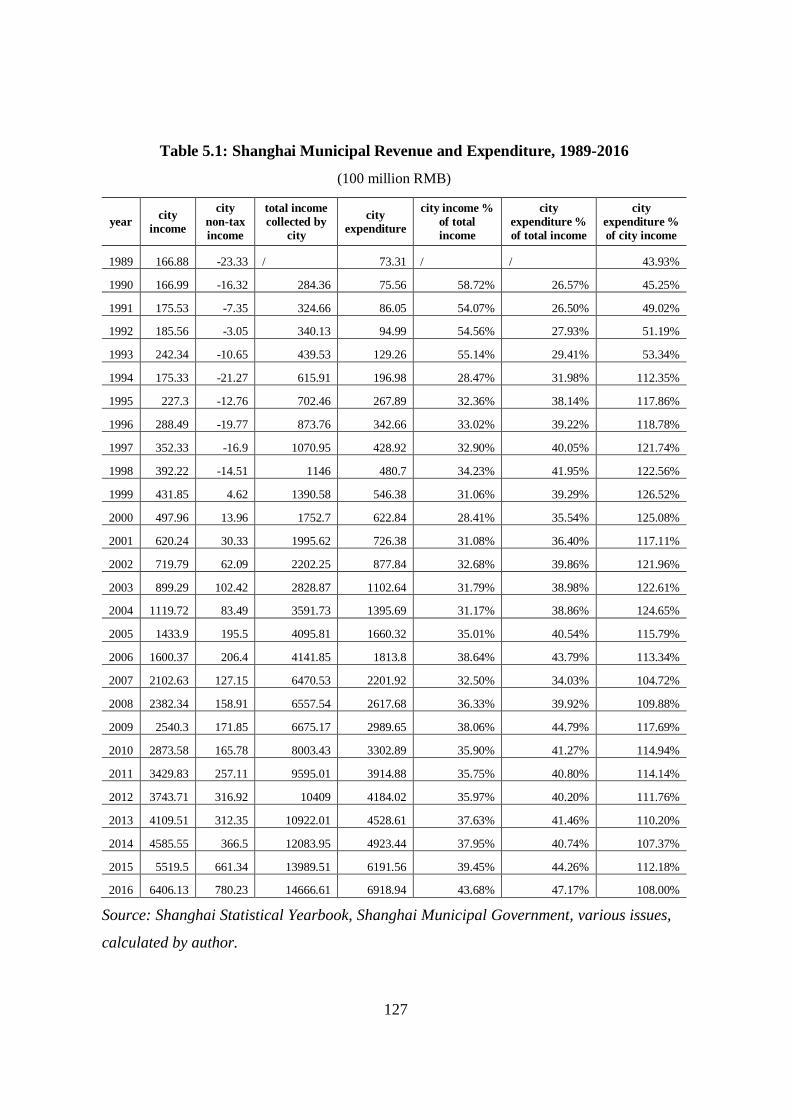
127
Table 5.1: Shanghai Municipal Revenue and Expenditure, 1989-2016
(100 million RMB)
year city
income
city
non-tax
income
total income
collected by
city
city
expenditure
city income %
of total
income
city
expenditure %
of total income
city
expenditure %
of city income
1989 166.88 -23.33 / 73.31 / / 43.93%
1990 166.99 -16.32 284.36 75.56 58.72% 26.57% 45.25%
1991 175.53 -7.35 324.66 86.05 54.07% 26.50% 49.02%
1992 185.56 -3.05 340.13 94.99 54.56% 27.93% 51.19%
1993 242.34 -10.65 439.53 129.26 55.14% 29.41% 53.34%
1994 175.33 -21.27 615.91 196.98 28.47% 31.98% 112.35%
1995 227.3 -12.76 702.46 267.89 32.36% 38.14% 117.86%
1996 288.49 -19.77 873.76 342.66 33.02% 39.22% 118.78%
1997 352.33 -16.9 1070.95 428.92 32.90% 40.05% 121.74%
1998 392.22 -14.51 1146 480.7 34.23% 41.95% 122.56%
1999 431.85 4.62 1390.58 546.38 31.06% 39.29% 126.52%
2000 497.96 13.96 1752.7 622.84 28.41% 35.54% 125.08%
2001 620.24 30.33 1995.62 726.38 31.08% 36.40% 117.11%
2002 719.79 62.09 2202.25 877.84 32.68% 39.86% 121.96%
2003 899.29 102.42 2828.87 1102.64 31.79% 38.98% 122.61%
2004 1119.72 83.49 3591.73 1395.69 31.17% 38.86% 124.65%
2005 1433.9 195.5 4095.81 1660.32 35.01% 40.54% 115.79%
2006 1600.37 206.4 4141.85 1813.8 38.64% 43.79% 113.34%
2007 2102.63 127.15 6470.53 2201.92 32.50% 34.03% 104.72%
2008 2382.34 158.91 6557.54 2617.68 36.33% 39.92% 109.88%
2009 2540.3 171.85 6675.17 2989.65 38.06% 44.79% 117.69%
2010 2873.58 165.78 8003.43 3302.89 35.90% 41.27% 114.94%
2011 3429.83 257.11 9595.01 3914.88 35.75% 40.80% 114.14%
2012 3743.71 316.92 10409 4184.02 35.97% 40.20% 111.76%
2013 4109.51 312.35 10922.01 4528.61 37.63% 41.46% 110.20%
2014 4585.55 366.5 12083.95 4923.44 37.95% 40.74% 107.37%
2015 5519.5 661.34 13989.51 6191.56 39.45% 44.26% 112.18%
2016 6406.13 780.23 14666.61 6918.94 43.68% 47.17% 108.00%
Source: Shanghai Statistical Yearbook, Shanghai Municipal Government, various issues,
calculated by author.

128
Figure 5.3: Shanghai’s Local Revenue and Expenditure % of Total Revenue
Source: Shanghai Statistics Yearbook, Shanghai Municipal Government, various issues,
calculated by author.
5.4 Global integration of China’s national economy and Shanghai’s autonomy
change
This section traces the global integration of China’s national economy indicated by the ratio
of import and export to China’s GDP and the ratio of FDI flow to China’s GDP. This is to
test the hypothesis that as China’s national economy becomes more globalized, it is more
likely that Shanghai obtains higher local autonomy.
5.4.1 China’s imports’ and exports’ shares
Data for the two indicators are acquired from the World Development Indicators published
by the World Bank, with a time span from 1990 to 2016/17. China experienced a short
international boycott after 1989; international atmosphere was also a bit odd for China,
another major communist regime, after the collapse of the Soviet Union. At the beginning
of the 1990s, international trade stood at 24.68% of the country’s GDP, higher than India’s
15%. Of course, this is not a criterion of the quality of economy, but this indicates a higher
0.00%
10.00%
20.00%
30.00%
40.00%
50.00%
60.00%
70.00%
1990 1992 1994 1996 1998 2000 2002 2004 2006 2008 2010 2012 2014 2016
city income % of total income city expenditure % of total income

129
possibility that China feels the attraction as well as impacts of international trade, adding to
the potential of policy change towards globalization—both at the central and the local level,
compared to India.
Figure 5.4: China’s Import and Export of Goods and Services, % of GDP
Source: World Development Indicators, World Bank.
The figure of imports and exports combined, after ascending to 37.3% in 1993, stayed
relatively stable until a dip to 32.84% occurred in 1998, probably because of shrinking
demand due to the Asian Financial Crisis that broke out in the same year. Import and export
then picked up pace after 2001, the year when China was officially admitted into the World
Trade Organization (WTO). This is a milestone that marks a deeper stage of integration of
the Chinese economy into global economy. The decision itself of the Chinese authority’s
top-level decision to embrace globalization—in a sense a reaffirmation of the opening-up
policy the country first adopted in the late 1970s. The share of import and export saw a
dramatic increase afterwards, culminating at 65.62% in 2006. Then it gradually waned,
with a one-off rebound to 50.6% in 2011, before ending at 37.06% in 2016. For seven
years, more than half of China’s economy is related to the world market. This is a situation
not experienced as much in India.
As per Shanghai’s fiscal figures, its expenditure of total income saw an obvious rise
from 1990 to 1997, to 40.05%. This agrees with China’s heightened level of global
integration. The following years saw that percentage stay relatively stable at around 40%,
0%
10%
20%
30%
40%
50%
60%
70%
80%
90%
100%
1990 1992 1994 1996 1998 2000 2002 2004 2006 2008 2010 2012 2014 2016
GDP (100%) Imports % of GDP Exports % of GDP

130
except in 2000 it dropped to 36%. It went up to more than 40% again five years later, and
stayed above that level ever since. This indicator is largely in coordination with the import
and export percentages. They both rose since the mid-1990s. There was also a common dip
in around 2000. Later, Shanghai’s local expenditure increased together with China’s import
and export. However, when import and export started to lessen in their share in China’s
economy, Shanghai’s local autonomy did not decline—until 2016, it actually expanded
further to close to a half. Shanghai’s municipal share in its total income (municipally
retained + municipally collected on behalf of the central) also showed a similar trend.
5.4.2 China’s FDI inflow and outflow
FDI flow, on the other hand, tells a different story. In 1990, it accounted for a marginal
1.2% of China’s national GDP—too little to induce real changes. However, it rocketed to
7.18% in 1993—by more than six times in just three years. Then the share dwindled away
slightly, and stayed around 4.5% for about two decades until 2012. Following the 2008
Financial Crisis, it temporarily dipped to 3.42% in 2009, but quickly rebounded. It showed
a major downturn since 2015. In 2017, the level came to 2.21%, back to the 1991-92 level.
Since 2013, China started a wave of overseas merger and acquisition54. The long-standing
gap between FDI inflow and outflow started to close up, and intersected in 2016, the year
China for the first time sent more capital oversees than it received. This implies China,
while being a popular destination for foreign investment, is also showing larger appetite for
overseas investment—both mechanisms require aid by the GWC.
54 See Lihuan Zhou and Denise Leung: “China's overseas investments, explained in 10 graphics”, World
Resources Institute, Jan. 28, 2015, <http://www.wri.org/blog/2015/01/china%E2%80%99s-overseas-
investments-explained-10-graphics>, last access Aug. 10, 2018.
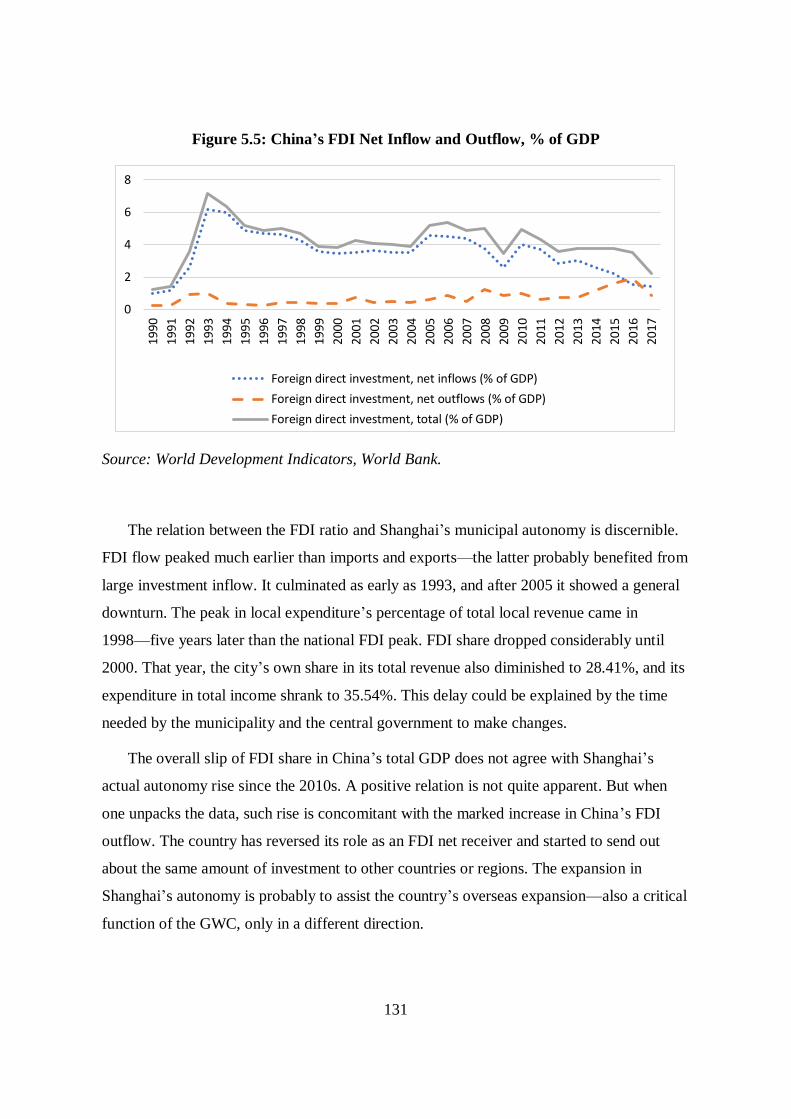
131
Figure 5.5: China’s FDI Net Inflow and Outflow, % of GDP
Source: World Development Indicators, World Bank.
The relation between the FDI ratio and Shanghai’s municipal autonomy is discernible.
FDI flow peaked much earlier than imports and exports—the latter probably benefited from
large investment inflow. It culminated as early as 1993, and after 2005 it showed a general
downturn. The peak in local expenditure’s percentage of total local revenue came in
1998—five years later than the national FDI peak. FDI share dropped considerably until
2000. That year, the city’s own share in its total revenue also diminished to 28.41%, and its
expenditure in total income shrank to 35.54%. This delay could be explained by the time
needed by the municipality and the central government to make changes.
The overall slip of FDI share in China’s total GDP does not agree with Shanghai’s
actual autonomy rise since the 2010s. A positive relation is not quite apparent. But when
one unpacks the data, such rise is concomitant with the marked increase in China’s FDI
outflow. The country has reversed its role as an FDI net receiver and started to send out
about the same amount of investment to other countries or regions. The expansion in
Shanghai’s autonomy is probably to assist the country’s overseas expansion—also a critical
function of the GWC, only in a different direction.
0
2
4
6
8
1990
1991
1992
1993
1994
1995
1996
1997
1998
1999
2000
2001
2002
2003
2004
2005
2006
2007
2008
2009
2010
2011
2012
2013
2014
2015
2016
2017
Foreign direct investment, net inflows (% of GDP)
Foreign direct investment, net outflows (% of GDP)
Foreign direct investment, total (% of GDP)

132
5.4.3 Summary
In sum, the concomitance between the global integration of China’s economy and
Shanghai’s local autonomy change is discernible. Both rise and fall relatively close to each
other, sometimes with a few years’ delay to reflect in fiscal figures. This confirms our
hypothesis that the more internationalized a national economy gets, its leading GWC is
more likely to receive larger local autonomy. Both the global city model and the world city
hypothesis are upheld in the observation of Shanghai. It fares differently in India. A
possible explanation is that India’s level of global integration is lower than China, so the
changes have yet to exert effects in inter-governmental relations. FDI flow, on the other
hand, needs to be broken down to unravel meaningful relations. At first, autonomy level
seems to grow together with FDI flow’s share; yet in recent years, FDI net outflow picked
up and started to have an impact on autonomy levels. Still, this must be examined further
with the Guangzhou and Ho Chi Minh City cases.
5.5 Intercity competition and Shanghai’s autonomy level
This section analyzes the intensity of competition Shanghai faces from neighboring cities,
and determines whether such competition has affected the GWC’s local autonomy level.
Since each GWC has an intrinsic urge to win inter-urban competition to build up its
“command and control” functions, and that territorial states, especially developmental
states, also use GWCs as a tool for national development, we expect this competition to be
fierce, so the GWC and the territorial state both have an incentive to increase the former’s
power.
5.5.1 Intercity competition against Shanghai according to GaWC
Contrary to widespread notion that Shanghai is the leading Chinese city in terms of
globalization and modernization, what we find from the World according to GaWC
assessments reveal a slightly different picture. Rather than being the Chinese GWC that
could dictate the country’s international economy and beyond, Shanghai actually is under a
high level of pressure from neighboring cities in terms of GWC strength and formation.

133
Table 5.2: Shanghai’s Neighboring GWCs According to GaWC, 2000-2018
City Country/Region 2000 2004 2008 2010 2012 2016 2018
Shanghai China α- α- α+ α+ α+ α+ α+
Hong Kong Hong Kong, SAR α+ α+ α+ α+ α+ α+ α+
Singapore Singapore α+ α+ α+ α+ α+ α+ α+
Tokyo Japan α+ α+ α+ α+ α+ α+ α+
Beijing China β+ α- α+ α α+ α+ α+
Seoul S. Korea α- α α α α- α α
Kuala Lumpur Malaysia α- α- α α α α α
Bangkok Thailand α- α- α- α- α- α- α
Taipei Taiwan α- α- α- α- α- α- α
Manila Philippines β+ γ+ β+ β+ β+ α- α-
Guangzhou China γ- γ- β- β β+ α- α
HCMC Vietnam γ HS β- β β β+ β+
Shenzhen China S S γ β- β- β α-
Hanoi Vietnam HS HS HS γ+ β- β β+
Chengdu China / / S S HS β- β+
Tianjin China / / S HS γ- β- β
Nanjing China / / S S HS γ+ β
Kaohsiung Taiwan / / S S S HS HS
Hangzhou China / / / S HS γ+ β+
Qingdao China / / / S HS γ+ β-
Wuhan China / / / / S γ- β
Xi'an China / / / / S γ- γ+
Number of same-country cities in HS
level and above 4 4 8 8 14 17 24
Source: The World According to GaWC, GaWC, various issues, calculated by author.
East Asia has some of the world’s strongest GWCs, including Tokyo, Hong Kong and
Seoul. Given the top two GWCs of London and New York “define a duopoly that
constitutes a case apart” (P. J. Taylor et al. 2009), these East Asian cities are generally on
the highest level a GWC could achieve. Together with Singapore, the region holds five
“alpha+” cities, and at least six “alpha” or “alpha-” GWCs. “The Alpha ++/+ levels are
over-represented by western Pacific Rim cities..., a pattern strongly accentuated in 2008...
(P. J. Taylor et al. 2009, original emphasis)”. These cities can be deemed as well-developed
GWCs with the capability as basing points for international capital and TNCs. In 2008 both
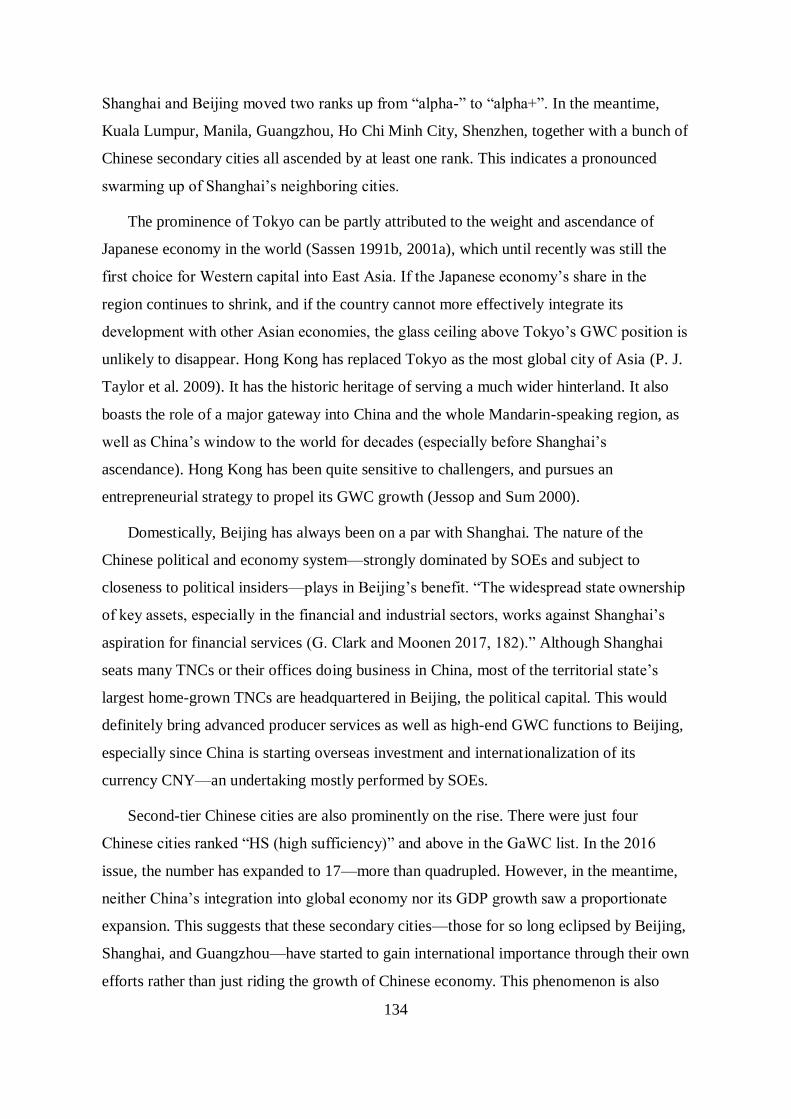
134
Shanghai and Beijing moved two ranks up from “alpha-” to “alpha+”. In the meantime,
Kuala Lumpur, Manila, Guangzhou, Ho Chi Minh City, Shenzhen, together with a bunch of
Chinese secondary cities all ascended by at least one rank. This indicates a pronounced
swarming up of Shanghai’s neighboring cities.
The prominence of Tokyo can be partly attributed to the weight and ascendance of
Japanese economy in the world (Sassen 1991b, 2001a), which until recently was still the
first choice for Western capital into East Asia. If the Japanese economy’s share in the
region continues to shrink, and if the country cannot more effectively integrate its
development with other Asian economies, the glass ceiling above Tokyo’s GWC position is
unlikely to disappear. Hong Kong has replaced Tokyo as the most global city of Asia (P. J.
Taylor et al. 2009). It has the historic heritage of serving a much wider hinterland. It also
boasts the role of a major gateway into China and the whole Mandarin-speaking region, as
well as China’s window to the world for decades (especially before Shanghai’s
ascendance). Hong Kong has been quite sensitive to challengers, and pursues an
entrepreneurial strategy to propel its GWC growth (Jessop and Sum 2000).
Domestically, Beijing has always been on a par with Shanghai. The nature of the
Chinese political and economy system—strongly dominated by SOEs and subject to
closeness to political insiders—plays in Beijing’s benefit. “The widespread state ownership
of key assets, especially in the financial and industrial sectors, works against Shanghai’s
aspiration for financial services (G. Clark and Moonen 2017, 182).” Although Shanghai
seats many TNCs or their offices doing business in China, most of the territorial state’s
largest home-grown TNCs are headquartered in Beijing, the political capital. This would
definitely bring advanced producer services as well as high-end GWC functions to Beijing,
especially since China is starting overseas investment and internationalization of its
currency CNY—an undertaking mostly performed by SOEs.
Second-tier Chinese cities are also prominently on the rise. There were just four
Chinese cities ranked “HS (high sufficiency)” and above in the GaWC list. In the 2016
issue, the number has expanded to 17—more than quadrupled. However, in the meantime,
neither China’s integration into global economy nor its GDP growth saw a proportionate
expansion. This suggests that these secondary cities—those for so long eclipsed by Beijing,
Shanghai, and Guangzhou—have started to gain international importance through their own
efforts rather than just riding the growth of Chinese economy. This phenomenon is also

135
noted elsewhere. A.T. Kearney noticed a “remarkable rise of Chinese cities” that reflects
proactive efforts on various levels to improve competitiveness (A.T. Kearney 2018, 7–10).
The ascent of secondary cities in national urban system brings both opportunities and
competition to leading cities. Some services and functions are no longer tied only to
Shanghai or Beijing—they are freer to relocate to other GWCs that have newly become
good and viable platforms, considering Chinese local governments are usually highly
interested in attracting advanced producer services and promoting their cities
internationally55.
Figure 5.6: Intercity Competition for Shanghai According to GaWC (International)
12=α++; 11=α+; 10=α; 9=α-; 8=β+; 7=β; 6=β-; 5=γ+; 4=γ; 3=γ-; 2=high sufficiency;
1=sufficiency; 0=not in the ranking.
55 A hot area where secondary Chinese cities take great efforts is establishing direct air or railway connections
with major international GWCs or trade partner countries. Traditionally, international flight services are
concentrated in Beijing, Shanghai, Guangzhou and Hong Kong. For example, the southwestern city of
Chengdu has been trying to promote itself as an alternative aviation hub, launching direct air services to
almost all major GWCs including London, Sydney, Tokyo, Los Angeles, etc. Local governments at
Nanjing, Hangzhou and Wuhan, etc. are also keen for such connections, on the assumption that direct
connections bring opportunities, travelers, investments, and promote the city’s international visibility.
Apparently, better-connected second-tier cities diminish Shanghai’s gateway function, as people and
freight that used to transfer at Shanghai can now get to their final destinations more directly.
0123456789101112
2000 2004 2008 2010 2012 2016 2018Shanghai Hong Kong SingaporeTokyo Seoul Kuala LumpurBangkok Taipei ManilaHo Chi Minh City Hanoi Kaohsiung
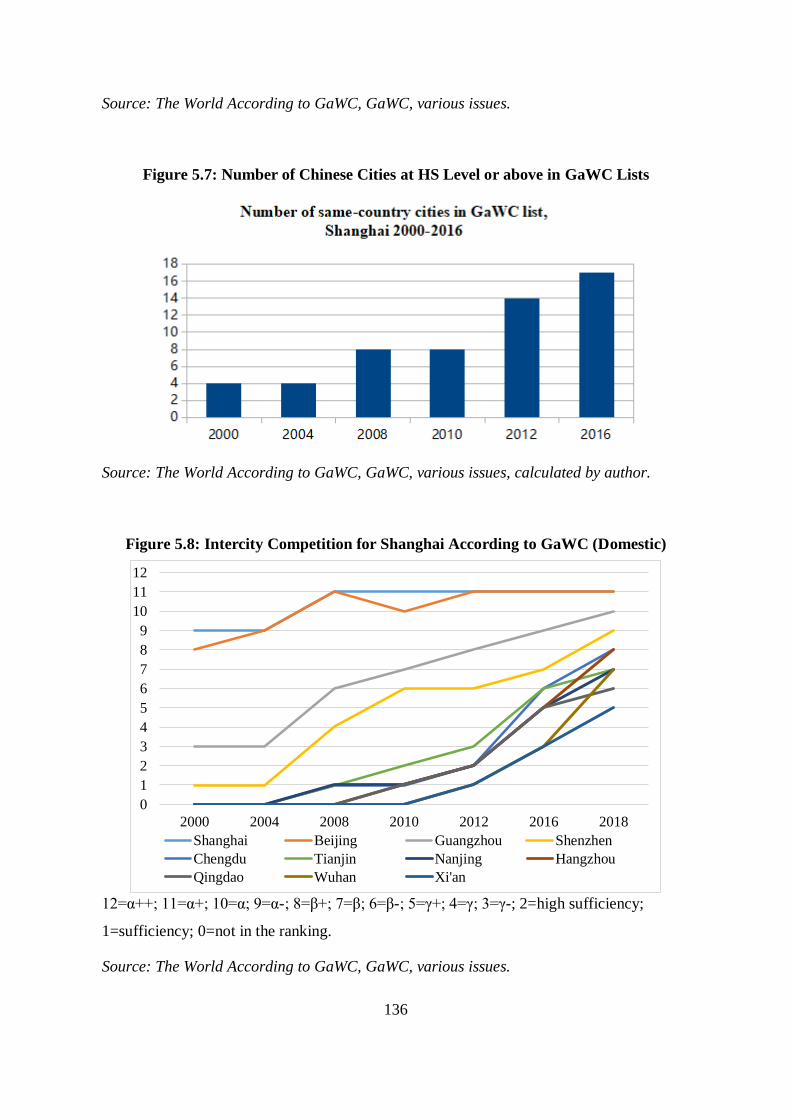
136
Source: The World According to GaWC, GaWC, various issues.
Figure 5.7: Number of Chinese Cities at HS Level or above in GaWC Lists
Source: The World According to GaWC, GaWC, various issues, calculated by author.
Figure 5.8: Intercity Competition for Shanghai According to GaWC (Domestic)
12=α++; 11=α+; 10=α; 9=α-; 8=β+; 7=β; 6=β-; 5=γ+; 4=γ; 3=γ-; 2=high sufficiency;
1=sufficiency; 0=not in the ranking.
Source: The World According to GaWC, GaWC, various issues.
0
1
2
3
4
5
6
7
8
9
10
11
12
2000 2004 2008 2010 2012 2016 2018
Shanghai Beijing Guangzhou Shenzhen
Chengdu Tianjin Nanjing Hangzhou
Qingdao Wuhan Xi'an
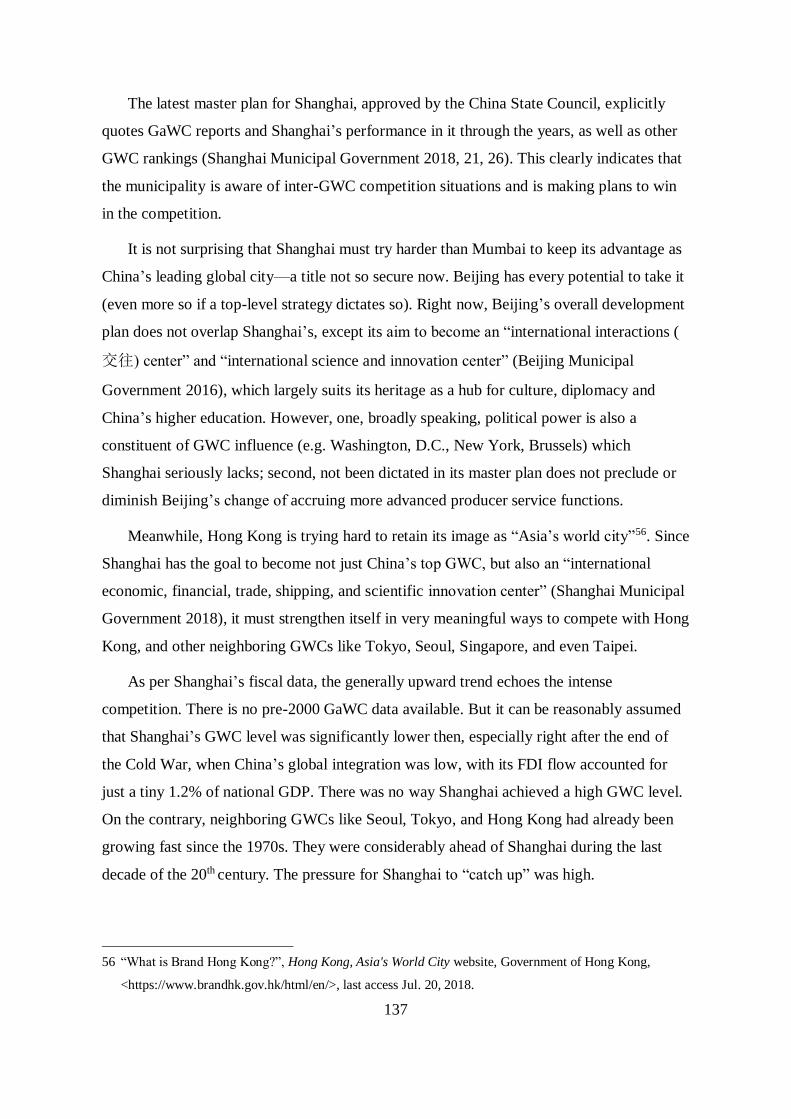
137
The latest master plan for Shanghai, approved by the China State Council, explicitly
quotes GaWC reports and Shanghai’s performance in it through the years, as well as other
GWC rankings (Shanghai Municipal Government 2018, 21, 26). This clearly indicates that
the municipality is aware of inter-GWC competition situations and is making plans to win
in the competition.
It is not surprising that Shanghai must try harder than Mumbai to keep its advantage as
China’s leading global city—a title not so secure now. Beijing has every potential to take it
(even more so if a top-level strategy dictates so). Right now, Beijing’s overall development
plan does not overlap Shanghai’s, except its aim to become an “international interactions (
交往) center” and “international science and innovation center” (Beijing Municipal
Government 2016), which largely suits its heritage as a hub for culture, diplomacy and
China’s higher education. However, one, broadly speaking, political power is also a
constituent of GWC influence (e.g. Washington, D.C., New York, Brussels) which
Shanghai seriously lacks; second, not been dictated in its master plan does not preclude or
diminish Beijing’s change of accruing more advanced producer service functions.
Meanwhile, Hong Kong is trying hard to retain its image as “Asia’s world city”56. Since
Shanghai has the goal to become not just China’s top GWC, but also an “international
economic, financial, trade, shipping, and scientific innovation center” (Shanghai Municipal
Government 2018), it must strengthen itself in very meaningful ways to compete with Hong
Kong, and other neighboring GWCs like Tokyo, Seoul, Singapore, and even Taipei.
As per Shanghai’s fiscal data, the generally upward trend echoes the intense
competition. There is no pre-2000 GaWC data available. But it can be reasonably assumed
that Shanghai’s GWC level was significantly lower then, especially right after the end of
the Cold War, when China’s global integration was low, with its FDI flow accounted for
just a tiny 1.2% of national GDP. There was no way Shanghai achieved a high GWC level.
On the contrary, neighboring GWCs like Seoul, Tokyo, and Hong Kong had already been
growing fast since the 1970s. They were considerably ahead of Shanghai during the last
decade of the 20th century. The pressure for Shanghai to “catch up” was high.
56 “What is Brand Hong Kong?”, Hong Kong, Asia's World City website, Government of Hong Kong,
<https://www.brandhk.gov.hk/html/en/>, last access Jul. 20, 2018.
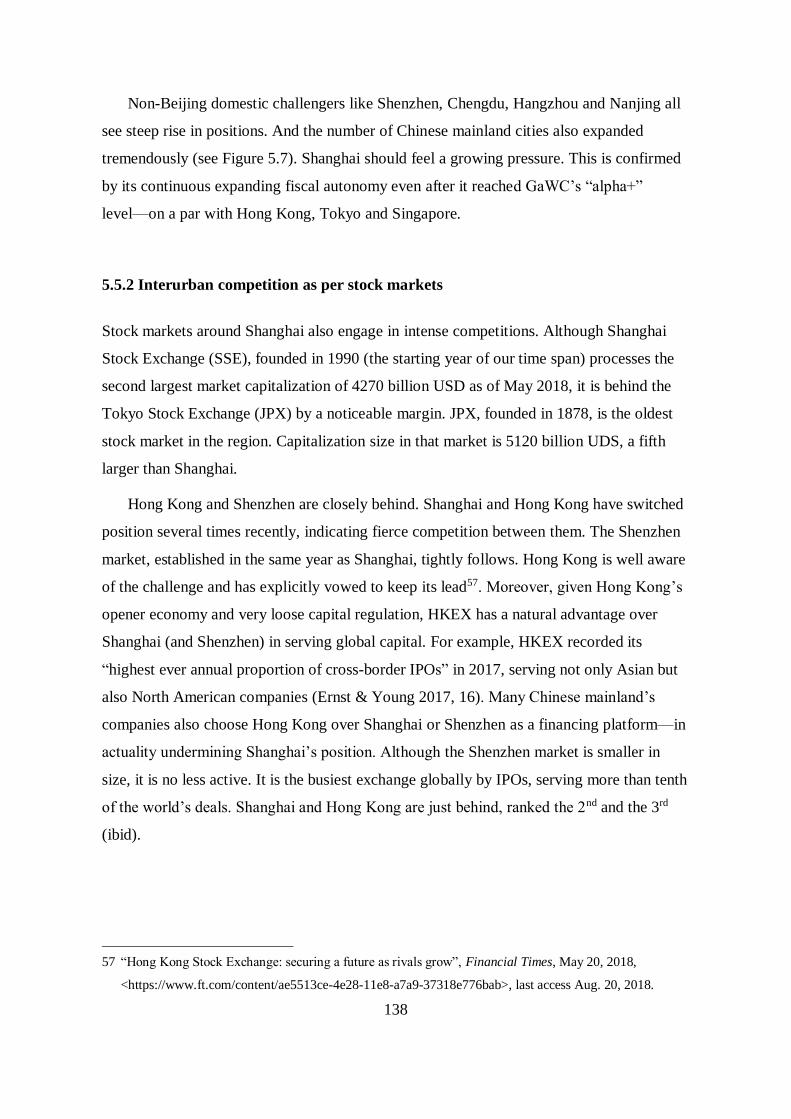
138
Non-Beijing domestic challengers like Shenzhen, Chengdu, Hangzhou and Nanjing all
see steep rise in positions. And the number of Chinese mainland cities also expanded
tremendously (see Figure 5.7). Shanghai should feel a growing pressure. This is confirmed
by its continuous expanding fiscal autonomy even after it reached GaWC’s “alpha+”
level—on a par with Hong Kong, Tokyo and Singapore.
5.5.2 Interurban competition as per stock markets
Stock markets around Shanghai also engage in intense competitions. Although Shanghai
Stock Exchange (SSE), founded in 1990 (the starting year of our time span) processes the
second largest market capitalization of 4270 billion USD as of May 2018, it is behind the
Tokyo Stock Exchange (JPX) by a noticeable margin. JPX, founded in 1878, is the oldest
stock market in the region. Capitalization size in that market is 5120 billion UDS, a fifth
larger than Shanghai.
Hong Kong and Shenzhen are closely behind. Shanghai and Hong Kong have switched
position several times recently, indicating fierce competition between them. The Shenzhen
market, established in the same year as Shanghai, tightly follows. Hong Kong is well aware
of the challenge and has explicitly vowed to keep its lead57. Moreover, given Hong Kong’s
opener economy and very loose capital regulation, HKEX has a natural advantage over
Shanghai (and Shenzhen) in serving global capital. For example, HKEX recorded its
“highest ever annual proportion of cross-border IPOs” in 2017, serving not only Asian but
also North American companies (Ernst & Young 2017, 16). Many Chinese mainland’s
companies also choose Hong Kong over Shanghai or Shenzhen as a financing platform—in
actuality undermining Shanghai’s position. Although the Shenzhen market is smaller in
size, it is no less active. It is the busiest exchange globally by IPOs, serving more than tenth
of the world’s deals. Shanghai and Hong Kong are just behind, ranked the 2nd and the 3rd
(ibid).
57 “Hong Kong Stock Exchange: securing a future as rivals grow”, Financial Times, May 20, 2018,
<https://www.ft.com/content/ae5513ce-4e28-11e8-a7a9-37318e776bab>, last access Aug. 20, 2018.
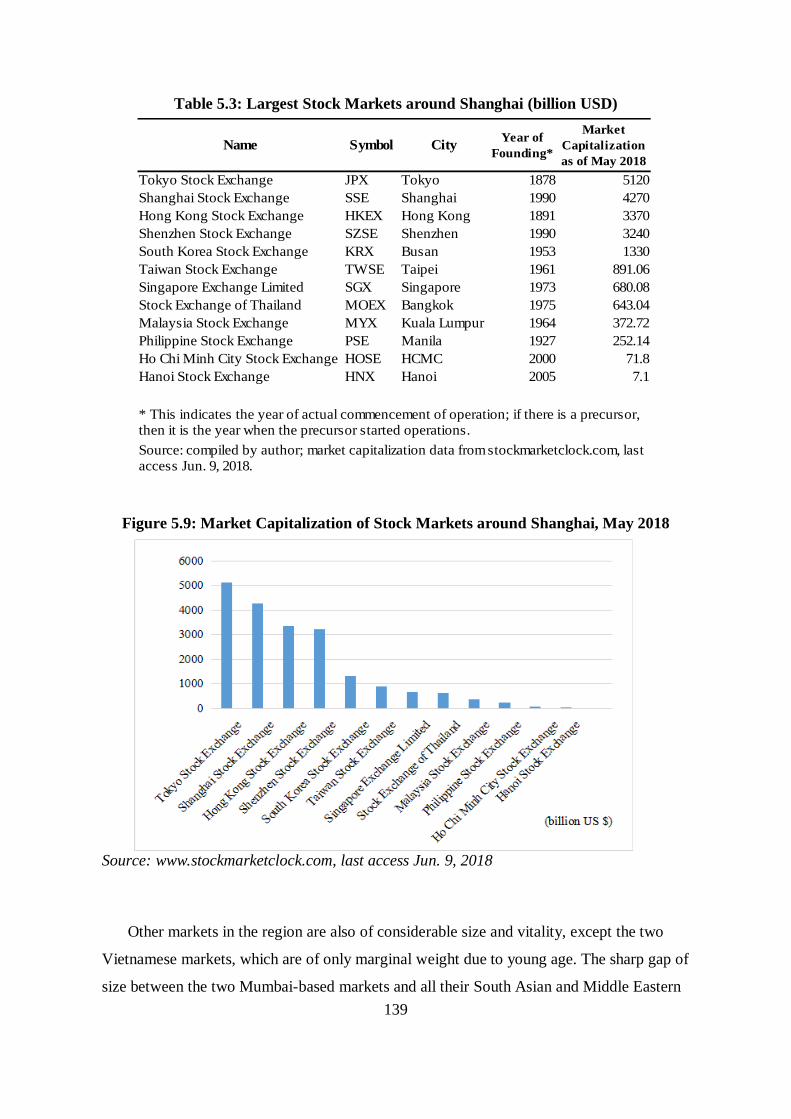
139
Table 5.3: Largest Stock Markets around Shanghai (billion USD)
Figure 5.9: Market Capitalization of Stock Markets around Shanghai, May 2018
Source: www.stockmarketclock.com, last access Jun. 9, 2018
Other markets in the region are also of considerable size and vitality, except the two
Vietnamese markets, which are of only marginal weight due to young age. The sharp gap of
size between the two Mumbai-based markets and all their South Asian and Middle Eastern
Name Symbol City
Tokyo Stock Exchange JPX Tokyo 1878 5120
Shanghai Stock Exchange SSE Shanghai 1990 4270
Hong Kong Stock Exchange HKEX Hong Kong 1891 3370
Shenzhen Stock Exchange SZSE Shenzhen 1990 3240
South Korea Stock Exchange KRX Busan 1953 1330
Taiwan Stock Exchange TWSE Taipei 1961 891.06
Singapore Exchange Limited SGX Singapore 1973 680.08
Stock Exchange of Thailand MOEX Bangkok 1975 643.04
Malaysia Stock Exchange MYX Kuala Lumpur 1964 372.72
Philippine Stock Exchange PSE Manila 1927 252.14
Ho Chi Minh City Stock Exchange HOSE HCMC 2000 71.8
Hanoi Stock Exchange HNX Hanoi 2005 7.1
Year of
Founding*
Market
Capitalization
as of May 2018
* This indicates the year of actual commencement of operation; if there is a precursor, then it is the year when the precursor started operations.
Source: compiled by author; market capitalization data from stockmarketclock.com, last access Jun. 9, 2018.

140
counterparts is not seen in the Shanghai case. This echoes GaWC’s observation that the
West Pacific Rim is seating a disproportionately large number of GWCs—possibly
reflecting a shift of center of world economic gravity.
Of course, due to China’s regulation on capital markets, currency exchange rates and its
companies’ overseas financing, Shanghai (together with Shenzhen) is still the handiest
choice for domestic companies. The newly established cross-boundary investment channels
of SSE-HKEX58, SZSE-HKEX59 and SSE-LSE connections slightly alleviate difficulty in
cross-border investment, but hindrances still abound. In this sense, competition pressure on
Shanghai is lessened—it is only to compete domestically with Shenzhen, the other stock
market in South China. However, if the city, as per its growth plan, is to become an
“international financial center” (Shanghai Municipal Government 2018) able to offer
financial services to users beyond China, it still has a long way to go—and some of the
obstacles can only be fundamentally removed on the national level.
The high competition pressure from neighboring stock markets is reflected in the
increase in Shanghai’s local autonomy. As afore observed, both the municipal revenue’s
and spending’s shares in the city’s total revenue see evident rise since the early 1990s.
There is no continuous tracing of size of capitalization of all the stock markets since 1990
to now. We only know that the sizes of these markets, especially the large ones, tie closely.
This is different than the situation in Mumbai.
5.5.3 Summary
This part analyzes the intercity competition Shanghai faces. There is clearly an ascent of
GWCs in the West Pacific Rim. More GWCs in this region are occupying higher levels in
GaWC rankings, at the cost of relative decline of Western cities. Shanghai is a latecomer as
GWC, yet it enjoys the privilege of riding the growth of Chinese national economy, which
utilizes the city as a major point of articulation between the territorial state and the global
economy.
58 “沪港通”, Shanghai Stock Exchange, <http://www.sse.com.cn/services/hkexsc/home/>, last access Aug.
2, 2018.
59 "深港通", Shenzhen Stock Exchange, <http://www.szse.cn/main/szhk/>, last access Aug. 2, 2018.

141
The intense competition from neighboring GWCs adds to the burden of the territorial
state to better facilitate investment and offer advanced producer services to accommodate to
national growth. Here, the mutuality between China and the GWC of Shanghai is strong.
The result is a rise in Shanghai’s autonomy level.
The second hypothesis is confirmed within this case. Compared with Mumbai, it also
holds true: intercity competition for Mumbai is relatively lower than Shanghai, and
Mumbai has achieved much less increase in local autonomy. The Indian GWC’s autonomy
has expanded very modestly, yet that of Shanghai has seen tremendous expansion.
5.6 Shanghai’s weight in China’s foreign economy and the city’s autonomy level
This section studies how much of China’s foreign economy is concentrated in Shanghai.
Hypothesis 3 predicts that if more of a territorial state’s foreign economy is processed
through its GWC, that city is more likely to obtain larger local autonomy to cope with local
implications by higher levels of globalization, and to better facilitate urban and national
growth. The following indicators are used to evaluate the concentration level: the share of
China’s largest companies (as per Forbes 500) headquartered in Shanghai, how much of
China’s FDI inflow go through Shanghai, and the city’s weight in China’s imports and
exports. We expect a positive relation.
Shanghai has long been considered a “window” to the post-reform and opening-up
China. In popular impression, its level of internationalization exceeds most—if not all—of
its peers, and it is the city where most of international TNCs land their first footstep into the
Chinese market. The following part verifies such notion and investigates whether such
status has affected the city’s autonomy level.
5.6.1 China’s largest TNCs in Shanghai as per Forbes500
I use the Forbes 500 list from 1995 to 2017 to observe how many of China’s largest
companies are headquartered in Shanghai. This indication is directly in line with
Friedmann’s conceptualization of the world city (Friedmann 1986; Friedmann and Wolff

142
1982), in which the GWCs are basing points of capital flow and they command the world
economy through TNCs located there.
In 1995, there were only two Chinese companies in the Forbes500 list, both
headquartered in Beijing. Until 2003, eleven Chinese companies had made the list, all of
which based in Beijing. This is obviously in token of China’s SOE-dominated economy,
and most SOEs operate from the political capital. For about a decade, no other Chinese city
had a world top 500 company.
In 2004, two Shanghai-based companies entered the list, ending the Beijing monopoly.
In 2009, Bank of Communications, one of China’s oldest financial service provider, were
listed for the first time. It is also the first non-Beijing-based Chinese bank to appear in the
Forbes500 list. Two years later, another advanced producer service company originated in
Shanghai, the Pacific Insurance, made the list.
Since 2004, Shanghai’s share of China’s largest companies has stayed relatively stable
at 10% for about a decade. Due to the relatively small number in 2004, the city’s share
started at 13%. This does not mean Shanghai’s position was markedly higher then. The
number of Chinese companies expanded tremendously since then, reaching 109, about a
fifth of the total, and Shanghai’s percentage remained at approx. 10%.
Among the eight Shanghainese companies, only two (Bank of Communications, Pacific
Insurance) are advanced producer service providers. The rest either deals with logistics (e.g.
China Ocean Shipping, COSCO Shipping) or manufacturing (e.g. Baosteel, Shanghai
Automobile). This on the one hand reflects the city’s historic heritage as an “ocean + river”
harbor and an industrial center, and on the other hand reflects its relatively weak basis as
the basing point for China’s overseas expansion—the majority of China’s largest financial
and banking corporations are still in Beijing, rather than Shanghai. Nevertheless, logistics
and manufacturing are still important sectors for an economic hub, as advanced producer
services and TNC headquarters must have concrete activities to “command and control”,
and a diverse industry base enhances a city’s metropolitan vitality.
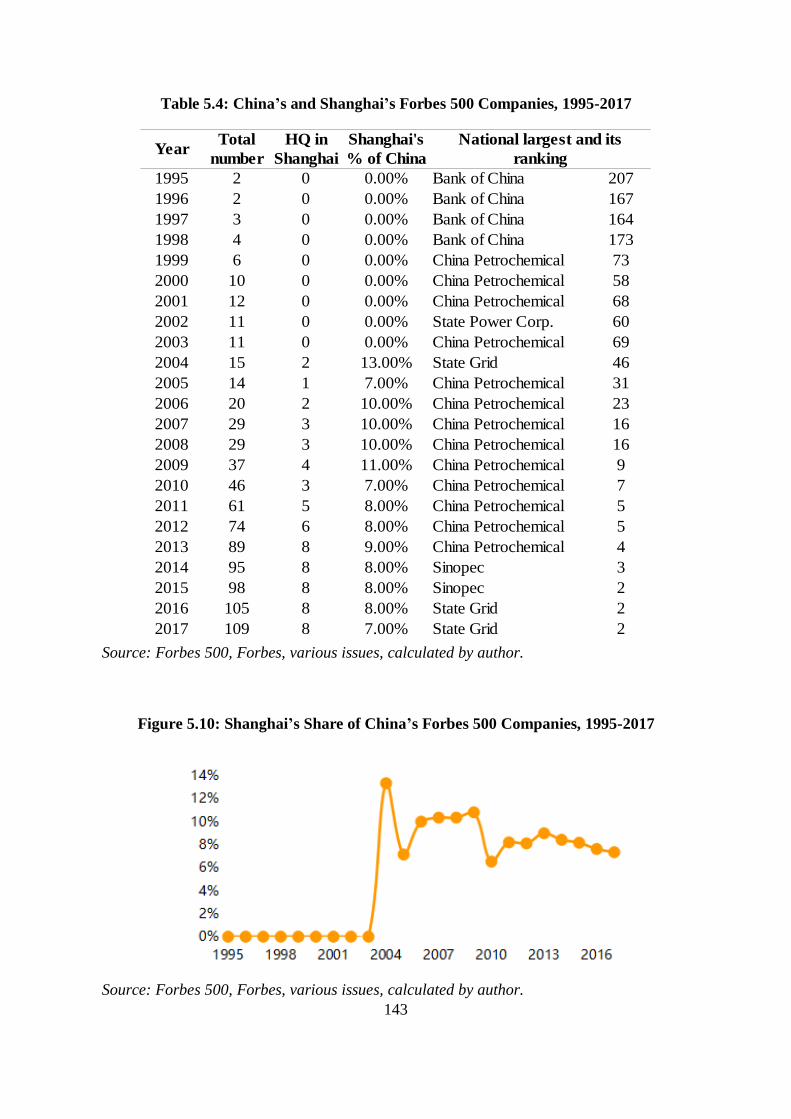
143
Table 5.4: China’s and Shanghai’s Forbes 500 Companies, 1995-2017
Source: Forbes 500, Forbes, various issues, calculated by author.
Figure 5.10: Shanghai’s Share of China’s Forbes 500 Companies, 1995-2017
Source: Forbes 500, Forbes, various issues, calculated by author.
Year
1995 2 0 0.00% Bank of China 207
1996 2 0 0.00% Bank of China 167
1997 3 0 0.00% Bank of China 164
1998 4 0 0.00% Bank of China 173
1999 6 0 0.00% China Petrochemical 73
2000 10 0 0.00% China Petrochemical 58
2001 12 0 0.00% China Petrochemical 68
2002 11 0 0.00% State Power Corp. 60
2003 11 0 0.00% China Petrochemical 69
2004 15 2 13.00% State Grid 46
2005 14 1 7.00% China Petrochemical 31
2006 20 2 10.00% China Petrochemical 23
2007 29 3 10.00% China Petrochemical 16
2008 29 3 10.00% China Petrochemical 16
2009 37 4 11.00% China Petrochemical 9
2010 46 3 7.00% China Petrochemical 7
2011 61 5 8.00% China Petrochemical 5
2012 74 6 8.00% China Petrochemical 5
2013 89 8 9.00% China Petrochemical 4
2014 95 8 8.00% Sinopec 3
2015 98 8 8.00% Sinopec 2
2016 105 8 8.00% State Grid 2
2017 109 8 7.00% State Grid 2
Total
number
HQ in
Shanghai
Shanghai's
% of China
National largest and its
ranking

144
Overall, the city’s percentage in China has a stable trajectory, if not a slight decline
since 2009. The latest figure of 2017 shows only 7% of such companies operating from
Shanghai. The number of Shanghai-based TNCs has remained at 8 since 2013, yet the
number of China has expanded from 89 to 109. This means, from 2004 to 2017, China’s
national total expanded by more than seven times, while that of Shanghai only quadrupled.
At least in terms of the largest home-grown TNCs, especially in financial service, Shanghai
does not have a distinct advantage in China, not to mention being the first choice.
When we juxtapose this trend with Shanghai’s local autonomy level, we do not find a
distinct relation, except the most general trend: Shanghai’s share of China’s Forbes 500
companies changed from zero to 7%, and the city’s local autonomy also saw marked
increase. It seems to confirm the hypothesis in a very crude sense. The marginal slipping of
Shanghai’s share does not agree with the city’s continuous increase in local autonomy.
This phenomenon could be better analyzed, if a larger population of companies is
observed. The Forbes500 list only counts the largest 109 Chinese companies in 2017 (in
1995 the number was just two). Although expanded tremendously, the number is more of a
token of China’s size growth in world economy, rather than a good piece of information on
the overall landscape of Chinese companies and their origins—the size of a TNC is not
necessarily indicative of its level of international expansion. Meanwhile, a solely domestic
list of more companies, or a list of all TNCs (both domestic and international) doing
business in China, or even more preferably, a list of TNCs by foreign assets controlled
would potentially provide a better picture.
5.6.2 China’s FDI inflow through Shanghai
The largest companies of a territorial state are important, but not the only aspect of
globalization. They are major players in the Chinese marketplace, and organs for the
national capital to expand internationally. Yet, to get a full picture, we must view other
indicators pertaining to production, flow of goods and people, etc. As a newly
industrialized country, China’s early ascendance owes much to its relatively cheap labor
force and labor-intensive manufacturing enabled by it. Today, the majority of its exports are
industrial products of higher value. But it still needs logistic facilities such as capable ports,
airports, and ground transportation. As a comprehensive transportation hub in China and
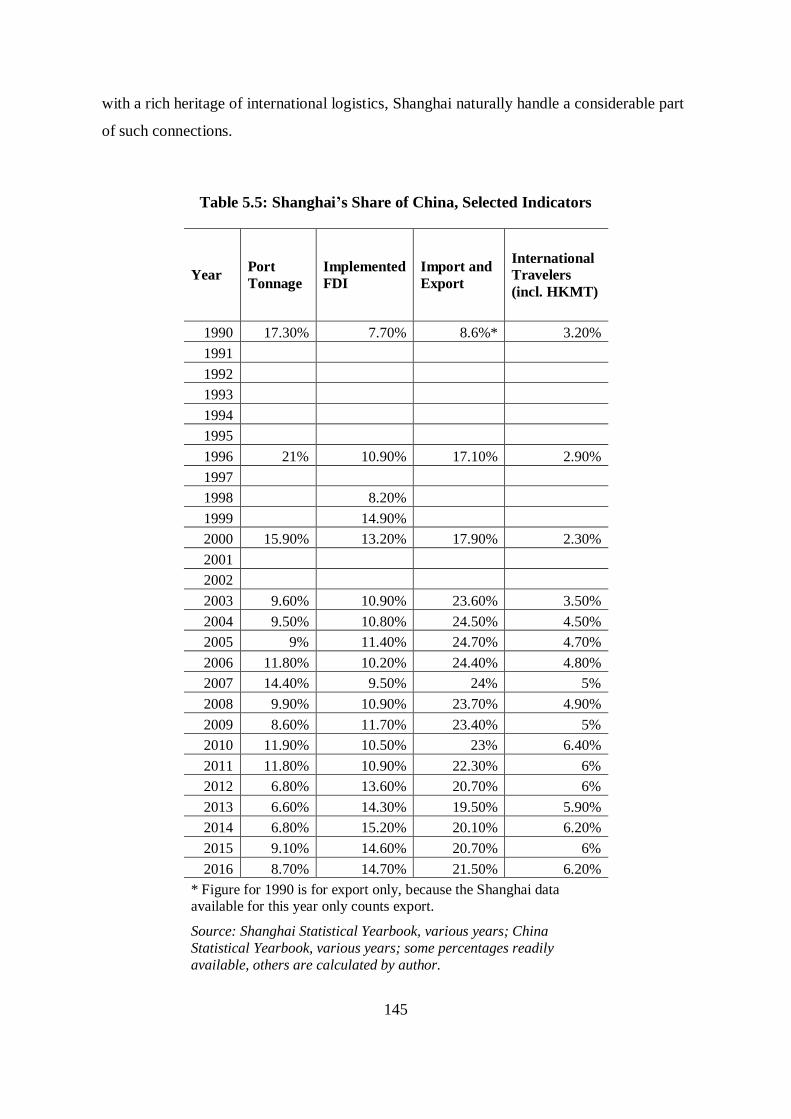
145
with a rich heritage of international logistics, Shanghai naturally handle a considerable part
of such connections.
Table 5.5: Shanghai’s Share of China, Selected Indicators
Year Port
Tonnage
Implemented
FDI
Import and
Export
International
Travelers
(incl. HKMT)
1990 17.30% 7.70% 8.6%* 3.20%
1991
1992
1993
1994
1995
1996 21% 10.90% 17.10% 2.90%
1997
1998 8.20%
1999 14.90%
2000 15.90% 13.20% 17.90% 2.30%
2001
2002
2003 9.60% 10.90% 23.60% 3.50%
2004 9.50% 10.80% 24.50% 4.50%
2005 9% 11.40% 24.70% 4.70%
2006 11.80% 10.20% 24.40% 4.80%
2007 14.40% 9.50% 24% 5%
2008 9.90% 10.90% 23.70% 4.90%
2009 8.60% 11.70% 23.40% 5%
2010 11.90% 10.50% 23% 6.40%
2011 11.80% 10.90% 22.30% 6%
2012 6.80% 13.60% 20.70% 6%
2013 6.60% 14.30% 19.50% 5.90%
2014 6.80% 15.20% 20.10% 6.20%
2015 9.10% 14.60% 20.70% 6%
2016 8.70% 14.70% 21.50% 6.20%
* Figure for 1990 is for export only, because the Shanghai data available for this year only counts export.
Source: Shanghai Statistical Yearbook, various years; China
Statistical Yearbook, various years; some percentages readily
available, others are calculated by author.

146
I use three indicators to further assess Shanghai’s weight in China’s foreign economy:
actualized FDI (inflow), import and export, and entry of international travelers. Per Table
5.5, Shanghai’s percentage of FDI inflow to China doubled from 1990 to 2016. In 1990,
7.7% of FDI to China went to Shanghai. Then the percentage rose to 14.9% in 1999—
doubling for the first time. It then gradually declined to approx. 10% the next decade. In
2012, the figure picked up speed again and reached 15.2% in 2014, before stabilizing at
14.7% in 2017. There are clearly two peaks during the entire time span: the first at 1999-
2000, the second at 2013-2014.
The data at hand is just for FDI inflow, i.e. foreign investors’ ventures in China. Data of
the other direction, overseas investment by Chinese companies, are not available at hand.
Conventionally, developing countries receive more inflow than sending outflow, because
they have not yet accumulated enough capital, technology, and experience to pursue
overseas opportunities. Moreover, most developing countries retain certain policies to
protect home-grown industry sectors, making domestic enterprises in these sectors less
competitive internationally. But a true GWCs should be able to facilitate flows in both
directions. Moreover, with the continuous growth and opening-up of a territorial state, to
start investing abroad is only a matter of time. China has been increasingly engaged in
overseas investment, much of which is acquisition and merge. This has generated some
criticisms and concerns at the receiving end (Meunier 2014; Rogers, Lee, and Yan 2015).
Given a majority of China’s TNCs are SOEs, China’s overseas investment is largely
controlled in Beijing. This further increases Beijing’s weight at Shanghai’s expense.
FDI inflow to Shanghai largely shows a similar trend with the city’s autonomy level.
There is even a concomitant peak around 1997 to 1999. However, the city’s autonomy level
did not slide with its share of FDI inflow. Shanghai is articulating a larger share of its
national economy’s FDI inflow than Mumbai. And China’s FDI outflow is obviously
increasing, which has not occurred yet in India. Comparing the two nations, it is evident
that a higher share of FDI concentration in the GWC is more likely to lead to a heightened
level of that city’s local autonomy.

147
5.6.3 China’s import and export through Shanghai
As per table 5.5, China’s import and export from 1990 to 2016 had been flowing more and
more through Shanghai. In 1990, less than a tenth (8.6%) was handled in Shanghai. This is
a year when China’s globalization was just about to kick off. In 1996, 17.1% was
conducted in the city—doubling the 1990 level. China was accepted into WTO in 2001, and
Shanghai’s share rose to almost a quarter of the national total (24.7%) in just four years.
This indicates a marked concentration trend in Shanghai, as China’s global integration
deepens. However, the trend then stabilized and started to slide slightly, to less than 20% in
2013. It then stayed around 20%. The city is definitely of high importance in the country’s
foreign economy. This period is also when China gradually ascended as “the World
Factory”.
The number of international (cross-boundary) travelers is used as a supplementary
piece of evidence. Flow of people, especially well-educated and productive talents is of
critical importance for the smooth functioning of world economy. Clustering of such people
is also a salient trait of GWCs, as only central metropolis can provide enough job
opportunities and satisfy their life and recreational needs. Such indicator is of higher
importance for developing countries like China, which are thirsty for foreign investment,
technology and experience. In 1990, only 3.2% of foreign travelers to China went to
Shanghai. The figure gradually rose to 6.2% in 2016, almost doubling the percentage 25
years ago. The Shanghai Pudong International Airport (PVG) is China mainland’s busiest
airport in terms of cross-border passenger and cargo traffic60. The city definitely processes
a part of international people exchange between China and the world, but it does not
monopolize it—international travelers to Shanghai only account for less than a tenth of
China’s total. This indicates that Shanghai’s GWC role as a hub for international human
flow and interactions may not be as big as usually assumed. The majority of such flows
take place elsewhere. Existing data does not distinguish between business travelers and
60 “2018年民航机场生产统计公报”, Civil Aviation Administration of China Website, Mar. 5, 2019, <
http://www.caac.gov.cn/XXGK/XXGK/TJSJ/201903/t20190305_194972.html>, last access May 27, 2019.

148
leisure travelers, nor do we know how many Chinese people are traveling abroad61 from
Shanghai, therefore this figure is only of referential value.
5.6.4 Summary
Shanghai’s weight in China’s im- and export and international travelers roughly doubled
since 1990—about the same growth rate of its local autonomy level change. The peak of
import and export around 2004-2008 perfectly coincides with a culmination of the city’s
fiscal figures, where the city’s own revenue takes up 38.64% of its total income, and the
city expenditure takes up 43.79% of its total income in 2009. So far, the hypothesis is
confirmed within the case. On a national base, Shanghai’s share of FDI inflow is slightly
larger than Mumbai’s, yet its share of import and export is smaller. This could mean that
FDI flow has a bigger impact on a GWC’s autonomy level—capital flow influences inter-
governmental relations more than the flow of goods or people does.
5.7 Chapter conclusion
In this chapter, I have studied Shanghai, China’s leading GWC. This most global city of
mainland China is both interesting and important to observe. Through tracing Shanghai’s
local autonomy level and the three IVs, i.e. the international integration of China’s national
economy, competition from neighboring cities, and the city’s weight in China’s foreign
economic activities, the three hypotheses are tested. I now briefly sum up findings and
discuss their implications.
61 In 2018, there were about the same number of Chinese citizens traveling abroad (149.72 million) and
foreigners traveling to China (141.2 million). China Ministry of Culture and Travel, 2018年旅游市场基
本情况, Feb. 12, 2019, < http://zwgk.mct.gov.cn/auto255/201902/t20190212_837271.html?>, last access
May 26, 2019.

149
5.7.1 Performances of hypotheses
Hypothesis one, that the more globally integrated a national economy becomes, its leading
GWC is more likely to acquire higher levels of local autonomy, is tested using the GWC’s
share of import and export, and the share of FDI inflow and outflow in China’s GDP. There
is a notable relation between the two variables as predicted. Unlike India, a more
internationalized Chinese economy does bring more local power to its leading GWC,
despite some delay in the fiscal figures. What remains unclear is that a slipping level of
China’s global integration is accompanied by a still-growing local autonomy of Shanghai.
This may indicate a mutual need between the city and the territorial state: Shanghai wants
to sustain its status while China tries to stabilize its global integration through that GWC.
Hypothesis two predicts that if there is more competition from other neighboring
GWCs, there is a higher likelihood that a territorial state would transfer more power to its
leading GWC. The hypothesis holds true in the Shanghai case. At the beginning, Shanghai
had to work hard to catch up with neighboring GWCs. Later, when it achieved a relatively
high level, it still needs to strive to stay ahead of many competent rivals, including the
Chinese capital of Beijing and Hong Kong as a mature IFC. The intensity of competition
remains high. This is reflected perfectly in the ever increasing autonomy of Shanghai.
Mumbai, on the other hand, enjoys more security as India’s (and perhaps the South Asian)
leading GWC, therefore did not enjoy a clear rise in local autonomy.
The third part analyzes Shanghai’s share of China’s foreign economy using Forbes 500,
actualized FDI, import and export, and number of international travelers. They are of
different natures and reflect different aspects of China’s foreign economic activities. In
general, the long-term trajectory is as predicted by the hypothesis: a higher concentration of
a national economy’s foreign economic activities in a GWC leads to more devolution of
power to that city. Yet, some short-term deviations need further investigation, e.g. the slip
of Shanghai’s share of export and import during the last few years is accompanied by a
persistent increase in the city’s autonomy level.

150
5.7.2 Known deficiencies of the empirical test
First, although Shanghai’s fiscal data is more complete than Mumbai’s, the city’s statistical
yearbooks do not provide figures on the its alternative financing options. China’s budget
law does not allow local governments to issue loans62 without specific approval from the
central authority, yet its provinces routinely resort to alternative, off-budget financing
mechanisms (e.g. PPP, public-private partnership63) to circumvent this regulation, and the
operations of such mechanisms are fairly opaque64. In recent years, revenue from land-
leasing also constitutes a major source of income for local governments. According to a
study by Zhang Rufei, in 2000, only a half of Beijing’s municipal revenue is reflected “on-
budget”, while a fifth is formally off-budget (cited from Su and Zhao 2007, 91). Both on-
budget and off-budget incomes constitute real local autonomy. With further information on
such additional financing sources for the Shanghai government (although admittedly
difficult to obtain, because they are designed to evade superior investigation), a more
complete picture could be drawn.
Second, as has been pointed out, the Forbes 500 ranking only reflects one aspect of
China’s enterprise landscape. Given China is a unitary country with strong central
regulation, it is no surprise that the majority of its largest companies are headquartered in
Beijing rather than Shanghai. Besides, this list ranks companies by size rather than profit,
or profit rate, or foreign assets held, which are perhaps better indicators of real strength and
internationalization of a company. Also, a larger population of companies, especially
private enterprises and foreign enterprises conducting business in China, should be
examined. They have the potential to tell a different story, i.e. in reality Shanghai’s weight
may be larger.
62 When local governments need to, they do it through a special enterprise they own. These enterprises, when
borrowing from banks, should present a form of backing by its local government, confirming it would see
that the enterprises repay the loans.
63 “China admits to disguised fiscal borrowing risk”, Financial Times, Aug. 2, 2017,
<https://www.ft.com/content/5fe8b3c2-7754-11e7-90c0-90a9d1bc9691>, last access Aug. 1, 2018.
64 《全国PPP市场透明度指数刚过“及格线”,新建项目信息公开优于存量项目》, 证券时报网,Jul.
15, 2018, <http://news.stcn.com/2018/0715/14387364.shtml>, last access Aug. 1, 2018.

151
Third, in China, a politically unitary state led by a single ruling party, future career of
local officials usually has an impact on the locality they served. The former president Jiang
Zemin used to be mayor and the CPC secretary of Shanghai, so was the former prime
minister Zhu Rongji. Ever since, a Shanghai experience has been a powerful (if not
necessary) advantage, if an official is to climb higher into China’s top leading circle. This
reasonably has an effect on Shanghai’s autonomy level, as it makes it much more possible
and easier for the city’s interests and needs to be heard and considered by the central
authority. It also adds points to Shanghai because the top decision-makers are more familiar
with the city. If such aspect could be examined more closely, it would greatly contribute to
a better understanding of this topic.
5.7.3 General assessment of the GWC of Shanghai
Shanghai is certainly one of China’s most successful city in terms of modernization and
globalization since the country’s opening-up and reform in the late 1970s. It is the
designated financial center, besides Hong Kong, of the territorial state, as per the city’s
master plans approved by the state council as well as the country’s central policy
statements. Recently, it also boasts China’s first free-trade zone65, hosting of the country’s
import exhibition, among its old privileges. Although some privileges are diffused into
other cities quickly, and some only generated limited real benefits66, we can safely tell that
China’s central authority still uses Shanghai as a pilot city to test out more radical measures
of opening-up and reform. This, in effect, adds to Shanghai’s local autonomy relative to
other metropolises, because the city is able to try methods and carry out functions not
enjoyed by ordinary cities for the time being. So, from the standpoint of the territorial state,
Shanghai’s leading position will likely remain.
65 “China opens Shanghai free-trade zone”, The Guardian, Sep. 29, 2013,
<https://www.theguardian.com/world/2013/sep/29/china-shanghai-free-trade-zone>, last access Aug. 1,
2018.
66 “Benefits of Shanghai free-trade zone still shrouded in mystery”, Financial Times, May 14, 2014,
<https://www.ft.com/content/c1b3a678-d592-11e3-adec-00144feabdc0>; “Shanghai free-trade zone
struggles for relevance”, Financial Times, Sept. 27, 2015, <https://www.ft.com/content/8cec0faa-6364-
11e5-9846-de406ccb37f2>. Last access Aug. 2, 2018.

152
In terms of interurban competition, given China’s relatively high level of overall
economic (especially financial) regulation67, Shanghai at the moment has little edge over
Hong Kong (or other international GWCs) to “command and control” international
economy on a scale larger than the Greater China region. On the other hand, China has little
choice other than Shanghai or Hong Kong (and much less so, Beijing and Guangzhou) to
utilize as a competent GWC. The mutuality between the territorial state of China and the
GWC of Shanghai is currently deep and perhaps unbreakable. Both should see an interest in
propelling the other’s prosperity.
Recently, the global integration of Chinese economy is slowing down (as shown in the
first IV), despite its repeated assertion of continuous opening-up. The recent Sino-U.S.
trade war further augments the uncertainty. This may bring mixed policy results pertaining
Shanghai’s GWC autonomy level. On the one hand, lower levels of internationalization
make the central authority less likely to pro-actively uphold Shanghai—as the national
economy is getting more domestically driven, which requires a more balanced national
growth. Yet, on the other hand, the territorial state has committed itself to keep “all-around”
opening up to the world on a higher level and at a larger scale (K. Li 2018). This requires
strong facilitation by home-grown GWCs, especially to aid Chinese investments overseas
and the so-called “Belt and Road” initiative, whose effects remain to be seen. In this sense,
Shanghai as a stronger GWC is still necessary. Then again, the political factor should never
be ignored. When politics is involved, Beijing always has an advantage. The “Belt and
Road” summit, likely to be held annually (together with other high-level summits and
forums initiated by China) seems to have chosen Beijing as the host city, despite the
Chinese government trying to tune down any political intentions behind it. How it plays out
in the future would be interesting to observe.
67 For example, capital and financial accounts are still tightly controlled in mainland China, but not so in
Hong Kong.

153
Chapter 6: Case of Guangzhou, China
6.1 Introduction
This chapter studies Guangzhou, a major Chinese GWC long eclipsed by Beijing and
Shanghai. However, it is one of the three most global cities in China’s mainland, right after
Beijing and Shanghai (Ma and Timberlake 2008). In terms of potentials, it is ranked the
59th in A.T. Kearney’s Global Cities Outlook 2018, on a par with Hong Kong (54th),
Shanghai (64th) and Kuala Lumpur (61st) (A.T. Kearney 2018, 14). The Pearl River Delta
Region (PRDR), where the city locates, is one of the largest mega-urban regions in the
world. City-regions are important in GWC formation because they highlight some most
imminent and new policy issues brought out by intensified globalization, and generates
higher levels of dependency and inter-dependency among urban centers (Scott 2001b).
Guangzhou makes an interesting case as to better understand how GWCs in such a city-
region fare in their inter-governmental relations. To more closely study this city would
contribute to our knowledge of GWC formation and growth in the world’s second largest
economy.
There has been much less academic attention on Guangzhou from the GWC perspective
than on Shanghai or Beijing. Existing researches include: Brencic uses Guangzhou’s
Haizhu District to illustrate the city’s urban planning’s implications in its growth as a GWC
(Brencic 2010). Li et al. study manufacturing’s importance in Guangzhou’s path toward
GWC and suggest industry and manufacturing are more crucial than financial and corporate
service for GWC formation in the Global South (W. Li, Xue, and Huang 2018). Chubarov
and Brooker identified three pathways to GWC formation and categorize Guangzhou as a
“global industrialized city”, whose globalism is based on its economic scale and status as a
manufacturing center (Chubarov and Brooker 2013).

154
6.2 Guangzhou’s local autonomy 1998-2016
I assess Guangzhou’s local autonomy change using the city’s fiscal figures from 1998 to
2016. Data is available from Guangzhou Statistics Yearbooks. Unfortunately, pre-1998
figures are unavailable as yet.
Unlike Shanghai and HCMC, but similar to Mumbai, Guangzhou is not under direct
jurisdiction of national authority. Technically, the channel must go through Guangdong
Province. However, the city is one of the “sub-provincial level cities”68 in China with a
higher level of discretion on economic and social policies that are slightly lower than
provinces but higher than ordinary cities. Such change in local autonomy happened before
our observation, so is not discussed here.
As per Table 6.1, in 1998, the Guangzhou city revenue was 137.32 billion CNY, local
expenditure was 179.61 billion CNY. Through two decades, growth rate of both local
revenue and expenditure experienced intense fluctuations. So did the sum of subsidies from
higher governments. Considering the change of CNY currency value, it is infeasible to
assess the trend on the sum of money. Instead, I use changes in year-on-year ratio.
Guangzhou’s city expenditure has always been larger than its revenue. The gap is filled
by subsidies from upper governments and other sources. The subsidies’ sum is
approximately the same amount of the municipality’s extra expenditure minus its own
revenue. This implies a continuous transference of fiscal power from higher levels. City
expenditure rocketed to more than 180% of its own revenue in 2004, then plummeted to
120% the following year. Both 2003’s and 2005’s percentages were less than 140%. This
68 Except the four municipalities under direct supervision of the central government (Beijing, Shanghai,
Tianjin, Chongqing), “sub-provincial level cities” (副省级城市) are the other category of municipalities
with a higher administrative level than ordinary cities. These cities are provincial capitals or central cities
in their respective regions, considered to play a critical role in regional or national economic and social
development. This title was enacted by the Chinese State Council in 1994 to replace the “cities with
individual development plans” (计划单列市), meaning their development plans are presented to, reviewed
and approved by the State Council, rather than the provinces they belong to. With the title comes
economic management powers roughly equivalent to that of a province. The city’s administrative level is
also lifted up a rank to one between the province and ordinary cities. Currently there are 15 sub-provincial
level cities in China: Guangzhou, Shenzhen, Hangzhou, Nanjing, Xi’an, Wuhan, Chengdu, Ningbo,
Qingdao, Dalian, Shenyang, Xiamen, Changchun, Jinan and Harbin.

155
abnormality could be due to data error or some unexplained factor, because as per the city’s
annual statistics report, there was no drastic changes in relevant items69. The general trend
through the two decades (except 2004) is largely a mild “W” curve. It slipped to less than
120% in 2001, then rebounded slightly to 130% in the next few years, before dropping
again to close to 100%. In 2007 and 2009, Guangzhou spent about the same amount of its
revenue. Yet, the ratio started to pick up during the last few years, indicating increased
alternative financing sources the city was using.
Subsidies from upper levels of government refer to those either for inter-regional
equalization or for special purposes. The data source does not distinguish between subsidies
from Guangdong Province and subsidies from Beijing. In general, the ratio of grants
culminated in 2004 (28.1%), then saw gradual rescind ever after, slipping from 22.03% in
2005 to 12.46% nine years later. It picked up slightly in the last two years, but whether that
is normal fluctuation or the start of a new trend is uncertain. As a whole, subsidies do not
show an apparent rise. If anything, the ratio stayed roughly the same, indicating lack of
power transference in this regard.
As the same with Shanghai, we compare Guangzhou’s fiscal change with China’s
national average. China’s national background is introduced in the Shanghai case, therefore
not repeated here. Local expenditure in China has been gradually increasing since 1998,
despite a small low point in 2000. Since this year, figures started to include interest
payment of loans. It is unclear whether this caused the dip. Guangzhou displays a different
pattern than China’s national trend, indicating the city is a special case. The national curve
shows a slow yet steady growth, but Guangzhou’s curve contains much larger fluctuations.
Moreover, about between 2007 and 2009, local expenditure had a short-term drop. This is
not seen nationwide, suggesting other causes were affecting Guangzhou’s local autonomy
level. We can omit the possibility that the variation of Guangzhou’s DV can be fully
accounted for on China’s national basis.
69 According to The 2004 Guangzhou Statistical Report on National Economy and Social Development (广州
市 2004年国民经济和社会发展统计公报), in this year, fiscal revenue accrued in the city grew by
17.3%; the city’s budgeted general fiscal expenditure grew by 10.3%. No drastic change was reported.

156
Table 6.1: Guangzhou Municipal Revenue and Expenditure (10000 CNY)
Source: Guangzhou Statistical Yearbook, various years, Guangzhou Municipal Government, calculated by author.
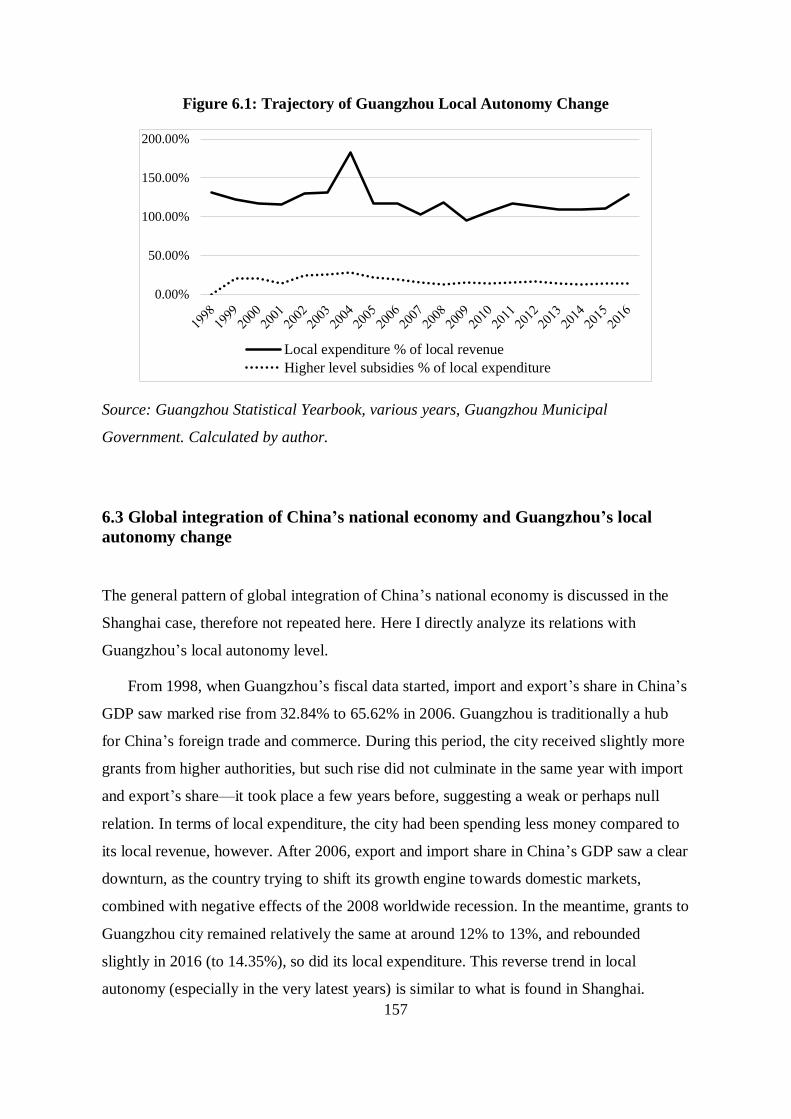
157
Figure 6.1: Trajectory of Guangzhou Local Autonomy Change
Source: Guangzhou Statistical Yearbook, various years, Guangzhou Municipal
Government. Calculated by author.
6.3 Global integration of China’s national economy and Guangzhou’s local
autonomy change
The general pattern of global integration of China’s national economy is discussed in the
Shanghai case, therefore not repeated here. Here I directly analyze its relations with
Guangzhou’s local autonomy level.
From 1998, when Guangzhou’s fiscal data started, import and export’s share in China’s
GDP saw marked rise from 32.84% to 65.62% in 2006. Guangzhou is traditionally a hub
for China’s foreign trade and commerce. During this period, the city received slightly more
grants from higher authorities, but such rise did not culminate in the same year with import
and export’s share—it took place a few years before, suggesting a weak or perhaps null
relation. In terms of local expenditure, the city had been spending less money compared to
its local revenue, however. After 2006, export and import share in China’s GDP saw a clear
downturn, as the country trying to shift its growth engine towards domestic markets,
combined with negative effects of the 2008 worldwide recession. In the meantime, grants to
Guangzhou city remained relatively the same at around 12% to 13%, and rebounded
slightly in 2016 (to 14.35%), so did its local expenditure. This reverse trend in local
autonomy (especially in the very latest years) is similar to what is found in Shanghai.
0.00%
50.00%
100.00%
150.00%
200.00%
Local expenditure % of local revenue
Higher level subsidies % of local expenditure

158
In terms of FDI flow, the continuous drop of China’s FDI flow from 1998 until 2005 is
accompanied by Guangzhou’s expenditure to revenue ratio coming from 130% to 116%—a
mild decline. Grants to the city remained about the same at 20%. China’s FDI inflow
expanded greatly in 2005, then shrank year by year (with an understandable plummet after
2008). Grants to Guangzhou had a similar curve—it dropped from 22.3% to 14.35%. The
city’s expenditure to revenue ratio, however, displayed some fluctuations before ending
with an upward tip. This, again, is in reverse to FDI inflow but consistent with FDI outflow.
Guangzhou displays largely the same trend in local autonomy as Shanghai (except for
the last few years, which needs to be further investigated against more cases), but to a less
extent. The southern GWC of China is strongly feeling the ups and downs of its national
economy’s integration into global economy. Nationwide, the two cities are from the same
background, so for this individual IV (global integration of national economy), there is no
variation between Shanghai and Guangzhou. With China’s global involvement lessening,
Guangzhou did not show a similar shrink in local autonomy, but its local autonomy did not
increase either. Only in the last few years, like Shanghai, the city’s autonomy level saw a
rebound trend, with China’s FDI outflow on the rise. Such rebound is not seen elsewhere in
China. Its nationwide central expenditure and local expenditure ratio remained the same
since 2011. So, in Guangzhou, the first hypothesis is mildly confirmed.
6.4 Intercity competition and Guangzhou’s local autonomy change
Guangzhou has been experiencing even more intense competition from neighboring GWCs,
compared to Shanghai, Mumbai and HCMC. The PRDR densely seat three major GWCs
(Hong Kong, Shenzhen, Guangzhou), with downtown Guangzhou and downtown Hong
Kong just 120km apart, and Shenzhen lies in the middle. Across the Pearl River estuary are
two smaller cities of Macao and Zhuhai. These cities, especially the big three, are
intricately inter-connected and at the same time competing with each other, as well as with
other neighboring cities (Douglass 2000b). Unlike Shanghai’s situation, Hong Kong, the
most global city in Asia, is just on the doorstep of Guangzhou.
In early stages of China’s opening up, the PRDR benefited greatly from its closeness to
Hong Kong, and attracted many manufacturing factories that found Hong Kong too
expensive and tried to tap the huge labor pool of mainland China. Such proximity also

159
helped Guangzhou and Shenzhen lure investment from overseas Chinese who use Hong
Kong as a gateway into the vast hinterland of China. The region rode the wave of NIDL
with the help of Hong Kong’s GWC functions. “Geographical proximity to Hong Kong has
given Zhujiang (Pearl River) delta region a huge advantage over other regions in China (J.
Shen 2002, 134).” Nevertheless, at the same time, especially in recent years, loosened
regulation on cross-border movements between China mainland and Hong Kong has started
to drain high-end investment and talent back to Hong Kong, (Mok and Cheung 2011; M. Li
and Bray 2007), as Hong Kong intentionally trying to consolidate its status as Asia’s
leading GWC. This skews against Guangzhou’s favor, as geographical proximity—used to
be an advantage—now turns into a possible disadvantage for high-aiming talents and
capitals to easily relocate to more mature platforms. Besides Hong Kong and Shenzhen,
there are two other “alpha” level GWCs (Taipei and Bangkok), the same level as
Guangzhou, located within 1600 km’s radius. Belonging to different economies, their de
facto challenge to Guangzhou is lower than Hong Kong.
Even closer than Hong Kong, Shenzhen is another giant city with strong nationwide
magnetism. Even though not the provincial capital of Guangdong Province, the city has
surpassed Guangzhou in economic size and growth rate in 2017—except rare cases70, in
China, the provincial capital is also the largest and the most developed city in the province.
Guangzhou is now in the third place among the PRDR’s big three—until modern times its
status as the regional center had been unquestionable. As per the World According to
GaWC, Shenzhen has tied closely with Guangzhou, ascending to “alpha-” level in 2018,
just one rank below. Some suggest that Shenzhen enjoys bigger potential as it does not
suffer from some of the worst urban problems plaguing old cities like Guangzhou, e.g.
urban slums and lack of land space for future growth. It also has more direct access to Hong
Kong, making it a better platform for China’s domestic capital and talents who want closer
connections with more internationalized service.
Another reason that Shenzhen and Hong Kong constitute more intense competition to
Guangzhou than to Shanghai is because of the dense interurban network in PRDR. It makes
70 Exceptions include: Xiamen (Fujian Province), Dalian (Liaoning Province), Qingdao (Shandong Province),
and Suzhou (Jiangsu Province). It must be pointed out that comparing cities solely on the ground of
economic size is a negative legacy of China’s craze for GDP output, and may be misleading. A
comprehensively strong city does not always have to be economically bigger.

160
flows of capital, people, and goods even more instant and convenient than in or with other
regions. As aforementioned, it could potentially undermine Guangzhou’s status, as
alternative urban platforms are easily accessible even without leaving the region. Some may
argue that it also makes it easier for talents and resources elsewhere in the region to locate
to Guangzhou—the dynamic is bidirectional. It is true for Guangzhou, but equally true for
Shenzhen and Hong Kong. Guangzhou still needs to strive to distinguish itself as the more
attractive destination.
With regards to other domestic cities, the situation Guangzhou faces is the same with
Shanghai. Second-tier cities are trying hard to arm themselves with more GWC functions at
the cost of Shanghai, Beijing and Guangzhou’s monopoly. Close to Guangzhou, the ascent
of second-tier cities like Wuhan, Chengdu, Xiamen and Changsha are especially
noteworthy. On the one hand, their connections with Guangzhou (as well as Shenzhen and
Hong Kong) are intensified, which is enhances Guangzhou’s connectedness; on the other
hand, being stronger in themselves localizes many functions that once had to be carried out
elsewhere.
Table 6.2 Guangzhou Intercity Competition as per GaWC, 2000-2018
City Country/Region 2000 2004 2008 2010 2012 2016 2018
Guangzhou China γ- γ- β- β β+ α- α
Hong Kong Hong Kong, SAR α+ α+ α+ α+ α+ α+ α+
Shenzhen China S S γ β- β- β α-
Singapore Singapore α+ α+ α+ α+ α+ α+ α+
Shanghai China α- α- α+ α+ α+ α+ α+
Beijing China β+ α- α+ α α+ α+ α+
Kuala Lumpur Malaysia α- α- α α α α α
Bangkok Thailand α- α- α- α- α- α- α
Taipei Taiwan α- α- α- α- α- α- α
Manila Philippines β+ γ+ β+ β+ β+ α- α-
HCMC Vietnam γ HS β- β β β+ β+
Hanoi Vietnam HS HS HS γ+ β- β β+
Chengdu China / / S S HS β- β+
Kaohsiung Taiwan / / S S S HS HS
Macao Macao, SAR S S S S S S S
Wuhan China / / / / S γ- β
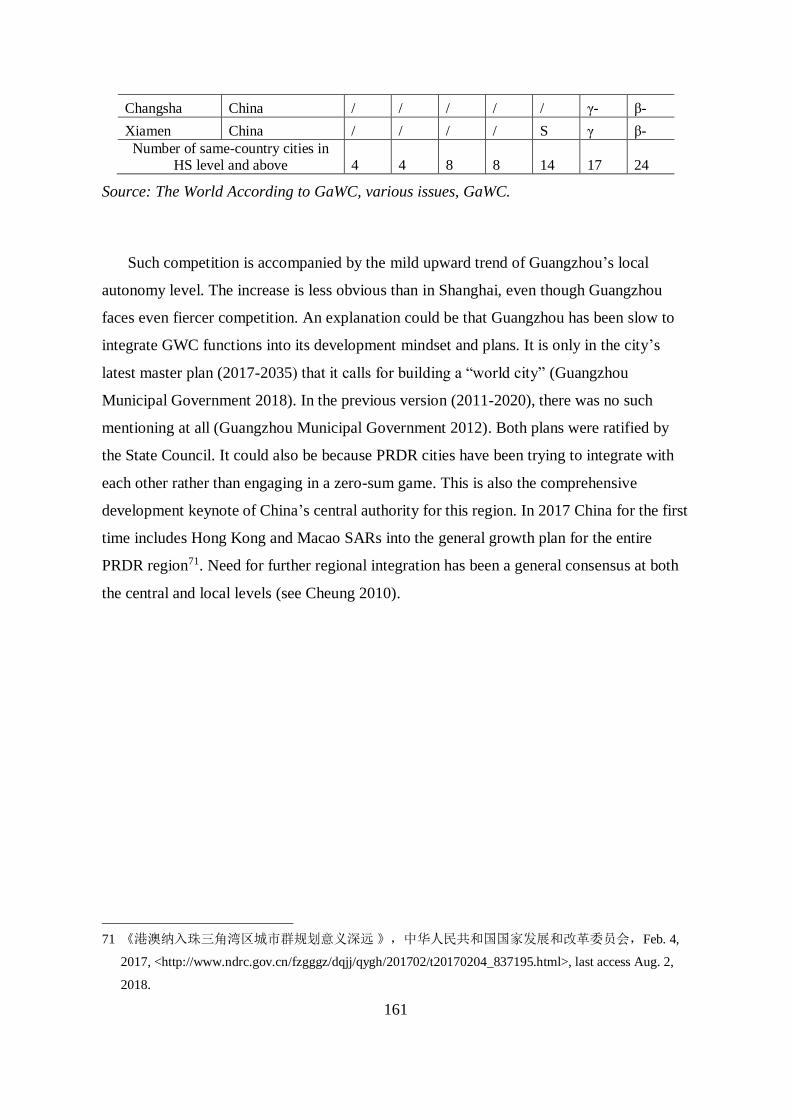
161
Changsha China / / / / / γ- β-
Xiamen China / / / / S γ β-
Number of same-country cities in HS level and above 4 4 8 8 14 17 24
Source: The World According to GaWC, various issues, GaWC.
Such competition is accompanied by the mild upward trend of Guangzhou’s local
autonomy level. The increase is less obvious than in Shanghai, even though Guangzhou
faces even fiercer competition. An explanation could be that Guangzhou has been slow to
integrate GWC functions into its development mindset and plans. It is only in the city’s
latest master plan (2017-2035) that it calls for building a “world city” (Guangzhou
Municipal Government 2018). In the previous version (2011-2020), there was no such
mentioning at all (Guangzhou Municipal Government 2012). Both plans were ratified by
the State Council. It could also be because PRDR cities have been trying to integrate with
each other rather than engaging in a zero-sum game. This is also the comprehensive
development keynote of China’s central authority for this region. In 2017 China for the first
time includes Hong Kong and Macao SARs into the general growth plan for the entire
PRDR region71. Need for further regional integration has been a general consensus at both
the central and local levels (see Cheung 2010).
71 《港澳纳入珠三角湾区城市群规划意义深远 》,中华人民共和国国家发展和改革委员会,Feb. 4,
2017, <http://www.ndrc.gov.cn/fzgggz/dqjj/qygh/201702/t20170204_837195.html>, last access Aug. 2,
2018.

162
Figure 6.2: Intercity Competition for Guangzhou According to GaWC (International)
12=α++; 11=α+; 10=α; 9=α-; 8=β+; 7=β; 6=β-; 5=γ+; 4=γ; 3=γ-; 2=high sufficiency;
1=sufficiency; 0=not in the ranking.
Source: The World According to GaWC, various issues, GaWC.
Figure 6.3: Intercity Competition for Guangzhou According to GaWC (Domestic)
12=α++; 11=α+; 10=α; 9=α-; 8=β+; 7=β; 6=β-; 5=γ+; 4=γ; 3=γ-; 2=high sufficiency;
1=sufficiency; 0=not in the ranking.
Source: The World According to GaWC, various issues, GaWC
0
1
2
3
4
5
6
7
8
9
10
11
12
2000 2004 2008 2010 2012 2016 2018
Guangzhou Hong Kong Singapore
Kuala Lumpur Bangkok Taipei
Manila Ho Chi Minh City Hanoi
Kaohsiung Macao
0123456789
101112
2000 2004 2008 2010 2012 2016 2018
Guangzhou Shenzhen Shanghai Beijing
Wuhan Changsha Xiamen Chengdu

163
In sum, the second hypothesis, that the more intense competition a GWC faces, that
GWC is more likely to acquire bigger local autonomy, is upheld in the Guangzhou case.
Despite efforts at PRDR incorporation, the city still faces intense actual competition from
two strong GWCs right at its doorstep, and its local autonomy does see expansion.
Nonetheless, the hypothesis expects a more obvious increase of autonomy, since
Guangzhou represent the highest value in this IV. Empirics do not show the expected result.
The city’s autonomy level does not seem to be that sensitive to competition. Changes in
local autonomy may need time to actualize. This could also be attributed to the highly
integrated nature of the PRDR, so that Guangzhou does not perceive Shenzhen or Hong
Kong’s growth directly as its own loss. Neither does China’s national strategy encourage an
all-out intercity competition in that region. This “harmony” is not enjoyed by Shanghai.
Although the Yangtze River Delta is comparable to PRDR in both size and level of
development, there is no rival GWC that could possibly replace Shanghai. Both Nanjing
(beta level, 2018) and Hangzhou (beta+ level, 2018), the other two central cities in the
region, are way behind Shanghai in terms of GWC capacity. Despite its huge GDP size,
Suzhou is integrated into global economy mainly via Shanghai’s articulation. The city’s
own GWC functions are rather limited.
6.5 Concentration of China’s foreign economy in Guangzhou and Guangzhou’s
local autonomy change
Guangzhou has been one of China’s main hubs for international trade and commerce. The
“China Import and Export Fair”, or “Canton Fair”, which has been held in the city since
1957, played an irreplaceable role in China’s opening up policy and its export-led growth
mode. Since its establishment in 1957, it has been a major source of foreign income for
China, especially in the pre-1978 era. More than 30% of China’s annual export deals are
signed on Canton Fairs. In 1972 and 1973, the share even exceeded 50%72.
72 “奋进广交会,开放大窗口”, Guangzhou Municipal Government Website, Feb. 16, 2019.
<http://www.gz.gov.cn/gzgov/s7498/201904/4682066f064f43eb97c1fcc5e53171ca.shtml>, last access
Apr. 29, 2019.

164
As in the other three cases, I assess the concentration of China’s foreign economy in
Guangzhou using actualized FDI and Forbes 500 rankings.
Table 6.3: Guangzhou’s Share of China’s Actualized FDI (10000 USD)
Year Guangzhou
China (excl.
H.K., Macao,
Taiwan)
Guangzhou %
of China
1997 289379 6440800 4.49%
1998 304467 5855700 5.20%
1999 317600 5265900 6.03%
2000 311541 5935600 5.25%
2001 332746 4967200 6.70%
2002 265299 5501100 4.82%
2003 306409 5614000 5.46%
2004 247696 6407200 3.87%
2005 284128 6380500 4.45%
2006 305477 6707600 4.55%
2007 341138 7833900 4.35%
2008 377413 9525300 3.96%
2009 387476 9180400 4.22%
2010 408121 10882100 3.75%
2011 437626 11769800 3.72%
2012 474312 11329400 4.19%
2013 480385 11872100 4.05%
2014 510707 11970500 4.27%
2015 541634 12626700 4.29%
2016 570120 12600100 4.52%
2017 628900
Source: Guangzhou figures from Guangzhou Statistical Yearbook, various years,
Guangzhou Municipal Government; China figures from National Bureau of Statistics of
China database, last access Jun. 15, 2018. Calculated by author.
Guangzhou’s share of China’s actualized FDI has been relatively stable, at 4.5% to 5%
between 1997 and 2016. Years from 1999 to 2003 saw a temporary expansion to more than
6%, then the ratio stayed between 4% and 5%. The peak was accompanied by a slight
increase in grants to the municipality from 1999 to 2004. Grants then slightly fell to 18%

165
and stayed there, as did the city’s FDI ratio. There is no discernable relation between FDI
concentration in Guangzhou and the city’s expenditure to revenue ratio.
Compared to Shanghai, Guangzhou is obviously attracting less foreign investment, and
has failed to markedly enlarge its share in the nation. Shanghai, however, has somehow
managed to take ever bigger shares. This is reflected in both cities’ autonomy levels:
Shanghai’s local autonomy is being continuously expanded, yet change in Guangzhou’s
local autonomy is rather modest.
In terms of concentration of China’s largest companies, as per Forbes 500, Guangzhou
has accounted for just a marginal percentage. The city only became visible the list in 2005
with one company. Due to the relatively small number of China in that year, it takes up 7%
of the country’s total. The city’s performance did not change for the next eight years. No
other company headquartered in Guangzhou made the Forbes 500 list. However, China’s
national number has expanded drastically from 14 to 74. In 2010, Guangzhou’s neighbor
Shenzhen sent two companies into Forbes 500 (Ping An Insurance and Huawei), it is in this
year that Shenzhen surpassed Guangzhou in this regard. In 2012, China Merchants Bank,
the eighth largest bank in China73, also headquartered in Shenzhen, entered the list.
Shenzhen’s lead over Guangzhou is enlarged. It should be noted that both Ping An
Insurance and China Merchants’ Bank—besides serving individual clients—also provide
advanced producer services. This skews in Shenzhen’s favor in terms of GWC functions. It
is only in 2013 that Guangzhou Automobile also made the list, changing the city’s number
from one to two. But due to the ever bigger number of China’s companies, Guangzhou’s
percentage only remained the same. Overall, the concentration of China’s biggest
companies headquartered in Guangzhou largely did not change, if not slipped.
Table 6.4: China and Guangzhou’s Forbes 500, 1995-2017
Year Total
number
HQ in
Guangzhou
Guangzhou's %
of China
National largest and its
ranking
1995 2 0 0% Bank of China 207
1996 2 0 0% Bank of China 167
73 “Largest Banks in China”, Worldlistmania.com, <https://www.worldlistmania.com/largest-banks-china/>,
last access Apr. 29, 2019.

166
1997 3 0 0% Bank of China 164
1998 4 0 0% Bank of China 173
1999 6 0 0% China Petrochemical 73
2000 10 0 0% China Petrochemical 58
2001 12 0 0% China Petrochemical 68
2002 11 0 0% State Power Corp. 60
2003 11 0 0% China Petrochemical 69
2004 15 0 0% State Grid 46
2005 14 1 7% China Petrochemical 31
2006 20 1 5% China Petrochemical 23
2007 29 1 3% China Petrochemical 16
2008 29 1 3% China Petrochemical 16
2009 37 1 3% China Petrochemical 9
2010 46 1 2% China Petrochemical 7
2011 61 1 2% China Petrochemical 5
2012 74 1 1% China Petrochemical 5
2013 89 2 2% China Petrochemical 4
2014 95 2 2% Sinopec 3
2015 98 2 2% Sinopec 2
2016 105 3 3% State Grid 2
2017 109 3 3% State Grid 2
Source: Forbes 500, Forbes, various issues, calculated by author.
Guangzhou’s sluggish performance may have rendered the city unable to enhance its
status in the eye of the central authority. The city’s autonomy level did not see obvious
expansion—its changes are sluggish. It should be remembered that the Forbes 500 is just
one aspect of the enterprise landscape, and that just a few companies in the list is unlikely
to meaningfully change inter-governmental relations. Also, the PRDR is famous not for its
giant enterprises, but vigorous small- and medium sized companies (Schmidt 1997). So,
again the same with Shanghai, an enlarged population of companies with more ranking
criteria should be observed, with which a different picture could be drawn.
In general, Guangzhou’s weight in China’s foreign economy is relatively smaller than
Shanghai. It is indeed impressive for a city to account for a twentieth of the territorial
state’s implemented FDI, and 3% of its largest companies—few other cities in the same
country could achieve this, not to mention the additional privilege brought by the Canton
Fair. Yet, such percentage has not increased further for more than ten years. This suggests

167
faster rise of other cities. It is maybe due to this reason that it has yet to make meaningful
impacts on the city’s local autonomy.
6.6 Chapter Conclusion
This chapter studies the GWC of Guangzhou, an important metropolis in South China and
the PRDR. Three IVs are assessed respectively for their relations with Guangzhou’s local
autonomy level. Being a Chinese city, Guangzhou bears some different features than
Shanghai. They share the same value on the first IV (global integration of national
economy), but fare differently on DV and the other two IVs. They also represent two
distinct urban regions, more than 1000km apart from each other. There is low possibility
that they interfere with each other’s performance in IVs.
6.6.1 Performance of hypotheses
Unlike Shanghai, Guangzhou has been slow to bulk up its GWC role. Its local autonomy
sees a gentle W-curve change. Grants from upper authority’s change is even more
modest—unlike Shanghai’s considerable increase. This does not seem to have been
affected by the global integration of China’s national economy. This is similar to Mumbai:
Indian economy’s growing internationalization did not lead to an observable expansion in
Mumbai’s local autonomy. Even though Shanghai displays an upward trend, that may be
caused by other factors or in combination with other factors—making IV1 an INUS
condition. So far the first hypothesis has not been convincingly confirmed.
Second, facing intense competition from neighboring GWCs (especially Hong Kong
and Shenzhen), Guangzhou, however, has been slow to incorporate the GWC concept into
its growth visions. The mildly growing local autonomy is consistent with the second
hypothesis, yet the highest level of competition did not induce the largest expansion in local
autonomy. A possible change can only be noticed in the latest few years in the city’s
evident increase in local expenditure to revenue ratio, the establishment of the Nansha New
Area, as well as the move to include the “world city” vision in its master plan for the first
time. Generally, this could be due to a different nature of intercity dynamics in the PRDR
168
(integration and cooperation vs. competition), and whether the city in question has a clear
global ambition—the latter is meanwhile shaped by the former. In all, the second
hypothesis is confirmed weakly in Guangzhou.
Third, Guangzhou does not have a considerable weight in China’s foreign economy,
despite it being a southern growth pole and a window to the world for decades. There is
even less concentration of both China’s implemented FDI and largest TNCs in Guangzhou.
And the city’s share did not obviously increase in the last decade. This is reflected in the
city’s sluggish increase in local autonomy. Compared with Shanghai, who has a larger
share and receives greater autonomy, the third hypothesis is upheld in China.
6.6.2 Known deficiencies of empirical test
First, mentioned before, the nature of intercity dynamics in PRDR is different from those
around Mumbai or Shanghai. Integration and cooperation levels among urban centers are
higher. Cities are more inter-dependent. Also, the Chinese central authority does not seem
to encourage an all-out intercity competition in that region, it is difficult and infeasible for
Guangzhou to set its future plans directly in a competitive manner vis-à-vis neighboring
cities. This may have led to the city’s inactiveness in GWC formation. How to exclude such
regional traits from empirical test—or to incorporate it more coherently, so as to better
compare Guangzhou with other cases, is a tricky but necessary undertaking for future
works.
Second, PRDR abounds with small- and medium-sized companies (Schmidt 1997).
They are not monitored or tracked by most company rankings. So the Forbes 500 list may
not reflect Guangzhou’s real weight. Besides, given that region’s high level of integration,
some enterprises are able to make use of GWC functions of Guangzhou, Shenzhen, and
Hong Kong, without actually locating to those cities (e.g. Gree in Zhuhai). This also adds to
the complexity of the enterprise landscape. But at the same time, they altogether lift the
concentration level of the PRDR. To pick out Guangzhou individually for an assessment
may be questionable.
Third, indicators for concentration of China’s foreign economy in Guangzhou is
unsatisfactory in terms of validity. Not only more indicators must be included, but also it is
problematic to solely rely on Guangzhou’s data. Intra-region interactions and flows make it

169
difficult to attribute any “flow” or investment precisely to one city. Therefore, there may be
non-Guangzhou investment attributed to Guangzhou, and parts related to Guangzhou
attributed to other cities. This is a common problem when one studies a certain city in a
coherent city-region.
6.6.3 General assessment of Guangzhou
Guangzhou has been not only eclipsed by Beijing and Shanghai, but also challenged by its
close neighbors of Hong Kong and Shenzhen. Its relative lack of exposure and smaller
weight may have partly led to the slow increase in the city’s local autonomy. Although the
city serves as the main venue of Canton Fair, but the event’s participants are national or
even international. Not only manufacturers in Guangzhou use the platform to promote
products. This could have two implications. One the one hand, hosting such events (and
Guangzhou is among the busiest cities in China to host exhibitions and fairs74) requires
strong local accommodation and logistical capabilities. Huge flocks of businessmen
(domestic and international) in the city bring daunting governance challenges that are
highly peculiar to GWCs. The city, to become a competent host, would feel strong impetus
to expand its own autonomy. On the other hand, since the events cater to the whole national
economy, central policymakers may device ways to directly utilize that platform to serve
national welfare, instead of indirectly through expanded autonomy for the city where the
events are held. In sum, although indisputably important in China’s international trade and
commerce, the Canton Fair may produce mixed or uncertain outcomes in Guangzhou’s
local autonomy vis-à-vis Beijing. This cannot be properly covered by any IV in this
research, but its implications need to be studied more deeply.
The slow increase in Guangzhou’s local autonomy could also be due to the polycentric
nature of PRDR, and Guangzhou foresees more benefits in cooperation, rather than
competition in intercity interactions. Pan-PRDR intercity cooperation is encouraged by
74 “世界会展城市实力排名出炉,中国十城市入围”, 中国网新闻中心, Mar. 4, 2017,
<http://news.china.com.cn/txt/2017-03/04/content_40407879.htm>, last access Apr. 27, 2019.

170
both the central75 and provincial authority76. As the traditional regional center, Guangzhou
may feel obliged to cooperate, rather than compete with its neighbors. However, other cities
never ceased to carry on the competition angst and have made remarkable progress. In
2017, Guangzhou eventually incorporated GWC visions into its master plan. In this sense,
locating in a mega-urban region and being the historical central city in that region bring
interesting effects to a GWC’s self-identity and positioning, as well as how that GWC
views its neighbors as potential rivals or cooperators. This would lead to complex effects
on the city’s inter-governmental relations.
With the footloose nature of capital and infrastructure improvements in China,
Guangzhou is losing its geographical advantage not only within its urban-region but also in
the territorial state, as Shenzhen rising fast and Hong Kong further integrating with China’s
mainland. Nor has this city managed to increase its weight in China’s foreign economy.
The territorial state has limited interest in propelling its GWC formation, compared to
Shanghai. However, Guangzhou is a major member of the PRDR urban region, which is
critical to China’s national economy. National policies are more inclined to that region,
instead of to any single city in that region. Chief Executives of Hong Kong and Macao
SARs are included in China’s top-level group in charge of the Yuegang’ao (Guangdong,
Hong Kong, Macao) Bay Area development for the first time in 201877 (as a comparison, at
the time of writing, there is no equivalent top-level leading group for the Yangtze River
Delta region, where Shanghai is). A more coordinated regional plan benefits Guangzhou
too. Either way, the city’s fate is tightly tied to PRDR. And rather than just the city’s local
autonomy level, if the whole PRDR’s local autonomy level could be assessed, one may get
results more pertinent to the GWC or global city-region scholarship.
75 “国务院关于深化泛珠三角区域合作的指导意见”, China State Council, 国发【2016】18号, <
http://www.gov.cn/zhengce/content/2016-03/15/content_5053647.htm >, last access Apr. 27, 2019.
76 “广东省深化泛珠三角区域合作实施意见”, People’s Government of Guangdong Province, 粤府
【2017】8号, 2017, < http://zwgk.gd.gov.cn/006939748/201702/t20170213_692564.html >, last access
Apr. 27, 2019.
77 《林郑月娥崔世安将首次进入中央层面的小组》,新浪网,Aug. 14, 2018,
<http://news.sina.com.cn/o/2018-08-14/doc-ihhtfwqq7747058.shtml>, last access Aug. 15, 2018.
171
Chapter 7: Case of Ho Chi Minh City, Vietnam
7.1 Introduction
This chapter studies Vietnam’s leading GWC the Ho Chi Minh City (HCMC). Formerly
known as Saigon, HCMC has a long historical heritage as a commercial and trade center of
South Indochina since the French colonial rule. Today it is the largest city and financial and
economic center of Vietnam, a fast-growing mid-sized economy in Southeast Asia.
Although its size is relatively small yet, both in terms of GDP growth rate and share of FDI
in GDP, Vietnam is among the front runners in ASEAN (see Figures 7.1, 7.2). In 1994, the
U.S. lifted its 19 years of trade embargo on Vietnam. The country is now in the process of
receiving many manufacturing industries relocating from China due to rising costs. In this
sense, Vietnam is increasingly involved in the new phase of NIDL, and is a hot destination
for global capital’s expansion. Therefore, closer attention to HCMC, which has not been
much examined by the GWC scholarship, is necessary and would generate further
knowledge on emerging GWCs in smaller-sized economies.
Administratively, together with other four cities78, HCMC is at the same level as a
province in Vietnam. It has the same powers and responsibilities as provinces, and does not
overlap with any of them. It is similar to Shanghai’s position in China as a municipality
directly under central control. There is no intermediate level between the city and the
central authority.
GWC researches on HCMC are rare, but works on HCMC’s unique status in Vietnam
as its largest city and economic center—i.e. as a large third world metropolis—abound.
Some are worth noting: Gainsborough uses HCMC to illustrate on the changing political
economy in Vietnam, including changes in its central-local relations (Gainsborough 2003);
Dapice et al. discuss governance challenges confronting HCMC’s growth as Vietnam’s
leading mega-city: two most imminent challenges are traffic congestion and need for
additional space for urban development (Dapice, Gomez-Ibanez, and Thanh 2010); Vind
78 The other four cities are: Hanoi, Can Tho, Da Nang and Hai Phong.

172
and Fold trace HCMC’s position in global commodity chains and thereby try to inform on
WCN (Vind and Fold 2011);
Figure 7.1: GDP Growth Rate of Some ASEAN Countries, 1993-2016 (%)
Source: World Development Indicators, World Bank.
Figure 7.2: FDI Inflow’s % of GDP of Some ASEAN Countries, 1993-2016
Source: World Development Indicators, World Bank.
-10
-8
-6
-4
-2
0
2
4
6
8
10
12
Vietnam Thailand Philippines Malaysia
0
2
4
6
8
10
12
14
Vietnam Thailand Philippines Malaysia
173
7.2 Decentralization in Vietnam since Doi Moi
This part briefly introduces decentralization and local autonomy in Vietnam since Doi Moi.
This is to serve as a control vector for the study variables. As with previous cases, to assess
IVs’ real effects on HCMC’s local autonomy, the city must be first situated in its national
background. It would strengthen our conclusions if HCMC turns out to be a deviant case in
Vietnam; and if its change is concurrent with other provinces, we will have to tune down
our conclusions and consider our study variables more carefully.
Along with many other newly industrialized countries, since the late 1980’s, Vietnam
started to embrace global markets and incrementally relaxed regulation and control on
economy and society, although as a communist regime, much central planning was still in
place, and the country was—although willing to—only loosening grips and adopting
additional reforms gradually. Pilot programs are often carried out to test for their
applicability and latent problems before they are rolled out nationally. It should be noted
here that many of such pilot programs—political or economic—are first tested in HCMC.
Constitutionally, the supreme national power belongs to the National Assembly.
However, given the political system of the country, the Communist Party of Vietnam
(CPV) has the de facto absolute power and comprehensive control over all aspects of
politics including jurisdiction. This is similar to China, where the Communist Party of
China is in de facto control of the country’s political life. In 1986, the Resolution of the 6th
Party Congress of CPV acknowledged the need to decentralize power, emphasizing “the
balance between the decision-making right of the central level, the rights to autonomy of
the local level and production units, and the ownership role of the collective workers” (Anh
2016, 191–92). Since then decentralization has been cautiously pushed forward by the
central government in the areas of “state budget; investment; administration and personnel;
land and natural enterprises (SOEs); and public services (ibid.)” with a practical aim to
overcome economic difficulties plaguing the country and unleash some level of freedom
and momentum in local governments and the private sector.
Fiscally, in 1990, a resolution titled Fiscal Decentralization to Local Governments was
passed by the Council of Ministers as a Doi Moi measure. It laid the groundwork for the
making and enactment of the country’s first budget law (1996), which has been updated
twice in 2002 (effective since 2004) and 2015 (effective since 2017). With a budget law to

174
follow and incremental measures in place, a general trend was created towards more
delimitation and predictability of fiscal responsibilities among different government tiers.
Some tax incomes are now shared between central and provincial governments79.
Provincial governments are given greater discretion on their fiscal relations with sub-
provincial bodies within their territories. Local governments are now also allowed to take
out loans to meet their financial needs, with strings attached. More resources and autonomy
are placed at sub-national levels.
In this process, however, the central authority’s attempts to retain control are obvious
too. For decentralization, provincial-level units are classified into three groups, each with a
different level of local discretion and central supervision—indicating a strong “top-down”
characteristic of the process. Fiscally, the center not only set a “period of stability” of 3 to 5
years on the allocation of shared tax revenue, but also rejected local demands for increasing
the share of provincially-collected import tax that are locally kept. On local debts, although
localities are now allowed to do so, the central government has imposed a ceiling on the
debt ratio that localities must conform to. Localities are incrementally granted autonomy to
check and ratify investment projects on their own, but their space of doing so remains
dictated by central policymakers—important or certain kinds of projects still have to be
reported to and approved by Hanoi. Sub-national budgets can now be set sub-nationally, yet
all those budgets must be integrated into the national budget plan (Nguyen-Hoang and
Schroeder 2010, 701). There were even attempts to “recentralize” power in the 2000s (Anh
2016, 194). Like China, local autonomy in Vietnam still bears much inherent features of a
unitary state.
From the figure below, we can tell that overall, with incremental decentralization since
Doi Moi, local autonomy in Vietnam has steadily grown. There is a generally upward trend
in both the local government’s revenue and expenditure as percentages of total revenue and
expenditure. It is accompanied by a decline in the subsidies from central government as
percentage of total local expenditure. Changes became stagnant since 2004, probably due to
the adoption of the “periods of stability”. Scholars made mixed assessments on the results
and prospects of local autonomy in Vietnam since Doi Moi. Some believe that in fact,
79 Sharing rates vary among provinces, but in each province the same rate applies to all items of shared tax.
This feature is considered unique to Vietnam.

175
actually achieved decentralization failed to meet the objectives set by formal policies and
arrangements; while some think local autonomy has increased significantly and that the
CPV now has to deal with stronger localism and diffused power (see Rao 2001; Nguyen-
Hoang and Schroeder 2010; Uchimura and Kono 2012; The World Bank 2015, etc.). Some
find the decentralization’s actual impact is not entirely clear (Kono and Uchimura 2012).
This is a national background to note when analyzing HCMC.
Figure 7.3: Vietnamese Fiscal Decentralization 1996-2013
Source: (Anh 2016, 203)
7.3 HCMC’s local autonomy change, 2005-2016
I first assess HCMC’s local autonomy level using its fiscal data from 2005 to 2016,
spanning 12 years. The duration observed is the shortest among our four cases, because the
city’s fiscal data prior to 2005 and after 2016 is unfortunately not available to me at the
time of writing.

176
Table 7.1: Ho Chi Minh City Local Public Finance, 2005-2016
177
Per Table 7.1, HCMC’s local autonomy level has risen pronouncedly. In 2005,
Vietnamese central authority sent just 254.4 billion Dongs to HCMC, accounting for a tiny
1.25% of the city’s overall local expenditure. In comparison, HCMC’s local budget took up
a majority of the city’s overall expenditure (87.97%). This indicates a lack of devolution
from upper authority. Central subsidy then increased to 8.52% in five years. In 2011 it
doubled to 16.32% and stayed at 10% to 15% afterwards. It is the same year when
Vietnam’s central government asked “to strongly develop trade and investment services,
participate in international and regional distribution networks and form international-level
trade centers such as ... Ho Chi Minh City... (Vietnamese Prime Minister 2011)” This is
highly relevant to HCMC’s GWC role. In this year, HCMC’s expenditure from local
budget started to decline in the total budget, going from 91.23% in 2010 to 89.22% in 2011.
The fall continued steadily to 2016, when local source of expenditure accounted for just
64.9% of the total local budget. This could mean a) an increasing amount of money from
above (the central government), and b) more financial resources are tapped via alternative
means like loans and debts. Both point to increased local autonomy. Such trend is further
demonstrated by Vietnam’s latest five-year plan for 2016-2020, which specifically demands
more investment to HCMC to address its traffic problem (Vietnamese Government 2001),
which has long tarnished the city’s image as a GWC (see Dapice, Gomez-Ibanez, and
Thanh 2010).
To complement the fiscal figures, we also take other aspects into consideration.
Administratively, in Vietnam, the 63 provinces and cities are divided into three groups of
decentralization. Group 1, which enjoys special status and the largest freedom, consists of
only HCMC and Hanoi. In Group 2 are other three cities under central supervision (Hai
Phong, Da Nang and Can Tho). They enjoy less freedom than Group 1, but more freedom
than Group 3, which includes all other provinces (Anh 2016, 194). This categorization
highly indicates that first, HCMC has in itself a higher level of autonomy; and second, it is
of a higher priority than other provinces and cities for the Vietnamese national government.
As mentioned in §7.2, Vietnamese local governments have multiple ways to raise
money to make ends meet, including development banks (38% of total in 2011), state
treasury (29%), local bonds (22%) and central government on-lending (8%) (The World
Bank 2015, 44). But HCMC and Hanoi are the only cities to have substantially issued
bonds. They are also allowed to adopt multiple models of fund-raising including Build-
178
Operate-Transfer (BOT), Built-Transfer-Operate (BTO), and Build-Transfer (BT) (Nguyen-
Hoang and Schroeder 2010, 706). Moreover, HCMC and Hanoi have a higher borrowing
ceiling. Ordinary provinces are only allowed to borrow up to 30% of their annual capital
budget, while HCMC (and Hanoi) is allowed 100% (ibid, 45). This aspect points to locally
“grabbed autonomy” that is different from devolution from the center. The locality is able
to actively pursue or improvise ways of funding other than solely relying on a unified
national budget—a more self-driven manner of local autonomy. With substantially larger
financial power, HCMC is able to carry out governmental functions and provide better
public services pertaining to GWC formation.
Internally, HCMC abolished all sub-municipal level People’s Councils in April 2009,
retaining only the municipal People’s Council. Functions and decisions of the city-level
authority are therefore strengthened (Kono and Uchimura 2012, 140). So, in addition to
more autonomy vis-à-vis the central authority, HCMC’s local autonomy is further
concentrated into the hands of the municipal government through a re-centralizing effort
within its jurisdiction. This empowers the city to adopt more citywide policies and pursue
objectives that benefit overall metropolitan growth.
In all, we see an apparent rise of local autonomy in HCMC. The Vietnamese
decentralization is played out on a higher level in this city than elsewhere, making HCMC a
special sub-national unit. The following sections investigate causes of such differences
from aspects of the globalization’s ramifications on Vietnam and on HCMC itself.
7.4 Global integration of Vietnamese economy and HCMC’s local autonomy
Vietnam has a relatively high level of integration into globalization, much higher than
China and India. In 2003, both import’s and export’s ratio to GDP exceeded 50%. In the
same year, that of India was less than 15%, and that of China less than 30%. The
percentage has seen a steady increase ever since, only with two short-term dips in 2005 and
2009. In 2017, imports of goods and services accounted for 98.8% of the country’s GDP,
while exports accounted for 101.6%. It means Vietnam is highly involved in the global
commodity chain. Its dependence on the smooth connection to and functioning of global
economy is substantial. With a large share of its international trade being with Asian
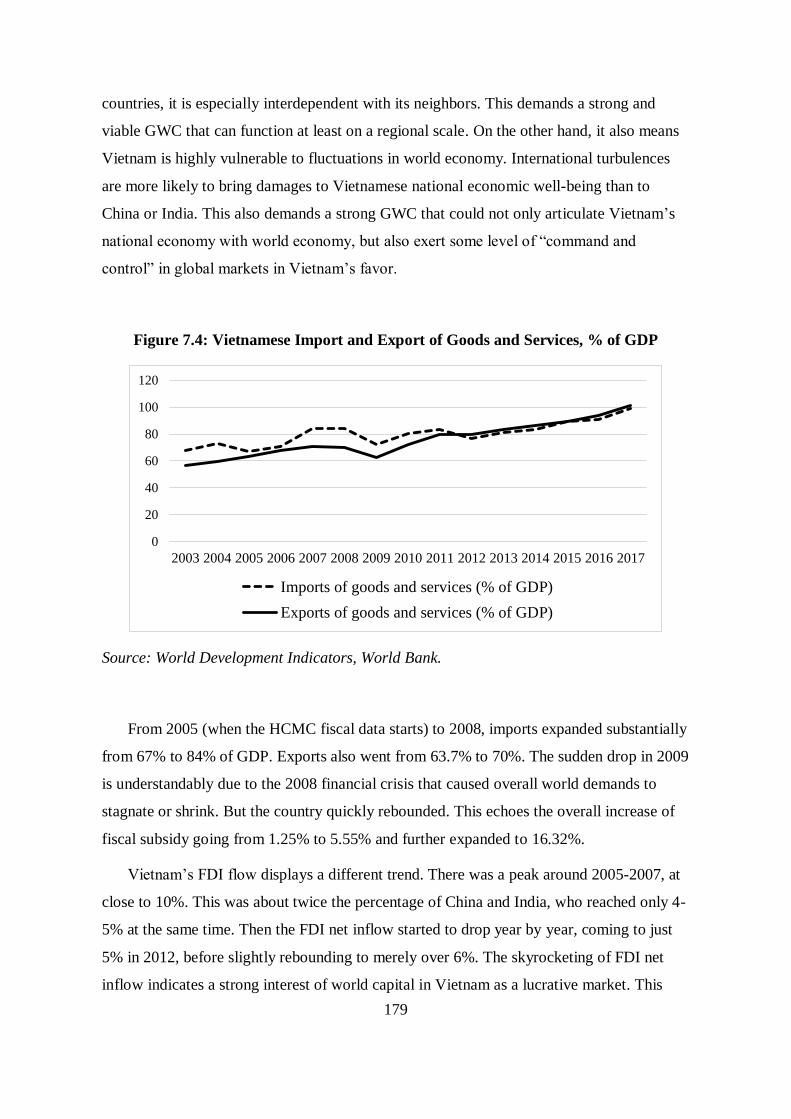
179
countries, it is especially interdependent with its neighbors. This demands a strong and
viable GWC that can function at least on a regional scale. On the other hand, it also means
Vietnam is highly vulnerable to fluctuations in world economy. International turbulences
are more likely to bring damages to Vietnamese national economic well-being than to
China or India. This also demands a strong GWC that could not only articulate Vietnam’s
national economy with world economy, but also exert some level of “command and
control” in global markets in Vietnam’s favor.
Figure 7.4: Vietnamese Import and Export of Goods and Services, % of GDP
Source: World Development Indicators, World Bank.
From 2005 (when the HCMC fiscal data starts) to 2008, imports expanded substantially
from 67% to 84% of GDP. Exports also went from 63.7% to 70%. The sudden drop in 2009
is understandably due to the 2008 financial crisis that caused overall world demands to
stagnate or shrink. But the country quickly rebounded. This echoes the overall increase of
fiscal subsidy going from 1.25% to 5.55% and further expanded to 16.32%.
Vietnam’s FDI flow displays a different trend. There was a peak around 2005-2007, at
close to 10%. This was about twice the percentage of China and India, who reached only 4-
5% at the same time. Then the FDI net inflow started to drop year by year, coming to just
5% in 2012, before slightly rebounding to merely over 6%. The skyrocketing of FDI net
inflow indicates a strong interest of world capital in Vietnam as a lucrative market. This
0
20
40
60
80
100
120
2003 2004 2005 2006 2007 2008 2009 2010 2011 2012 2013 2014 2015 2016 2017
Imports of goods and services (% of GDP)
Exports of goods and services (% of GDP)
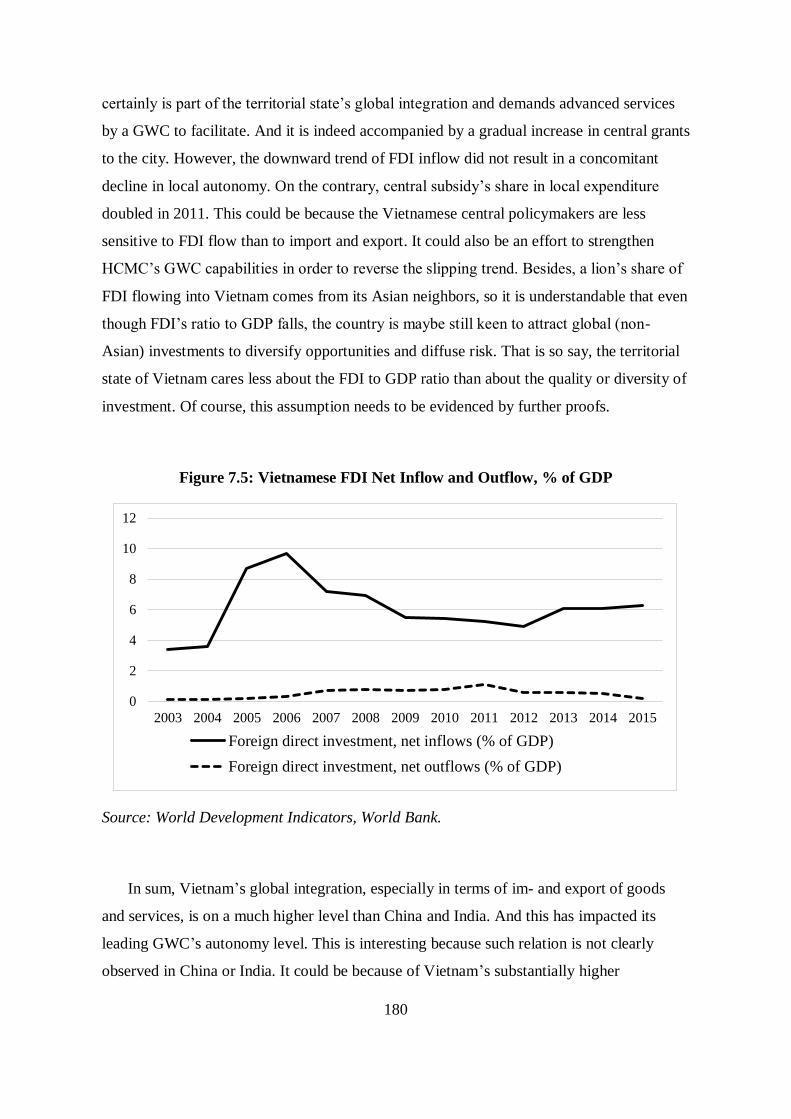
180
certainly is part of the territorial state’s global integration and demands advanced services
by a GWC to facilitate. And it is indeed accompanied by a gradual increase in central grants
to the city. However, the downward trend of FDI inflow did not result in a concomitant
decline in local autonomy. On the contrary, central subsidy’s share in local expenditure
doubled in 2011. This could be because the Vietnamese central policymakers are less
sensitive to FDI flow than to import and export. It could also be an effort to strengthen
HCMC’s GWC capabilities in order to reverse the slipping trend. Besides, a lion’s share of
FDI flowing into Vietnam comes from its Asian neighbors, so it is understandable that even
though FDI’s ratio to GDP falls, the country is maybe still keen to attract global (non-
Asian) investments to diversify opportunities and diffuse risk. That is so say, the territorial
state of Vietnam cares less about the FDI to GDP ratio than about the quality or diversity of
investment. Of course, this assumption needs to be evidenced by further proofs.
Figure 7.5: Vietnamese FDI Net Inflow and Outflow, % of GDP
Source: World Development Indicators, World Bank.
In sum, Vietnam’s global integration, especially in terms of im- and export of goods
and services, is on a much higher level than China and India. And this has impacted its
leading GWC’s autonomy level. This is interesting because such relation is not clearly
observed in China or India. It could be because of Vietnam’s substantially higher
0
2
4
6
8
10
12
2003 2004 2005 2006 2007 2008 2009 2010 2011 2012 2013 2014 2015
Foreign direct investment, net inflows (% of GDP)
Foreign direct investment, net outflows (% of GDP)

181
dependence on the world market. Could it be that this dependence is so great for the
Vietnamese government to ignore? The rising autonomy of HCMC is also consistent with
Vietnam’s increasing dependence on FDI inflow, although in a very crude sense. The short-
term reverse trend between FDI’s percentage of GDP and HCMC’s local autonomy begs
deeper investigation.
7.5 Intercity competition and HCMC’s local autonomy level
Still, I use the World according to GaWC to assess the competition HCMC faces. There
have been just two Vietnamese cities to ever appear on the GaWC radar, indicating that
Vietnamese cities are still backward and weakly connected internationally. From 2000 to
2018, HCMC’s performance has been not entirely stable. It actually dropped one rank in
2004, from “beta” level to “high sufficiency” level—the same level as Hanoi. Afterwards,
the city has been continuously improving, reaching “beta+” level in 2018. This is a
relatively high level in Southeast Asia. Besides mature GWCs like Bangkok, Kuala Lumpur
and Singapore, HCMC’s neighboring cities are all below this rank, e.g. Cebu at
“sufficiency” and Hanoi at “beta”. Other neighbors like Penang and Phnom Penh only
entered the GaWC map recently, not to mention smaller Vietnamese cities like Da Nang
and Hai Phong—although important domestically—were never powerful enough to qualify
as a GWC.
Indeed, the East- and Southeast Asian region is teeming with strong GWCs. To the
northeast of HCMC there are Tokyo and Seoul; to the north there are Hong Kong,
Shanghai, Beijing and Guangzhou; and to the South, Singapore and Bangkok. GWCs are
thought to operate on different levels. They are “arranged into a hierarchy of spatial
articulations, roughly in accord with the economic power they command (Friedmann 1995,
23, original emphasis).” These other GWCs articulate much larger or stronger economies
than HCMC. In this sense, they have stronger “command and control” over international
economy. Therefore, they are understandably not pursuing the same kinds of investment or
project with HCMC—although on rare occasions, they could be after a same trophy such as
the right to host a major sports/cultural/economic event. For the most part, we do not see
them as real challengers to HCMC.

182
Table 7.2: HCMC’s Neighboring GWCs According to GaWC
City Country/Region 2000 2004 2008 2010 2012 2016 2018
Ho Chi Minh City Vietnam γ HS β- β β β+ β+
Singapore Singapore α+ α+ α+ α+ α+ α+ α+
Kuala Lumpur Malaysia α- α- α α α α α
Bangkok Thailand α- α- α- α- α- α- α
Manila Philippines β+ γ+ β+ β+ β+ α- α-
Guangzhou China γ- γ- β- β β+ α- α
Hong Kong China α+ α+ α+ α+ α+ α+ α+
Hanoi Vietnam HS HS HS γ+ β- β β+
Penang Malaysia / / S S S S γ-
Cebu Philippines / / / S S S S
Phnom Penh Cambodia / / / / S HS γ-
Macao China S S S S S S S
Number of same-country cities 2 2 2 2 2 2 2
Source: The World According to GaWC, GaWC, various issues.
Domestically, the capital and northern growth pole of Vietnam, Hanoi, has been tightly
behind Ho Chi Minh City for the majority of time. Other than Hanoi, there is no
Vietnamese cities ever to appear in GaWC’s radar. HCMC’s domestic competition scenario
is quite like that of Mumbai and Shanghai, with the political capital as the only true rival.
Hanoi obviously provides more direct contact to the central authority as well as more
insider information. What else skews in Hanoi’s favor (and in Shanghai’s case, skews in
Beijing’s favor) is the unitary political system of Vietnam and the strong presence of SOEs
in its national economy (SOE is a major source of income for the Vietnamese government
(Uchimura and Kono 2012, 110–11)). Furthermore, seating so many SOE headquarters
brings to Hanoi additional influence in Vietnamese economy—and future influence over
international economy if these SOEs grow into TNCs. Along with the headquarters,
advanced service sectors also conglomerate in Hanoi. Some firms would require only one
foothold in Vietnam temporarily and need to choose between Hanoi and HCMC—a
situation also found in China, where TNCs need to decide between Beijing and Shanghai.
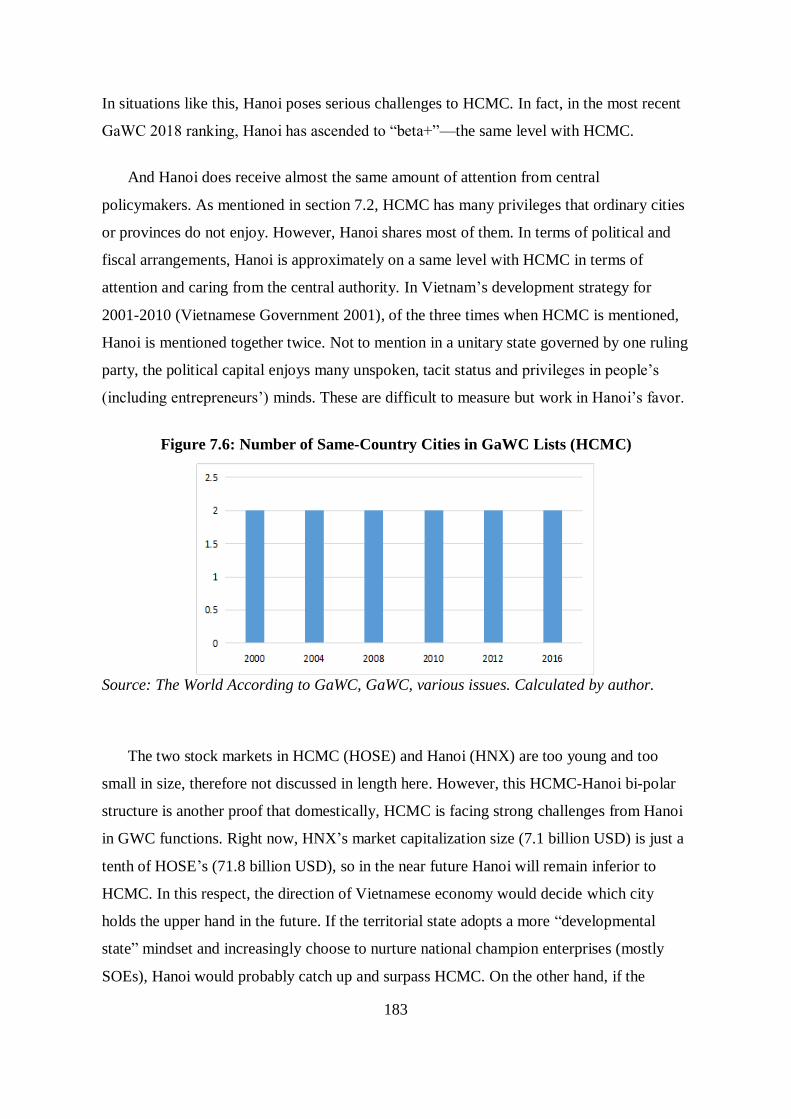
183
In situations like this, Hanoi poses serious challenges to HCMC. In fact, in the most recent
GaWC 2018 ranking, Hanoi has ascended to “beta+”—the same level with HCMC.
And Hanoi does receive almost the same amount of attention from central
policymakers. As mentioned in section 7.2, HCMC has many privileges that ordinary cities
or provinces do not enjoy. However, Hanoi shares most of them. In terms of political and
fiscal arrangements, Hanoi is approximately on a same level with HCMC in terms of
attention and caring from the central authority. In Vietnam’s development strategy for
2001-2010 (Vietnamese Government 2001), of the three times when HCMC is mentioned,
Hanoi is mentioned together twice. Not to mention in a unitary state governed by one ruling
party, the political capital enjoys many unspoken, tacit status and privileges in people’s
(including entrepreneurs’) minds. These are difficult to measure but work in Hanoi’s favor.
Figure 7.6: Number of Same-Country Cities in GaWC Lists (HCMC)
Source: The World According to GaWC, GaWC, various issues. Calculated by author.
The two stock markets in HCMC (HOSE) and Hanoi (HNX) are too young and too
small in size, therefore not discussed in length here. However, this HCMC-Hanoi bi-polar
structure is another proof that domestically, HCMC is facing strong challenges from Hanoi
in GWC functions. Right now, HNX’s market capitalization size (7.1 billion USD) is just a
tenth of HOSE’s (71.8 billion USD), so in the near future Hanoi will remain inferior to
HCMC. In this respect, the direction of Vietnamese economy would decide which city
holds the upper hand in the future. If the territorial state adopts a more “developmental
state” mindset and increasingly choose to nurture national champion enterprises (mostly
SOEs), Hanoi would probably catch up and surpass HCMC. On the other hand, if the
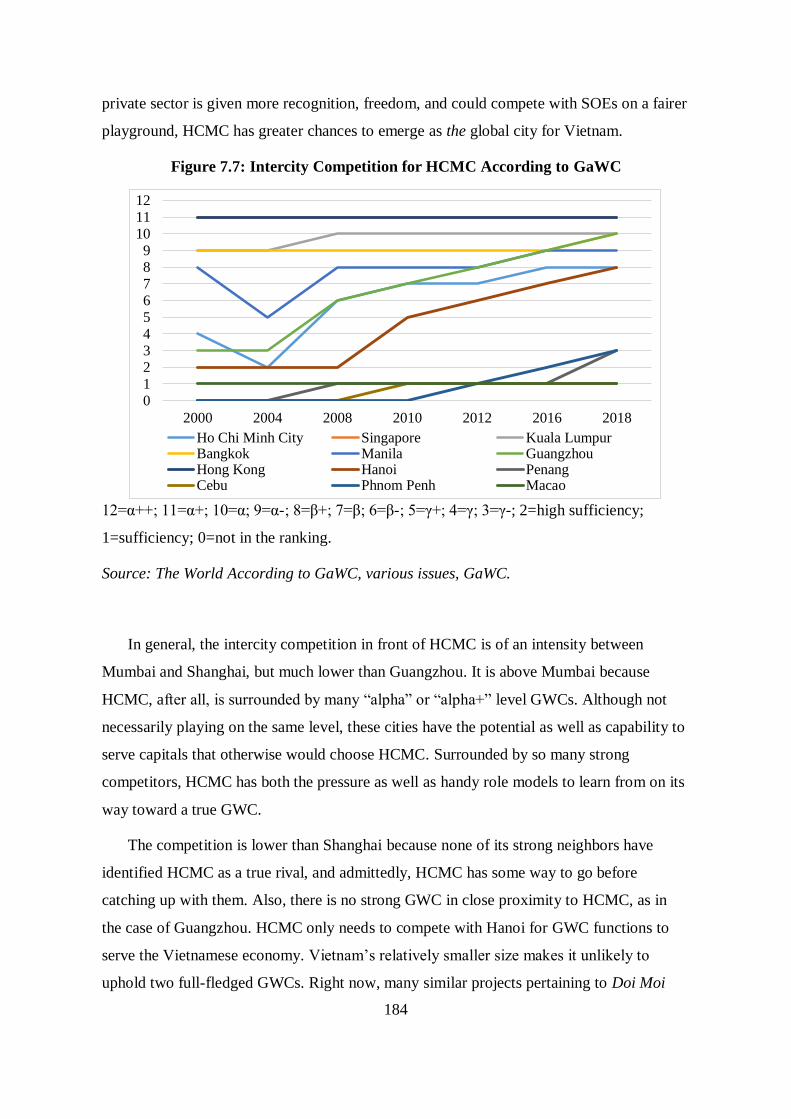
184
private sector is given more recognition, freedom, and could compete with SOEs on a fairer
playground, HCMC has greater chances to emerge as the global city for Vietnam.
Figure 7.7: Intercity Competition for HCMC According to GaWC
12=α++; 11=α+; 10=α; 9=α-; 8=β+; 7=β; 6=β-; 5=γ+; 4=γ; 3=γ-; 2=high sufficiency;
1=sufficiency; 0=not in the ranking.
Source: The World According to GaWC, various issues, GaWC.
In general, the intercity competition in front of HCMC is of an intensity between
Mumbai and Shanghai, but much lower than Guangzhou. It is above Mumbai because
HCMC, after all, is surrounded by many “alpha” or “alpha+” level GWCs. Although not
necessarily playing on the same level, these cities have the potential as well as capability to
serve capitals that otherwise would choose HCMC. Surrounded by so many strong
competitors, HCMC has both the pressure as well as handy role models to learn from on its
way toward a true GWC.
The competition is lower than Shanghai because none of its strong neighbors have
identified HCMC as a true rival, and admittedly, HCMC has some way to go before
catching up with them. Also, there is no strong GWC in close proximity to HCMC, as in
the case of Guangzhou. HCMC only needs to compete with Hanoi for GWC functions to
serve the Vietnamese economy. Vietnam’s relatively smaller size makes it unlikely to
uphold two full-fledged GWCs. Right now, many similar projects pertaining to Doi Moi
0
1
23
4
5
6
78
9
10
11
12
2000 2004 2008 2010 2012 2016 2018
Ho Chi Minh City Singapore Kuala LumpurBangkok Manila GuangzhouHong Kong Hanoi PenangCebu Phnom Penh Macao

185
and opening up are being carried now in Hanoi and HCMC in parallel, with the latter
seemingly holding an upper hand (e.g. see Marchall 2005 for a comparison of doi moi
urban development projects in Hanoi and HCMC).
This medium level of competition is accompanied by the clear rise in HCMC’s local
autonomy. It can also be further evidenced by the substantially increased development
investments the city spends. In 2005 the city spent 7516.5 billion Dong, in 2016 the
expenditure has more than quadrupled, to 31790 billion Dong. It is clear that both the
central government and HCMC has an interest in strengthening the city’s GWC
capabilities. The second hypothesis is evidently upheld here.
7.6 Concentration of Vietnam’s foreign economy in HCMC
In the other three cases, concentration is indicated by the number of Forbes 500 companies
in a GWC, and its share in the national total. Unfortunately, no Vietnamese companies have
ever made the list, so it is impossible to use the same measurement for HCMC. Instead, I
use the VNR500 rankings dedicated solely to Vietnamese companies. It counts the largest
500 companies and the largest 500 private companies in Vietnam. Actually, given the
population size of 500 for a relatively small economy like Vietnam, such list is a better
reflection of the company distribution in the country. The item “largest enterprises in
Vietnam” also includes foreign companies doing business there, i.e. Samsung (1st place,
2017) and Toyota (27th place, 2017)80, reflecting a more truthful pattern of global capital’s
agglomeration in the territorial state. In this sense, this measurement accords better with
one central tenet of the GWC scholarship: a city’s importance in world city network is a
reflection of how the national/regional economy the city articulates is situated in the
international division of labor. If more TNCs—domestic or international ones—are
headquartered in a city, that city is more engaged in global economy.
80 “Top 500 largest enterprises in Vietnam, 2017, full list”, VNR500,
<http://www.vnr500.com.vn/Charts/Index?chartId=1>, last access Aug. 1, 2018.
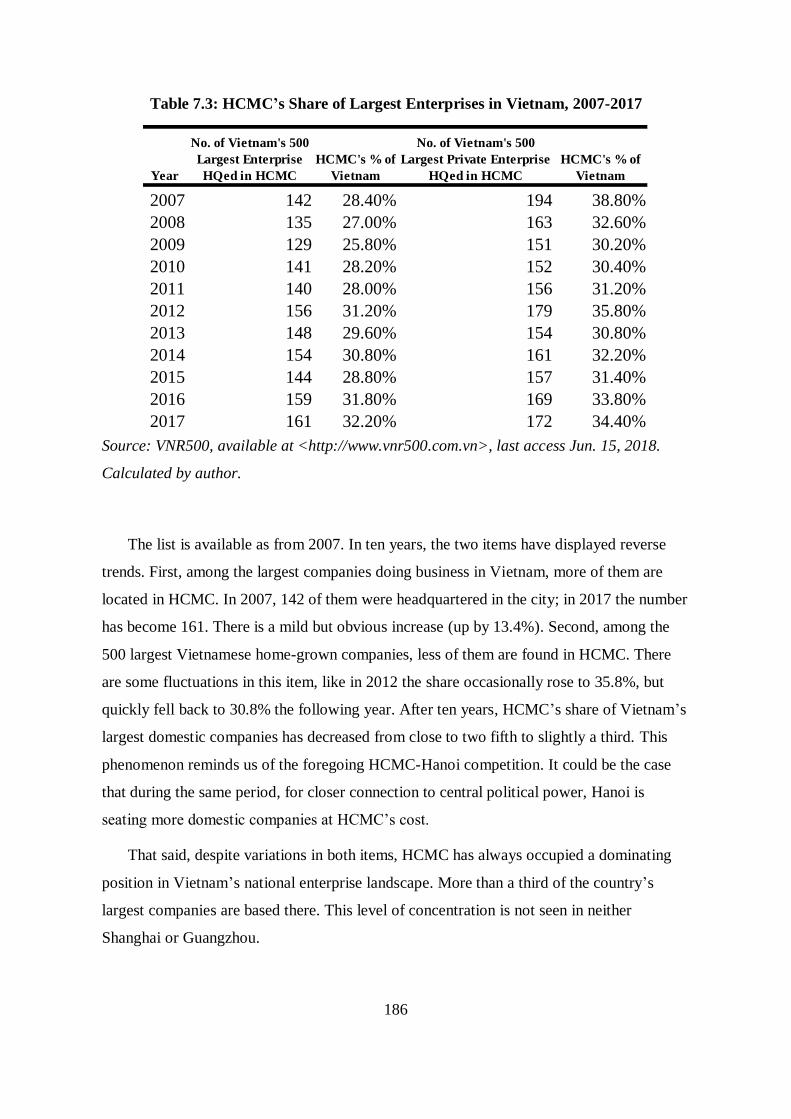
186
Table 7.3: HCMC’s Share of Largest Enterprises in Vietnam, 2007-2017
Source: VNR500, available at <http://www.vnr500.com.vn>, last access Jun. 15, 2018.
Calculated by author.
The list is available as from 2007. In ten years, the two items have displayed reverse
trends. First, among the largest companies doing business in Vietnam, more of them are
located in HCMC. In 2007, 142 of them were headquartered in the city; in 2017 the number
has become 161. There is a mild but obvious increase (up by 13.4%). Second, among the
500 largest Vietnamese home-grown companies, less of them are found in HCMC. There
are some fluctuations in this item, like in 2012 the share occasionally rose to 35.8%, but
quickly fell back to 30.8% the following year. After ten years, HCMC’s share of Vietnam’s
largest domestic companies has decreased from close to two fifth to slightly a third. This
phenomenon reminds us of the foregoing HCMC-Hanoi competition. It could be the case
that during the same period, for closer connection to central political power, Hanoi is
seating more domestic companies at HCMC’s cost.
That said, despite variations in both items, HCMC has always occupied a dominating
position in Vietnam’s national enterprise landscape. More than a third of the country’s
largest companies are based there. This level of concentration is not seen in neither
Shanghai or Guangzhou.
Year
2007 142 28.40% 194 38.80%
2008 135 27.00% 163 32.60%
2009 129 25.80% 151 30.20%
2010 141 28.20% 152 30.40%
2011 140 28.00% 156 31.20%
2012 156 31.20% 179 35.80%
2013 148 29.60% 154 30.80%
2014 154 30.80% 161 32.20%
2015 144 28.80% 157 31.40%
2016 159 31.80% 169 33.80%
2017 161 32.20% 172 34.40%
No. of Vietnam's 500
Largest Enterprise
HQed in HCMC
HCMC's % of
Vietnam
No. of Vietnam's 500
Largest Private Enterprise
HQed in HCMC
HCMC's % of
Vietnam

187
If we interpret such figures with HCMC’s local autonomy change, we find a
concomitant trend between HCMC’s share of largest enterprise and HCMC’s local
autonomy expansion, yet no similar trend between HCMC’s share of largest Vietnamese
companies and the city’s local autonomy. This suggests autonomy level is more sensitive to
overall economic activities (including foreign companies), than to Vietnam’s domestic
companies. This echoes the first IV, foreign trade’s ratio to Vietnam’s total GDP. More
largest companies, including foreign ones, are located in HCMC rather than other cities in
Vietnam. In this sense, concentration of Vietnam’s foreign economy is seeing gradual
intensification at HCMC. The hypothesis expects a growing level of local autonomy. It is
empirically confirmed. Of course, changes in both items do not qualify as “significant”, so
the authorities—central or local or both—may as well not have registered the latent trend,
then the seemingly positive relation is more of a coincidence than a valid causality. This
begs deeper investigation with more data sets covering a longer time span.
I did not find FDI statistics for HCMC and for Vietnam using the same gauge and time
separation, so the concentration of FDI flow in HCMC is not assessed here. But there
should be no surprise that HCMC is the top city in Vietnam in terms of FDI attraction81.
What is unclear is the year-on-year change in HCMC’s share in Vietnam’s total FDI flow.
Overall, the third hypothesis—that the more concentrated in a GWC a country’s foreign
economy is, that GWC is more likely to have a higher level of local autonomy—is largely
upheld in the HCMC case.
7.7 Chapter Conclusion
This chapter briefly studies HCMC, Vietnam’s leading GWC. It has shown the city has
enjoyed an obviously heightened level of local autonomy—a good part of which been
devolved from the central authority. The Vietnamese national government is allocating an
increasing amount of resource to HCMC, and at the same time the city is spending
81 “Ho Chi Minh City tops nation in FDI attraction”, The Voice of Vietnam, Apr. 10, 2018,
<https://english.vov.vn/economy/ho-chi-minh-city-tops-nation-in-fdi-attraction-372368.vov>, last access
Aug. 15, 2018.

188
significantly more money on development projects. Even against the general fiscal
decentralization background in Vietnam, HCMC stands out as a special case. This chapter
tries to find answers for this special case.
The first hypothesis, that as Vietnam’s national economy becomes more globally
integrated, it is more likely that HCMC achieves a higher level of local autonomy, is
confirmed. Vietnam’s national economy is highly involved in globalization. The ratios of
both foreign trade and FDI flow to the country’s GDP are much higher than those of China
and India—and perhaps even higher than most developing countries. Vietnam is highly
dependent on smooth and efficient functioning of global commodity chains and (in-)flow of
foreign investment (the country’s FDI outflow is negligible). In the meantime, this renders
the country more vulnerable to international volatility. This is different than China or India,
to whom foreign trade never accounts for more than half of their GDPs, and the two much-
bigger economies have stronger capacity to weather external turmoil. It is perhaps for this
reason that the first hypothesis is clearly confirmed in Vietnam, but less so in China or
India. FDI flow, on the other hand, shows great short-term turbulence, but its general trend
also supports the hypothesis.
The second hypothesis, that more intense interurban competition makes it more likely
that Vietnam’s leading GWC obtains greater local autonomy, is confirmed as well. HCMC
faces strong domestic competition from Hanoi, the political capital and northern center of
Vietnam. Internationally, it is surrounded by top-level GWCs and many minor but aspirant
contestants. Competition exists, yet not as intense as in Guangzhou or Shanghai. The
increase in the central grants and municipal expenditure on development investment
upholds the hypothesis.
The third hypothesis, that if a territorial state’s foreign economy is more concentrated
in a GWC, that city is more likely to get higher levels of autonomy, is tested using
HCMC’s share of Vietnam’s largest enterprises and largest home-grown enterprises.
HCMC’s overall percentage remained relatively stable, and its share of the former
increased mildly. Its enlarged autonomy is consistent with the hypothesis’ prediction. The
latter share actually slipped marginally, indicating Vietnamese companies concentrating
away from HCMC. Still, HCMC retained its overall dominance of Vietnam’s foreign
economy, suggesting a trend of more foreign companies clustering in the city. This

189
supports the hypothesis. Although, the distribution of Vietnamese domestic companies
requires closer examination.
Although HCMC is Vietnam’s leading GWC, it is not yet in the horizon of most GWC
discussions. However, it is a valuable GWC study case. It is one of the few cases that come
from a mid-sized national economy in the Global South but with a high level of global
integration. In such scenario, the possible mutuality or contradiction between the territorial
state and its growing GWC is highly interesting to observe.

190
Chapter 8: Conclusion
This dissertation studied the local autonomy level of GWCs in major developing countries.
Four cities are chosen: Mumbai in India, Shanghai and Guangzhou in China, and HCMC in
Vietnam. They are all leading GWCs in their countries, playing significant roles both in
articulating national economy with global economy, and as “basing points” for world
capital and TNCs. Therefore, they attract wide attention from the globe, as well as domestic
politicians and citizens. The academia is also interested in learning how globalization has
affected these cities, the territorial states behind these cities, and how the cities and
territorial states have reacted to such effects. However, so far, little attention has focused on
inter-governmental relations between these cities and their territorial states. This researches
tries to add knowledge in this aspect.
Despite similar domestic and international backgrounds, the four GWCs have enjoyed
markedly different levels of local autonomy. Since the early 1990s, when observation
period of this research starts, levels of their local autonomy have also changed differently.
It seems they—together with their territorial states—have responded to globalization and
their prospects in an inter-connected world economy very differently. Among all factors
relating to globalization and international economy these national economies (and GWCs)
face, which are more relevant in determining the local autonomy in emerging GWCs, and
which factors are not so important?
8.1 Summary
Three IVs are tested for their relations with these GWCs’ local autonomy level: global
integration of their national economy, intercity competition from neighboring GWCs, and
concentration of the country’s foreign economy.
The four cities are chosen to reflect both the high and low value of the three IVs. They
are all leading GWC in their respective territorial state. Capital cities are avoided. The cases
are from three exemplary developing countries in today’s world. China and India deserve
attention due to their market sizes as well as geopolitical weight. Their future prospects

191
would bring profound impacts to world economy—and world politics too. Vietnam is a
mid-sized developing country, highly dependent on global economy and with a strong
ambition to further internationalize. The three countries are all located in Asia, where the
center of gravity of world economy is shifting towards82.
The research spans more than two decades, from the early 1990s to today. It is a period
when globalization expanded and deepened greatly after the Cold War ended. It is also
when the three countries all embarked on a new phase of economic liberalization and
participation in NIDL.
Both the global city concept (Sassen 1991b, 2001a, etc.) and the world city hypothesis
(Friedmann and Wolff 1982; Friedmann 1986) agree that the geographical dispersal of
global economy necessitates stronger central command and control functions. Since such
dispersal to less-developed regions like China, India and Vietnam are dynamically
underway, and since these regions are quickly becoming organic parts of the capital’s
global production, it is imperative to study GWCs in these regions as well.
Since the mid- to the late 1980s, there has been a widespread trend of decentralization,
first started in Western countries, and later expanded into many developing countries
including China, India, and Vietnam (Stren 2015). However, despite such trend, the four
cities display characteristics different from ordinary cities in their own countries, therefore
a closer examination from the perspective of GWC is necessary.
This study aims to contribute to the still weak (although admittedly growing fast)
literature on less-developed regions in GWC research. Direct comparisons of Chinese and
Indian GWCs are still rare (Laurenceson and Kamalakanthan 2004; Segbers 2007;
Weinstein and Ren 2009, to the author’s knowledge when writing this dissertation). Studies
on minor GWCs in smaller economies like Vietnam are even rarer (Gubry and Huong
2002; Dapice, Gomez-Ibanez, and Thanh 2010). By comparing four cities in these three
countries from the angle of inter-governmental relations, I bring a unique piece of
knowledge into the field.
82 “The global economy's shifting center of gravity in 11 charts”, The Wall Street Journal, Jan. 20, 2016,
<http://graphics.wsj.com/global-growth/>, last access Aug. 2, 2018.
192
As agreed by most GWC literature, since GWCs realize their functions through
commanding and controlling the geographically expanding world economy (either through
facilitating TNCs or hosting TNC headquarters), and that the vast territories of developing
countries are increasingly part of the world economy, GWCs located and specialized in
those new territories should see faster growth and raised importance in the eye of the global
capital and world economy. These territorial states are mostly keen on making use of
foreign investment, technology, and experience to speed up modernization and economic
growth. The mutuality of the territorial state and its GWC would lead to more local
autonomy for the GWC.
On the other hand, the territorial state is meanwhile responsible for other regions of the
country, and must cater to diverse, sometimes contradictory needs, so it cannot always fully
accommodate its GWC’s demands. A GWC, directly confronted with social and economic
ramifications of globalization, tends to generate quite different preferences than ordinary
cities in its national urban system. Chances are, these preferences come at the cost of other
regions’ benefits. Other regions’ policy preferences may also harm the GWC’s
competitiveness. Both would try to tip the balance towards itself. The territorial state must
make hard decisions. Its choice may not be deterministic, as inter-governmental
transference of power is not the only source of local autonomy, but it meaningfully affects
the chances of more of less local autonomy at the GWC. This contradiction of interest
between the territorial state and its leading GWC adds to the complexity of local autonomy.
To understand how this inter-governmental relation is shaped, I choose the concept of
local autonomy to reflect power allocations between the central authority of a territorial
state and its GWC. This concept is mainly measured by fiscal power of the city, aided by
some relevant governmental policies. Two aspects are especially observed: the central-local
fiscal allocations, and local power to issue loans. The former shows how much fiscal
resource goes to the local level and could strengthen the city’s capability of development
and infrastructure improvement. The latter is the locality’s power to overspend as an
investment in the city’s own future—also an indication of freedom of activity.
Fiscal data from the four cities are collected for the longest duration possible. The
shortest period of observation is on HCMC, which spans just twelve years. Figures for local
loans are not equally accessible for all the cities, they are used wherever available. I also

193
contrast the GWC’s fiscal figure to its national figure. This is to rule out the possibility that
the GWC’s local autonomy change is only a part of the national trend. I find that all four
cities display different trajectories in terms of local autonomy than their territorial state’s
general pattern. This implies factors special to these cities are at work.
Drawing on academic works on GWC and local government, I identify three possible
factors that could affect inter-governmental relations of these cities: the global integration
of a national economy, measured by the foreign trade to GDP ratio and the FDI flow to
GDP ratio; intercity competition from neighboring GWCs, measured with the World
according to GaWC rankings and market capitalization size of stock markets; and
concentration of a territorial state’s foreign economy in a GWC, measured by that city’s
share of the country’s largest enterprises and foreign trade. They make the three IVs,
reflecting different scales of interactions respectively: the international to the national, the
international to the local, and the national to the local. Based on current theories on GWC
and territorial states in globalization, I hypothesize a positive relation between the
foregoing IVs and the DV (level of local autonomy of the GWC in a territorial state).
8.2 Main findings and discussion
Unfortunately, there is no strong evidence supporting the first hypothesis. Although it is
upheld within the Shanghai and HCMC cases, in a cross-case comparison, one cannot
safely come to a positive conclusion. Even within China, against the same fluctuation of the
country’s foreign trade, Guangzhou and Shanghai do not display similar changes in their
local autonomy. In Vietnam, however, whose national economy is much more
internationally dependent, the local autonomy of HCMC has risen markedly.
When one looks at individual indicators, it becomes clear that Shanghai and
Guangzhou’s continuous rise in autonomy is concomitant with China’s FDI outflow, while
not so related with foreign trade in general, which has seen lower levels of integration in
late years.
In Vietnam, the only case where the hypothesis is strongly upheld, the national
economy’s integration level is double the height of China and India. This could have two

194
implications: one, a national economy’s global integration must pass a certain threshold to
make an impact on its GWC’s central-local relations—if the territorial state does not attach
enough weight to its foreign economy, it would have insufficient motivation to propel its
GWC. Two, FDI flow has a higher relevance to a GWC’s local autonomy. In China,
although the FDI net inflow to GDP ratio has been gradually declining, the country is
investing heavily in overseas markets, resulting in an obvious upward trend in its FDI
outflow. This is accompanied by the continuous rise in its two GWCs’ local autonomy.
Such findings echo Sassen’s observation that FDI flow accounts for a far larger part of
international interactions today than goods and articles, and that financial flow demands
more and stronger central control functions (Sassen 2000a). It is not quite expected by the
world city hypothesis, which stresses that cities are repositioned according to the general
statuses of their articulated economies in a new international division of labor (NIDL)
(Friedmann and Wolff 1982; Friedmann 1986)—there indeed has been a reshaping process,
yet the changed pattern does not override the financial sectors of the world capitalism.
With regards to intercity competition among GWCs, the hypothesis holds true in all
cases. There is a clear relation between the intensity of competition and the central-local
power devolution to the GWC. Obviously, the territorial state and its GWCs share a
mutuality in enhancing the GWC’s competitiveness. Even across cases, it is clear that
Shanghai, who is facing fiercer competition than Mumbai, is getting more local autonomy
from China’s central government. Although Guangzhou is considered facing the highest
level of competition, its position in PRDR may have had an alleviating effect, as
cooperation and coordination brings more benefits, and the central policymakers do not
expect an intra-region competition. Mumbai, facing very limited challenge to its status in
South Asia and India, has not obtained much more local autonomy.
The indicator we use to evaluate competition, the World According to GaWC rankings,
just reflect one dimension of the picture, i.e. intra-firm networks of advanced producer
services. The market capitalization size of stock exchanges is unfortunately not applicable
to all GWCs. Other rankings using alternative criteria could be added in the future as
supplementary angles.

195
This is unsurprising that the “competition angst” is widely felt and has made an impact.
Our observation also agrees with other academic findings that there is a mutually
reinforcing effect between place marketing/branding and decentralization to that place (see
Stren 2015). What remains interesting is the link connecting the territorial state’s angst for
competition and its policy change toward its GWC. Process-tracing could be used in the
future to unravel the dynamics inside the “black box”. It is a different question than
intercity competition, yet international competition, either for wealth or for comprehensive
national power, is undeniably happening (Porter 1991; Stopford, Strange, and Henley 1991;
Kuptsch and Pang 2006, etc.). In a way, the whole subject of international politics is about
competition among territorial states. This should be investigated more closely with
competitive measures at local levels (esp. at GWCs), and look for their relations. It is also
in this area that we may find an incision to put GWC scholarship into IR studies—as a
component of national power or a tool for international competition.
The concentration of a territorial state’s foreign economy in a GWC also has a positive
relation with the GWC’s local autonomy level. It means the GWC’s importance for a
national economy is partly determined by how much the national economy is articulated
through this city. Mutuality between territorial state and GWC trumps contradictions
between them on this issue—when a GWC processes a large part of a territorial state’s
foreign economic activities, the state usually chooses to uphold that GWCs, rather than
equalizing the unevenness of its economic activity.
It needs to be pointed out that, the causality in this hypothesis is not unidirectional,
meaning the other way is also possible: the more autonomy a GWC obtains from its
territorial state, more of the national economy would concentrate in that city, because of
better GWC functions and urban governance capability enabled by a higher local autonomy
level. So the third hypothesis, although largely confirmed, should be taken with a grain of
caution. Further research could pay more attention to determine which causality direction is
stronger, and under which circumstance.
To sum up, I find more mutuality than contradiction between a developing territorial
state and its leading GWC. A developing country like China, India or Vietnam usually
chooses to promote its leading city’s GWC formation, at the cost of a balanced national
urban system. FDI has a bigger impact on the central-local relations than foreign trade does,

196
although their combined relation with the GWC’s autonomy level is weak. Intercity
competition puts both territorial states and GWCs on alert. It prompts the territorial state to
grant more power to GWCs, who also acquire so to respond to competitions. Concentration
of a territorial state’s foreign economy in a GWC adds weight to the city, resulting in
further power increase at the city level. The extent to which these factors fare for each
GWC affects the level of mutuality or contradiction between the territorial state and the
GWC, leading to different outcomes in the GWC’s local autonomy.
8.3 Policy implications and further research
With regard to global integration of a national economy, it has been shown that FDI flow
has a greater impact on inter-governmental relations. Financial functions of a GWC has
long been recognized therefore need no further explanation. For developing countries like
China, India and Vietnam, when central authorities devolve power to its GWCs, more
attention should be paid toward the city’s capability of articulating their real economies,
which are so far holding more comparative advantage on world markets. Although
generally speaking, more FDI flowing into a national economy is desirable, but to date
there has been no consensus on the real benefits of FDI in a country’s economic prosperity.
Certain thresholds in human capital, etc. need to be met; a country should also adopt fitting
policies. Anyway, FDI’s positive effects should not be taken for granted (see Alfaro and
Johnson 2013).
Besides, GWCs only facilitate FDI flow, the city themselves do not determine how to
use FDI. Actual use of such investments is subject to TNCs and other related actors. This
means the GWC cannot guarantee the efficiency and efficacy of FDI usage. Relying too
much on this aspect of GWC risks undermining a national economy in other areas. In future
research, attention could also be paid to a wider comparison including full-fledged Western
GWCs, to test whether their national economies’ foreign trade also weight less than FDI on
inter-governmental relations between their GWCs and central authority. This could give us
a more complete picture on the mutuality or contradictions between territorial states and
their GWCs.

197
It is unclear whether these cities’ officials and civil society perceive and feel about
intercity competition in a same or similar way. Although governments are responding, more
consensus need to be reached among residents, especially common dwellers. In developing
countries’ GWC campaigns, low-level labors and basic service industries tend to be
sacrificed, making room for fashionable CBDs and high-end professionals’ needs (see D.
Clark 2003, chap. 5). Taking this into consideration, it is interesting to study whether a
divergence or overlap exists between different strata’s attitudes toward a city’s
competitiveness-promoting measures. Under-protection and under-representation of basic-
level workers and the socially vulnerable inevitably leads to social polarization and
instability. Attention and efforts should be made that more public resources are tilted
toward them, because they are an indispensable part of any GWC. If any GWC is to
compete harder with other cities, e.g. constructing better infrastructure, providing more
amenities for top talents, entrepreneurs and international investors, more basic-level
servicers are needed. None of the case countries in this study is famous for its committed
protection for basic-level laborers83. Inability to recognize them as an indispensable part of
any metropolis and insufficient protection for them will undermine the long-term potential
of a GWC, if not outright disruption of the city’s basic service provision.
As for concentration of international economy in a GWC, there are different results
among indicators. A more coherent index should be devised. Since the whole GWC
literature is, in a sense, about new forms of centrality other than the territorial state and the
international system made up of territorial states, and since much work has been done to
assess these cities’ centrality within their own network (WCN), we need to understand how
the game is played within territorial states—do these cities also constitute some form of
international centrality within the national economies they articulate? The relatively
83 For examples:
“China: ‘ruthless’ campaign to evict Beijing's migrant workers condemned”, The Guardian, Nov. 27,
2017, <https://www.theguardian.com/world/2017/nov/27/china-ruthless-campaign-evict-beijings-migrant-
workers-condemned>, last access Aug. 10, 2018.
“Vietnam’s left-behind urban migrants”, The Diplomat, Apr. 8, 2017,
<https://thediplomat.com/2017/04/vietnams-left-behind-urban-migrants/>, last access Aug. 10, 2018.
“India’s migrant workers face hostility in Mumbai”, The Christian Science Monitor, Apr. 9, 2010,
<https://www.csmonitor.com/World/Asia-South-Central/2010/0409/India-s-migrant-workers-face-
hostility-in-Mumbai>, last access Aug. 10, 2018.

198
inconclusive performance of the third hypothesis implies a less clear domestic picture—
some leading GWCs in fact only seat a small fraction of its territorial state’s biggest
companies and “flows”. This is in contrary to the GWC theory in the sense that these cities
should cluster a large number of the country’s TNCs84 (Shanghai and Guangzhou
obviously do not). How can it be, that a GWC occupying central position in regional or
world economy being not so central in its own national economy? But this is consistent
with Sassen’s suggestion that as a city gets more global, it becomes “de-territorialized” or
detached from its nation state (Sassen 1991b). Which suggestion is true, and under what
circumstance? Is this phenomenon more peculiar to GWCs in developing economies or
developed ones? This is a very interesting area for future research.
I did not study social disparity and its relations with the cities’ local autonomy level.
However, this is a meaningful and important policy issue. Social disparity and polarization
(the “dual-city hypothesis”) is always expected to occur within GWCs (Sassen 1991b;
Borja et al. 1997; Castells 2010), as the city is home to two completely different group of
citizens—one well-educated and wealthy, the other less skilled, poorer and without stable
jobs. It becomes more conflict-prone if wealth distribution is severely unjust, which would
subsequently lead to social instability and disruption. If a GWC is of critical importance to
its territorial state, they should share a mutual interest in appropriately handling such
tension in the city, in order to sustain its smooth running. This requires more local fiscal
and policy capacity. However, such measures may worsen the regional disparity of the
territorial state, which in turn undermines the overall national welfare—constituting a
contradiction between a GWC and its territorial state. Such problems must be squarely and
adequately addressed by joined efforts from the municipal and the central authorities.
Future research could pay more attention to, inter alia, this aspect of GWC growth.
As pointed out above, national authorities should be aware of the possible mutually
reinforcing effects between concentration of foreign economic activities in a GWC and that
city’s local autonomy level. This means more autonomy at a GWC may worsen the uneven
development in a country’s national urban system. Although uneven development is
intrinsically unavoidable (Harvey 2006; N. Smith 2008), extreme scenarios would impair
84 In (Friedmann 1986), one of the earliest categorizations of GWC, “headquarters for TNCs (including
regional headquarters) (ibid. 72)” was one of the selection criteria.
199
overall balance of national economy and society. This in the long term harms both the
territorial state and its GWC. Findings in this research agree with Clark and Moonen’s
suggestion that “these cities’ success will also depend on strategies to avoid excessive
demand and inflation in the world city and curb rising disparities with other national cities”
(G. Clark and Moonen 2017, 239). For example, London has been widely acknowledged as
a telling case of one leading city over-concentrating high-value industries at the expense of
other regions in the country. This is a negative externality of mega GWCs that a territorial
state must be aware of and try to rein in. Therefore, on this issue, the territorial state and the
GWC share a mutuality that although a prosperous GWC works in the national economy’s
favor, the local autonomy of that GWC should not overgrow, before its benefits are offset
by runaway national uneven development.
200
Bibliography
Abrahamson, Mark. 2004. Global Cities. Oxford University Press.
Acs, Zoltan, and Catherine Armington. 2004. “Employment Growth and Entrepreneurial
Activity in Cities.” Regional Studies 38 (8): 911–27.
https://doi.org/10.1080/0034340042000280938.
Ács, Zoltán J. 2002. Innovation and the Growth of Cities. Cheltenham, UK; Northampton,
MA: E. Elgar.
Acuto, Michele. 2013. “City Leadership in Global Governance.” Global Governance: A
Review of Multilateralism and International Organizations 19 (3): 481–498.
Aijaz, Rumi. 2008. “Form of Urban Local Government in India.” Journal of Asian and
African Studies 43 (2): 131–54. https://doi.org/10.1177/0021909607087217.
Aldecoa, Francisco, and Michael Keating, eds. 1999. Paradiplomacy in Action: The
Foreign Relations of Subnational Governments. The Cass Series in Regional and
Federal Studies 4. London and New York: Routledge, Taylor & Francis Group.
Alderson, Arthur S., and Jason Beckfield. 2004. “Power and Position in the World City
System.” American Journal of Sociology 109 (4): 811–51.
https://doi.org/10.1086/378930.
Alfaro, L., and M.S. Johnson. 2013. “Foreign Direct Investment and Growth.” In The
Evidence and Impact of Financial Globalization, 299–309. Elsevier.
http://linkinghub.elsevier.com/retrieve/pii/B9780123978745000166.
Alger, Chadwick F. 1990. “The World Relations of Cities: Closing the Gap between Social
Science Paradigms and Everyday Human Experience.” International Studies Quarterly
34 (4): 493. https://doi.org/10.2307/2600609.
Amen, Mark, Patricia L McCarney, Noah J Toly, and Klaus Segbers, eds. 2011. Cities and
Global Governance: New Sites for International Relations. Ashgate.
Ancien, Delphine. 2011. “Global City Theory and the New Urban Politics Twenty Years
On: The Case for a Geohistorical Materialist Approach to the (New) Urban Politics of
Global Cities.” Edited by Gordon MacLeod and Martin Jones. Urban Studies 48 (12):
2473–93. https://doi.org/10.1177/0042098011411945.
Anh, Vu Thanh Tu. 2016. “Vietnam: Decentralization Amidst Fragmentation.” Journal of
Southeast Asian Economies 33 (2): 188–208.
201
Anholt, Simon. 2007. Competitive Identity: The New Brand Management for Nations,
Cities and Regions. Basingstoke [England]; New York: Palgrave Macmillan.
A.T. Kearney. 2017. Global Cities 2017 - Leaders in a World of Disruptive Innovation.
A.T. Kearney.
———. 2018. 2018 Global Cities Report: Learning from the East - Insights from China’s
Urban Success. A.T. Kearney.
Bahl, Roy W. 1998. “China: Evaluating the Impact of Intergovernmental Fiscal Reform.”
In Fiscal Decentralization in Developing Countries, edited by Bird and Vaillancourt.
Cambridge: Cambridge University Press.
Beal, Vincent, and Gilles Pinson. 2014. “When Mayors Go Global: International Strategies,
Urban Governance and Leadership: When Mayors Go Global.” International Journal
of Urban and Regional Research 38 (1): 302–17. https://doi.org/10.1111/1468-
2427.12018.
Beaverstock, J. V., M. A. Doel, P. J. Hubbard, and Peter J. Taylor. 2002. “Attending to the
World: Competition, Cooperation and Connectivity in the World City Network.”
Global Networks 2 (2): 111–132.
Beaverstock, Jonathan V., Richard G. Smith, and Peter J. Taylor. 2000. “World-City
Network: A New Metageography?” Annals of the Association of American
Geographers 90 (1): 123–134.
Begg, Iain. 1999. “Cities and Competitiveness.” Urban Studies 36 (5/6): 795.
Beijing Municipal Government. 2016. “Beijing City Master Plan (2016-2035).” Beijing:
Beijing Municipal Government. http://zhengwu.beijing.gov.cn/gh/dt/t1494703.htm.
Boaden, Noel. 1971. Urban Policy-Making: Influences on County Boroughs in England
and Wales. Cambridge [Eng.]: University Press.
Borja, Jordi, Manuel Castells, Mireia Belil, and Chris Benner. 1997. Local and Global: The
Management of Cities in the Information Age. London: Earthscan Publications.
Brencic, Elizabeth Nicole. 2010. “Guangzhou - Making a Global City: The Contemporary
Model of Urban Planning in Guangzhou: The Case of Guangzhou’s Haizhu District.”
Master Thesis, Basel: Basel University.
Brennan, Geoffrey, and James M. Buchanan. 2000. The Power to Tax: Analytical
Foundations of a Fiscal Constitution. The Collected Works of James M. Buchanan, v.
9. Indianapolis: Liberty Fund.

202
Brenner, Neil. 1998. “Global Cities, Glocal States: Global City Formation and State
Territorial Restructuring in Contemporary Europe.” Review of International Political
Economy 5 (1): 1–37.
———. 2004. New State Spaces: Urban Governance and the Rescaling of Statehood.
Oxford New York: Oxford University Press.
Brenner, Neil, and Nik Theodore. 2002. “Cities and the Geographies of ‘Actually Existing
Neoliberalism.’” Antipode 34 (3): 349–79.
Brown, Michael P. 1993. “The Possibility of Local Autonomy.” Urban Geography 13 (3):
257–79. https://doi.org/10.2747/0272-3638.13.3.257.
Cai, Jianming, and Victor F.S. Sit. 2003. “Measuring World City Formation? The Case of
Shanghai.” The Annals of Regional Science 37 (3): 435–46.
https://doi.org/10.1007/s00168-003-0163-8.
Camagni, Roberto. 2002a. “On the Concept of Territorial Competitiveness: Sound or
Misleading?” Urban Studies 39 (13): 2395–2411.
———. 2002b. “On the Concept of Territorial Competitiveness: Sound or Misleading?”
Urban Studies (Routledge) 39 (13): 2395–2411.
https://doi.org/10.1080/0042098022000027022.
Castells, Manuel. 2010. The Rise of the Network Society. 2nd ed. The Information Age:
Economy, Society, and Culture, v. 1. Chichester, West Sussex; Malden, MA: Wiley-
Blackwell.
Chattaraj, Shahana. 2012. “Shanghai Dreams: Urban Restructuring in Globalizing
Mumbai.” Doctoral Thesis, Princeton University.
Chen, Xiangming. 2009. “Introduction: Why Chinese and Indian Megacities?” City &
Community 8 (4): 363–68. https://doi.org/10.1111/j.1540-6040.2009.01297.x.
Cheung, Peter T.Y. 2010. “Chapter 9. Understanding Cross-Boundary Cooperation in
South China.” Progress in Planning 73 (January): 50–59.
Chubarov, Ilya, and Daniel Brooker. 2013. “Multiple Pathways to Global City Formation:
A Functional Approach and Review of Recent Evidence in China.” Cities 35
(December): 181–89. https://doi.org/10.1016/j.cities.2013.05.008.
Clark, David. 2003. Urban World, Global City. London; New York, NY: Routledge.
http://site.ebrary.com/id/10100025.

203
Clark, Gordon L. 1984. “A Theory of Local Autonomy.” Annals of the Association of
American Geographers 74 (2): 195–208. https://doi.org/10.1111/j.1467-
8306.1984.tb01448.x.
Clark, Greg, and Tim Moonen. 2014. “Mumbai: India’s Global City.” Global Cities
Initiative. The Brookings Institution.
———. 2017. World Cities and Nation States. Chichester, West Sussex, United Kingdom:
John Wiley & Sons.
Clark, T. N. 1968. “Who Governs, Where, When and with What Effect.” In Community
Structure and Decision-Making: Comparative Analysis, edited by T. N. Clark, 21–45.
San Francisco: Chandler Publishing Company.
———. 1974. “Community Autonomy in the National System: Federalism, Localism and
Decentralization.” In Comparative Community Politics, edited by T. N. Clark, 21–45.
Beverly Hills: SAGE Publications.
Coe, Neil M., Philip F. Kelly, and Henry Wai-Chung Yeung. 2013. Economic Geography:
A Contemporary Introduction. 2nd ed. Hoboken, N.J: Wiley-Blackwell.
Cohen, R. B. 1981. “The New International Division of Labour, Multinational Corporations
and Urban Hierarchy.” In Urbanisation and Urban Planning in Capitalist Society,
edited by Michael Dear and Allen J. Scott. London: Methuen.
Craw, Michael. 2008. “Taming the Local Leviathan: Institutional and Economic
Constraints on Municipal Budgets.” Urban Affairs Review 43 (5): 663–90.
https://doi.org/10.1177/1078087407311588.
Crouch, Colin, and Patrick Le Galès. 2012. “Cities as National Champions?” Journal of
European Public Policy 19 (3): 405–19.
https://doi.org/10.1080/13501763.2011.640795.
Curtis, Simon. 2008. “Global Cities and the Transformation of the International System.”
Doctoral Thesis, London: The London School of Economics and Politics Science.
———. 2011. “Global Cities and the Transformation of the International System.” Review
of International Studies 37 (04): 1923–47.
https://doi.org/10.1017/S0260210510001099.
———. 2016a. “Cities and Global Governance: State Failure or a New Global Order?”
Millennium: Journal of International Studies 44 (3): 455–77.
https://doi.org/10.1177/0305829816637233.

204
———. 2016b. Global Cities and Global Order. Oxford University Press.
https://doi.org/10.1093/acprof:oso/9780198744016.001.0001.
Dapice, David, Jose A Gomez-Ibanez, and Nguyen Xuan Thanh. 2010. “Ho Chi Minh City:
The Challenges of Growth.” Policy Dialogue Paper 2. Series on Vietnam’s WTO
Accession and International Competitiveness Research. Ho Chi Minh City: United
Nations Development Programme in Vietnam.
Derudder, Ben. 2007. “The Mismatch between Concepts and Evidence in the Study of a
Global Urban Network.” In Cities in Globalization: Practices, Policies and Theories,
edited by Peter J. Taylor, Ben Derudder, Pieter Saey, and Frank Witlox, 261–75.
Questioning Cities. London ; New York: Routledge, Taylor & Francis Group.
Derudder, Ben, and Frank Witlox. 2008. “Mapping World City Networks through Airline
Flows: Context, Relevance, and Problems.” Journal of Transport Geography 16 (5):
305–12. https://doi.org/10.1016/j.jtrangeo.2007.12.005.
Derudder, Ben, Frank Witlox, James Faulconbridge, and Jon Beaverstock. 2008. “Airline
Data for Global City Network Research: Reviewing and Refining Existing
Approaches.” GeoJournal 71 (1): 5–18. https://doi.org/10.1007/s10708-008-9148-6.
Derudder, Taylor, Witlox, and Catalano. 2003. “Hierarchical Tendencies and Regional
Patterns in the World City Network: A Global Urban Analysis of 234 Cities.” Regional
Studies 37 (9): 875–86. https://doi.org/10.1080/0034340032000143887.
Douglass, Mike. 2000a. “The Rise and Fall of World Cities in the Changing Space-
Economy of Globalization: Comment on Peter J. Taylor’s ‘World Cities and Territorial
States under Conditions of Contemporary Globalization.’” Political Geography 19 (1):
43–49.
———. 2000b. “Mega-Urban Regions and World City Formation: Globalisation, the
Economic Crisis and Urban Policy Issues in Pacific Asia.” Urban Studies 37 (12):
2315–35. https://doi.org/10.1080/00420980020002823.
Duffy, Hazel. 1995. Competitive Cities: Succeeding in the Global Economy. London; New
York: E & FN Spon. http://public.eblib.com/choice/publicfullrecord.aspx?p=181056.
Ernst & Young. 2017. “Global IPO Trends: Q4 2017.” EY Global IPO Trends Reports.
EYGM Limited.
Fleurke, Frederik, and Rolf Willemse. 2006. “Measuring Local Autonomy: A Decision-
Making Approach.” Local Government Studies 32 (1): 71–87.
https://doi.org/10.1080/03003930500453542.
205
Friedmann, John. 1986. “The World City Hypothesis.” Development and Change 17 (1):
69–83.
———. 1995. “Where We Stand: A Decade of World City Research.” In World Cities in a
World-System, edited by Paul L. Knox and Peter J. Taylor, 21–47. Cambridge
University Press.
———. 1996. “On the Writing of ‘the World City Hypothesis.’” Scottish Geographical
Magazine 112 (2): 127–28. https://doi.org/10.1080/14702549608554460.
Friedmann, John, and Goetz Wolff. 1982. “World City Formation: An Agenda for Research
and Action.” International Journal of Urban and Regional Research 6 (3): 309–344.
Fröbel, Folker, Jürgen Heinrichs, and Otto Kreye. 1980. The New International Division of
Labour: Structural Unemployment in Industrialised Countries and Industrialisation in
Developing Countries. Cambridge University Press.
Gainsborough, Martin. 2003. Changing Political Economy of Vietnam: The Case of Ho Chi
Minh City. Rethinking Southeast Asia 5. London and New York: RoutledgeCurzon.
Garcia, Marisol, and Dennis R. Judd. 2012. “Competitive Cities.” In The Oxford Handbook
of Urban Politics, edited by Peter John, Karen Mossberger, and Susan E. Clarke.
Oxford University Press.
Geddes, Patrick. 1924. “A World League of Cities.” Sociological Review 26 (166): 7.
Gerring, John. 2007. Case Study Research: Principles and Practices. Cambridge University
Press.
Ghadge, Ravi. 2013. “Shanghaization of Mumbai: Visions, Displacements, Contestations.”
Doctoral Thesis, University of Illinois at Urbana-Champaign.
Ghorpade, Kedar R. 2005. “Mumbai: Economic Restructuring by Default.” In Public
Problems--Private Solutions? Globalizing Cities in the South, edited by Klaus Segbers,
Simon Raiser, and Krister Volkmann, 35–49. Urban and Regional Planning and
Development Series. Aldershot, Hants, England ; Burlington, VT: Ashgate.
Goldsmith, Michael. 2012. “Cities in Intergovernmental Systems.” In The Oxford
Handbook of Urban Politics, edited by Peter John, Karen Mossberger, and Susan E.
Clarke. Oxford University Press.
Gore, Christopher D., and Nansozi K. Muwanga. 2014. “Decentralization Is Dead, Long
Live Decentralization! Capital City Reform and Political Rights in Kampala, Uganda:
Capital City Reform and Political Rights in Kampala, Uganda.” International Journal

206
of Urban and Regional Research 38 (6): 2201–16. https://doi.org/10.1111/1468-
2427.12012.
Gottdiener, Mark, and Leslie Budd. 2005. Key Concepts in Urban Studies. SAGE Key
Concepts. London ; Thousand Oaks, Calif: SAGE Publications.
Gourevitch, Peter. 1978. “The Second Image Reversed: The International Sources of
Domestic Politics.” International Organization 32 (4): 881–912.
Gross, Jill Simone. 2007. “Diversity and the Democratic Challenge -- Governing World
Cities.” In Governing Cities in a Global Era: Urban Innovation, Competition, and
Democratic Reform, edited by Robin Hambleton and Jill Simone Gross, 73–91.
Palgrave Macmillan. http://public.eblib.com/choice/publicfullrecord.aspx?p=367957.
Guangzhou Municipal Government. 2012. “Guangzhou City Master Plan 2011-2020.”
Guangzhou: Guangzhou Municipal Government.
———. 2018. “Guangzhou City Master Plan 2017-2035.” Guangzhou: Guangzhou
Municipal Government.
Gubry, Patrick, and Le Thi Huong. 2002. “Ho Chi Minh City: A Future Megacity in
Vietnam.” In . Bangkok.
Gugler, Josef, ed. 2004. World Cities beyond the West: Globalization, Development, and
Inequality. Cambridge; New York: Cambridge University Press.
Gurr, Ted Robert, and Desmond King. 1987. The State and the City. University of Chicago
press.
Hall, Peter. 1966. The World Cities. McGraw Hill.
Hall, Tim, and Phil Hubbard. 1996. “The Entrepreneurial City: New Urban Politics, New
Urban Geographies?” Progress in Human Geography 20 (2): 153–74.
https://doi.org/10.1177/030913259602000201.
Harris, Andrew. 2013. “Concrete Geographies: Assembling Global Mumbai through
Transport Infrastructure.” City 17 (3): 343–60.
https://doi.org/10.1080/13604813.2013.798884.
Harvey, David. 2006. The Limits to Capital. New and fully updated ed. London; New
York: Verso.
Held, David, and Anthony G. McGrew, eds. 2003. The Global Transformations Reader: An
Introduction to the Globalization Debate. 2nd ed. Cambridge, UK; Malden, MA USA:
Polity Press; Distributed in the USA by Blackwell Pub.

207
Henton, Douglas. 2001. “Lessons from Silicon Valley: Governance in a Global City-
Region.” In Global City-Regions: Trends, Theory, Policy, edited by Allen J. Scott,
391–400. Oxford University Press.
Herrschel, Tassilo, and Peter Newman. 2017. Cities as International Actors: Urban and
Regional Governance Beyond the Nation State. London: Palgrave Macmillan UK.
https://doi.org/10.1057/978-1-137-39617-4.
Hill, Richard Child, and Kuniko Fujita. 2003. “The Nested City: Introduction.” Urban
Studies 40 (2): 207–17.
Hill, Richard Child, and June Woo Kim. 2000. “Global Cities and Developmental States:
New York, Tokyo and Seoul.” Urban Studies 37 (12): 2167–95.
https://doi.org/10.1080/00420980020002760.
Hoelscher, Kristian. 2016. “The Evolution of the Smart Cities Agenda in India.”
International Area Studies Review 19 (1): 28–44.
https://doi.org/10.1177/2233865916632089.
Hoornweg, Daniel. 2011. “Chapter 5: The Evolution of City Indicators: Challenges and
Progress.” In Cities and Global Governance: New Sites for International Relations,
edited by Mark Amen, Patricia L McCarney, Noah J Toly, and Klaus Segbers, 91–109.
Ashgate.
Hoyler, M. 2004. London and Frankfurt as World Cities: Global Service Centers between
Cooperation and Competition. Vol. 56.
Hymer, Stephen. 1982. “The Multinational Corporation and the Law of Uneven
Development.” In Introduction to the Sociology of “Developing Societies,” edited by
Hamza Alavi and Teodor Shanin, 128–52. London: Macmillan Education UK.
https://doi.org/10.1007/978-1-349-16847-7_12.
Jacobs, Jane. 1970. The Economy of Cities. Vintage Books 584. New York: Vintage Books.
———. 1984. Cities and the Wealth of Nations: Principles of Economic Life. 1st Vintage
Books edition, May 1985. New York: Vintage Books.
Jefferson, Mark. 1939. “The Law of the Primate City.” Geographical Review 29 (2): 226–
32. https://doi.org/10.2307/209944.
Jensen-Butler, Chris. 1999. “Cities in Competition: Equity Issues.” Urban Studies 36 (5/6):
865.

208
Jessop, Bob, and Ngai-Ling Sum. 2000. “An Entrepreneurial City in Action: Hong Kong’s
Emerging Strategies in and for (Inter)Urban Competition.” Urban Studies 37 (12):
2287–2313. https://doi.org/10.1080/00420980020002814.
Jin, Hehui, Yingyi Qian, and Barry R. Weingast. 2005. “Regional Decentralization and
Fiscal Incentives: Federalism, Chinese Style.” Journal of Public Economics 89 (9–10):
1719–42. https://doi.org/10.1016/j.jpubeco.2004.11.008.
JNNURM Directorate. n.d. “Prototype Interactive Public Questions & Answers.”
Government of India.
John, Peter, and Alistair Cole. 1999. “Political Leadership in the New Urban Governance:
Britain and France Compared.” Local Government Studies 25 (4): 98–115.
https://doi.org/10.1080/03003939908433969.
Judd, D. R. 2005. “Everything Is Always Going to Hell: Urban Scholars as End-Times
Prophets.” Urban Affairs Review 41 (2): 119–31.
https://doi.org/10.1177/1078087405280197.
Jung, Eun Jin. 2010. “Primate City.” In Encyclopedia of Urban Studies, edited by Ray
Hutchison, 609–10. SAGE Publications Ltd.
Kim, Yeong-Hyun, and John Rennie Short. 2008. Cities and Economies. Routledge Critical
Introductions to Urbanism and the City. London and New York: Routledge, Taylor &
Francis Group.
King, Gary, Robert O. Keohane, and Sidney Verba. 1994. Designing Social Inquiry:
Scientific Inference in Qualitative Research. Princeton, N.J: Princeton University
Press.
Kono, Hisaki, and Hiroko Uchimura. 2012. “The Diversity of Fiscal Decentralization
below Provincial Level and Its Relation to Development in Vietnam: Do More
Decentralized Provinces Improve Health and Economic Equity?” In Fiscal
Decentralization and Development: Experiences of Three Developing Countries in
Southeast Asia, edited by Hiroko Uchimura, 133–70. Palgrave Macmillan.
Kresl, Peter, and Balwant Singh. 2012. “Urban Competitiveness and US Metropolitan
Centres.” Urban Studies 49 (2): 239–54. https://doi.org/10.1177/0042098011399592.
Kuptsch, Christiane, and Eng Fong Pang, eds. 2006. Competing for Global Talent.
International Institute for Labour Studies.

209
Kuznetsov, Alexander S. 2015. Theory and Practice of Paradiplomacy: Subnational
Governments in International Affairs. Routledge New Diplomacy Studies. London ;
New York, NY: Routledge.
Lai, Karen. 2012. “Differentiated Markets: Shanghai, Beijing and Hong Kong in China’s
Financial Centre Network.” Urban Studies 49 (6): 1275–96.
https://doi.org/10.1177/0042098011408143.
Lake, Robert W. 1994. “Negotiating Local Autonomy.” Political Geography 13 (5): 423–
442.
Lane, Philip R., and Sergio L. Schmukler. 2007. “International Financial Integration of
China and India.” In Dancing with Giants: China, India, and the Global Economy,
edited by L. Alan Winters and Shahid Yusuf, 101–32. Washington, DC: World Bank :
Institute of Policy Studies.
Laurenceson, James, and Abhaya Kamalakanthan. 2004. “Emerging Financial Centres in
Asia: A Comparative Analysis of Mumbai and Shanghai.” In , 206–22. Brisbane:
ACESA.
Lee, Roger, and Ulrich Schmidt-Marwede. 1993. “Interurban Competition? Financial
Centres and the Geography of Financial Production.” International Journal of Urban
and Regional Research 17 (4): 492–515. https://doi.org/10.1111/j.1468-
2427.1993.tb00237.x.
Lee, Sam Youl, Richard Florida, and Zoltan Acs. 2004. “Creativity and Entrepreneurship:
A Regional Analysis of New Firm Formation.” Regional Studies 38 (8): 879–91.
https://doi.org/10.1080/0034340042000280910.
Lever, William F. 1999. “Competitive Cities in Europe.” Urban Studies (Routledge) 36
(5/6): 1029–44. https://doi.org/10.1080/0042098993349.
Li, Keqiang. 2018. “Report on the Work of the Government.” Beijing: China State Council.
Li, Mei, and Mark Bray. 2007. “Cross-Border Flows of Students for Higher Education:
Push–Pull Factors and Motivations of Mainland Chinese Students in Hong Kong and
Macau.” Higher Education 53 (6): 791–818. https://doi.org/10.1007/s10734-005-5423-
3.
Li, Wei, Desheng Xue, and Xu Huang. 2018. “How Manufacturing Affects the
Development of World City: A Case Study of Guangzhou in China.”
http://www.preprints.org/manuscript/201801.0103/v1.
210
Lijphart, Arend. 1971. “Comparative Politics and the Comparative Method.” The American
Political Science Review 65 (3): 682. https://doi.org/10.2307/1955513.
———. 1984. Democracies: Patterns of Majoritarian and Consensus Government in
Twenty-One Countries. New Haven: Yale University Press.
Lin, Jan. 2016. “Sassen’s Tandem of Texts on Global Cities, 1988 and 1991.” City &
Community 15 (2): 109–12. https://doi.org/10.1111/cico.12176.
Logan, John R., and Harvey Molotch. 1987. Urban Fortunes: The Political Economy of
Place. Berkeley, Los Angeles, London: University of California Press.
Ma, Xiulian. 2009. “City and State Relations under Globalization: A Network Approach.”
Doctoral Thesis, The University of Utah.
Ma, Xiulian, and Michael Timberlake. 2013. “World City Typologies and National City
System Deterritorialisation: USA, China and Japan.” Urban Studies 50 (2): 255–75.
https://doi.org/10.1177/0042098012453859.
Ma, Xiulian, and Michael F. Timberlake. 2008. “Identifying China’s Leading World City:
A Network Approach.” GeoJournal 71 (1): 19–35. https://doi.org/10.1007/s10708-
008-9146-8.
Marchall, Richard. 2005. “Doi Moi and the Ascending Dragons of Vietnam.” In Emerging
Urbanity: Global Urban Projects in the Asia Pacific Rim, 94–111. Singapore:
Routledge.
McFarlane, Colin. 2010. “Mumbai (Bombay), India.” In Encyclopedia of Urban Studies,
edited by Ray Hutchison, 530–32. Thousand Oaks, Calif: SAGE Publications.
MCGM. 2007. “Annual Accounts for the Year 2006-2007.” Administrative Report of Chief
Accountant’s Department. Mumbai: Brihanmumbai Mahanagarpalika.
Meunier, Sophie. 2014. “Divide and Conquer? China and the Cacophony of Foreign
Investment Rules in the EU.” Journal of European Public Policy 21 (7): 996–1016.
https://doi.org/10.1080/13501763.2014.912145.
Mill, John Stuart. 1895. A System of Logic: Ratiocinative and Inductive, Being a Connected
View of the Principles of Evidence, and the Methods of Scientific Investigation. London
and New York: Longmans, Green, and Co.
Ministry of Finance. 2007. “Report of the High Powered Expert Conmmittee on Making
Mumbai an International Financial Centre.” New Delhi: Ministry of Finance,
Government of India.

211
Ministry of Urban Affairs and Employment. 1993. “Centrally Sponsored Scheme of
Infrastructural Development in Mega Cities: Guidelines.” Government of India.
Mitra, Subrata Kumar. 2011. Politics in India: Structure, Process and Policy. London ;
New York: Routledge.
Mohan, Sudha. 2005. “Between Privatization and Participation: The Provision of Basic
Services in Mumbai.” In Public Problems -- Private Solutions? Globalizing Cities in
the South, edited by Klaus Segbers, Simon Raiser, and Krister Volkmann, 191–206.
Ashgate.
Mok, Ka Ho, and Anthony B.L. Cheung. 2011. “Global Aspirations and Strategising for
World-Class Status: New Form of Politics in Higher Education Governance in Hong
Kong.” Journal of Higher Education Policy and Management 33 (3): 231–51.
https://doi.org/10.1080/1360080X.2011.564998.
Molotch, Harvey. 1976a. “The City as a Growth Machine: Toward a Political Economy of
Place.” American Journal of Sociology 82 (2): 309–332.
———. 1976b. “The City as a Growth Machine: Toward a Political Economy of Place.”
American Journal of Sociology 82 (2): 309–32.
Mossberger, Karen, and Gerry Stoker. 2001. “The Evolution of Urban Regime Theory: The
Challenge of Conceptualization.” Urban Affairs Review 36 (6): 810–835.
Mueller, Sean. 2011. “The Politics of Local Autonomy: Measuring Cantonal
(De)Centralisation in Switzerland.” Space and Polity 15 (3): 213–39.
https://doi.org/10.1080/13562576.2011.692579.
Musterd, Sako, and Zoltán Kovács, eds. 2013. Place-Making and Policies for Competitive
Cities. Chichester, West Sussex, United Kingdom: Wiley Blackwell.
Myers, David J. 2002. “The Dynamics of Local Empowerment: An Overview.” In Capital
City Politics in Latin America : Democratization and Empowerment, edited by Henry
A. Dietz and David J. Myers, 1–27. Boulder, Colo: Lynne Rienner Publishers.
http://search.ebscohost.com/login.aspx?direct=true&db=nlebk&AN=709315&site=eho
st-live.
Nagaraj, R. 1997. “What Has Happened since 1991? Assessment of India’s Economic
Reforms.” Economic and Political Weekly 32 (44/45): 2869–79.
Nguyen-Hoang, Phuong, and Larry Schroeder. 2010. “An Analysis of Quasi-Decentralized
Budgeting in Vietnam.” International Journal of Public Administration 33 (12–13):
698–709. https://doi.org/10.1080/01900692.2010.514449.

212
Nijman, Janne Elisabeth. 2016. “Renaissance of the City as Global Actor. The Role of
Foreign Policy and International Law Practices in the Construction of Cities as Global
Actors.” ASSER Research Paper.
OECD. 2015. “Local Economic Leadership.” OECD.
Ohmae, Kenichi. 1996. The End of the Nation State: The Rise of Regional Economies.
London: HarperCollins.
Olds, Kris, and Henry Yeung. 2004. “Pathways to Global City Formation: A View from the
Developmental City-State of Singapore.” Review of International Political Economy
11 (3): 489–521. https://doi.org/10.1080/0969229042000252873.
Organisation for Economic Co-operation and Development, ed. 2006. Competitive Cities in
the Global Economy. OECD Territorial Reviews. Paris: Organisation for Economic
Co-operation and Development, OECD Publishing.
Page, Edward, and Michael Goldsmith, eds. 1987. Central and Local Government
Relations: A Comparative Analysis of West European Unitary States. Sage Modern
Politics Series, v. 13. London ; Beverly Hills: SAGE Publications.
Pethe, Abhay, Sahil Gandhi, and Vaidehi Tandel. 2011. “Assessing the Mumbai
Metropolitan Region: A Governance Perspective.” Economic & Political Weekly 46
(26/27): 187–95.
Phadke, Aparna. 2014. “Mumbai Metropolitan Region: Impact of Recent Urban Change on
the Peri-Urban Areas of Mumbai.” Urban Studies 51 (11): 2466–83.
https://doi.org/10.1177/0042098013493483.
Phatak, Vidyadhar K. 2007. “Mumbai/Bombay.” In The Making of Global City Regions:
Johannesburg, Mumbai/Bombay, São Paulo, and Shanghai, edited by Klaus Segbers,
Simon Raiser, and Krister Volkmann, 323–28. Johns Hopkins Studies in Globalization.
Baltimore: Johns Hopkins University Press.
Pinto, Marina R. 2005. “Changes and Challenges in Urban Governance -- the Mumbai
Experience.” In Public Problems--Private Solutions? Globalizing Cities in the South,
edited by Klaus Segbers, Simon Raiser, and Krister Volkmann, 347–62. Urban and
Regional Planning and Development Series. Aldershot, Hants, England ; Burlington,
VT: Ashgate.
Pluijm, Rogier van der, and Jan Melissen. 2007. “City Diplomacy: The Expanding Role of
Cities in International Politics.” 10. Clingendael Diplomacy Papers. The Hague:
Netherlands Institute of International Relations Clingedael.

213
Polèse, Mario. 2005. “Cities and National Economic Growth: A Reappraisal.” Urban
Studies 42 (8): 1429–1451.
Porter, Michael E. 1991. Competitive Advantage of Nations: Creating and Sustaining
Superior Performance. London: Macmillan.
———. 2000. “Location, Competition, and Economic Development: Local Clusters in a
Global Economy.” Economic Development Quarterly 14 (1): 15–34.
https://doi.org/10.1177/089124240001400105.
———. 2003. “The Economic Performance of Regions.” Regional Studies 37 (6/7): 545.
https://doi.org/10.1080/0034340032000108688.
Putnam, Robert D. 1988. “Diplomacy and Domestic Politics: The Logic of Two-Level
Games.” International Organization 42 (3): 427–60.
Rao, M. Govinda. 2001. Fiscal Decentralization in Indian Federalism. Bangalore: Institute
for Social and Economic Change.
Rimmer, Peter J. 1996. “Chapter 3: International Transport and Communications
Interactions between Pacific Asia’s Emerging World Cities.” In Emerging World Cities
in Pacific Asia, edited by Fu-chen Lo and Yue-man Yeung, 48–97. Tokyo: United
Nations University Press.
Robinson, Jennifer. 2002. “Global and World Cities: A View from off the Map.”
International Journal of Urban and Regional Research 26 (3): 531–54.
Rogers, Dallas, Chyi Lin Lee, and Ding Yan. 2015. “The Politics of Foreign Investment in
Australian Housing: Chinese Investors, Translocal Sales Agents and Local Resistance.”
Housing Studies 30 (5): 730–48. https://doi.org/10.1080/02673037.2015.1006185.
Saito, Asato. 2003. “Global City Formation in a Capitalist Developmental State: Tokyo and
the Waterfront Sub-Centre Project.” Urban Studies 40 (2): 283–308.
Sankhe, Shirish, Ireena Vittal, and Ajit Mohan. 2011. “Urban Giants: India and China, and
Their Urbanization Paths.” Environment and Urbanization ASIA 2 (1): 1–12.
https://doi.org/10.1177/097542531000200102.
Sassen, Saskia. 1991a. The Global City: New York, London, Tokyo. Princeton, N.J:
Princeton University Press.
———. 1991b. The Global City: New York, London, Tokyo. Princeton, N.J: Princeton
University Press.
———. 2000a. Cities in a World Economy. 2. ed. Sociology for a New Century. Thousand:
Pine Forge Press.

214
———. 2000b. “The Global City: Strategic Site/New Frontier.” American Studies 41 (2/3):
79–95.
———. 2001a. The Global City: New York, London, Tokyo. 2nd ed. Princeton, N.J:
Princeton University Press.
———. 2001b. “Global Cities and Developmentalist States: How to Derail What Could Be
an Interesting Debate: A Response to Hill and Kim.” Urban Studies 38 (13): 2537–40.
https://doi.org/10.1080/00420980120094650.
———, ed. 2002. Global Networks, Linked Cities. New York: Routledge.
———. 2016. “The Global City: Enabling Economic Intermediation and Bearing Its
Costs.” City & Community 15 (2): 97–108. https://doi.org/10.1111/cico.12175.
Schmidt, Klaus-Dieter. 1997. “Small- and Medium-Sized Enterprises in Cross-Border
Networks: Empirical Evidence from the Pearl River Delta.” Kiel Working Paper 88.
The Kiel Institute of World Economics.
Schneider, Aaron. 2003. “Decentralization: Conceptualization and Measurement.” Studies
in Comparative International Development 38 (3): 32–56.
Schneider, M. 1989. The Competitive City. Pittsburgh: University of Pittsburgh Press.
Scott, Allen J., ed. 2001a. Global City-Regions: Trends, Theory, Policy. Oxford University
Press.
———. 2001b. “Globalization and the Rise of City-Regions.” European Planning Studies
9 (7): 813–26. https://doi.org/10.1080/09654310120079788.
Segbers, Klaus, ed. 2005. Public Problems--Private Solutions? Globalizing Cities in the
South. Urban and Regional Planning and Development Series. Aldershot, Hants,
England ; Burlington, VT: Ashgate.
———, ed. 2007. The Making of Global City Regions: Johannesburg, Mumbai/Bombay,
São Paulo, and Shanghai. Johns Hopkins Studies in Globalization. Baltimore: Johns
Hopkins University Press.
Shanghai Municipal Government. 2018. “Striving for the Excellence Global City: Shanghai
City Masterplan (2017-2035).” Shanghai: Shanghai Municipal Government.
Shen, Jianfa. 2002. “Urban and Regional Development in Post-Reform China: The Case of
Zhujiang Delta.” Progress in Planning 57 (2): 91–140. https://doi.org/10.1016/S0305-
9006(01)00022-8.

215
Shen, Wei. 2009. “Chinese Student Circular Migration and Global City Formation: A
Relational Case Study of Shanghai and Paris.” Doctoral Thesis, Loughborough
University. https://dspace.lboro.ac.uk/dspace/handle/2134/6385.
Short, J. R., Y. Kim, M. Kuus, and H. Wells. 1996. “The Dirty Little Secret of World Cities
Research: Data Problems in Comparative Analysis.” International Journal of Urban &
Regional Research 20 (4): 697–717.
Smith, David A., and Michael F. Timberlake. 2001. “World City Networks and
Hierarchies, 1977-1997.” American Behavioral Scientist 44 (10): 1656–78.
Smith, Neil. 2008. Uneven Development: Nature, Capital, and the Production of Space. 3rd
ed. Athens: University of Georgia Press.
Smith, Richard G. 2014. “Beyond the Global City Concept and the Myth of ‘Command and
Control’: Beyond the Global City Concept and the Myth of ‘Command and Control.’”
International Journal of Urban and Regional Research 38 (1): 98–115.
https://doi.org/10.1111/1468-2427.12024.
Stegarescu, Dan. 2004. “Public Sector Decentralization: Measurement Concepts and Recent
International Trends.” ZEW Discussion Paper 04-74.
https://doi.org/10.2139/ssrn.604482.
Stone, C. N. 1989. Regime Politics: Governing Atlanta, 1946-1988. Lawrence: University
Press of Kansas.
Stopford, John M., Susan Strange, and John S. Henley. 1991. Rival States, Rival Firms:
Competition for World Market Shares. Cambridge Studies in International Relations
18. Cambridge ; New York: Cambridge University Press.
Strange, Susan. 1996. The Retreat of the State: The Diffusion of Power in the World
Economy. Cambridge Studies in International Relations 49. New York: Cambridge
University Press.
———. 2004. States and Markets. 2. ed., repr. London: Pinter.
Stren, Richard. 2015. “Cities and Politics in the Developing World: Why Decentralization
Matters.” In The Oxford Handbook of Urban Politics, edited by Peter John, Karen
Mossberger, and Susan E. Clarke. Oxford University Press.
Su, Ming, and Quanhou Zhao. 2007. “China: Fiscal Framework and Urban Infrastructure
Finance.” In Financing Cities: Fiscal Responsibility and Urban Infrastructure in
Brazil, China, India, Poland and South Africa, edited by George E. Peterson and

216
Patricia Clarke Annez, 74–107. Washington, DC : Los Angeles: World Bank ; Sage
Publications.
Tavares, Rodrigo. 2016. Paradiplomacy: Cities and States as Global Players. New York:
Oxford University Press.
Taylor, Peter J. 1995. “World Cities and Territorial States: The Rise and Fall of Their
Mutuality.” In World Cities in a World-System, edited by Paul L. Knox and Peter J.
Taylor, 48–62. Cambridge ; New York: Cambridge University Press.
Taylor, Peter J. 2000. “World Cities and Territorial States under Conditions of
Contemporary Globalization.” Political Geography 19 (1): 5–32.
Taylor, Peter J. 2004. World City Network: A Global Urban Analysis. London; New York:
Routledge.
Taylor, Peter J. 2007. “Problematizing City/State Relations: Towards a Geohistorical
Understanding of Contemporary Globalization.” Transactions of the Institute of British
Geographers 32 (2): 133–150.
Taylor, Peter J., G. Catalano, and D. R. F. Walker. 2002. “Measurement of the World City
Network.” Urban Studies 39 (13): 2367–76.
Taylor, Peter J., Michael Hoyler, David R.F. Walker, and Mark J. Szegner. 2001. “A New
Mapping of the World for the New Millennium.” Geographical Journal 167 (3): 213–
22. https://doi.org/10.1111/1475-4959.00019.
Taylor, Peter J., Pengfei Ni, Ben Derudder, M. Hoyler, K. Pain, F. Witlox, and D. Bassens.
2009. “Measuring the World City Newtork: New Results and Developments.” GaWC
Research Bulletin 300. GaWC.
Taylor, Peter J., David RF Walker, Gilda Catalano, and Michael Hoyler. 2002. “Diversity
and Power in the World City Network.” Cities 19 (4): 231–241.
Taylor, Peter, Ni Pengfei, Ben Derudder, Anneleen De Vos, L. Fengyong, Michael Hoyler,
Huang Jin, K. Pain, Frank Witlox, and Yang Xiaolan. 2009. “Pathways of Growth and
Decline: Connectivity Changes in the World City Network, 2000-2008.” In 105th
Annual Meeting of the Association of American Geographers.
Thanh, Vo Tri. 2005. “Vietnam’s Trade Liberalization and International Economic
Integration: Evolution, Problems, and Challenges.” ASEAN Economic Bulletin 22 (1):
75–91.
The World Bank. 2015. “Making the Whole Greater than the Sum of the Parts: A Review
of Fiscal Decentralization in Vietnam.” Hanoi: The World Bank in Vietnam.

217
Therborn, Göran. 2011. “End of a Paradigm: The Current Crisis and the Idea of Stateless
Cities.” Environment and Planning A 43 (2): 272–85. https://doi.org/10.1068/a42328.
Tiebout, Charles M. 1956. “A Pure Theory of Local Expenditures.” Journal of Political
Economy 64 (5): 416–24.
Tsukamoto, Takashi, and Ronald K. Vogel. 2007. “Rethinking Globalization -- The Impact
of Central Governments on World Cities.” In Governing Cities in a Global Era: Urban
Innovation, Competition, and Democratic Reform, edited by Robin Hambleton and Jill
Simone Gross, 15–31. Palgrave Macmillan.
Uchimura, Hiroko, and Hisaki Kono. 2012. “Intergovernmental Fiscal Relationships in
Vietnam after the 2002 State Budget Law: The Center-Province and the Province-
District/Commune Dimensions.” In Fiscal Decentralization and Development:
Experiences of Three Developing Countries in Southeast Asia, edited by Hiroko
Uchimura, 101–31. Palgrave Macmillan.
Vietnamese Government. 2001. “Strategy for Socio-Economic Development 2001-2010.”
Hanoi: Vienamese Government.
http://www.chinhphu.vn/portal/page/portal/English/strategies/strategiesdetails?categor
yId=29&articleId=3065.
Vietnamese Prime Minister. 2011. “Decision No. 175/QD-TTg of January 27, 2011,
Approving the Overall Strategy on the Development of Vietnamese Service Sector
through 2020.” Decision Số: 175/QD-TTg. Hanoi: Vienamese Government.
http://www.moj.gov.vn/vbpq/en/Lists/Vn%20bn%20php%20lut/View_Detail.aspx?Ite
mID=10739#.
Vind, Ingeborg, and Niels Fold. 2011. “City Networks and Commodity Chains: Identifying
Global Flows and Local Connections in Ho Chi Minh City.” In Commodity Chains and
World Cities, edited by Ben Derudder and Frank Witlox, 65–89. Oxford, UK: Wiley-
Blackwell. https://doi.org/10.1002/9781444328264.ch4.
Vogel, Ronald K., H.V. Savitch, Jiang Xu, Anthony G.O. Yeh, Weiping Wu, Andrew
Sancton, Paul Kantor, et al. 2010. “Governing Global City Regions in China and the
West.” Progress in Planning 73 (1): 1–75.
https://doi.org/10.1016/j.progress.2009.12.001.
Wallerstein, Immanuel. 1979. The Capitalist World-Economy: Essays. Studies in Modern
Capitalism. Cambridge: Cambridge University Press.

218
Wang, Shaoguang. 1997. “China’s 1994 Fiscal Reform: An Initial Assessment.” Asian
Survey 37 (9): 801–17. https://doi.org/10.2307/2645698.
Wang, Zhiguo, and Liang Ma. 2014. “Fiscal Decentralization in China: A Literature
Review.” Annals of Economics and Finance 15 (2): 751–70.
Ward, Peter M. 1995. “The Successful Management and Administration of World Cities:
Mission Impossible?” In World Cities in a World-System, edited by Paul L. Knox and
Peter J. Taylor, 298–314. Cambridge, U.K.: Cambridge University Press.
Wei, Yehua Dennis, and Chi Kin Leung. 2005. “Development Zones, Foreign Investment,
and Global City Formation in Shanghai.” Growth and Change 36 (1): 16–40.
Weinstein, Liza, and Xuefei Ren. 2009. “The Changing Right to the City: Urban Renewal
and Housing Rights in Globalizing Shanghai and Mumbai.” City & Community 8 (4):
407–32. https://doi.org/10.1111/j.1540-6040.2009.01300.x.
Winters, L. Alan, and Shahid Yusuf, eds. 2007. Dancing with Giants: China, India, and the
Global Economy. Washington, DC: World Bank : Institute of Policy Studies.
Wolman, Harold, and Michael Goldsmith. 1990. “Local Autonomy as a Meaningful
Analytic Concept: Comparing Local Government in the United States and the United
Kingdom.” Urban Affairs Quarterly 26 (1): 3–27.
Wong, Christine P. W. 2000. “Central-Local Relations Revisited: The 1994 Tax Sharing
Reform and Public Expenditure Management in China.” World Bank Office in China.
Wu, Fulong. 2000. “The Global and Local Dimensions of Place-Making: Remaking
Shanghai as a World City.” Urban Studies 37 (8): 1359–77.
https://doi.org/10.1080/00420980020080161.
———. 2010. “Shanghai, China.” In Encyclopedia of Urban Studies, edited by Ray
Hutchison, 704–7. Thousand Oaks, Calif: SAGE Publications.
Zhang, Le-Yin. 2014. “Dynamics and Constraints of State-Led Global City Formation in
Emerging Economies: The Case of Shanghai.” Urban Studies 51 (6): 1162–78.
https://doi.org/10.1177/0042098013495577.
Zhang, Li, and Simon Xiaobin Zhao. 2009. “City Branding and the Olympic Effect: A Case
Study of Beijing.” Cities 26 (5): 245–54. https://doi.org/10.1016/j.cities.2009.05.002.
Zhao, Suisheng. 1993. “Deng Xiaoping’s Southern Tour: Elite Politics in Post-Tiananmen
China.” Asian Survey 33 (8): 739–56. https://doi.org/10.2307/2645086.

219
Acknowledgements
My PhD journey had been unexpectedly long. Along the way, many people helped,
enlightened, or even inspired me in different ways, for which I am grateful. Some among
them stayed longer, or the whole time, and have become somewhat inseparable from this
invaluable experience of mine.
First of all, I thank my parents for always being there, through all my happy, mundane
and depressed days. They have supported me in all the ways within their capacity. Eight
thousand kilometers away, their love may not have produced the original or intended
effects on me, yet without it, I don’t think I would pull it off. I owe them a big hug.
I would like to express my deep gratitude to my supervisor Prof. Klaus Segbers. He
guided me through my academic exploration with extreme patience, and always provided
the right kind of help and encouragement when I needed it the most. His sharpness,
experience and vision benefitted my research greatly.
During the years when I worked on the dissertation, idly or hastily, the Graduate School
of Global Politics (GSGP) at the Free University of Berlin had never forgotten to remind,
encourage, and sometimes push me. I “lingered” through quite a few student advisors at the
GSGP. Among them, I especially thank Ms. Claudia Kissling and Ms. Sabine Pag, from
whom I received most help and information.
My appreciation also goes to Prof. Oliver Ibert, for his very kindly agreeing to be the
second examiner of my dissertation and his most constructive inputs during our
conversations and on my defense.
I had the fortune to make some—just a few—true friends during these years. With
some I only had a few chats, with some I shared a substantial part of my life. They brought
me much fun and joy to my lonely or uninteresting days. I thank them and wish them well.
Lastly, I thank the China Scholarship Council (CSC) for funding the first three years of
my stay in Germany. This journey would not be possible without their financial support and
coordination.