a comparative study of socio-economic ... comparative study of socio-economic benefits from...
TRANSCRIPT

A COMPARATIVE STUDY OF
SOCIO-ECONOMIC BENEFITS
FROM MICROGRIDS, SHS AND THE
GRID IN RURAL SOUTH ASIA Narasimha D. Rao (IIASA), Anjana Agarwal,
Davida Wood

Research Objectives
What are the socio-economic impacts of small-scale electricity (SME) systems on rural communities in South Asia?
Focus:
Service conditions
Income
Women/health
Children/education
Business decisions

Site Selection
Selection Criteria • Technology • SME Vintage
Kavre/Sindhuli, Nepal Technology: Microhydro Vintage: 2-12 years
Araria, East Bihar Technology: Biomass (crop) Vintage: 2-10 years
West Champaran, West Bihar Technology: Biomass (husk) Vintage: 0-6 years
Nepal Map
All districts Technology: SHS Vintage: 0-12 years
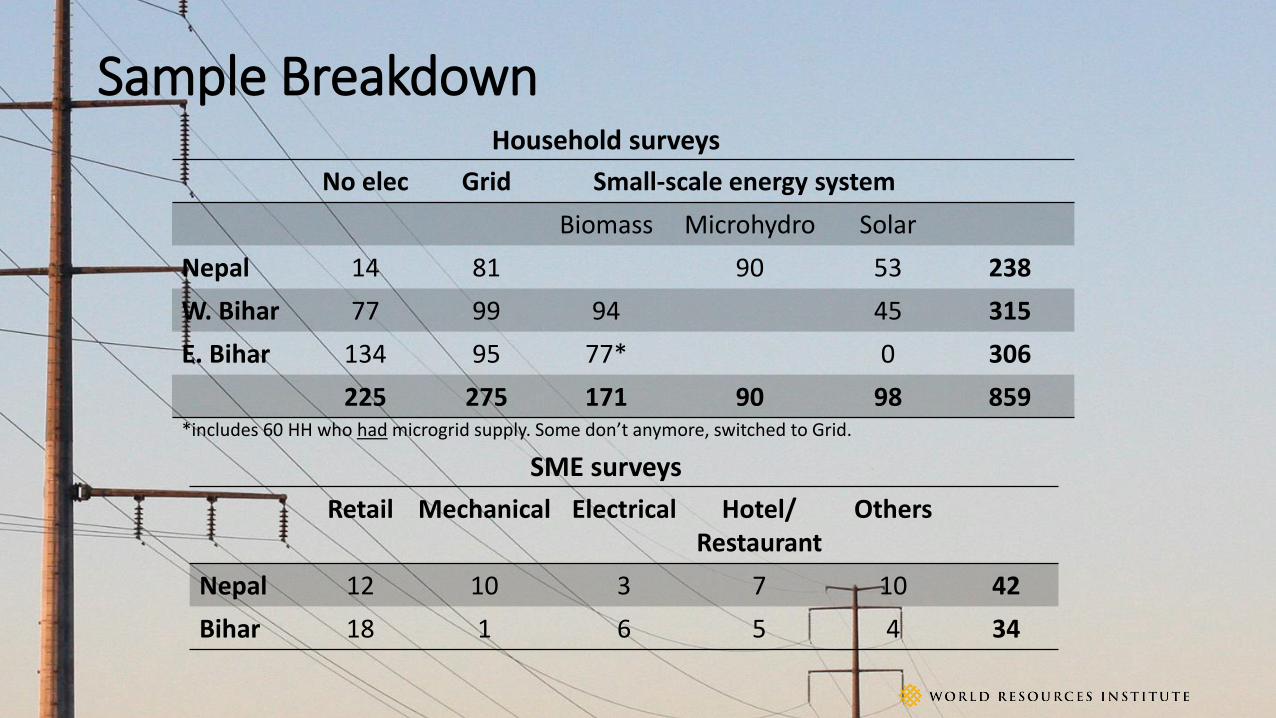
Sample Breakdown Household surveys
*includes 60 HH who had microgrid supply. Some don’t anymore, switched to Grid.
SME surveys
No elec Grid Small-scale energy system
Biomass Microhydro Solar
Nepal 14 81 90 53 238
W. Bihar 77 99 94 45 315
E. Bihar 134 95 77* 0 306
225 275 171 90 98 859
Retail Mechanical Electrical Hotel/ Restaurant
Others
Nepal 12 10 3 7 10 42
Bihar 18 1 6 5 4 34

Research Design
• Quantitative - Cross-sectional, controlled
comparison of outcomes across 3 groups Using Propensity Score
Matching Data: household surveys
• Qualitative - Livelihood impacts (location
choices, income effects) Data: Small-business
interviews
• Literature review
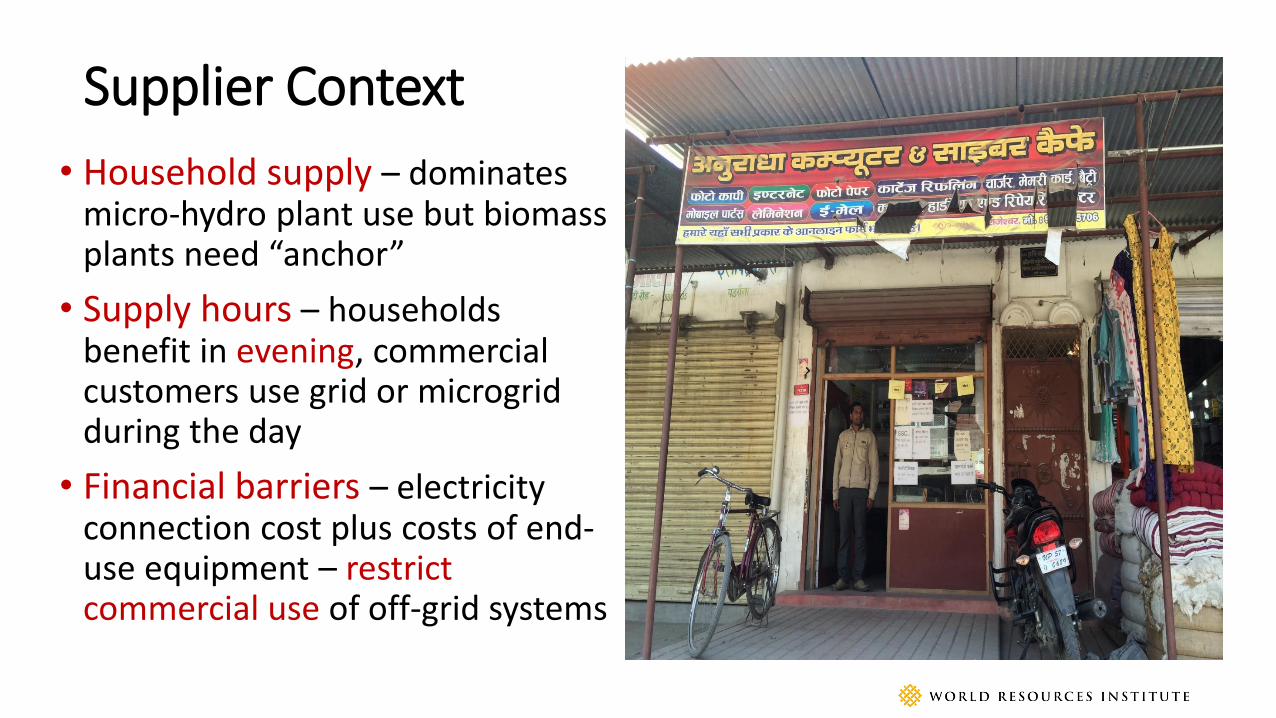
Supplier Context
• Household supply – dominates micro-hydro plant use but biomass plants need “anchor”
• Supply hours – households benefit in evening, commercial customers use grid or microgrid during the day
• Financial barriers – electricity connection cost plus costs of end-use equipment – restrict commercial use of off-grid systems

Estimate of Daily Supply Hours
Mean (std dev)
Grid Microgrid
Nepal 18 (2) 15 (5)
W. Bihar 6 (5) 4 (2)
E. Bihar 4 (4) 3 (2)
Grid: Higher availability vs. Lower Reliability
Microhydro availability > Biomass microgrid availability
In India, hours of grid supply inversely proportional to distance of village from paved road. Greater homogeneity in grid supply in Nepal

Electricity Prices Average Prices (Rs/kWh) Electricity Expenditure Share Monthly Costs
Exp India Nepal India Nepal India Nepal
Group Grid Microgrid
Grid Microgrid
Grid Microgrid
Grid Microgrid
Grid Microgrid
Grid Microgrid
0-249 20.8 44.0 8.4 7% 10% 3% 146 122 63
250-499
21.9 56.1 4.1 15.4 6% 4% 5% 4% 184 107 102 74
500-999
40.5 94.1 4.5 12.3 5% 2% 2% 3% 218 111 77 78
1000-1999
29.3 67.2 4.1 13.1 3% 2% 1% 2% 234 136 78 80
2000+ 36.6 53.1 4.0 10.8 1% 1% 1% 1% 198 139 119 79

Impacts on Income and Livelihoods
•No discernable difference based on hours of supply and system type •Small sample with high standard deviation

Impact on Women and Health Benefits
• Electricity access → Shift in time use – from household chores to leisure, more time for income generating activities
• Kerosene use is significantly reduced with SHS
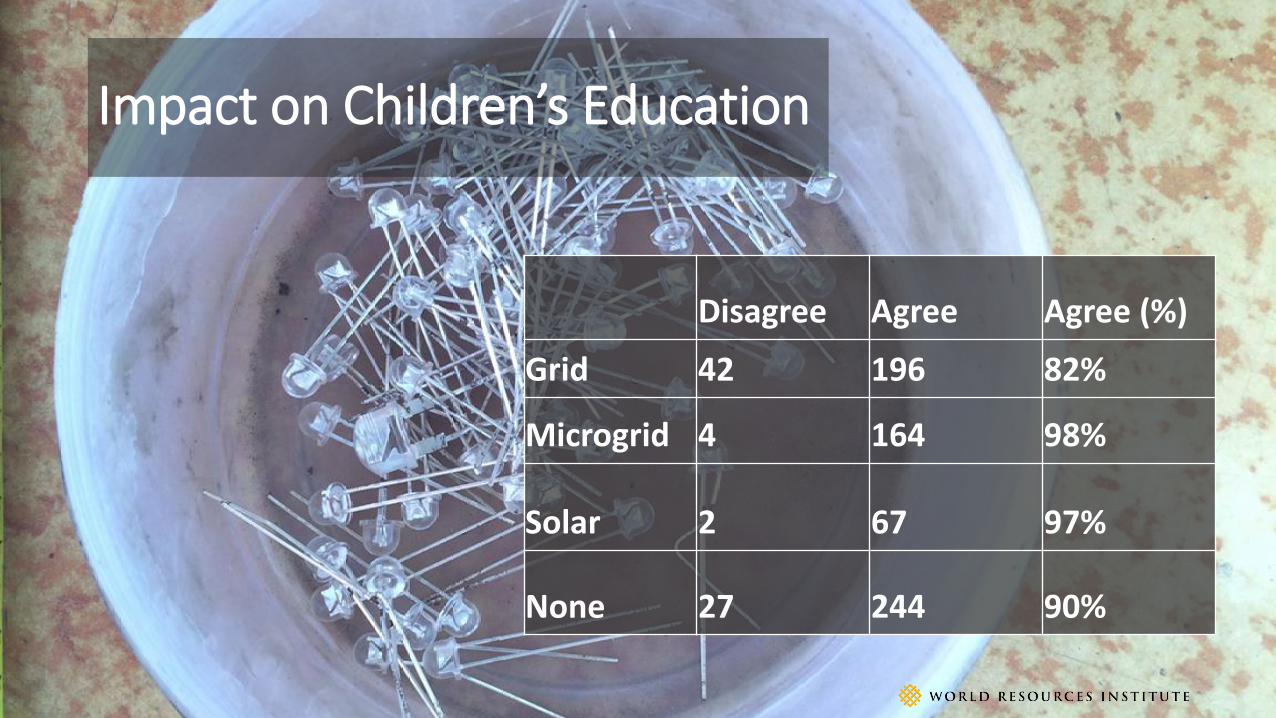
Impact on Children’s Education
Disagree Agree Agree (%)
Grid 42 196 82%
Microgrid 4 164 98%
Solar 2 67 97%
None 27 244 90%

Small Scale Businesses
• Electricity is essential, cost less of a factor • Reliability paramount: preference for more stable micro-
grid • Poor supply constrains (latent) demand
• Electricity enhances SME customer base (e.g., TVs)
• With present supply, electricity is not a primary determinant of business choice/location • Nepal: road access dominates • Bihar: family, supplement to farm

Thank you!

Determinants of Appliance Ownership
0 ≥1 ≥2 ≥3 No. of
Appliances
Monthly Exp (per cap): INR 0-500
GRID
MICRO GRID
SHS
0 >=1 >=2 >=3 >=4 >=5 No. of
Appliances
Monthly Exp (per cap): INR 500-1,000
GRID
MICRO GRID
SHS
0 >=1 >=2 >=3 >=4 >=5 No. of Appliances
Monthly Exp (per cap): INR 1,000-2,000
GRID
MICRO GRID
SHS

Village mean grid supply availability and distance from paved roads
R² = 0.3354
0
2
4
6
8
10
12
0
0.1
0.2
0.3
0.4
0.5
0.6
0.7
0.8
0 5 10 15 20 25
Dis
tan
ce f
rom
Pav
ed
Ro
ads
(km
)
Availability (Hours/Day)
India Nepal

Determinants of Appliance Ownership DV: Total appliances per cap Coefficient t-stat
Microgrid Dummy -1.82*** (4.72)
SHS Dummy -2.32*** (3.30)
Nepal Dummy 2.21*** (3.41)
Age of Elec Connection 0.25*** (7.05)
HH exp (‘000 Rs/cap) 0.33** (2.13)
Head of HH Education (1-4) 0.54*** (2.77)
Distance from paved road (km) -0.07** (1.99)
Hrs per day (30 day recall) 0.16*** (4.16)
R2 0.39
N 498 * p<0.1; ** p<0.05; *** p<0.01
Reference Country is India, supply system is Grid