a comparative study of the career aspirations, job seeking
TRANSCRIPT
Western Michigan University Western Michigan University
ScholarWorks at WMU ScholarWorks at WMU
Dissertations Graduate College
4-1984
A Comparative Study of the Career Aspirations, Job Seeking A Comparative Study of the Career Aspirations, Job Seeking
Patterns, and Career Patterns of Male and Female Doctoral Patterns, and Career Patterns of Male and Female Doctoral
Recipients in Educational Administration Recipients in Educational Administration
Alice J. Hullhorst Western Michigan University
Follow this and additional works at: https://scholarworks.wmich.edu/dissertations
Part of the Educational Administration and Supervision Commons
Recommended Citation Recommended Citation Hullhorst, Alice J., "A Comparative Study of the Career Aspirations, Job Seeking Patterns, and Career Patterns of Male and Female Doctoral Recipients in Educational Administration" (1984). Dissertations. 2366. https://scholarworks.wmich.edu/dissertations/2366
This Dissertation-Open Access is brought to you for free and open access by the Graduate College at ScholarWorks at WMU. It has been accepted for inclusion in Dissertations by an authorized administrator of ScholarWorks at WMU. For more information, please contact [email protected].
A COMPARATIVE STUDY OF THE CAREER ASPIRATIONS, JOB SEEKING PATTERNS, AND CAREER PATTERNS OF MALE
AND FEMALE DOCTORAL RECIPIENTS IN EDUCATIONAL ADMINISTRATION
by
Alice J. Hullhorst
A Dissertation Submitted to the
Faculty of The Graduate College in partial fulfillment of the
requirements for the Degree of Doctor of Education
Department of Educational Leadership
Western Michigan University Kalamazoo, Michigan
April 1984
Reproduced with permission of the copyright owner. Further reproduction prohibited without permission.
A COMPARATIVE STUDY OF THE CAREER ASPIRATIONS, JOB SEEKING PATTERNS, AND CAREER PATTERNS OF MALE
AND FEMALE DOCTORAL RECIPIENTS IN EDUCATIONAL ADMINISTRATION
Alice J. Hullhorst, Ed.D.
Western Michigan University, 1984
There has been a dramatic increase in the number of women
completing advanced degrees in educational administration during
the past decade. Yet, the number of women administrators has
decreased during this same time period. The purpose of this study
was to compare career aspirations, job seeking patterns, and career'
patterns of men and women doctorates in educational administration.
The sample consisted of 118 men and 118 women who received
doctorates in educational administration or educational leadership
from Mid-American Conference universities between 1976-1980. A
mailed questionnaire was used to collect data. The 23 hypotheses
were tested using a chi-square test or a J: test for independent
means. The following conclusions are based upon the findings of
the study:
Career Aspirations
There were some differences in the career aspirations of men
and women doctorates in educational administration. More males
aspired to the superintendency at the time of doctoral completion
and as a final career goal. More females were interested in
Reproduced with permission of the copyright owner. Further reproduction prohibited without permission.
becoming college professors at the time of doctoral completion. The
women doctorates had lower career aspirations than the men.
Job Seeking Patterns
The women doctorates were somewhat more aggressive in their job
seeking patterns than the men. The women used slightly more in
formal and formal job seeking methods and applied for more jobs when
looking for their present position.
Career Patterns
There were differences in the career patterns of men and women
doctorates in educational administration. The males had more admin
istrative or management experience prior to completing the doctorate,
while the women had more teaching experience. The typical career
path for the men doctorates was that of K-12 public/private school
administrator. The women doctorates followed more diverse career
paths including college professor, K-12 public/private school admin
istrator, and higher education administrator. The males earned more
money than the females. More women perceived home and family re
sponsibilities, lack of available jobs, lack of opportunities for
promotion and advancement, sex discrimination, and inability to re
locate as major constraints in their career. More women perceived
themselves to be underemployed. No support was found for sex differ
ences in degree of satisfaction with career progress.
Reproduced with permission of the copyright owner. Further reproduction prohibited without permission.
INFORMATION TO USERS
This reproduction was made from a copy of a document sent to us for microfilming. While the most advanced technology has been used to photograph and reproduce this document, the quality of the reproduction is heavily dependent upon the quality of the material submitted.
The following explanation of techniques is provided to help clarify markings or notations which may appear on this reproduction.
1.The sign or “target” for pages apparently lacking from the document photographed is “Missing Page(s)”. I f it was possible to obtain the missing page(s) or section, they are spliced into the film along with adjacent pages. This may have necessitated cutting through an image and duplicating adjacent pages to assure complete continuity.
2. When an image on the film is obliterated with a round black mark, it is an indication of either blurred copy because of movement during exposure, duplicate copy, or copyrighted materials that should not have been filmed. For blurred pages, a good image of the page can be found in the adjacent frame. If copyrighted materials were deleted, a target note will appear listing the pages in the adjacent frame.
3. When a map, drawing or chart, etc., is part of the material being photographed, a definite method of “sectioning” the material has been followed. It is customary to begin filming at the upper left hand comer of a large sheet and to continue from left to right in equal sections with small overlaps. I f necessary, sectioning is continued again-beginning below the first row and continuing on until complete.
4. For illustrations that cannot be satisfactorily reproduced by xerographic means, photographic prints can be purchased at additional cost and inserted into your xerographic copy. These prints are available upon request from the Dissertations Customer Services Department.
5. Some pages in any document may have indistinct print. In all cases the best available copy has been filmed.
International300 N.Zeeb RoadAnn Arbor, Ml 48106
Reproduced with permission of the copyright owner. Further reproduction prohibited without permission.

Reproduced with permission of the copyright owner. Further reproduction prohibited without permission.
8414956
Hullhorst, Alice J.
A COMPARATIVE STUDY OF THE CAREER ASPIRATIONS, JOB SEEKING PATTERNS, AND CAREER PATTERNS OF MALE AND FEMALE DOCTORAL RECIPIENTS IN EDUCATIONAL ADMINISTRATION
Western Michigan University Ed.D. 1984
UniversityMicrofilms
International 300 N. Zeeb Road, Ann Arbor, Ml 48106
Copyright 1984
by
Hullhorst, Alice J.
All Rights Reserved
Reproduced with permission of the copyright owner. Further reproduction prohibited without permission.

Reproduced with permission of the copyright owner. Further reproduction prohibited without permission.

PLEASE NOTE:
In all cases this material has been filmed in the best possible way from the available copy. Problems encountered with this document have been identified here with a check mark V .
1. Glossy photographs or pages______
2. Colored illustrations, paper or print______
3. Photographs with dark background______
4. Illustrations are poor copy______
5. Pages with black marks, not original copy.
6. Print shows through as there is text on both sides of page______
7. Indistinct, broken or small print on several pages
8. Print exceeds margin requirements______
9. Tightly bound copy with print lost in spine______
10. Computer printout pages with indistinct print______
11. Page(s)____________ lacking when material received, and not available from school orauthor.
12. Page(s)____________seem to be missing in numbering only as text follows.
13. Two pages numbered___________ . Text follows.
14. Curling and wrinkled pages______
15. Other_______________________________________________________________________
UniversityMicrofilms
International
Reproduced with permission of the copyright owner. Further reproduction prohibited without permission.

Reproduced with permission of the copyright owner. Further reproduction prohibited without permission.

($) Copyright by Alice J. Hullhorst
1984
Reproduced with permission of the copyright owner. Further reproduction prohibited without permission.
ACKNOWLEDGMENTS
I would like to express my appreciation to some of the people
who assisted me in completing my doctoral program.
First, I would like to thank Richard Munsterman, my committee
chairperson, for his guidance, encouragement, and patience in help
ing me to complete this study. I would also like to thank the
other members of my committee, Jean Ramsey and Lawrence Schlack,
for their many helpful suggestions and their support.
My appreciation to Donald Weaver and the Mott Foundation for
giving me the opportunity to spend a very rewarding year as an
intern in the Community Leadership Training Center.
A very special thanks to my parents and my husband, John, for
their love, encouragement, and support.
Alice J. Hullhorst
Reproduced with permission of the copyright owner. Further reproduction prohibited without permission.
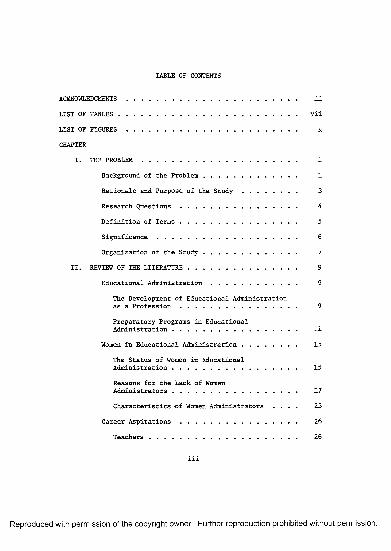
TABLE OF CONTENTS
ACKNOWLEDGMENTS............................................... ii
LIST OF T A B L E S .................................................. vii
LIST OF F I G U R E S ................................................ x
CHAPTER
I. THE P R O B L E M ............................................ 1
Background of the Problem.......................... 1
Rationale and Purpose of the Study ............... 3
Research Questions ................................ 4
Definition of Terms ................................ 5
Significance ....................................... 6
Organization of the Study .......................... 7
II. REVIEW OF THE LITERATURE............................... 9
Educational Administration ........................ 9
The Development of Educational Administrationas a Pr o f e s s i o n ................................ 9
Preparatory Programs in EducationalAdministration .................................. 11
Women in Educational Administration............... 15
The Status of Women in EducationalAdministration .................................. 15
Reasons for the Lack of WomenAdministrators.................................. 17
Characteristics of Women Administrators . . . . 23
Career Aspirations ................................ 26
Teachers......................................... 26
iii
Reproduced with permission of the copyright owner. Further reproduction prohibited without permission.
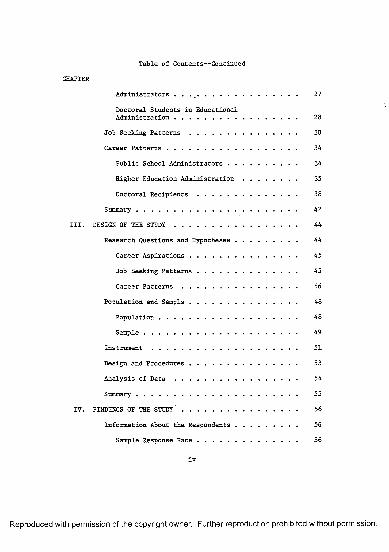
Table of Contents— Continued
CHAPTER
Administrators . . . #........................... 27
Doctoral Students in EducationalAdministration.................................. 28
Job Seeking Patterns .............................. 30
Career Patterns .................................... 34
Public School Administrators ................... 34
Higher Education Administration ............... 35
Doctoral Recipients ........................... 38
Summary............................................ 42
III. DESIGN OF THE S T U D Y ................................. 44
Research Questions and Hypotheses ................. 44
Career Aspirations .............................. 45
Job Seeking Patterns ........................... 45
Career Patterns ................................ 46
Population and Sample .............................. 48
Population...................................... 48
Sample.......................................... 49
Instru m e n t........................................ 51
Design and Procedures .............................. 53
Analysis of D a t a .................................. 54
Summary............................................ 55
IV. FINDINGS OF THE STUDY- ............................... 56
Information About the Respondents................. 56
Sample Response R a t e ........................... 56
iv
Reproduced with permission of the copyright owner. Further reproduction prohibited without permission.
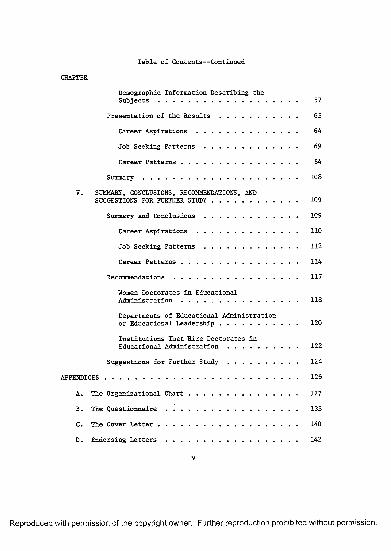
Table of Contents— Continued
CHAPTER
Demographic Information Describing theS u b j e c t s ....................................... 57
Presentation of the R e s u l t s ..................... 63
Career Aspirations ............................ 64
Job Seeking Patterns .......................... 69
Career Patterns ................................ 84
Summar y ........................................... 108
V. SUMMARY, CONCLUSIONS, RECOMMENDATIONS, ANDSUGGESTIONS FOR FURTHER S T U D Y ........................ 109
Summary and Conclusions.......................... 109
Career Aspirations ............................ 110
Job Seeking Patterns .......................... 112
Career Patterns ................................ 114
Recommendations.........* ....................... 117
Women Doctorates in EducationalAdministration . . . . . ..................... 118
Departments of Educational Administration or Educational Leadership ..................... 120
Institutions That Hire Doctorates inEducational Administration ................... 122
Suggestions for Further Study ................... 124
APPENDICES...................................................... 126
A. The Organizational C h a r t .............................. 127
B. The Questionnaire..................................... 133
C. The Cover L e tter....................................... 140
D. Endorsing Letters ..................................... 142
v
Reproduced with permission of the copyright owner. Further reproduction prohibited without permission.
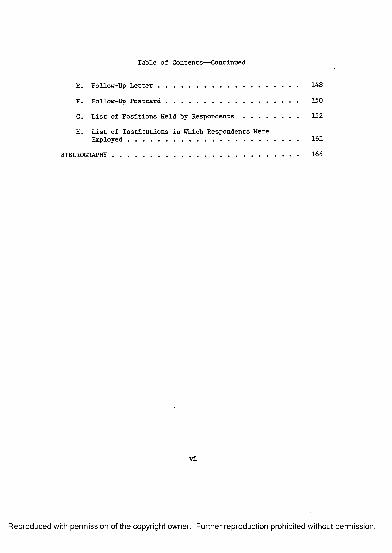
Table of Contents— Continued
E. Follow-Up Letter ....................................... 148
F. Follow-Up Postcard ..................................... 150
G. List of Positions Held by R e s p ondents................. 152
H. List of Institutions in Which Respondents WereEmployed............................................... 161
BIBLIOGRAPHY ................................................... 164
Reproduced with permission of the copyright owner. Further reproduction prohibited without permission.
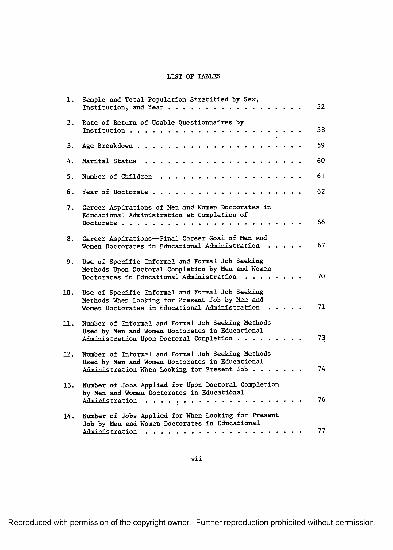
LIST OF TABLES
1. Sample and Total Population Stratified by Sex,Institution, and Y e a r .................................... 52
2. Rate of Return of Usable Questionnaires byInstitution............................................... 58
3. Age Breakdown............................................. 59
4. Marital S t a t u s ........................................... 60
5. Number of C h i l d r e n ....................................... 61
6. Year of Doctorate......................................... 62
7. Career Aspirations of Men and Women Doctorates in Educational Administration at Completion ofDoctorate................................................. 66
8. Career Aspirations— Final Career Goal of Men andWomen Doctorates in Educational Administration ......... 67
9. Use of Specific Informal and Formal Job SeekingMethods Upon Doctoral Completion by Men and Women Doctorates in Educational Administration ............... 70
10. Use of Specific Informal and Formal Job Seeking Methods When Looking for Present Job by Men andWomen Doctorates in Educational Administration ......... 71
11. Number of Informal and Formal Job Seeking MethodsUsed by Men and Women Doctorates in Educational Administration Upon Doctoral Completion ................. 73
12. Number of Informal and Formal Job Seeking MethodsUsed by Men and Women Doctorates in Educational Administration When Looking for Present J o b ............. 74
13. Number of Jobs Applied for Upon Doctoral Completion by Men and Women Doctorates in EducationalAdministration . . . . . ................................ 76
14. Number of Jobs Applied for When Looking for PresentJob by Men and Women Doctorates in Educational Administration........................................... 77
vii
Reproduced with permission of the copyright owner. Further reproduction prohibited without permission.
List of Tables— Continued
15. Number of Job Interviews Upon Doctoral Completion by Men and Women Doctorates in EducationalAdministration........................................... 78
16. Number of Job Interviews When Looking for Present Job by Men and Women Doctorates in Educational Administration........................................... 79
17. Number of Job Offers Received by Men and WomenDoctorates in Educational Administration AfterCompleting the Doctorate ................................ 80
18. Number of Job Offers Received by Men and WomenDoctorates in Educational Administration WhenLooking for Present J o b .................................. 81
19. Number of Administrative or Management Jobs Applied For Upon Doctoral Completion by Men and WomenDoctorates in Educational Administration ............... 82
20. Number of Administrative or Management Jobs Applied For When Looking for Present Job by Men and Women Doctorates in Educational Administration ............... 83
21. Years of Predoctoral Work Experience of Men andWomen Doctorates in Educational Administration......... 85
22. Years of Predoctoral Non-Administrative/Management Work Experience of Men and Women Doctorates inEducational Administration .............................. 87
23. Type of First Postdoctoral Position Held by Men andWomen Doctorates in Educational Administration ......... 89
24. Present or Last Type of Position Held by Men andWomen Doctorates in Educational Administration ......... 90
25. Major Type of Job Activity for First PostdoctoralP o s i t i o n ................................................. 91
26. Major Type of Job Activity for Present or LastPosition H e l d ............................................. 92
27. First Postdoctoral Type of Institution in Which Men and Women Doctorates in Educational Administration Were E m p l o y e d ....................................... 94
viii
Reproduced with permission of the copyright owner. Further reproduction prohibited without permission.
List of Tables— Continued
28. Present or Last Type of Institution in Which Men and Women Doctorates in Educational AdministrationWere Employed............................................. 95
29. Average Annual Salary for First Postdoctoral Position Held by Men and Women Doctorates inEducational Administration................. 96
30. Average Annual Salary for Present or Last PositionHeld by Men and Women Doctorates in Educational Administration........................................... 97
31. Factors Perceived as Constraints on Career Progress by Men and Women Doctorates in EducationalAdministration........................................... 99
32. Years of Unemployment for Men and Women Doctoratesin Educational Administration .............................. 101
33. Perceptions of Underemployment of Men and WomenDoctorates in Educational Administration ................. 103
34. Degree of Satisfaction With Career Progress of Menand Women Doctorates in Educational Administration . . . 106
Reproduced with permission of the copyright owner. Further reproduction prohibited without permission.

LIST OF FIGURES
1. Promotional Hierarchy for Academic Administrators . . . . 36
x
Reproduced with permission of the copyright owner. Further reproduction prohibited without permission.
CHAPTER I
THE PROBLEM
Background of the Problem
Teaching has always been a traditional career for women.
According to a survey by the National Education Association (1973),
67% of the public school teachers in the United States are women.
Yet, few women hold leadership positions in our educational institu
tions. There has been much concern in recent years over the under
representation of women administrators in the field of education.
Despite the advent of the women’s movement, enactment of
Title IX of the Educational Amendments of 1972, and affirmative
action, the percentage of women administrators in the public schools
has actually decreased in the past 30 years. In 1950, 12% of the
junior high and 6% of the senior high principalships and 9% of the
superintendencies were held by women as reported by Croft-NEI (cited
in McCarthy, Kuh, and Beckman, 1979). In 1971, 21% of the elemen
tary and 3% of the secondary principalships and less than 1% of the
superintendencies were held by women. By 1975, women held only 18%
of the elementary and 2% of the secondary principalships and less
than 1% of the superintendencies (National Council of Administrative
Women in Education, 1975).
The representation of women in administrative positions in
higher education is not much better. According to a 1978-79 study
1
Reproduced with permission of the copyright owner. Further reproduction prohibited without permission.
of the employment patterns of women and minorities in administrative
positions, only 19.7% of administrators at colleges and universities
in the United States are women. This study was conducted by the
College and University Personnel Association (1981), and the results
are based on responses from 1,222 institutions covering 26,104 admin
istrators.
One reason given for the small percentage of women in adminis
trative positions is that they lack the appropriate educational
qualifications. Most administrative positions require at least a
master's degree. Several studies have shown that a larger percent
age of men complete master's, specialist, and doctoral degrees in
education than women (Lyman & Speizer, 1980; Michigan Department of
Education, 1981; Van Meir, 1975).
Although women are still underrepresented in graduate programs,
the number of females completing advanced degrees has increased sub
stantially in recent years. The percent of master's degrees
awarded to women increased from 35.8% in 1967-68 to 48.3% in 1977-78.
The percent of doctor's degrees awarded to women increased from 12.6%
in 1967-68 to 26.4% in 1977-78 (National Center for Educational
Statistics, 1980).
The number of women completing advanced degrees specifically in
the field of educational administration has also risen sharply.
Until recently, few women sought degrees in educational administra
tion. In 1971-72 the University Council for Educational Administra
tion estimated that only about 8% of the students in educational
administration were women. During the past decade, there has been
Reproduced with permission of the copyright owner. Further reproduction prohibited without permission.
3a significant increase in the number of women pursuing degrees in
this field. Between 1972 and 1977, more than 7,700 educational ad
ministration doctorates were awarded, 15% of them to females. In
the 1976-77 academic year alone, nearly 1,500 educational adminis
tration doctorates were conferred, 22% upon women. By 1978, 29% of
the doctorates in educational administration were awarded to women
(National Research Council, 1978). "Thus it appears that the pro
portion of female doctoral students in educational administration is
increasing while the proportion of female administrators in public
school districts is decreasing" (McCarthy et al., 1979, p. 202).
Rationale and Purpose of the Study
If more women are completing advanced degrees in educational
administration, but there are fewer women administrators, one might
wonder what is happening to these women graduates? There are few
studies on women who hold degrees in educational administration.
Most of the research on women in this field has been on women who
are or have been administrators, regardless of their educational
background. This study will focus specifically on women who have
completed doctorates in educational administration and will compare
them with a matched sample of men doctorates from the same disci
pline .
The 1970s has seen an unprecedented increase in the number of
women entering college at all degree levels. Particularly signifi
cant is the increase of women seeking degrees in such nontraditional
fields as law, medicine, engineering, and educational administration.
Reproduced with permission of the copyright owner. Further reproduction prohibited without permission.
4As more women complete degrees in fields that have traditionally-
been male dominated, it becomes increasingly important to determine
how successful these women have been in reaching their career goals
after receiving their degrees. This is especially important in a
field such as educational administration where the percentage of
women administrators appears to be decreasing. Therefore, the pur
pose of this study is to determine if there are significant differ
ences in the career aspirations, job seeking patterns, and career
patterns of men and women who complete doctorates in the field of
educational administration.
Research Questions
This study will investigate three major areas: career aspira
tions, job seeking patterns, and career patterns. The researcher
has formulated three research questions to reveal the differences
between men and women who have completed doctorates in educational
administration in relation to these three variables. Specific
hypotheses related to each research question were developed from the
review of literature and are discussed in Chapters II and III. The
three major research questions are listed below:
1. Do men and women who complete doctorates in educational
administration differ in their career aspirations?
2. Do men and women who complete doctorates in educational
administration differ in their job seeking patterns?
3. Do men and women who complete doctorates in educational
administration differ in their career patterns?
Reproduced with permission of the copyright owner. Further reproduction prohibited without permission.
5Definition of Terms
The terms most frequently used in this study have been defined
in order to provide the reader with a clear understanding of their
usage.
1. Educational administration is defined as "a social process
concerned with identifying, maintaining, stimulating, controlling,
and unifying formally and informally organized human and material
energies within an integrated system designed to accomplish pre
determined objectives" (Knezevich, 1975, p. 12). This term will
also be used to refer to preparatory programs designed to prepare
individuals for leadership positions in educational institutions.
2. Career aspirations is defined as an individual's goal in
terms of the kind of position or positions desired.
3. Career patterns refers to the work-related experiences and
activities of an individual and includes positions held, types of
institutions for which the person has worked, salary, unemployment,
underemployment, and factors perceived as constraints on career
progress. This study focused primarily on employment from comple
tion of the doctorate to the present.
4. Job seeking patterns refers to the entire process of find
ing employment and includes finding out about job openings, applying
for jobs, interviewing, and job offers.
5. Career constraints are defined as factors which the individ
ual perceives as having hindered his or her career progress.
Reproduced with permission of the copyright owner. Further reproduction prohibited without permission.
66. Formal vs. informal job search methods are defined by Brown
(1967) as follows:
"Formal" and "informal" intermediaries are dichotomized upon the primary relationships between the individual and the liaison. "Informal" refers to all those liaisons with which the individual has relationships which are not primarily for the purpose of finding a job. . . . "Formal" refers to all liaisons to which the individual relates for the explicit purpose of finding a job. (p. 117, footnote)
7. Underemployment is defined as employment in a position that
normally does not require the educational degree held by that indi
vidual and/or the expertise and experience that person possesses.
Significance
This study should be of significance to at least two groups of
people. First, the results should be of significance to departments
of educational administration or educational leadership. McCarthy
et al. (1979) emphasized the need for this kind of research in the
following paragraph:
Clearly, considerable attention must be given to recent placement data on a national scale to determine congruence between students' aspirations, and employment opportunities. . . . In addition, faculty must remain responsive to the changing characteristics of students. Among the more salient trends is the increase in female doctoral candidates, (p. 202)
Secondly, this study should be helpful to women who plan to
pursue doctorates in educational administration. If women doctor
ates in educational administration are having greater difficulty
than male doctorates in locating and securing administrative posi
tions commensurate with their education and experience, they should
Reproduced with permission of the copyright owner. Further reproduction prohibited without permission.
7be aware of the problem.
It is hoped that this study will determine if there are major
differences in the career aspirations, job seeking patterns, and
career patterns of men and women who complete doctorates in the
field of educational administration. Documenting whether or not
significant differences do exist, and what these differences are,
is the first step in trying to combat the problem.
Organization of the Study
This report is divided into five chapters. Chapter I is an
introduction to the study and includes the background of the prob
lem, rationale and purpose of the study, research questions, defini
tion of terms, significance, and organization of the study.
Chapter II presents a review of the literature beginning with a
brief history of the development of educational administration as a
profession and the growth of preparatory programs in educational
administration. This is followed by a discussion of the role of
women in educational administration. Chapter II also examines the
research on career aspirations, job seeking patterns, and career
patterns.
Chapter III describes the design of the study. The chapter
begins with the three research questions and their corresponding
hypotheses. Also included is a discussion of the population and
sample, the instrument, design and procedures, and analysis of the
data.
Reproduced with permission of the copyright owner. Further reproduction prohibited without permission.
8Chapter IV presents the findings of the study. It discusses
the characteristics of the respondents and gives the results of the
data analyses and hypotheses testing.
Chapter V gives a summary of the research and conclusions. It
also discusses the implications of the findings and offers recom
mendations for future research.
Reproduced with permission of the copyright owner. Further reproduction prohibited without permission.
CHAPTER II
REVIEW OF THE LITERATURE
This chapter includes a review of the literature related to the
present study. The literature review is divided into five major
sections that are pertinent to the understanding of this disserta
tion. The first section, on educational administration, gives a
brief history of the development of educational administration as a
profession and the growth of preparatory programs. The second
section examines the status of women in educational administration
and looks at some of the reasons for the paucity of women adminis
trators. A review of the literature on career aspirations is pre
sented in the third section. The fourth section deals with job
seeking patterns, and the last section is concerned with career
patterns.
Educational Administration
The Development of Educational Administration as a Profession
In the days of the one-room school, there were only students
and teachers— no administrators. As schools grew larger, it became
necessary to have someone in charge. At first, a head teacher was
designated, but as schools became even larger and more complex, a
full-time administrator had to be appointed. Thus, the principal-
ship was established as one of the first administrative positions in
9
Reproduced with permission of the copyright owner. Further reproduction prohibited without permission.
10the public schools (De Young, 1960).
As school districts expanded to include several school build
ings, the need arose for someone to oversee the entire system. In
early times, this task was undertaken by a school committee of lay
men. But, this proved impractical and eventually a superintendent
was employed to administer all of the schools within a district.
The first school superintendents were appointed in Buffalo and
Louisville in 1837 (De Young, 1960). After the principalship and
superintendency were established, other administrative positions
were added, such as, assistant superintendent, business manager,
curriculum director, and other specialists.
The development of administration in higher education followed
a similar pattern. In the beginning, the only administrator was the
president. "The president taught, raised money, collected fees,
managed the physical plant, handled student discipline, and con
trolled the faculty and curriculum" (Burns, 1962, p. 55). This
arrangement continued until the turn of the century when an increase
in the size of colleges, specialization of knowledge, and the addi
tion of a variety of services created .a need for more administrators
to manage these functions.
Thus, the field of educational administration evolved. The
early administrators had no specialized training in management or
administration. Cubberly (1916) described these early administra
tors as "gifted amateurs and pioneers." It wasn't until the 20th
century that educational administration developed into a specialized
profession.
Reproduced with permission of the copyright owner. Further reproduction prohibited without permission.
11Preparatory Programs in Educational Administration
As educational administration became established as a profes
sion, colleges and universities began offering preparatory programs
for administrators. The first department of educational administra
tion was founded at Teacher's College, Columbia University in the
first decade of the 20th century. By 1940, about 40 universities
offered Ph.D. programs and about 30 offered Ed.D. programs in educa
tional administration. In the mid-1970s, about 80 universities
offered Ph.D. programs in educational administration, while close to
100 institutions offered the Ed.D. (Farquhar, 1977).
Up until the end of World War II, preparatory programs in educa
tional administration consisted of "largely folklore, experiences
recounted by professors to students in summer sessions, with little
research into the process or theory of administration" (Moore, 1964,
p. 14). The typical doctoral student was a practicing administrator
who attended classes on a part-time basis. Graduate assistantships
and fellowships were rare, and full-time residency was not required.
The student's program consisted of at least 70 credit hours of
classes plus a dissertation. The majority of students were white
males.
What Moore (1964) referred to as "the ferment in school admin
istration" began in 1947. Three events occurred at about this time
that were to change the nature of preparatory programs in educa
tional administration. The first event was the establishment of the
National Conference of Professors of Educational Administration
Reproduced with permission of the copyright owner. Further reproduction prohibited without permission.
12(NCPEA) at Endicott in 1947. Members of NCPEA were interested in
exchanging knowledge of teaching and research practices and expand
ing scientific inquiry related to educational administration.
The second of the three events was the preparation of a report
by the Planning Committee of the American Association of School
Administrators (AASA) which had been given the job of projecting the
AASA program of concerns for the next 10 years. The report, pre
sented in January 1947, recommended that the AASA program include
the initiation of studies and programs looking toward further professionalization of the superintendency through improved training programs, refined standards of selection by boards of education, and fuller and wider participation in the activities of the profession.(Moore, 1957, p. 2)
In November 1947, the AASA submitted a proposal to the W. K. Kellogg
Foundation for funding to establish a national commission to study
the superintendency. The Kellogg Foundation rejected this proposal,
but they agreed to sponsor some conferences to explore the need for
national study in educational administration. This led to the third
and most significant event.
In 1950, the W. K. Kellogg Foundation provided funds for the
inauguration of the Co-operative Program in Educational Administra
tion (CPEA). CPEA Centers were established at eight universities
across the country. One of the purposes of the CPEA Centers was to
improve graduate programs of preparation for school administrators.
The "Centers" conducted studies to determine the basic competencies
needed for successful administration and the kind of preparation
program that would best develop these competencies in people.
Reproduced with permission of the copyright owner. Further reproduction prohibited without permission.
By the 1960s, these developments began to impact preparatory
programs in universities across the country. The University Council
for Educational Administration (UCEA), formed in 1956, helped dis
seminate the knowledge and materials developed by the CPEA Centers.
According to Farquhar (1977), the typical doctoral student in the
1960s was still a white male, but he was 5 years younger than his
predecessor a decade earlier. He had been a principal but had given
up his job to pursue graduate study because the university now had a
full-time residency requirement. Chances are he had received a
fellowship or an assistantship from the university. The student's
program was heavy in the social sciences and emphasized the theory
of administration. Workshops and seminars replaced the old lecture-
and-textbook courses and internships became an integral part of the
doctoral program. The student of the 60s "was being prepared as an
'applied social scientist,’ and he was a participant in what may be
referred to as the 'golden age' of educational administration"
(Farquhar, 1977, p. 335). This was definitely a period of growth in
departments of educational administration with the number of stu
dents and faculty increasing dramatically.
Farquhar (1977) referred to the period extending from the late
1960s to the present as "the age of diversity and adversity" (p.
340). He identified three major phenomena that shaped preparatory
programs during this period.
One, a legacy from the 1960's, was the phenomenon of growth— both in the level of sophistication of preparatory programs and in the variety of content and activities comprising them. A second was the phenomenon of relevance— concern with the application and utilization,
Reproduced with permission of the copyright owner. Further reproduction prohibited without permission.
14rather than merely the production and dissemination, of knowledge, concern with assessment and accountability, and concern with performance and competence. The third basic phenomenon was that of democratization, reflected in efforts to open up access to preparation programs, to involve students in departmental decision making, and to increase flexibility and individualization in program determination, (p. 341)
What are doctoral programs in educational administration like
at the present? In 1975, the University Council for Educational
Administration (UCEA) sponsored a survey of preparatory programs in
educational administration throughout the United States. Silver and
Spuck (1978) described the typical 1975 doctoral student and the
program in educational administration as follows.
Departments of educational administration require an average of
82 hours beyond the baccalaureate degree for completion of the
doctorate. The typical doctoral program consists of course work,
some type of field experience, and a dissertation. One-half of the
departments surveyed required students to pass final comprehensive
exams. Slightly more than three-fifths of the programs emphasize
development of three major skill areas— conceptual, technical, and
human relations skills. Ninety-seven percent of the departments in
this study have some kind of residency requirement.
A profile of the typical doctoral student shows that a majority
are part-time students and are employed as teachers or administra
tors. Most of the students come from the surrounding geographic
region of the university they'are attending. At the time of this
study, one-quarter of the students were women and one-fifth were
minorities. One-half or more of the students were preparing
Reproduced with permission of the copyright owner. Further reproduction prohibited without permission.
15themselves for positions in public school administration. Less than
40% were interested in becoming university professors. Only about
20% were preparing to be researchers or administrators in higher
education or state, regional, and federal agencies.
This section traced the development of educational administra
tion as a profession and the growth of programs that prepare leaders
for our educational institutions. Historically, women have been
missing persons in the field of educational administration. Women
have been underrepresented both as administrators and as students in
preparatory programs. The next section will examine the status of
women in educational administration and will discuss the reasons for
the lack of women administrators.
Women in Educational Administration
The Status of Women in Educational Administration
Teaching has always been considered to be an ideal profession
for women. It was thought that they could do the job better than
men because they were more gentle, patient, loving, and nurturing
(Woody, 1966, Vol. 1). Also, women were preferred because they fit
the 19th century image of the teacher as one who would be subordi
nate and would "toe the line" as did the students (Tyack, 1974).
In 1878, Harpers reported that "women teachers are often preferred
by superintendents because they are more willing to comply with
established regulations and less likely to ride headstrong hobbies"
(cited in Biklen, 1980, p. 3). On the other hand, men were
Reproduced with permission of the copyright owner. Further reproduction prohibited without permission.
16considered to be more suitable candidates for leadership positions
in the schools. Thus, the trend of hiring female teachers and male
administrators developed.
This trend persists to this day, despite efforts to change it.
In fact, the percentage of women administrators in the public
schools has actually decreased in the past 30 years. In 1950, 12%
of the junior high and 6% of the senior high principalships and 9%
of the superintendencies were held by women as reported by Croft-NEI
(cited in McCarthy et al., 1979). In 1971, 21% of the elementary
and 3% of the secondary principalships and less than 1% of the super
intendencies were held by women. By 1975, women held only 18% of
the elementary and 2% of the secondary principalships and less than
1% of the superintendencies (National Council of Administrative
Women in Education, 1975).
The statistics are much the same in higher education. Accord
ing to a recent survey of women and minorities in administrative
positions, only 19.7% of administrators at U.S. colleges and univer
sities are women (College and University Personnel Association,
1981).
The higher one goes in the educational hierarchy, the fewer
women one will find. Whereas 67% of all. public school teachers are
women, only about 20% are principals and less than 1% hold the
superintendency. In higher education, the majority of women admin
istrators are concentrated in entry-level or middle-management posi
tions. A recent study by the College and University Personnel Asso
ciation (1981) shows that only 1.1% of the chief executive officers
Reproduced with permission of the copyright owner. Further reproduction prohibited without permission.
17in public white coeducational institutions of higher education are
women.
Women have also been underrepresented in preparatory programs
in educational administration. In 1971-72 the University Council
for Educational Administration estimated that only about 8% of the
students in educational administration were women. Although there
has been a phenomenal increase in the number of women pursuing
degrees in educational administration, women still comprise only
about one-third of the students in preparatory programs.
Reasons for the Lack of Women Administrators
What accounts for the relatively small proportion of women in
educational administration? There is no simple answer to this ques
tion; however, several recurring themes emerge from the literature.
Socialization. A large body of research explains the absence
of women from leadership positions as a result of the socialization
of females in our society. Women are socialized to be passive,
dependent, and noncompetitive. They are expected to play supportive
roles such as wife, mother, and secretary. The qualities desired in
top-level administrators are just the opposite— competition, inde
pendence, competency, intellectual achievement, and leadership.
These qualities are associated with masculinity. "This means that
for a woman to have a self-concept which incorporates the qualities
of leadership, she must come to terms with society's interpretation
that she is not feminine" (Nieboer, 1975, p. 101).
Reproduced with permission of the copyright owner. Further reproduction prohibited without permission.
18As a result of this early socialization, few women have aspired
to leadership positions. Horner (1969) found in her study of male
and female undergraduate students that women often avoid success
because they fear it will lead to negative consequences, such as
unpopularity and loss of femininity.
Marriage and family responsibilities. A second problem women
face is that of juggling a career with marriage and family responsi
bilities. In our society, women usually carry the major responsi
bility for homemaking and child rearing. This means that the
married career woman must be able to handle two jobs— one at home
and one in the workplace. On the other hand, the typical career man
is most often married to a traditional wife who manages the family
responsibilities while her husband concentrates fully on his career
(Hochschild, 1975).
Many women interrupt their careers in their 20s and early 30s
to raise a family. This is usually a crucial period for career
development. Hennig (1977), in her doctoral thesis, studied 25 women
in top business management positions in the United States. None of
these women married until they were at least 35 years old, long
after their careers had been firmly established.
Marriage also affects a woman's mobility. The husband's job
usually determines where a couple will live. The wife may not be
able to find suitable employment in that area. On the other hand,
the wife is sometimes forced to give up a good job because her
husband has been transferred or accepted a better position in
Reproduced with permission of the copyright owner. Further reproduction prohibited without permission.
19another location. In a recent survey of men and women administra
tors in Oregon, Schmuck (1975) confirmed that women were more place-
bound than men. Only four women in the study had served as adminis
trators in other districts, while all of the men had served in at
least two other school districts.
Lack of educational qualifications. A third reason given for
the underrepresentation of women in educational administration is
that they lack appropriate educational qualifications. Most admin
istrative positions require at least a master's degree. In 1962,
less than 16% of women had earned master's degrees while 40% of men
had. Men held four doctoral degrees in education to every one held
by a woman. Also, fewer women earned administrative credentials
(Taylor, 1970).
As indicated in Chapter I, this is changing. Although women
still do not earn as many advanced degrees as men, the percentage
of women who have completed master's and doctoral degrees has in
creased substantially in recent years. In 1977-78, 48.3% of all
master's degrees and 26.4% of all doctorates were awarded to women.
In the field of education, women completed 67% of master's degrees
and 38% of doctorates (National Center for Educational Statistics,
1980). In 1978, 29% of the doctorates in educational administration
were earned by women (National Research Council, 1978).
Women are ineffective leaders and administrators. Yet another
reason cited for the absence of women administrators is the belief
that women are ineffective leaders and administrators. Research on
Reproduced with permission of the copyright owner. Further reproduction prohibited without permission.
20the effectiveness of women administrators has focused primarily on
male and female school principals. Gross and Trask (1976) found
that the mean score on pupils' academic performance was higher in
schools with women principals than in schools with men principals.
However, other studies (Grobman & Hines, 1956; Hemphill, Griffiths,
& Frederickson, 1962; Hines & Grobman, 1955) showed no difference
between schools administered by men and women in pupil achievement
in math, reading, or language.
Women principals were found to be more competent in the area of
instructional supervision. In a study by Hemphill et al. (1962),
superiors rated women higher on knowledge of teaching methods and
techniques. Women principals tended to be more concerned with the
objectives of teaching, pupil participation, and evaluation of
learning. Gross and Trask (1976) indicated that women principals
themselves emphasized supervision of instruction and rated them
selves higher in this area than did men. Both studies attribute
women's competence in instructional supervision to the fact that
most women principals have had more years of teaching experience
than men principals.
In the area of administrative performance, the Florida Leader
ship Project (cited in Meskin, 1974) discovered that women princi
pals tended to use democratic practices and more effective adminis
trative practices more frequently than men principals. According to
Hemphill et al. (1962), women's administrative performance is char
acterized by exchanging information, maintaining organizational
relationships, and responding to outsiders; whereas the
Reproduced with permission of the copyright owner. Further reproduction prohibited without permission.
21administrative performance of men is characterized by complying with
suggestions made by others and analyzing the situation. This same
study showed that women tended to involve teachers, superiors, and
outsiders in their work while men more often made final decisions
and took action without involving others. Hoyle (1969) explored
differences in the ways men and women principals attack problems.
The results revealed that teachers describe women administrators as
noticing potential problem situations and as reviewing results of
action significantly more often than did male administrators. Gross
and Trask (1976) found, however, that the sex of the principal was
not related to teacher morale.
The research comparing male and female principals clearly dis
proves the belief that women are ineffective administrators. In
fact, it shows just the opposite. A quote from Hemphill et al.
(1962) summarizes the research in this area.
The evidence appears to favor women if the job of the principal is conceived in a way that values working with teachers and outsiders; being concerned with the objectives of teaching, pupil participation, and the evaluation of learning; having knowledge of teaching methods and techniques; and gaining positive reactions from teachers and superiors, (p. 334)
Discrimination. Last, but certainly not least, is the use of
discriminatory hiring and promotional practices by educational insti
tutions. Women often have difficulty finding out about administra
tive job openings. Palmieri and Shakeshaft (1976) described the
situation as follows:
They [women] are not in the job pool, so to speak, for administrative positions. In higher education, despite
Reproduced with permission of the copyright owner. Further reproduction prohibited without permission.
22affirmative action programs, the jobs are often filled before the ad appears. Men have an informal communication network via friends, male colleagues and social functions which informs them of possible job openings.Women do not have this same advantage unfortunately.(p. 62)
Even if a woman gains access to information about administra
tive job openings, she is likely to face discrimination in the
screening process and at the interview stage. Timpano and Knight
(1976), in their study of women administrators on Long Island, found
that search committees are almost exclusively male. Schmuck (1975)
also found this to be true when she reviewed the composition of
screening committees for administrators in urban school districts
over a 4-year period. She discovered that the committees, which
usually consist of six to eight members, were composed of all men in
about one-half of the cases. The other half of the committees had
only one or two women each. Schmuck believed that "male domination
of screening committees has a direct bearing on the chances of a
woman to receive a job" (p. 349).
Those women who do clear the hurdles just described and secure
administrative positions may experience differential treatment once
they are on the job. Several studies have been done on sex differ
ences in organizational experiences. Kanter (1977) believed that
opportunity, power, and the social composition of peer groups shape
the behavior of men and women in organizations. She argued that
when either males or females perceive a lack of opportunity they
limit their aspirations and seek satisfaction through interpersonal
relationships rather than task performance. Kanter said that when a
Reproduced with permission of the copyright owner. Further reproduction prohibited without permission.
23person is different from others in their peer group, they become
"tokens." The "token" is usually isolated from informal networks
and has few opportunities to be sponsored. Since there are so few
women administrators, they are often treated as "tokens."
Fennel (1978) believed that women lack adequate legitimacy to
seek incumbency of an authority role. She said:
The organizational authorities are actually less likely to back up the authority of a female incumbent in a leadership role than they would be to support a male incumbent. Furthermore, according to our line of thought, subordinates, whether male or female, would be less likely to accept directives and evaluations from a female incumbent in an authority position because, unless shown otherwise, they would assume she does not have the legitimacy necessary for these acts. (p. 601)
Characteristics of Women Administrators
Despite the odds against women in educational administration,
some women have made it into administrative positions. Much of the
research on women in educational administration has focused on suc
cessful women administrators. The following discussion will look
at what these studies say about the family background and education
of women administrators.
Hennig (1977), in her study of top women business executives,
discovered that 20 out of the 25 women interviewed were either
eldest or only children. Most studies of women administrators have
similar findings. Schlack (1974) found that the majority of both
middle and upper management women student personnel administrators
in her study were only children or had one sibling. A survey of
women in administrative positions in California community colleges
Reproduced with permission of the copyright owner. Further reproduction prohibited without permission.
24indicated that 73% were the only child or the eldest child in the
family. McGee (1979) found that approximately half of the women
college presidents that she surveyed were either only children or
had one sibling. Of these, 56% were first bora. The only study
producing different results was a survey by Morris (1982) comparing
women administrators with women teachers. She found that birth
order was not an important factor for either teachers or adminis
trators .
Looking at the data on parents1 employment, most studies indi
cated that women administrators were most likely to have had mothers
who were not employed during their childhood (Benedetti, 1975;
Gasser, 1976; McGee, 1979; Morris, 1982; Schlack, 1974). Benedetti
(1975), McGee (1979), and Schlack (1974) all found that the majority
of the fathers of women administrators were employed in either pro
fessional or managerial fields.
The results were mixed regarding the marital status of women
administrators. McGee (1979) and Pfiffner (1973) reported that the
majority of the women in their studies were married. However,
three other studies reported that about two-thirds of the women
administrators they surveyed were not married (Gardner, 1966; Gross
& Trask, 1976; Schlack, 1974). Most women administrators have small
families. Schlack (1974) reported that almost half of the middle
and upper management administrators in her study had no children,
while Benedetti (1975) found that 72% of her subjects had two chil
dren or less.
Reproduced with permission of the copyright owner. Further reproduction prohibited without permission.
The educational background of women administrators differs
according to the type and level of position they hold and the kind
of institution in which they are employed. Gross & Trask (1976)
compared the educational backgrounds of men and women elementary
principals. They found little difference between men and women
elementary principals in the level of degrees held. Eighty-five
percent of the women principals held master's degrees while 86% of
the men did. Only 3% of the women and 5% of the men principals
held doctorates. Nearly all of the elementary principals, both
men and women, received their graduate degrees in education, but the
men elementary principals had completed more hours in administration
than women principals. An NEA (1968) study confirmed this finding:
Men supervising principals showed more interest in "general school administration" than did the women supervising principals. . . . Women supervising principals, in contrast, showed more interest than the men principals in graduate study of "elementary school instruction" and of "elementary school supervision and curriculum." (p. 26)
Studies on women administrators in higher education show that
practically all of the women had at least a masters' degree (Gardner,
1966; McGee, 1979; Pfiffner, 1973; Schlack, 1974). The proportion
of women with doctorates increases with the level of responsibility,
as might be expected. According to Gasser (1976), less than one-
quarter of the lower level administrators had earned a doctorate.
Schlack (1974) reported that 12.2% of middle management and 19.5% of
the upper management student personnel administrators held doctor
ates. These women had pursued a wide variety of major fields.
Reproduced with permission of the copyright owner. Further reproduction prohibited without permission.
26In summary, the following profile of the typical woman adminis
trator emerges from the literature. She was born the eldest or only
child. Her mother was a housewife and her father was employed in a
professional or managerial field. If married, she has either no
children or two children. She holds a master's degree and probably
a doctorate if she is a top-level administrator or employed in
higher education.
The intent of the researcher, thus far, has been to familiarize
the reader with the field of educational administration and the re
search on women in this profession. Since the purpose of this dis
sertation is to investigate differences in the career aspirations,
job seeking patterns, and career patterns between men and women who
complete doctorates in educational administration, the next three
sections will review the literature specifically related to these
three variables. The first of these three sections will be a dis
cussion of career aspirations.
Career Aspirations
This section will present the findings of some comparative
studies on the career aspirations of men and women teachers, admin
istrators, and doctoral students in educational administration.
Teachers
Several studies have been conducted on the career aspirations
of teachers. Dias (1975) and Gross and Trask (1976) found that more
men teachers aspired to administrative positions than women teachers.
Reproduced with permission of the copyright owner. Further reproduction prohibited without permission.
27McMillan (1975) compared leadership aspirations of prospective men
and women teachers in a college of education at a large state uni
versity. The results showed that "among prospective women teachers,
the likelihood of accepting leadership in a school or educational
organization decreased as the level of responsibility increased"
(p. 324). Matheny (1973) and Wain (1976) found no difference in the
aspirations of men and women teachers. However, Metheny's (1973)
study indicated that a large percentage of the women thought they
would be discriminated against because of their sex and didn’t know
if they would be able to overcome the discrimination.
Ortiz (1982) suggested that the reason women public school
teachers do not aspire to administrative positions is that the
schools create an atmosphere which encourages men to advance within
the hierarchy while expecting women to remain in teaching. She
found that women who openly expressed a desire to become administra
tors often experienced difficulty in obtaining tenure.
Administrators
The research on career aspirations of administrators focuses on
public school administration. In a study of elementary principals
conducted by the NEA (1968), 50.2% of men supervising principals and
79.2% of women indicated that the elementary principalship was their
final occupational goal. Of those who did not consider the princi
palship their final occupational goal, more women chose elementary
classroom teaching or a position as a central office supervisor as
a final goal, while more men selected the position of superintendent.
Reproduced with permission of the copyright owner. Further reproduction prohibited without permission.
28Way (1976) found that a greater proportion of women public school
administrators aspired to be state/federal program specialists or
college instructors, whereas a greater proportion of men public
school administrators aspired to be superintendents. A study con
ducted for the Virginia Association of Elementary School Principals
(Seawell & Canady, 1974) discovered that male principals seemed to
see the principalship as a stepping stone to other positions in the
educational hierarchy.
Doctoral Students in Educational Administration
Kline and Munsterman (1976) compared experiences, competencies,
and employment desires of doctoral students in educational adminis
tration according to race and sex. They surveyed two hundred forty-
seven 1973-74 and 1974-75 doctoral students from UCEA member insti
tutions (University Council for Educational Administration). Stu
dents were asked to indicate their career preference from the follow
ing three categories— public school administration, higher education
administration, or professorship. No significant difference was
found, based on sex or race, in terms of what these students were
seeking to become professionally. However, there was a significant
difference between males and females regarding the type of position
desired at the K-12 public and private school level. Both white and
minority women indicated a higher preference for elementary princi
palships, while white males preferred secondary principalships. A
much larger percentage of males desired a position as superintendent.
Over 70% of white females preferred director or supervisory
Reproduced with permission of the copyright owner. Further reproduction prohibited without permission.
29positions in contrast to 35% in each of the other three groups
(white males, black females, and black males). White females also
indicated a greater desire to work in federal or state agencies or
regional service units.
A 1978 survey on the characteristics and attitudes of doctoral
students in educational administration suggests that differences
continue to exist in the career aspirations of male and female
doctoral students in the field. McCarthy et al. (1979) stated:
Most women do not have as much administrative experience as men. Consequently, when women finish the doctorate they are not likely to fare as well in competition with their male counterparts for positions in the shrinking pool of vacancies in building and central office administration. Therefore, women are probably turning to what have been in the past less popular types of positions, e.g., research/evaluation and "other" education-related work. (p. 203)
The research indicates that there is a difference in the career
aspirations of men and women in the field of educational administra
tion. These findings led the researcher to develop the following
two hypotheses.
Hypothesis 1 : There is a difference between men and women who
complete doctorates in educational administration in the kinds of
positions they desire at the time the doctorate is completed.
Hypothesis 2: There is a difference between men and women who
complete doctorates in educational administration in the kinds of
positions they desire as a final career goal.
Reproduced with permission of the copyright owner. Further reproduction prohibited without permission.
Job Seeking Patterns30
The researcher found only three studies that dealt specifically
with the job seeking process. The first study presented here is
concerned with networks. Much has been written about the "old boys'
network." Mills (1978) wrote her dissertation on the functioning of
informal networks in relation to the hiring process in higher educa
tion. Mills listed 15 methods that job seekers might use to learn
about job openings (p. 92). The first eight methods are labeled as
informal and the remaining seven methods are considered formal.
These methods are listed below:
Informal:
Graduate advisor
Other graduate professor
Chair/head of department
Graduate classmate
Undergraduate professor
Faculty colleague
Other professional friend
Other/informal
Formal:
College placement office
Unsolicited call or letter
Professional association advertisement
Convention placement service
Commercial teacher's agency
Reproduced with permission of the copyright owner. Further reproduction prohibited without permission.
31Other advertisement
Other/formal
Mills's (1978) conclusions supported the hypothesis that in
formal networks dominate the hiring process in higher education. In
comparing men and women, she found that both men and women used in
formal networks extensively. However, she discovered that men's use
was spread across the informal methods, while women's use was con
centrated in the two categories of chair/head of department and pro
fessional friends. The study also showed that women's use of in
formal networks is more intrainstitutional as opposed to inter-
institutional, As a result of reading this study, four hypotheses
were formulated.
Hypothesis 3 : Men who complete doctorates in educational admin
istration use more informal job seeking methods when looking for
their first job after completing the doctorate than women with the
same degree.
Hypothesis 4 : Women who complete doctorates in educational
administration use more formal job seeking methods when looking for
their first job after completing the doctorate than men with the
same degree.
Hypothesis 5 ; Men who complete doctorates in educational admin
istration use more informal job seeking methods when looking for
their present job than women with the same degree.
Hypothesis 6 : Women who complete doctorates in educational
administration use more formal job seeking methods when looking for
their present job than men with the same degree.
Reproduced with permission of the copyright owner. Further reproduction prohibited without permission.
32Leviton and Whitely (1981) compared the job seeking patterns of
female and male Ph.D. recipients who had received their degrees from
the University of Kansas during the 1975-76 academic year. Compari
sons were made on four job seeking measures: jobs heard about, jobs
applied for, interviews, and job offers. The results showed that
men reported more job possibilities over the various stages of the
job seeking process. In addition, the men reported applying for
significantly more jobs and received more job offers. Although the
job seeking patterns of men and women differed, the study found no
evidence of a sex difference in the quality of the jobs they actu
ally obtained.
The preceding study suggested the following six hypotheses.
Hypothesis 7: Men who complete doctorates in educational
administration apply for more jobs when looking for their first job
after completing the doctorate than women with the same degree.
Hypothesis 8: Men who complete doctorates in educational
administration apply for more jobs when looking for their present
job than women with the same degree.
Hypothesis 9: Men who complete doctorates in educational
administration obtain more job interviews following completion of
the doctorate than women with the same degree.
Hypothesis 10: Men who complete doctorates in educational
administration obtain more job interviews when looking for their
present job than women with the same degree.
Hypothesis 11: Men who complete doctorates in educational
administration receive more job offers following completion of the
Reproduced with permission of the copyright owner. Further reproduction prohibited without permission.
33doctorate than women with the same degree.
Hypothesis 12; Men who complete doctorates in educational
administration receive more job offers when looking for their pres
ent job than women with the same degree.
Eaton (1970) surveyed 80 women who earned their advanced
degrees in the field of educational administration from four
Michigan universities between 1965-1970 to determine what percentage
were actually working in administrative positions and why the rest
were not working as administrators. Eaton found that only about
one-third (32.3%) of the women respondents actually desired an ad
ministrative position when they entered this field. Thirty women
were not in administrative positions, 17 by choice. The other 13
wanted to work as administrators, but only three had actually
applied for an administrative position. This data caused the re
searcher to wonder whether women with doctorates in educational ad
ministration actually apply for administrative positions as fre
quently as men. Hypotheses 13 and 14 were developed to determine
the answer to this question.
Hypothesis 13: Men who complete doctorates in educational
administration apply for more administrative or management positions
following completion of the doctorate than women with the same
degree.
Hypothesis 14; Men who complete doctorates in educational ad
ministration apply for more administrative or management positions
when looking for their present job than women with the same degree.
Reproduced with permission of the copyright owner. Further reproduction prohibited without permission.
34Career Patterns
What does the literature show regarding differences in the
career patterns of men and women administrators? First, the career
patterns of public school administrators will be examined.
Public School Administrators■
According to a study conducted by the American Association of
School Administrators (1960), superintendents follow one of two
career patterns. The first is teacher/principal/central office ad
ministrator/superintendent in school districts with a population of
100,000 or more. The second pattern, found in smaller school dis
tricts, is teacher/principal/superintendent.
Both men and women administrators begin their careers as teach
ers. But, Gross and Trask (1976) found that males teach an average
of 5-7 years, while females teach 15 years before assuming their
first administrative position. Several studies (Gross & Trask,
1976; NEA, 1968; Way, 1976) confirm that women principals have more
years of teaching experience than men principals.
The first administrative appointment for most male teachers is
the principalship. Women tend to move from teaching into specialist
positions such as reading specialist or curriculum specialist
(Ortiz, 1982). Those women who are appointed to principalships
usually become elementary principals. Once they are in the princi
palship, women show less inclination to seek higher level positions.
As mentioned earlier, an NEA (1968) study of elementary principals
Reproduced with permission of the copyright owner. Further reproduction prohibited without permission.
35revealed that 79.2% of women supervising principals considered the
elementary principalship as their final occupational goal as com
pared to 50.2% of men supervising principals.
The studies cited above show that women administrators have had
more years of teaching experience, while men become administrators
earlier in their careers. These data led to the formulation of the
following three hypotheses.
Hypothesis 15: Men who complete doctorates in educational ad
ministration have had more years of administrative or management
experience prior to completing the doctorate than women with the
same degree.
Hypothesis 16; Women who complete doctorates in educational
administration have had more years of non-administrative/management
experience prior to completing the doctorate than men with the same
degree.
Higher Education Administration
According to Cohen and March (1974), the typical career pattern
for academic administrators in higher education is as shown in
Figure 1. How closely do women administrators follow this pattern?
Studies of top-level women college and university administrators
shed some light on their career patterns.
Freeman (1977) surveyed 27 top-level women administrators in
higher education from Washington, D.C. The women in this study were
either college presidents, vice presidents, administrative deans, or
deans. The following quotation describes their typical career path.
Reproduced with permission of the copyright owner. Further reproduction prohibited without permission.
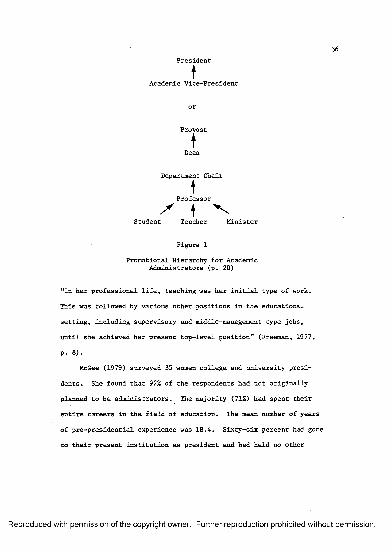
36Presidentt
Academic Vice-President
or
ProvosttDean
Department ChairtProfessor
Student Teacher Minister
Figure 1
Promotional Hierarchy for Academic Administrators (p. 20)
"In her professional life, teaching was her initial type of work.
This was followed by various other positions in the educational
setting, including supervisory and middle-management type jobs,
until she achieved her present top-level position" (Freeman, 1977,
p. 8).
McGee (1979) surveyed 35 women college and university presi
dents. She found that 92% of the respondents had not originally
planned to be administrators. The majority (71%) had spent their
entire careers in the field of education. The mean number of years
of pre-presidential experience was 18.4. Sixty-six percent had gone
to their present institution as president and had held no other
Reproduced with permission of the copyright owner. Further reproduction prohibited without permission.
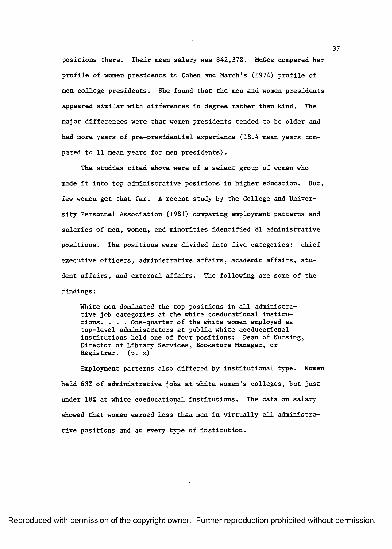
37positions there. Their mean salary was $42,378. McGee compared her
profile of women presidents to Cohen and March's (1974) profile of
men college presidents. She found that the men and women presidents
appeared similar with differences in degree rather than kind. The
major differences were that women presidents tended to be older and
had more years of pre-presidential experience (18.4 mean years com
pared to 11 mean years for men presidents).
The studies cited above were of a select group of women who
made it into top administrative positions in higher education. But,
few women get that far. A recent study by the College and Univer
sity Personnel Association (1981) comparing employment patterns and
salaries of men, women, and minorities identified 81 administrative
positions. The positions were divided into five categories: chief
executive officers, administrative affairs, academic affairs, stu
dent affairs, and external affairs. The following are some of the
findings:
White men dominated the top positions in all administrative job categories at the white coeducational institutions. . . . One-quarter of the white women employed as top-level administrators at public white coeducational institutions held one of four positions: Dean of Nursing,Director of Library Services, Bookstore Manager, or Registrar, (p. x)
Employment patterns also differed by institutional type. Women
held 63% of administrative jobs at white women's colleges, but just
under 18% at white coeducational institutions. The data on salary
showed that women earned less than men in virtually all administra
tive positions and at every type of institution.
Reproduced with permission of the copyright owner. Further reproduction prohibited without permission.
38Doctoral Recipients
Two major studies have been conducted on women doctorates. The
first, by Astin (1969), surveyed 1,958 women who had obtained the
doctorate in 1957 or 1958. Astin found that women doctorates were,
on the average, 2 years older than their male counterparts. The
women doctorates tended to come from upper-middle-class backgrounds
and their parents were much more highly educated than adults of
comparable ages in the general population. These women came from
small families. Only a little over one-half of the respondents were
married. Women doctorates tended to marry men of comparable educa
tional attainment and had smaller families than women in the general
population.
In the area of career development and work patterns, Astin
(1969) found that 91% of the women surveyed were in the labor force.
Of these, 81% were working full time. The majority of women doctor
ates were employed by academic institutions. Their primary work
function was teaching. The greatest obstacle to career development
was their inability to find adequate household help. "The second
biggest obstacle encountered by women doctorates was employer dis
crimination, primarily expressed in differential salaries for men
and women, and in promotion, seniority, and tenure policies based
on sex" (p. 148).
The second major study on women doctorates was conducted by
Centra (1974). Centra compared the current status and professional
development of 3,658 women and men doctorates matched according to
Reproduced with permission of the copyright owner. Further reproduction prohibited without permission.
39disciplines, the institutions they attended, and their year of
graduation. In the area of employment patterns, he found that women
were employed full time an average of 78% of the time since receiv
ing the doctorate compared to 95% for men. Centra found that more
women taught (57% vs. 46% for men), while more men were in adminis
tration and management (26% vs. 15% of the women). Two-thirds of
the men and 70% of the women were employed at four-year colleges
or universities.
According to Centra (1974), income differed considerably for
men and women even when the sexes were matched on years of full-time
experience, rank, and type of position. "Women's average income for
all types of employment varied from $16,400 for those with 5-6 years
of experience to $21,800 for those with 22-23 years; men’s varied
from $18,700 to $24,100 for the same lengths of experience" (p. 156).
The aforementioned studies on career patterns suggested three
additional hypotheses.
Hypothesis 17: There is a difference between men and women who
complete doctorates in educational administration in the types of
positions they have held since completing the doctorate.
Hypothesis 18: There is a difference between men and women who
complete doctorates in educational administration in the types of
institutions where they have been employed since completing the
doctorate.
Hypothesis 19; Men who complete doctorates in educational
administration earn more than women with the same degree.
Reproduced with permission of the copyright owner. Further reproduction prohibited without permission.
40As mentioned previously, Astin (1969) found that the women
doctorates in her study indicated that inability to find adequate
household help and employer discrimination were the greatest
obstacles to their career development. Way (1976) obtained similar
findings in her comparative study of men and women school adminis
trators. Way found that a greater proportion of the women school
administrators perceived discrimination because of sex as a con
straint than did the men school administrators. A greater propor
tion of the men school administrators indicated lack of training,
education, or experience as a constraint than did the women school
administrators. The results of these two studies led the researcher
to develop the following hypothesis.
Hypothesis 20: There is a difference between men and women who
complete doctorates in educational administration in the kinds of
constraints they perceive on their career progress.
The next two studies investigated sex differences in job place
ment of college graduates. The first study, conducted by the Com
mittee to Study the Status of Women in Graduate Education and Later
Careers at the University of Michigan (1974), looked at the place
ment of University of Michigan Ph.D. recipients for the 1971 and
1972 calendar years. The data were collected in March of the year
following graduation, so that degree recipients had a minimum of
3 months and a maximum of 11 months to find jobs.
These data show that among 1972 graduates, three times as many women as men were considered to be "unsatisfactorily placed," (i.e., designated as unemployed, underemployed, employed outside their own field, or of uncertain employment status by their departments), (p. 23)
Reproduced with permission of the copyright owner. Further reproduction prohibited without permission.
41The study indicated that married women graduates were at a greater
disadvantage in finding jobs than either single women or married men
graduates.
The second study on job placement was a survey of 1973 gradu
ates from the three campuses of the University of Illinois (Duff &
Parrish, 1977). The average graduate in this study had been out of
school 10 months at the time the survey was conducted. Data were
collected on unemployment, underemployment, job dissatisfaction,
relation of job to major, and salary for each degree level. At the
doctoral level, 1.4% of male doctorates were unemployed, whereas
5.7% of female doctorates were unemployed at the time the survey was
completed. The median salary for male doctorates was $15,200 as
compared to $13,100 for female doctorates. "The 1974 survey found
female college graduates at all degree levels clearly disadvantaged
in the labor market in comparison with male graduates" (Duff &
Parrish, 1977, p. 160).
Another study by Solomon, Kent, Ochsner, and Hurwicz (1981)
investigated underemployment among Ph.D.'s. These researchers sur
veyed a large sample of doctoral-level humanists employed in public
sector jobs. When comparing males and females, they found that
"female humanists employed in the public sector are significantly
less likely than are men to hold executive, managerial, administra
tive and supervisory positions and are more likely to be profession
als and research scientists" (Solomon et al., 1981, p. 128). This
study found that more women in the sample of government-employed
humanists considered themselves to be underemployed than did the men.
Reproduced with permission of the copyright owner. Further reproduction prohibited without permission.
42The following two hypotheses were developed based on the find
ings of the three previous studies.
Hypothesis 21: Women who complete doctorates in educational
administration have experienced more years of unemployment since
completing the doctorate than men with the same degree.
Hypothesis 22; A greater percentage of women who complete
doctorates in educational administration perceive themselves to be
underemployed than men with the same degree.
The final hypothesis is concerned with how satisfied doctoral
recipients in educational administration are with their career
progress. If there is a difference in the career aspirations, job
seeking patterns, and career patterns of men and women doctorates
in educational administration; then, there might also be a differ
ence between men and women in how satisfied they are with the
progress of their careers. Thus, the following hypothesis was
developed.
Hypothesis 23: There is a difference between men and women who
complete doctorates in educational administration in how satisfied
they are with their career progress.
Summary
The intent of Chapter II has been to familiarize the reader
with the literature related to this study. The research seems to
indicate that men and women differ in their career aspirations, job
seeking patterns, and career patterns. Few studies have been done
specifically on doctoral recipients in the field of educational
Reproduced with permission of the copyright owner. Further reproduction prohibited without permission.
43administration in relation to these three variables. The purpose of
this dissertation is to determine if there are differences in the
career aspirations, job seeking patterns, and career patterns of men
and women who complete doctorates in the field of educational admin
istration.
Chapter III will list the hypotheses and describe how this
study was conducted.
Reproduced with permission of the copyright owner. Further reproduction prohibited without permission.
CHAPTER III
DESIGN OF THE STUDY
The purpose of Chapter III is to describe the procedures used
to conduct this study. This chapter begins with a list of the
hypotheses, followed by a description of the population and sample,
the instrument, design and procedures, and the methods of data
analysis.
Research Questions and Hypotheses
The intent of this study was to determine if there are differ
ences in the career aspirations, job seeking patterns, and career
patterns of men and women who complete doctorates in the field of
educational administration. The following three research questions
were formulated by the researcher:
1. Do men and women who complete doctorates in educational
administration differ in their career aspirations?
2. Do men and women who complete doctorates in educational
administration differ in their job seeking patterns?
3. Do men and women who complete doctorates in educational
administration differ in their career patterns?
The next step was to develop specific hypotheses from the re
search questions. A total of 23 hypotheses were formulated by the
researcher. These hypotheses were derived from the literature
44
Reproduced with permission of the copyright owner. Further reproduction prohibited without permission.
45review as described in Chapter II. The hypotheses are listed below
under the three major areas investigated in this study.
Career Aspirations
1. There is a difference between men and women who complete
doctorates in educational administration in the kinds of positions
they desire at the time they complete the doctorate.
2. There is a difference between men and women who complete
doctorates in educational administration in the kinds of positions
they desire as a final career goal.
Job Seeking Patterns
3. Men who complete doctorates in educational administration
use more informal job seeking methods when looking for their first
job after completing the doctorate than women with the same degree.
4. Women who complete doctorates in educational administration
use more formal job seeking methods when looking for their first job
after completing the doctorate than men with the same degree.
5. Men who complete doctorates in educational administration
use more informal job seeking methods when looking for their present
job than women with the same degree.
6. Women who complete doctorates in educational administration
use more formal job seeking methods when looking for their present
job than men with the same degree.
7. Men who complete doctorates in educational administration
apply for more jobs when looking for their first job after
Reproduced with permission of the copyright owner. Further reproduction prohibited without permission.
46completing the doctorate than women with the same degree.
8. Men who complete doctorates in educational administration
apply for more jobs when looking for their present job than women
with the same degree.
9. Men who complete doctorates in educational administration
obtain more job interviews following completion of the doctorate
than women with the same degree.
10. Men who complete doctorates in educational administration
obtain more job interviews when looking for their present job than
women with the same degree.
11. Men who complete doctorates in educational administration
receive more job offers following completion of the doctorate than
women with the same degree.
12. Men who complete doctorates in educational administration
receive more job offers when looking for their present job than
women with the same degree.
13. Men who complete doctorates in educational administration
apply for more administrative or management positions following
completion of the doctorate than women with the same degree.
14. Men who complete doctorates in educational administration
apply for more administrative or management positions when looking
for their present job than women with the same degree.
Career Patterns
15. Men who complete doctorates in educational administration
have had more years of administrative or management experience prior
Reproduced with permission of the copyright owner. Further reproduction prohibited without permission.
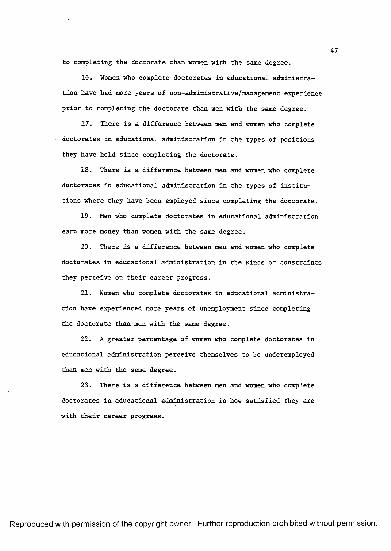
47to completing the doctorate than women with the same degree.
16. Women who complete doctorates in educational administra
tion have had more years of non-administrative/management experience
prior to completing the doctorate than men with the same degree.
17. There is a difference between men and women who complete
doctorates in educational administration in the types of positions
they have held since completing the doctorate.
18. There is a difference between men and women who complete
doctorates in educational administration in the types of institu
tions where they have been employed since completing the doctorate.
19. Men who complete doctorates in educational administration
earn more money than women with the same degree.
20. There is a difference between men and women who complete
doctorates in educational administration in the kinds of constraints
they perceive on their career progress.
21. Women who complete doctorates in educational administra
tion have experienced more years of unemployment since completing
the doctorate than men with the same degree.
22. A greater percentage of women who complete doctorates in
educational administration perceive themselves to be underemployed
than men with the same degree.
23. There is a difference between men and women who complete
doctorates in educational administration in how satisfied they are
with their career progress.
Reproduced with permission of the copyright owner. Further reproduction prohibited without permission.
48Population and Sample
Population
The population for this study consisted of all men and women
who received doctorates in educational administration or educational
leadership from universities in the Mid-American Conference (MAC)
during the calendar years of 1976 through 1980.
The Mid-American Conference is made up of 10 universities
located in four midwestern states (Illinois, Indiana, Michigan, and
Ohio). Although each university is unique, the MAC schools have
many similar characteristics. All are coeducational, state-
supported institutions. They are classified as regional univer
sities. According to a study by Dunham (1969), "the most salient
characteristics of state colleges and regional universities are
rapid change of function and astounding growth" (p. 1). All of the
Mid-American Conference universities began as state normal schools
whose sole purpose was to train teachers. They have moved along a
spectrum from single-purpose teachers' colleges to multipurpose
universities.
Each of the MAC universities has a large College of Education.
All of the schools except Central Michigan University and Eastern
Michigan University offer doctoral degrees in educational adminis
tration or educational leadership. The Mid-American Conference con
sists of the following institutions:
Ball State University— Muncie, Indiana
Bowling Green State University— Bowling Green, Ohio
Reproduced with permission of the copyright owner. Further reproduction prohibited without permission.
49Central Michigan University— Mt. Pleasant, Michigan
Eastern Michigan University— Ypsilanti, Michigan
Kent State University— Kent, Ohio
Miami University— Oxford, Ohio
Northern Illinois University— DeKalb, Illinois
Ohio University— Athens, Ohio
University of Toledo— Toledo, Ohio
Western Michigan University— Kalamazoo, Michigan
The decision to use the Mid-American Conference universities as
the population for this study was made for two reasons. First, the
Mid-American Conference schools represent a sizable group of col
leges in the Midwest that could provide an adequate population of
doctoral recipients in the field of educational administration for
this study.
Secondly, the Departments of Educational Administration at the
MAC schools appear to be "typical" of such departments across the
country. A recent study of Preparatory Programs for Educational
Administrators in the United States (Silver & Spuck, 1978) found
that three out of four programs in educational administration are in
public institutions. Therefore, the graduates from the MAC univer
sities should provide a representative sample of doctoral recipients
in educational administration in the Midwest.
Sample
The sample was selected from a list of doctoral recipients from
eight of the 10 Mid-American Conference universities. Central
Reproduced with permission of the copyright owner. Further reproduction prohibited without permission.
50Michigan University and Eastern Michigan University were not in
cluded in the study because neither school offers a doctoral degree
in educational administration. The first step was to contact the
chairperson of the Department of Educational Administration or
Educational Leadership at each of the eight universities. A letter
was sent to each department chairperson explaining the nature of the
study and asking if their department would be willing to participate
in the study. Several days after the letters were mailed, the
researcher followed up with a phone call to each department chair.
Those schools that agreed to participate were asked to supply the
researcher with a complete list of names, addresses, and phone num
bers of all graduates who had received doctorates in educational
administration or educational leadership for each of the following
calendar years: 1976, 1977, 1978, 1979, and 1980.
The list of names, addresses, and phone numbers from each uni
versity were organized by institution, year of graduation, and sex.
A stratified random sample was chosen from this list in the follow
ing manner. All of the women doctoral recipients from each institu
tion and for each year were included in the sample because only
about one-third of the total graduates were women. The same number
of men as women were selected from each institution using a random
table of numbers. Wherever possible, the men were matched with the
women from each institution by year of graduation. Individuals
without addresses and persons living in foreign countries were not
included in the sample. A sample of 236 subjects (118 men and 118
women) was chosen from a total population of 448 doctoral recipients.
Reproduced with permission of the copyright owner. Further reproduction prohibited without permission.
51Table 1 presents a breakdown of the number of graduates included in
the sample and the total population of doctoral recipients by insti
tution, year of graduation, and sex.
Instrument
The instrument used to collect data for this study was a mailed
questionnaire developed by the researcher. The decision to use a
mailed questionnaire rather than personal or telephone interviews
was based on several factors including the sample size, geographic
location of the subjects, the type of information needed, and ex
pense. The subjects in this study live in all parts of the United
States and abroad; therefore, it would have been virtually impos
sible to conduct personal interviews. Telephone interviews were
ruled out because of the expense involved in making such a large
number of long-distance phone calls. Thus, the mailed questionnaire
was selected as the most suitable instrument for this study.
The questionnaire consisted of 22 questions which were designed
to collect data in the following areas: demographic information,
career aspirations, job seeking patterns, and career patterns.
Three research questions and 23 hypotheses were derived from the
review of literature. An organizational chart (Appendix A) was then
developed listing the research questions, their corresponding
hypotheses, the information needed to test each hypothesis, and the
data analysis methods. This chart was used to develop the questions
on the questionnaire. The researcher attempted to keep the ques
tionnaire brief while making sure that all of the essential
Reproduced with permission of the copyright owner. Further reproduction prohibited without permission.
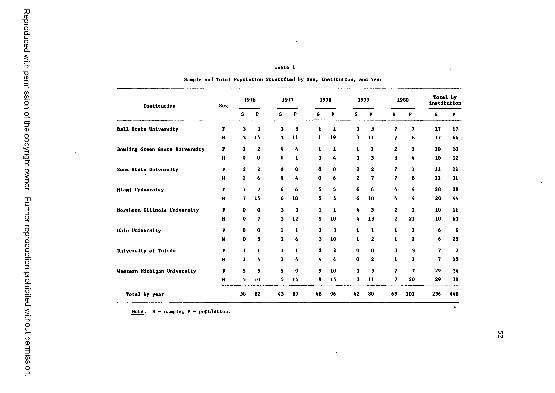
Reproduced
with perm
ission of the
copyright owner.
Further reproduction
prohibited w
ithout permission.
Sample and Total Population Stratified by Sex, Institution, and Year
Institution Sex1976
S P
1977
S P
1978
S P
1979
S P
1980
S P
Total by InstitutionS P
Ball State University F 3 3 3 3 1 1 3 3 7 7 17 17M 3 15 3 11 1 19 3 11 7 8 17 64
Bowling Green State University F 2 2 4 4 1 1 1 1 2 2 10 10M 0 0 1 1 3 4 3 3 3 4 10 12
Kent State Unlverolty F 2 2 0 0 0 0 2 2 7 7 11 11M 2 6 0 4 0 6 2 7 7 8 11 31
Miami University F 7 7 6 6 5 5 6 6 4 4 28 28M 7 15 6 10 5 5 6 10 4 4 28 44
Northern Illinois University F 0 0 3 3 1 1 4 5 10 11H 0 7 3 12 1 10 4 13 2 21 10 63
Ohio University F 0 0 1 1 3 3 1 1 1 1 6 6M 0 5 1 6 3 10 1 2 1 2 6 25
University of Toledo F 1 1 1 1 2 2 0 0 3 3 7 7M 1 4 1 4 4 4 0 2 1 1 7 15
Western Michigan University F S 5 5 9 9 10 3 3 7 7 29 34M 5 10 5 14 9 15 3 11 7 20 29 70
Total by year 38 82 43 89 48 96 42 80 65 101 236 448
Note. S - sample; P - population.
53information would be collected.
A pilot study was conducted to test face validity, clarity, and
understanding of the questionnaire. The questionnaire was dis
tributed to five men and five women who had received doctorates in
educational leadership from Western Michigan University but who were
not included in the larger study. These 10 people were selected for
the pilot test because they were similar to the population to be
studied and they all lived in or near Kalamazoo, Michigan, where
they could be easily contacted by the researcher. Each person was
asked to complete the questionnaire. They were also asked to indi
cate if any of the questions were unclear and to make suggestions
for improving the questionnaire. Nine of the 10 questionnaires were
completed and returned to the researcher. Revisions were made on
the instrument based on the comments and suggestions of the pilot
test group. The revised questionnaire (Appendix B) and a cover
letter (Appendix C) were reproduced by a commercial printer.
Design and Procedures
In an attempt to increase the response rate, the researcher
asked the chairperson from the Department of Educational Administra
tion or Educational Leadership at each participating university to
write a letter of endorsement (Appendix D). In these letters, the
department chairs endorsed the study and encouraged their respective
alumni to respond. Each subject received an endorsing letter signed
by the chairperson at the university from which they received their
degree. The letters of endorsement were included in the packet as
Reproduced with permission of the copyright owner. Further reproduction prohibited without permission.
54described in the next paragraph.
During the week of May 9, 1983, the questionnaires were mailed
to the 236 doctoral recipients in the sample. Each packet contained
a cover letter, an endorsing letter, a copy of the questionnaire,
and a self-addressed stamped envelope. The cover letter explained
the purpose of the study and emphasized the importance of each per
son's response. The subjects were assured that individual responses
would be kept strictly confidential. Each questionnaire was coded
for follow-up purposes.
On June 3, 1983, a follow-up letter (Appendix E) , a second
questionnaire, and another self-addressed stamped envelope were sent
to those who had not yet responded. Several weeks after the second
mailing, a postcard (Appendix F) was sent to the remaining non
respondents .
Analysis of Data
A codebook was developed by the researcher. As the completed
questionnaires were received, the data were coded onto optical scan
sheets. All of the optical scan sheets were then taken to Testing
Services at Western Michigan University where a data bank was
created. The data were analyzed using the Statistical Package for
the Social Sciences (SPSS).
First, frequency distributions were found for each variable.
In some cases, categories were collapsed or combined due to the
small number of responses for some items. Means, inodes, medians,
and standard deviations were also calculated for all of the
Reproduced with permission of the copyright owner. Further reproduction prohibited without permission.
55variables. Crosstabulations by sex were run for those variables at
the nominal level of measurement, and frequency tables were devel
oped.
Secondly, the hypotheses were tested. Hypotheses in which a
nominal scale of measurement was used to collect data were tested
using the chi-square test for inferences about the independence of
classifications in a contingency table or the Fisher exact probabil
ity test. The _t test for inferences about differences between popu
lation means was used to test the hypotheses in which interval data
were collected. (See Appendix A for a description of the exact data
analysis technique used to test each hypothesis.) The level of
significance for testing each hypothesis was .05. This meant that
there was a probability of .05 for committing a Type I error (alpha).
Summary
Chapter III has described the procedures used to conduct this
study. In summary, a stratified random sample of 118 females and
118 males was selected out of population of 448 doctoral recipients
in educational administration from eight Mid-American Conference
schools. A mailed questionnaire was used to collect data from the
subjects on career aspirations, job seeking patterns, and career
patterns. The data analysis techniques used to test the 23 hypothe
ses were described. Chapter IV will report the findings from this
study.
Reproduced with permission of the copyright owner. Further reproduction prohibited without permission.
CHAPTER IV
FINDINGS OF THE STUDY
This chapter will report the findings of the study concerning
the career aspirations, job seeking patterns, and career patterns of
men and women who complete doctorates in educational administration.
The first section will present information about the respondents
including the sample response rate and demographic information
describing the subjects. This will give the reader some background
information about the respondents. The second section reports the
results of the data analysis and hypothesis testing for the 23
hypotheses listed in Chapter III.
Information About the Respondents
Sample Response Rate
The sample used in this study consisted of 118 females and 118
males, or a total of 236 subjects. All of these subjects completed
doctorates in educational administration or educational leadership
between 1976 and 1980 at one of the eight Mid-American Conference
universities listed on pages 48 and 49. The entire population of
female graduates and a stratified random sample of male graduates
were included in the study.
A questionnaire was mailed to each of the 236 subjects. A
total of 200 questionnaires, or 85Z, were returned to the researcher.
56
Reproduced with permission of the copyright owner. Further reproduction prohibited without permission.
57The number of returned questionnaires that were usable was 183, or
78%. The 17 unusable questionnaires included 12 returned because of
wrong addresses, two unanswered questionnaires, and three from indi
viduals who indicated that they had completed their doctorates be
fore 1976. Of the 183 usable responses, 93 were females and 90 were
males. Table 2 contains the number of usable questionnaires re
turned from the graduates of each institution.
One of the problems associated with mailed questionnaires is
getting an adequate response rate. In this study, 15%, or 36, of
the questionnaires were not returned. Although this is not a large
percentage of nonrespondents, there is always the possibility that
the nonrespondents may differ significantly from the respondents and
the results based on the responses could be biased. The researcher
has no evidence to indicate that this is the case, but the reader
should be aware that this is one of the limitations of this study.
Demographic Information Describing the Subjects
Subjects were asked to respond to several informational ques
tions in the survey including age,-marital status, number of chil
dren, and the year of doctoral completion. The responses to these
questions are presented in this section.
Age breakdown. Table 3 shows the age breakdown for men and
women as well as for the group as a whole. The modal age group for
all of the respondents was 40-44. Over one-half (57%) of the sub
jects were between the ages of 35-44.
Reproduced with permission of the copyright owner. Further reproduction prohibited without permission.
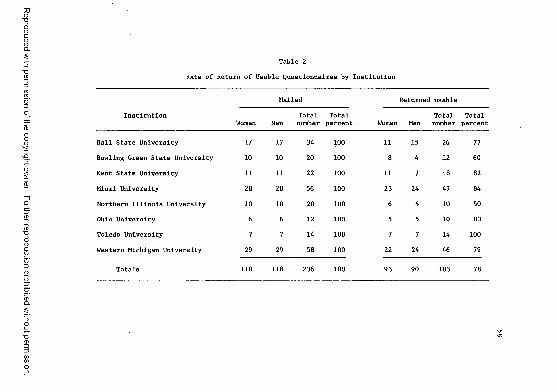
Reproduced
with perm
ission of the
copyright owner.
Further reproduction
prohibited w
ithout permission.
Table 2
Rate of Return of Usable Questionnaires by Institution
Institution
Mailed Returned usable
Women MenTotalnumber
Totalpercent Women Men
Totalnumber
Totalpercent
Ball State University 17 17 34 100 11 15 26 77
Bowling Green State University 10 10 20 100 8 4 12 60
Kent State University 11 11 22 100 11 7 18 82
Miami University 28 28 56 100 23 24 47 84
Northern Illinois University 10 10 20 100 6 4 10 50
Ohio University 6 6 12 100 5 5 10 83
Toledo University 7 7 14 100 7 7 14 100
Western Michigan University 29 29 58 100 22 24 46 79
Totals 118 118 236 100 93 90 183 78
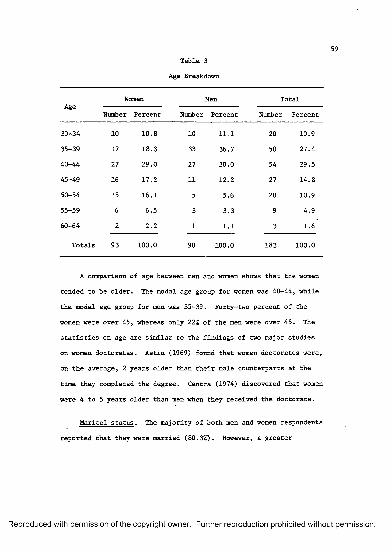
Table 3
Age Breakdown
AgeWomen Men Total
Number Percent Number Percent Number Percent
30-34 10 10.8 10 11.1 20 10.9
35-39 17 18.3 33 36.7 50 27.4
40-44 27 29.0 27 30.0 54 29.5
45-49 16 17.2 11 12.2 27 14.8
50-54 15 16.1 5 5.6 20 10.9
55-59 6 6.5 3 3.3 9 4.9
60-64 2 2.2 1 1.1 3 1.6
Totals 93 100.0 90 100.0 183 100.0
A comparison of age between men and women shows that the women
tended to be older. The modal age group for women was 40-44, while
the modal age group for men was 35-39. Forty-two percent of the
women were over 45, whereas only 22% of the men were over 45. The
statistics on age are similar to the findings of two major studies
on women doctorates. Astin (1969) found that women doctorates were,
on the average, 2 years older than their male counterparts at the
time they completed the degree. Centra (1974) discovered that women
were 4 to 5 years older than men when they received the doctorate.
Marital status. The majority of both men and women respondents
reported that they were married (80.3%). However, a greater
Reproduced with permission of the copyright owner. Further reproduction prohibited without permission.
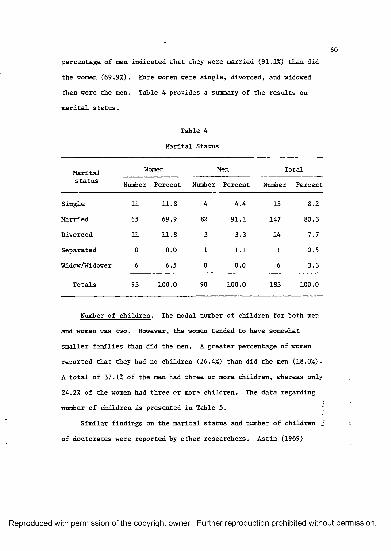
60percentage of men indicated that they were married (91.1%) than did
the women (69.9%). More women were single, divorced, and widowed
than were the men. Table 4 provides a summary of the results on
marital status.
Table 4
Marital Status
Maritalstatus
Women Men Total
Number Percent Number Percent Number Percent
Single 11 11.8 4 4.4 15 8.2
Married 65 69.9 82 91.1 147 80.3
Divorced 11 11.8 3 3.3 14 7.7
Separated 0 0.0 1 1.1 1 0.5
Widow/Widower 6 6.5 0 0.0 6 3.3
Totals 93 100.0 90 100.0 183 100.0
Number of children. The modal number of children for both men
and women was two. However, the women tended to have somewhat
smaller families than did the men. A greater percentage of women
reported that they had no children (26.4%) than did the men (18.0%).
A total of 37.1% of the men had three or more children, whereas only
24.2% of the women had three or more children. The data regarding
number of children is presented in Table 5. I
Similar findings on the marital status and number of children i
of doctorates were reported by other researchers. Astin (1969)
Reproduced with permission of the copyright owner. Further reproduction prohibited without permission.
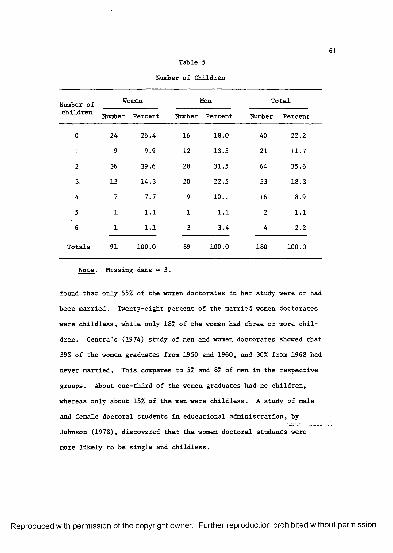
61Table 5
Number of Children
Number of Women Men Totalchildren Number Percent Number Percent Number Percent
0 24 26.4 16 18.0 40 22.2
1 9 9.9 12 13.5 21 11.7
2 36 39.6 28 31.5 64 35.6
3 13 14.3 20 22.5 33 18.3
4 7 7.7 9 10.1 16 8.9
5 1 1.1 1 1.1 2 1.1
6 1 1.1 3 3.4 4 2.2
Totals 91 100.0 89 100.0 180 100.0
Note. Missing data = 3.
found that only 55% of the women doctorates in her study were or had
been married. Twenty-eight percent of the married women doctorates
were childless, while only 18% of the women had three or more chil
dren. Centra's (1974) study of men and women doctorates showed that
39% of the women graduates from 1950 and 1960, and 30% from 1968 had
never married. This compares to 5% and 8% of men in the respective
groups. About one-third of the women graduates had no children,
whereas only about 15% of the men were childless. A study of male
and female doctoral students in educational administration, by
Johnson (1978), discovered that the women doctoral students were
more likely to be single and childless.
Reproduced with permission of the copyright owner. Further reproduction prohibited without permission.
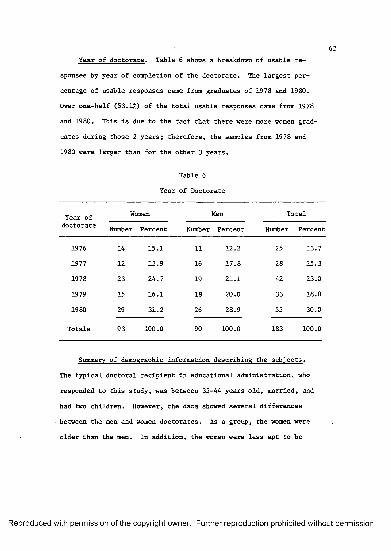
62Year of doctorate. Table 6 shows a breakdown of usable re
sponses by year of completion of the doctorate. The largest per
centage of usable responses came from graduates of 1978 and 1980.
Over one-half (53.1%) of the total usable responses came from 1978
and 1980. This is due to the fact that there were more women grad
uates during those 2 years; therefore, the samples from 1978 and
1980 were larger than for the other 3 years.
Table 6
Year of Doctorate
Year of doctorate
Women Men Total
Number Percent Number Percent Number Percent
1976 14 15.1 11 12.2 25 13.7
1977 12 12.9 16 17.8 28 15.3
1978 23 24.7 19 21.1 42 23.0
1979 15 16.1 18 20.0 33 18.0
1980 29 31.2 26 28.9 55 30.0
Totals 93 100.0 90 100.0 183 100.0
Summary of demographic information describing the subjects.
The typical doctoral recipient in educational administration, who
responded to this study, was between 35-44 years old, married, and
had two children. However, the data showed several differences
between the men and women doctorates. As a group, the women were
older than the men. In addition, the women were less apt to be
Reproduced with permission of the copyright owner. Further reproduction prohibited without permission.
63married and they had fewer children than their male counterparts.
Similar differences between male and female doctorates have been
reported by other researchers.
Presentation of the Results
The presentation of the results of this study is organized
around the 23 research hypotheses listed in the beginning of Chapter
III. These hypotheses provided a framework for contrasting and com
paring men and women doctoral recipients in educational administra
tion in regard to their career aspirations, job seeking patterns,
and career patterns. The following organizational scheme will be
utilized in discussing the results of the hypothesis testing:
1. Each research hypothesis will be formally stated.
2. The data utilized for testing the hypothesis and the tech
nique used to analyze the data will be discussed.
3. The results of the data analysis will be presented, includ
ing a discussion of the similarities and differences between men and
women doctorates in educational administration.
4. The results will be compared with the findings of other
related research that was presented in the review of literature.
Each hypothesis was tested using either the _t test for indepen
dent means, the chi-square test for independent samples, or the
Fisher exact probability test. The .05 level of significance was
used to test the null hypotheses.
Reproduced with permission of the copyright owner. Further reproduction prohibited without permission.
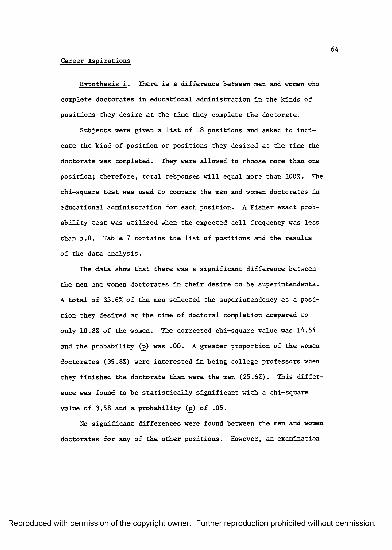
Career Aspirations
Hypothesis 1. There is a difference between men and women who
complete doctorates in educational administration in the kinds of
positions they desire at the time they complete the doctorate.
Subjects were given a list of 18 positions and asked to indi
cate the kind of position or positions they desired at the time the
doctorate was completed. They were allowed to choose more than one
position; therefore, total responses will equal more than 100%. The
chi-square test was used to compare the men and women doctorates in
educational administration for each position. A Fisher exact prob
ability test was utilized when the expected cell frequency was less
than 5.0. Table 7 contains the list of positions and the results
of the data analysis.
The data show that there was a significant difference between
the men and women doctorates in their desire to be superintendents.
A total of 35.6% of the men selected the superintendency as a posi
tion they desired at the time of doctoral completion compared to
only 10.8% of the women. The corrected chi-square value was 14.54
and the probability (p) was .00. A greater proportion of the women
doctorates (39.8%) were interested in being college professors when
they finished the doctorate than were the men (25.6%). This differ
ence was found to be statistically significant with a chi-square
value of 3.58 and a probability (p) of .05.
No significant differences were found between the men and women
doctorates for any of the other positions. However, an examination
Reproduced with permission of the copyright owner. Further reproduction prohibited without permission.
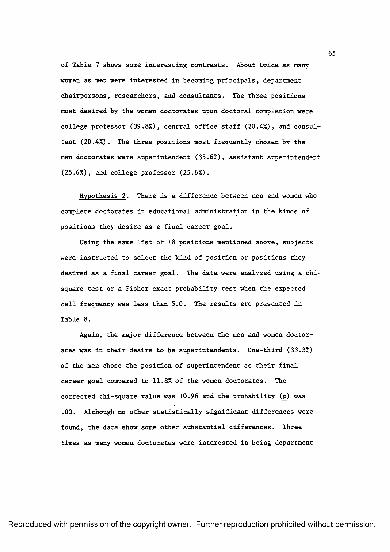
65of Table 7 shows some interesting contrasts. About twice as many
women as men were interested in becoming principals, department
chairpersons, researchers, and consultants. The three positions
most desired by the women doctorates upon doctoral completion were
college professor (39.8%), central office staff (20.4%), and consul
tant (20.4%). The three positions most frequently chosen by the
men doctorates were superintendent (35.6%), assistant superintendent
(25.6%), and college professor (25.6%).
Hypothesis 2 . There is a difference between men and women who
complete doctorates in educational administration in the kinds of
positions they desire as a final career goal.
Using the same list of 18 positions mentioned above, subjects
were instructed to select the kind of position or positions they
desired as a final career goal. The data were analyzed using a chi-
square test or a Fisher exact probability test when the expected
cell frequency was less than 5.0. The results are presented in
Table 8.
Again, the major difference between the men and women doctor
ates was in their desire to be superintendents. One-third (33.3%)
of the men chose the position of superintendent as their final
career goal compared to 11.8% of the women doctorates. The
corrected chi-square value was 10.96 and the probability Cp) was
.00. Although no other statistically significant differences were
found, the data show some other substantial differences. Three
times as many women doctorates were interested in being department
Reproduced with permission of the copyright owner. Further reproduction prohibited without permission.
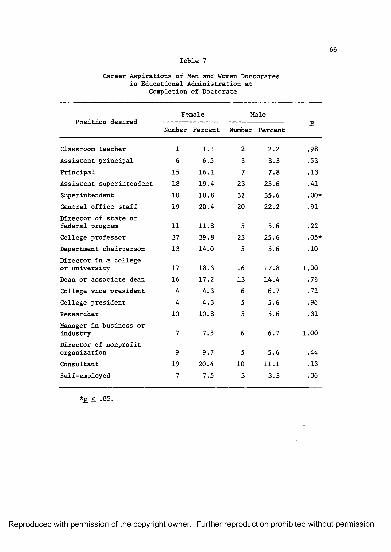
66Table 7
Career Aspirations of Men and Women Doctorates in Educational Administration at
Completion of Doctorate
Position desiredFemale Male
Number Percent Number Percent2.
Classroom teacher 1 1.1 2 2.2 .98Assistant principal 6 6.5 3 3.3 .53Principal 15 16.1 7 7.8 .13Assistant superintendent 18 19.4 23 25.6 .41Superintendent 10 10.8 32 35.6 .00*Central office staff 19 20.4 20 22.2 .91Director of state or federal program 11 11.8 5 5.6 .22College professor 37 39.8 23 25.6 .05*Department chairperson 13 14.0 5 5.6 .10Director in a college or university 17 18.3 16 17.8 1.00Dean or associate dean 16 17.2 13 14.4 .76College vice president 4 4.3 6 6.7 .71College president 4 4.3 5 5.6 .96Researcher 10 10.8 5 5.6 .31Manager in business or industry 7 7.5 6 6.7 1.00Director of nonprofit organization 9 9.7 5 5.6 .44Consultant 19 20.4 10 11.1 .13Self-employed 7 7.5 3 3.3 .36
tfcp _ Q2 _
Reproduced with permission of the copyright owner. Further reproduction prohibited without permission.
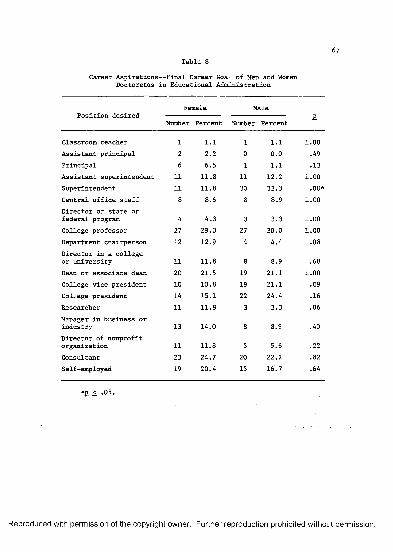
67Table 8
Career Aspirations— Final Career Goal of Men and Women Doctorates in Educational Administration
Female MalePosition desired
Number Percent Number Percent E.
Classroom teacher 1 1.1 1 1.1 1.00Assistant principal 2 2.2 0 0.0 .49Principal 6 6.5 1 1.1 .13Assistant superintendent 11 11.8 11 12.2 1.00Superintendent 11 11.8 30 33.3 .00*Central office staff 8 8.6 8 8.9 1.00Director of state or federal program 4 4.3 3 3.3 1.00College professor 27 29.0 27 30.0 1.00Department chairperson 12 12.9 4 4.4 .08Director in a college or university 11 11.8 8 8.9 .68Dean or associate dean 20 21.5 19 21.1 1.00College vice president 10 10.8 19 21.1 .09College president 14 15.1 22 24.4 .16Researcher 11 11.8 3 3.3 .06Manager in business or industry 13 14.0 8 8.9 .40Director of nonprofit organization 11 11.8 5 5.6 .22Consultant 23 24.7 20 22.2 .82Self-employed 19 20.4 15 16.7 .64
* £ < .05.
Reproduced with permission of the copyright owner. Further reproduction prohibited without permission.
68chairpersons and researchers, while a greater proportion of the men
doctorates wanted to be college vice presidents and presidents.
The three positions chosen most frequently by the women doctor
ates as a final career goal were college professor (29.0%), consul
tant (24.7%), and dean or associate dean (21.5%). The three posi
tions most desired by the men doctorates as a final career goal were
superintendent (33.3%), college professor (30.0%), and college presi
dent (24.4%).
How do these findings compare with the results of other studies
on the career aspirations of men and women in educational adminis
tration? In a study of men and women public school administrators,
Way (1976) found that a significantly greater proportion of women
school administrators aspired to be state/federal program special
ists and college instructors while a greater proportion of the men
school administrators aspired to be superintendents. Kline and
Munsterman (1976) found differences in the types of positions de
sired by men and women doctoral students in educational administra
tion at the K-12 level. They discovered that more women were inter
ested in the elementary principalship, while a much greater percent
age of men selected the secondary principalship and superintendency
as their desired choice.
Summary of results on career aspirations. Some statistically
significant differences were found in the career aspirations of the
men and women doctorates in educational administration. A signifi
cantly greater proportion of men doctorates aspired to the
Reproduced with permission of the copyright owner. Further reproduction prohibited without permission.
69superintendency, while more women doctorates were interested in be
coming college professors at the time they completed the doctorate.
When asked to indicate their final career goal, a significantly
greater proportion of men doctorates were still interested in becom
ing superintendents than the women doctorates. These findings are
similar to the results of several other studies on the career
aspirations of men and women in educational administration.
Job Seeking Patterns
One of the purposes of this study was to determine if men and
women who complete doctorates in educational administration differ
in their job seeking patterns. First, the subjects were asked if
they had looked for a job at the time they completed the doctorate
or at anytime since completing the doctorate. A total of 132 re
spondents answered "yes" to this question and 51 answered "no."
Respondents who answered "no" were instructed to skip the questions
on job seeking patterns. Data were collected from the remaining
respondents on job seeking methods, number of jobs applied for, and
number of interviews and job offers received both at the time of
doctoral completion and when looking for their present job.
Hypotheses 3 through 6 are concerned with job seeking methods.
The following procedure was used to gather the data and test these
four hypotheses. The doctoral recipients were given a list of 16
job seeking methods and asked to circle all the methods they used
when looking for their first job after completing the doctorate and
when seeking their present job. Tables 9 and 10 contain a list of
Reproduced with permission of the copyright owner. Further reproduction prohibited without permission.
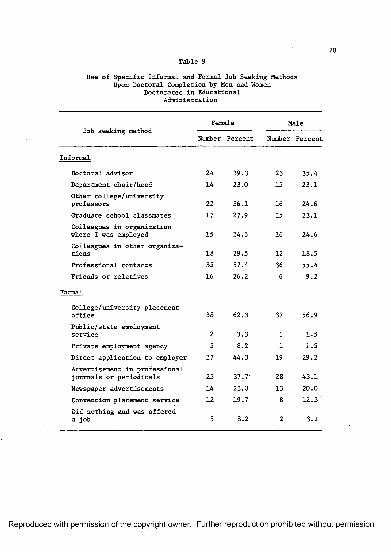
70Table 9
Use of Specific Informal and Formal Job Seeking Methods Upon Doctoral Completion by Men and Women
Doctorates in Educational Adminis tration
Job seeking methodFemale Male
Number Percent Number Percent
Informal
Doctoral advisor 24 39.3 23 35.4Department chair/head 14 23.0 15 23.1Other college/university professors 22 36.1 16 24.6Graduate school classmates 17 27.9 15 23.1Colleagues in organization where I was employed 15 24.6 16 24.6Colleagues in other organizations 18 29.5 12 18.5Professional contacts 35 57.4 36 55.4Friends or relatives 16 26.2 6 9.2
Formal
College/university placement office 38 62.3 37 56.9Public/state employment service 2 3.3 1 1.5Private employment agency 5 8.2 1 1.5Direct application to employer 27 44.3 19 29.2Advertisement in professional journals or periodicals 23 37.7 28 43.1Newspaper advertisements 14 23.0 13 20.0Convention placement service 12 19.7 8 12.3Did nothing and was offered a job 5 8.2 2 3.1
Reproduced with permission of the copyright owner. Further reproduction prohibited without permission.
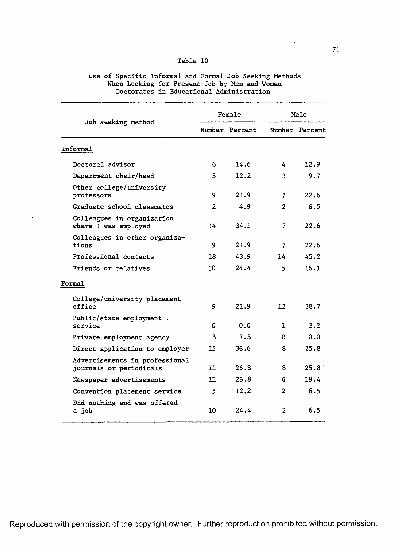
Table 10
Use of Specific Informal and Formal Job Seeking Methods When Looking for Present Job by Men and Women
Doctorates in Educational Administration
Job seeking methodFemale Male
Number Percent Number Percent
Informal
Doctoral advisor 6 14.6 4 12.9Department chair/head 5 12.2 3 9.7Other college/university professors 9 21.9 7 22.6Graduate school classmates 2 4.9 2 6.5Colleagues in organization where I was employed 14 34.1 7 22.6Colleagues in other organizations 9 21.9 7 22.6Professional contacts 18 43.9 14 45.2Friends or relatives 10 24.4 5 16.1
Formal
College/university placement office 9 21.9 12 38.7Public/state employment service 0 0.0 1 3.2Private employment agency 3 7.3 0 0.0Direct application to employer 15 36.6 8 25.8Advertisements in professional journals or periodicals 11 26.8 8 25.8Newspaper advertisements 11 26.8 6 19.4Convention placement service 5 12.2 2 6.5Did nothing and was offered a job 10 24.4 2 6.5
Reproduced with permission of the copyright owner. Further reproduction prohibited without permission.
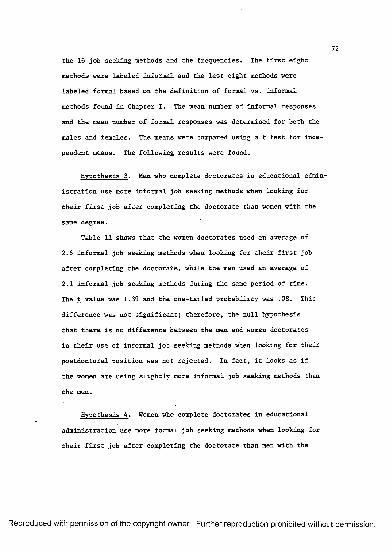
72the 16 job seeking methods and the frequencies. The first eight
methods were labeled informal and the last eight methods were
labeled formal based on the definition of formal vs. informal
methods found in Chapter I. The mean number of informal responses
and the mean number of formal responses was determined for both the
males and females. The means were compared using a _t test for inde
pendent means. The following results were found.
Hypothesis 3 . Men who complete doctorates in educational admin
istration use more informal job seeking methods when looking for
their first job after completing the doctorate than women with the
same degree.
Table 11 shows that the women doctorates used an average of
2.6 informal job seeking methods when looking for their first job
after completing the doctorate, while the men used an average of
2.1 informal job seeking methods during the same period of time.
The _t value was 1.39 and the one-tailed probability was .08. This
difference was not significant; therefore, the null hypothesis
that there is no difference between the men and women doctorates
in their use of informal job seeking methods when looking for their
postdoctoral position was not rejected. In fact, it looks as if
the women are using slightly more informal job seeking methods than
the men.
Hypothesis 4 . Women who complete doctorates in educational
administration use more formal job seeking methods when looking for
their first job after completing the doctorate than men with the
Reproduced with permission of the copyright owner. Further reproduction prohibited without permission.
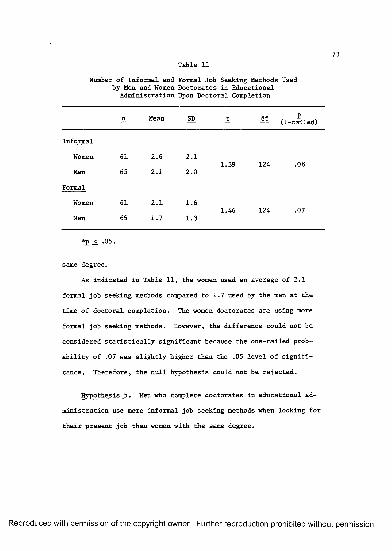
73Table 11
Number of Informal and Formal Job Seeking Methods Used by Men and Women Doctorates in Educational
Administration Upon Doctoral Completion
n Mean SD _t df 2.(1-tailed)
Informal
Women 61 2.6 2.11.39 124 .08
Men 65 2.1 2.0
Formal
Women 61 2.1 1.61.46 124 .07
Men 65 1.7 1.3
* £ < .05.
same degree.
As indicated in Table 11, the women used an average of 2.1
formal job seeking methods compared to 1.7 used by the men at the
time of doctoral completion. The women doctorates are using more
formal job seeking methods. However, the difference could not be
considered statistically significant because the one-tailed prob- .
ability of .07 was slightly higher than the .05 level of signifi
cance. Therefore, the null hypothesis could not be rejected.
Hypothesis 5 . Men who complete doctorates in educational ad
ministration use more informal job seeking methods when looking for
their present job than women with the same degree.
Reproduced with permission of the copyright owner. Further reproduction prohibited without permission.
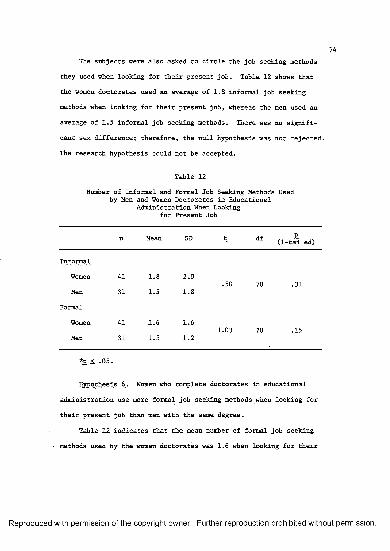
74The subjects were also asked to circle the job seeking methods
they used when looking for their present job. Table 12 shows that
the women doctorates used an average of 1.8 informal job seeking
methods when looking for their present job, whereas the men used an
average of 1.5 informal job seeking methods. There was no signifi
cant sex difference; therefore, the null hypothesis was not rejected.
The research hypothesis could not be accepted.
Table 12
Number of Informal and Formal Job Seeking Methods Used by Men and Women Doctorates in Educational
Administration When Looking for Present Job
n Mean SD t df -2- — (1-tailed)
Informal
Women 41 1.8 2.0.50 70 .31
Men 31 1.5 1.8
Formal
Women 41 1.6 1.61.03 70 .15
Men 31 1.3 1.2
*£ <. .05.
Hypothesis 6 . Women who complete doctorates in educational
administration use more formal job seeking methods when looking for
their present job than men with the same degree.
Table 12 indicates that the mean number of formal job seeking
• methods used by the women doctorates was 1.6 when looking for their
Reproduced with permission of the copyright owner. Further reproduction prohibited without permission.
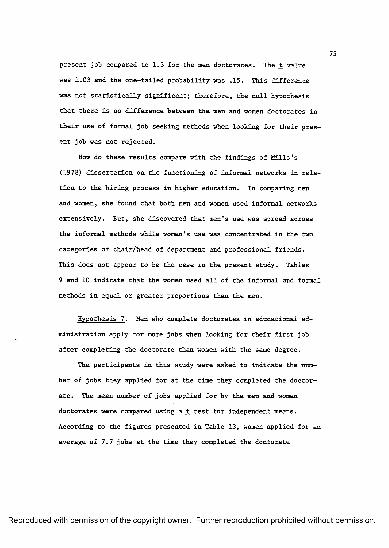
75present job compared to 1.3 for the men doctorates. The j: value
was 1.03 and the one-tailed probability was .15. This difference
was not statistically significant; therefore, the null hypothesis
that there is no difference between the men and women doctorates in
their use of formal job seeking methods when looking for their pres
ent job was not rejected.
How do these results compare with the findings of Mills's
(1978) dissertation on the functioning of informal networks in rela
tion to the hiring process in higher education. In comparing men
and women, she found that both men and women used informal networks
extensively. But, she discovered that men's use was spread across
the informal methods while women's use was concentrated in the two
categories of chair/head of department and professional friends.
This does not appear to be the case in the present study. Tables
9 and 10 indicate that the women used all of the informal and formal
methods in equal or greater proportions than the men.
Hypothesis 7. Men who complete doctorates in educational ad
ministration apply for more jobs when looking for their first job
after completing the doctorate than women with the same degree.
The participants in this study were asked to indicate the num
ber of jobs they applied for at the time they completed the doctor
ate. The mean number of jobs applied for by the men and women
doctorates were compared using a _t test for independent means.
According to the figures presented in Table 13, women applied for an
average of 7.7 jobs at the time they completed the doctorate
Reproduced with permission of the copyright owner. Further reproduction prohibited without permission.
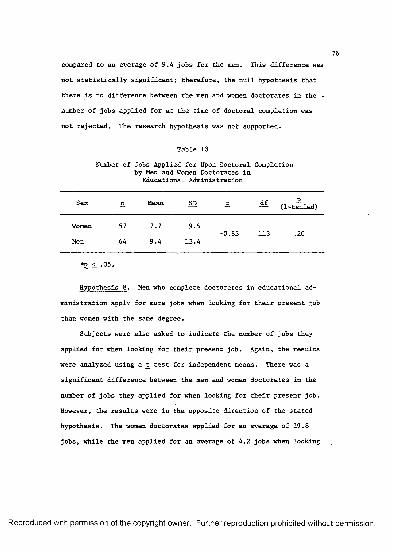
76compared to an average of 9.4 jobs for the men. This difference was
not statistically significant; therefore, the null hypothesis that
there is no difference between the men and women doctorates in the .
number of jobs applied for at the time of doctoral completion was
not rejected. The research hypothesis was not supported.
Table 13
Number of Jobs Applied for Upon Doctoral Completion by Men and Women Doctorates in
Educational Administration
Sex n Mean SD _t df £(1-tailed)
Women 57 7.7 9.5-0.83 113 .20
Men 64 9.4 13.4
*£ <. .05.
Hypothesis 8 . Men who complete doctorates in educational ad
ministration apply for more jobs when looking for their present job
than women with the same degree.
Subjects were also asked to indicate the number of jobs they
applied for when looking for their present job. Again, the results
were analyzed using a _t test for independent means. There was a
significant difference between the men and women doctorates in the
number of jobs they applied for when looking for their present job.
However, the results were in the opposite direction of the stated
hypothesis. The women doctorates applied for an average of 19.8
jobs, while the men applied for an average of 4.2 jobs when looking
Reproduced with permission of the copyright owner. Further reproduction prohibited without permission.
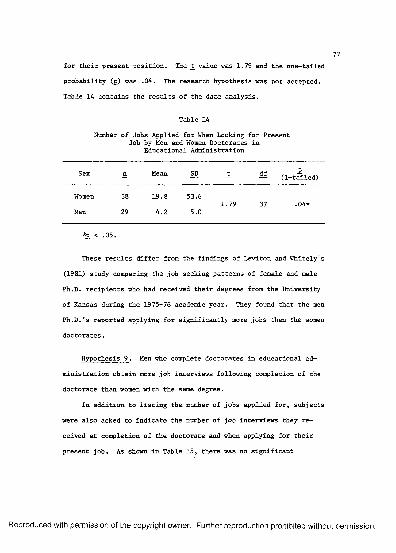
77for their present position. The _t value was 1.79 and the one-tailed
probability (jg) was .04. The research hypothesis was not accepted.
Table 14 contains the results of the data analysis.
Table 14
Number of Jobs Applied for When Looking for Present Job by Men and Women Doctorates in
Educational Administration
Sex n Mean SD t df £(1-tailed)
Women 38 19.8 53.61.79 37 .04*
Men 29 4.2 5.0
*£ <. .05.
These results differ from the findings of Leviton and Whitely's
(1981) study comparing the job seeking patterns of female and male
Ph.D. recipients who had received their degrees from the University
of Kansas during the 1975-76 academic year. They found that the men
Ph.D.’s reported applying for significantly more jobs than the women
doctorates.
Hypothesis 9 . Men who complete doctorates in educational ad
ministration obtain more job interviews following completion of the
doctorate than women with the same degree.
In addition to listing the number of jobs applied for, subjects
were also asked to indicate the number of job interviews they re
ceived at completion of the doctorate and when applying for their
present job. As shown in Table 15, there was no significant
Reproduced with permission of the copyright owner. Further reproduction prohibited without permission.
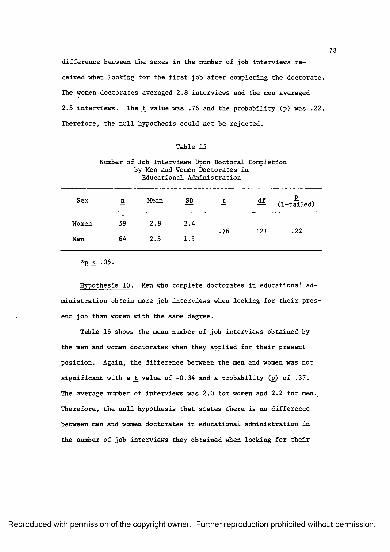
78difference between the sexes in the number of job interviews re
ceived when looking for the first job after completing the doctorate.
The women doctorates averaged 2.8 interviews and the men averaged
2.5 interviews. The _t value was .76 and the probability (_p) was .22.
Therefore, the null hypothesis could not be rejected.
Table 15
Number of Job Interviews Upon Doctoral Completion by Men and Women Doctorates in
Educational Administration
Sex S Mean SD _t df 2(1-tailed)
Women 59 2.8 2.4.76 121 .22
Men 64 ' 2.5 1.9
*£ <. .05.
Hypothesis 10. Men who complete doctorates in educational ad
ministration obtain more job interviews when looking for their pres
ent job than women with the same degree.
Table 16 shows the mean number of job interviews obtained by
the men and women doctorates when they applied for their present
position. Again, the difference between the men and women was not
significant with a _t value of -0.34 and a probability (jj) of .37.
The average number of interviews was 2.0 for women and 2.2 for men.
Therefore, the null hypothesis that states there is no difference
between men and women doctorates in educational administration in
the number of job interviews they obtained when looking for their
Reproduced with permission of the copyright owner. Further reproduction prohibited without permission.
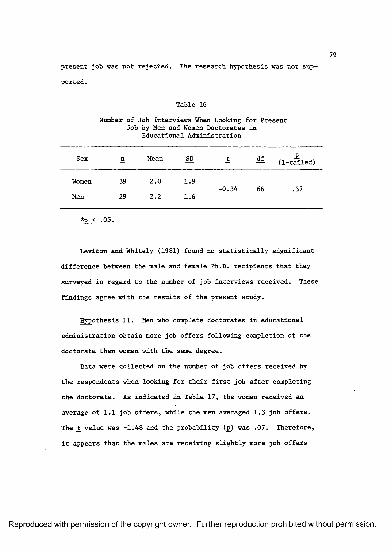
79present job was not rejected. The research hypothesis was not sup
ported .
Table 16
Number of Job Interviews When Looking for Present Job by Men and Women Doctorates in
Educational Administration
Sex n Mean SD df £(1-tailed)
Women 39 2.0 1.9-0.34 66 .37
Men 29 2.2 1.6
*£j< .05.
Leviton and Whitely (1981) found no statistically significant
difference between the male and female Ph.D. recipients that they
surveyed in regard to the number of job interviews received. These
findings agree with the results of the present study.
Hypothesis 11. Men who complete doctorates in educational
administration obtain more job offers following completion of the
doctorate than women with the same degree.
Data were collected on the number of job offers received by
the respondents when looking for their first job after completing
the doctorate. As indicated in Table 17, the women received an
average of 1.1 job offers, while the men averaged 1.3 job offers.
The £ value was -1.48 and the probability (p) was .07. Therefore,
it appears that the males are receiving slightly more job offers
Reproduced with permission of the copyright owner. Further reproduction prohibited without permission.
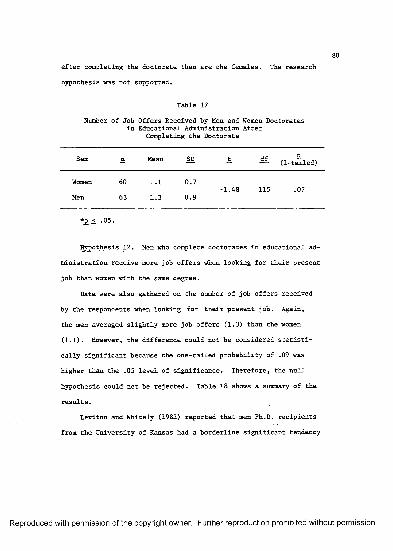
after completing the doctorate than are the females. The research
hypothesis was not supported.
Table 17
Number of Job Offers Received by Men and Women Doctorates in Educational Administration After
Completing the Doctorate
Sex n Mean SD _t df R(1-tailed)
Women 60 1.1 0.7-1.48 115 .07
Men 63 1.3 0.9
*£ < .05.
Hypothesis 12. Men who complete doctorates in educational ad
ministration receive more job offers when looking for their present
job than women with the same degree.
Data were also gathered on the number of job offers received
by the respondents when looking for their present job. Again,
the men averaged slightly more job offers (1.3) than the women
(1.1). However, the difference could not be considered statisti
cally significant because the one-tailed probability of .09 was
higher than the .05 level of significance. Therefore, the null
hypothesis could not be rejected. Table 18 shows a summary of the
results.
Leviton and Whitely (1981) reported that men Ph.D. recipients
from the University of Kansas had a borderline significant tendency
Reproduced with permission of the copyright owner. Further reproduction prohibited without permission.
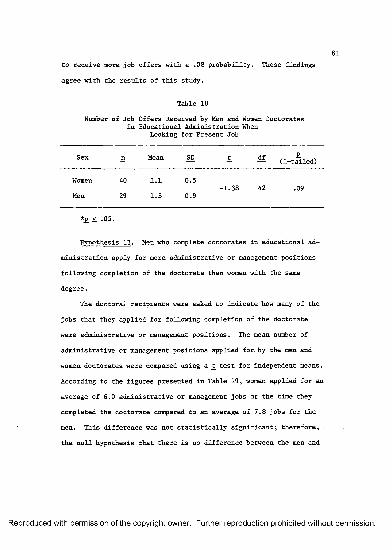
81to receive more job offers with a .08 probability. These findings
agree with the results of this study.
Table 18
Number of Job Offers Received by Men and Women Doctorates in Educational Administration When
Looking for Present Job
Sex n Mean SD t df £(1-tailed)
Women 40 1.1 0.5-1.38 42 .09
Men 29 1.3 0.9
*R ± *05.
Hypothesis 13. Men who complete doctorates in educational ad
ministration apply for more administrative or management positions
following completion of the doctorate than women with the same
degree.
The doctoral recipients were asked to indicate how many of the
jobs that they applied for following completion of the doctorate
were administrative or management positions. The mean number of
administrative or management positions applied for. by the men and
women doctorates were compared using a _t test for independent means.
According to the figures presented in Table 19, women applied for an
average of 6.0 administrative or management jobs at the time they
completed the doctorate compared to an average of 7.8 jobs for the
men. This difference was not statistically significant; therefore,
the null hypothesis that there is no difference between the men and
Reproduced with permission of the copyright owner. Further reproduction prohibited without permission.
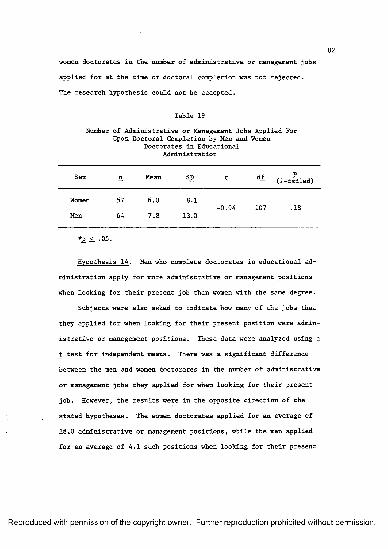
women doctorates in the number of administrative or management jobs
applied for at the time of doctoral completion was not rejected.
The research hypothesis could not be accepted.
Table 19
Number of Administrative or Management Jobs Applied For Upon Doctoral Completion by Men and Women
Doctorates in Educational Administration
Sex n Mean SD .t df £(1-tailed)
Women 57 6.0 8.1-0.94 107 .18
Men 64 7.8 13.0
*£ <. .05.
Hypothesis 14. Men who complete doctorates in educational ad
ministration apply for more administrative or management positions
when looking for their present job than women with the same degree.
Subjects were also asked to indicate how many of the jobs that
they applied for when looking for their present position were admin
istrative or management positions. These data were analyzed using a
t_ test for independent means. There was a significant difference
between the men and women doctorates in the number of administrative
or management jobs they applied for when looking for their present
job. However, the results were in the opposite direction of the
stated hypotheses. The women doctorates applied for an average of
18.0 administrative or management positions, while the men applied
for an average of 4.1 such positions when looking for their present
Reproduced with permission of the copyright owner. Further reproduction prohibited without permission.
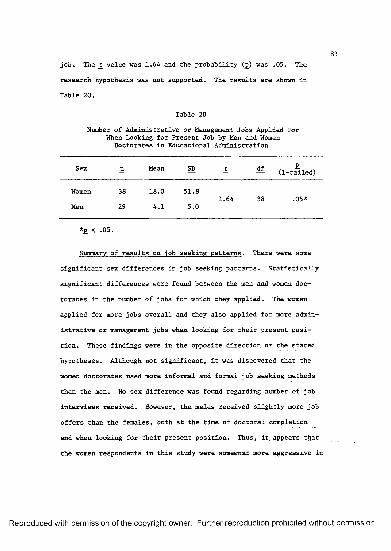
83job. The _t value was 1.64 and the probability (jg) was .05. The
research hypothesis was not supported. The results are shown in
Table 20.
Table 20
Number of Administrative or Management Jobs Applied For When Looking for Present Job by Men and Women
Doctorates in Educational Administration
Sex n Mean SD _t df £(1-tailed)
Women 38 18.0 51.81.64 38 .05*
Men 29 4.1 5.0
*£ <. *05.
Summary of results on job seeking patterns. There were some
significant sex differences in job seeking patterns. Statistically
significant differences were found between the men and women doc
torates in the number of jobs for which they applied. The women
applied for more jobs overall and they also applied for more admin
istrative or management jobs when looking for their present posi
tion. These findings were in the opposite direction of the stated
hypotheses. Although not significant, it was discovered that the
women doctorates used more informal and formal job seeking methods
than the men. No sex difference was found regarding number of job
interviews received. However,' the males received slightly more job
offers than the females, both at the time of doctoral completion
and when looking for their present position. Thus, it, appears that
the women respondents in this study were somewhat more aggressive in
Reproduced with permission of the copyright owner. Further reproduction prohibited without permission.
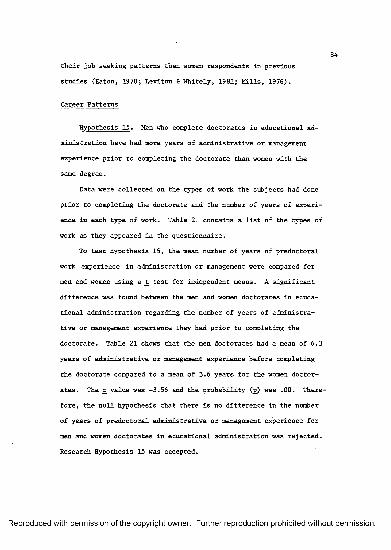
84their job seeking patterns than women respondents in previous
studies (Eaton, 1970; Leviton & Whitely, 1981; Mills, 1976).
Career Patterns
Hypothesis 15. Men who complete doctorates in educational ad
ministration have had more years of administrative or management
experience prior to completing the doctorate than women with the
same degree.
Data were collected on the types of work the subjects had done
prior to completing the doctorate and the number of years of experi
ence in each type of work. Table 21 contains a list of the types of
work as they appeared in the questionnaire.
To test Hypothesis 15, the mean number of years of predoctoral
work experience in administration or management were compared for
men and women using a _t test for independent means. A significant
difference was found between the men and women doctorates in educa
tional administration regarding the number of years of administra
tive or management experience they had prior to completing the
doctorate. Table 21 shows that the men doctorates had a mean of 6.3
years of administrative or management experience before completing
the doctorate compared to a mean of 3.6 years for the women doctor
ates. The _t value was -3.56 and the probability Cg) was .00. There
fore, the null hypothesis that there is no difference in the number
of years of predoctoral administrative or management experience for
men and women doctorates in educational administration was rejected.
Research Hypothesis 15 was accepted.
Reproduced with permission of the copyright owner. Further reproduction prohibited without permission.
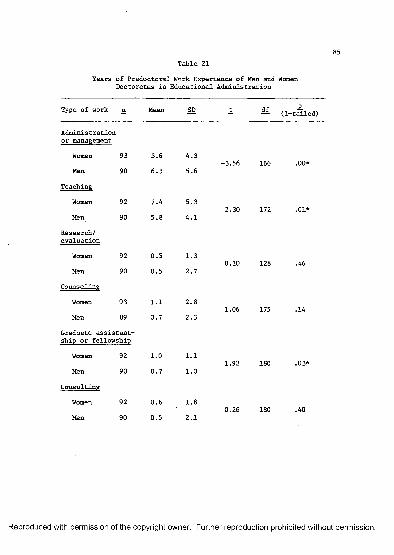
85
Years of Predoctoral Work Experience of Men and Women Doctorates in Educational Administration
Type of work n Mean SD _t df (]_talled)
Administration or management
Women 93 3.6 4.3-3.56 166 .00*
Men 90 6.3 5.6
Teaching
Women 92 7.4 5.32.30 172 .01*
Men 90 5.8 4.1
Research/evaluation
Women 92 0.5 1.30.10 128 .46
Men 90 0.5 2.7
Co tinseling
Women 93 1.1 2.81.06 175 .14
Men 89 0.7 2.3
Graduate assistant- ship or fellowship
Women 92 1.0 1.11.92 180 .03*
Men 90 0.7 1.0
Consulting
Women 92 0.6 1.80.26 180 .40
Men 90 0.5 2.1
Reproduced with permission of the copyright owner. Further reproduction prohibited without permission.
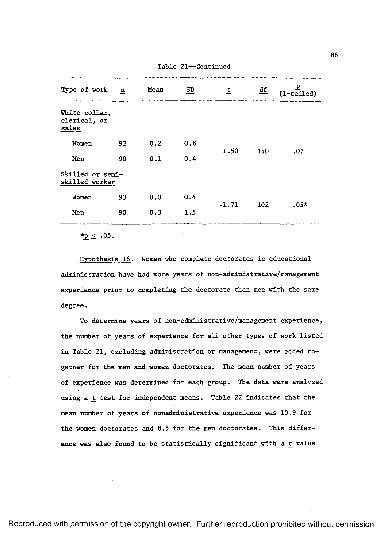
Table 21— Continued
Type of work _n Mean SD _t df £(1-tailed)
White collar, clerical, or sales
Women 93
Men 90
0.2
0.1
0.8
0.41.50 140 .07
Skilled or semiskilled worker
Women 93
Men 90
0.0
0.3
0.4
1.5-1.71 102 .05*
*£ < .05.
Hypothesis 16. Women who complete doctorates in educational
administration have had more years of non-administrative/management
experience prior to completing the doctorate than men with the same
degree.
To determine years of non-administrative/management experience,
the number of years of experience for all other types of work listed
in Table 21, excluding administration or management, were added to
gether for the men and women doctorates. The mean number of years
of experience was determined for each group. The data were analyzed
using a _t test for independent means. Table 22 indicates that the
mean number of years of nonadministrative experience was 10.9 for
the women doctorates and 8.5 for the men doctorates. This differ
ence was also found to be statistically significant with a _t value
Reproduced with permission of the copyright owner. Further reproduction prohibited without permission.
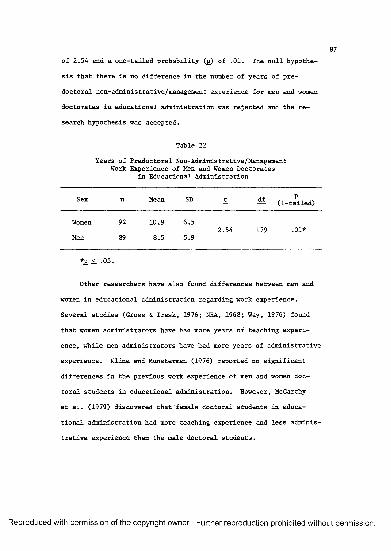
of 2.54 and a one-tailed probability (_g) of .01. The null hypothe
sis that there is no difference in the number of years of pre
doctoral non-administrative/management experience for men and women
doctorates in educational administration was rejected and the re
search hypothesis was accepted.
Table 22
Years of Predoctoral Non-Administrative/Management Work Experience of Men and Women Doctorates
in Educational Administration
Sex ii Mean SD t df 2.(1-tailed)
Women 92 10.9 6.52.54 179 .01*
Men 89 8.5 5.9
*£ <. .05.
Other researchers have also found differences between men and
women in educational administration regarding work experience.
Several studies (Gross & Trask, 1976; NEA, 1968; Way, 1976) found
that women administrators have had more years of teaching experi
ence, while men administrators have had more years of administrative
experience. Kline and Munsterman (1976) reported no significant
differences in the previous work experience of men and women doc
toral students in educational administration. However, McCarthy
et al. (1979) discovered that'female doctoral students in educa
tional administration had more teaching experience and less adminis
trative experience than the male doctoral students.
Reproduced with permission of the copyright owner. Further reproduction prohibited without permission.
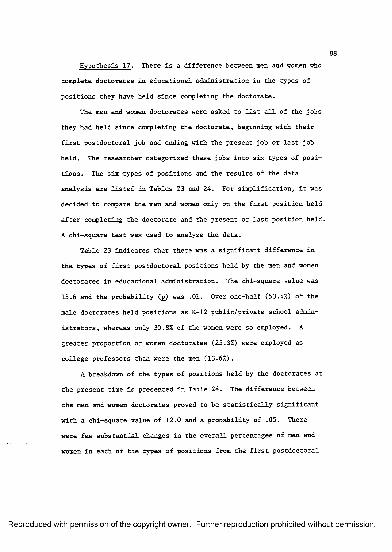
Hypothesis 17. There is a difference between men and women who
complete doctorates in educational administration in the types of
positions they have held since completing the doctorate.
The men and women doctorates were asked to list all of the jobs
they had held since completing the doctorate, beginning with their
first postdoctoral job and ending with the present job or last job
held. The researcher categorized these jobs into six types of posi
tions. The six types of positions and the results of the data
analysis are listed in Tables 23 and 24. For simplification, it was
decided to compare the men and women only on the first position held
after completing the doctorate and the present or last position held.
A chi-square test was used to analyze the data.
Table 23 indicates that there was a significant difference in
the types of first postdoctoral positions held by the men and women
doctorates in educational administration. The chi-square value was
15.6 and the probability Cg) was .01. Over one-half (53.4%) of the
male doctorates held positions as K-12 public/private school admin
istrators, whereas only 30.8% of the women were so employed. A
greater proportion of women doctorates (25.3%) were employed as
college professors than were the men (13.6%).
A breakdown of the types of positions held by the doctorates at
the present time is presented in Table 24. The difference between
the men and women doctorates proved to be statistically significant
with a chi-square value of 12.0 and a probability of .05. There
were few substantial changes in the overall percentages of men and
women in each of the types of positions from the first postdoctoral
Reproduced with permission of the copyright owner. Further reproduction prohibited without permission.
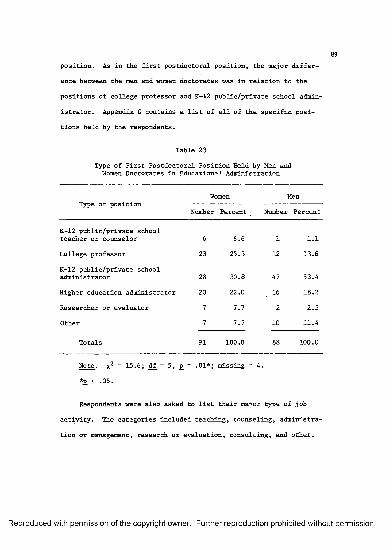
position. As in the first postdoctoral position, the major differ
ence between the men and women doctorates was in relation to the
positions of college professor and K-12 public/private school admin
istrator. Appendix G contains a list of all of the specific posi
tions held by the respondents.
Table 23
Type of First Postdoctoral Position Held by Men and Women Doctorates in Educational Administration
Type of positionWomen Men
Number Percent _ Number Percent
K-12 public/private school teacher or counselor 6 6.6 1 1.1
College professor 23 25.3 12 13.6
K-12 public/private school administrator 28 30.8 47 53.4
Higher education administrator 20 22.0 16 18.2
Researcher or evaluator 7 7.7 2 2.3
Other 7 7.7 10 11.4
Totals 91 100.0 88 100.0
Note, x2 = 15.6; df_ = 5, £ = .01*; missing = 4.
*2. <. .05.
Respondents were also asked to list their major type of job
activity. The categories included teaching, counseling, administra
tion or management, research or evaluation, consulting, and other.
Reproduced with permission of the copyright owner. Further reproduction prohibited without permission.
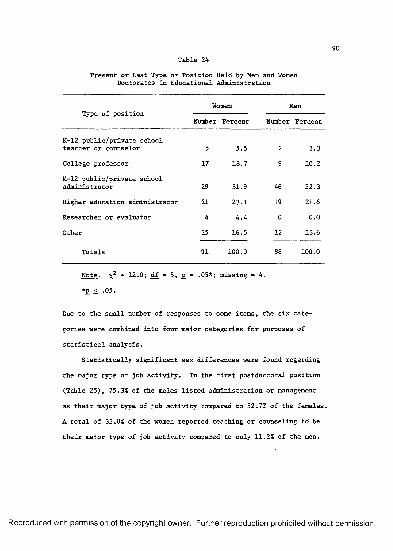
90Table 24
Present or Last Type of Position Held by Men and Women Doctorates in Educational Administration
Type of positionWomen Men
Number Percent Number Percent
K-12 public/private school teacher or counselor 5 5.5 2 2.3
College professor 17 18.7 9 10.2
K-12 public/private school administrator 29 31.9 46 52.3
Higher education administrator 21 23.1 19 21.6
Researcher or evaluator 4 4.4 0 0.0
Other 15 16.5 12 13.6
Totals 91 100.0 88 100.0
Note, x2 = 12.0; df = 5, = .05*; missing = 4.
* £ < .05.
Due to the small number of responses to some items, the six cate
gories were combined into four major categories for purposes of
statistical analysis.
Statistically significant sex differences were found regarding
the major type of job activity. In the first postdoctoral position
(Table 25), 75.3% of the males listed administration or management
as their major type of job activity compared to 52.7% of the females.
A total of 33.0% of the women reported teaching or counseling to be
their major type of job activity compared to only 11.2% of the men.
Reproduced with permission of the copyright owner. Further reproduction prohibited without permission.
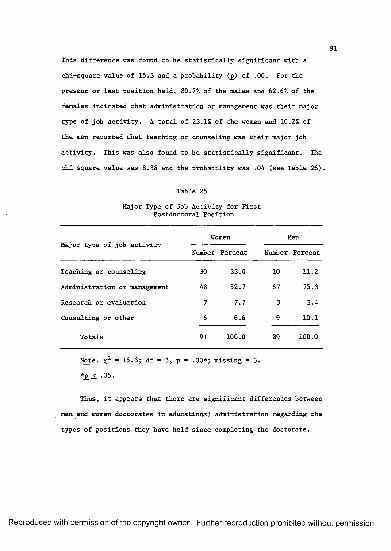
This difference was found to be statistically significant with a
chi-square value of 15.3 and a probability (_p) of .00. For the
present or last position held, 80.7% of the males and 62.6% of the
females indicated that administration or management was their major
type of job activity. A total of 23.1% of the women and 10.2% of
the men reported that teaching or counseling was their major job
activity. This was also found to be statistically significant. The
chi-square value was 8.25 and the probability was .04 (see Table 26).
Table 25
Major Type of Job Activity for First Postdoctoral Position
Major type of job activityWomen Men
Number Percent Numbei■ Percent
Teaching or counseling 30 33.0 10 11.2
Administration or management 48 52.7 67 75.3
Research or evaluation 7 7.7 3 3.4
Consulting or other 6 6.6 9 10.1
Totals 91 100.0 89 100.0
Note, x2 = 15.3; df = 3, 2. = -00*;; missing = 3.
*£ < .05.
Thus, it appears that there are significant differences between
men and women doctorates in educational administration regarding the
types of positions they have held since completing the doctorate.
Reproduced with permission of the copyright owner. Further reproduction prohibited without permission.
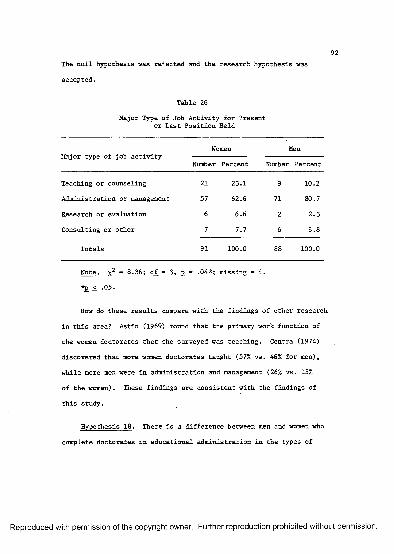
92The null hypothesis was rejected and the research hypothesis was
accepted.
Table 26
Major Type of Job Activity for Present or Last Position Held
Major type of job activityWomen Men
Number Percent Number Percent
Teaching or counseling 21 23.1 9 10.2
Administration or management 57 62.6 71 80.7
Research or evaluation 6 6.6 2 2.3
Consulting or other 7 7.7 6 6.8
Totals 91 100.0 88 100.0
Note, x2 = 8.36; df = 3 , £ = .04*; missing = 4.
*£ ± *05..
How do these results compare with the findings of other research
in this area? Astin (1969) found that the primary work function of
the women doctorates that she surveyed was teaching. Centra (1974)
discovered that more women doctorates taught (57% vs. 46% for men),
while more men were in administration and management (26% vs. 15%
of the women). These findings are consistent with the findings of
this study.
Hypothesis 18. There is a difference between men and women who
complete doctorates in educational administration in the types of
Reproduced with permission of the copyright owner. Further reproduction prohibited without permission.
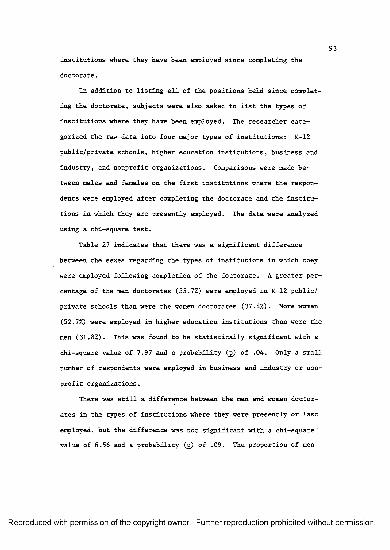
institutions where they have been employed since completing the
doctorate.
In addition to listing all of the positions held since complet
ing the doctorate, subjects were also asked to list the types of
institutions where they have been employed. The researcher cate
gorized the raw data into four major types of institutions: K-12
public/private schools, higher education institutions, business and
industry, and nonprofit organizations. Comparisons were made be
tween males and females on the first institutions where the respon
dents were employed after completing the doctorate and the institu
tions in which they are presently employed. The data were analyzed
using a chi-square test.
Table 27 indicates that there was a significant difference
between the sexes regarding the types of institutions in which they
were employed following completion of the doctorate. A greater per
centage of the men doctorates (55.7%) were employed in K-12 public/
private schools than were the women doctorates (37.4%). More women
(52.7%) were employed in higher education institutions than were the
men (31.8%). This was found to be statistically significant with a
chi-square value of 7.97 and a probability (j>) of .04. Only a small
number of respondents were employed in business and industry or non
profit organizations.
There was still a difference between the men and women doctor
ates in the types of institutions where they were presently or last
employed, but the difference was not significant with a chi-square
value of 6.56 and a probability (g) of .09. The proportion of men
Reproduced with permission of the copyright owner. Further reproduction prohibited without permission.
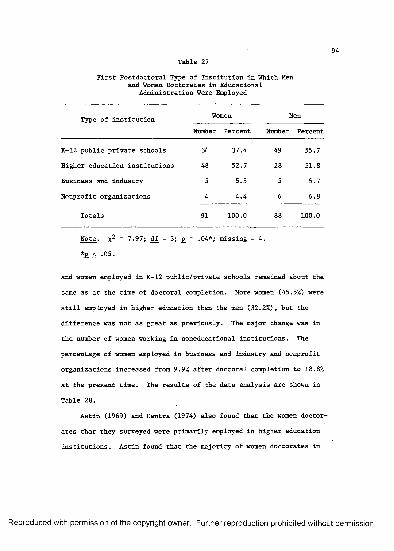
94Table 27
First Postdoctoral Type of Institution in Which Men and Women Doctorates in Educational
Administration Were Employed
Type of institution Women Men
Number Percent Number Percent
K-12 public private schools 34 37.4 49 55.7
Higher education institutions 48 52.7 28 31.8
Business and industry 5 5.5 5 5.7
Nonprofit organizations 4 4.4 6 6.8
Totals 91 100.0 88 100.0
Note, x2 = 7.97; df = 3; £ = .04*; missing = 4.
*£ <. .05.
and women employed in K-12 public/private schools remained about the
same as at the time of doctoral completion. More women (45.5%) were
still employed in higher education than the men (32.2%), but the
difference was not as great as previously. The major change was in
the number of women working in noneducational institutions. The
percentage of women employed in business and industry and nonprofit
organizations increased from 9.9% after doctoral completion to 18.8%
at the present time. The results of the data analysis are shown in
Table 28.
Astin (1969) and Centra (1974) also found that the women doctor
ates that they surveyed were primarily employed in higher education
institutions. Astin found that the majority of women doctorates in
Reproduced with permission of the copyright owner. Further reproduction prohibited without permission.
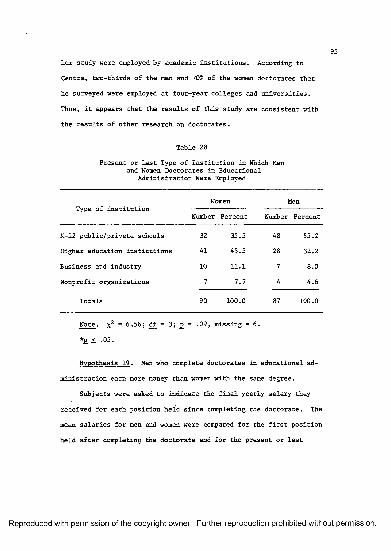
95her study were employed by academic institutions. According to
Centra, two-thirds of the men and 70% of the women doctorates that
he surveyed were employed at four-year colleges and universities.
Thus, it appears that the results of this study are consistent with
the results of other research on doctorates.
Table 28
Present or Last Type of Institution in Which Men and Women Doctorates in Educational
Administration Were Employed
Type of institutionWomen Men
Number Percent Number Percent
K-12 public/private schools 32 35.5 48 55.2
Higher education institutions 41 45.5 28 32.2
Business and industry 10 11.1 7 8.0
Nonprofit organizations 7 7.7 4 4.6
Totals 90 100.0 87 100.0
Note, x2 = 6.56; df = 3; £ = .09, missing = 6.
*£ < .05.
Hypothesis 19. Men who complete doctorates in educational ad
ministration earn more money than women with the same degree.
Subjects were asked to indicate the final yearly salary they
received for each position held since completing the doctorate. The
mean salaries for men and women were compared for the first position
held after completing the doctorate and for the present or last
Reproduced with permission of the copyright owner. Further reproduction prohibited without permission.
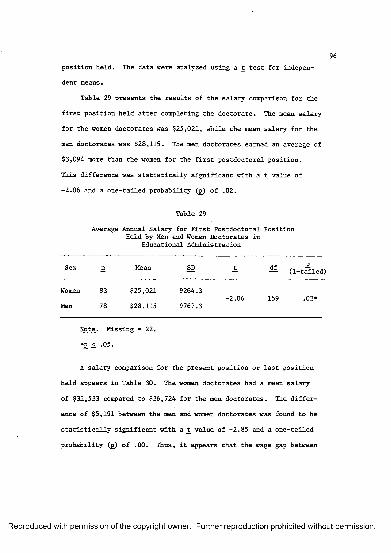
96position held. The data were analyzed using a t_ test for indepen
dent means.
Table 29 presents the results of the salary comparison for the
first position held after completing the doctorate. The mean salary
for the women doctorates was $25,021, while the mean salary for the
men doctorates was $28,115. The men doctorates earned an average of
$3,094 more than the women for the first postdoctoral position.
This difference was statistically significant with a _t value of
-2.06 and a one-tailed probability Cg) of .02.
Table 29
Average Annual Salary for First Postdoctoral Position Held by Men and Women Doctorates in
Educational Administration
Sex n Mean SD t df 2(1-tailed)
Women 83 $25,021 9264.3-2.06 159 .02*
Men 78 $28,115 9767.3
Note. Missing = 22.
*£ < .05.
A salary comparison for the present position or last position
held appears in Table 30. The women doctorates had a mean salary
of $31,533 compared to $36,724 for the men doctorates. The differ
ence of $5,191 between the men and women doctorates was found to be
statistically significant with a _t value of -2.85 and a one-tailed
probability (p) of .00. Thus, it appears that the wage gap between
Reproduced with permission of the copyright owner. Further reproduction prohibited without permission.
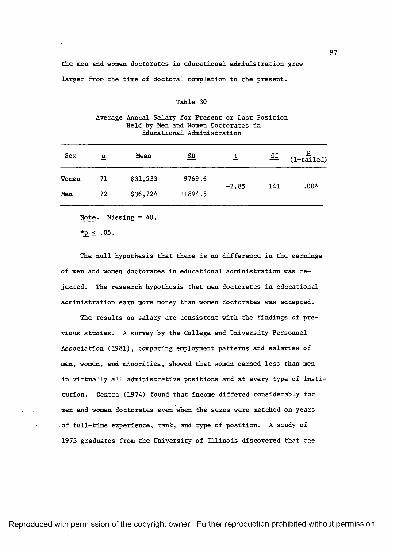
97the men and women doctorates in educational administration grew
larger from the time of doctoral completion to the present.
Table 30
Average Annual Salary for Present or Last Position Held by Hen and Women Doctorates in
Educational Administration
Sex n Mean SD _t df £(1-tailed)
Women 71 $31,533 9769.6-2.85 141 .00*
Men 72 $36,724 11894.5
Note. Missing = 40.
*£ <. .05.
The null hypothesis that there is no difference in the earnings
of men and women doctorates in educational administration was re
jected. The research hypothesis that men doctorates in educational
administration earn more money than women doctorates was accepted.
The results on salary are consistent with the findings of pre
vious studies. A survey by the College and University Personnel
Association (1981), comparing employment patterns and salaries of
men, women, and minorities, showed that women earned less than men
in virtually all administrative positions and at every type of insti
tution. Centra (1974) found that income differed considerably for
men and women doctorates even when the sexes were matched on years
of full-time experience, rank, and type of position. A study of
1973 graduates from the University of Illinois discovered that the
Reproduced with permission of the copyright owner. Further reproduction prohibited without permission.
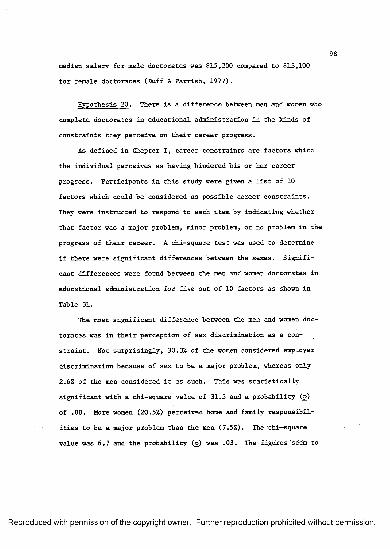
98median salary for male doctorates was $15,200 compared to $13,100
for female doctorates (Duff & Parrish, 1977).
Hypothesis 20. There is a difference between men and women who
complete doctorates in educational administration in the kinds of
constraints they perceive on their career progress.
As defined in Chapter I, career constraints are factors which
the individual perceives as having hindered his or her career
progress. Participants in this study were given a list of 10
factors which could be considered as possible career constraints.
They were instructed to respond to each item by indicating whether
that factor was a major problem, minor problem, or no problem in the
progress of their career. A chi-square test was used to determine
if there were significant differences between the sexes. Signifi
cant differences were found between the men and women doctorates in
educational administration for five out of 10 factors as shown in
Table 31.
The most significant difference between the men and women doc
torates was in their perception of sex discrimination as a con
straint. Not surprisingly, 30.3% of the women considered employer
discrimination because of sex to be a major problem, whereas only
2.6% of the men considered it as such. This was statistically
significant with a chi-square value of 31.5 and a probability (j>)
of .00. More women (20.5%) perceived home and family responsibil
ities to be a major problem than the men (7.5%). The'chi— square
value was 6.7 and the probability (j>) was .03. The figures seem to
Reproduced with permission of the copyright owner. Further reproduction prohibited without permission.
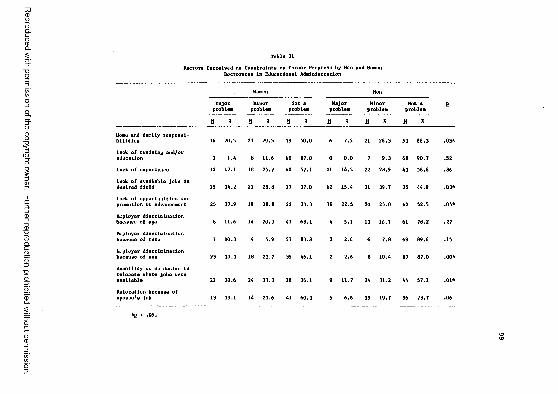
Reproduced
with perm
ission of the
copyright owner.
Further reproduction
prohibited w
ithout permission.
Factors Perceived as Constraints on Career Progress by Men and Women Doctorates In Educational Administration
Women Men
Majorproblem
Minorproblem
Hot a problem
Hajorproblem
Minorproblem
Not a problem £
N X N X N X N X N X N X
llouu and family responsibilities 16 20.5 23 29.5 39 50.0 6 7.5 21 26.3 53 66.3 .03*back of training and/or education 1 1.6 8 11.6 60 87.0 0 0.0 7 9.3 68 90.7 .52
Lack of experience 12 17.1 18 25.7 60 57.1 11 16.5 22 28.9 63 56.6 .86
Lack of available Jobs In desired field 25 36.2 21 28.8 27 37.0 12 15.6 31 39.7 35 66.9 .03*Lack of opportunities for prumotlon or advancement 25 37.9 19 28.8 22 33.3 18 22.5 20 25.0 62 52.5 .05*Employer discrimination because of age 8 11.6 16 20.3 67 68.1 6 5.1 13 16.7 61 78.2 .27
Employer discrimination because of race V 10.3 6 5.9 57 83.8 2 2.6 6 7.8 69 89.6 .15
Employer discrimination because of sex 23 30.3 18 23.7 35 66.1 2 2.6 8 10.6 67 87.0 .00*
inability or no desire to relocate where Jobs were available 22 30.6 26 33.3 26 36.1 9 11.7 26 31.2 66 57.1 .01*
Relocation because of spouse's Job 13 19.1 16 20.6 61 60.3 5 6.6 15 19.7 56 73.7 .06
*j> < .05.
vOVO
indicate that the women had more difficulty finding suitable jobs
and getting promotions. Lack of available jobs in desired field was
considered to be a major problem by 34.2% of the women doctorates
compared to 15.4% of the men. This difference was statistically
significant with a chi-square value of 7.37 and a probability of
.03. A greater proportion of women (37.9%) also perceived lack of
opportunities for promotion or advancement as a major problem, while
only 22.5% of the men considered it as a major problem. The chi-
square value was 6.1 with a probability of .05. The last factor in
which there was a significant difference between the sexes was in
ability or no desire to relocate where jobs were available. As
might be expected, more women (30.6%) thought that relocation was a
major problem than did the men (11.7%). Overall, it appears that
Hypothesis 20 which states that there is a difference between men
and women who complete doctorates in educational administration in
the kinds of constraints they perceive on their career progress was
supported.
The researcher discovered only two other studies that investi
gated career constraints. The first, by Astin (1969), found that
the women doctorates in the study indicated that the inability to
find adequate household help and employer discrimination were the
greatest obstacles to their career development. The second study,
on public school administrators, also found that a greater propor
tion of the women perceived discrimination because of sex to be a
constraint than did the men (Way, 1976). The findings of Astin and
Way are similar to the results of this study.
Reproduced with permission of the copyright owner. Further reproduction prohibited without permission.
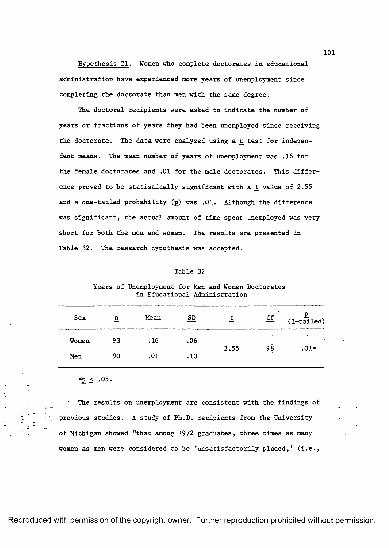
101Hypothesis 21. Women who complete doctorates in educational
administration have experienced more years of unemployment since
completing the doctorate than men with the same degree.
The doctoral recipients were asked to indicate the number of
years or fractions of years they had been unemployed since receiving
the doctorate. The data were analyzed using a _t test for indepen
dent means. The mean number of years of unemployment was .16 for
the female doctorates and .01 for the male doctorates. This differ
ence proved to be statistically significant with a _t value of 2.55
and a one-tailed probability Cg) was .01. Although the difference
was significant, the actual amount of time spent unemployed was very
short for both the men and women. The results are presented in
Table 32. The research hypothesis was accepted.
Table 32
Years of Unemployment for Men and Women Doctorates in Educational Administration
Sex n Mean SD t_ df £(1-tailed)
Women 93 .16 .062.55 98 .01*
Men 90 .01 .10
*£ <. .05.
: The results on unemployment are consistent with the findings of
- ’ previous studies. A study of Ph.D. recipients from the University
‘ of Michigan showed "that among 1972 graduates, three times as many
women as men were considered to be ’unsatisfactorily placed,’ (i.e.,
Reproduced with permission of the copyright owner. Further reproduction prohibited without permission.
102designated as unemployed, underemployed, employed outside their own
field, or of uncertain employment status by their departments)"
(Committee to Study, 1974, p. 23). Duff and Parrish (1977) found
that 1.4% of the male doctorates they surveyed were unemployed com
pared to 5.7% of the female doctorates.
Hypothesis 22. A greater percentage of women who complete
doctorates in educational administration perceive themselves to be
underemployed than men with the same degree.
In Chapter I, underemployment was defined as employment in a
position that normally does not require the educational degree held
by that individual and/or the expertise and experience that person
possesses. Subjects were asked to answer yes or no to seven ques
tions designed to assess whether or not the individual perceived
themselves to be underemployed. Not everyone answered the questions;
therefore, the total number of responses to each question will not
equal 100% of the respondents. The chi-square test was vised to com
pare the responses of the men and women doctorates for each question.
The questions and results of the data analysis appear in Table 33.
The first six questions dealt with specific indicators of under
employment. Significant sex differences were found in the responses
to two questions. More women (42.2%) indicated that their job re
quired a doctorate than did the men (23.2%). One possible explana
tion for this difference is that more of the women respondents were
employed in higher education where a doctorate is usually required.
A greater percentage of the men (87.5%) felt that their job was
Reproduced with permission of the copyright owner. Further reproduction prohibited without permission.
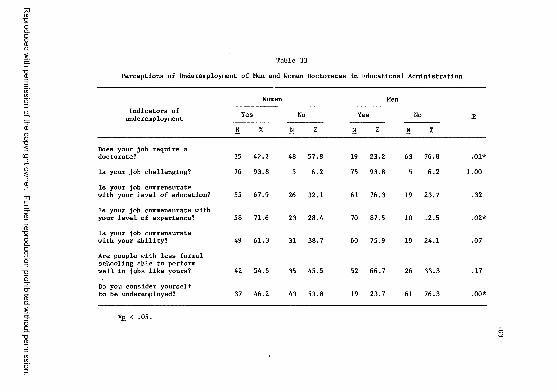
Reproduced
with perm
ission of the
copyright owner.
Further reproduction prohibited
without perm
ission.
Table 33
Perceptions of Underemployment of Men and Women Doctorates in Educational Administration
Women MenIndicators of
underemployment Yes No Yes No
N % N % N % N %
Does your job require a doctorate? 35 42.2 48 57.8 19 23.2 63 76.8 .01*
Is your job challenging? 76 93.8 5 6.2 75 93.8 5 6.2 1.00
Is your job commensurate with your level of education? 55 67.9 26 32.1 61 76.3 19 23.7 .32
Is your job commensurate with your level of experience? 58 71.6 23 28.4 70 87.5 10 12.5 .02*
Is your job commensurate with your ability? 49 61.3 31 38.7 60 75.9 19 24.1 .07
Are people with less formal schooling able to perform well in jobs like yours? 42 54.5 35 45.5 52 66.7 26 33.3 .17
Do you consider yourself to be underemployed? 37 46.2 43 53.8 19 23.7 61 76.3 .00*
*£ < .05.
103
104commensurate with their level of experience than did the women
(71.6%). Although not statistically significant, more men (75.9%)
also felt that their job was commensurate with their ability than
did the women (61.3%). The same percentage of men and women indi
cated that their job was challenging.
The last question specifically asked, "Do you consider yourself
to be underemployed?" A total of 46.2% of the women considered
themselves to be underemployed compared to 23.7% of the men. This
difference proved to be statistically significant with a chi-square
value of 7.9 and a probability (j>) of .00. Although the findings
of the first six questions were mixed, the results of the last ques
tion would seem to support the research hypothesis that a greater
percentage of women who complete doctorates in educational adminis
tration perceive themselves to be underemployed.
These findings agree with the results of several other studies
that investigated underemployment. As mentioned previously, a study
of University of Michigan Ph.D.'s who graduated in 1971 and 1972
found that more of the women graduates were underemployed (Committee
to Study, 1974). A study of sex differences in the employment of
college graduates at all levels, by Duff and Parrish (1977), re
ported that twice as many women as men were underemployed. A group
of researchers who conducted a survey on underemployed Ph.D.’s
discovered that more women than men in their sample saw themselves
as underemployed.
Reproduced with permission of the copyright owner. Further reproduction prohibited without permission.
105Hypothesis 23. There is a difference between men and women who
complete doctorates in educational administration in how satisfied
they are with their career progress.
Satisfaction with career progress was determined by asking
individuals to circle the response that best described how satisfied
they were with the progress of their career up to the present time.
There were six possible choices, ranging from very satisfied to very
dissatisfied. Table 34 shows the number and percentage of responses
in each category for both men and women. Due to the small number of
responses to some items, the six categories were combined into two
major categories for the purposes of data analysis. Very satisfied,
satisfied, and somewhat satisfied were combined under the label of
satisfied. Somewhat dissatisfied, dissatisfied, and very dissatis
fied were combined under the heading of dissatisfied. A chi-square
test was used to determine if there was a significant difference
between the sexes regarding degree of satisfaction with career
progress.
A total of 89% of the women doctorates and 92.2% of the men
were satisfied with their career progress up to the present time.
Only 11% of the women and 7.8% of the men were dissatisfied. The
chi-square value was .24 and the probability was .63. The null
hypothesis that there is no difference between men and women doctor
ates in educational administration concerning satisfaction with
career progress was not rejected. The researcher has no evidence ~ _
to indicate that men and women doctorates differ in their-satis
faction with career progress.
Reproduced with permission of the copyright owner. Further reproduction prohibited without permission.
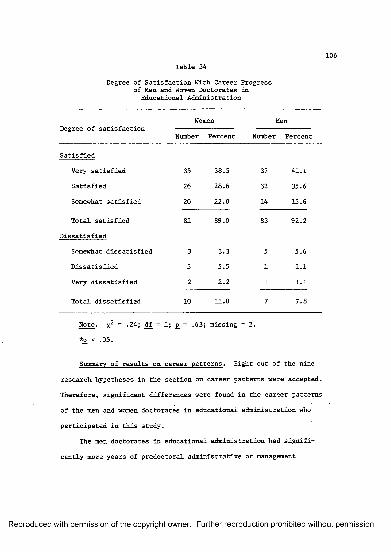
106Table 34
Degree of Satisfaction With Career Progress of Men and Women Doctorates in
Educational Administration
Degree of satisfactionWomen Men
Number Percent Number Percent
Satisfied
Very satisfied 35 38.5 37 41.1
Satisfied 26 28.6 32 35.6
Somewhat satisfied 20 22.0 14 15.6
Total satisfied 81 89.0 83 92.2
Dissatisfied
Somewhat dissatisfied 3 3.3 5 5.6
Dissatisfied 5 5.5 1 1.1
Very dissatisfied 2 2.2 1 1.1
Total dissatisfied 10 11.0 7 7.8
Note, x2 = -24; df = 1; £ = ■.63; missing = 2.
*£ j< .05.
Summary of results on career patterns. Eight out of the nine
research hypotheses in the section on career patterns were accepted.
Therefore, significant differences were found in the career patterns
of the men and women doctorates in educational administration who
participated in this study.
The men doctorates in educational administration had signifi
cantly more years of predoctoral administrative or management
Reproduced with permission of the copyright owner. Further reproduction prohibited without permission.
107experience than did the women. The women doctorates had signifi
cantly more years of non-administrative/management experience prior
to completing the doctorate compared to the men.
A comparison of types of positions held by the respondents
showed a significant sex difference. The majority of men held posi
tions as K-12 public/private school administrators. The women held
more diverse positions including that of college professor, higher
education administrator, and public school administrator. A signifi
cantly greater percentage of women were employed in higher education
institutions, whereas more men worked in K-12 public/private schools.
Salary differences were also reported with the males earning signifi
cantly more than the females.
There was a significant difference between the men and women
doctorates in their perception of constraints on career progress.
More women felt that home and family responsibilities were a major
problem than did the men. A significantly greater percentage of the
women indicated that lack of available jobs in desired field and
lack of opportunities for promotion and advancement were major con
straints on their career progress. Inability or no desire to re
locate where jobs were available was also considered to be a major
problem by more women than men respondents. Not surprisingly, sex
discrimination by employers was seen as a major problem by 30% of
the women compared to only 2% of the men.
Unemployment and underemployment were also investigated in the
section on career patterns. The findings on unemployment indicate
that the average length of time spent unemployed was significantly
Reproduced with permission of the copyright owner. Further reproduction prohibited without permission.
108longer for the women doctorates than for the men. A greater per
centage of the females considered themselves to be underemployed
than did the males. No significant sex difference was found in the
degree of satisfaction with career progress.
Summary
The purpose of Chapter IV has been to present and discuss the
results of the data analysis for this study. Similarities and dif
ferences between men and women doctorates in educational administra
tion were reported relative to the research hypotheses formulated
for this investigation.
Chapter V will present a summary of the results and conclusions.
In addition, the researcher will offer recommendations and sugges
tions for further study.
Reproduced with permission of the copyright owner. Further reproduction prohibited without permission.
CHAPTER V
SUMMARY, CONCLUSIONS, RECOMMENDATIONS,AND SUGGESTIONS POR FURTHER STUDY
Chapter V will provide the reader with a summary of the results
and will present the conclusions drawn from these results. It will
also offer recommendations and suggestions for further study.
The purpose of this study was to compare the career aspirations,
job seeking patterns, and career patterns of men and women who com
plete doctorates in educational administration. The population used
in this study consisted of all males and females who received doctor
ates in educational administration or educational leadership from
eight universities in the Mid-American Conference (MAC) during the
calendar years of 1976 through 1980. A stratified sample of 236
subjects (118 men and 118 women) were chosen from the total popula
tion of 448 doctoral recipients and a questionnaire was mailed to
each sample member. The data were analyzed and the results are pre
sented in Chapter IV. A summary of the results and the conclusions
are presented in the following section.
Summary and Conclusions
This study investigated three major areas: Career aspirations,
job seeking patterns, and career patterns. This section will pre
sent a summary of the results followed by the conclusions for each
one of these major areas.
109
Reproduced with permission of the copyright owner. Further reproduction prohibited without permission.
110Career Aspirations
Subjects were given a list of 18 positions and asked to indi
cate the kind of position or positions they desired at the time they
completed the doctorate and also as a final career goal. The re
sults showed that a significantly greater proportion of the men
doctorates in educational administration aspired to the superintend
ency, while more women doctorates were interested in becoming col
lege professors at the time they completed the doctorate. When
asked to indicate their final career goal, a significantly greater
percentage of men doctorates were still interested in becoming
superintendents than the women doctorates.
Although no other statistically significant differences were
found in the career aspirations of the men and women doctorates,
some interesting contrasts can be found in Tables 7 and 8. Twice
as many women were interested in becoming principals, department
chairpersons, researchers, and consultants at the time they com
pleted the doctorate. Three times as many women as men were inter
ested in becoming department chairpersons and researchers as a final
career goal. More men aspired to the college vice presidency and
presidency as a final career goal than did the women.
The conclusion that can be drawn from these results is that
there are some differences in the career aspirations of men and
women who complete doctorates -in educational administration. More
women doctorates were interested in college teaching at the time
of doctoral completion, while more men doctorates aspired to
Reproduced with permission of the copyright owner. Further reproduction prohibited without permission.
Illpositions as public school administrators. It is somewhat surpris
ing to find that so many of the women were interested in teaching,
especially since these women chose to get their doctorates in educa
tional administration or educational leadership rather than a spe
cific subject area. One explanation for this finding can be found
by looking at the background of these women. The women doctorates
had more work experience in teaching than in any other type of work.
Evidently many of the women who participated in this study felt more
comfortable in the role of teacher.
The findings on career aspirations also indicate that the women
doctorates have somewhat lower career aspirations than the men. Few
women were interested in becoming superintendents. Yet, Tables 7
and 8 show that more women than men were interested in being prin
cipals and there was little difference between the males and females
in their desire to become central office staff or assistant super
intendents. In higher education, the percentage of men and women
interested in being directors, associate deans, or deans was about
the same, but more men aspired to the college vice presidency and
presidency as a final career goal than did the women.
Why don't more of the women doctorates in educational adminis
tration aspire to the top-level positions? They certainly have the
educational credentials for these jobs. One possible explanation is
that the women do not have the experience for these jobs. This
study found that the men doctorates had significantly more adminis
trative or management experience prior to completing the doctorate
than did the women doctorates. Another explanation is that the
Reproduced with permission of the copyright owner. Further reproduction prohibited without permission.
112women doctorates do not aspire to the top-level positions because
they feel there is little chance of getting these jobs. Only about
1% of the public school superintendents and college presidents in
the United States are women. Kanter's (1977) study on men and women
in the corporation found that people have low aspirations when they
think their chances for moving up the career ladder are low.
Another conclusion is that the number of both men and women
interested in being consultants and becoming self-employed increased
substantially from the time of doctoral completion to the final
career goal. This trend could indicate a desire to move out of
institutions and become more self-directed. It could also be a
result of the restricted job market in the field of education.
Job Seeking Patterns
Although none of the research hypotheses on job seeking pat
terns were supported, some interesting sex differences were found.
No significant difference was found between the males and females
in their use of informal and formal job seeking methods; however,
the women used slightly more of all methods, both informal and
formal. The women applied for more jobs overall and they also
applied for more administrative or management jobs when looking
for their present position. These findings were in the opposite
direction of the stated hypotheses. No sex difference was found
regarding number of job interviews received. However, the males
had a tendency to receive more job offers than the famales, both
at the time of doctoral completion and when looking for their
Reproduced with permission of the copyright owner. Further reproduction prohibited without permission.
113present position.
One would conclude from these results that the women doctorates
in this study were more aggressive in looking for jobs than were the
men doctorates. Earlier studies have shown just the opposite (Duff
& Parrish, 1977; Eaton, 1970; Leviton & Whitely, 1981; Mills, 1976).
Thus, it would appear that women graduates have become more knowl
edgeable about job seeking methods and are applying these methods
more vigorously than in the past.
Although the women doctorates applied for more jobs when
applying for their present position, they did not receive more
interviews or job offers than the men doctorates. The females
applied for an average of 19.7 jobs when applying for their present
position and received an average of 2.0 interviews and 1.1 job
offers. The men applied for an average of 4.2 jobs and received an
average of 2.2 interviews and 1.3 job offers. If you look at the
ratio of job applications to interviews and job offers, you would
have to conclude that the men were more successful than the women
in getting interviews and job offers when looking for their present
position.
One of the surprising findings of this study was that the women
doctorates applied for more administrative or management positions
when looking for their present jobs. This finding is in sharp con
trast to the results of a 1970 study of women graduates in educa
tional administration by Eaton (1970). Eaton found that few of the
women she surveyed had actually applied for an administrative posi
tion. The results of the present study are encouraging. They
Reproduced with permission of the copyright owner. Further reproduction prohibited without permission.
114
indicate that more women doctorates in educational administration
are now applying for administrative and management positions.
Despite this fact, the present study found that only 62% of the
women were presently working in administrative or management posi
tions compared to 80% of the men. This could indicate that, al
though the women doctorates are applying for more administrative or
management positions, they are having greater difficulty getting the
jobs. Further research needs to be conducted to determine if the
women doctorates are experiencing more difficulty getting interviews
and job offers for administrative or management positions.
Career Patterns
Significant differences were found in the career patterns of
the men and women doctorates in educational administration. Eight
out of nine of the hypotheses in this section were supported.
It was discovered that the men doctorates had significantly
more years of work experience in administrative or management posi
tions prior to completing the doctorate. The women doctorates had
more predoctoral work experience in non-administrative/management
jobs such as teaching.
A significant sex difference was also found in postdoctoral
employment experience. Over one-half of the men were employed in
the K-12 public/private schools, whereas over one-half of the women
had worked in higher education institutions since completing the
doctorate. The majority of the men held administrative positions
in the public/private schools. The jobs held by the women were more
Reproduced with permission of the copyright owner. Further reproduction prohibited without permission.
diverse. About one-quarter of the women were college professors,
almost one-third were K-12 public/private school administrators,
and another one-quarter were higher education administrators.
Salary differences were also reported with the males e a r n i n g sig
nificantly more than the females.
The results on unemployment showed that the average length of
time spent unemployed was significantly longer for the women doctor
ates than for the men. A greater percentage of the females con
sidered themselves to be underemployed than did the males.
A greater percentage of the women doctorates perceived home and
family responsibilities, lack of available jobs, lack of opportu
nities for promotion and advancement, sex discrimination, and in
ability to relocate as major constraints on their career. No sig
nificant difference was found between the men and women doctorates
in the degree of satisfaction with career progress. Approximately
90% of the males and females were satisfied with the progress of
their career up to the present time.
What conclusions can be drawn from the results on career pat
terns? One conclusion is that the women doctorates are at a dis
tinct disadvantage when applying for administrative or management
positions because of their lack of administrative or management
experience. Given two candidates with the same educational qualifi
cations, an employer is most apt to hire the person with the most
experience related to the job. This could be one reason why more
of the women are working as teachers, counselors, and researchers
than the men.
Reproduced with permission of the copyright owner. Further reproduction prohibited without permission.
116It can be concluded that the typical career path for the male
doctorates is that of K-12 public/private school administrator.
Over one-half of the men have followed this pattern. The career
path for the women doctorates is not as distinct. They have fol
lowed more diverse paths including college teacher, higher education
administrator, and public school administrator. Another conclusion
is that more males than females have worked as administrators or
managers since completing the doctorate, while more women than men
have been employed as teachers or counselors. It looks as if the
traditional pattern of women as teachers and men as administrators
continues to exist even among doctorates in educational administra
tion.
The conclusion on salary is that the men doctorates earn more
money than the women doctorates. In addition, the wage gap between
the men and women doctorates widened from the time of doctoral com
pletion to the present. One explanation for the salary difference
is that more of the males are in administrative or management jobs
which usually pay more than teaching or other nonadministrative
positions. Another explanation is that the women have had less
administrative or management experience than the men.
It can be concluded that the women doctorates feel there are
more constraints impinging upon their career progress than do the
men. A greater percentage of women felt that home and family re
sponsibilities were a major problem. Although there has been some
change in sex roles, most women are still responsible for running
the household and taking care of the children. This means that they
Reproduced with permission of the copyright owner. Further reproduction prohibited without permission.
117either have less time to devote to a demanding career or they find
themselves trying to be super woman. More women also felt that re
location was a major problem. Women are less apt to be able to move
to take advantage of career opportunities. This is especially true
of married women where the husband’s career takes preference. This
restriction definitely affects women’s aspirations as well as their
career progress. Evidently, women feel that sex discrimination is
still a major problem. Perhaps, research needs to be conducted to
determine if this is, in fact, the case.
Another conclusion of this study was that more women considered
themselves to be underemployed than the men. Yet, both the males
and females were equally satisfied with the progress of their career
up to the present time. Considering some of the findings of this
study, it is surprising that the women would be as satisfied with
their career progress. One possible explanation is that the women
had somewhat lower aspirations than the men.
Recommendations
The researcher offers the following recommendations based on
the results of this study. The recommendations are aimed at three
major groups: (1) women doctorates in educational administration,
(2) departments of educational administration or educational leader
ship, and (3) institutions that hire doctorates in educational ad
ministration .
Reproduced with permission of the copyright owner. Further reproduction prohibited without permission.
Women Doctorates in Educational Administration118
One of the findings of this study was that the women doctorates
in educational administration had fewer years of administrative or
management experience prior to completing the doctorate than did the
men doctorates. As mentioned previously, this places women at a
distinct disadvantage when competing for administrative positions.
This is particularly true for the older woman doctorate. She may
be considered overqualified for entry-level or middle-management
jobs, but she does not have the experience for the top-level posi
tions. In this study, approximately 70% of the women doctorates
were over 40. Although, there are no quick fixes for this problem,
there are some things women can do to remedy this situation.
First, internships are one way that women can gain administra
tive or management experience. Most departments of educational ad
ministration require doctoral students to participate in some type
of internship or field experience. Women should devote a great deal
of thought and planning to their internships. The internship should
relate to the individual’s overall professional goals and should
give the intern an opportunity to take responsibility and get prac
tical experience.
In addition to internships, there are many other ways that
women can gain administrative experience and enhance their leader
ship skills. For example, they can serve on boards of directors,
chair committees, become officers in professional and community
organizations, and run for public office. All of these activities
Reproduced with permission of the copyright owner. Further reproduction prohibited without permission.
119can provide valuable experience and give women greater visibility in
their own organizations and within the profession.
The picture is somewhat brighter for younger women. Young
women who are interested in becoming administrators should be aware
of the career path they must follow to achieve their career goals.
They must seek out administrative positions earlier in their careers,
so they will have the experience to compete with their male col
leagues for administrative jobs. These women must realize that they
cannot spend 15 years teaching and then expect to move into top ad
ministrative positions. In summary, women who are interested in
becoming administrators must seek out every opportunity available to
gain administrative or management experience and improve their lead
ership skills.
Secondly, women must become more mobile. Thirty percent of the
women doctorates in this study reported that inability or no desire
to relocate where jobs were available was a major constraint on
their career progress. This is a real dilemma for the married women.
Yet, many two-career couples have come up with creative solutions to
this problem. As the job market in education becomes more and more
restricted, the willingness to relocate where jobs are available
will become increasingly important.
Last, but not least, it is important that women continue to
actively seek positions for which they are qualified. An encourag
ing finding of this study was that the women doctorates were as
active in the job seeking process as the men doctorates. In fact,
the women used slightly more of both the informal and formal job
Reproduced with permission of the copyright owner. Further reproduction prohibited without permission.
120seeking methods and applied for more jobs when looking for their
present position. However, the men received slightly more job
offers. Thus, it appears that the women doctorates must be more
aggressive in looking for a job if they are to be successful in
securing a position. Women should not be discouraged if they are
not offered the first job they apply for. They must be thorough
and persistent in their job search campaign.
Departments of Educational Administration or Educational Leadership
As more women pursue doctorates in this field, departments of
educational administration or educational leadership must become
more aware of the special needs and problems of this group of stu
dents. As this study shows, there are some significant differences
in the career aspirations, job seeking experiences, and career pat
terns of men and women doctorates in educational administration.
One problem that women doctorates face is lack of administra
tive or management experience. Some of the steps that women can
take to remedy this situation have already been discussed. One
suggestion was that women use internships to gain administrative
experience. A study of preparatory programs for educational admin
istrators by Silver and Spuck (1978) found that 65% of doctoral pro
grams in educational administration require their students to par
ticipate in some kind of internship or field experience. However,
there has been some concern expressed in the literature about the
quality of these experiences (Barrilleaux, 1972; Ramsey & Lutz,
1973). The results of the present study point to the importance of
Reproduced with permission of the copyright owner. Further reproduction prohibited without permission.
121providing quality internships for doctoral students, particularly
women, who have had little or no administrative or management expe
rience. Also, a more flexible approach is needed in regard to the
length of the internship. Students with little experience should
have the option of participating in more than one internship or
serving a longer internship than students who have had a great deal
of work experience.
Departments of educational administration need to examine their
program purposes and curriculum. Silver and Spuck (1978) discovered
that the major purpose of most preparatory programs in educational
administration is to prepare students for administrative positions
in public school systems. The majority of the male doctorates in
the present study were interested in becoming public school admin
istrators. But, the women were more interested in college teaching
and higher education administration. There was also some evidence
that both the men and women were shifting their interests to jobs in
non-educational institutions as a final career goal. Departments of
educational administration need to offer more diverse programs to
match the interests of students and reflect the changing job market.
As the job market in education becomes tighter and the competi
tion for jobs more intense, new doctorates will need additional help
to find suitable employment. Departments of educational administra
tion must take a more active role in placing both their male and
female graduates.
Reproduced with permission of the copyright owner. Further reproduction prohibited without permission.
122Institutions That Hire Doctorates in Educational Administration
Of course, the recommendations offered thus far will be of
little value unless the institutions that employ educational leaders
become more receptive to hiring and promoting women for leadership
positions. There is some evidence in the present study to indicate
that the women doctorates are still facing sex discrimination in the
workplace. Thirty percent of the women doctorates thought that
employer discrimination because of sex was a major problem that had
hindered their career progress compared to only 2% of the men. A
greater percentage of women considered lack of opportunities for
promotion and advancement to be a major problem. Although the women
doctorates applied for more administrative or management jobs when
looking for their present position, fewer women are presently work
ing in administrative positions.
Again, there are no easy solutions to this problem. The prac
tice of selecting men for administrative or management positions is
a tradition that is deeply ingrained. Attitudes are difficult to
change and many employers still prefer to hire men for top leader
ship positions. The researcher offers the following recommendations
for organizations that wish to achieve sexual parity in the work
place .
First, institutions must have a strong commitment to affirma
tive action. A recent study by the U.S. Labor Department has found
that, indeed, affirmative action does work. The study discovered
that "the percentages of women and minorities hired and promoted in
Reproduced with permission of the copyright owner. Further reproduction prohibited without permission.
123key j-'bs has increased much more in companies required to take
affirmative action to improve their lot than in comparable companies
not subject to these requirements" (Simpson, 1984, p. 104). Most
importantly, the commitment must come from the top. Safron (1984)
found that the key to success in affirmative action is the commit
ment of the chief executive officer.
Secondly, organizations should actively recruit qualified
female candidates for leadership positions. It is often argued that
there are no qualified women. This is a myth. The present study
shows that there are many qualified women available. Institutions
can get the names of qualified women from departments of educational
administration, university placement offices, and professional orga
nizations. Also, they should not overlook women within their own
organizations.
Thirdly, institutions must examine their hiring and promotional
practices and eliminate any biases that might adversely affect women.
They should look at the makeup of their search committees. Search
committees should consist of both men and women who are committed to
equal employment opportunity and affirmative action.
Some institutions are going one step further. They are develop
ing special programs to help women gain administrative experience.
One example is the "Leaders for the 80's" project sponsored by The
League for Innovation in the Community College and The American
Association of Women in Community and Junior Colleges. The purpose
of this program is to identify women in community colleges who show
administrative potential and give them an opportunity to improve
Reproduced with permission of the copyright owner. Further reproduction prohibited without permission.
124their administrative competencies. Selected participants develop a
project that will benefit their local campus and develop additional
administrative skills. They also participate in a 1-week national
training workshop.
Another example of an innovative new program is "The Management
Associates Program" at Western Michigan University. The purpose of
this program is to provide individuals, especially women and minor
ities, with an opportunity to work as administrative associates with
senior management personnel at the university. A.ccording to Western
Michigan University President, Dr. John T. Bernhard, "programs will
be designed to give participants the visibility, legitimacy and some
experience in senior management roles." Programs such as these will
definitely help women gain the experience and visibility they need
to move into leadership roles.
Suggestions for Further Study
This study explored differences in the career aspirations, job
seeking patterns, and career patterns of men and women who complete
doctorates in educational administration or educational leadership.
A replication of this study should be done using a nationally
representative sample of doctorates in educational administration to
determine if national findings are consistent with the findings of
this study using graduates of the Mid-American Conference schools.
The MAC schools are located in the Midwest where the economy is poor
and unemployment is higher than the national average. These factors
could have had some effect on the outcome of the study. A nationally
Reproduced with permission of the copyright owner. Further reproduction prohibited without permission.
125focused study would eliminate regional biases.
This same study could be replicated in several years to deter
mine if any changes have taken place. The increase in the number
of women completing doctorates in educational administration is a
fairly recent phenomenon. It would be interesting to see if some of
the differences found in this study still exist in 5 or 10 years.
The purpose of this study was to determine if there were dif
ferences in the career aspirations, job seeking patterns, and career
patterns of men and women who complete doctorates in educational
administration. Differences were found on many of the factors
studied. No attempt was made to determine "why this is so?" More
studies need to be designed which ascertain why these differences
exist. For example, why are so few women interested in becoming
superintendents? Why did so many women perceive sex discrimination
as a constraint to their career progress?
In the section on job seeking patterns, it was discovered that
the women doctorates were applying for more administrative or man
agement positions when looking for their present job. Yet, fewer
women are currently working in administrative or management posi
tions. This raises the question, are women having more difficulty
getting interviews and job offers for administrative or management
jobs? More research needs to be conducted on job seeking patterns
of men and women doctorates in educational administration. The
researcher recommends that this be done through in-depth' interviews
where more detailed information could be gathered.
Reproduced with permission of the copyright owner. Further reproduction prohibited without permission.

APPENDICES
126
Reproduced with permission of the copyright owner. Further reproduction prohibited without permission.

Appendix A
The Organizational Chart
127
Reproduced with permission of the copyright owner. Further reproduction prohibited without permission.
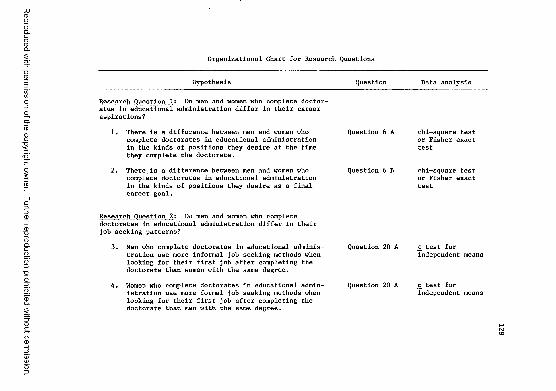
Reproduced
with perm
ission of the
copyright owner.
Further reproduction
prohibited w
ithout permission.
Organizational Chart for Research Questions
Hypothesis Question Data analysis
Research Question 1 : Do men and women who complete doctorates in educational administration differ in their career aspirations?
1. There is a difference between men and women who Question 6 Acomplete doctorates in educational administrationin the kinds of positions they desire at the time they complete the doctorate.
2. There is a difference between men and women who Question 6 Bcomplete doctorates in educational administrationin the kinds of positions they desire as a final career goal.
chi-square test or Fisher exact test
chi-square test or Fisher exact test
Research Question 2: Do men and women who completedoctorates in educational administration differ in their job seeking patterns?
3. Men who complete doctorates in educational administration use more informal job seeking methods when looking for their first job after completing the doctorate than women with the same degree.
4. Women who complete doctorates in educational administration use more formal job seeking methods when looking for their first job after completing the doctorate than men with the same degree.
Question 20 A t̂ test for independent
Question 20 A Ji test forindependent means
128
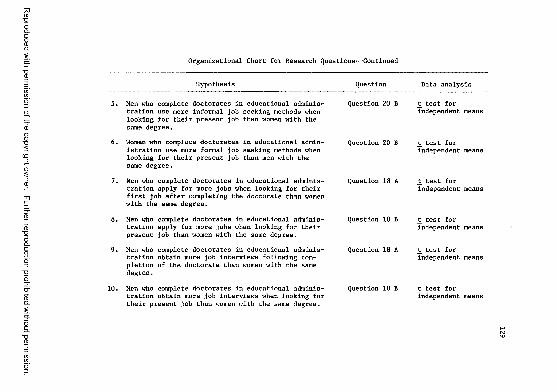
Reproduced
with perm
ission of the
copyright owner.
Further reproduction prohibited
without perm
ission.
Organizational Chart for Research Questions— Continued
Hypothesis Question Data analysis
Men who complete doctorates in educational administration use more informal job seeking methods when looking for their present job than women with the same degree.
Women who complete doctorates in educational administration use more formal job seeking methods when looking for their present job than men with the same degree.
Men who complete doctorates in educational administration apply for more jobs when looking for their first job after completing the doctorate than women with the same degree.
Question 20 B _t test forindependent means
Question 20 B t̂ test forindependent means
Question 18 A t̂ test forindependent means
Men who complete doctorates in educational administration apply for more jobs when looking for their present job than women with the same degree.
Men who complete doctorates in educational administration obtain more job interviews following completion of the doctorate than women with the same degree.
Question 18 B t̂ test for independent
Question 18 A J: test forindependent means
Men who complete doctorates in educational administration obtain more job interviews when looking for their present job than women with the same degree.
Question 18 B t̂ test forindependent means
129
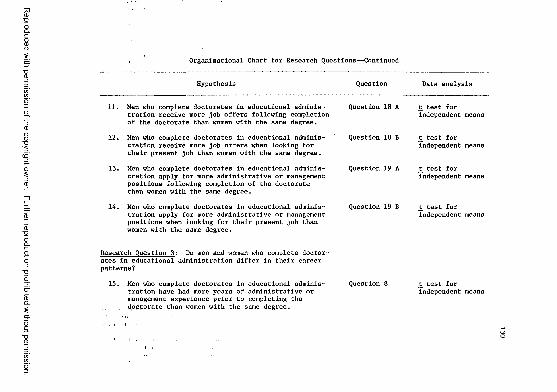
Reproduced
with perm
ission of the
copyright owner.
Further reproduction
prohibited w
ithout permission.
Organizational Chart for Research Questions— Continued
Hypothesis Question Data analysis
11. Men who complete doctorates in educational adminis- Question 18 Atration receive more job offers following completionof the doctorate than women with the same degree.
12. Men who complete doctorates in educational adminis- Question 18 Btration receive more job offers when looking fortheir present job than women with the same degree.
13. Men who complete doctorates in educational adminis- Question 19 Atration apply for more administrative or managementpositions following completion of the doctorate than women with the same degree.
14. Men who complete doctorates in educational adminis- Question 19 Btration apply for more administrative or managementpositions when looking for their present job than women with the same degree.
test for independent means
t test for independent means
Jt test for independent means
t̂ test for independent means
Research Question 3: Do men and women who complete doctorates in educational administration differ in their career patterns?
15. Men who complete doctorates in educational adminis- Question 8 jt test fortration have had more years of administrative or independent meansmanagement experience prior to completing the
, floptorate than women with the same degree.
130
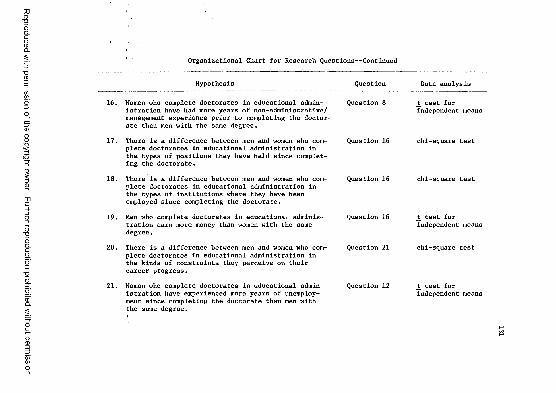
Reproduced
with perm
ission of the
copyright owner.
Further reproduction prohibited
without perm
ission.
Organizational Chart for Research Questions— Continued
Hypothesis Question Data analysis
16. Women who complete doctorates in educational administration have had more years of non-administrative/ management experience prior to completing the doctorate than men with the same degree.
17. There is a difference between men and women who complete doctorates in educational administration in the types of positions they have held since completing the doctorate.
18. There is a difference between men and women who complete doctorates in educational administration in the types of institutions where they have been employed since completing the doctorate.
19. Men who complete doctorates in educational administration earn more money than women with the same degree.
20. There is a difference between men and women who complete doctorates in educational administration in the kinds of constraints they perceive on their career progress.
21. Women who complete doctorates in educational administration have experienced more years of unemployment since completing the doctorate than men with the same degree.
Question J
Question 16
Question 16
Question 16
Question 21
Question 12
t̂ test for independent means
chi-square test
chi-square test
J: test for independent means
chi-square test
t̂ test for independent means
131
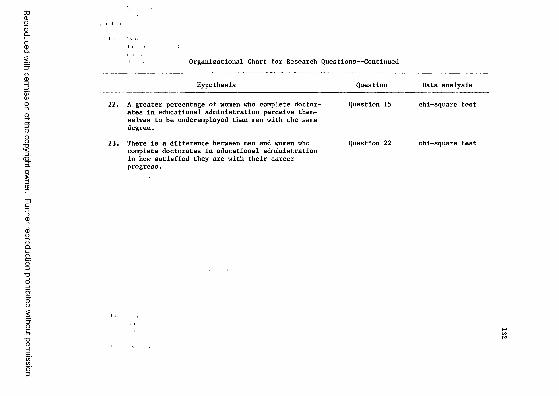
Reproduced
with perm
ission of the
copyright owner.
Further reproduction
prohibited w
ithout permission.
Organizational Chart for Research Questions— Continued
Hypothesis Question Data analysis
22. A greater percentage of women who complete doctor- Question 15 chi-square testates in educational administration perceive themselves to be underemployed than men with the samedegree.
23. There is a difference between men and women who Question 22 chi-square testcomplete doctorates in educational administrationin how satisfied they are with their career progress.
132

Appendix B
The Questionnaire
133
Reproduced with permission of the copyright owner. Further reproduction prohibited without permission.
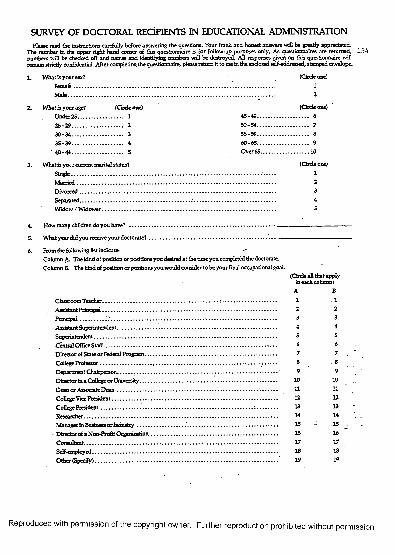
SURVEY OF DOCTORAL RECIPIENTS IN EDUCATIONAL ADMINISTRATIONPlease read the instructions carefully before answering the questions. Your frank and honest answers will be greatly appreciated.
The number in the upper right hand comer of this questionnaire is for follow-up purposes only. As questionnaires are returned, 134 numbers will be checked off and names and identifying numbers will be destroyed. All responses given on this questionnaire will remain strictly confidential. After completing the questionnaire, please return it to me in the enclosed self-addressed, stamped envelope.
1. What is your sex? (Circle one)
Male............................................................................................................................................. 2
What is your age? (Circle ojUnder 25............................... 125 -29................................... 230-34................................... 335 - 39................................... 4
' 40-44................................... 5
What is yo-. r current marital status?Single............................................M arried........................................Divorced......................................Separated......................................Widow / Widower.......................
(Grdeone)45-49................................... 65 0 -5 4 .. . ............................. 7
60 - 65................................... 9Over 65..................................10
4. How many children do you have? ..............
5. What year did you receive your doctorate? .
From the following list indicate:Column A. The kind of position or positions you desired at the time you completed the doctorate. Column B. The kind of position or positions you would consider to be your final occupational goal.
(Circle all that apply
Assistant Principal...............................Principal..............................................Assistant Superintendent.....................Superintendent.....................................Central Office S taff.............................Director of State or Federal Program..College Professor.................................Department Chairperson.....................Director in a College or University----Dean or Associate D ean .....................College Vice President.........................College President.................................Researcher............Manager in Busines
• Director of a Non-Profit Organization .Consultant..............................................Self-employed.........................................Other (Specify).......................................
in each column)A B1 . 12 23 • 34 45 56 67 7 . "8 89 9
10 1011 1112. 1213 1314 14 _IS 7 " . 15 ..16 1617 1718 1819 19
Reproduced with permission of the copyright owner. Further reproduction prohibited without permission.
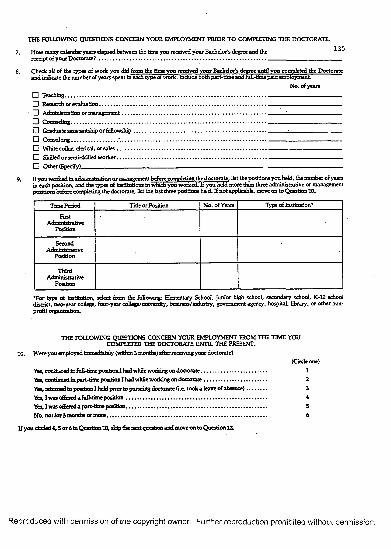
THE FOLLOWING QUESTIONS CONCERN YOUR EMPLOYMENT PRIOR TO COMPLETING THE DOCTORATE.1357. How many calendar years elapsed between the time you received your Bachelor's degree and the
receipt of your Doctorate?........................................................................................................ ....... .....................................................
8. Check aS of die types of work you did from the time you received your Bachelor's degree until you completed the Doctorate and indicate the number of years spent in each type of work. Include both part-time and full-time paid employment
No. of years□ Teaching......................................................................................................................................... ...................................................□ Research or evaluation.................................................................................................... .................................................................□ Administration or management--------------------------------------------------------------------------- :----------------------------I I Counseling..................................................................................................................................... ...................................................D Graduate assistantship or fellowship............................................................................................ :---------------------------□ Consulting.........................................................................................................................................................................................□ White collar, clerical, or sales.........................................................................................................................................................□ Skilled or semi-skilled worker.........................................................................................................................................................O Other (Specify)____________________________________________________________ ________________________
breach position, and ’the ty p e of institutions in which y w worked. If you heJcTmore than three administrative or management positions before completing the doctorate, list the last three positionsheld. If not applicable, move on to Question 10.
Tune Period Title or Position No. of Years Type of Institution*
FirstAdministrative
Position
SecondAdministrative
Position
ThirdAdministrative
Position
•For type of institution, select from the following: Elementary School, junior high school, secondary school, K-12 school district, two-year college, four-year college/university, business/industry, government agency, hospital, library, or other nonprofit organization.
THE FOLLOWING QUESTIONS CONCERN YOUR EMPLOYMENT FROM THE TIME YOU COMPLETED THE DOCTORATE UNTIL THE PRESENT.
10. Were you employed immediately (within 3 months) after receiving your doctorate?(Circle one)
Yes, continued in full-time position I had while working on doctorate............................................. 1Yes, continued in part-time position I had while working on doctorate........................................... 2Yes, returned to position I held prior to pursuing doctorate (i.e. took a leave of absence).............. 3Yes, I was offered a full-time position................................................................................................ 4Yes, I was offered a part-time position ...................... 5No, not for 3 months or more...... 1............................. 6
If you circled 4,5 or 6 in Question 10, skip the next question and move on to Question 12.
Reproduced with permission of the copyright owner. Further reproduction prohibited without permission.
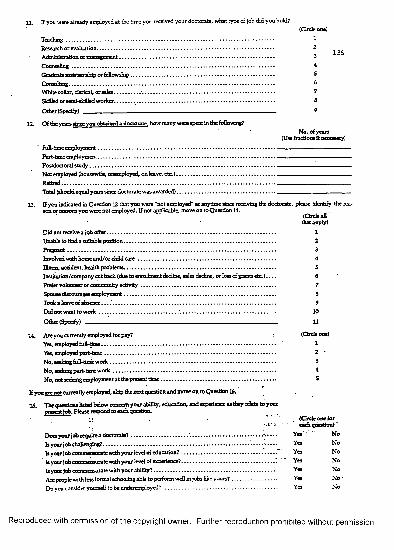
11. If you were already employed at the time you received your doctorate, what type of job did you hold?(Circle one)
Teaching.............................................................................................................................................. 1Research or evaluation........................................................................................................................ 2Administration or management.......................................................................................................... 3Counseling.......................................................................................................................................... 4Graduate assistantship or fellowship.................................................................................................. 5Consulting........................................................................................................- .................................. 6White collar, clerical, orsales................... 7Skilled or semi-skilled worker............. 8
Other (Specify) _____________ 9
12. Of the years since you obtained a doctorate, how many were spent in the following?No. of years
(Use fractions if necessary)Full-time employment............................................................................................................................................................................Part-time employment......................................................................................................................... ...................................................Postdoctoral study..................................................................................................................................................................................Not employed (housewife, unemployed, on leave, etc.)................................................................... ...................................................Retired.....................................................................................................................................................................................................Total (should equal years since doctorate was awarded)................................................................... ...................................................
13. If you indicated in Question 12 that you were "not employed" at anytime since receiving the doctorate, please identify the rea son or reasons you were not employed. If not applicable, move on to Question 14.
(Circle all that apply)
Did not receive a job offer................................................................................................................................. 1Unable to find a suitable position........................................................................................................ 2Pregnant.................................................................................................. 3Involved with home and/or child c a re .............................................................................................. 4Illness, accident, health problems........................................................................................................ 5Institution/company cut back (due to enrollment decline, sales decline, or loss of grants etc.) . 6Prefer volunteer or community activity............................................................................................ 7Spouse discourages employment........................................................................................................ 8Took a leave of absence....'............................................................................................................... 9Did not want to w o rk ..................................................................................................... 10
Other (Specify) _______________________________________ 11
14. Are you currently employed for pay? . (Circle one)Yes, employed full-time....................................................................................................................... 1Yes, employed part-time 2 -No, seeking fuQ-tirrie w ork ................................................................................................................. 3No, seeking part-time w o rk ............................................................................................................... 4No, not seeking employment a t the present time............................................................................... 5
If you are not currently employed, skip the next question and move on to Question 16.
15. The questions listed below concern your ability, education, and experience as theyrdate to your present fob. Pkaseraspond to each question.
Does your job require a doctorate? ............................. ................................................. Yes NoIs your job challenging?....................... • ....... Yes NoIs your job commensurate with your level of education? ....................................................... Yes NoIs your job commensurate with your level of experience?................................................................. Yes NoIs your job commensurate with your ability7 .................................................................................... Yes NoAre people with less formal schooling able to perform well in jobs like yours7............................... Yes No -Do you consider yourself to be underemployed?.............................................................................. Yes No
Reproduced with permission of the copyright owner. Further reproduction prohibited without permission.
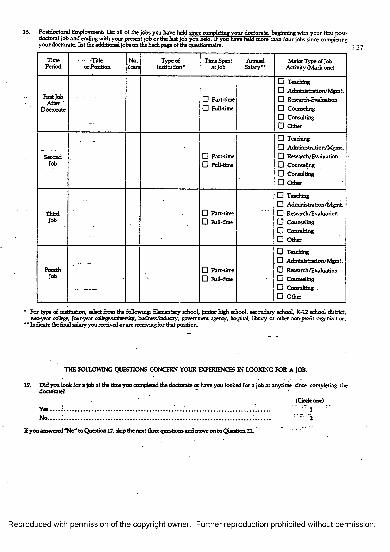
16. Postdoctoral Employment: List all of the jobs you have held since completing your doctorate, beginning with your first postdoctoral job and ending with your present job or the last job you held. If you have held more than four jobs since completing your doctorate, list the additional jobs on the back page of the questionnaire.
TimePeriod
- - -Title or Position
No.Years
Type of Institution*
Tune Spent a t Job Salary**
Major Type of Job Activity (Mark one)
First Job After '
Doctorate—
D Part-time O Full-time
O Teaching□ Administration/Mgmt. O Research-Evaluation□ Counseling G Consulting D Other
SecondJob
D Part-time D Full-time
D TeachingG Administration/Mgmt. G Research/Evaluation G Counseling G Consulting Q Other
ThirdJob
□ Part-time D Full-time
G TeachingG Administration/Mgmt. G Research/Evaluation G Counseling G Consulting Q Other
FourthJob
D Part-time D Full-time
G TeachingG Administration/Mgmt. Q Research/Evaluation G Counseling G Consulting .Q Other
* For type of institution, select from die following: Elementary school, junior high school, secondary school; K-12 school district, two-year college, four-year college/university, business/industry, government agency, hospital, library or other nonprofit organization.
** Indicate the final salary you received or are receiving for that position.
THE FOLLOWING QUESTIONS CONCERN YOUR EXPERIENCES IN LOOKING FOR A JOB.
17. Did you look for a job at die time you completed the doctorate or have you looked for a job at anytime since completing the doctorate?
(Cirde one)Y es. . . . : .......................................................................... .......................................................^ ~ J 1No.....:.......................................... “ vt:- r2
If you answered *TJo" to Question 17, skip the next three questions and move on to Question 21.
137
Reproduced with permission of the copyright owner. Further reproduction prohibited without permission.
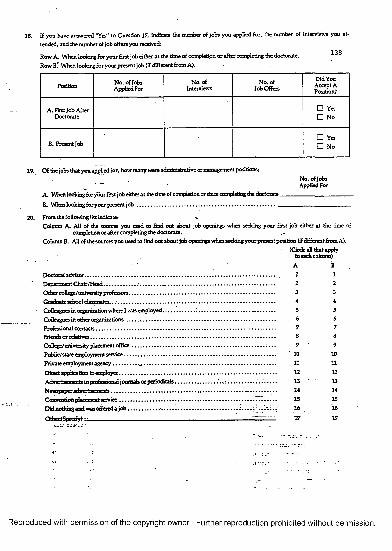
If you have answered "Yes" to Question 17, indicate the number of jobs you applied for, the number of interviews you attended, and the number of job offers you received:
138Row A. When looking for your first job either at the time of completion or after completing the doctorate.Row B.’ When looking for your present job (if different from A).
Position No. of Jobs Applied For
No. of Interviews
No. of Job Offers
DidYou Accept A Position7
A. First Job After Doctorate
□ Yes□ No
B. Present Job□ Yes□ No
19. Of the jobs that you applied for, how many were administrative or management positions:No. of Jobs Applied For
A. When looking for your fis t job either at the time of completion or since completing the doctorate _
B. When looking for your present j o b ..............................................................................- .............. .....
20. From the following list indicate:Column A. AB of the sources you used to find out about job openings when seeking your first job either at the time of
completion or after completing the doctorate.Column B. AD of the sources you used to find out about job openings when seeking your present position (if different from A).
Othe: ty professors..Graduate school classmates.. . ........ ...................Colleagues in organization where I was employed..Colleagues in other organizations...........................Professional contacts................................................
College/university placement office...............................Public/state employment service.....................................Private employment agency............................................Direct application to employer.........................................Advertisements in professional journals or periodicals..
Convention placement service........Did nothing and was offered a job.. Othet Specify>__________
(Circle all that applyin each column)
A B1 12 23 34 45 5
. 6 67 78 89 9
‘ 10 1011 1112 1213 1314 14IS IS16 ....... "16
17 17
Reproduced with permission of the copyright owner. Further reproduction prohibited without permission.
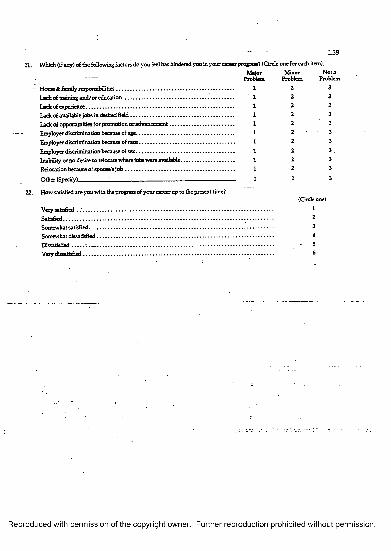
- — 13921. Which (if any) of the following factors do you feel has hindered you in your career progress? (Circle one for each item).
Major. .. Minor Not aProblem Problem Problem
- Home & family responsibilities . 1 2 3Lack of training and/or education 1 2 3Lade of experience 1 2 3Lack of available jobs in desired field 1 2 3Ladcofopportunitiesforpromotionoradvancement 1 2 3Employer discrimination because of age................................................................... 1 2 3Employer discrimination because of race 1 2 3Employer discrimination because of sex................................................................... 1 2 3Inability or no desire to relocate where jobs were available..................................... 1 2 3Relocation because of spouse's jo b 1 2 3
Other (Specify)__________ 1 2 3
22." How satisfied are you with the progress of your career up to the present time?(Circle one)
Very satisfied ............................................................................................................................................... 1Satisfied............................................................................................... 2Somewhat satisfied.......................................................................................................................................... 3Somewhat dissatisfied...................................................................................................................................... 4Dissatisfied ........................................................................................................................ - 5Very dissatisfied............................................................................................................................................... 6
Reproduced with permission of the copyright owner. Further reproduction prohibited without permission.

Appendix C
The Cover Letter
140
Reproduced with permission of the copyright owner. Further reproduction prohibited without permission.
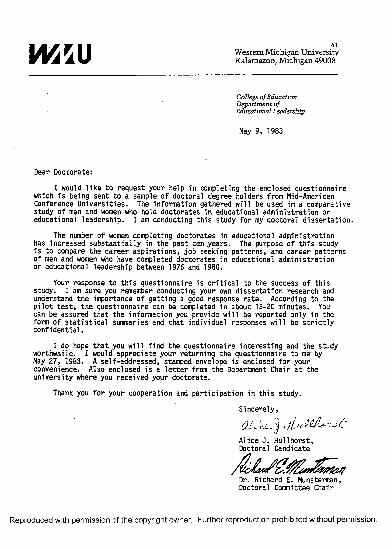
141Western Michigan University Kalamazoo, Michigan 49008
College of Education Department of Educational Leadership
May 9, 1983
Dear Doctorate:I would like to request y our help in completing the enclosed questionnaire
which is being sent to a sample of doctoral degree holders from Mid-American Conference Universities. The information gathered will be used in a comparative study of men and women who hold doctorates in educational administration or educational leadership. I am conducting this study for my doctoral dissertation.
The number of women completing doctorates in educational administration has increased substantially in the past ten years. The purpose of this study is to compare the career aspirations, job seeking patterns, and career patterns of men and women who have completed doctorates in educational administration or educational leadership between 1976 and 1980.
Your response to this questionnaire is critical to the success of this study. I am sure you remember conducting your own dissertation research and understand the importance of getting a good response rate. According to the pilot test, the questionnaire can be completed in about 15-20 minutes. You can be assured that the information you provide will be reported only in the form of statistical summaries and that individual responses will be strictly confidential.
I do hope that you will find the questionnaire interesting and the study worthwhile. I would appreciate you r returning the questionnaire to m e by May 27, 1983. A self-addressed, stamped envelope is enclosed for y our convenience. Also enclosed is a letter from the Department Chair at the university w here you received y our doctorate.
Thank you for you r cooperation and participation in this study.Sincerely,
Alice J. Hullhorst, Doctoral Candidate
Dr. Richard E. Munsterman, Doctoral Committee Chair
Reproduced with permission of the copyright owner. Further reproduction prohibited without permission.

Appendix D
Endorsing Letters
Reproduced with permission of the copyright owner. Further reproduction prohibited without permission.
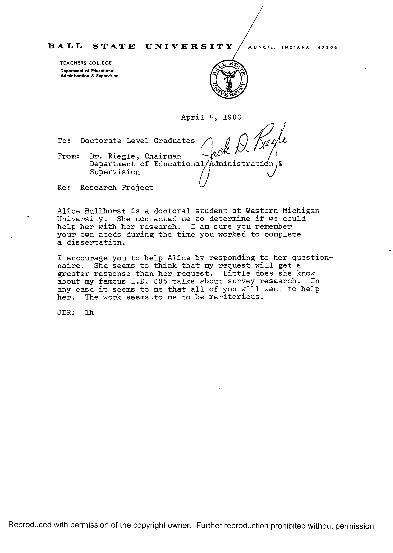
B A L L S T A T E U N I V E R S I T Y
April
To: Doctorate Level GraduatesFrom: Dr. Riegle, Chairman C * [ I
Department of Educational/Administratiqn IS Supervision / j \y
Re: Research Project
Alice Hullhorst is a doctoral student at Western Michigan University. She contacted me to determine if we could help her with her research: I am sure you rememberyour own needs during the time you worked to complete a dissertation.I encourage you to help Alice by responding to her questionnaire. She seems to think that my request will get a greater response than her request. Little does she know about my famous I.D. 60 5 talks about survey research. In any case it seems to me that all of you will want to help her. The work seems .to me to be meritorious.JDR: lh
Reproduced with permission of the copyright owner. Further reproduction prohibited without permission.
Bowling Green State UniversityDepartment of Educational Administration
and Supervision Room 529 Education Building Bowling Green. Ohio 43403
Cable: BCSUOH
Dear Graduate:
Enclosed is a questionnaire from Alice Hullhorst, a doctoral student at Western Michigan University.The questionnaire seeks information about the career aspirations, job seeking patterns, and career patterns of doctoral degree holders in educational administration from universities in the Mid-American Conference.Ms. Hullhorst has asked for our help in identifying some of our graduates in this study.
We are happy to cooperate in this study and hope you too will be willing to assist Ms. Hullhorst in her dissertation research. I believe this study merits your attention; therefore, I encourage you to respond to this questionnaire.
LesTie J .\cjhamber lin Chair of EDAS
LJC/lam
Enclosure
Telephone: (419) - 372-0151
Reproduced with permission of the copyright owner. Further reproduction prohibited without permission.
K E N T S T A T E U N I V E R S I T Y DEPARTMENT OF ADMINISTRATIONKENT. OHIO 44242 EDUCATIONAI.1 MINISTRATION 216) 672-2294
TO: Departmental Doctoral Graduates
FROM: William Konnert
DATE: April 13, 1983
SUBJECT: Enclosed Research Request
Enclosed is a questionnaire from Alice Hullhorst, a doctoral student at Western Michigan University. The questionnaire seeks information about the career aspirations, job seeking patterns, and career patterns of doctoral degree holders in educational administration from universities in the Mid-American Conference. Ms. Hullhorst has asked for departmental help in identifying doctoral graduates for this study.
While the questionnaire does require some of your time to complete, the study does have the potential of providing valuable information.The Department will be provided with a copy of the final product.
Hope things are going well!!
Reproduced with permission of the copyright owner. Further reproduction prohibited without permission.
WK/mlb
SCHOOL OF EDUCATION AND ALLIED PROFESSIONSM iam i University O xford , O h io 45056Department of Educational Leadership (513) 529-6825
80thANNIVERSARY
Dear EDL Graduate:Please pardon this form letter which is necessary under the circumstances.
Ms. Alice Hullhorst, a doctoral student at Western Michigan University, is engaged in dissertation research (surely, you remember those agonies!). She is studying career aspirations, job seeking patterns, and career patterns of doctoral degree holders from various universities, and she has asked our help in identifying some of our graduates. We are happy to cooperate in what promises to be significant research, and we hope that you too will assist Ms. Hullhorst.
The questionnaire which is enclosed seeks information, the source of which I am certain will remain confidential. I have complete confidence in the integrity of the WMU department with respect to preserving anonymity and completing the study.
As always, we (and Ms. Hullhorst) thank you for your cooperation.Cordially,
^ a m e s R. ShowkeirJRS:jf
An Equal Opportunity Employer
Reproduced with permission of the copyright owner. Further reproduction prohibited without permission.
Northern Illinois University QDeKalb, Illinois 60115
Department of Leadership and Educational Policy Studies 815 753 1491
March 24, 1983
Recipients of Doctoral Degrees in Educational Administration from Northern Illinois University
Dear Friends:
Greetings from all of us here at Northern. I trust this finds you healthy, happy, and professionally active.
I want to indicate my awareness of the research Alice Hullhorst is conducting for purposes of completing her doctoral program at Western Michigan University, and to assure you that she has my support for her study. I hope you will find it possible to respond to her survey so that NIU will be appropriately represented in her findings.
I'm sure we all remember our anxieties about achieving good response rates for our dissertation research, and the appreciation we felt for the assistance we received from our professional colleagues.I'm certain Ms. Hullhorst will be equally appreciative of your consideration in responding to her questionnaire.
Best wishes for continued success in all of your endeavors.
Sincerely yours,
Department of Leadership and Educational Policy Studies
KRG/as
Northern Illinois University is an Equal OoDortunity/Affirmative Action Employer
Reproduced with permission of the copyright owner. Further reproduction prohibited without permission.
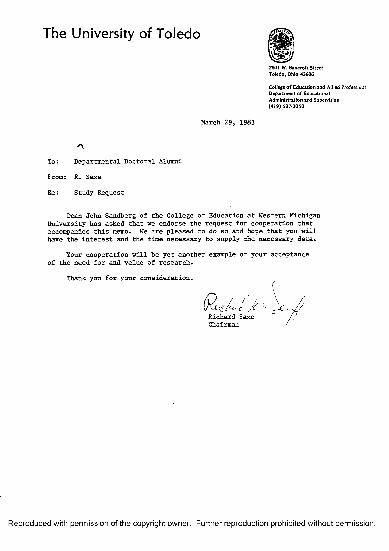
T h e Unive r s i t y o f T o l e d o2801 W. Bancroft Street Toledo, Ohio 43606
College of Education and Allied Professions Department of Educational Administration and Supervision (419) 537-2050
March 29, 1983
To: Departmental Doctoral Alumni
From: R. Saxe
Re: Study Request
Dean John Sandberg of the College of Education at Western Michigan University has asked that we endorse the request for cooperation that accompanies this memo. We are pleased to do so and hope that you will have the interest and the time necessary to supply the necessary data.
Your cooperation will be yet another example of your acceptance of the need for and value of research.
Thank you for your consideration.
Richard Saxe Chairman
Reproduced with permission of the copyright owner. Further reproduction prohibited without permission.
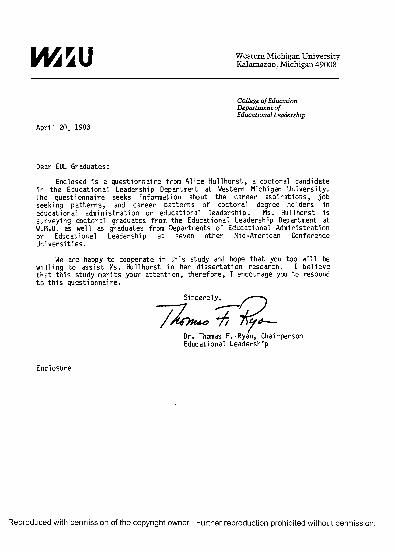
Western Michigan University Kalamazoo, Michigan 49008
College of Education Department of Educational Leadership
April 20, 1983
Dear EDL Graduates:Enclosed is a questionnaire from Alice Hullhorst, a doctoral candidate
in the Educational Leadership Department at Western Michigan University. The questionnaire seeks information about the career aspirations, job seeking patterns, and career patterns of doctoral degree holders in educational administration or educational leadership. Ms. Hullhorst is surveying doctoral graduates from the Educational Leadership Department at W.M.U. as well as graduates from Departments of Educational Administration or Educational Leadership at seven other Mid-American Conference Universities.
We are happy to cooperate in this study and hope that you too will be willing to assist Ms. Hullhorst in her dissertation research. I believe that this study merits your attention, therefore, I encourage you to respond to this questionnaire.
Sincerely,
Dr. Thomas F.-Ryan, Chairperson Educational Leadership
Enclosure
Reproduced with permission of the copyright owner. Further reproduction prohibited without permission.

Appendix E
Follow-Up Letter
Reproduced with permission of the copyright owner. Further reproduction prohibited without permission.
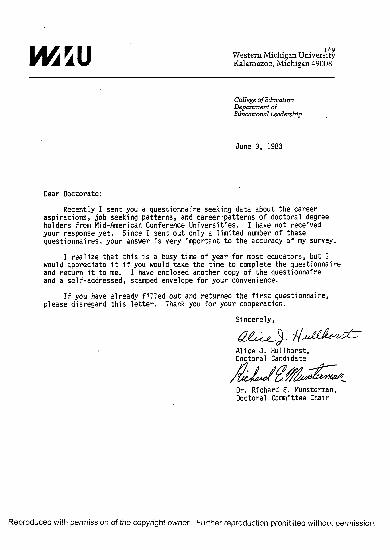
IYAU Western Michigan University Kalamazoo, Michigan 49008
College of Education Department of Educational Leadership
June 3, 1983
Dear Doctorate:Recently I sent you a questionnaire seeking data about the career
aspirations, job seeking patterns, and career patterns of doctoral degree holders from Mid-American Conference Universities. I have not received your response yet. Since I sent out only a limited number of these questionnaires, you r answer is very important to the accuracy of my survey.
I realize that this is a busy time of year for most educators, but I would appreciate it if you would take the time to complete the questionnaire and return it to me. I have enclosed another copy of the questionnaire and a self-addressed, stamped envelope for your convenience.
If you have already filled out and returned the first questionnaire, please disregard this letter. Thank you for y our cooperation.
Sincerely,
Alice J. Hullhorst, Doctoral Candidate
Dr. Richard E. Munsterman, Doctoral Committee Chair
Reproduced with permission of the copyright owner. Further reproduction prohibited without permission.

Appendix F
Follow-Up Postcard
Reproduced with permission of the copyright owner. Further reproduction prohibited without permission.
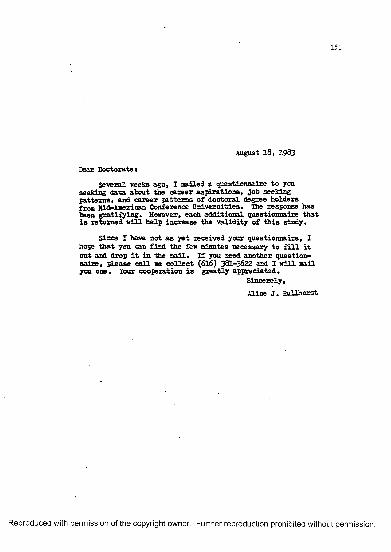
151
August 18 , 1983
Dear D o c to ra te :
S ev e ra l weeks ago , I m ailed a q u e s tio n n a ire t o you seeking d a ta about th e c a re e r a s p i r a t io n s , jo b seek ing p a tte rn s , and c a re e r p a tte rn s o f d o c to ra l degree h o ld e rs from Mid-American Conference U n iv e rs i t ie s . Hie response has been g r a t i f y in g . However, each a d d it io n a l q u e s tio n n a ire t h a t i s re tu rn e d w i l l h e lp in c re a se th e v a l id i ty o f t h i s s tu d y .
Since I have n o t a s y e t rece iv ed your q u e s tio n n a ire , I hope t h a t you can f in d th e few m inutes n ecessary to f i l l i t o u t and d ro p i t in th e m a il. I f you need a n o th e r q u e s tio n n a ir e , p lea se c a l l me c o l l e c t (6 l6 ) 381-3622 and I w i l l m ail you one. lo u r c o o p e ra tio n i s g r e a t ly a p p re c ia te d .
S in c e re ly ,
A lice J . H u llh o rs t
Reproduced with permission of the copyright owner. Further reproduction prohibited without permission.
Appendix G
List of Positions Held by Respondents
Reproduced with permission of the copyright owner. Further reproduction prohibited without permission.
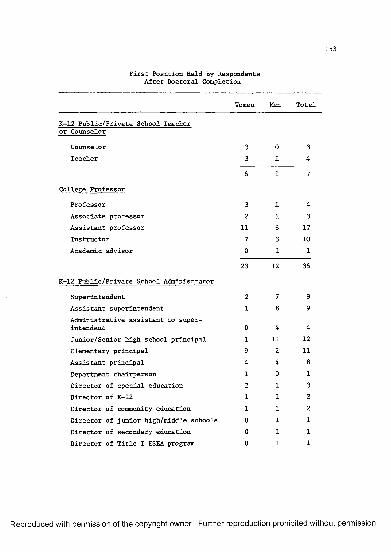
153
First Position Held by RespondentsAfter Doctoral Completion
Women Men Total
K-12 Public/Private School Teacheror Counselor
Counselor 3 0 3Teacher 3 1 4
6 1 7
College Professor
Professor 3 1 4Associate professor 2 1 3Assistant professor 11 6 17Instructor 7 3 10Academic advisor 0 1 1
23 12 35
K-12 Public/Private School Administrator
Superint endent 2 7 9Assistant superintendent 1 8 9Administrative assistant to superintendent 0 4 4Junior/Senior high school principal 1 11 12Elementary principal 9 2 11Assistant principal 4 4 8Department chairperson 1 0 1Director of special education 2 1 3Director of K-12 1 1 2Director of community education 1 1 2Director of junior high/middle schools 0 1 1Director of secondary education 0 1 1Director of Title I ESEA program 0 1 1
Reproduced with permission of the copyright owner. Further reproduction prohibited without permission.
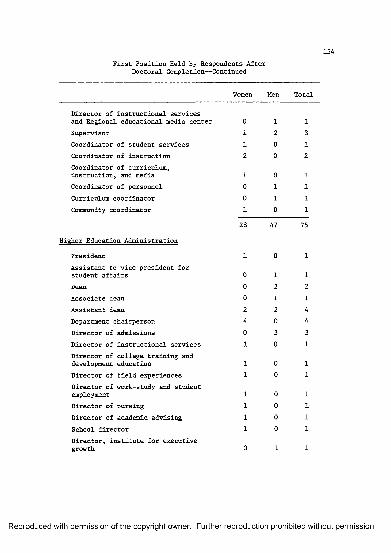
154First Position Held by Respondents After
Doctoral Completion— Continued
Women Men Total
Director of instructional servicesand Regional educational media center O i lSupervisor 1 2 3Coordinator of student services 1 0 1Coordinator of instruction 2 0 2Coordinator of curriculum,instruction, and media 1 0 1Coordinator of personnel O i lCurriculum coordinator O i lCommunity coordinator 1 0 1
28 47 75
Higher Education Administration
President 1 0 1Assistant to vice president forstudent affairs 0 1 1Dean 0 2 2Associate dean 0 1 1Assistant dean 2 2 4Department chairperson 4 0 4Director of admissions 0 3 3Director of instructional services 1 0 1Director of college training anddevelopment education 1 0 1Director of field experiences 1 0 1Director of work-study and studentemployment 1 0 1Director of nursing 1 0 1Director of academic advising 1 0 1School director 1 0 1Director, institute for executivegrowth 0 1 1
Reproduced with permission of the copyright owner. Further reproduction prohibited without permission.
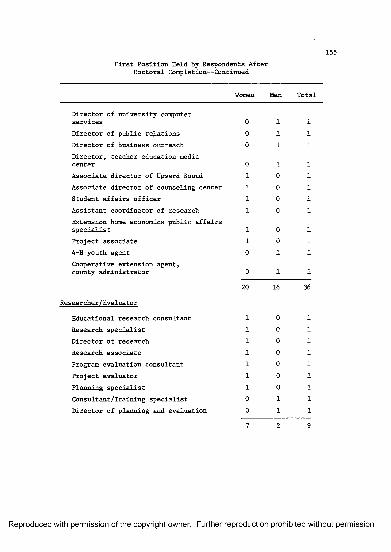
First Position Held by Respondents AfterDoctoral Completion— Continued
Women Men Total
Director of university computer services 0 1 1Director of public relations 0 1 1Director of business outreach 0 1 1Director, teacher education media center 0 1 1Associate director of Upward Bound 1 0 1Associate director of counseling center 1 0 1Student affairs officer 1 0 1Assistant coordinator of research 1 0 1Extension home economics public affairs specialist 1 0 1Project associate 1 0 14-H youth agent 0 1 1Cooperative extension agent, county administrator 0 1 1
20 16 36
Researcher/Evaluator
Educational research consultant 1 0 1Research specialist 1 0 1Director of research 1 0 1Research associate 1 0 1Program evaluation consultant 1 0 1Project evaluator 1 0 1Planning specialist 1 0 1Consultant/Training specialist 0 1 1Director of planning and evaluation 0 1 1
7 2 9
Reproduced with permission of the copyright owner. Further reproduction prohibited without permission.
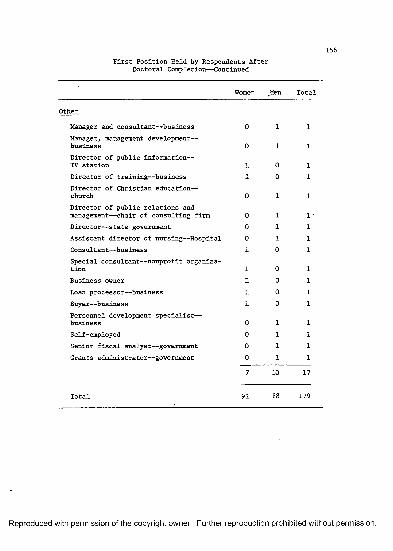
156First Position Held by Respondents After
Doctoral Completion— Continued
Women Men Total
Other
Manager and consultant— business 0 1 1Manager, management development— business 0 1 1Director of public information— TV station 1 0 1Director of training— business 1 0 1Director of Christian education— church 0 1 1Director of public relations and management— chair of consulting firm 0 1Director— state government 0 1 1Assistant director of nursing— Hospital 0 1 1Consultant— business 1 0 1Special consultant— nonprofit organization 1 0 1Business owner 1 0 1Loan processor— business 1 0 1Buyer— business 1 0 1Personnel development specialist— business 0 1 1Self-employed 0 1Senior fiscal analyst— government 0 1 1Grants administrator— government 0 1 1
7 10 17
Total 91 88 179
Reproduced with permission of the copyright owner. Further reproduction prohibited without permission.
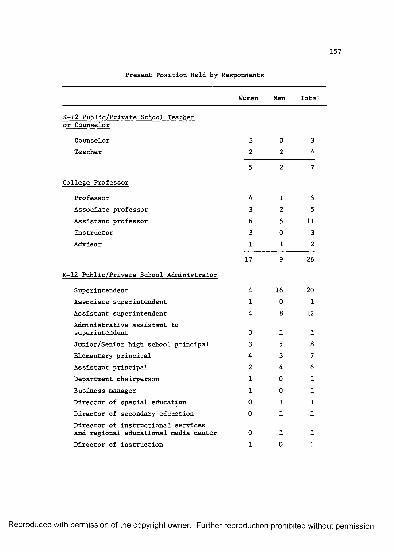
157
Present Position Held by Respondents
Women Men Total
K-12 Public/Private School Teacheror Counselor
Counselor 3 0 3Teacher 2 2 4
5 2 7
College Professor
Professor 4 1 5Associate professor 3 2 5Assistant professor 6 5 11Instructor 3 0 3Advisor 1 1 2
17 9 26
K-12 Public/Private School Administrator
Superintendent 4 16 20Associate superintendent 1 0 1Assistant superintendent 4 8 12Administrative assistant to superintendent 0 1 1Junior/Senior high school principal 3 5 8Elementary principal 4 3 7Assistant principal 2 4 6Department chairperson 1 0 1Business manager 1 0 1Director of special education 0 1 1Director of secondary education 0 1 1Director of instructional services and regional educational media center 0 1 1Director of instruction 1 0 1
Reproduced with permission of the copyright owner. Further reproduction prohibited without permission.
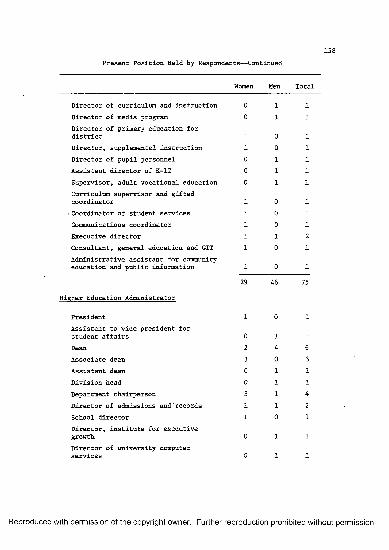
Present Position Held by Respondents— Continued158
Director of curriculum and instructionDirector of media programDirector of primary education for districtDirector, supplemental instructionDirector of pupil personnelAssistant director of K-12Supervisor, adult vocational educationCurriculum supervisor and gifted coordinator
• Coordinator of student servicesCommunications coordinatorExecutive directorConsultant, general education and GITAdministrative assistant for community education and public information
Higher Education Administrator
PresidentAssistant to vice president for student affairsDeanAssociate deanAssistant deanDivision headDepartment chairpersonDirector of admissions and recordsSchool directorDirector, institute for executive growthDirector of university computer services
Women Men Total
O i lO i l
1 0 11 0 1O i l O i l O i l
1 0 11 0 11 0 11 1 2 1 0 1
1 0 129 46 75
1 0 1
0 1 12 4 63 0 30 1 10 1 13 1 41 1 2 1 0 1
0 1 1
0 1 1
Reproduced with permission of the copyright owner. Further reproduction prohibited without permission.
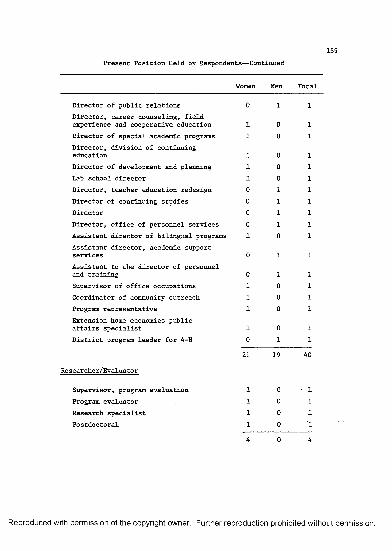
Present Position Held by Respondents— Continued159
Women Men Total
Director of public relations O i lDirector, career counseling, fieldexperience and cooperative education 1 0 1Director of special academic programs 1 0 1Director, division of continuingeducation 1 0 1Director of development and planning 1 0 1Lab school director 1 0 1Director, teacher education redesign 0 1 1Director of continuing studies 0 1 1Director 0 1 1Director, office of personnel services 0 1 1Assistant director of bilingual programs 1 0 1Assistant director, academic supportservices 0 1 1Assistant to the director of personneland training 0 1 1Supervisor of office occupations 1 0 1Coordinator of community outreach 1 0 1Program representative 1 0 1Extension home economics publicaffairs specialist 1 0 1District program leader for 4-H 0 1 1
21 19 40
Researcher/Evaluator
Supervisor, program evaluation 1 0 - 1Program evaluator 1 0 1Research specialist 1 0 1Postdoctoral 1 0 1
4 0 4
Reproduced with permission of the copyright owner. Further reproduction prohibited without permission.
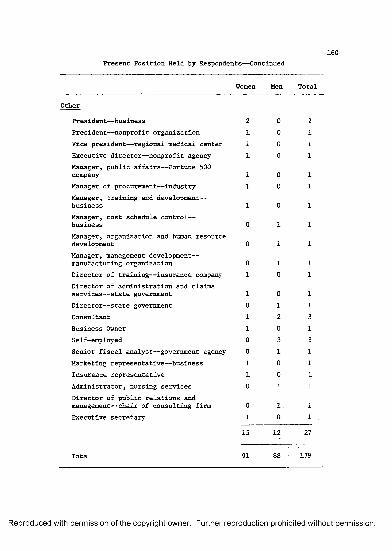
Present Position Held by Respondents— Continued
Women Men Total
Other
Pres ident— bus iness 2 0 2President— nonprofit organization 1 0 1Vice president— regional medical center 1 0 1Executive director— nonprofit agency 1 0 1Manager, public affairs— Fortune 500 company 1 0 1Manager of procurement— industry 1 0 1Manager, training and development— business 1 0 1Manager, cost schedule control— business 0 1 1Manager, organization and human resource development 0 1 1Manager, management development— manufacturing organization 0 1 1Director of training— insurance company 1 0 1Director of administration and claims services— state government 1 0 1Director— state government 0 1 1Consultant 1 2Business Owner 1 0 1Self-employed 0 3 3Senior fiscal analyst— government agency 0 1 1Marketing representative— business 1 0 1Insurance representative 1 0 1Administrator, nursing services 0 1 1Director of public relations and management— chair of consulting firm 0 1. 1Executive secretary 1 0
15 12 27
Total 91 88 179
Reproduced with permission of the copyright owner. Further reproduction prohibited without permission.

List of Institutions in Which Respondents Were Employed
161
Reproduced with permission of the copyright owner. Further reproduction prohibited without permission.
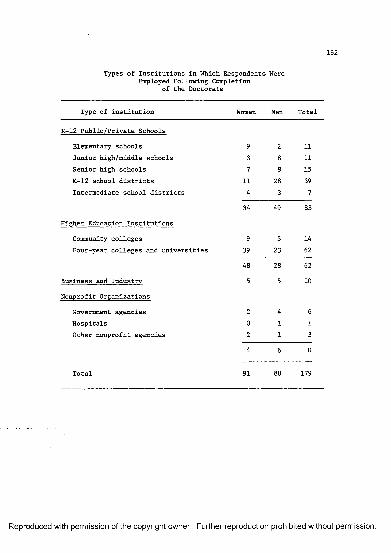
Types of Institutions in Which Respondents Were Employed Following Completion
of the Doctorate
Type of institution Women Men Total
K-12 Public/Private Schools
Elementary schools 9 2 11Junior high/middle schools 3 8 11Senior high schools 7 8 15K-12 school districts 11 28 39Intermediate school districts 4 3 7
34 49 83
Higher Education Institutions
Community colleges 9 5 14Four-year colleges and universities 39 23 62
48 28 62
Business and Industry 5 5 10
Nonprofit Organizations
Government agencies 2 4 6Hospitals 0 1 1Other nonprofit agencies 2 1 3
4 6 10
Total 91 88 179
Reproduced with permission of the copyright owner. Further reproduction prohibited without permission.
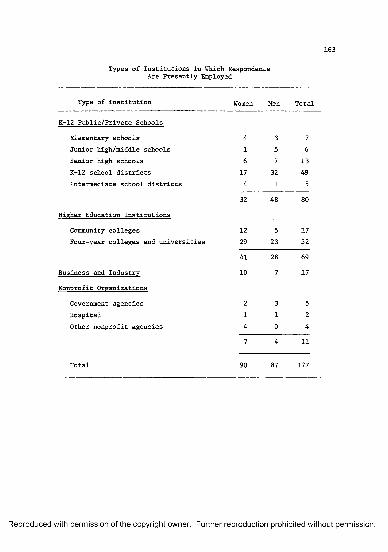
163
Types of Institutions in Which Respondents Are Presently Employed
Type of institution Women Men Total
K-12 Public/Private Schools
Elementary schools 4 3 7Junior high/middle schools 1 5 6Senior high schools 6 7 13K-12 school districts 17 32 49Intermediate school districts 4 1 5
Higher Education Institutions
32 48 80
Community colleges 12 5 17Four-year colleges and universities 29 23 52
41 28 69
Business and Industry 10 7 17
Nonprofit Organizations
Government agencies 2 3 5Hospital 1 1 2Other nonprofit agencies 4 0 4
7 4 11
Total 90 87 177
Reproduced with permission of the copyright owner. Further reproduction prohibited without permission.
BIBLIOGRAPHY
Adkison, J. A. Women in school administration: A review of theresearch. Review of Educational Research, 1981, 51(3), 311-343.
American Association of School Administrators and Research Division of the National Education Association. Profile of the school superintendent. Washington, DC: Author, 1960.
Astin, H. S. The woman doctorate in America. New York: RussellSage Foundation, 1969.
Barrilleaux, L. Behavioral outcomes for administrative internships: School principals. Educational Administration Quarterly,Winter 1972, 8, 59-71.
Bartol, K. M. The sex structuring of organizations: A search forpossible causes. Academy of Management Review, 1978, _3, 805-815.
Bauer, B. M. Admission and employment patterns of women matriculating in educational administration at selected midwestern universities (Doctoral dissertation, Ball State University,1975). Dissertation Abstracts International, 1976, 37, 52A. (University Microfilms No. 76-16,458)
Benedetti, C. R. Similarities and differences in the leadership styles and personal characteristics of women in educational administration and women in business administration (Doctoral dissertation, Western Michigan University, 1975). Dissertation Abstracts International, 1975, 36, 1188A-1189A. (University Microfilms No. 75-18,760)
Biklen, S. K. Introduction: Barriers to equity— women, educationalleadership, and social change. In S. K. Biklen & M. B. Brannigan (Eds.), Women and educational leadership. Lexington, MA: Lexington Books, 1980.
Brown, D. G. The mobile professors. Washington, DC: AmericanCouncil on Education, 1967.
Burns, G. P. Administrators in higher education: Their functionsand coordination. New York: Harper & Brothers, 1962.
Centra, J. A. Women, men and the doctorate. Princeton, NJ: Educational Testing Service, 1974.
164
Reproduced with permission of the copyright owner. Further reproduction prohibited without permission.
165Clement, J. Sex bias in school administration. In S. K. Biklen &
M. B. Brannigan (Eds.), Women and educational leadership. Lexington, MA: Lexington Books, 1980.
Cohen, M. D., & March, J. G. Leadership and ambiguity. New York: McGraw-Hill, 1974.
College and University Personnel Association. Women and minorities in administration of higher education institutions: Employmentpatterns and salary comparisons 1978-79. Washington, DC:Author, 1981.
Committee to Study the Status of Women in Graduate Education and Later Years at The University of Michigan. The higher the fewer. Ann Arbor: Author, 1974.
Cubberley, E. P. Public school administration. New York: HoughtonMifflin, 1916.
De Young, C. A. American education (4th ed.). New York: McGraw-Hill, 1960.
Dias, S. L. A study of personal, perceptual, and motivational factors influential in predicting the aspiration level of women and men toward the administrative roles in education (Doctoral dissertation, Boston University School of Education, 1975). Dissertation Abstracts International, 1975, 36, 1202A. (University Microfilms No. 75-20,946)
Dunham, E. A. Colleges of the forgotten Americans. New York: McGraw-Hill, 1969.
Duff, F. L., & Parrish, J. B. Sex differences in employment of college graduates. Journal of National Association for Women Deans, Administrators and Counselors, 1977, 40(4), 155-160.
Eaton, L. L. A survey of women graduates in the field of educational administration. Unpublished specialist project, Eastern Michigan University, 1970.
Estler, S. E. Women as leaders in public education. Signs:Journal of Women in Culture and Society, 1975, 1(2), 363-386.
Farquhar, R. E. Preparatory programs in educational administration. In L. L. Cunningham, W. G. Hack, & R. 0. Nystrand (Eds.), Educational administration. Berkeley, CA: McCutchan, 1977.
Fecher, A. A. R. Career patterns of women in college and university administration (Doctoral dissertation, Indiana University, 1972). Dissertation Abstracts International, 1973, 33, 6115A. (University Microfilms No. 73-10,765)
Reproduced with permission of the copyright owner. Further reproduction prohibited without permission.
166Fennell, M. L., McMahon, A. M., & Hildebrand, P. An alternative
perspective on sex differences in organizational settings: Theprocess of legitimation. Sex Roles, 1978, 4(4), 589-604.
Freeman, G. E. A profile of top-level women administrators in higher education in Washington, DC, 1977. (ERIC Document Reproduction Service No. ED 144 472)
Gardner, H. R. Women administrators in higher education in Illinois: A study of current career patterns (Doctoral dissertation,Indiana University, 1966). Dissertation Abstracts, 1966, 27,1686A.
Gasser, M. H. Career patterns of women administrators in higher education: Barriers and constraints (Doctoral dissertation,Southern Illinois University, 1975). Dissertation Abstracts International, 1976, 36, 7893A. (University Microfilms No. 76-13,240)
Goerss, K. V. Women administrators in education: A review ofresearch 1960-1976. Washington, DC: National Association forWomen Deans, Administrators, and Counselors,
Grobman, H., & Hines, V. A. What makes a good principal? TheBulletin of the National Association of Secondary School Principals, 1956, 40(223), 5-16.
Gross, N. C., & Trask, A. E. The sex factor and the management of schools. New York: John Wiley & Sons, 1976.
Hall, D. T. Careers in organizations. Santa Monica, CA: Goodyear,1976.
Hall, F. S., & Hall, D. T. The two-career couple. Reading, MA: Addison-Wesley, 1979.
Hemphill, J. K., Griffiths, D. E., & Frederikson, N. Administrative performance and personality. New York: Columbia University,Teachers College, 1962.
Hennig, M. , & Jardim, A. The managerial woman. Garden City:Anchor Press, 1977.
Hines, V. A., & Grobman, H. The weaker sex is losing cut. School Board Journal, March 1955, .pp. 100; 102.
Hochschild, A. R. Inside the clockwork of male careers. In F. Howe (Ed.), Women and the power to change. New York: McGraw-Hill,1975.
Reproduced with permission of the copyright owner. Further reproduction prohibited without permission.
167Horner, M. Fail: Bright women. Psychology Today, November 1969,
pp. 36-38; 62.
Hoyle, J. Who shall be principal: A man or a woman? The NationalElementary Principal, 1969, 48(3), 23-24.
Jelinek, M. Career management for the individual and the organization. Chicago: St. Clair Press, 1979.
Johnson, J. M. A comparison of male and female doctoral and postdoctoral students of educational administration at universities in Pennsylvania (Doctoral dissertation, University of Pittsburgh, 1978). Dissertation Abstracts International, 1979,39, 4628A. (University Microfilms No. 79-02,704)
Kanter, R. M. Men and women of the corporation. New York: BasicBooks, 1977.
Kline, C., & Munsterman, R. E. UCEA doctoral student experience, competency and employment desire according to race and sex.UCEA Review, 1976, 18(1), 1-10.
Knezevich, S. J. Administration of public education (3rd ed.).New York: Harper & Row, 1975.
Leviton, L. C., & Whitely, S. E. Job seeking patterns of female and male Ph.D. recipients. Psychology of Women Quarterly, 1981, 5(5), 690-701.
Lyman, K. D., & Speizer, J. J. Advancing in school administration:A pilot project for women. Harvard Educational Review, 1980, 50(1), 25-35.
Matheny, P. H. P. A study of the attitudes of selected male and female teachers, administrators and board of education presidents toward women in educational administrative positions (Doctoral dissertation, Northwestern University, 1973). Dissertation Abstracts International, 1973, _34, 2976A. (University Microfilms No. 73-30,658)
McCarthy, M., Kuh, G. D., & Beckman, J. M. Characteristics and attitudes of doctoral students in educational administration.Phi Delta Kappan, 1979, 61, 200-203.
McGee, M. Women college and university presidents: Their personaland professional characteristics, career development patterns, and opinions about their roles. In M. C. Berry (Ed.), Women in
-. higher education administration: A book of readings. Washington,.DC: National Association of Women Deans, Administrators and-Counselors, 1979.
Reproduced with permission of the copyright owner. Further reproduction prohibited without permission.
168McMillan, M. Leadership aspirations of prospective teachers: A
comparison of men and women. Journal of Teacher Education, 1975, 26(4), 323-325.
Meskin, J. D. The performance of women school administrators: Areview of the literature. Administrators Notebook, 1974, 23(1), 1-4.
Michigan Department of Education, Office for Sex Equity. Professional staff of Michigan's public schools: Employment trendsfor race and sex 1978-79— 1979-80. Lansing: Authro, 1981.
Michigan Department of Education, Office for Sex Equity. The Michigan model pilot. Lansing: Author, 1982.
Mills, B. R. The functioning of informal networks in relation to the hiring process in higher education. Unpublished doctoral dissertation, Western Michigan University, 1978.
Moore, H. A., Jr. Studies in school administration. Washington,DC: American Association of School Administrators, 1957.
Moore, H. A., Jr. The ferment in school administration. In D. E. Griffiths (Ed.), Behavioral science and educational administration. Chicago: The University of Chicago Press, 1964.
Morris, E. B. Women in educational leader positions: An investigation of some common factors in socialization, educational background, and career commitment. Unpublished doctoral dissertation, Western Michigan University, 1982.
National Center for Educational Statistics. Earned degrees conferred 1977-78. Washington, DC: U.S. Department of Education,1980.
National Council of Administrative Women in Education. Wanted:More women in educational leadership. Washington, DC:National Education Association, 1975.
National Education Association. The status of the public school teacher. Washington, DC: Author, 1973.
National Education Association, Department of Elementary School Principals. The elementary school principalship in 1968:A research study. Washington, DC: NEA, 1968.
National Research Council. A century of doctorates. Washington,DC: National Academy of Sciences, 1978. (a)
Reproduced with permission of the copyright owner. Further reproduction prohibited without permission.
169National Research Council. Summary report, 1977: Doctorate
recipients from U.S. universities. Washington, DC: National Academy of Sciences, 1978. (b)
Nieboer, N. A. There is a certain kind of woman. . . . Journal of the National Association for Women Deans, Administrators and Counselors, Spring 1975, 38, 99-103.
Ortiz, F. I. Career patterns in education: Men, women andminorities in public school administration. New York: J. F.Praeger, 1982.
Palmieri, P., & Shakeshaft, C. S. Up the front staircase: A proposal for women to achieve parity with men in the field of educational administration. Journal of the National Association for Women Deans, Administration and Counselors, 1976, 39(2), 58-65.
Pfiffner, V. T. Factors associated with women in major administrative positions in California community colleges (Doctoral dissertation, University of Southern California, 1972). Dissertation Abstracts International, 1973, 33, 4888A. (University Microfilms No. 73-7260)
Ramsey, M. A., & Lutz, F. W. The internship in school administration: A review of its history and a conceptualization for thefuture. Planning and Changing, 1973, _4(3), 135-143.
Safran, C. Corporate women: Just how far have we come? WorkingWoman, March 1984, pp. 99-104.
Schlack, M. J. A comparison of personal characteristics and leadership styles of university upper management and middle management women student personnel administrators (Doctoral dissertation, Western Michigan University, 1974). Dissertation Abstracts International, 1974, 35, 8521. (University Microfilms No. 74-19,076)
Schmuck, P. A. Deterrents to women's careers in school management. Sex Roles, 1975, 1(4), 339-353.
Scriven, A. L., & Nunnery, M. Y. Women central office administrators in large urban districts: Characteristics and perceptions.Educational Horizons, 1974, 52(3), 138-141.
Seawell, W. , & Canady, R. Where have all the women gone? National Elementary Principal, 1974, 53(4), 46-48.
Silver, P. F., & Spuck, D. W. Preparatory programs for educational administrators in the United States. Columbus, OH: UniversityCouncil for Educational Administration, 1978.
Reproduced with permission of the copyright owner. Further reproduction prohibited without permission.
170Simpson, P. Affirmative action in action. Working W o m a n , March
1984, p. 104.
Solomon, L. C., Kent, L., Ochsner, N. L., & Hureircz, M. Underemployed Ph.D.'s. Lexington, MA: Lexington Books, 1981.
Taylor, H. A. Women in administration. In M. C. Nolte (Ed.), An introduction to school administration: Selected readings(4th ed.). London: Collier-Macmillan, 1970.
Timpano, D. M. , & Knight, L. W. Sex discrimination in the selection of school district administrators: What can be done? Washington, DC: National Institute of Education, 1976.
Tyack, D. The one best system. Cambridge, MA: Harvard UniversityPress, 1974.
Van Meir, E. J. Sexual discrimination in school administration opportunities. Journal of the National Association for Women Deans, Administrators and Counselors, Summer 1975, 38, 163-167.
Wain, J. A. Attitudes of teachers toward women school administrators and the aspirations of teachers for administrative positions in the state of Minnesota (Doctoral dissertation, University of Minnesota, 1975). Dissertation Abstracts International, 1976,36, 4951A. (University Microfilms No. 76-4,082)
Way, J. W. A comparison of background profiles, career expectations and career aspirations of men and women public school administrators. Unpublish doctoral dissertation, Western Michigan University, 1976.
Woody, T. A. History of women's education in the United States.New York: Octagon Books, 1966. (2 Vols., originally published by Science Press, 1929)
Reproduced with permission of the copyright owner. Further reproduction prohibited without permission.