a comparison of creativity and innovation metrics and sample
TRANSCRIPT

ORIGINAL PAPER
A comparison of creativity and innovation metrics and samplevalidation through in-class design projects
Sarah K. Oman • Irem Y. Tumer • Kris Wood •
Carolyn Seepersad
Received: 4 August 2011 / Revised: 24 August 2012 / Accepted: 28 August 2012 / Published online: 19 September 2012
� Springer-Verlag London Limited 2012
Abstract This paper introduces a new perspective/
direction on assessing and encouraging creativity in con-
cept design for application in engineering design education
and industry. This research presents several methods used
to assess the creativity of similar student designs using
metrics and judges to determine which product is consid-
ered the most creative. Two methods are proposed for
creativity concept evaluation during early design, namely
the Comparative Creativity Assessment (CCA) and the
Multi-Point Creativity Assessment (MPCA) methods. A
critical survey is provided along with a comparison of
prominent creativity assessment methods for personalities,
products, and the design process. These comparisons cul-
minate in the motivation for new methodologies in creative
product evaluation to address certain shortcomings in
current methods. The paper details the creation of the two
creativity assessment methods followed by an application
of the CCA and MPCA to two case studies drawn from
engineering design classes.
Keywords Creativity assessment � Innovation �Engineering design � Concept design
1 Introduction
This research delves into efforts to understand creativity as
it propagates through the conceptual stages of engineering
design, starting from an engineer’s cognitive processes,
through concept generation, evaluation, and final selection.
Consumers are frequently faced with a decision of which
product to buy—where one simply satisfies the problem at
hand and another employs creativity or novelty to solve the
problem. Consumers typically buy the more creative
products, ones that ‘‘delight’’ the customers and go beyond
expectation of functionality (Horn and Salvendy 2006;
Saunders et al. 2009; Elizondo et al. 2010). Many baseline
products may employ creative solutions, but although
creativity may not be required for some products, creative
solutions are usually required to break away from baseline
product features and introduce features that delight cus-
tomers. In engineering design, creativity goes beyond
consumer wants and needs; it brings added utility to a
design and bridges the gap between form and function.
Creativity can be classified into four broad categories:
the creative environment, the creative product, the creative
process, and the creative person (Taylor 1988). This paper
briefly discusses the creative person and focuses on the
creative product and process before introducing methods of
assessing creative products. A survey of creativity assess-
ment methods is introduced that examines previously
tested methods of personality, deductive reasoning, and
product innovation.
Specifically, this paper introduces a new perspective/
direction on assessing and encouraging creativity in
S. K. Oman � I. Y. Tumer (&)
Complex Engineering System Design Laboratory,
School of Mechanical, Industrial, and Manufacturing
Engineering, Oregon State University, Corvallis, OR 97330,
USA
e-mail: [email protected]
K. Wood
Manufacturing and Design Laboratory,
Department of Mechanical Engineering,
University of Texas at Austin, Austin, TX 78712-1064, USA
C. Seepersad
Product, Process, and Materials Design Lab,
Department of Mechanical Engineering,
University of Texas at Austin, Austin, TX 78712-1064, USA
123
Res Eng Design (2013) 24:65–92
DOI 10.1007/s00163-012-0138-9

concept design for engineering design education and
industry alike. This research first presents a survey of
creativity assessment methods and then proposes several
methods used to assess the creativity of similar student
designs using metrics and judges to determine which
product is considered the most creative. The survey pre-
sents a unique comparison study in order to find where the
current gap in assessment methods lies, to provide the
motivation for the formulation of new creativity assess-
ments. Namely, two methods are proposed for creativity
concept evaluation during early design: the Comparative
Creativity Assessment (CCA) and the Multi-Point Crea-
tivity Assessment (MPCA). The CCA is based upon
research done by Shah et al. (2003b) and evaluates how
unique each subfunction solution of a design is across the
entire design set of solutions (Linsey et al. 2005). The
MPCA is adapted from NASA’s Task Load Index (2010)
and Besemer’s Creative Product Semantic Scale (1998)
and requires a group of judges to rate each design based on
adjective pairs, such as original/unoriginal or surprising/
expected.
The Background section introduces and elaborates on
the concept of creativity, studies on how to increase crea-
tivity during the concept generation phase, and finally
methods to determine the most creative product or concept
in a set of designs. The next section provides a critical
survey and comparison of prominent creativity assessment
methods for personalities, products, and the design process.
These comparisons culminate in the motivation for a new
methodology in creative product evaluation to address
certain shortcomings in current methods. Section 4 details
two possible creativity assessment methods followed by an
application of those methods to two case studies drawn
from engineering design classes in Sect. 5. The students in
these classes were divided into teams and tasked with the
2008 and 2009 ASME Student Design Competition pro-
jects: a remote-controlled Mars rover and an automatic
waste sorter, respectively (Oman and Tumer 2009, 2010).
Lessons learned and conclusions drawn from the applica-
tion of the methods to the two case studies are presented
along with where this research can go in Future Work.
2 Background
The Background section addresses several subjects
regarding creative design that will provide a better under-
standing regarding the motivation and development of the
proposed CCA and MPCA methods. The definition of
creativity is the most prolific question regarding creative
concept design and is addressed in Sect. 2.1. Once different
aspects of creativity are outlined, Sects. 2.2 and 2.3 provide
the background information regarding concept generation
and evaluation that is needed to fully explain the proce-
dures for the CCA and MPCA. The last subsection of the
Background presents further relevant research in the field
of creativity and concept design.
2.1 Creativity of a person, product, and process
Just as creativity can be broken into four categories
(environment, product, process, and person), the category
of the creative person can also be divided into psycho-
metric and cognitive aspects (Sternberg 1988). Psycho-
metric approaches discuss how to classify ‘‘individual
differences in creativity and their correlates,’’ while the
cognitive approach ‘‘concentrates on the mental processes
and structures underlying creativity (Sternberg 1988).’’
Cognitive aspects of the creative person may encompass
intelligence, insight, artificial intelligence, free will, and
more (Sternberg 1988). Csikszentmihalyi discusses where
creativity happens by saying:
There is no way to know whether a thought is new
except with reference to some standards, and there is
no way to tell whether it is valuable until it passes
social evaluation. Therefore, creativity does not
happen inside people’s heads, but in the interaction
between a person’s thoughts and a sociocultural
context. It is a systemic rather than an individual
phenomenon (Csikszentmihalyi 1996).
Creativity in the broadest terms is simply the ability to
look at the problem in a different way or to restructure the
wording of the problem such that new and previously
unseen possibilities arise (Linsey et al. 2008a).
Cropley and Cropley describe the opposite of creativity,
convergent thinking, as ‘‘too much emphasis on acquiring
factual knowledge … reapplying it in a logical manner …having clearly defined and concretely specified goals …and following instructions.’’ Their description of divergent
thinking correlates with several other definitions of crea-
tivity, stating that it ‘‘involves branching out from the
given to envisage previously unknown possibilities and
arrive at unexpected or even surprising answers, and thus
generating novelty (Cropley and Cropley 2005).’’ Several
other sources mention novelty in their definitions of crea-
tivity, stating that an idea is creative if it is both novel and
valuable or useful (Liu and Liu 2005; Chulvi et al. 2011).
During the conceptual design phase, a designer begins
with loose constraints and requirements and must use these
to build an understanding of the problem and possible
directions to the solution. The goals of the problem are
vague, and in many cases, there is no clear definition of
when the design task is complete and whether the design is
progressing in an acceptable direction (Yamamoto and
Nakakoji 2005). This is the motivation behind the creation
66 Res Eng Design (2013) 24:65–92
123

of many design and ideation methods such as Mindmap-
ping (Otto and Wood 2001), CSketch (Shah 2007), Design-
by-Analogy (Linsey et al. 2008a, b), TRIZ/TIPS, Synectics
(Blosiu 1999), and Historical Innovators Method (Jensen
et al. 2009).
A useful definition for creativity and innovation of
engineering products is provided by Cropley and Cropley,
in which creativity is defined as a four-dimensional, hier-
archical model that must exhibit relevance and effective-
ness, novelty, elegance, and ‘‘generalizability’’ (Cropley
and Cropley 2005). In this regard, relevance must be sat-
isfied and refers to a product simply solving the problem it
is intended to solve. If only relevance is satisfied the
solution is routine. If the solution is relevant and novelty is
also satisfied as described previously in this section, then
the product/solution is original. When the product is ori-
ginal and also pleasing to look at and goes beyond only the
mechanical solution, it is elegant. Lastly, when the solution
is elegant and generalizable such that it is broadly appli-
cable and can be transferred to alternate situations to open
new perspectives, then the product is innovative (Cropley
and Cropley 2005).
Work conducted by UMass and UT Austin further
expands on originality by evaluating it on a five-point scale
where a concept may be ‘‘common,’’ ‘‘somewhat interest-
ing,’’ ‘‘interesting,’’ ‘‘very interesting,’’ or ‘‘innovative’’
(Genco et al. 2011). Each concept is rated at the feature
level, but the maximum feature-level score is assigned as
the overall originality score.
Combining the definitions, creativity in this research is
described as a process to evaluate a problem in an unex-
pected or unusual fashion in order to generate ideas that
are novel. Also, creativity (noun) refers to novelty and
originality. Innovation is then defined as creativity that
embodies usefulness in order to realize an impact on
society (i.e., application of said creativity) through a new
method, idea, or product.
With creativity and innovation defined for the purposes
of this paper, the remainder of the Background section
discusses aspects of engineering design that can factor in
creativity into the design process.
2.2 Ideation methods: fostering creativity
and innovation
Forced but structured stimuli have been proven to aid in
creative processes. Negative stimuli can be detrimental,
such as stimulus that sparks off-task conversations (Howard
et al. 2008). Likewise, the presence of design representations
with a high degree of superficial detail (such as in detailed
prototypes) in the physical design environment tends to inhibit
ideation and restricts the retrieval of far-field analogies from
memory (Christensen and Schunn 2007).
Unfortunately, many designers opt not to use ideation
methods because of the seemingly cumbersome steps that
create long bouts of work, ‘‘in which doubt, ambiguity, and
a lack of perseverance can lead people to abandon the
creative process (Luburt 2005).’’
Thus, effective methods of ideation should be, at a
minimum, environmentally controlled, stimulating, and
engaging to the subjects. Other aspects of creativity can
include thinking outside the box by evaluating the
assumptions to a problem and then, ‘‘imagining what is
possible if we break them (Pierce and Pausch 2007).’’
For many engineers, structured concept generation can
be the most effective means to generate effective solutions.
Ideation methods provide structure and time constraints to
the concept design process and lead designers to explore a
larger solution space (Shah et al. 2003a), as well as include
all members of the design team (Ulrich and Eppinger
2000). Such ideation methods also provide the capacity for
designers to generate ideas they would not otherwise have
been able to be based exclusively on their intuition. These
methods aid designers and students in generating a multi-
tude of ideas before subjectively evaluating all alternatives.
The most commonly used methods are Morphological
Analysis (Cross 2000; Ullman 2010), Method 6-3-5 (Pahl
and Beitz 1988; VanGundy 1988; Shah 2007; Linsey et al.
2005), and the Theory of Inventive Problem Solving (TRIZ)
(Savransky 2000; Clausing and Fey 2004; Shulyak 2008;
Ullman 2010). Extensive research involving TRIZ has
produced simpler adaptations to the methodology, such as
Advanced Systematic Inventive Thinking (ASIT), which
can then be combined with design theories in engineering
practice, such as the C-K theory (Reich et al. 2010).
Numerous additional papers and texts detail more
ideation methods that can be used for both individual
concept generation and group efforts (Buhl 1960; Pahl
and Beitz 1988; Hinrichs 1992; Pugh 1996; Sonnentag
et al. 1997; Akin and Akin 1998; Huang and Mak 1999;
Cross 2000; Ulrich and Eppinger 2000; Gautam 2001;
Kroll et al. 2001; Moskowitz et al. 2001; Otto and Wood
2001; Song and Agogino 2004; Linsey et al. 2005, 2008a;
Cooke 2006; Hey et al. 2008; Mayeur et al. 2008; Ullman
2010).
Any of these methods can be used to aid creativity as
ideas are being generated and are taught to engineers in
education and industry alike. Several methods are used by
the students whose designs are analyzed in Sect. 5. The
issue regarding concept generation methods is determining
which is the most effective for research or industry needs.
Lopez-Mesa and Thompson provide an analysis of design
methods based on research and industry experience and
further delve into the relationship between product, pro-
cess, person, and environment (Lopez-Mesa and Thompson
2006). Section 3.3 outlines assessment methods that
Res Eng Design (2013) 24:65–92 67
123

attempt to answer this question by comparing the results of
many commonly used ideation methods.
2.3 Evaluation methods: assessing creativity
and innovation
Once the concepts have been generated using one or more
of the ideation methods, designers are faced with yet
another difficult problem: how does the designer decide
which idea is best or the most preferred? What exactly
makes a design stand out from other designs? In order to
answer these questions, evaluation methods have been
developed that aid the decision-making process. The act of
choosing a design from a set of alternatives is a daunting
task comprised of compromise, judgment, and risk (Buhl
1960). Designers must choose a concept that will satisfy
customer and engineering requirements, but most designs
rarely cover every requirement at hand or every require-
ment to the same degree, or else the decision-making
process would be simple. Decision making at the concept
design stage is even more difficult as there is still very
limited information about the ideas that designers can use
to make a decision (Ullman 2010). Commonly used eval-
uation processes include the Weighted Objectives Method
(Pahl and Beitz 1988; VanGundy 1988; Jones 1992; Fogler
and LeBlanc 1995; Roozenburg and Eekels 1995; Cross
2000), Pugh’s Method (Pugh 1996), or the Datum Method
(Roozenburg and Eekels 1995; Pugh 1996; Ulrich and
Eppinger 2000; Ullman 2010). Critical goals of Pugh’s
Method or the Datum Method are to obtain consensus in a
team environment and to enable further concept generation
through the combination and revising of designs based on
preferred features or characteristics.
Other, more comprehensive methods can be found
throughout the literature that provide a broader procedural
guide to the entire decision-making process. Methods such
as Robust Decision Making (Ullman 2006) provide
designers with a detailed account of what decision making
entails, how to make robust decisions within team settings,
and how to best evaluate alternatives. Many engineering
design textbooks, such as Otto and Wood’s Product Design
(Otto and Wood 2001), Ullman’s The Mechanical Design
Process (Ullman 2010), Paul and Beitz’s Engineering
Design (Pahl and Beitz 1988), and Ulrich and Eppinger’s
Product Design and Development (Ulrich and Eppinger
2000), provide an overview of how to make decisions when
faced with numerous alternatives, which are very effective,
but do not necessarily focus on creativity as a design
requirement.
Educators and Industry employ varying decision-making
methods like the ones mentioned above as they all have
different advantages. The following subsection discusses
their limitations.
2.3.1 Limitations of evaluation methods
It is important to note that the methods discussed in Sect.
2.3 do not assess creativity specifically. Furthermore, while
many different methods of creativity assessment exist,
there has not been a thorough comparison done in the lit-
erature; specifically, there is no survey within the literature
that summarizes the methods available to designers for
assessing creativity of personality, product, or process. As
a result, Sect. 3 presents a survey and comparison of
evaluation methods specifically designed to assess crea-
tivity. Tables 1, 2 and 3 provide a unique comparison of
these methods not yet found in literature. This provides the
motivation for adapting current methods to fit a unique
application of creativity analysis detailed in Sect. 4, as
applied to the comparison of designs generated during an
engineering design course and evaluated with respect to
their creativity.
2.4 Further relevant research
Additional research in the past decade has tackled various
issues in concept design, such as analyzing the differences
between ideation methods or determining ethnographic
differences in knowledge reuse. Pons and Raine propose a
generic design activity that can be used in diverse design
situations that involve vague requirements or abstract
problem statements (Pons and Raine 2005). One study
examined the effects of ideation methods in the architec-
tural design domain and proposes how to analyze the level
of creativity output through controlled architectural design
experiments (Kowaltowski et al. 2010). Along those lines,
a recent study detailed an experiment comparing several
such methods to determine the effect of intuitive versus
logical ideation methods on the creativity output (Chulvi
et al. 2012). Another experiment in concept generation
examined the effect of creative stimuli to groups in order to
increase the frequency of ideas generated later in the design
process (Howard et al. 2010).
Demian and Fruchter created a design repository of
ethnographic knowledge in context to support productivity
and creativity in concept generation (Demian and Fruchter
2005). A study of the entire concept design process traced
the initial creativity of ideas through to implementation and
evaluated how the effectiveness of team communication
affected the end creativity (Legardeur et al. 2009). Effec-
tiveness is the core issue of a study that proposes guidelines
during the conceptual phase to finding quick solutions that
satisfy functional requirements (Mulet and Vidal 2008).
Furthermore, Shai and Reich (2004) discuss how to aid
collaboration between engineering fields through the for-
mulation and representation of the design problem using
common mathematical terms and tools.
68 Res Eng Design (2013) 24:65–92
123

Ta
ble
1C
om
par
iso
no
fcr
eati
vit
yas
sess
men
tm
eth
od
sfo
rp
rod
uct
s
Ev
alu
atio
nm
eth
od
sfo
rp
rod
uct
s
Met
ho
dS
ou
rce
Ho
wd
oes
it
eval
uat
e?
Met
ho
do
fev
alu
atio
nV
aria
ble
cate
go
ries
inev
alu
atio
nV
alid
atio
nw
ith
inp
aper
Sta
ge
of
des
ign
Cre
ativ
e
Pro
du
ct
Sem
anti
c
Sca
le(C
PS
S)
Bes
emer
20
06
Jud
ges
([6
0)
7-p
oin
tL
iker
t-ty
pe
scal
e
wit
h5
5ad
ject
ive
pai
rs
No
vel
ty(s
urp
risi
ng
,o
rig
inal
),R
eso
luti
on
(lo
gic
al,
use
ful,
val
uab
le,
un
der
stan
dab
le),
and
Ela
bo
rati
on
and
syn
thes
is(o
rgan
ic,
wel
lcr
afte
d,
eleg
ant)
Des
crip
tio
no
fo
ver
12
stu
die
su
sin
gC
PS
Sin
last
dec
ade
At
sket
chin
g
stag
eo
r
any
tim
e
ther
eaft
er
Co
nse
nsu
al
Ass
essm
ent
Tec
hn
iqu
e
(CA
T)
Am
abil
e1
98
2Ju
dg
es
(un
spec
ified
nu
mb
er)
5-p
oin
tL
iker
t-ty
pe
scal
e
wit
ho
pen
scal
e
No
vel
ty,
app
rop
riat
enes
s,te
chn
ical
ity
,h
arm
on
y,
arti
stic
qu
alit
y
8st
ud
ies
wit
h2
0–
10
1
par
tici
pan
ts(c
hil
dre
nto
coll
ege
age)
mak
ing
coll
ages
or
po
ems.
An
aly
zed
by
6–
20
jud
ges
of
var
yin
gex
per
tise
Aft
erco
mp
lete
d
art
pro
ject
,
po
em,
or
pro
du
ct
Stu
den
tP
rod
uct
Ass
essm
ent
Fo
rm(S
PA
F)
Rei
s1
99
1
(Ho
rn2
00
6)
Jud
ges
(un
spec
ified
nu
mb
er)
5-p
oin
tL
iker
t-ty
pe
scal
e
wit
h1
5sc
ori
ng
item
s
Ori
gin
alit
y,
ach
iev
edo
bje
ctiv
e,ad
van
ced
fam
ilia
rity
,
qu
alit
yb
eyo
nd
age/
gra
de
lev
el,
atte
nti
on
tod
etai
l,
tim
e/ef
fort
/en
erg
y,
ori
gin
alco
ntr
ibu
tio
n
50
exp
erts
and
exp
erie
nce
d
teac
her
sv
alid
ated
met
ho
d
wit
hin
teg
rate
dre
liab
ilit
y
of
0.8
Fu
lly
dev
elo
ped
wo
rk(s
ket
ch,
wri
tin
g,
scie
nce
wo
rk)
Inn
ov
ativ
e
Ch
arac
teri
stic
s
Sau
nd
ers
DE
TC
20
09
Jud
ges
(min
imal
nu
mb
er)
Yes
/No
on
wh
eth
erp
rod
uct
isb
ette
rth
ana
dat
um
Fu
nct
ion
alit
y,
Arc
hit
ectu
re(s
ize,
lay
ou
t,u
seo
fp
hy
sica
l
env
iro
nm
ent)
,E
nv
iro
nm
enta
lin
tera
ctio
ns
(mat
eria
l
flo
w,
ener
gy
flo
w,
info
rmat
ion
flo
w,
infr
astr
uct
ure
inte
ract
ion
),U
ser
inte
ract
ion
s(p
hy
sica
ld
eman
ds,
sen
sory
dem
and
s,m
enta
ld
eman
ds)
,C
ost
(pu
rch
ase
cost
,o
per
atin
gco
st)
An
aly
zed
95
pro
du
cts
feat
ure
din
pu
bli
shed
To
p
Inn
ov
ativ
eP
rod
uct
sli
sts
fro
m2
00
6–
08
Mar
ket
ed
pro
du
cts
Ind
ust
ry
Pre
fere
nce
s
Eli
zon
do
20
10
Jud
ges
(un
spec
ified
nu
mb
er)
10
-po
int
Lik
ert-
typ
esc
ale
wit
h1
7sc
ori
ng
item
s
Dif
fere
nti
abil
ity
,cr
eati
vit
y,
pro
bab
ilit
yo
fad
op
tio
n,
nee
dsa
tisf
acti
on
Sen
ior
des
ign
pro
du
cts
jud
ged
by
ind
ust
ryan
d
acad
emic
exp
erts
(un
spec
ified
nu
mb
ers)
At
end
of
des
ign
cou
rse
(fu
lly
dev
elo
ped
pro
toty
pe)
Qu
alit
ysc
ale
Lin
sey
20
07
Jud
ges
(un
spec
ified
nu
mb
er)
4-p
oin
tY
es/N
ofl
ow
char
t
wit
hth
ree
qu
esti
on
s
Tec
hn
ical
lyfe
asib
le,
tech
nic
ally
dif
ficu
ltfo
rco
nte
xt,
exis
tin
gso
luti
on
29
3fa
cto
rial
exp
erim
ent
ov
er2
wee
ks
usi
ng
sen
ior
coll
ege
stu
den
tsin
14
team
s
of
4–
6st
ud
ents
Fu
lly
dev
elo
ped
sket
ches
Mo
ss’s
Met
rics
Mo
ss1
96
6
(Ch
ulv
i
20
11
)
Jud
ges
(un
spec
ified
nu
mb
er)
0–
3sc
ale
rati
ng
sb
yju
dg
esP
rod
uct
of
jud
ges
rati
ng
so
nu
sefu
lnes
s(a
bil
ity
tom
eet
req
uir
emen
ts)
and
un
usu
aln
ess
(rev
erse
pro
bab
ilit
yo
f
idea
bei
ng
ing
rou
po
fso
luti
on
s)
12
Ph
.D.
stu
den
tso
r
pro
fess
ion
als
pla
ced
in
fou
rte
ams,
wo
rkin
gin
3
on
e-h
ou
rse
ssio
ns
(pre
sen
ted
inC
hu
lvi
20
11
)
Fu
lly
dev
elo
ped
sket
cho
r
any
tim
e
ther
eaft
er
Sar
kar
and
Ch
akra
bar
ti
Met
rics
Sar
kar
20
08
(Ch
ulv
i
20
11
)
Met
rics
wit
h
jud
ges
Deg
ree
of
no
vel
tyb
ased
on
SA
PP
hIR
Eco
nst
ruct
san
d
No
vel
tyco
nst
ruct
s(a
ctio
n,
stat
e,p
hy
sica
lp
hen
om
ena,
ph
ysi
cal,
org
ans,
inp
uts
,p
arts
)an
dd
egre
eo
f
use
fuln
ess
(im
po
rtan
ceo
ffu
nct
ion
,n
um
ber
of
use
rs,
len
gth
of
usa
ge,
ben
efit
of
pro
du
ct)
Fu
lly
dev
elo
ped
sket
cho
r
any
tim
e
ther
eaft
er
Ev
alu
atio
no
f
Inn
ov
ativ
e
Po
ten
tial
(EP
I)
Just
el2
00
8
(Ch
ulv
i
20
11
)
Jud
ges
(un
spec
ified
nu
mb
er)
Jud
ges
rate
req
uir
emen
t
(0–
3–
9sc
ale)
,
acco
mp
lish
men
t(1
–3
–9
scal
e),
and
no
vel
ty(0
–3
scal
e)
Imp
ort
ance
of
each
req
uir
emen
t,A
cco
mp
lish
men
t
(sat
isfa
ctio
no
fea
chre
qu
irem
ent)
,N
ov
elty
(no
t
inn
ov
ativ
eo
rin
crem
enta
l,m
od
erat
e,o
rra
dic
al
inn
ov
atio
n)
Fu
lly
dev
elo
ped
sket
cho
r
any
tim
e
ther
eaft
er
Res Eng Design (2013) 24:65–92 69
123

3 Creativity studies: a survey and comparison
The past several decades have witnessed numerous studies
on creativity, some domain-specific such as engineering
and others applicable to a wide range of disciplines. The
following section provides a comparison of studies on
creativity and innovation, summarized in Tables 1, 2 and 3.
Currently, no comprehensive literature search documents
and evaluates creativity assessment methods in order to
determine holes in current research within this particular
domain. These tables work to fill this gap in literature.
Comparisons are discussed for each of the three evaluation
categories (person/personality, product, and groups of
ideas). Section 3.1 details unique methods to assess prod-
ucts or fully formed ideas and provide information on how
the concepts are evaluated within each method along with
the variables of analysis. Section 3.2 outlines methods to
assess the person or personality, and Sect. 3.3 details
methods to assess groups of ideas.
The first column presents the names of the proposed
assessment methods. If no name is presented, the main
author is used to name the method unless the paper is
describing someone else’s work, as is the case in Chulvi
et al. who present three methods of previous authors. How
the metric evaluates the category of the table (product,
person/personality, or groups of ideas) is given in the third
column. The fourth column provides a short description of
the assessment procedure while the fifth column details the
variables or variable categories used to assess creativity of
the person, product, or set of ideas. The Validation column
provides a short description of the experiment or case study
presented in the article used in this literature survey. For
example, the methods by Moss, Sarkar, and Justel are
presented in the article by Chulvi et al. and the Validation
column presents the experiment done by Chulvi et al.
(2011). The final column outlines the most appropriate time
during the design phase to implement the assessment
method (for example, some methods only evaluate the
principles of the design while others need a fully formed
concept or prototype to evaluate).
Tables 1, 2 and 3 provides a distinctive opportunity for
easy comparison of known methods of creativity assess-
ment. For example, all the methods detailed for assessing
products use judges with Likert-type scales except Inno-
vative Characteristics method, which allows simple yes/no
answers. All the person/personality methods use surveys to
determine personality types. Of the two methods outlined
that evaluate groups of ideas, the refined metrics propose
modifications to the original Shah’s metrics to increase the
effectiveness of several metrics within the method.
The remainder of the section goes into further detail on
the methods outlined in Tables 1, 2 and 3, organized by
what the method analyzes (specifically product, person, orTa
ble
1co
nti
nu
ed
Ev
alu
atio
nm
eth
od
sfo
rp
rod
uct
s
Met
ho
dS
ou
rce
Ho
wd
oes
it
eval
uat
e?
Met
ho
do
fev
alu
atio
nV
aria
ble
cate
go
ries
inev
alu
atio
nV
alid
atio
nw
ith
inp
aper
Sta
ge
of
des
ign
Res
ou
rce-
Eff
ort
-Val
ue
(RE
V)
Red
elin
gh
uy
s
19
97
a
Met
rics
Ev
alu
ate
des
ign
erag
ain
st
exp
erts
and
asse
ssd
esig
n
for
val
ues
reg
ard
ing
eng
inee
rin
gre
qu
irem
ents
Qu
alit
yo
fth
ep
rod
uct
,sa
tisf
acti
on
of
eng
inee
rin
g
req
uir
emen
ts,
exp
erti
seo
fth
ed
esig
ner
Cas
est
ud
yw
ith
two
com
pan
yte
ams
solv
ing
sam
eco
mp
lex
pro
ble
m
Bef
ore
con
cep
t
gen
erat
ion
and
afte
rfu
lly
dev
elo
ped
sket
ch
70 Res Eng Design (2013) 24:65–92
123

Ta
ble
2C
om
par
iso
no
fcr
eati
vit
yas
sess
men
tm
eth
od
sfo
rp
erso
n/p
erso
nal
ity
Ev
alu
atio
nm
eth
od
sfo
rp
erso
n/p
erso
nal
ity
Met
ho
dS
ou
rce
Ho
wd
oes
it
eval
uat
e?
Met
ho
do
fev
alu
atio
nV
aria
ble
cate
go
ries
inev
alu
atio
nV
alid
atio
nw
ith
inp
aper
Sta
ge
of
des
ign
Ad
ject
ive
Ch
eck
list
(AC
L)
Go
ug
h1
98
3
(Cro
ple
y2
00
0)
Su
rvey
/ju
dg
es3
00
-ite
mse
to
fad
ject
ives
use
dfo
r
self
-rat
ing
or
rati
ng
by
ob
serv
ers
Mea
sure
s3
7tr
aits
of
ap
erso
n,
can
be
par
edd
ow
nfo
rsp
ecifi
c
inte
rest
s
Has
bee
nre
du
ced
tofi
tsp
ecifi
c
nee
ds
inm
ult
iple
stu
die
sw
ith
reli
abil
ity
ran
gin
gfr
om
0.4
1to
0.9
1
At
any
po
int
in
des
ign
Cre
ativ
eP
erso
nal
ity
Sca
le(C
PS
)
Go
ug
h1
99
2
(Cro
ple
y2
00
0)
Su
rvey
/ju
dg
es3
0-i
tem
set
of
adje
ctiv
esfr
om
AC
Lse
t(s
eeab
ov
e)
18
po
siti
ve
adje
ctiv
ew
eig
hts
(wid
ein
tere
sts,
ori
gin
al,
etc)
,1
2
neg
ativ
ead
ject
ive
wei
gh
ts
(co
nv
enti
on
al,
com
mo
n,
etc.
)
Rep
ort
edre
liab
ilit
yin
var
iou
s
stu
die
sfr
om
0.4
0to
0.8
0
At
any
po
int
in
des
ign
To
rran
ceT
ests
of
Cre
ativ
eT
hin
kin
g
(TT
CT
)
To
rran
ce1
99
9
(Cro
ple
y2
00
0)
Su
rvey
/ju
dg
esT
est
spli
tin
tov
erb
alan
d
no
nv
erb
al(fi
gu
ral)
sect
ion
sw
ith
qu
esti
on
acti
vit
ies
Flu
ency
(nu
mb
erre
spo
nse
s),
flex
ibil
ity
(nu
mb
ero
f
cate
go
ries
),o
rig
inal
ity
(rar
ity
of
resp
on
ses)
,el
abo
rati
on
(det
ail
of
resp
on
ses)
,ab
stra
ctn
ess,
resi
stan
ceto
pre
mat
ure
clo
sure
Stu
die
sre
po
rtm
edia
nin
terr
ater
reli
abil
ity
0.9
–0
.97
and
rete
st
reli
abil
ity
bet
wee
n0
.6-0
.7
At
any
po
int
in
des
ign
My
ers-
Bri
gg
sT
yp
e
Ind
icat
or
(MB
TI)
My
ers
19
85
(McC
aull
ey2
00
0)
Su
rvey
93
Yes
/No
qu
esti
on
sIn
tro
ver
sio
n/e
xtr
ov
ersi
on
,
intu
itio
n/s
ensi
ng
,fe
elin
g/
thin
kin
g,
per
cep
tio
n/j
ud
gm
ent
Use
dp
roli
fica
lly
thro
ug
ho
ut
the
lite
ratu
resi
nce
19
67
At
any
po
int
in
des
ign
Cre
atri
xIn
ven
tory
(C&
RT
)
By
rd1
98
6(C
rop
ley
20
00
)
Su
rvey
9-p
oin
tL
iker
t-ty
pe
scal
eo
f2
8
sco
rin
git
ems
Cre
ativ
eth
ink
ing
vs
risk
tak
ing
mat
rix
wit
h8
sty
les
(Rep
rod
uce
r,
Mo
difi
er,
Ch
alle
ng
er,
Pra
ctic
aliz
er,
Inn
ov
ato
r,
Sy
nth
esiz
er,
Dre
amer
,P
lan
ner
)
Rep
ort
s.7
2re
test
reli
abil
ity
bu
tn
o
oth
erd
ata
pro
vid
ed.A
rgu
essc
ale
po
sses
ses
‘‘fa
cev
alid
ity
’’
At
any
po
int
in
des
ign
Cre
ativ
eR
easo
nin
g
Tes
t(C
RT
)
Do
oli
ttle
19
90
(Cro
ple
y2
00
0)
Su
rvey
40
rid
dle
sR
idd
les
spli
tin
totw
o2
0-r
idd
le
lev
els
Rep
ort
ssp
lit-
hal
fre
liab
ilit
y
bet
wee
n0
.63
and
0.9
9an
d
val
idit
yo
f0
.70
com
par
edto
ano
ther
per
son
alit
yte
st
At
any
po
int
in
des
ign
Res Eng Design (2013) 24:65–92 71
123

Ta
ble
3C
om
par
iso
no
fcr
eati
vit
yas
sess
men
tm
eth
od
sfo
rg
rou
ps
of
idea
s
Ev
alu
atio
nm
eth
od
sfo
rg
rou
ps
of
idea
s
Met
ho
dS
ou
rce
Ho
wd
oes
it
eval
uat
e?
Met
ho
do
fev
alu
atio
nV
aria
ble
cate
go
ries
inev
alu
atio
nV
alid
atio
nw
ith
inp
aper
Sta
ge
of
des
ign
Sh
ah’s
Met
rics
Sh
ah2
00
0,
20
03
Met
rics
wit
h
jud
ges
Bre
akd
ow
no
fh
ow
each
con
cep
t
sati
sfies
fun
ctio
nal
req
uir
emen
ts,
nu
mb
ero
fid
eas
gen
erat
ed
Qu
alit
y,q
uan
tity
of
idea
s,N
ov
elty
,
var
iety
wit
hin
dat
ase
t
Ex
amp
leev
alu
atio
ns
for
each
cate
go
ryg
iven
fro
mst
ud
ent
des
ign
com
pet
itio
nco
nce
pts
At
sket
cho
r
pro
toty
pe
stag
e
Sh
ah’s
refi
ned
met
rics
Nel
son
20
09
Met
rics
wit
h
jud
ges
New
way
fro
mS
hah
’sm
etri
csto
calc
ula
tev
arie
tyan
dco
mb
ines
it
wit
hN
ov
elty
.In
pu
tsan
d
var
iab
les
rem
ain
the
sam
e
Qu
alit
y,q
uan
tity
of
idea
s,N
ov
elty
,
var
iety
wit
hin
dat
ase
t
No
ne
giv
enA
tsk
etch
or
pro
toty
pe
stag
e
Ad
just
ed
Lin
ko
gra
ph
y
Van
Der
Lu
gt
20
00
Met
rics
Det
erm
ines
ho
wre
late
dce
rtai
n
fun
ctio
nso
luti
on
sar
eto
each
oth
erb
ased
on
gra
ph
ical
lin
k
char
t
Lin
kd
ensi
ty(n
um
ber
of
lin
ks,
nu
mb
ero
fid
eas)
,ty
pe
of
lin
k
(su
pp
lem
enta
ry,
mo
difi
cati
on
,
tan
gen
tial
),an
dse
lf-l
ink
ind
ex
(fu
nct
ion
of
nu
mb
ero
fid
eas
par
ticu
lar
des
ign
erg
ener
ated
)
Un
der
gra
dst
ud
ents
(un
spec
ified
nu
mb
er)
in
gro
up
so
f4
ina
90
-min
des
ign
mee
tin
gb
rok
enin
to4
ph
ases
At
ph
ysi
cal
pri
nci
ple
so
r
sket
chin
gst
age
Mo
difi
ed
Lin
ko
gra
ph
y
Vid
al2
00
4M
etri
csD
eter
min
esh
ow
rela
ted
cert
ain
fun
ctio
nso
luti
on
sar
eto
each
oth
erb
ased
on
lin
kd
ensi
tyu
sin
g
var
iab
les
atri
gh
t
Nu
mb
ero
fid
eas,
nu
mb
ero
fv
alid
idea
s,n
um
ber
of
reje
cted
idea
s,
nu
mb
ero
fu
nre
late
did
eas,
nu
mb
ero
fg
lob
alid
eas
60
firs
t-y
ear
stu
den
tsd
ivid
ed
into
gro
up
so
ffi
ve
in1
-h
des
ign
blo
cks
At
ph
ysi
cal
pri
nci
ple
so
r
sket
chin
gst
age
Lo
pez
-Mes
a’s
Met
rics
Lo
pez
-Mes
a
20
11
Met
rics
wit
h
jud
ges
Co
un
to
fco
nce
pts
that
sati
sfy
each
of
the
var
iab
les
atri
gh
t,
jud
gem
ent
of
crit
eria
by
jud
ges
Var
iety
(nu
mb
ero
fg
lob
al
solu
tio
ns)
,Q
uan
tity
(nu
mb
ero
f
var
ian
ts),
No
vel
ty(p
erce
nt
of
solu
tio
ns
gen
erat
edb
yfe
wer
nu
mb
ero
fg
rou
pm
emb
ers,
clas
sifi
cati
on
of
par
adig
m
chan
ge
typ
e),
feas
ibil
ity
(tim
e
ded
icat
edto
solu
tio
n,
rate
of
atte
nd
edre
flec
tio
ns)
17
Ph
.D.
stu
den
tso
rp
rofe
sso
rs
eval
uat
edan
dp
lace
din
4
gro
up
s,4
5m
ind
esig
n
pro
ble
m
At
sket
cho
r
pro
toty
pe
stag
e
Sar
kar
Met
rics
Sar
kar
20
08
Met
rics
wit
h
jud
ges
Co
un
to
fco
nce
pts
that
sati
sfy
each
of
the
var
iab
les
atri
gh
t,
jud
gem
ent
of
crit
eria
by
jud
ges
Qu
anti
ty,
qu
alit
y(s
ize
and
typ
eo
f
des
ign
spac
eex
plo
red
),so
luti
on
rep
rese
nta
tio
n(n
um
ber
of
solu
tio
ns
by
sket
ch,
des
crip
tio
n,
etc.
),v
arie
ty(c
om
par
iso
no
fle
ss
sim
ilar
idea
sto
ver
ysi
mil
ar
idea
s)
6d
esig
ner
sw
ith
gra
du
atio
n
deg
ree
and
3y
ears
exp
erie
nce
,n
oti
me
con
stra
int,
giv
enid
eatr
igg
ers
thro
ug
ho
ut
At
sket
chin
gst
age
72 Res Eng Design (2013) 24:65–92
123

group of ideas). The final subsection details current limi-
tations of creativity assessment to provide the motivation
behind the creation of the CCA and MPCA detailed in the
next section.
3.1 Person/personality assessment methods
Sources claim that there are over 250 methods of assessing
the creativity of a person or personality (Torrance and Goff
1989; Cropley 2000), thus the methods presented herein are
only a small sample that include the more prominent
methods found in literature, especially within engineering
design.
Perhaps the most prominent of psychometric approaches
to study and classify people are the Torrance Tests of
Creative Thinking (TTCT) and the Myers-Briggs Type
Indicator (MBTI). The TTCT originally tested divergent
thinking based on four scales: fluency (number of respon-
ses), flexibility (number of categories of responses), orig-
inality (rarity of the responses), and elaboration (detail of
the responses). Thirteen more criteria were added to the
original four scales and are detailed in Torrance’s discus-
sion in The Nature of Creativity (Torrance 1988).
The MBTI tests classify people in four categories: atti-
tude, perception, judgment, and lifestyle. The attitude of a
person can be categorized as either extroverted or intro-
verted. The perception of a person is through either sensing
or intuition, and the judgment of a person is through either
thinking or feeling. The lifestyle of a person can be clas-
sified as using either judgment or perception in decisions.
Further detail can be found in (Myers and McCaulley
1985) and (McCaulley 2000). Although MBTI does not
explicitly assess creativity, the method has been used for
decades in creativity personality studies, examples of
which include: (Jacobson 1993; Houtz et al. 2003; Nix and
Stone 2010; Nix et al. 2011).
The Creatrix Inventory (C&RT) is unique in that it
analyzes a designer’s creativity relative to his/her tendency
to take risks in concept design. The scores are plotted on a
creativity versus risk scale and the designer is ‘‘assigned
one of eight styles: Reproducer, Modifier, Challenger,
Practicalizer, Innovator, Synthesizer, Dreamer, and Planner
(Cropley 2000).’’ Another unique approach to evaluating
designers’ creativity is the Creative Reasoning Test (CRT).
This method poses all the questions in the form of riddles.
Further detail regarding personality assessment methods
can be found in (Cropley 2000). Although useful to
determine the creativity of people, these methods do not
play any part in aiding or increasing the creative output of
people, regardless of whether or not they have been
determined to be creative by any of the above methods.
The following subsections evaluate the creativity of the
output.
3.2 Product evaluation methods
Srivathsavai et al. provide a detailed study of three product
evaluation methods that analyze novelty, technical feasi-
bility, and originality, presented by Shah et al. (2003b),
Linsey (Linsey 2007), and Charyton et al (2008), respec-
tively. The study analyzes the interrater reliability and
repeatability of the three types of concept measures and
concludes that these methods provide better reliability
when used at a feature/function level instead of at the
overall concept level. Furthermore, coarser scales (e.g., a
three- or four-point scale) provide better interrater reli-
ability than finer scales (e.g., an eleven-point scale). Two
interesting points the study discusses are that most product
creativity metrics only compare like concepts against each
other and that most judges have to focus at a functional
level to rate concepts. This brings about a call for metrics
that can assess creativity of dissimilar concepts or products
and allow judges to take in the entire concept to analyze the
creativity of the entire product (Srivathsavai et al. 2010).
A similar comparison study by Chulvi et al. used three
metrics by Moss, Sarkar, and Chakrabarti and the Evalu-
ation of Innovative Potential (EPI) to evaluate the out-
comes of different design methods (Chulvi et al. 2011).
These methods evaluate the ideas individually, as opposed
to the study by Srivathsavai that evaluated groups of con-
cepts. The metrics by Moss use judges to evaluate concepts
based on usefulness and unusualness on a 0–3 scale. The
final creativity score for each concept is the product of the
scores for the two parameters. The metrics by Sarkar and
Chakrabarti also evaluate creativity on two parameters:
novelty and usefulness. The calculation of novelty is based
on the SAPPhIRE model of causality where the seven
constructs (action, state, physical phenomena, physical
effects, organs, inputs, and parts) constitute different levels
of novelty from low to very high. The interaction of the
constructs and levels are combined using function-beha-
vior-structure (FBS). The usefulness parameter of the
metrics is calculated based on the degree of usage the
product has or will have on society through importance of
function, number of users, length of usage, and benefit. The
two parameters, novelty and usefulness, are combined
through metrics that essentially multiply the two measures.
Lastly, the EPI method is modified by Chulvi et al. to only
evaluate creativity and uses the parameters: importance of
each requirement (on a 0–3–9 scale), degree of satisfaction
for each requirement (on a 1–3–9 scale), and the novelty of
the proposed design. Novelty is scored on a 0–3 scale by
judges as to whether the design is not innovative (score of
0), has incremental innovation (score of 1), has moderate
innovation (score of 2), or has radical innovation (score of
3). The Chulvi et al.’s study concluded that measuring
creativity is easier when the designers used structured
Res Eng Design (2013) 24:65–92 73
123

design methods as the outcomes are closer to the intended
requirements and innovative solutions are easier to pick out
from the groups. Furthermore, when these methods were
compared to expert judges rating the designs on 0–3 scales
for novelty, usefulness, and creativity, they found that the
judges had a difficult time assessing and comparing use-
fulness of concepts. Experts also have a difficult time
making a distinction between novelty and creativity.
Another form of creativity assessment is the Creative
Product Semantic Scale (CPSS) based on the framework of
the Creative Product Analysis Matrix (CPAM) created by
Susan Besemer (Besemer 1998; Besemer and O’Quin
1999; O’Quin and Besemer 2006). The CPSS is split into
three factors (Novelty, Elaboration and Synthesis, and
Resolution), which are then split into different facets for
analysis. The Novelty factor is split into original and sur-
prise. Resolution is split into valuable, logical, useful, and
understandable. Elaboration and Synthesis is split into
organic, elegant, and well crafted. Each of these nine facets
are evaluated using a set of bipolar adjective item pairs on
a 7-point Likert-type scale (Besemer 1998), with a total of
54 evaluation word pairs. Examples of these adjective item
pairs include useful–useless, original–conventional, and
well-made–botched (Besemer 2008). The Likert-type scale
allows raters to choose from seven points between the two
adjectives in order to express their opinion on the design.
Non-experts in any domain or field of study can use the
CPSS. However, possible downsides to the CPSS method
are that the recommended minimum number of raters
needed for the study is sixty and it takes considerable time
to go through all 54 adjective pairs for each individual
concept. In the case of limited time and personnel resour-
ces, this method is not practical.
Similar to the CPSS method, the Consensual Assessment
Technique (CAT) uses raters to assess concepts against
each other using a Likert-type scale system (Kaufman et al.
2008) on 23 criteria based on: novelty, appropriateness,
technicality, harmony, and artistic quality (Horng and Lin
2009). This method requires the judges to have experience
within the domain, make independent assessments of the
concepts in random order, make the assessments relative to
each other, and assess other dimensions besides creativity
(Amabile 1982).
A method created by Redelinghuys, called the CEQex
technique, has been readapted into the REV (Resources,
Effort, Value) technique. This method involves a set of
equations that evaluate product quality, designer expertise,
and designer creative effort (Redelinghuys 1997a, b). This
is the only method found thus far that evaluates both the
product and the designer. Also, the evaluation of the
designer does not involve the divergent thinking tests used
by many psychological creativity tests. Instead, it looks at
the educational background and relevant experience of the
designer(s) along with how much effort they put into the
creative design process. In this way, the assessment method
must evaluate not only the product, but the process as well.
The REV technique requires not only the subject
(designer), but also an assessor and a reference designer (a
real or fictional expert of the field in question).
The metrics discussed in this subsection present unique
ways of assessing products or ideas that have proven
valuable to researchers. However, through this literature
survey, several gaps in assessment methods have been
observed, which are mitigated by the new, proposed CCA
and MPCA methods. The following section discusses
several methods of assessing groups of ideas with specific
detail on one method developed by Shah et al. that are then
adapted into the CCA method. Thus, Sect. 3.3.1 presents
the full metrics of Shah et al. before detailing how they are
adapted into CCA in Sect. 4.
3.3 Assessing groups of ideas
The methods in Sect. 3.2 provide a means to assess indi-
vidual ideas based on judging scales. Several methods of
assessment take a step back from individual idea assess-
ment and focus on the evaluation of groups of ideas.
Two methods of assessing groups of ideas use the
principles of linkography, a graphical method of analyzing
relationships between design moves (Van Der Lugt 2000;
Vidal et al. 2004). Van Der Lugt use the linkography
premise to evaluate groups of ideas based on the number of
links between ideas, the type of link, and how many
designers were involved with each idea. The three types of
links are supplementary (if one idea adds to another),
modification (if one idea is changed slightly), and tan-
gential (two ideas are similar but with different function)
(Van Der Lugt 2000). The study done by Vidal et al.
focuses on link density using the variables: number of
ideas, number of valid ideas, number of rejected ideas,
number of not related ideas, and number of global ideas
(Vidal et al. 2004).
Two other methods of assessing groups of ideas measure
similar aspects of ideation method effectiveness, but use
different variables to calculate them. The metrics by
Lopez-Mesa analyze groups of ideas based on novelty, vari-
ety, quantity, and feasibility (quality) (Lopez-Mesa et al.
2011), while the metrics presented by Sarkar in AI EDAM
are based upon variety, quantity, quality, and solution
representation (words vs visual, etc.) (Sarkar and Chak-
rabarti 2008). Lopez-Mesa et al. evaluate variety through
the number of global solutions in the set of designs, while
Sarkar et al. compare the number of similar ideas to those
with less similarity. Quality in the Sarkar et al. metrics is
based on the size and type of design space explored by the
set of ideas, while feasibility according to Lopez-Mesa
74 Res Eng Design (2013) 24:65–92
123

et al. refers to the time dedicated to each solution and the
rate of attended reflections. Lopez-Mesa et al. provide a
unique perspective on the representation and calculation of
novelty compared with other group ideation assessment
methods in that it is a characterization of change type (i.e.,
whether only one or two new parts are present versus an
entire system change) and level of ‘‘non-obviousness’’
calculated by how many teams in the experiment also
produced similar solutions (Lopez-Mesa et al. 2011).
Shah et al.’s metrics measure the effectiveness of concept
generation methods, that is, groups of ideas, and have been
used prolifically in the literature (Lopez-Mesa and Thompson
2006; Nelson et al. 2009; Oman and Tumer 2010; Schmidt
et al. 2010; Srivathsavai et al. 2010) and been adapted on
several occasions to meet individual researchers’ needs
(Nelson et al. 2009; Oman and Tumer 2009, 2010; Lopez-
Mesa et al. 2011). The set of metrics created to compare the
different concept generation methods are based upon any of
four dimensions: novelty, variety, quantity, and quality (Shah
et al. 2003a, b). The concept generation methods can be
analyzed with any or all of the four dimensions, but are based
on subjective judges’ scoring. The original metrics and vari-
ables for this method are discussed in the next subsection. An
important aspect of these metrics is that they were not
developed to measure creativity specifically, rather the
‘‘effectiveness of [ideation] methods in promoting idea gen-
eration in engineering design (Shah et al. 2000).’’ However, as
the definitions of creativity and innovation detailed in Sect. 2.1
involve the inclusion of originality and usefulness, the
dimensions of novelty and quality included in Shah et al.’s
metrics can be adapted to suit the needs of creativity assess-
ment, as discussed in the following sections.
3.3.1 Metrics by Shah et al.
The original metrics provided by Shah et al. are presented here
before discussing how the metrics are adapted to apply to
individual concepts in a set of designs in the next section.
For each of the equations, the ‘‘stages’’ discussed refer
to the stages of concept development, that is, physical
principles, conceptualization, implementation (embodi-
ment), development of detail, testing, etc.
3.3.1.1 Novelty Novelty is how new or unusual an idea is
compared to what is expected. The metric developed for it is:
MN ¼Xm
j¼1
fj
Xn
k¼1
SNjkpk ð1Þ
where MN is the novelty score for an idea with m functions
and n stages. Weights are applied to both the importance of
the function (fj) and importance of the stage (pk). SN is
calculated by:
SNjk ¼Tjk � Cjk
Tjk� 10 ð2Þ
where Tjk is the total number of ideas for the function j and
stage k, and Cjk is the number of solutions in Tjk that match
the current idea being evaluated. Dividing by Tjk normal-
izes the outcome, and multiplying by 10 provides a scaling
of the result.
3.3.1.2 Variety Variety is measured as the extent to
which the ideas generated span the solution space; lots of
similar ideas are considered to have less variety and thus
less chance of finding a better idea in the solution space.
The metric for variety is:
MV ¼Xm
j¼1
fjX4
k¼1
SVkbk=n ð3Þ
where MV is the variety score for a set of ideas with
m functions and four (4) rubric levels. The analysis for
variety uses four levels to break down a set of ideas into
components of physical principles, working principles,
embodiment, and detail. Each level is weighted with scores
SVk with physical principles worth the most and detail
worth the least. Each function is weighted by fj, and the
number of concepts at level k is bk. The variable n is the
total number of ideas generated for comparison.
3.3.1.3 Quality Quality measures how feasible the set of
ideas is as well their relative ability to satisfy design
requirements. The metric for quality is:
MQ ¼Xm
j¼1
fj
XSQjkpk= n�
Xm
j¼1
fj
!ð4Þ
where MQ is the quality rating for a set of ideas based on
the score SQjk at function j and stage k. The method to
calculate SQ is based on normalizing a set of numbers for
each Quality criterion to a range of 1 to 10. No metric is
given to calculate these SQ values. Weights are applied to
the function and stage (fj and pk,, respectively), and m is the
total number of functions. The variable n is the total
number of ideas generated for comparison. The denomi-
nator is used to normalize the result to a scale of 10.
3.3.1.4 Quantity Quantity is simply the total number of
ideas, under the assumption that the more ideas there are,
the greater the chance of creating innovative solutions.
There is no listed metric for quantity as it is a count of the
number of concepts generated with each method of design.
The four ideation assessment equations (Novelty, Vari-
ety, Quality, and Quantity) are effective in studies to
determine which concept generation method (such as 6-3-5
or TRIZ) works to produce the most effective set of ideas.
Res Eng Design (2013) 24:65–92 75
123

The methods discussed in Sect. 3.3 outline ways to
assess multiple groups of ideas to determine which set of
ideas has more creativity or effective solutions. The fol-
lowing subsection outlines the limitations of current crea-
tivity assessment.
3.4 Limitations of current creativity assessment
There is a lack of methodology to assess any group of ideas
in order to determine the most creative idea out of the
group. This limitation led to the adaptation of the above
equations into the Comparative Creativity Assessment
(CCA)—a method to do just such an assessment, which is
detailed in the next section. The CCA is based off the two
equations by Shah et al. that succeed in evaluating indi-
vidual designs instead of the entire idea set. Furthermore,
there is no method to simultaneously account for all of the
aspects of creativity considered in this study and rank
orders the concepts in terms of creativity. The work done
by Shah et al. is widely used to assess concept generation
methods, but was easily adaptable to suit the needs of this
study.
The equations also bring to the table a method that
reduces the amount of reliance of human judgment in
assessing creativity—something not found in current lit-
erature. All other assessment methods, such as CAT and
CPSS, rely on people to rate the creativity of the products
or ideas based on set requirements. Furthermore, many
judgment-based creativity assessments are very detailed
and take considerable time to implement. The goal of the
CCA is to reduce the level of subjectivity in the assessment
while making it repeatable and reliable. The CCA metrics
and procedure for evaluating concepts are detailed in Sect.
4.1 that will explain how this goal is satisfied. The Multi-
Point Creativity Assessment (MPCA) is introduced next to
combat a gap in judging methods for a quick, but detailed
creativity assessment and is discussed in the Sect. 4.2. The
theory of the MPCA is based on a proven task analysis
method developed by NASA and on the adjective pairing
employed by the CPSS method. The MPCA provides an
opportunity to combine the quick assessment technique of
NASA’s Task Load Index (TLX) and the method of
evaluating aspects of creativity introduced by the CPSS
method. The Shah et al. metrics were used as a starting
point due to their prolific nature within the engineering
design research community. They were the most thor-
oughly developed and tested at the time and were the only
metrics that came close to the overarching goal of the
CCA: to develop a method that reduces the dependence on
judges to evaluate creativity of individual concepts. The
MPCA was designed to provide a more detailed, but quick
method of evaluating creativity using judges and was based
on two methods (NASA’s TLX and the CPSS method) that
were previously established and used extensively in liter-
ature as well.
4 Creativity metrics development
The proposed creativity assessment method is an adapta-
tion of Shah et al.’s previous metrics that provide a method
to analyze the output of various ideation methods to
determine which method provides the most effective
results, detailed in the previous section. The following
subsection outlines how these metrics were adapted to suit
new assessment requirements for evaluating concept crea-
tivity. Section 4.2 provides insight into how the proposed
MPCA evaluation method was created based on previously
established assessment methods.
4.1 Comparative Creativity Assessment (CCA)
With Shah et al.’s metrics, ideation methods can be com-
pared side by side to see whether one is more successful in
any of the four dimensions. However, the metrics are not
combined in any way to produce an overall effectiveness
score for each concept or group of ideas. Because the
purpose of the original Shah’s metrics was the ability to
assess ideation methods for any of the four aspects, they
did not help to assign a single creativity score to each team.
The four areas of analysis were not intended to evaluate
creativity specifically and were not to be combined to
provide one score or rating. Shah et al. best state the rea-
soning behind this: ‘‘Even if we were to normalize them in
order to add, it is difficult to understand the meaning of
such a measure. We can also argue that a method is worth
using if it helps us with any of the measures (Shah et al.
2003b).’’ There is added difficulty to combining all of the
metrics, as Novelty and Quality measure the effectiveness
of individual ideas, while Variety and Quantity are
designed to measure an entire set of ideas generated. Thus
Variety and Quantity may be considered as irrelevant for
comparing different ideas generated from the same method.
With this in mind, two of the Shah’s metrics above can be
manipulated to derive a way to measure the overall crea-
tivity of a single design in a large group of designs that
have the same requirements.
This paper illustrates how to implement the modified
versions of the Novelty and Quality metric on a set of
designs that aim to solve the same engineering design
problem. For the purposes of assessing the creativity of a
final design compared with others, the metrics developed
by Shah et al. were deemed the most appropriate based on
the amount of time required to perform the analysis and
ease of understanding the assessment method. However,
the Variety and Quantity metrics could only evaluate a
76 Res Eng Design (2013) 24:65–92
123

group of ideas, so only the two metrics that could evaluate
individual ideas from the group, namely Novelty and
Quality, could be used. Also, the original metrics focused
not only on the conceptual design stage, but also on
embodiment (prototyping), detail development, etc. within
concept design. As the focus of this study is to assess the
creativity at the early stages of concept generation,
the metrics have to be further revised to account for only
the conceptual design phase.
The following are the resulting equations:
Novelty: MN ¼Xm
j¼1
fjSNj ð5Þ
SNj ¼Tj � Rj
Tj� 10 ð6Þ
Quality: MQ ¼Xm
j¼1
fjSQj ð7Þ
SQj ¼ 1þ ðAj � xjÞð10� 1Þ=ðAj � BjÞ ð8Þ
CCA: C ¼ WNMN þWQMQ ð9Þ
where
WN þWQ ¼ 1 ð10Þ
and
Xm
j¼1
fj ¼ 1 ð11Þ
where the design variables are: Tj, number of total ideas
produced for function j in Novelty; i, number of ideas
being evaluated in Quality; fj, weight of importance of
function j in all equations; Rj, number of similar solutions
in Tj to function j being evaluated in Novelty; Aj, maximum
value for criteria j in set of results; Bj, minimum value for
criteria j in set of results; xj, value for criteria j of design
being evaluated; SQj, score of quality for function j in
Quality; SNj, score of novelty for function j in Novelty; WN,
weight of importance for Novelty (WN in real set [0,1]);
WQ, weight of importance for Quality (WQ in real set [0,1]);
MN, creativity score for Novelty of the design; MQ, crea-
tivity score for Quality of the design; C, Creativity score.
In this paper, the theory behind the Novelty and Quality
metrics is combined into the CCA (Eq. 8), in an attempt to
assist designers and engineers in assessing the creativity of
their designs quickly from the concept design phase. The
CCA is aptly named as it aims to provide engineers and
companies with the most creative solution so that they may
create the most innovative product on the market.
Emphasis in this study is placed solely on the concept
design stage because researchers, companies, and engineers
alike all want to reduce the amount of ineffectual designs
going into the implementation stages (Ullman 2006). Other
goals of creative concept design include identifying the
most promising novel designs while mitigating the risk of
new territory in product design.
As the metrics were not intended to be combined into a
single analysis, the names of variables are repeated but do
not always represent the same thing, so variable definitions
must be modified for consistency. The original metric
equations (Eqs. 1–4) are written to evaluate ideas by dif-
ferent stages, namely conceptual, embodiment, and detail
development stages. However, as the analysis in this study
is only concerned with the conceptual design stage and
does not involve using any existing ideas/creations, the
equations will only be evaluated at the conceptual stage,
that is, n and pk in the Novelty equation equal one.
The major differences between the metrics created by
Shah et al. and the Comparative Creativity Assessment
used in this paper are the reduction in the summations to
only include the concept design level, and the combination
of Novelty and Quality into one equation. The resulting
assessment will aid in quick and basic comparison between
all the designs being analyzed. This equation takes each of
the creativity scores for the modified Novelty (MN) and
Quality (MQ) and multiplies each by a weighted term, WN
and WQ, respectively. These weights may be changed by
the evaluators based on how important or unimportant the
two aspects are to the analysis. Thus, these weights and the
weights of the individual functions, fj, are a subjective
aspect of the analysis and are based on customer and
engineer requirements and preferences. This could prove
advantageous as the analyses can be applied to a very wide
range of design situations and requirements. Brown states it
most concisely; ‘‘the advantage of any sort of metric is that
the values do not need to be ‘correct’, just as long as it
provides relative consistency allowing reliable comparison
to be made between products in the same general category
(Brown 2008).’’ Future work will determine how to elim-
inate the subjectiveness of the function weights through the
inclusion of new metrics that evaluate the number of the
creative solutions for each function in a data set.
Note that both equations for Novelty and Quality look
remarkably similar; however, the major difference is with
the SN and SQ terms. These terms are calculated differently
between the two creativity metrics and are based on dif-
ferent information for the design. The method to calculate
SQ is based on normalizing a set of numbers for each
Quality criterion to a range of 1–10. Each criterion for the
Quality section must be measured or counted values in
order to reduce the subjectivity of the analysis. For
example, the criterion to minimize weight would be cal-
culated for device x by using the maximum weight (Aj) that
any of the devices in the set exhibit along with the mini-
mum weight (Bj). Equation 8 is set up to reward those
designs which minimize their value for criteria j. If the
Res Eng Design (2013) 24:65–92 77
123

object of a criterion for Quality is to maximize the value,
then the places for Aj and Bj would be reversed. Other
possible criteria in the Quality section may be part count,
power required, or number of manufactured/custom parts.
It can be summarized that the main contributions of this
research are the modifications to Eqs. 1 and 3 to develop
Eqs. 5 and 7, plus the development of the new Eqs. 8–10.
Furthermore, these metrics are proposed for use in a new
application of assessing individual ideas through the
combination of quality and novelty factors, an application
that has not been found in previous research. Future anal-
ysis of the metrics will determine how to add variables into
the metrics that capture interactions of functions and
components. This is important in the analysis of creativity
with regard to functional modeling in concept generation as
many creative solutions are not necessarily an individual
solution to one particular function, but the combination of
several components to solve one or more functions within a
design problem.
4.2 Multi-Point Creativity Assessment (MPCA)
To compare the results of the Comparative Creativity
Assessment (CCA), two other forms of assessing creativity
were performed on the devices: a simple rating out of ten
for each product by the judges and the Multi-Point Crea-
tivity Assessment (MPCA).
The MPCA was adapted from NASA’s Task Load Index
(TLX) (2010), which allows participants to assess the
workload of certain tasks. Each task that a worker performs
is rated based on seven different criteria, such as mental
demand and physical demand. Each criterion is scored on a
21-point scale, allowing for an even five-point division on a
scale of 100. To develop a weighting system for the overall
analysis, the participants are also asked to indicate which
criteria they find more important on a list of pair-wise
comparisons with all the criteria. For example, in the
comparison between mental and physical demand in the
TLX, one might indicate that they feel mental demand is
more important for the tasks being evaluated.
For the purpose of the creativity analysis, the TLX was
adapted such that the criteria used are indicative of dif-
ferent aspects of creativity, such as unique, novel, and
functional. Judges rated each device using the creativity
analysis adapted from the NASA TLX system, herein
called the Multi-Point Creativity Assessment (MPCA).
After rating each device based on the seven criteria of
creativity, the judges rate all the criteria using the pair-wise
comparisons to create the weighting system for each judge.
Appendix 2 contains the score sheet used by the Judges to
rate each device.
Appendix 3 is an example of a completed pair-wise
comparison used to calculate the weights of the criterion.
The premise for the pair-wise comparisons is to evaluate
the judges’ perception of what they think is more important
for creativity analysis for each of the criteria. The criteria
used for the MPCA are original/unoriginal, well-made/
crude, surprising/expected, ordered/disordered, astonish-
ing/common, unique/ordinary, and logical/illogical. Using
the information of judges’ preferences for the criteria, a
composite score can be calculated for each device. For
example, between original and surprising, one judge may
deem original more creative, while another thinks sur-
prising is more important for creativity. See Appendix 3 for
a full example of the comparisons.
The final score, on a base scale of 10, is calculated by
Eq. 12:
MPCA ¼Pg
h¼1
Pmj¼1 fj � SMj
h i.T
� �
10gð12Þ
where the design variables are: MPCA, Multi-Point Crea-
tivity Assessment score; fj, weighted value for criterion j;
SMj, Judge’s score for criterion j; m, total number of criteria
in the assessment; T, total number of pair-wise compari-
sons; g, total number of judges.
The example values for the weights (fj) provided in
Appendix 3 would be multiplied by each of the judges
ratings for the criteria provided in Appendix 2. Thus, an
example calculation for the base summation of one design
idea using the numbers provided in the Appendices
becomes:
Xm
j¼1
fj � SMj
" #=T ¼ ð6� 80þ 2� 65þ 5� 85þ 2� 35
þ 4� 60þ 3� 50þ 4� 65þ 2
� 45Þ=28
¼ 65:89
In the above calculation, the criteria are summed in the
order presented in Appendix 2. The full calculation for the
MPCA of a particular design idea would then involve
averaging all the judges’ base summations for that idea
(like the one calculated above) and dividing by ten to
normalize to a base scale.
This proposed assessment method has the advantage
over the CPSS method as it takes a fraction of the time and
manpower, while still providing a unique opportunity to
assess creativity through multiple aspects. The MPCA also
takes into consideration judges’ perceptions of creativity
through the calculation of the weighted value for each
criterion (fj in Eq. 12). As there is no similar method of
creativity assessment that requires few judges and breaks
creativity up into several aspects, validation of the method
becomes difficult. However, it can be argued that the
method, although newly developed, has been proven
through the successful history of its origin methods. The
78 Res Eng Design (2013) 24:65–92
123

base summation for the MPCA is the NASA-derived
equation for the TLX method calculation. The second
summation and base scale of ten were added based on the
CPSS methodology.
5 Experimental studies
The proposed creativity assessment methods were devel-
oped to assess the creativity of concept designs that work to
solve the same engineering design problem. Two studies
were conducted during the development of the CCA and
MPCA, one prior to the creation of the MPCA and use of
the Judges’ scoring as a pilot study. Lessons learned from
the first study are applied in Study Two. The second study
is more comprehensive, using all three methods of evalu-
ation in comparison with statistical conclusions drawn
from the data. Both studies used undergraduate, junior-
level design team projects as the case study and are
described further in this section.
Table 4 Fall 2008 Novelty
criteria and typesFunction Solution Number of designs SNj
Move device (f1 = 0.25) Track 24 1.43
Manufactured wheels 1 9.64
4 9 Design wheels 2 9.29
8 9 Design wheels 1 9.64
Drive over barrier (f2 = 0.2) Double track 4 8.57
Angle track 15 4.64
Single track powered 2 9.29
Wheels with arm 1 9.64
Wheels with ramp 1 9.64
Angled wheels powered 1 9.64
Tri-wheel 1 9.64
Single track with arm 1 9.64
Angled track with arm 2 9.29
Pick up rocks (f3 = 0.2) Rotating sweeper 10 6.43
Shovel under 8 7.14
Scoop in 9 6.79
Grabber arm 1 9.64
Store rocks (f4 = 0.15) Angle base 11 6.07
Flat base 10 6.43
Curve base 2 9.29
Hold in scoop 3 8.93
Tin can 1 9.64
Half-circle base 1 9.64
Drop rocks (f5 = 0.15) Tip vehicle 2 9.29
Open door 8 7.14
Mechanized pusher 5 8.21
Reverse sweeper 4 8.57
Open door, tip vehicle 3 8.93
Drop scoop 3 8.93
Rotating doors 1 9.64
Leave can on target 1 9.64
Rotating compartment 1 9.64
Control device (f6 = 0.05) Game controller 3 8.93
Plexiglass 5 8.21
Remote controller 4 8.57
Plastic controller 3 8.93
Car controller 7 7.50
Metal 5 8.21
Wood 1 9.64
Res Eng Design (2013) 24:65–92 79
123

5.1 Study one: Mars Rover design challenge
5.1.1 Overview
Study One had 28 teams design a robotic device that could
drive over 4’’ 9 4’’ (10.2 cm 9 10.2 cm) barriers, pick up
small rocks, and bring them back to a target area on the
starting side of the barriers for the 2008 ASME Student
Design Competition (2009). Although each device was
unique from every other device, it was also very evident
that many designs mimicked or copied each other to satisfy
the same requirements of the design competition problem.
For example, 24 of the 28 designs used a tank tread design
for mobility, while only four designs attempted wheeled
devices.
5.1.2 Creativity evaluation
To implement the creativity metrics, each design is first
evaluated based on converting energy to motion (its
method of mobility), traversing the barriers, picking up the
rocks, storing the rocks, dropping the rocks in the target
area, and controlling energy (their controller). These
parameters represent the primary functions of the design
task and make up the Novelty component of scoring.
Table 4 outlines the different ideas presented in the
group of designs under each function (criterion) for the
Novelty analysis, followed by the number of designs that
used each particular idea. Below each function (criterion)
name in the table is the weighted value, fj, which puts more
emphasis on the more important functions such as mobility
and less emphasis on less important functions such as how
the device is controlled. Note that all weights in the anal-
ysis are subjective and can be changed to put more
emphasis on any of the criteria. This gives advantage to
those engineers wanting to place more emphasis on certain
functions of a design rather than others during analysis.
The third column shows the Rj values (number of similar
solutions in Tj to the function j being evaluated in Novelty)
and all the Tj values equal 28 for all criteria (28 designs
total). The final column presents the score of novelty for
each associated function solution (SNj in Eqs. 5, 6).
The calculation for each concept’s Novelty score then
becomes a summation of its SNj values for each function
solution multiplied by the functions respective weighting.
An example calculation for one of the devices is given
below that uses the first choice listed for each of the
functions. These choices are track (move device), double
track (drive over barrier), rotating sweeper (rick up rocks),
angle base (store rocks), tip vehicle (drop rocks), and game
controller (control device). The calculation of Novelty for
the example concept becomes:
MN ¼ 0:25� 1:43þ 0:2� 8:57þ 0:2� 6:43þ 0:15
� 6:07þ 0:15� 9:29þ 0:05� 8:93
¼ 6:11
The Quality section of the metrics evaluates the designs
individually through the criteria of weight, milliamp hours
from the batteries, the number of switches used on the
controller, the total number of parts, and the number of
custom manufactured parts. These criteria were created in
Table 5 Quality criteria weighted values
Criteria fj value
Weight 0.3
Milliamp hours 0.2
# Switches 0.2
# Materials 0.2
# Manuf. parts 0.1
Table 6 Novelty, quality, and combined creativity scores for study
one
Fig. 1 Device 3—evaluated as the most creative mars rover design
80 Res Eng Design (2013) 24:65–92
123

order to determine which devices were the most complex to
operate, the most difficult to manufacture, and the most
difficult to assemble. The weight and milliamp hour criteria
were part of the competition requirements and easily
transferred to this analysis. Each device was evaluated and
documented with regard to each of the criteria, and then all
the results were standardized to scores between 1 and 10.
For example, the maximum weight for the design set was
2,900 g (Aj in Eq. 8), and the minimum weight was 684
grams (Bj in Eq. 8). Each design was weighed (xj in Eq. 8),
and the weights were normalized to a scale of ten using the
equation for SQj. The calculation for an example product
weighing 2,000 g is:
SQ weight ¼ 1þ ð2; 900� 2; 000Þð10� 1Þ=ð2; 900� 684Þ¼ 4:66
The overall Quality score for the example would then
sum the products of the SQ values and the function weights
(fj). The above example shows how the equation to
calculate the Quality score for a particular function
(vehicle weight in this case) gives lower scores for
higher values within the data set. The weighted values
for each criterion in Quality are presented in Table 5. Thus,
the above SQ_weight = 4.66 would be multiplied by
fweight = 0.3 from the table in the calculation for MQ.
With all the variables for the Novelty and Quality metric
components identified, each device is then evaluated. Once
the Novelty and Quality criteria are scored for each device,
the CCA is implemented to predict the most overall crea-
tive design of the set.
Table 6 lists each device with an identifying name and
their respective Novelty and Quality scores. The total
creativity score C from the CCA following the Novelty and
Quality scores is calculated using the weights WN and WQ,
where WN equals 0.6 and WQ equals 0.4, giving more
priority to Novelty. The subjectiveness of the metrics is
needed so that they can be applied over a wide range of
design scenarios. The advantage to this subjectiveness is
that the weights can be changed at any time to reflect the
preferences of the customers or designers. This would be
useful for situations in which a customer may want to focus
more on the quality of the project and less on novelty, thus
allowing evaluators to include creativity as a secondary
focus if needed.
As highlighted in Table 6, the device with the highest
Creativity score based on the revised metric is Device 3,
pictured in Fig. 1. It is interesting to note that D3 remains
the highest scoring design of the set until the weights for
Novelty and Quality are changed such that Quality’s
weight is greater than 0.6, at which point D10 (highlighted
in Table 6) becomes the highest scoring because of its high
Quality score. However, when the Novelty weight is
increased above 0.85, D27 becomes the most creative
based on the CCA because of its high Novelty score
(highlighted in Table 6). Figure 2 illustrates the relation-
ship between the final CCA scores and varying the weights
for Novelty and Quality. In the plot, the Novelty weight
steadily increases by 0.1 to show how each device’s overall
score changes. This figure shows that although two devices
can have the highest CCA score when the Novelty weight
is high or low, only Device 3 is consistently high on CCA
score (it is the only to score above 8.0 no matter what the
weights).
Device 3 is the most creative of the group because it
embodies the necessary criteria for both Novelty and
Quality such that the design is both unique and useful at the
conceptual design phase. The design of Device 3 is unique
because it was the only one to use four manufactured
wheels (mobility) and a ramp (over barrier). Its solution for
picking up the rocks (shovel under) and storing the rocks
Fig. 2 Relationship between
varying novelty weights and
CCA score
Res Eng Design (2013) 24:65–92 81
123

(flat compartment) were not quite as unique, but it was only
one of five devices to use a mechanized pusher to drop the
rocks and only one of four to use a remote controller. The
combination of these concepts yielded a high Novelty
score. Its high Quality score is largely due to the fact that it
had the lowest milliamp hours and the lowest number of
parts of all the devices. It also scored very well for weight
and number of manufactured parts, but only had a median
score for the number of switches used to control the device.
As stated previously, this analysis only deals with the
conceptual design phase and not implementation. The
majority of the designs actually failed during the end-of-
project design competition due to many different problems
resulting from a time constraint toward the end of the design
process for the design teams. The emphasis of the project was
on concept design and team work, not implementation of their
design. Only two devices in the 28 designs were able to finish
the obstacle course, and most designs experienced a failure,
such as component separation or flipping upside-down when
traversing the barrier, which was all expected. Four months
after the local design competition, at the regional qualifiers for
the ASME Mars Rover competition, the majority of all the
competing designs from around the Pacific Northwest per-
formed in the same manner as the end-of-project design
competition, even with months of extra development and
preparation. This illustrates the difficulty of the design prob-
lem and the limitations placed on the original design teams
analyzed for this study.
5.1.3 Lessons learned from study one
Several important contributions came from Study One that
benefited the second experiment detailed in Sect. 5.2. The
primary goal of the first study was determining the procedure
for analyzing the student concepts using the CCA.
Study One also provided information regarding how the
data needed to be collected from the student design teams and
how the calculations were run. Data collection was done
during and after the design competition, making it difficult to
collect data. Organized Excel spreadsheets developed prior to
the assessment of the designs would have proved to be more
effective and efficient when it came to data collection. This
aspect of data collection was employed in Study Two in order
to use more reliable data from the students.
Study One showed that there needs to be less emphasis on
the execution of the ideas developed by the students. This was
evident from the results of the design competitions as the
students lack the experience of design implementation at their
current stage of education. They develop machining and
design development skills in the next semester and during
their senior design projects. This provided the motivation to
assessing only at the concept design level with the metrics.
Some interesting trends were discovered when analyz-
ing the results of the CCA scores. This is evident most
prominently in Fig. 2 as it shows that some concepts prove
to be more creative regardless of the weightings for novelty
and quality, while others were only creative based on one
of the aspects. Other concepts proved to be not creative no
matter what weightings were applied to the assessment.
5.2 Study two: automated waste sorter design
challenge
5.2.1 Overview
Study Two consisted of 29 teams given 7 weeks to design and
create prototypes for the 2009 ASME Student Design compe-
tition, which focused on automatic recyclers (2010). The rules
called for devices that automatically sort plastic bottles, glass
containers, aluminum cans, and tin cans. The major differen-
tiation between types of materials lay with the given dimen-
sions of the products: plastic bottles were the tallest, glass
containers were very short and heavy, and aluminum cans were
lightweight compared to the tin cans of similar size. The tin
cans were ferrous and thus could be sorted using magnets.
Devices were given strict requirements to abide by such as
volume and weight constraints and safety requirements, and
most importantly had to operate autonomously once a master
shut-off switch was toggled (see Fig. 3 for an example).
As with the devices for Study One, the teams created
very similar projects, although each was unique in its own
particular way. For example, 21 of the 29 devices sorted
the tin cans using a motorized rotating array of magnets,
yet within all the teams, there were 15 different strategies
for the progression of sorting the materials (for example,
plastic is sorted first, then tin, aluminum, and glass last).
All the devices were evaluated only at the concept
design stage and not on the implementation. The studentsFig. 3 Example waste sorter with functions to automatically sort
plastic, glass, aluminum, and tin
82 Res Eng Design (2013) 24:65–92
123

did not have time to place adequate attention on the
implementation and testing of their devices. Many teams
did not have any teammates with adequate experience in
many of the necessary domains, such as electronics or
programming. Thus, many concepts were very sound and
creative, but could not be implemented completely within
the time allotted for the project.
At the end of each study, the teams participated in a design
exhibition where they are required to compete against other
teams. Because less emphasis was placed on the implementa-
tion of their concepts, all the devices were very basic and
limited in construction. Unfortunately, none of the devices
were able to successfully sort the recyclable materials auton-
omously, but many functioned correctly if the recyclables were
fed into the device by hand. The major downfall for the teams
was their method of feeding the materials into their devices.
As the implementation of the team’s projects was rushed
at the end of the school term, proper documentation of the
Quality aspects were not possible. Thus, the quality aspect
of the Innovation Equation was not included this year in the
creativity analysis and the results of the end-of-term
competition are not presented.
5.2.2 Creativity evaluation
Each team executed a design process that began with
several weeks of systematic design exercises, such as using
Morphological Matrices and Decision Matrices in order to
promote the conceptual design process. Although every
device seemed unique from the others, it was also evident
that many designs mimicked or copied each other to satisfy
the same requirements of the design competition problem.
Study One provided valuable lessons learned that were
implemented in Study Two, such as the inclusion of asking
judges to rate the products and perform the MPCA.
The most basic assessment used was asking a panel of
judges to score the devices on a scale from one to ten for
their interpretation of creativity. The panel of judges was
assembled post-competition in a private room and given
the exact same set of information for each device, includ-
ing pictures and descriptions of how the device operated.
This procedure allowed for an acceptable interrater reli-
ability for the study ([0.75).
For the CCA, each device was documented for its methods
in satisfying novelty features. The novelty criteria included
how the device sorted each of the materials (plastic, alumi-
num, tin, and glass), in what order they were sorted, and how
the outer and inner structures were supported. Appendix 1
contains tables similar to Table 4 in Sect. 5.1.2, which outline
how many devices used a particular solution for each of the
novelty criteria. The weighted values, fj, are presented below
the title of each criterion. The weighted values used for this
analysis were based on the competition’s scoring equation and
the overall structural design. The scoring equation places the
same emphasis on all four waste material types, thus each of
the sorting types was given the same weighted value. The
method to support overall structure was given the next highest
fj value as it provides the majority of the support to the entire
design. The method of supporting the inner structure, although
important, does not garner as much emphasis in terms of
creativity, which can also be said for the order of sort.
The results of all three creativity analyses are given in
Table 7, with statistical analysis of the results presented in
the next section.
5.2.3 Statistical analysis
Statistical analysis results of this study include interrater
reliability of the judges and different comparisons within
the results of the three different creativity ratings described
previously.
Table 7 Study two creativity scores
Device # CCA Judging: out of 10 MPCA
1 5.86 5.33 5.26
2 5.90 5.11 4.92
3 7.76 5.89 5.31
4 6.84 5.22 5.37
5 6.86 6.00 5.68
6 6.43 6.67 6.66
7 6.67 3.11 3.92
8 6.60 6.11 6.51
9 6.53 5.67 6.01
10 6.66 4.56 4.83
11 7.83 6.78 6.75
12 6.78 6.78 6.33
13 8.40 8.00 7.07
14 6.17 6.22 5.68
15 7.24 4.78 4.95
16 9.12 4.78 5.26
17 6.45 5.89 5.82
18 6.76 6.00 5.17
19 7.86 6.33 6.21
20 5.62 6.11 5.40
21 7.07 6.33 5.62
22 8.07 5.78 5.82
23 8.78 5.67 5.38
24 7.90 7.11 6.94
25 6.69 5.89 5.99
26 6.31 5.33 5.64
27 6.57 4.44 4.40
28 6.64 6.33 6.09
29 9.16 8.44 7.64
Italics denote the highest score for each of the calculations
Res Eng Design (2013) 24:65–92 83
123

The analysis of the three types of creativity assessment
used averages of the judges’ scores out of ten, the averages
for each device from the Multi-Point Creativity Assess-
ment, and the final scores from the Comparative Creativity
Assessment. Thus, the scores from the CCA could be
compared to two average creativity means to determine the
validity of the method. This is done using an intraclass
correlation (ICC), which allows one to test the similarities
of measurements within set groups (Ramsey and Schafer
2002; Montgomery 2008).
The ICC was also used to determine the interrater
reliability of the judges for both the Judges’ scorings out
of ten and the MPCA. The judges were nine graduate
students at Oregon State University familiar with the class
projects and were provided the same information
regarding each project and the projects’ features. The
interrater reliability for the judges’ ratings out of ten for
each device was slightly higher than the MPCA interrater
reliability at 0.820 and 0.779, respectively. The CCA
method did not require judges. A previous study examined
the interrater reliability and repeatability of several ide-
ation effectiveness metrics, including the novelty portion
of Shah’s metrics (Srivathsavai et al. 2010). This study
found that the repeatability of the novelty metric at the
feature level of analysis had above an 80% agreement
between evaluators. This analysis successfully addresses
the concern of interpretation of data sets for the novelty
portion of Shah’s metrics and thus the novelty portion of
the CCA as well.
The primary analysis for the validation of the CCA is a
comparison of the means of the Judges’ scorings out of ten
and the MPCA, known as the intraclass correlation.
However, these two means must first be verified using a
bivariate correlation analysis, such as through SPSS sta-
tistical software (http://www.spss.com/).
Comparing the creativity scores for the MPCA and
judges’ ratings out of ten resulted in a high bivariate cor-
relation coefficient (Pearson’s r = 0.925). This verifies that
the two data sets are very similar to one another and thus
can be used to determine whether or not the Innovation
Equation results are also similar.
Fig. 4 Comparison of three creativity analyses
Fig. 5 Most creative automated waste sorter (Device 29) based on its
use of sensors for all sorting functions and a unique method of support
84 Res Eng Design (2013) 24:65–92
123

However, an intraclass correlation analysis on the three
data sets yields a very low correlation coefficient
(r = 0.336). A scatter plot of the data depicts this lack of
correlation and can be used to determine where the
majority of the skewed data lies (see Fig. 4). As shown in
this plot, Devices, 3, 7, 15, 16, 22, 23, and 27 are the most
skewed. Possible reasons behind the lack of correlation are
discussed in the next section. By eliminating these devices
from the analysis, the intraclass correlation rises signifi-
cantly (r = 0.700), thus proving partial correlation with
Judges’ scorings.
The data sets can be used to draw conclusions as to
which device may be deemed as the most creative out of
the 29 designs. A basic analysis of the data and graph
shows that the most creative design is Device 29 (see
Fig. 5), which has the highest average creativity score. This
can be attributed to the fact that it is one of the only devices
to use sensors for all sorting functions and the one device to
use plexiglass as its outer and inner supports.
5.2.4 Lessons learned
The implementation of the CCA in Study One and both the
CCA and MPCA in Study Two has taught some important
lessons regarding the evaluation of conceptual designs. The
large data set allowed statistical analysis of the results to
push the future of quantitative creativity assessment in the
right direction. These two studies have shown that metrics
can be applied to a set of designs to assess the level of
creativity of possible designs. These metrics can be used by
engineers and designers to determine, in the early stages of
design, which ideas may be the most beneficial for their
problem statement by driving toward innovative products.
The distinct advantage of the CCA method is that there is
very little human subjectivity involved in the method beyond
determining the weights/importance of the subfunctions (fj in
Eqs. 5, 7) and Novelty versus Quality (WN and WQ in Eq. 9).
The remainder of the subjectivity is with the interpretation of
how each subfunction is satisfied for each design idea, which
is dependent on the detail of the documentation or the
description by the designers. Further studies will determine
the amount of repeatability for this analysis, that is, to deter-
mine whether any designer uses the CCA method and obtains
the same results as the researchers in this study.
In addition, some conclusions can be drawn from this
study in regard to experimental setup. Much can be done to
improve future use of the creativity assessment techniques
to aid designers in the creativity evaluation process. First
and foremost, the more controls in an experiment of this
nature, the better. Using latent data on class competitions is
a good starting point in the development of creativity
assessment methods, but the conclusions drawn directly
from the data are not very robust. The design of a
controlled experiment is necessary as a final validation of the
CCA and MPCA. The designs evaluated in this study were
created based on overly constrained ASME design competi-
tion rules and regulations, thus somewhat hindering the
inclusion of creative solutions. Thus, the creativity in the
solutions was very similar and extremely innovative designs
were few and far between. Further studies using the creativity
analysis methods should be unconstrained, conceptual
experiments, allowing further room to delve outside the box
by the designers and bridge the gap between using the methods
to judge completed designs and evaluating concepts. The
evaluation of concepts is extremely important for engineers in
order to move forward in the design process.
Points to change in future experiments include varying
the delivery of information to the judges, while keeping the
information the exact same. This could include changing
the order that the judges rate the devices and changing the
way the data are presented for each device. This would
prevent trends in which judges tend to learn as they go,
thus the last ratings may be more consistent than the first
few. The group of judges had controlled information,
allowing them to create comparisons based on device
functions and structure; however, they were unable to see
the real products as there was no time during the design
competition to analyze them.
The pictures given to the judges and physical appear-
ance of the projects may have formed product appeal biases
that skewed the data. Although the two scoring sets from
the judges were statistically similar, they were well below
the scores of the CCA. This could be explained by the fact
that some judges may have used just the look of the devices
to rate them on creativity instead of taking into account the
uniqueness and originality they displayed in functionality
Fig. 6 Poorly implemented automated waste sorter (Device 7) with
no mechanics built into the device (only has a pegboard outer
structure)
Res Eng Design (2013) 24:65–92 85
123

and accomplishing the competition requirements. The
judges’ ratings for both the MPCA and out of ten were
based on rating the entire project, whereas the CCA broke
down the projects into the feature level.
A prime example of this is Device 7 (see Fig. 6), which had
a unique way of sorting the aluminum using an eddy current to
detect the material and used an outer structure that no other
team used. However, it simply looked like a box made of peg
board, thus the judges could easily give it a low creativity
score based on the outward appearance and apparent quality of
the device. This fact would explain the lack of correlation
between the CCA and the Judges’ scorings, but further data
and analysis would be necessary to fully attribute it to the low
correlation coefficient. As the focus of the study was on the
theoretical value of creativity of the concepts themselves, the
CCA should be more indicative of the true value of creativity.
This leads the argument that the low correlation between
judging methods and the CCA proves that the CCA better
captures overall creativity of an idea. Limitations placed on
the design teams (such as time, budget, and team member
capabilities) contributed to the lack of implementation of their
creative ideas.
Lastly, the information presented to the judges and used to
calculate the CCA was gathered using the teams’ class doc-
umentation, which was widely inconsistent. Some teams
provided great detail into the makeup and operation of their
device, while others did not even explain how the device
worked. In preparation for a creativity analysis such as this,
each team must be questioned or surveyed for relevant
information regarding all aspects of their device beforehand.
Because each team presented their device’s information dif-
ferently, the interpretation of said data was not consistent.
6 Conclusions and future work
This paper presents and discusses the analysis of concepts
generated during two mechanical engineering design projects
by means of creativity assessment methods. First a survey of
creativity assessment methods is presented and summarized in
Tables 1, 2 and 3 in Sect. 3, which provides a unique oppor-
tunity to compare and contrast analysis methods for person-
ality types, product creativity, and the creativity of groups of
ideas. This survey contributed to the motivation behind the
creation of the Comparative Creativity Assessment and Multi-
Point Creativity Assessment methods. In particular, the Multi-
Point Creativity Assessment method was used in conjunction
with a Comparative Creativity Assessment, derived from an
initial set of creativity metrics from the design creativity lit-
erature. The methods proposed in this paper fill the gaps found
in the current literature. The CCA method provides a means to
evaluate individual concepts within a data set to determine the
most creative ideas for a given design problem using very little
evaluator subjectivity. Furthermore, the CCA method breaks
down each concept to the function and component level; an
aspect of concept evaluation that is rarely seen in creativity
evaluation methods. The advantage of the MPCA method is
that this method is a quick method for judges to break concepts
down into seven aspects of creativity that factors in the judges’
preferences of importance for those aspects.
The creation of the MPCA in conjunction with the CCA
allowed for statistical analysis of the validity of these methods
in analyzing creativity in design. Although there was limited
statistical correlation between the judges’ scorings of crea-
tivity and the CCA scores, this study provides valuable insight
into the design of creativity assessment methods and experi-
mental design. Supplemental studies will examine the
repeatability of the CCA for users inexperienced with the
method and how to increase the interrater reliability of
the MPCA. Furthermore, metrics will be added to the CCA
method in order to eliminate the subjective nature of setting
the function weights (fj values) by the evaluators. The added
metrics will use information on the amount of creative solu-
tions within each function’s data set to determine the values of
each function’s importance with the analysis.
Further research into evaluation techniques includes how to
assess risk and uncertainty in creative designs. With the
inclusion of creativity in concept design comes the risk of
implementing concepts that are unknown or foreign to the
engineers (Yun-hong et al. 2007). By quantifying this risk at
the concept design stage, engineers are further aided in their
decision-making process, given the ability to eliminate the
designs that are measured to be too risky for the amount of
creativity it applies (Ionita et al. 2004; Mojtahedi et al. 2008).
By defining all risk in a product at the concept design stage,
designers can more effectively look past old designs and look
for new, improved ideas that optimize the level of risk and
innovation (Yun-hong et al. 2007).
Current research interests delve into quantifying crea-
tivity in the concept generation phase of engineering design
and determining how one can apply this concept to auto-
mated concept generation (Bohm et al. 2005). Ongoing
work at Oregon State University focuses on using a cyber-
based repository that aims to promote creativity in the early
stages of engineering design by sharing design aspects of
previous designs in an easily accessible repository. Various
tools within the repository guide the designers through the
design repository to generate solutions based on functional
analysis. The Design Repository can be accessed from
http://designengineeringlab.org/delabsite/repository.html.
By combining creativity and innovation risk measure-
ments with the conceptual design phase, engineers will be
given the opportunity to choose designs effectively that
satisfy customers by providing a creative product that is not
risky by their standards, and also satisfy conditions set
forth by engineering and customer requirements. This will
86 Res Eng Design (2013) 24:65–92
123

be particularly helpful when utilizing automated concept
generation tools (Bohm et al. 2005). Automated concept
generation tools create numerous designs for a given problem,
but leave the selection of possible and probable ideas to the
designers and engineers. Using creativity metrics in order to
narrow the selection space would allow for easier decisions
during the concept design phase of engineering.
Acknowledgments This research is supported through grant num-
ber CMMI-0928076 from the National Science Foundation’s Engi-
neering Design and Innovation Program. Any opinions or findings of
this work are the responsibility of the authors and do not necessarily
reflect the views of the sponsors or collaborators. The authors would
like to thank Dr. David Ullman and Dr. Robert Stone for their help
and guidance in conducting the classroom experiments and the
members of the Complex Engineered Systems Laboratory (Josh
Wilcox, Douglas Van Bossuyt, David Jensen, and Brady Gilchrist) at
OSU for their insightful feedback on the paper.
Appendices
Appendix 1: Study two novelty criteria and types
Function Solution Number of
designs
Support overall
structure
(f5 = 0.15)
Plexiglass 2
Wood 2
Wood struts 3
Steel 3
Steel box 8
Peg board 1
K’nex 1
Steel struts 4
Round light steel 1
Round and square 1
Foam boards 2
Tube 1
Support inner
structure
(f5 = 0.04)
Parts 10
Wood struts 4
Wood and steel 3
Steel struts 6
K’nex 2
Foam board 1
Plexiglass 2
Tube 1
Order of sort
(f6 = 0.01)
P T G A 3
G P T A 1
T A P G 2
P G T A 1
G T P A 3
Function Solution Number of
designs
T G A P 4
T A G P 1
G T A P 2
T G P A 1
ALL 2
T P G A 3
P T A G 1
T P A G 1
P T A/G 2
T G A/P 2
Sort aluminum
(f1 = 0.2)
Leftover 8
Eddy current with magnet 2
Height sensitive pusher 2
Eddy current and punch 6
Eddy current and gravity 1
Height sensitive conveyor 2
Height sensitive hole 3
Metallic sensor 2
Height sensitive ramp 1
Weight sensitive ramp 1
Weight sensitive balance 1
Sort tin
(f2 = 0.2)
Motorized rotating magnets 17
Motorized magnet arm 5
Magnet sensor pusher 3
Swinging magnet 1
Magnet sensor 2
Motorized belt magnet 1
Sort plastic
(f3 = 0.2)
Leftover 6
Height sensitive pushers 10
Height sensitive gravity 5
Weight sensitive fan blower 4
Height sensitive ramp 1
Height sensitive conveyor 2
Height sensor 1
Sort glass
(f4 = 0.2)
Leftover 3
Weight sensitive trapdoor 21
Dimension sensitive
trapdoor
1
Weight sensor pusher 1
Weight sensor 1
Weight sensitive balance 1
Height sensitive pusher 1
Res Eng Design (2013) 24:65–92 87
123
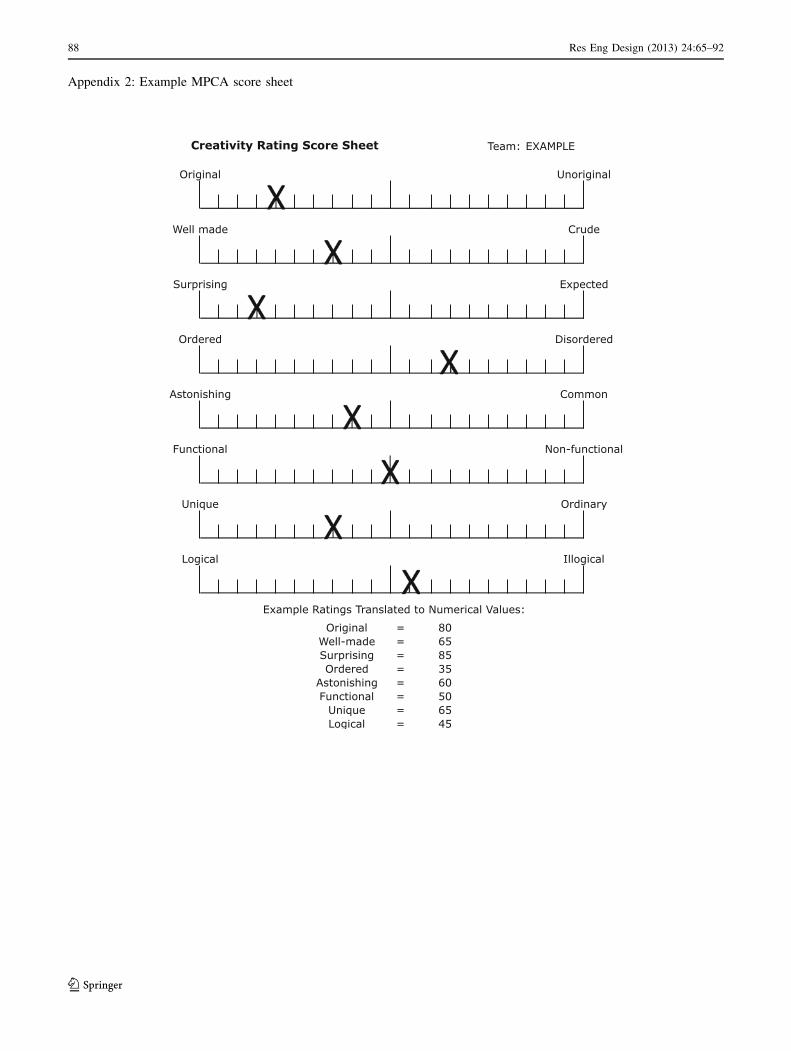
Appendix 2: Example MPCA score sheet
88 Res Eng Design (2013) 24:65–92
123

Appendix 3: MPCA pair-wise comparison example
References
Akin O, Akin C (1998) On the process of creativity in puzzles,
inventions, and designs. Automat Construct. Retrieved Novem-
ber 6, 2008, from http://www.andrew.cmu.edu/user/oa04/papers/
CreativDS.pdf
Amabile T (1982) Social psychology of creativity: a consensual
assessment technique. J Pers Soc Psychol 43(5):997–1013
ASME (2009) ASME student design competition. Retrieved February
12, 2011, from http://www.asme.org/Events/Contests/Design
Contest/2009_Student_Design_2.cfm
ASME (2010) ASME student design competition: earth saver.
Retrieved February 12, 2011, from http://www.asme.org/Events/
Contests/DesignContest/2010_Student_Design_2.cfm
ASME (2010) NASA TLX: Task Load Index. 2010, from http://
humansystems.arc.nasa.gov/groups/TLX/
Res Eng Design (2013) 24:65–92 89
123

Besemer S (1998) Creative product analysis matrix: testing the model
structure and a comparison among products—three novel chairs.
Creativ Res J 11(3):333–346
Besemer S (2008) ideaFusion. Retrieved 05/10/2009, 2009, from
http://ideafusion.biz/index.html
Besemer S, O’Quin K (1999) Confirming the three-factor creative
product analysis matrix model in an American sample. Creativ
Res J 12(4):287–296
Blosiu J (1999) Use of synectics as an idea seeding technique to
enhance design creativity. In: IEEE international conference on
systems, man, and cybernetics, Tokyo, Japan, pp 1001–1006
Bohm M, Vucovich J, et al (2005) Capturing creativity: using a
design repository to drive concept innovation. In: ASME 2005
design engineering technical conferences and computers and
information in engineering conference, Long Beach, CA
Brown DC (2008) Guiding computational design creativity research.
In: Proceedings of the international workshop on studying design
creativity, University of Provence, Aix-en-Provence
Buhl H (1960) Creative engineering design. Iowa State University
Press, Ames
Charyton C, Jagacinski R et al (2008) CEDA: a research instrument
for creative engineering design assessment. Psychol Aesthetics
Creativ Arts 2(3):147–154
Christensen B, Schunn C (2007) The relationship of analogical
distance to analogical function and preinventive structure: the
case of engineering design. Memory Cogn 35(1):29–38
Chulvi V, Mulet E et al (2011) Comparison of the degree of creativity
in the design outcomes using different design methods. J Eng
Des (iFirst: 1-29)
Chulvi V, Gonzalez-Cruz C et al (2012) Influence of the type of idea-
generation method on the creativity of solutions. Res Eng Des
(Online)
Clausing D, Fey V (2004) Effective innovation: the development of
winning technologies. Professional Engineering Publishing, New
York
Cooke M (2006) Design methodologies: toward a systematic
approach to design. In: Bennett A (ed) Design studies: theory
and research in graphic design. New York, Princeton Architec-
tural Press
Cropley A (2000) Defining and measuring creativity: are creativity
tests worth using? Roeper Rev 23(2):72–79
Cropley D, Cropley A (2005). Engineering creativity: a systems concept
of functional creativity. In: Kaufman J, Baer J (eds) Creativity across
domains. Lawrence Erlbaum Associates, London, pp 169–185
Cross N (2000) Engineering design methods: strategies for product
design. Wiley, Chichester
Csikszentmihalyi M (1996) Creativity: flow and the psychology of
discovery and invention. Harper Collins, New York
Demian P, Fruchter R (2005) An ethnographic study of design
knowledge reuse in the architecture, engineering, and construc-
tion industry. Res Eng Des 16:184–195
Elizondo L, Yang M et al (2010) Understanding innovation in student
design projects. In: ASME 2010 international design in engi-
neering technical conferences. Montreal, Quebec, Canada
Fogler HS, LeBlanc SE (1995) Strategies for creative problem
solving. Prentice Hall PTR, New Jersey
Gautam K (2001) Conceptual blockbusters: creative idea generation
techniques for health administrators. Hospital Topics Res
Perspect Healthcare 79(4):19–25
Genco N, Johnson D et al (2011) A study of the effectiveness of
empathic experience design as a creative technique. In: ASME
2011 international design engineering technical conferences &
computers and information in engineering conference, Wash-
ington, D.C., USA
Hey J, Linsey J et al (2008) Analogies and metaphors in creative
design. Int J Eng Educ 24(2):283–294
Hinrichs T (1992) Problem solving in open worlds: a case study in
design. Lawrence Erlbaum Associates, Hillsdale
Horn D, Salvendy G (2006) Consumer-based assessment of product
creativity: a review and reappraisal. Hum Factors Ergonom
Manufact 16(2):155–175
Horng JS, Lin L (2009) The development of a scale for evaluating
creative culinary products. Creativ Res J 21(1):54–63
Houtz J, Selby E et al (2003) Creativity styles and personality type.
Creativ Res J 15(4):321–330
Howard T, Culley A, et al (2008) Creative stimulation in conceptual
design: an analysis of industrial case studies. In: ASME 2008
international design engineering technical conferences, Brook-
lyn, NY, pp 1–9
Howard T, Dekoninck E et al (2010) The use of creative stimuli at
early stages of industrial product innovation. Res Eng Des
21:263–274
Huang GQ, Mak KL (1999) Web-based collaborative conceptual
design. J Eng Des 10(2):183–194
Ionita M, America P et al (2004) A scenario-driven approach for
value, risk and cost analysis in system architecting for innova-
tion. In: Fourth working IEEE/IFIP conference on software
architecture, Oslo, Norway
Jacobson C (1993) Cognitive styles of creativity. Psychol Rep
72(3):1131–1139
Jensen D, Weaver J et al (2009) Techniques to enhance concept
generation and develop creativity. In: ASEE annual conference,
Austin, TX, pp 1–25
Jones JC (1992) Design methods. Van Nostrand Reinhold, New York
Kaufman J, Baer J et al (2008) A comparison of expert and nonexpert
raters using the consensual assessment technique. Creativ Res J
20(2):171–178
Kowaltowski D, Bianchi G et al (2010) Methods that may stimulate
creativity and their use in architectural design education. Int J
Technol Des Educ 20:453–476
Kroll E, Condoor S et al (2001) Innovative conceptual design.
Cambridge University Press, Cambridge
Legardeur J, Boujut J et al (2009) Lessons learned from an empirical
study of the early design phases of an unfulfilled innovation. Res
Eng Des 21:249–262
Linsey J (2007) Design-by-analogy and representation in innovative
engineering concept generation. Ph.D Dissertation. University of
Texas at Austin, Austin
Linsey J, Green M et al (2005) Collaborating to success: an
experimental study of group idea generation techniques. In:
ASME 2005 international design engineering technical confer-
ences, Long Beach, CA, pp 1–14
Linsey J, Markman A et al (2008) Increasing innovation: presentation
and evaluation of the wordtree design-by-analogy method. In:
ASME 2008 international design engineering technical confer-
ences, Brooklyn, NY, pp 1–12
Linsey J, Wood K et al (2008) Wordtrees: a method for design-by-
analogy. In: ASEE annual conference & exposition, Pittsburgh,
PA
Liu H, Liu X (2005) A computational approach to stimulating
creativity in design. In: 9th international conference on computer
supported cooperative work in design, Coventry, UK, 344–354
Lopez-Mesa B, Thompson G (2006) On the significance of cognitive
style and the selection of appropriate design methods. J Eng Des
17(4):371–386
Lopez-Mesa B, Mulet E et al (2011) Effects of additional stimuli on
idea-finding in design teams. J Eng Des 22(1):31–54
Luburt T (2005) How can computers by partners in the creative
process: classification and commentary on the special issue. Int J
Hum Comput Stud 63:365–369
Mayeur A, Darses F et al (2008) Creative sketches production in
digital design: a user-centered evaluation of a 3D digital
90 Res Eng Design (2013) 24:65–92
123

environment. In: 9th international symposium on smart graphics,
Rennes, France, pp 82–93
McCaulley MH (2000) Myers-Briggs type indicator: a bridge between
counseling and consulting. Consult Psychol J Practice Res
52(2):117–132
Mojtahedi SM, Mousavi SM et al (2008) Risk identification and
analysis concurrently: group decision making approach. the
fourth international conference on management of innovation
and technology, Bangkok, Thailand
Montgomery D (2008) Design and analysis of experiments. Wiley,
Hoboken
Moskowitz H, Gofman A et al (2001) Rapid, inexpensive, actionable
concept generation and optimization: the use and promise of
self-authoring conjoint analysis for the food service industry.
Food Service Technol 1:149–167
Mulet E, Vidal R (2008) Heuristic guidelines to support conceptual
design. Res Eng Des 19:101–112
Myers IB, McCaulley MH (1985) Manual: a guide to the development
and use of the Myers-Briggs type indicator. Consulting
Psychologists Press, Palo Alto
Nelson BA, Wilson JO et al (2009) Redefining metrics for measuring
ideation effectiveness. Des Stud 30(6):737–743
Nix A, Stone R (2010) The search for innovative styles. In: ASME
2010 international design engineering technical conferences,
Montreal, Canada.
Nix A, Mullet K et al (2011) The search for innovation styles II.
Design Principles and Practices, Rome
Oman S, Tumer IY (2009) The potential of creativity metrics for
mechanical engineering concept design. In: International con-
ference on engineering design, ICED’09, Stanford, CA
Oman S, Tumer I (2010) Assessing creativity and innovation at the
concept generation stage in engineering design: a classroom
experiment. In: ASME 2010 international design engineering
technical conferences & computers and information in engi-
neering conference, Montreal, Quebec, Canada
O’Quin K, Besemer S (2006) Using the creative product semantic
scale as a metric for results-oriented business. Creativ Innovat
Manage 15(1):34–44
Otto K, Wood K (2001) Product design: techniques in reverse
engineering and new product development. Upper Saddle River,
Prentice Hall
Pahl G, Beitz W (1988) Engineering design: a systematic approach.
Springer, London
Pierce J, Pausch R (2007) Generating 3D interaction techniques by
identifying and breaking assumptions. Virtual Reality, pp 15–21
Pons D, Raine J (2005) Design mechanisms and constraints. Res Eng
Des 16:73–85
Pugh S (1996) Creating innovative products using total design.
Addison-Wesley Publishing Company, Reading
Ramsey F, Schafer D (2002) The statistical sleuth: a course in
methods of data analysis. Duxbury Press, Boston
Redelinghuys C (1997a) A model for the measurement of creativity,
Part I: relating expertise, quality and creative effort. Int J Eng
Educ 13(1):30–41
Redelinghuys C (1997b) A model for the measurement of creativity,
Part II: creative paths and case study. Int J Eng Educ
13(2):98–107
Reich Y, Hatchuel A et al (2010) A theoretical analysis of creativity
methods in engineering design: casting and improving ASIT
within C-K theory. J Eng Des (iFirst: 1-22)
Roozenburg NFM, Eekels J (1995) Product design: fundamentals and
methods. Wiley, New York
Sarkar P, Chakrabarti A (2008) The effect of representation of
triggers on design outcomes. Artif Intell Eng Des Anal Manuf
22(2):101–116
Saunders M, Seepersad C et al (2009) The characteristics of
innovative, mechanical products. In: ASME 2009 international
design engineering technical conferences & computers and
information in engineering conference, IDETC/CIE 2009, San
Diego, CA
Savransky S (2000) Engineering of creativity: introduction to TRIZ
methodology of inventive problem solving. CRC Press, Boca
Raton
Schmidt L, Vargas-Hernandez N et al (2010) Pilot of systematic
ideation study with lessons learned. In: ASME 2010 interna-
tional design engineering technical conferences & computers
and information in engineering conference, Montreal, Quebec,
Canada
Shah J (2007) Collaborative sketching (C-sketch). Cognitive Studies
of design ideation & creativity. Retrieved September 2009, from
http://asudesign.eas.asu.edu/projects/csketch.html
Shah J, Kulkarni S et al (2000) Evaluation of idea generation methods
for conceptual design: effectiveness metrics and design of
experiments. J Mech Des 122:377–384
Shah J, Smith S et al (2003) Empirical studies of design ideation:
alignment of design experiments with lab experiments. In:
ASME 2003 international conference on design theory and
methodology, Chicago, IL
Shah J, Vargas-Hernandez N et al (2003b) Metrics for measuring
ideation effectiveness. Des Stud 24:111–134
Shai O, Reich Y (2004) Infused design. I. Theory. Res Eng Des
15:93–107
Shulyak L (2008) Introduction to TRIZ. The Altshuller Institute for
TRIZ studies. Retrieved October 3, 2008, from http://www.
aitriz.org/articles/40p_triz.pdf
Song S, Agogino A (2004) Insights on designers’ sketching activities
in new product design teams. In: ASME 2004 international
design engineering technical conferences, Salt Lake City, UT,
pp 1–10
Sonnentag S, Frese M et al (1997) Use of design methods, team
leaders’ goal orientation, and team effectiveness: a follow-up
study in software development projects. Int J Hum Comput
Interact 9(4):443–454
Srivathsavai R, Genco N et al (2010) Study of existing metrics used in
measurement of ideation effectiveness. In: ASME 2010 interna-
tional design engineering technical conferences & computers
and information in engineering conference, Montreal, Quebec,
Canada
Sternberg R (1988) The nature of creativity: contemporary psycho-
logical perspectives. Cambridge University Press, New York
Taylor C (1988) Various approaches to and definitions of creativity.
In: Sternberg R (ed) The nature of creativity: contemporary
psychological perspectives. Cambridge University Press, New
York, pp 99–121
Torrance EP (1988) The nature of creativity as manifest in its testing.
In: Sternberg R (ed) The nature of creativity: contemporary
psychological perspectives. Cambridge University Press, New
York, pp 43–75
Torrance EP, Goff K (1989) A quiet revolution. J Creative Behav
23(2):136–145
Ullman D (2006) Making robust decisions. Trafford Publishing,
Victoria
Ullman D (2010) The mechanical design process. McGraw-Hill
Science/Engineering/Math, New York
Ulrich K, Eppinger S (2000) Product design and development.
McGraw-Hill, Boston
Van Der Lugt R (2000) Developing a graphic tool for creative
problem solving in design groups. Des Stud 21(5):505–522
VanGundy A (1988) Techniques of structured problem solving. Wan
Nostrand Reinhold Company, New York
Res Eng Design (2013) 24:65–92 91
123

Vidal R, Mulet E et al (2004) Effectiveness of the means of
expression in creative problem-solving in design groups. J Eng
Des 15(3):285–298
Yamamoto Y, Nakakoji K (2005) Interaction design of tools for
fostering creativity in the early stages of information design. Int J
Hum Comput Stud 63:513–535
Yun-hong H, Wen-bo L et al (2007) An early warning system for
technological innovation risk management using artificial neural
networks. In: International conference on management science &
engineering, Harbin, P.R.China
92 Res Eng Design (2013) 24:65–92
123