a comparison of gc-fid and ptr-ms toluene measurements in
TRANSCRIPT

Atmos. Meas. Tech., 3, 959–980, 2010www.atmos-meas-tech.net/3/959/2010/doi:10.5194/amt-3-959-2010© Author(s) 2010. CC Attribution 3.0 License.
AtmosphericMeasurement
Techniques
A comparison of GC-FID and PTR-MS toluene measurements inambient air under conditions of enhanced monoterpene loading
J. L. Ambrose1,2, K. Haase1,2, R. S. Russo2, Y. Zhou2, M. L. White 2,*, E. K. Frinak 2,** , C. Jordan2, H. R. Mayne1,R. Talbot2, and B. C. Sive2
1Department of Chemistry, University of New Hampshire, Durham, New Hampshire, USA2Climate Change Research Center, Institute for the Study of Earth Oceans and Space, University of New Hampshire, Durham,New Hampshire, USA* now at: Northern Essex Community College, Haverhill, Massachusetts, USA** now at: USMA Network Science Center, West Point, New York, USA
Received: 17 November 2009 – Published in Atmos. Meas. Tech. Discuss.: 6 January 2010Revised: 22 May 2010 – Accepted: 16 June 2010 – Published: 23 July 2010
Abstract. Toluene was measured using both a gas chro-matographic system (GC), with a flame ionization detec-tor (FID), and a proton transfer reaction-mass spectrome-ter (PTR-MS) at the AIRMAP atmospheric monitoring sta-tion Thompson Farm (THF) in rural Durham, NH during thesummer of 2004. Simultaneous measurements of monoter-penes, includingα- and β-pinene, camphene,13-carene,and d-limonene, by GC-FID demonstrated large enhance-ments in monoterpene mixing ratios relative to toluene, withmedian and maximum enhancement ratios of∼2 and∼30,respectively. A detailed comparison between the GC-FIDand PTR-MS toluene measurements was conducted to testthe specificity of PTR-MS for atmospheric toluene measure-ments under conditions often dominated by biogenic emis-sions. We derived quantitative estimates of potential interfer-ences in the PTR-MS toluene measurements related to sam-pling and analysis of monoterpenes, including fragmentationof the monoterpenes and some of their primary carbonyl ox-idation products via reactions with H3O+, O+
2 and NO+ inthe PTR-MS drift tube. The PTR-MS and GC-FID toluenemeasurements were in good quantitative agreement and thetwo systems tracked one another well from the instrumentallimits of detection to maximum mixing ratios of∼0.5 ppbv.A correlation plot of the PTR-MS versus GC-FID toluenemeasurements was described by the least squares regressionequationy=(1.13±0.02)x−(0.008±0.003) ppbv, suggestinga small∼13% positive bias in the PTR-MS measurements.The bias corresponded with a∼0.055 ppbv difference at thehighest measured toluene level. The two systems agreed
Correspondence to:J. L. Ambrose([email protected])
quantitatively within the combined 1σ measurement preci-sions for 60% of the measurements. Discrepancies in themeasured mixing ratios were not well correlated with en-hancements in the monoterpenes. Better quantitative agree-ment between the two systems was obtained by correctingthe PTR-MS measurements for contributions from monoter-pene fragmentation in the PTR-MS drift tube; however, theimprovement was minor (<10%). Interferences in the PTR-MS measurements from fragmentation of the monoterpeneoxidation products pinonaldehyde, caronaldehyde andα-pinene oxide were also likely negligible. A relatively largeand variable toluene background in the PTR-MS instrumentlikely drove the measurement bias; however, the precise con-tribution was difficult to accurately quantify and thus wasnot corrected for in this analysis. The results from THF sug-gest that toluene can be reliably quantified by PTR-MS us-ing our operating conditions (drift tube pressure, tempera-ture and voltage of 2.0 mbar, 45◦C and 600 V, respectively)under the ambient compositions probed. This work extendsthe range of field conditions under which PTR-MS validationstudies have been conducted.
1 Introduction
Proton transfer reaction-mass spectrometry (PTR-MS) wasrecently developed for on-line monitoring of atmosphericvolatile organic compounds (VOCs) (Hansel et al., 1995;Lindinger et al., 1998a). The method and its applicationsin atmospheric sciences were described in great detail in re-cent reviews (Hewitt et al., 2003; de Gouw and Warneke,2007; Blake et al., 2009). The principal advantages of PTR-
Published by Copernicus Publications on behalf of the European Geosciences Union.

960 J. L. Ambrose et al.: A comparison of GC-FID and PTR-MS toluene measurements in ambient air
MS are its capabilities for sensitive, high frequency measure-ments in real time. A disadvantage is that the method doesnot distinguish between isomeric/isobaric compounds; fur-thermore, ion fragmentation, clustering and secondary ion-molecule reactions in the drift tube can interfere in the mea-surement of some compounds under certain conditions (deGouw and Warneke, 2007). Considerable effort has beenmade to characterize the performance of PTR-MS for quan-tification of atmospheric VOCs, demonstrating it to be a valu-able analytical method for that purpose (Warneke et al., 2001,2003; de Gouw et al., 2003a, b; de Gouw and Warneke,2007). Still, the compositional diversity of the atmosphereand widespread deployment of PTR-MS for trace gas moni-toring requires continued validation work be carried out, andatmospheric environments remain for which PTR-MS val-idation studies are lacking (de Gouw and Warneke, 2007).In particular, validation work has not been carried out inforested environments where the VOC spectrum is expectedto be dominated by biogenic compounds. The present workis aimed toward the validation of PTR-MS toluene measure-ments based on ambient trace gas measurements at a forestedsite in New England.
Toluene is a ubiquitous component of atmospheric volatileorganic compound loading. Atmospheric toluene measure-ments have been used to probe several important issues inatmospheric sciences including photochemical aging of pol-lutants (Roberts et al., 1984; Parrish et al., 2007; Warnekeet al., 2007) and emissions inventory testing (Warneke etal., 2007; Karl et al., 2009). Additionally, several studiesdemonstrated that toluene may contribute to secondary or-ganic aerosol formation in certain environments (e.g., Hurleyet al., 2001).
Toluene is a significant component of fossil fuel andbiomass combustion emissions (Andreae and Merlet, 2001;Schauer et al., 2002). It is also released to the atmospherevia fossil fuel and industrial solvents evaporation (Singh andZimmerman, 1992; White et al., 2009). Although biogenictoluene emissions have not been widely observed (Helmig etal., 1998), a recent report demonstrated that toluene may bedirectly emitted from some plant species (White et al., 2009),as was suggested by observations from two previous studies(Heiden et al., 1999; Holzinger et al., 2000).
In the analysis of VOCs in ambient air by PTR-MS,toluene is quantified from its protonated molecular ion(C7H+
9 ) with a mass to charge ratio (m/z) of 93. Previ-ous field studies conducted under conditions dominated byanthropogenic emissions generally showed good quantita-tive agreement between toluene measurements made both byPTR-MS and GC techniques (Warneke et al., 2001, 2003;de Gouw et al., 2003a; Kuster et al., 2004; Rogers et al.,2006). An analysis of toluene measurements made by PTR-MS and GC-MS in the New England coastal marine bound-ary layer, downwind of monoterpene source regions, foundno evidence for interference of monoterpenes in the PTR-MStoluene measurements (de Gouw et al., 2003a).
However, laboratory investigations pertinent to PTR-MSmeasurements of monoterpenes (C10H16), which have pri-marily biogenic sources (Geron et al., 2000), demonstratedthat samples of several common monoterpenes and their ox-idation products may, under certain conditions, yieldm/z=93ion fragments via reactions with H3O+, O+
2 and NO+ inthe PTR-MS drift tube (Schoon et al., 2003, 2004; Tani etal., 2003, 2004; Warneke et al., 2003; Lee et al., 2006a,b; Maleknia et al., 2007). Stronger correlations betweenmonoterpenes and the PTR-MSm/z=93 signal were ob-served in a laboratory investigation of VOC emissions fromMediterranean holm oak (Holzinger et al., 2000) and in a bo-real forest environment (Rinne et al., 2005), although theirorigins could not be identified unambiguously. It was shownthat them/z=93 signal measured from holm oak could be at-tributed top-cymene (C10H14), a biogenic VOC related tothe monoterpenes (Tani et al., 2003). To date, no analysisof field data has been dedicated to quantification of poten-tial interferences in PTR-MS toluene measurements relatedto sampling of monoterpenes.
The present investigation used ambient measurementsmade at a forested site in New England under conditionsof enhanced monoterpene loading to quantify potential inter-ferences in PTR-MS toluene measurements associated withsampling of monoterpenes and their oxidation products. De-tails of the measurement site, the analytical systems usedand the data analysis methods are given in Sect. 2. Mea-surements of monoterpenes by GC-FID and toluene by GC-FID and PTR-MS are presented in Sect. 3, together with aquantitative analysis of potential interferences in the PTR-MS toluene measurements. The major findings are summa-rized in Sect. 4.
2 Methods
2.1 Experimental
Measurements reported in this work were made in Durham,NH at the University of New Hampshire AIRMAP atmo-spheric monitoring network site Thompson Farm (THF) (Tal-bot et al., 2005) between 24 July and 15 August 2004, dur-ing the International Consortium for Atmospheric Researchon Transport and Transformation (ICARTT) field campaign.The THF site (43.11◦ N, 70.95◦ W, 24 m elevation above sealevel) is 24 km from the Gulf of Maine on an active cornfarm, seasonally planted with alfalfa; it is surrounded bymixed hardwood/pine forest (Ollinger et al., 1998; Justice etal., 2002). Ambient air was drawn at∼1500 standard litersper minute through a PFA Teflon-lined aluminum manifoldfrom the top of a 15 m tower using a Gast R5-Series regener-ative blower (Gast Manufacturing, Inc., Benton Harbor, MI).Sub-samples were directed to a suite of trace gas analyzershoused at the base of the tower.
Atmos. Meas. Tech., 3, 959–980, 2010 www.atmos-meas-tech.net/3/959/2010/

J. L. Ambrose et al.: A comparison of GC-FID and PTR-MS toluene measurements in ambient air 961
Table 1. Operational and quality parameters for analytical systems operated at THF during summer 2004 and from which measurementswere used in this work.
Sample cycle period Integration timeVariables measured Analytical Scheme LOD or range Precision Accuracy
Chemical variables
Toluene GC-FID ∼40 min ∼6 min 0.005 ppbv ±5% ±5%a
Monoterpenesb 0.010 ppbv ±5% ±5%a
Toluene PTR-MS ∼8 min 20 s 0.015 ppbv ±5%c±15%d
O3 UV absorbancee 1 min 1 min 1 ppbv ±1%
NO O3 chemiluminescence 1 min 1 min 0.060 ppbv <±17%
Meteorological variables
Pressure Manometer 1 min 1 min 500 to 1100 mbar±0.03 mbar ±0.08 mbar
Temperature Thermistor 1 min 1 min −40 to 60◦C ±0.1◦C ±0.2◦C
Relative Humidity Thin film capacitor 1 min 1 min 0 to 100% ±0.3% ±2 to±3%
Wind speed Anemometer 1 min 1 min 0 to 75 m s−1f±1% or±0.07 m s−1
Other
J (NO2) Filter radiometer 1 min 1 min 1×10⁻⁶ s−1
a For standard mixing ratio.b Quality parameters derived from analysis ofn-decane standard.c For calibration factor (CTol) determination;measurement precision was estimated from counting statistics as described previously (Hayward et al., 2002; de Gouw et al., 2003a) and was≥10%.d Based on least squares linear regression against GC-FID toluene measurements.e 254 nm.f Threshold=0.45 m s−1.
This work focuses on toluene measurements made us-ing a GC system and a PTR-MS and monoterpene mea-surements made using the GC system. Ancillary measure-ments included nitric oxide (NO) by chemiluminescence(model 42CTL, Thermo Environmental Instruments, Inc,Franklin, MA), ozone (O3) by UV photometer (model 49C-PS, Thermo Environmental), nitrogen dioxide photolysis fre-quency (J (NO2)) by filter radiometer (Metcon, Inc., Boul-der, CO), and meteorological parameters, measured by asuite of Qualimetrics sensors (Qualimetrics, Inc., now AllWeather, Inc., Sacramento, CA), including temperature bythermistor (model 5190C), pressure by capacitance manome-ter (model 7190), relative humidity (RH) by thin film capac-itor (model 5190C), and wind speed by anemometer (model2031). Selected operational parameters for each of the abovemeasurement systems are given in Table 1. The GC sys-tem (Zhou et al., 2005) and the operational parameters of thePTR-MS were described in previous publications (Talbot etal., 2005; Ambrose et al., 2007). Specific details pertainingto the measurements in this work are described here.
The GC sample acquisition/injection system was a modi-fied, liquid N2 cooled, Entech sample concentrator (EntechInstruments, Inc., Simi Valley, CA). Samples (1200 cm3)
were drawn at∼200 cm3 min−1 via a downstream pump andmass flow controller (Unit Instruments, Inc., Yorba Linda,CA) through two 20 cm× 0.3175 cm Silonite-coated stain-less steel loops (Entech). The first loop was cooled to−20◦C
for sample dehumidification; the second loop was packedwith 60/80 mesh glass beads (Ohio Valley Specialty Com-pany, Marietta, OH) and cooled to−185◦C for analyte en-richment. After sample trapping, the loops were flushed with100 cm3 of ultra high purity (UHP) He (Maine Oxy, Auburn,Maine) at 100 cm3 min−1 to reduce O3-alkene reactions dur-ing heating (Sive et al., 2005). Numerous experiments havebeen conducted in our laboratory, as well as others (E. Apel,NCAR and D. Riemer, University of Miami, personal com-munication, 2003), which demonstrate that this is a reliableway to quench O3-alkene reactions for this type of system.To ensure there were no trace contaminants in the UHP Heflow stream, it was first passed through a1/4 in (6.35 mm)× 20 ft (6.10 m) activated charcoal/molecular sieve (13X)trap (60/80 mesh) and then through a Valco heated getterhelium purifier (model HP2, Valco Instruments Company,Inc., Houston, TX). The sample enrichment loop was re-sistively heated to 100◦C in ∼10 s and the sample was in-jected in UHP He carrier (Maine Oxy, Auburn, ME), viaan 8-port switching valve (SV) (Valco), into a Shimadzu17A GC (Shimadzu Corporation, Columbia, MD), where thesample was split to four separate capillary columns. Non-methane hydrocarbons (NMHCs) (C6-C11) were separatedon a 60 m× 0.32 mm I.D., 1.0µm film thickness VF-5mscolumn (Varian, Inc., Walnut Creek, CA) and measured witha flame ionization detector (FID). Following injection, thesample dehumidification and enrichment loops were both
www.atmos-meas-tech.net/3/959/2010/ Atmos. Meas. Tech., 3, 959–980, 2010

962 J. L. Ambrose et al.: A comparison of GC-FID and PTR-MS toluene measurements in ambient air
heated and back-flushed with UHP He for 5 min at 100◦Cto clean the loops in preparation for the next sample. Thesample cycle time was∼42 min with a∼6 min acquisitiontime. A 1200 cm3 aliquot of one of two different wholeair standards was analyzed every tenth sample for quantifi-cation of target compounds and to monitor system perfor-mance. The toluene mixing ratios in the whole air stan-dards were 1.215 and 0.101 ppbv (±5%). The precisions ofthe standard peak area measurements were±4% and±5%,respectively. In this work the averagen-decane responsefactor (RF), (14.2±0.9)×103 ppbv−1(1σ ; n=40), measuredfrom assays of the 1.215 ppbv whole air standard was usedfor quantification of monoterpenes in ambient samples:
RFdecane=Adecane
MRdecane. (1)
In Eq. (1)Adecaneis the decane chromatographic peak areadetermined from analysis of the whole air standard contain-ing a known decane mixing ratio, MRdecane. Although sev-eral of the measured monoterpenes were contained in oneof the whole air standards their mixing ratios were observedto decrease over time. The monoterpenes are highly reac-tive and were previously shown to exhibit loss in gas stan-dards (Sive, 1998). In the course of calibration experimentswith the THF GC system, various classes of hydrocarbonswithin each carbon number grouping were analyzed and allyielded the same per-carbon response (Table S1). For ex-ample, the toluene per-carbon response was the same asfor n-heptane and other C7 compounds and the individualmonoterpene per-carbon response was also the same as forn-decane (Tables S1, S2). This validated the use of a singleresponse factor for each group of compounds (e.g., C10), in-dependent of the type of NMHC (e.g., linear alkane, cyclicalkene). Furthermore, two of the gravimetric high-pressuresynthetic blends from Apel-Reimer Environmental, Inc. usedfor the PTR-MS calibrations (see below) were quantitativelyassayed and compared with the whole air standards used forthe THF GC system (Table S2). The high-pressure syntheticstandards were diluted to atmospheric mixing ratios (ppbvto pptv levels) with catalytic converter-prepared zero air ad-justed to maintain the humidity of the sampled air. The re-sponse factors measured for the whole air and synthetic stan-dards agreed quantitatively. (Please see Russo et al., 2010for additional discussion of our routine GC system calibra-tion procedures and results.)
The PTR-MS (Ionicon Analytik GmbH, Innsbruck, Aus-tria) was operated with a drift tube pressure and temperatureof 2.0 mbar and 45◦C, respectively, and a potential of 600 Vapplied over the length (9.6 cm) of the drift tube. A seriesof 30 masses was monitored continuously; six masses weremonitored for diagnostic purposes while the remaining 24masses corresponded to the VOCs of interest (Table S3). Thedwell time for each of the 24 masses was 20 s, yielding a totalmeasurement cycle of∼8 min. The system was zeroed every2.5 h for 4 cycles by diverting the flow of ambient air through
a heated catalytic converter (0.5% Pd on alumina at 450◦C)to oxidize the VOCs and determine system background sig-nals. Calibrations for the PTR-MS system were conductedusing three different high-pressure cylinders containing syn-thetic blends of selected NMHCs and oxygenated volatile or-ganic compounds (OVOCs) at the ppbv level (Apel-ReimerEnvironmental, Inc., Broomfield, CO). Each of the cylindersused in the calibrations had an absolute accuracy of< ±5%for all gases. Using methods similar to those described pre-viously (Apel et al., 1998, 2003), standards were diluted toatmospheric mixing ratios (ppbv to pptv levels) with catalyticconverter-prepared zero air adjusted to maintain the humidityof the sampled air. Calibrations were conducted periodicallyto monitor PTR-MS performance and quantify the mixingratios of target gases. Mixing ratios for each gas were cal-culated by using the normalized counts per second whichwere obtained by subtracting out the non-zero backgroundsignal for each compound. The PTR-MS precision was es-timated from counting statistics as described by Hayward etal. (2002) and de Gouw et al. (2003a). For the measurementspresented below the normalized sensitivity to toluene was15.8 ncps ppbv−1. The background ion current form/z=93,which was relatively large and variable during the ICARTTcampaign period, ranged from 1.2 to 4.1 cps, with an aver-age value of 2.3±0.6 cps. The average value of the H3O+
ion current was (2.8±0.2)×106 cps, as calculated from themeasured H18
3 O+ (m/z=21) ion current and tabulated isotopicabundances (de Bievre and Taylor, 1993). The ratio of theH3O+(H2O) ion current to that of H3O+ was on average10±2% and ranged from 6–15%.
2.2 Calculations
The PTR-MS and GC-FID measurements were merged to theGC system time stamp. Only samples for which the GC-FID sample trapping interval and the PTR-MS sample cy-cle overlapped were included. The merged data were usedto estimate the potential contribution of monoterpene frag-mentation in the PTR-MS drift tube to the PTR-MS signal atm/z=93 (nominally toluene).
The reaction of toluene (Tol) with H3O+ in the PTR-MSdrift tube to produce the protonated molecular ion, (Tol+H)+,atm/z=93 (m93) is described by Reaction (R1),
Tol+H3O+kTol+H3O+
−−−−−−→m93+H2O, (R1)
wherekTol+H3O+ is the rate constant for the reaction. Sim-ilarly, the reaction of compoundj with H3O+ can be writtenas in Reaction (R2):
j +H3O+kj+H3O+
−−−−−→ (j +H)+ +H2O. (R2)
For some atmospheric VOCs, including monoterpenes, theprotonated molecular ion formed via Reaction (R2) will frag-ment to lowerm/zproduct ions under certain PTR-MS oper-ating conditions. The production ofm/z=93 fragment ions
Atmos. Meas. Tech., 3, 959–980, 2010 www.atmos-meas-tech.net/3/959/2010/

J. L. Ambrose et al.: A comparison of GC-FID and PTR-MS toluene measurements in ambient air 963
from reaction of compoundj with H3O+ can be written asin Reaction (R3),
j +H3O+φ(93)j ·kj+H3O+
−−−−−−−−−→m93, (R3)
whereφ(93)j is them93 yield resulting from ionization ofcompoundj . Therefore, the total rate of change of the con-centration ofm/z=93 ions in the PTR-MS drift tube directlyresulting from reaction of H3O+ with toluene and fragmen-tation of other compoundsj is given by Eq. (2):
d[m93]
dt= kTol+H3O+ · [Tol] · [H3O+
]
+
∑j
kj+H3O+ ·φ(93)j · [j ] · [H3O+]. (2)
The rate constant for reaction of compoundj with H3O+
and the concentration ofj can be expressed as fractions ofthe corresponding rate constant for toluene and the tolueneconcentration, respectively:
kj+H3O+ = fkj·kTol+H3O+ , (3)
[j ] = fj · [Tol]. (4)
Combining Eqs. (3) and (4) with Eq. (2) gives Eq. (5):
d[m93]
dt= kTol+H3O+ · [Tol] · [H3O+
]
·
{1+
∑j
φ(93)j ·fkj·fj
}= kTol+H3O+ · [Tol]
·[H3O+] · {1+F } (5)
Integration of Eq. (5) over the time interval required for ionsto traverse the drift tube,1t , gives Eq. (6):
[m93] = kTol+H3O+ · [Tol] · [H3O+] · {1+F } ·1t. (6)
If there are no other compounds present which fragment tom/z=93, all the values ofφ(93) are zero,F=0, and Eq. (6)reduces to the standard expression for integrated signal inPTR-MS (Lindinger et al., 1998a). The toluene volume mix-ing ratio, VMR(m93) (hereinafter referred to simply as thetoluene mixing ratio), is quantified based on the ratio of thebackground-corrected ion current (counts per second, cps) atm/z=93,Im93c, to the normalized ion current (ncps) for H3O+
as shown in Eq. (7),
VMR(m93)=Im93r−Im93b(IH3O+
106
)·CTol
=Im93c(
IH3O+
106
)·CTol
, (7)
whereIm93r andIm93b are the raw and backgroundm/z=93ion currents, respectively, andCTol denotes the calibrationfactor (sensitivity) for toluene, typically expressed in units of
ncps ppbv−1. Because the H3O+(H2O) ion current was lowand did not depend on ambient RH, we did not include a termfor the water cluster ion current in Eq. (7) as may be neces-sary under different operating conditions (c.f., de Gouw andWarneke, 2007). In this work the calibration factor was de-termined from assays of standard gas cylinders as describedin Sect. 2.1. Alternatively, the calibration factor can be deter-mined from the instrument operating parameters, measuredion transmission efficiencies,Tr, and published values ofkTol+H3O+ and H3O+ ion mobility, µ, as described previ-ously (de Gouw and Warneke, 2007). The measuredm/z=93ion current is related to the concentration at the end of thedrift tube as shown in Eq. (8) (de Gouw and Warneke, 2007):
Im93c
IH3O+
=[m93]
[H3O+]·
T rm93
T rH3O+
, (8)
where here the expression is given in terms of thebackground-correctedm/z=93 ion current. In ambient airsamples with contributions to [m93] from j as describedabove the true toluene mixing ratio, VMR(m93)t, and the ap-parent measured toluene mixing ratio, VMR(m93)m, can bedefined as shown in Eq. (9), which follows from Eqs. (6–8):
VMR(m93)t=VMR(m93)m ·1
{1+F }. (9)
As expected, Eq. (9) shows that the value of VMR(m93)t willalways be smaller than that of VMR(m93)m in the presenceof monoterpenes that fragment to ion products atm/z=93(i.e., F >0). Similar to Eq. (9) corrections can be made for(1) production of ion products atm/z=93 from reactions ofmonoterpenes with O+2 and NO+ in the PTR-MS drift tubeand (2) fragmentation of monoterpene oxidation products. Itshould be noted that O+2 and NO+ ionize by charge trans-fer rather than by proton transfer as for H3O+. To accountfor reactions of O+2 and NO+ with j , additional terms thatrepresent abundances of O+
2 and NO+ relative to H3O+ inthe PTR-MS drift tube are included inF (Eq. 5). Values ofF were calculated using monoterpene measurements by GC-FID (Sect. 3.1), as well as published proton and charge trans-fer rate constants and ion fragmentation yields (Sect. 3.3).
3 Results and discussion
3.1 Monoterpene distributions
Here we present GC-FID measurements of monoterpenesat THF during summer 2004. In the discussion that fol-lows monoterpenes include C10H16 hydrocarbons as wellas p-cymene (C10H14), which is a related biogenic hy-drocarbon (Geron et al., 2000). The monoterpene com-position of plant species in the northeastern United Stateswas previously shown to consist mostly ofα-pinene,13-carene,β-pinene, d-limonene, sabinene,β-phellandrene,
www.atmos-meas-tech.net/3/959/2010/ Atmos. Meas. Tech., 3, 959–980, 2010
964 J. L. Ambrose et al.: A comparison of GC-FID and PTR-MS toluene measurements in ambient air
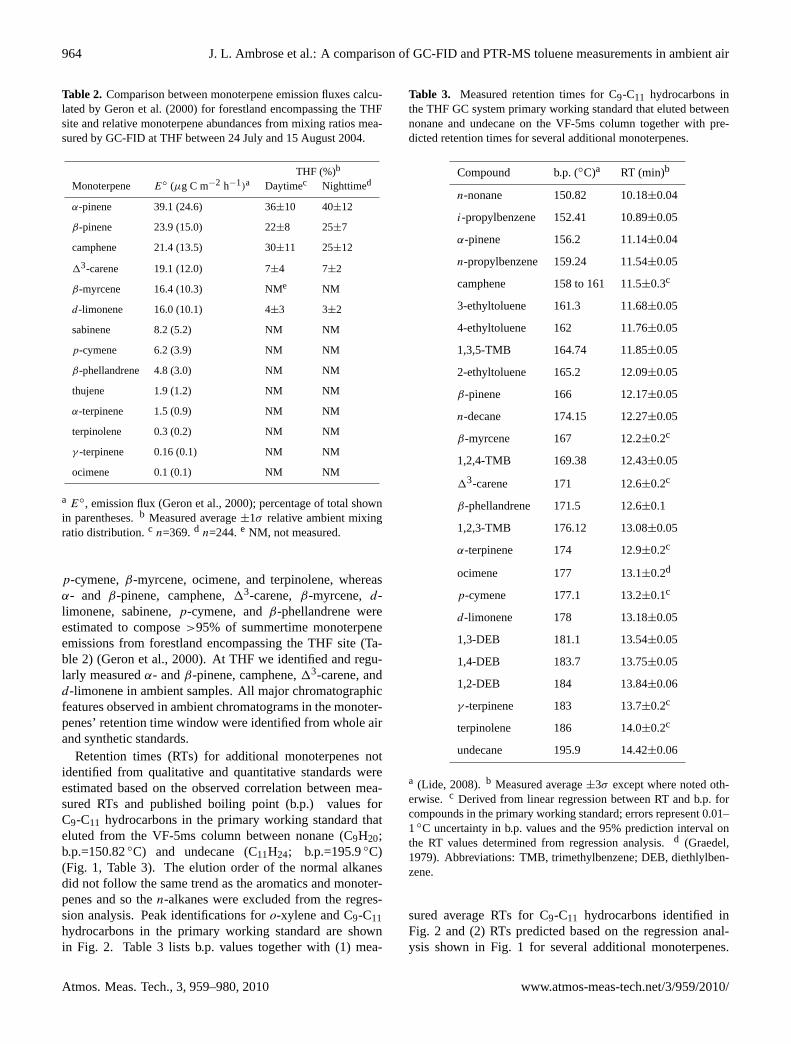
Table 2. Comparison between monoterpene emission fluxes calcu-lated by Geron et al. (2000) for forestland encompassing the THFsite and relative monoterpene abundances from mixing ratios mea-sured by GC-FID at THF between 24 July and 15 August 2004.
THF (%)b
Monoterpene E◦ (µg C m−2 h−1)a Daytimec Nighttimed
α-pinene 39.1 (24.6) 36±10 40±12
β-pinene 23.9 (15.0) 22±8 25±7
camphene 21.4 (13.5) 30±11 25±12
13-carene 19.1 (12.0) 7±4 7±2
β-myrcene 16.4 (10.3) NMe NM
d-limonene 16.0 (10.1) 4±3 3±2
sabinene 8.2 (5.2) NM NM
p-cymene 6.2 (3.9) NM NM
β-phellandrene 4.8 (3.0) NM NM
thujene 1.9 (1.2) NM NM
α-terpinene 1.5 (0.9) NM NM
terpinolene 0.3 (0.2) NM NM
γ -terpinene 0.16 (0.1) NM NM
ocimene 0.1 (0.1) NM NM
a E◦, emission flux (Geron et al., 2000); percentage of total shownin parentheses.b Measured average±1σ relative ambient mixingratio distribution.c n=369.d n=244.e NM, not measured.
p-cymene,β-myrcene, ocimene, and terpinolene, whereasα- and β-pinene, camphene,13-carene,β-myrcene, d-limonene, sabinene,p-cymene, andβ-phellandrene wereestimated to compose>95% of summertime monoterpeneemissions from forestland encompassing the THF site (Ta-ble 2) (Geron et al., 2000). At THF we identified and regu-larly measuredα- andβ-pinene, camphene,13-carene, andd-limonene in ambient samples. All major chromatographicfeatures observed in ambient chromatograms in the monoter-penes’ retention time window were identified from whole airand synthetic standards.
Retention times (RTs) for additional monoterpenes notidentified from qualitative and quantitative standards wereestimated based on the observed correlation between mea-sured RTs and published boiling point (b.p.) values forC9-C11 hydrocarbons in the primary working standard thateluted from the VF-5ms column between nonane (C9H20;b.p.=150.82◦C) and undecane (C11H24; b.p.=195.9◦C)(Fig. 1, Table 3). The elution order of the normal alkanesdid not follow the same trend as the aromatics and monoter-penes and so then-alkanes were excluded from the regres-sion analysis. Peak identifications foro-xylene and C9-C11hydrocarbons in the primary working standard are shownin Fig. 2. Table 3 lists b.p. values together with (1) mea-
Table 3. Measured retention times for C9-C11 hydrocarbons inthe THF GC system primary working standard that eluted betweennonane and undecane on the VF-5ms column together with pre-dicted retention times for several additional monoterpenes.
Compound b.p. (◦C)a RT (min)b
n-nonane 150.82 10.18±0.04
i-propylbenzene 152.41 10.89±0.05
α-pinene 156.2 11.14±0.04
n-propylbenzene 159.24 11.54±0.05
camphene 158 to 161 11.5±0.3c
3-ethyltoluene 161.3 11.68±0.05
4-ethyltoluene 162 11.76±0.05
1,3,5-TMB 164.74 11.85±0.05
2-ethyltoluene 165.2 12.09±0.05
β-pinene 166 12.17±0.05
n-decane 174.15 12.27±0.05
β-myrcene 167 12.2±0.2c
1,2,4-TMB 169.38 12.43±0.05
13-carene 171 12.6±0.2c
β-phellandrene 171.5 12.6±0.1
1,2,3-TMB 176.12 13.08±0.05
α-terpinene 174 12.9±0.2c
ocimene 177 13.1±0.2d
p-cymene 177.1 13.2±0.1c
d-limonene 178 13.18±0.05
1,3-DEB 181.1 13.54±0.05
1,4-DEB 183.7 13.75±0.05
1,2-DEB 184 13.84±0.06
γ -terpinene 183 13.7±0.2c
terpinolene 186 14.0±0.2c
undecane 195.9 14.42±0.06
a (Lide, 2008).b Measured average±3σ except where noted oth-erwise. c Derived from linear regression between RT and b.p. forcompounds in the primary working standard; errors represent 0.01–1◦C uncertainty in b.p. values and the 95% prediction interval onthe RT values determined from regression analysis.d (Graedel,1979). Abbreviations: TMB, trimethylbenzene; DEB, diethlylben-zene.
sured average RTs for C9-C11 hydrocarbons identified inFig. 2 and (2) RTs predicted based on the regression anal-ysis shown in Fig. 1 for several additional monoterpenes.
Atmos. Meas. Tech., 3, 959–980, 2010 www.atmos-meas-tech.net/3/959/2010/

J. L. Ambrose et al.: A comparison of GC-FID and PTR-MS toluene measurements in ambient air 965
For comparison, the regression analysis shown in Fig. 1 pre-dicted RTs for camphene and13-carene of 11.5±0.3 minand 12.6±0.2 min (Table 3), whereas the values measuredfrom a multi-component synthetic standard were∼11.6 minand∼12.8 min, respectively. The agreement between pre-dicted and measured RTs indicated that the RT versus b.p. re-lationship determined for C9-C11 hydrocarbons in the pri-mary working standard was a good predictor of RTs formonoterpenes when measured values were not available.
Figure 3 shows an example chromatogram from thenight of 2 August, when significantly elevated monoter-pene mixing ratios were measured. The unidentified peakat ∼13.3 min, labeled “UnID”, was within the estimatedRT windows for ocimene andp-cymene (Table 3), whichwere not identified from qualitative and quantitative stan-dards. The area of the unidentified peak was strongly cor-related with those of the other major monoterpenes, as il-lustrated in Fig. 4; however, it typically represented a minorfraction of the total monoterpene mixing ratio. Other mi-nor features that could be attributed toβ-phellandrene,α-terpinene,γ -terpinene, and terpinolene were also observedwhile the monoterpene mixing ratio was elevated; how-ever, the corresponding mixing ratios, estimated using then-decane RF, were typically below the instrumental limit ofdetection (LOD) for the monoterpenes (0.010 ppbv). Due totheir apparent low abundance monoterpenes other than thosemeasured (Table 2) were not considered in the followinganalysis.
A time series of the monoterpene mixing ratios measuredbetween 24 July, 22:00 LT and 15 August, 06:00 LT ispresented in Fig. 5. Measurements ofJ (NO2), expressedas 10 min average values normalized to the summertime(June to August) maximum, 7.9×10⁻³ s−1, reflect relativesolar irradiance intensity and delineate daytime and night-time periods. The highest monoterpene mixing ratios weremeasured during the nighttime hours under calm conditions(wind speed<0.5 m s−1) and with more humidity (Geronet al., 2000). Previous work demonstrated that the noctur-nal boundary layer in the region encompassing the THF sitecan lead to nighttime surface enhancements in trace gaseswith local emissions sources (Talbot et al., 2005; White etal., 2008), which likely contributed significantly to the night-time monoterpene maxima. The observed daytime minimain the monoterpene mixing ratios were likely driven by theincreased height of the boundary layer as well as greater ox-idation by hydroxyl radical (OH) and O3 during the daytimedespite higher monoterpene emissions during the day owingto warmer temperature (Guenther et al., 1993).
Table 2 compares summertime monoterpene fluxes esti-mated by Geron et al. (2000) for forestland encompassing theTHF site and average relative ambient monoterpene distribu-tions for summer 2004 based on data shown in Fig. 5. Theflux estimates were derived from regional tree species dis-tributions, monoterpene composition and emissions at 30◦C(Geron et al., 2000). The estimated flux distribution and mea-
sured mixing ratio distributions were in partial quantitativeagreement for the dominant monoterpenes, except a greaterabundance of camphene thanβ-pinene was measured, andβ-myrcene was not measured. The daytime and nighttimemixing ratio distributions were in close agreement despitelarge diurnal differences in the absolute mixing ratios. Thisis consistent with boundary layer dynamics being a signif-icant factor governing monoterpene abundances at THF aswas observed previously in a different forested environment(Roberts et al., 1985).
Based on data collected between 1990 and 1999, landcover in Strafford County, where the THF site is situated,consisted mostly of mixed forestland (∼57% of forestland)and deciduous tree species (∼30% of forestland) (Justice etal., 2002). For such land cover monoterpene compositionand emissions data were relatively scarce when the regionalmonoterpenes flux estimates shown in Table 2 were compiled(Geron et al., 2000). Thus, it is conceivable that local pat-terns of tree species distribution and monoterpene emissionscontributed to the differences between the emissions andmixing ratio distributions in Table 2. The monoterpenes reactrapidly with OH, O3 and the nitrate radical (NO3) (Atkinson,1994; Atkinson and Arey, 2003), and monoterpene oxida-tion between emission and sampling likely contributed to themeasured monoterpene distribution at THF. The lifetime ofβ-myrcene with respect to reaction with O3 is much shorterthan for the monoterpenes measured at THF (Atkinson andArey, 2003), which might partially explain whyβ-myrcenewas not measured in ambient air at THF, despite the rela-tively high β-myrcene emissions flux predicted for the THFregion (Geron et al., 2000).
3.2 GC-FID/PTR-MS toluene field comparison
Several laboratory and field comparisons between PTR-MSand GC-based toluene measurements were conducted pre-viously, with most studies demonstrating good quantita-tive agreement between PTR-MS and the more establishedchromatography-based measurement techniques. These in-clude comparison of PTR-MS with (1) GC-FID (offline)at a suburban site in the Netherlands during March 2000(Warneke et al., 2001); (2) GC-MS, with ion trap andquadrupole MS, at a suburban site in Houston, TX duringAugust and September 2000 (Kuster et al., 2004); (3) GC-MS aboard a research ship in the New England coastal ma-rine boundary layer (CMBL) during July and August 2002(de Gouw et al., 2003a); (4) GC-FID at a suburban site inTokyo, Japan during November 2002 (Kato et al., 2004); (5)GC-FID (offline) at a laboratory biomass combustion facility(Christian et al., 2004); (6) GC-FID (offline) in the MexicoCity metropolitan area during April and May 2003 (Rogerset al., 2006); (7) GC-FID (offline) aboard a research aircraftover New England and eastern Canada during July 2004 (deGouw et al., 2006); and (8) GC-MS and GC-FID (offline)
www.atmos-meas-tech.net/3/959/2010/ Atmos. Meas. Tech., 3, 959–980, 2010
966 J. L. Ambrose et al.: A comparison of GC-FID and PTR-MS toluene measurements in ambient air
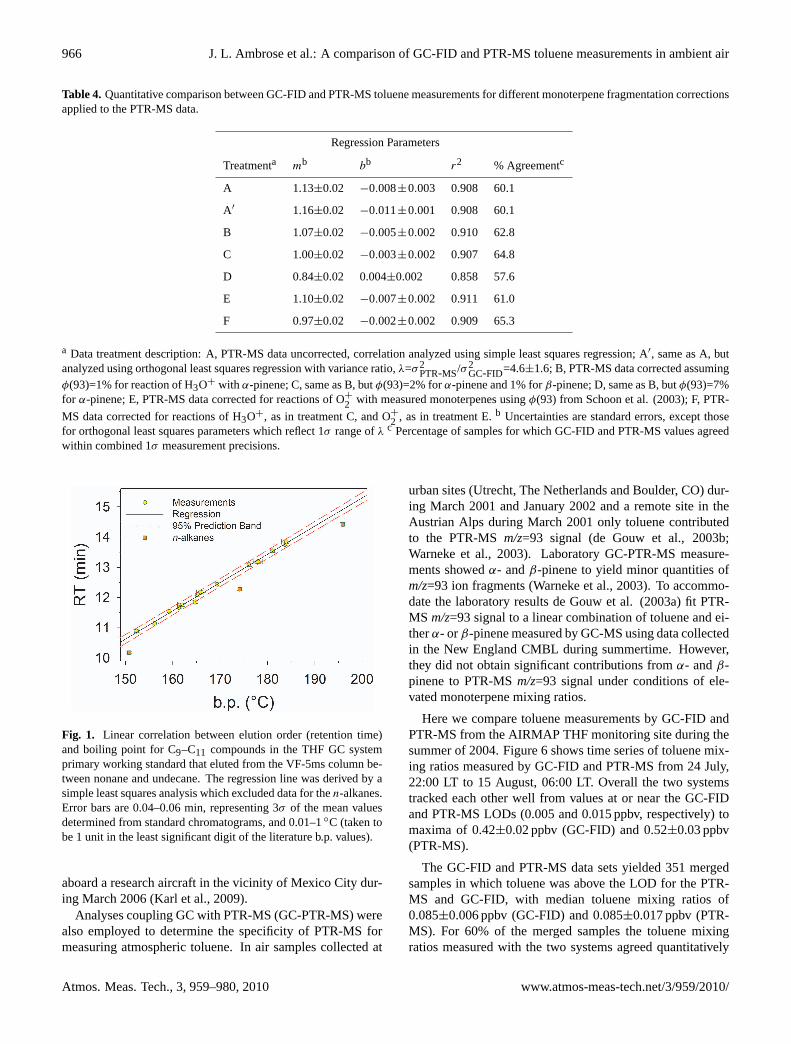
Table 4. Quantitative comparison between GC-FID and PTR-MS toluene measurements for different monoterpene fragmentation correctionsapplied to the PTR-MS data.
Regression Parameters
Treatmenta mb bb r2 % Agreementc
A 1.13±0.02 −0.008±0.003 0.908 60.1
A′ 1.16±0.02 −0.011±0.001 0.908 60.1
B 1.07±0.02 −0.005±0.002 0.910 62.8
C 1.00±0.02 −0.003±0.002 0.907 64.8
D 0.84±0.02 0.004±0.002 0.858 57.6
E 1.10±0.02 −0.007±0.002 0.911 61.0
F 0.97±0.02 −0.002±0.002 0.909 65.3
a Data treatment description: A, PTR-MS data uncorrected, correlation analyzed using simple least squares regression; A′, same as A, butanalyzed using orthogonal least squares regression with variance ratio,λ=σ2
PTR-MS/σ2GC-FID=4.6±1.6; B, PTR-MS data corrected assuming
φ(93)=1% for reaction of H3O+ with α-pinene; C, same as B, butφ(93)=2% forα-pinene and 1% forβ-pinene; D, same as B, butφ(93)=7%for α-pinene; E, PTR-MS data corrected for reactions of O+
2 with measured monoterpenes usingφ(93) from Schoon et al. (2003); F, PTR-
MS data corrected for reactions of H3O+, as in treatment C, and O+2 , as in treatment E.b Uncertainties are standard errors, except thosefor orthogonal least squares parameters which reflect 1σ range ofλ c Percentage of samples for which GC-FID and PTR-MS values agreedwithin combined 1σ measurement precisions.
Fig. 1. Linear correlation between elution order (retention time)and boiling point for C9–C11 compounds in the THF GC systemprimary working standard that eluted from the VF-5ms column be-tween nonane and undecane. The regression line was derived by asimple least squares analysis which excluded data for then-alkanes.Error bars are 0.04–0.06 min, representing 3σ of the mean valuesdetermined from standard chromatograms, and 0.01–1◦C (taken tobe 1 unit in the least significant digit of the literature b.p. values).
aboard a research aircraft in the vicinity of Mexico City dur-ing March 2006 (Karl et al., 2009).
Analyses coupling GC with PTR-MS (GC-PTR-MS) werealso employed to determine the specificity of PTR-MS formeasuring atmospheric toluene. In air samples collected at
urban sites (Utrecht, The Netherlands and Boulder, CO) dur-ing March 2001 and January 2002 and a remote site in theAustrian Alps during March 2001 only toluene contributedto the PTR-MSm/z=93 signal (de Gouw et al., 2003b;Warneke et al., 2003). Laboratory GC-PTR-MS measure-ments showedα- andβ-pinene to yield minor quantities ofm/z=93 ion fragments (Warneke et al., 2003). To accommo-date the laboratory results de Gouw et al. (2003a) fit PTR-MS m/z=93 signal to a linear combination of toluene and ei-therα- orβ-pinene measured by GC-MS using data collectedin the New England CMBL during summertime. However,they did not obtain significant contributions fromα- andβ-pinene to PTR-MSm/z=93 signal under conditions of ele-vated monoterpene mixing ratios.
Here we compare toluene measurements by GC-FID andPTR-MS from the AIRMAP THF monitoring site during thesummer of 2004. Figure 6 shows time series of toluene mix-ing ratios measured by GC-FID and PTR-MS from 24 July,22:00 LT to 15 August, 06:00 LT. Overall the two systemstracked each other well from values at or near the GC-FIDand PTR-MS LODs (0.005 and 0.015 ppbv, respectively) tomaxima of 0.42±0.02 ppbv (GC-FID) and 0.52±0.03 ppbv(PTR-MS).
The GC-FID and PTR-MS data sets yielded 351 mergedsamples in which toluene was above the LOD for the PTR-MS and GC-FID, with median toluene mixing ratios of0.085±0.006 ppbv (GC-FID) and 0.085±0.017 ppbv (PTR-MS). For 60% of the merged samples the toluene mixingratios measured with the two systems agreed quantitatively
Atmos. Meas. Tech., 3, 959–980, 2010 www.atmos-meas-tech.net/3/959/2010/

J. L. Ambrose et al.: A comparison of GC-FID and PTR-MS toluene measurements in ambient air 967
Fig. 2. Portion of a chromatogram from the THF GC system primary working standard showing identification of compounds that elutedbetween nonane and undecane on the VF-5ms column. The temperature program employed was 35◦C for 2 min, 10◦C min−1 to 115◦C,7◦C min−1 to 200◦C for 5 min. Abbreviations: TMB, trimethylbenzene; DEB, diethylbenzene.
Fig. 3. Portion of a chromatogram recorded at THF on 3 August, 04:23 LT during a period of elevated monoterpene mixing ratios.
within the combined 1σ measurement precisions. Despite asignificant background subtraction applied to the PTR-MSmeasurements, the two systems were in good quantitativeagreement. Figure 7 shows a linear correlation plot for themerged data. The parameters of simple least squares regres-sion and orthogonal least squares regression (determined us-ing JMPTM statistical software) are given in Table 4 (Treat-ments A and A′, respectively). Orthogonal least squares ac-counts for errors in both independent and dependent vari-ables (Tan and Iglewicz, 1999) and was applied in previouscomparisons between ambient PTR-MS and GC-MS toluenemeasurements (de Gouw et al., 2003a; Warneke et al., 2003).As shown in Table 4 the results of both regression analy-ses agree quantitatively in terms of the regression parame-ters and the coefficients of determination. In the followingdiscussion the results of different treatments of the PTR-MS
toluene data are analyzed in terms of simple least squaresregression parameters.
3.3 Sources of interference from monoterpenefragmentation
The C10H16 monoterpenes are typically detected by PTR-MSas the protonated molecular ion (m/z=137) and a dominantfragment ion withm/z=81. As discussed in greater detail be-low m/z=93 ions may also be generated from monoterpenefragmentation in the PTR-MS drift tube. Them/z=93, 81 and137 signals were observed by PTR-MS in a laboratory studyof VOC emissions from Mediterranean holm oak (Holzingeret al., 2000), consistent with (1) a biogenic toluene source,as was observed from sunflower and Scots pine by GC-MS(Heiden et al., 1999) and alfalfa by GC-FID (White et al.,2009), and (2) monoterpene fragmentation in the PTR-MS
www.atmos-meas-tech.net/3/959/2010/ Atmos. Meas. Tech., 3, 959–980, 2010

968 J. L. Ambrose et al.: A comparison of GC-FID and PTR-MS toluene measurements in ambient air
Table 5. Comparison of reported yields ofm/z=93 fragment ionsassociated with analysis of monoterpenes by PTR-MS and SIFT-MS.
φ(93) (%) vs. Reagent
Monoterpene H3O+a O+b2 NO+b φ(81) (%)a,c
α-pinene 12d 52e 4e 57d,f
7g 45h,i
1e 40j,k
< 1l 31g,m
< 0.1j,k 30e,b
camphene < 1d,e 13e < 1e
β-pinene 7g 56e 3e 70d,f
< 1d,e,l 40j,k
< 0.1j,k 33e,b
26g,m
β-myrcene 1e 61e 22e 26e,b
< 1d,e,l 1e
13-carene < 1d,e,l 41e 4e 30j,k
< 0.1j,k 19e,b
α-terpinene < 20n
< 1l
p-cymene 91d
85h,i
d-limonene 1d 26e < 1e 72d,f
< 1e 40j,k
< 0.1j,k 22e,b
γ -terpinene 3d
< 1n
terpinolene < 1d,l
a NO+ and O+
2 abundances were not specified and ion transmissionefficiency corrections were not applied in the PTR-MS studies andmay have contributed to the reported ion yields.b SIFT-MS; Hecarrier gas; yield corrected for ion transmission efficiency.c Fromreaction with H3O+. d (Maleknia et al., 2007).e (Schoon et al.,2003). f E/N=140–150 Td.g (Warneke et al., 2003).h (Tani etal., 2004). i E/N=142 Td. j (Tani et al., 2003).k E/N=120 Td;percentage of total ion signal including isotopic signal.l (Lee et al.,2006a).mE/N=106 Td.n (Lee et al., 2006b).
Fig. 4. Comparison of trends in the mixing ratios ofα-pinene and anunidentified (UnID) compound (assumed to be C10) during the pe-riod from 2 August, 12:00 LT to 3 August, 12:00 LT;(a) time seriesof relative mixing ratios;(b) linear regression of absolute mixingratios. TheJ (NO2) data in (a) are 10 min averages and delineatedaytime and nighttime periods. In (b) the correlation between thed-limonene andα-pinene mixing ratios is shown for comparison.The coefficients of determination (r2) for the regression lines were0.97 and 0.95 ford-limonene and UnID, respectively. Error barsrepresent the greater of the measurement precision or LOD. Mix-ing ratios below the LOD were set to 0.5×LOD in (a) and wereexcluded from the regression in (b).
drift tube (Tani et al., 2003). In a factor analysis applied toPTR-MS measurements of VOCs in a boreal forest duringJuly 2004 them/z=93, 81 and 137 signals loaded strongly onthe same factor (Rinne et al., 2005); however, the implica-tions were not discussed.
Here we discuss several possible sources of interferencesin PTR-MS analysis of toluene related to simultaneous sam-pling and analysis of monoterpenes. During the period from24 July to 15 August 2004 toluene and monoterpenes werequantified by GC-FID from a total of 600 ambient samplesat THF. The ratio of the monoterpene mixing ratio to theGC-FID toluene mixing ratio, hereinafter denoted by1Mon,
Atmos. Meas. Tech., 3, 959–980, 2010 www.atmos-meas-tech.net/3/959/2010/

J. L. Ambrose et al.: A comparison of GC-FID and PTR-MS toluene measurements in ambient air 969
Fig. 5. Time series of monoterpenes,J (NO2) (10 min averaged) and wind speed (10 min averaged) measured at THF from 24 July, 22:00 LTto 15 August, 06:00 LT. Values ofJ (NO2) relative to the summertime maximum delineate daytime and nighttime periods. Mixing ratiosbelow the LOD were set to 0.5×LOD.
ranged from<0.25 to 31±2, with a median value of 2.4. Forthe merged data set (n=349) the median value of1Mon was2.6±0.2. By comparison maximum1Mon values of>5 werereported from measurements made in the Gulf of Maine dur-ing summer of 2002 (de Gouw et al., 2003a). Thus, it appearswe observed relatively large enhancements in monoterpenesrelative to toluene at the THF site during summer 2004 andour data provide a unique test of the specificity of PTR-MSfor measurement of toluene in an atmospheric environmentstrongly influenced by biogenic monoterpene emissions.
It is expected that the generation of ion products atm/z=93by monoterpene fragmentation in the PTR-MS drift tubewould result in (1) a positive bias in the PTR-MS toluenemeasurements as compared with the GC-FID measurements,and (2) a positive correlation between1Mon and the magni-tude of the PTR-MS bias. An overall small positive bias of∼13% was observed in the PTR-MS measurements as indi-cated by the slope of the least squares regression fit to the
merged data in Fig. 7 (Table 4, treatment A). The observedbias is consistent with an additional source ofm/z=93 ionsin the PTR-MS instrument. Since the FID response factorsfor the PTR-MS toluene standard and the whole air stan-dards run on the GC system agreed to within stated uncer-tainties, it appeared that calibration errors were not the causeof the PTR-MS bias. The PTR-MS instrument backgroundat m/z=93 accounted for on average 38±16% of the totalm/z=93 ion current and was therefore relatively high. It wason average∼4-fold larger than them/z=93 ion current cor-responding with the PTR-MS bias. The backgroundm/z=93ion current showed significant variability and did not corre-late with the toluene mixing ratio. Excluding from our anal-ysis times when the largest relative backgroundm/z=93 ioncurrents were measured did not significantly reduce the PTR-MS bias. Although we could not accurately quantify thecontribution, it is likely that the relatively large and variablem/z=93 background current in the PTR-MS instrument was
www.atmos-meas-tech.net/3/959/2010/ Atmos. Meas. Tech., 3, 959–980, 2010

970 J. L. Ambrose et al.: A comparison of GC-FID and PTR-MS toluene measurements in ambient air
Fig. 6. Time series of toluene measured by GC-FID and PTR-MS during the period between 24 July, 22:00 LT and 15 August, 06:00 LT.Values ofJ (NO2) are show as in Fig. 5. Errors in the GC-FID and PTR-MS data are the greater of the 1σ measurement precision or LOD.
the primary driver of the measurement bias. Figure 8 com-pares time series of the PTR-MS error (percent differencewith respect to the GC toluene measurements),hereinafterdenoted asεPTR-MS, and1Mon. Maxima in the values ofεPTR-MS and1Mon generally occurred during nighttime butdid not appear to be well correlated, suggesting qualitativelythat interference in the PTR-MS toluene measurements frommonoterpene fragmentation was unimportant at THF. Quan-titative estimates of potential interferences in the PTR-MStoluene measurements are presented below.
3.3.1 Reactions with H3O+
Ion products were detected atm/z=93 in laboratory PTR-MS analyses of six monoterpenes,α-pinene (Warneke etal., 2003; Maleknia et al., 2007),β-pinene (Warneke etal., 2003),d-limonene (Maleknia et al., 2007),γ -terpinene
(Maleknia et al., 2007),α-terpinene (Lee et al., 2006b), andp-cymene (Tani et al., 2003, 2004; Maleknia et al., 2007),and in the analysis ofα-pinene andβ-myrcene by selectedion flow tube mass spectrometry (SIFT-MS) using H3O+ asreagent ion (Schoon et al., 2003). Table 5 compares yieldsof m/z=93 fragment ions,φ(93), reported in the literature.When more than one set of operating parameters was em-ployed, as in several of the above studies (Tani et al., 2003,2004; Maleknia et al., 2007), fragmentation data chosen forcomparison in Table 5 correspond with operating parametersmost similar to those used at THF. When data were not avail-able regarding the fraction of NO+ and O+
2 in the PTR-MSdrift tube, the reported values ofφ(93) were attributed en-tirely to H3O+ reactions; however, contributions from reac-tions of the parent monoterpenes with NO+ and O+
2 shouldnot be ruled out (see below). It is also important to note
Atmos. Meas. Tech., 3, 959–980, 2010 www.atmos-meas-tech.net/3/959/2010/

J. L. Ambrose et al.: A comparison of GC-FID and PTR-MS toluene measurements in ambient air 971
Table 6. Comparison between PTR-MS operating parameters employed at THF during summer of 2004 and in selected studies reported inthe literature.
PDT (mbar) TDT (K) E (V cm−1) E/N (Td)a KEion (kJ mole−1)b Reference
1.8–2.1 303–333 60c 120–150 23.5–39.8 (Maleknia et al., 2007)
1.8–2.1 296d 41.7–62.5 142 32.8 (Tani et al., 2004)
2.005±0.005 318 62.5 137 30.7 This work
ND ND ND 120 > 23.3e (Tani et al., 2003)
2.4 ND ND 106 > 18.4e (Warneke et al., 2003)
1.47 298 0.08 0.22 3.7f (Schoon et al., 2003)g
2.2 ND ND ND ND (Lee et al., 2006a,b)
a 1TD (Townsend)=10−17V cm2. b Calculated from published values ofµ0 in N2 (Dalton et al., 1976).c Drift tube length assumed to be9.6 cm.d Calculated fromPDT andE/N . e AssumedTDT >21◦C. f Equivalent to thermal energy.g SIFT-MS; conditions correspond withflow tube. Abbreviations: DT, drift tube; ND, no data.
that fragmentation patterns are partly controlled by PTR-MS operating conditions, which differed between studies;therefore, the yields reported in Table 5 may differ signifi-cantly from the actual yields obtained at THF. Table 6 givesthe instrumental operating parameters, when available, cor-responding with the fragmentation yields reported in Table 5as well as the parameters employed at THF during summer2004. Also given in Table 6 are mean H3O+ kinetic ener-gies, KEion, calculated from the tabulated operating parame-ters using Eq. (10) (McFarland et al., 1973),
KEion =1
2·m ·v2
d +1
2·Mb ·v2
d +3
2·kB ·T . (10)
wherem and Mb are the H3O+ and buffer gas molecularweights, respectively,vd is the H3O+ drift velocity, T is thedrift tube temperature, andkB is the Boltzmann constant. Thedrift velocity was calculated using Eq. (11) (de Gouw andWarneke, 2007),
vd =µ0 ·N0 ·E
N, (11)
whereµ0 is the reduced H3O+ mobility in the buffer gas,N0is the gas number density at standard temperature and pres-sure,E is the electric field strength, andN is the gas num-ber density under the experimental conditions. The valuesof KEion in Table 6 allow H3O+-neutral collision energiesto be compared between studies. Increasing KEion generallyresults in greater product ion fragmentation in the PTR-MSdrift tube (c.f., Tani et al., 2003).
Although most previous studies reported values ofφ(93)≤1% from PTR-MS analysis and reaction with H3O+ of themonoterpenes measured at THF, two showedφ(93) >1%from PTR-MS analysis ofα-pinene (Warneke et al., 2003;Maleknia et al., 2007), while one study reportedφ(93)>1%from PTR-MS analysis ofβ-pinene (Warneke et al., 2003).
Impurities in liquid monoterpene standards employed in pre-vious laboratory PTR-MS studies were measured atm/z=93(Tani et al., 2003), and it is possible that uncharacterizedimpurities contributed to the maximumφ(93) value of 12%shown in Table 5. However, it is less likely that interferencefrom impurities contributed to the highφ(93) values of 7%measured forα- andβ-pinene in a GC-PTR-MS analysis ofsynthetic gas standards (Warneke et al., 2003). Therefore,we considered values ofφ(93) significantly greater than 1%in quantifying possible interferences fromα- andβ-pinenefragmentation in the PTR-MS drift tube.
Corrections to the PTR-MS toluene mixing ratios werecalculated for reactions of H3O+ with the measured monoter-penes as shown in Sect. 2.2 using values of1Mon from theGC-FID measurements; proton transfer reaction rate con-stants measured previously for toluene (Spanel and Smith,1998),α- andβ-pinene (Tani et al., 2003); and integer val-ues ofφ(93) within the range of those reported previously(Table 5). To simplify the analysis we only considered cor-rections for which the value ofφ(93) for α-pinene was≥that forβ-pinene, consistent with previous observations (Ta-ble 5). The PTR-MS rate data of Tani et al. (2003) werederived relative to the SIFT-MS rate constant for the reac-tion of H3O+ with toluene measured bySpanel and Smith(1998). The experimental rate constants agreed to within15% error with the corresponding calculated collisional val-ues (Spanel and Smith, 1998; Schoon et al., 2003; Zhao andZhang, 2004). For non-polar compounds with rate constantsfor reaction with H3O+that are close to the collisional limitthe rate constants are expected to be independent of collisionenergy, which permits the use of thermal energy values forPTR-MS analyses (Keck et al., 2007). Thus, we assumedthat the use of the SIFT-MS rate constant for toluene and therelative rate data of Tani et al. (2003) in our analysis wasvalid.
www.atmos-meas-tech.net/3/959/2010/ Atmos. Meas. Tech., 3, 959–980, 2010

972 J. L. Ambrose et al.: A comparison of GC-FID and PTR-MS toluene measurements in ambient air
Table 7. Comparison of reported yields ofm/z=93 fragment ions associated with analysis of monoterpene oxidation products by PTR-MSand SIFT-MS.
Yield (%) vs. Oxidant
Monoterpene Oxidation Product OH O3 φ(93) (%)a
α-pinene pinonaldehyde 47–83b 19–34c 2d
28–87e 16±3e
α-pinene oxide 5.4±0.6c 9d
2e
β-pinene UnIDf < 5b 100g
β-myrcene 4-vinyl-4-pentenal 32–41b 49±8c > 70b,g,h, >10c,g,h
13-carene caronaldehyde 34±8i≤ 8i 3d
UnID > 5b 100g
ocimenej,k 4-methyl-3,5-hexadienall < 2 < 33
d-limonene UnID < 5b 100g
γ -terpinene UnID > 5b 100g
terpinolene 4-methyl-3-cyclohexen-1-one 43±7b 53±9c 47b,g,h, 9c,g,h
a From reaction with H3O+ unless indicated otherwise.b (Lee et al., 2006b).c( Lee et al., 2006a).d (Schoon et al., 2004).e (Atkinsonet al., 2006).f UnID, unidentified oxidation products.g NO+ and O+
2 abundances were not specified and may have contributed to reported
fragmentation.h Assuming dehydration of the corresponding protonated oxidation product in the PTR-MS drift tube was the only sourceof the reported yield.i (Hakola et al., 1994).j cis-, trans- mixture. k (Reissell et al., 2002).l Protonated molecular ion may dehydrate to am/z=93 fragment ion as observed for other 110 amu products (Lee et al., 2006a, b).
Table 4 presents quantitative data comparing the GC-FIDand PTR-MS toluene measurements for several fragmenta-tion corrections (treatments B–G) applied to the PTR-MSmeasurements. We defined fragmentation corrections thatimproved quantitative agreement between the GC-FID andPTR-MS measurements as those which (1) reduced the de-viation of the simple least squares regression slope fromunity and (2) increased the percentage of data for whichboth instruments agreed within combined measurement pre-cisions. The minimum fragmentation correction used a valueof φ(93)=1% forα-pinene (treatment B). The best quantita-tive agreement between the two data sets was achieved withφ(93)=2% forα-pinene and 1% forβ-pinene (treatment C).For treatment C the median, 75th and 95th percentile cor-rections were 3%, 8% and 19%, respectively; most of thecorrections were within the PTR-MS measurement precisionand were therefore insignificant. Values ofφ(93) >5% forα-pinene (e.g., treatment D) resulted in poorer quantitativeagreement than for the uncorrected measurements. Thus,our data appear to be most consistent with small values ofφ(93) for the measured monoterpenes and only a minor in-terference in the PTR-MS toluene measurements from reac-tions of monoterpenes with H3O+ in the PTR-MS drift tube.
The calculated interference in the PTR-MS toluene measure-ments from reaction of H3O+ with α- and β-pinene washighly correlated with1Mon(Fig. 8) because of the relativelylarge measured abundances for those compounds. Weremonoterpene fragmentation an important source ofm/z=93fragment ions in our instrument, the observed error in thePTR-MS toluene measurements (i.e.,εPTR-MS) would alsohave closely tracked1Mon.
3.3.2 Reactions with O+2 and NO+
The O+
2 and NO+ ions are formed in low yield in the PTR-MS ion source drift region (Hansel et al., 1995; de Gouwand Warneke, 2007), and their reactions with monoterpeneswere shown to generate products that may interfere with thePTR-MS signal atm/z=93. Reactions of O+2 with α- andβ-pinene,d-limonene,13-carene,β-myrcene, and camphenein the flow tube of a SIFT-MS instrument produced fragmention products withφ(93)>10% in all cases (Table 5) (Schoonet al., 2003). Similarly, reactions of NO+ with β-myrceneyielded fragment ion products withφ(93)=22% (Schoon etal., 2003). Lower yields (<5%) of m/z=93 products weremeasured for reactions of NO+ with α- and β-pinene,d-
Atmos. Meas. Tech., 3, 959–980, 2010 www.atmos-meas-tech.net/3/959/2010/

J. L. Ambrose et al.: A comparison of GC-FID and PTR-MS toluene measurements in ambient air 973
limonene,13-carene, and camphene (Schoon et al., 2003).It is important to note that the absence of a strong electricfield along the SIFT-MS flow tube results in substantiallylower H3O+-neutral collision energies in SIFT-MS than inPTR-MS, as illustrated by values of KEion given in Table 6.Furthermore, the stabilities of reaction intermediates are af-fected by the buffer gas, which differs between SIFT-MS andPTR-MS. Table 5 compares values ofφ(81) measured forseveral monoterpenes by SIFT-MS, using H3O+ as reagention, and PTR-MS, illustrating that the extent of monoter-pene fragmentation (1) was greater at higher ratios of elec-tric field strength to gas number density,E/N , in PTR-MSanalyses and (2) was significantly greater, by a factor of∼1.8±0.7(1σ ), in PTR-MS (withE/N=120–150 Td) than inSIFT-MS analyses. Accordingly, fragmentation yields fromreactions of monoterpenes with O+
2 and NO+ at THF likelywere significantly higher than those observed by SIFT-MS.To partly account for higher values ofφ(93) expected underour operating conditions than reported for the SIFT-MS anal-ysis of Schoon et al. (2003), we performed calculations withthe SIFT-MS fragmentation yields increased by a factor of 2as discussed below.
Corrections to the PTR-MS toluene mixing ratios werecalculated for reactions of O+2 with the measured monoter-penes in the PTR-MS drift tube (Table 4, treatment E). Thecalculations used rate constants and fragmentation patternsmeasured by SIFT-MS (Table 5) (Schoon et al., 2003). Theexperimental rate constants for reaction of O+
2 (and NO+)
with the measured monoterpenes agreed to within 10% errorwith the corresponding calculated collisional values (Schoonet al., 2003). As described above (Sect. 3.3.1) for reactionof H3O+ with toluene,α- andβ-pinene the use of the SIFT-MS rate constants for our analysis was assumed to be validdue to the non-polar nature of the monoterpenes. At THFthe PTR-MS signal atm/z=32, which we attributed to O+2 ,was typically<1% of the H3O+ signal during summer 2004,and the median correction to the PTR-MS toluene mixingratios was<1%, while the 95th percentile correction was6%. The quantitative agreement with the GC-FID measure-ments was slightly improved as compared with the uncor-rected PTR-MS measurements (Table 4); however, the cor-rections were entirely within the PTR-MS measurement pre-cision and therefore were insignificant. Increasing the valuesof φ(93) (Table 5) by a factor of 2 for O+2 reactions with themeasured monoterpenes, yieldingφ(93)=100% forα- andβ-pinene, did not significantly influence the results for treat-ment E. Reactions of O+2 with α- and β-pinene were cal-culated to make the largest contribution to the O+
2 -mediatedmonoterpene fragmentation interference because of the rel-atively large measured abundances and reportedφ(93) forthose compounds. The calculated fragmentation interferenceresulting from reactions of O+2 with the measured monoter-penes was highly correlated with1Mon (Fig. 8). Applyingcorrections for H3O+ and O+
2 reactions together (treatment
Fig. 7. Linear correlation between toluene measurements by GC-FID and PTR-MS. The regression line and its confidence band werederived from a simple least squares analysis. The regression param-eters are given in Table 4.
F) did not significantly affect agreement with the GC-FIDmeasurements compared to when corrections were appliedonly for H3O+ reactions. Our calculations suggest that re-actions of monoterpenes with O+
2 in the PTR-MS drift tubelikely resulted in a minor additional source ofm/z=93 frag-ment ions which did not interfere significantly with the mea-sured toluene mixing ratios.
The PTR-MS signal atm/z=31, with contributions from15N16O+ and likely also the protonated molecular ion offormaldehyde (H3CO+) (de Gouw and Warneke, 2007), wastypically <0.001% of the H3O+ signal. The corresponding14N16O+ signal atm/z=30 (unmeasured) was calculated tobe<0.3%. Thus, considering that values ofφ(93) for NO+
reactions are generally lower than those for O+
2 (Table 5), re-actions of monoterpenes with NO+ in the PTR-MS drift tubelikely did not significantly affect the measuredm/z=93 ioncurrent.
3.4 Sources of interference from monoterpeneoxidation products
Table 7 gives yields ofm/z=93 fragment ions from ozonol-ysis and photooxidation products of several monoterpenes.Reported formation yields for the oxidation products arealso tabulated. Reactions of H3O+ with oxidation prod-ucts ofα-pinene and13-carene were shown by SIFT-MS togive fragment ions atm/z=93 (Schoon et al., 2004). Prod-ucts from ozonolysis ofβ-myrcene and terpinolene were de-tected by PTR-MS atm/z=93 in a recent laboratory chamberstudy (Lee et al., 2006a). In an investigation of monoter-pene photochemistry by the same group (Lee et al., 2006b)photooxidation ofβ-myrcene,13-carene,γ -terpinene andterpinolene gave products detected by PTR-MS atm/z=93
www.atmos-meas-tech.net/3/959/2010/ Atmos. Meas. Tech., 3, 959–980, 2010

974 J. L. Ambrose et al.: A comparison of GC-FID and PTR-MS toluene measurements in ambient air
Fig. 8. Comparison between values ofεPTR-MS and1Mon for merged GC-FID, PTR-MS data for the period from 24 July, 22:00 LT to 15August, 06:00 LT. Values ofJ (NO2) are show as in Fig. 5. *Open symbols correspond with times when the toluene measurements did notagree quantitatively within the combined precisions of the two instruments. The dotted line represents perfect agreement.
with >5% molar yield, whereas photooxidation ofβ-pinenegave products detected atm/z=93 with <5% molar yield.Ocimene undergoes similar ozonolysis and photooxidationchemistry asβ-myrcene (Reissell et al., 2002), and thereforecould potentially also yield an additional indirect source ofm/z=93 fragment ions in PTR-MS analysis of monoterpenesduring periods of active oxidation chemistry. In the follow-ing discussion we consider production ofm/z=93 fragmentions from reactions of identified oxidation products of themonoterpenes measured at THF: pinonaldehyde,α-pineneoxide and caronaldehyde.
3.4.1 Ozonolysis products
We used O3 measurements, together with published kineticdata for O3-monoterpene reactions and product formationyields (Table 7) to estimate production rates of pinonalde-
hyde andα-pinene oxide fromα-pinene ozonolysis, andcaronaldehyde from13-carene ozonolysis at THF. Unlessotherwise indicated kinetic and product yield data from themost recent recommendations of the IUPAC Subcommit-tee for Gas Kinetic Data Evaluation (Atkinson et al., 2006)and from previous critical reviews (Atkinson, 1994, 1997)were used. Local conditions of pressure and temperaturewere used in all kinetic calculations; temperature dependen-cies have not been quantified for oxidation reactions of themajority of the monoterpenes. The calculated pinonalde-hyde production rates, based on a yield of 16±3% (Table 7),ranged from<0.001 to 0.023±0.015 ppbv hr−1, with uncer-tainty governed mostly by contribution from the rate constant(Atkinson et al., 2006). The measuredα-pinene mixing ra-tios were linearly interpolated between consecutive GC-FIDsamples to estimate pinonaldehyde production rates at 5 mintime resolution. Pinonaldehyde mixing ratios were estimated
Atmos. Meas. Tech., 3, 959–980, 2010 www.atmos-meas-tech.net/3/959/2010/

J. L. Ambrose et al.: A comparison of GC-FID and PTR-MS toluene measurements in ambient air 975
by summing the 5 min production rates over 1 h intervals,and ranged from<0.001 to∼0.023 ppbv. Corrections tothe PTR-MS toluene measurements for reactions of H3O+
with pinonaldehyde were calculated as described above forreactions of H3O+ and O+
2 with the parent monoterpenes.A value of φ(93)=0.02 (Table 7) and the collisional pro-ton transfer rate coefficient for pinonaldehyde (Schoon etal., 2004) resulted in negligible, 95th percentile<1%, cor-rections to the PTR-MS toluene mixing ratios. For polarcompounds with rate constants for reaction with H3O+ thatare close to the collisional limit, the rate constants are ex-pected to decrease with increasing collision energy (Kecket al., 2007). However, large differences in rate constantsare not expected between SIFT-MS and PTR-MS conditionsfor compounds with thermal ion-molecule rate constants thatare close to the collisional limit (Wyche et al., 2005). Weassumed that the rate constants of Schoon et al. (2004) pro-vided upper limits that closely approximated the correct val-ues in our analysis. The pinonaldehyde mixing ratio esti-mates bear considerable uncertainty since atmospheric lossprocesses, which may include a significant heterogeneouscomponent (Liggio and Li, 2006), and transport were nottaken into account. To partially account for the possibilityof a higher value ofφ(93) and greater pinonaldehyde ac-cumulation in the sampled air, calculations were performedwith the SIFT-MS value ofφ(93) increased by a factor of2. With φ(93)=0.04 the 95th percentile correction remained<1%. Calculated production rates forα-pinene oxide andcaronaldehyde were considerably lower than for pinonalde-hyde,<0.003 and<0.001 ppbv hr−1 respectively, therefore itis likely that sampling ofα-pinene oxide and caronaldehydefrom O3-initiated oxidation ofα-pinene and13-carene didnot significantly interfere in the PTR-MS toluene measure-ment. The calculated interference resulting from reaction ofH3O+ with pinonaldehyde, caronaldehyde andα-pinene ox-ide was a function of (1) the mixing ratios ofα-pinene and13-carene relative to that of toluene and (2) the local O3mixing ratio. The O3 mixing ratio peaked in the late after-noon, whereas the relative abundances ofα-pinene and13-carene tracked1Mon and were highest toward the end of thenight. The calculated interference resulting from reactionsof H3O+ with the monoterpene oxidation products showeda broad peak between the late evening (18:00 LT) and earlymorning (08:00 LT).
3.4.2 Photooxidation products
Because no measurements of OH have been made at THF todate the quantitative contribution of OH to monoterpene oxi-dation at THF is highly uncertain. We used a simple approxi-mation of OH concentrations, together with published kineticdata (Atkinson, 1989, 1994; Atkinson et al., 2006) and for-mation yields for monoterpene photoxidation products (Ta-ble 7) to estimate production rates of pinonaldehyde andcaronaldehyde from reactions of OH withα-pinene and13-
carene, respectively. Considering only daytime OH chem-istry the time rate of change of the pinonaldehyde mixingratio was approximated by Eq. (13):
d[Pinon]
dt= PPinon−k′
OH+Pinon· [Pinon], (12)
where,
PPinon= kOH+α-Pin·fPinon· [α-Pin] · [OH], (13)
k′
OH+Pinon= kOH+Pinon· [OH]. (14)
HerePPinon is the pinonaldehyde production rate,fPinon de-notes the formation yield of pinonaldehyde from reactions ofOH with α-pinene, and the bracketed terms represent con-centrations whereα-Pin and Pinon stand forα-pinene andpinonaldehyde, respectively. Pinonaldehyde mixing ratioswere estimated by integrating Eq. (13) stepwise over twelveconsecutive 5 min intervals (1 hr), with the initial conditionthat [Pinon]=0. For each 5 min interval, the termsPPinonandk′
OH+Pinon were calculated from the interpolated (5 minintervals)α-pinene mixing ratios and a constant OH con-centration of 2×10⁶ molecules cm−3. The starting value of[Pinon] was taken from integration over the preceding in-terval. Caronaldehyde mixing ratios were estimated analo-gous to the pinonaldehyde estimates. Integration of Eq. (13)and the method used for estimating pinonaldehyde mixingratios fromα-pinene ozonolysis are equivalent when the sec-ond term on the right side of Eq. (13) is excluded, which isappropriate for the slow O3-carbonyl reactions (c.f., Hakolaet al., 1994). A similar method as outlined above was pre-viously applied to estimate nighttime nitrate radical mixingratios at the AIRMAP atmospheric monitoring station on Ap-pledore Island, Maine (Ambrose et al., 2007). The approachis less appropriate here because the pinonaldehyde lifetimemay be long enough for transport to partially govern its at-mospheric mixing ratios. As for the pinonaldehyde levelsestimated fromα-pinene ozonolysis, the mixing ratios esti-mated from OH oxidation bear large uncertainties. The cal-culated pinonaldehyde production rates ranged from<0.001to 0.11±0.09 ppbv hr−1 based on an upper limit pinonalde-hyde yield of 87±20% (Table 7). The 1 hr integrated pinon-aldehyde mixing ratios ranged from<0.001 to∼0.10 ppbv,with maximum values occurring during the early morninghours, 06:00 to 07:30 LT. A value ofφ(93)=0.02 (Table 7)and the measured proton transfer rate coefficient for pinon-aldehyde (Schoon et al., 2004) resulted in negligible, 95thpercentile<1%, corrections to the PTR-MS toluene mixingratios during the daytime hours. The calculated interferencetracked the pinonaldehyde mixing ratio.
Measured OH concentrations were shown previously tobe strongly correlated with solar ultraviolet radiation (UV)(Ehhalt and Rohrer, 2000; Rohrer and Berresheim, 2006).
www.atmos-meas-tech.net/3/959/2010/ Atmos. Meas. Tech., 3, 959–980, 2010
976 J. L. Ambrose et al.: A comparison of GC-FID and PTR-MS toluene measurements in ambient air
An approximation of OH that is consistent with the ob-served correlations between the OH concentration and solarUV would give lower OH concentrations and reduced ox-idation rates at dawn, resulting in smaller corrections thanfor the case of a uniform OH concentration. Calculated pro-duction rates for caronaldehyde were slightly lower than forpinonaldehyde,<0.09 ppbv hr−1, while the SIFT-MS valueof φ(93) (Schoon et al., 2004) is only a factor of 1.5 higherfor caronaldehyde (Table 7). Thus, it is likely that samplingof caronaldehyde from the oxidation of13-carene by OH didnot significantly interfere in the PTR-MS toluene analysis.
In addition to daytime photochemistry, reactions of O3with alkenes were shown previously to generate OH in thedark (Atkinson, 1994). Yields of OH determined previ-ously from ozonolysis of the monoterpenes measured at THFwere typically large and ranged from≤0.18 for camphene to1.06(±50%) for13-carene (Atkinson, 1997). Based on mea-sured nighttime monoterpene and O3 mixing ratios and pub-lished kinetic data (Atkinson, 1994; Atkinson et al., 2006)and OH yields (Atkinson, 1997) the median nighttime OHproduction rate at THF was calculated to be∼0.03 ppbv hr−1
and dominated byα-pinene ozonolysis. For comparison,daytime OH production rates were calculated for the reactionsequence (R4) + (R5) using measurements of atmosphericpressure, RH, andJ (NO2) and published kinetic data forreactions of singlet oxygen, O1D, with N2, O2, and H2O(Atkinson et al., 2004):
O3+hυ → O1D+O2, (R4)
O1D+H2O→ 2OH. (R5)
Values ofJ (O1D) were estimated from theJ (NO2) measure-ments using Eq. (16), which was derived from observationsduring summertime at a research site in northern Germany(Ehhalt and Rohrer, 2000):
J (O1D) =
(J (NO2)
1.6
)2
. (15)
The median daytime OH production rate from Reac-tions (R4) and (R5) was calculated to be∼0.1 ppbv hr−1,and may represent<25% of the total daytime OH produc-tion (Rohrer and Berresheim, 2006). Thus, it is expected thatOH made a small but perhaps non-negligible contribution tonighttime monoterpenes oxidation at THF. Published mecha-nisms for the oxidation ofα-pinene by OH require values ofVMR(NO)/VMR(Mon) ≥1 for maximal yield of pinonalde-hyde (Pinho et al., 2007). Pinonaldehyde yields significantlylower than the values given in Table 7 were observed pre-viously from photooxidation ofα-pinene in the absence ofNO (Hatakeyama et al., 1991). Nighttime NO levels at THFwere typically below the 0.06 ppbv instrumental LOD, 95thpercentile<0.15 ppbv, and values of VMR(NO)/VMR(Mon)were typically<0.01, 95th percentile<0.21. Thus, night-time production of pinonaldehyde and caronaldehyde (by
analogy) was expected to be significantly lower than day-time production despite higher monoterpene mixing ratiosduring nighttime. In conclusion the above analysis suggeststhat products of OH-initiate monoterpene oxidation did notinterfere with the PTR-MS toluene measurement at THF.
3.5 Additional contributions to PTR-MS signalat m/z=93
3.5.1 Reactions with H3O+(H2O)
It is likely that the proton affinities of the monoterpenes mea-sured at THF are sufficiently high for those compounds toreact with H3O+(H2O) in the PTR-MS drift tube (Fernan-dez et al., 1998; Lindinger et al., 1998b; Tani et al., 2004).Such reactions could provide a source ofm/z=93 fragmentions in addition to those discussed above. However, in ouranalysis we did not consider reaction of monoterpenes withH3O+(H2O) because of its low measured ion current relativeto that of H3O+ and the lack of relevant kinetic and productdata. We estimated that at most, reaction of the measuredmonoterpenes with H3O+(H2O) would increase them/z=93yields by on average 10% above the yields from reaction withH3O+ alone, assuming equal rate constants and yields forreactions with H3O+ and H3O+(H2O). Because the protonaffinity of (H2O)2 (808 kJ mole−1) is much higher than thatof H2O (691 kJ mole−1) (Blake et al., 2009), which resultsin less exothermic proton transfer reactions for H3O+(H2O)compared with H3O+, it is likely that the m/z=93 yieldsfrom reaction of H3O+(H2O) with the monoterpenes mea-sured at THF are significantly lower than those from reactionwith H3O+. Available kinetic data suggest that proton trans-fer rate constants for H3O+(H2O) are generally slower thanthose for H3O+ (Smith andSpanel, 2005).
3.5.2 Chloroacetone and proton-bound ethanol dimer(((EtOH)2+H)+)
For completeness it should be noted that, in addition totoluene and fragment ions produced from monoterpenes andtheir oxidation products, chloroacetone was also shown toyield anm/z=93 ion (C3H6ClO+) when measured via PTR-MS (Warneke et al., 2003). Also, two laboratory studies haveattributed PTR-MS measurements ofm/z=93 ions to proton-bound ethanol dimers (C4H13O
+
2 ; ((EtOH)2+H)+) (Steeghset al., 2004; Maleknia et al., 2007). Chloroacetone is notcommonly measured in the atmosphere, and its mixing ratiosare expected to be low (Warneke et al., 2003). The condi-tions employed in the laboratory PTR-MS EtOH measure-ments were not representative of ambient air. We found them/z=47 signal to be unreliable for measurement of EtOH atTHF due to low sensitivity and significant interferences. In-terferences in the PTR-MSm/z=93 signal from chloroace-tone and ((EtOH)2+H)+ cannot be fully evaluated form ourdata, but they are not likely to be significant.
Atmos. Meas. Tech., 3, 959–980, 2010 www.atmos-meas-tech.net/3/959/2010/

J. L. Ambrose et al.: A comparison of GC-FID and PTR-MS toluene measurements in ambient air 977
4 Summary
In the analysis of atmospheric VOCs by PTR-MS, toluene isquantified as its protonated molecular ion atm/z=93. Previ-ous laboratory PTR-MS and SIFT-MS studies suggested ad-ditional sources ofm/z=93 ions associated with sampling andanalysis of several monoterpenes, including fragmentation ofthe parent monoterpenes and their carbonyl oxidation prod-ucts in the PTR-MS drift tube (Schoon et al., 2003; Tani etal., 2003; Warneke et al., 2003; Schoon et al., 2004, Tani etal., 2004; Lee et al., 2006a, b; Maleknia et al., 2007). To date,studies dedicated to evaluating the importance of these ad-ditional m/z=93 sources in ambient air have not appeared inthe literature; in general, PTR-MS validation studies have notbeen carried out in forested environments where the largestquantities of monoterpenes and their oxidation products areexpected to be encountered.
We conducted a quantitative comparison among GC-FIDand PTR-MS toluene measurements made at the AIRMAPTHF atmospheric monitoring station during the summer of2004. Concurrent measurements of monoterpenes, includ-ing α- andβ-pinene, camphene,13-carene, andd-limonene,by GC-FID demonstrated that the monoterpene abundanceregularly greatly exceeded that of toluene during the night-time hours under calm conditions. The data presented aunique test of PTR-MS specificity for toluene measurementin an atmospheric environment heavily influenced by bio-genic monoterpene emissions.
The GC-FID and PTR-MS toluene measurements rangedbetween<0.015 and∼0.5 ppbv and were generally in goodquantitative agreement as observed in previous comparisonstudies. An overall minor (∼13%) positive bias was ob-served for the PTR-MS measurements, but did not corre-late strongly with coincident monoterpene enhancements, aswould be expected if monoterpene fragmentation contributedsignificantly to the PTR-MS signal atm/z=93.
Potential sources ofm/z=93 fragment ions associated withsampling and analysis of monoterpenes by PTR-MS werequantified and included reactions of the measured monoter-penes and some of their atmospheric oxidation products withH3O+, O+
2 and NO+ in the PTR-MS drift tube. Their signif-icance was evaluated in terms of corresponding calculatedcorrections to the PTR-MS toluene mixing ratios. Yieldsof m/z=93 fragment ions,φ(93), and kinetic parameters forthe associated ion-molecule reactions were taken from thePTR-MS and SIFT-MS literature. Kinetic parameters forreactions of the monoterpenes and their primary carbonyloxidation products with O3 and hydroxyl radical, togetherwith measured O3 mixing ratios and an assumed constantdaytime OH concentration were used to estimate mixing ra-tios for the carbonyls. Our data were most consistent withφ(93) values of a few percent for reactions of H3O+ withα- andβ-pinene, which resulted in mostly insignificant cor-rections to the PTR-MS toluene measurements. Negligiblysmall corrections to the PTR-MS measurements were also
calculated for reactions of the measured monoterpenes withO+
2 and NO+. Likewise, levels of the monoterpene oxida-tion products pinonaldehyde,α-pinene oxide and caronalde-hyde were estimated to be too low to significantly interferewith the PTR-MS toluene measurement. Applying the cal-culated fragmentation corrections to our data would increaseby <10% the number of PTR-MS toluene measurements thatagreed quantitatively with the GC-FID measurements.
We conclude that the PTR-MS bias was likely driven by arelatively large and variable toluene background in the PTR-MS instrument, although the precise contribution was diffi-cult to quantify and thus was not corrected for in this anal-ysis. Subsequent to the ICARTT campaign an improvedcatalytic converter was developed in our laboratory whichyielded significantly lower, more stable background levelsfor most ions, includingm/z=93. The design and perfor-mance characteristics of the new catalytic converter for PTR-MS measurements will be described in detail in the Ph.D.thesis of K. Haase.
Our results suggest that with our PTR-MS operating con-ditions, under the atmospheric conditions encountered atTHF, interferences in PTR-MS toluene measurement associ-ated with monoterpene sampling is not significant. This workextends the range of atmospheric conditions under which thespecificity of the PTR-MS technique for atmospheric VOCmeasurement has been validated. The data interpretationmethods presented here should be more generally applica-ble for verifying the extent of analyte fragmentation in PTR-MS analysis of ambient air samples. An alternative, comple-mentary approach to our methodology for interference esti-mation would involve direct measurement of fragmentationyields for the relevant monoterpenes. The resources neces-sary for such measurements were not available to us at thetime this work was performed. Measurements under PTR-MS operating conditions of kinetic parameters and ion prod-uct yields for reactions of H3O+(H2O), NO+, and O+
2 withcommon atmospheric analytes, including monoterpene com-pounds, would be highly beneficial to the type of analysispresented here.
Supplementary material related to this article is availableonline at:http://www.atmos-meas-tech.net/3/959/2010/amt-3-959-2010-supplement.amt-2009-97-supplement.pdf.
Acknowledgements.Financial support for this work was providedto UNH through grant #NA06OAR4600189 from the Office ofOceanic and Atmospheric Research at the National Oceanic andAtmospheric Administration. We are thankful for the helpfulcomments of the two anonymous reviewers.
Edited by: D. Riemer
www.atmos-meas-tech.net/3/959/2010/ Atmos. Meas. Tech., 3, 959–980, 2010

978 J. L. Ambrose et al.: A comparison of GC-FID and PTR-MS toluene measurements in ambient air
References
Ambrose, J. L., Mao, H., Mayne, H. R., Stutz, J., Talbot, R., andSive, B. C.: Nighttime nitrate radical chemistry at Appledore Is-land, Maine during the 2004 International Consortium for Atmo-spheric Research on Transport and Transformation, J. Geophys.Res., 112, D21302, doi:10.1029/2007JD008756, 2007.
Andreae, M. O. and Merlet, P.: Emission of trace gases and aerosolsfrom biomass burning, Global Biogeochem. Cy., 15, 955–966,2001.
Apel, E. C., Calvert, J. G., Greenberg, J. P., Riemer, D., Zika, R.,Kleindienst, T. E., Lonneman, W. A., Fung, K., and Fujita, E.:Generation and validation of oxygenated volatile organic carbonstandards for the 1995 Southern Oxidants Study Nashville Inten-sive, J. Geophys. Res., 103, 22281–22944, 1998.
Apel, E. C., Hills, A. J., Leub, R., Zindel, S., Eisele, S., and Riemer,D. D.: A fast-GC/MS system to measure C2 to C4 carbonylsand methanol aboard aircraft, J. Geophys. Res., 108, D20, 8794,doi:10.1029/2002JD003199, 2003.
Atkinson, R.: Kinetics and mechanisms of the gas-phase reactionsof the hydroxyl radical with organic compounds, J. Phys. Chem.Ref. Data, 1, 1–246, 1989.
Atkinson, R.: Gas-phase tropospheric chemistry of organic com-pounds, J. Phys. Chem. Ref. Data Monogr., 2, 1–216, 1994.
Atkinson, R.: Gas-phase tropospheric chemistry of volatile organiccompounds: 1. Alkanes and alkenes, J. Phys. Chem. Ref. Data,26, 215–290, 1997.
Atkinson, R. and Arey, J.: Gas-phase tropospheric chemistry of bio-genic volatile organic compounds: a review, Atmos. Environ, 37,S2, S197–S219, 2003.
Atkinson, R., Baulch, D. L., Cox, R. A., Crowley, J. N., Hamp-son, R. F., Hynes, R. G., Jenkin, M. E., Rossi, M. J., and Troe, J.:Evaluated kinetic and photochemical data for atmospheric chem-istry: Volume I – gas phase reactions of Ox, HOx, NOx and SOxspecies, Atmos. Chem. Phys., 4, 1461–1738, doi:10.5194/acp-4-1461-2004, 2004.
Atkinson, R., Baulch, D. L., Cox, R. A., Crowley, J. N., Hamp-son, R. F., Hynes, R. G., Jenkin, M. E., Rossi, M. J., Troe, J.,and IUPAC Subcommittee: Evaluated kinetic and photochemi-cal data for atmospheric chemistry: Volume II – gas phase re-actions of organic species, Atmos. Chem. Phys., 6, 3625–4055,doi:10.5194/acp-6-3625-2006, 2006.
Blake, R. S., Monks, P. S., and Ellis, A. M.: Proton-Transfer Reac-tion Mass Spectrometry, Chem. Rev., 109, 861–896, 2009.
Christian, T. J., Kleiss, B., Yokelson, R. J., Holzinger, R.,Crutzen, P. J., Hao, W. M., Shirai, T., and Blake, D. R.:Comprehensive laboratory measurements of biomass-burningemissions: 2. First intercomparison of open-path FTIR, PTR-MS, and GC-MS/FID/ECD, J. Geophys. Res., 109, D02311,doi:10.1029/2003JD003874, 2004.
Dalton, I., Albritton, D. L., Lindinger, W., and Pahl, M.: Mobilitiesof CO+
2 , N2H+, H3O+, H3O+H2O, and H3O+(H2O)2 ions inN2, J. Chem. Phys., 65, 5028–5030, 1976.
de Bievre, P. and Taylor, P. D. P.: Table of isotopic compositions ofthe elements, Int. J. Mass Spectrom., 123, 149–166, 1993.
de Gouw, J. A., Goldan, P. D., Warneke, C., Kuster, W. C., Roberts,J. M., Marchewka, M., Bertman, S. B., Pszenny, A. A. P., andKeene, W. C.: Validation of proton transfer reaction-mass spec-trometry (PTR-MS) measurements of gas-phase organic com-pounds in the atmosphere during the New England Air Qual-
ity Study (NEAQS) in 2002, J. Geophys. Res., 108, D21, 4682,doi:10.1029/2003JD003863, 2003a.
de Gouw, J. and Warneke, C.: Measurements of volatile organiccompounds in the Earth’s atmosphere using proton-transfer-reaction mass spectrometry, Mass. Spectrom. Rev., 26, 223–257,2007.
de Gouw, J., Warneke, C., Karl, T., Eerdekens, G., van der Veen,C., and Fall, R.: Sensitivity and specificity of atmospheric tracegas detection by proton-transfer-reaction mass spectrometry, Int.J. Mass Spectrom., 223/224, 365–382, 2003b.
de Gouw, J. A., Warneke, C., Stohl, A., Wollny, A. G., Brock, C.A., Cooper, O. R., Holloway, J. S., Trainer, M., Fehsenfeld, F. C.,Atlas, E. L., Donnelly, S. G., Stroud, V., and Lueb, A.: Volatileorganic compounds composition of merged and aged forest fireplumes from Alaska and western Canada, J. Geophys. Res., 111,D10303, doi:10.1029/2005JD006175, 2006.
Ehhalt, D. H. and Rohrer, F.: Dependence of the OH concentrationon solar UV, J. Geophys. Res., 105, 3565–3571, 2000.
Fernandez, M. T., Williams, C., Mason, R. S., and Costa Cabral, B.J.: Experimental and theoretical proton affinity of limonene, J.Chem. Soc., Faraday Trans., 94, 1427–1430, 1998.
Geron, C., Rasmussen, R., Arnts, R. R., and Guenther, A.: A re-view and synthesis of monoterpene speciation from forests in theUnited States, Atmos. Environ., 34, 1761–1781, 2000.
Graedel, T. E.: Terpenoids in the atmosphere, Rev. Geophys., 17,937–947, 1979.
Guenther, A. B., Zimmerman, P. R., Harley, P. C., Monson, R. K.,and Fall, R.: Isoprene and monoterpene emission rate variability:model evaluations and sensitivity analyses, J. Geophys. Res., 98,D7, 12609–12617, 1993.
Hakola, H., Arey, J., Aschmann, S. M., and Atkinson, R.: Productformation from the gas-phase reactions of OH radicals and O3with a series of monoterpenes, J. Atmos. Chem., 18, 75–102,1994.
Hansel, A., Jordan, A., Holzinger, R., Prazeller, P., Vogel, W., andLindinger, W.: Proton transfer reaction mass spectrometry: on-line trace gas analysis at the ppb level, Int. J. Mass. Spectrom.Ion Proc., 149/150, 609–619, 1995.
Hatakeyama, S., Izumi, K., Fukuyama, T., Akimoto, H., andWashida, N.: Reactions of OH with alpha-pinene and beta-pinene in air – estimate of global CO production from the atmo-spheric oxidation of terpenes, J. Geophys. Res., 96, D1, 947–958,1991.
Hayward, S., Hewitt, C. N., Sartin, J. H., and Owen, S. M.: Per-formance characteristics and applications of a proton transferreaction-mass spectrometer for measuring volatile organic com-pounds in ambient air, Environ. Sci. Technol., 36, 1554–1560,2002.
Heiden, A. C., Kobel, K., Komenda, M., Koppmann, R., Shao, M.,and Wildt, J.: Toluene emissions from plants, Geophys. Res.Lett., 26, 1283–1286, 1999.
Helmig, D., Klinger, L. F., Guenther, A., Vierling, L., Geron, C.,and Zimmerman, P.: Biogenic volatile organic compound emis-sions (BVOCs) I. Identifications from three continental sites inthe US, Chemosphere, 38, 2163–2187, 1998.
Hewitt, C. N., Hayward, S., and Tani, A.: The application of protontransfer reaction-mass spectrometry (PTR-MS) to the monitoringand analysis of volatile organic compounds in the atmosphere, J.Environ. Monit., 5, 1–7, 2003.
Atmos. Meas. Tech., 3, 959–980, 2010 www.atmos-meas-tech.net/3/959/2010/

J. L. Ambrose et al.: A comparison of GC-FID and PTR-MS toluene measurements in ambient air 979
Holzinger, R., Sandoval-Soto, L., Rottenberger, S., Crutzen, P. J.,and Kesselmeier, J.: Emissions of volatile organic compoundsfrom Quercus ilexL. measured by Proton Transfer ReactionMass Spectrometry under different environmental conditions, J.Geophys. Res., 105, 20573–20579, 2000.
Hurley, M. D., Sokolov, O., Wallington, T. J., Takekawa, H., Kara-sawa, M., Koltz, B., Barnes, I., and Becker, K. H.: Organicaerosol formation during the atmospheric degradation of toluene,Environ. Sci. Technol., 35, 1358–1366, 2001.
Justice, D., Deely, A. K., and Rubin, F.: New Hampshire LandCover Assessment: Final Report, Complex Systems ResearchCenter, University of New Hampshire, Durham, NH, Rep.,42pp., 2002.
Karl, T., Apel, E., Hodzic, A., Riemer, D. D., Blake, D. R., andWiedinmyer, C.: Emissions of volatile organic compounds in-ferred from airborne flux measurements over a megacity, Atmos.Chem. Phys., 9, 271–285, doi:10.5194/acp-9-271-2009, 2009.
Kato, S., Miyakawa, Y., Kaneko, T., and Kajii, Y.: Urban air mea-surements using PTR-MS in Tokyo area and comparison withGC-FID measurements, Int. J. Mass Spectrom., 235, 103–110,2004.
Keck, L., Oeh, U., and Hoeschen, C.: Corrected equation for theconcentrations in the drift tube of a proton transfer reaction-massspectrometer (PTR-MS), Int. J. Mass Spectrom., 264, 92–95,2007.
Kuster, W. C., Jobson, B. T., Karl, T., Riemer, D., Apel, E., Goldan,P. D., and Fehsenfeld, F. C.: Intercomparison of volatile organiccarbon measurement techniques and data at La Porte during Tex-AQS2000 Air Quality Study, Environ. Sci. Technol., 38, 221–228, 2004.
Lee, A., Goldstein, A. H., Keywood, M. D., Gao, S., Varut-bangkul, V., Bahreini, R., Ng., N. L., Flagan, R. C., and Se-infeld, J. H.: Gas-phase products and secondary aerosol yieldsfrom the ozonolysis of ten different terpenes, J. Geophys. Res.,111, D07302, doi:10.1029/2005JD006437, 2006a.
Lee, A., Goldstein, A. H., Kroll, J. H., Ng, N. L., Varut-bangkul, V., Flagan, R. C., and Seinfeld, J. H.: Gas-phaseproducts and secondary aerosol yields from the photooxida-tion of 16 different terpenes, J. Geophys. Res., 111, D17305,doi:10.1029/2006JD007050, 2006b.
Lide, D. R.: CRC Handbook of Chemistry and Physics, 88th ed.,CRC Press, Boca Raton, FL, USA, 2008.
Liggio, J. and Li, S.-M.: Reactive uptake of pinonalde-hyde on acidic aerosols, J. Geophys. Res., 111, D24303,doi:10.1029/2005JD006978, 2006.
Lindinger, W., Hansel, A., and Jordan, A.: On-line monitoring ofvolatile organic compounds at pptv levels by means of proton-transfer-reaction mass spectrometry (PTR-MS) – Medical appli-cations, food control and environmental research, Int. J. MassSpectrom., 173, 191–241, 1998a.
Lindinger, W., Hansel, H., and Jordan, A.: Proton-transfer-reactionmass spectrometry (PTR-MS): on-line monitoring of volatile or-ganic compounds at pptv levels, Chem. Soc. Rev., 27, 347–354,1998b.
Maleknia, S. D., Bell, T. L., and Adams, M. A.: PTR-MS analysisof reference and plant-emitted volatile organic compounds, Int.J. Mass Spectrom., 262, 203–210, 2007.
McFarland, M., Albritton, D. L., Fehsenfeld, F. C., Ferguson, E. E.,and Schmeltekopf, A. L.: Flow-drift technique for ion mobility
and ion-molecule reaction rate constant measurements. II. Posi-tive ion reactions of N+, O+, and N+
2 with O2 and O+ with N2from thermal to∼2 eV, J. Chem. Phys., 59, 6620–6628, 1973.
Ollinger, S. V., Aber, J. D., and Federer, C. A.: Estimating regionalforest productivity and water yield using an ecosystem modellinked to a GIS, Landscape Ecol., 13, 323–334, 1998.
Parrish, D. D., Stohl, A., Forster, C., Atlas, E. L., Blake, D. R.,Goldan, P. D., Kuster, W. C., and de Gouw, J. A.: Effects of mix-ing on evolution of hydrocarbon ratios in the troposphere, J. Geo-phys. Res., 112, D10S34, doi:10.1029/2006JD007583, 2007.
Pinho, P. G., Pio, C. A., Carter, W. P. L., and Jenkin, M. E.: Evalua-tion of α- andβ-pinene degradation in the detailed troposphericchemistry mechanism, MCM v3.1, using environmental chamberdata, J. Atmos. Chem., 57, 171–202, 2007.
Reissell, A., Aschmann, S. M., Atkinson, R., and Arey, J.:Products of the OH radical- and O3-initiated reactions withmyrcene and ocimene, J. Geophys. Res., 107, D12, 4138,10.1029/2001JD001234, 2002.
Rinne, J., Ruuskanen, R. M., Reissell, A., Taipale, R., Hakola,H., and Kulmala, M.: On-line PTR-MS measurements of atmo-spheric concentrations of volatile organic compounds in a Euro-pean boreal forest ecosystem, Boreal Environ. Res., 10, 425–436,2005.
Roberts, J. M., Fehsenfeld, F. C., Liu, S. C., Bollinger, M. J., Hahn,C., Albritton, D. L., and Sievers, R. E.: Measurements of aro-matic hydrocarbon ratios and NOx concentrations in the ruraltroposphere: Estimates of air mass photochemical age and NOxremoval rate, Atmos. Environ., 18, 2421–2432, 1984.
Roberts, J. M., Hahn, C. J., Fehsenfeld, F. C., Warnock, J. M.,Albritton, D. L., and Sievers, R. E.: Monoterpene hydrocarbonsin the nighttime troposphere, Environ. Sci. Tech., 19, 364–369,1985.
Rogers, T. M., Grimsrud, E. P., Herndon, S. C., Jayne, J. T., Kolb,C. E., Allwine, E., Westberg, H., Lamb, B. K., Zavala, M.,Molina, L. T., Molina, M. J., and Knighton, W. B.: On-roadmeasurements of volatile organic compounds in the Mexico Citymetropolitan area using proton transfer reaction mass spectrom-etry, Int. J. Mass. Spectrom., 252, 26–37, 2006.
Rohrer, F. and Berresheim, H.: Strong correlation between levelsof tropospheric hydroxyl radicals and solar ultraviolet radiation,Nature, 442, 184–187, 2006.
Russo, R. S., Zhou, Y., White, M. L., Mao, H., Talbot, R., andSive, B. C.: Multi-year (2004–2008) record of nonmethane hy-drocarbons and halocarbons in New England: seasonal varia-tions and regional sources, Atmos. Chem. Phys., 10, 4909–4929,doi:10.5194/acp-10-4909-2010, 2010.
Schauer, J. J., Kleeman, M. J., Cass, G. R., and Simoneit, B. R.T.: Measurement of emissions from air pollution sources. 5. C1-C32 organic compounds from gasoline-powered motor vehicles,Environ. Sci. Technol., 36, 1169–1180, 2002.
Schoon, N., Amelynck, C., Vereecken, L., and Arijs, E.: A selectedion flow tube study of the reactions of H3O+, NO+ and O+
2 witha series of monoterpenes, Int. J. Mass Spectrom., 229, 231–240,2003.
Schoon, N, Amelynck, C., Vereecken, L., Coeckelberghs, H., andArijs, E.: A selected ion flow tube study of the reactions ofH3O+, NO+ and O+
2 with some monoterpene oxidation prod-ucts, Int. J. Mass Spectrom., 239, 7–16, 2004.
Singh, H. B. and Zimmerman, P. B.: Atmospheric distribution and
www.atmos-meas-tech.net/3/959/2010/ Atmos. Meas. Tech., 3, 959–980, 2010

980 J. L. Ambrose et al.: A comparison of GC-FID and PTR-MS toluene measurements in ambient air
sources of nonmethane hydrocarbons, in: Gaseous Pollutants:Characterization and Cycling, John Wiley & Sons, Inc., NewYork, NY, USA, 177–235, 1992.
Sive, B. C.: Atmospheric nonmethane hydrocarbons: Analyticalmethods and estimated hydroxyl radical concentrations, Univer-sity of California, Irvine, Irvine, Ph.D. thesis, 1998.
Sive, B. C., Zhou, Y., Troop, D., Li, Y., Little, W., Wingenter, O.W., Russo, R. S., Varner, R. K., and Talbot, R. W.: Develop-ment of a cryogen-free concentration system for measurementsof volatile organic compounds, Anal. Chem., 77, 6989–6998,doi:10.1021/ac0506231, 2005.
Smith, D. andSpanel, P.: Selected Ion Flow Tube Mass Spectrom-etry (SIFT-MS) for on-line trace gas analysis, Mass Spectrom.Rev., 24, 661–700, 2005.
Spanl, P. and Smith, D.: Selected ion flow tube studies of thereactions of H3O+, NO+, and O+
2 with several aromatic andaliphatic hydrocarbons, Int. J. Mass Spectrom., 181, 1–10, 1998.
Steeghs, M., Bais, H. P., de Gouw, J., Goldan, P., Kuster, W., North-way, M., Fall, R., and Vivanco, J. M.: Proton-transfer-reactionmass spectrometry as a new tool for real time analysis of root-secreted volatile organic compounds in Arabidopsis, Plant. Phys-iol., 135, 47–58, 2004.
Talbot, R., Mao, H., and Sive, B. C.: Diurnal characteristics of sur-face level O3 and other important trace gases in New England, J.Geophys. Res., 110, D09307, doi:10.1029/2004JD005449, 2005.
Tan, C. Y. and Iglewicz, B.: Measurement-methods comparisonsand linear statistical relationship, Technometrics, 41, 192–201,1999.
Tani, A., Hayward, S., and Hewitt, C. N.: Measurement of monoter-penes and related compounds by proton transfer reaction-massspectrometry (PTR-MS), Int. J. Mass Spectrom., 223/224, 561–578, 2003.
Tani, A., Hayward, S., Hansel, A., and Hewitt, C. N.: Effect ofwater vapor pressure on monoterpene measurements using pro-ton transfer reaction-mass spectrometry (PTR-MS), Int. J. Mass.Spectrom., 239, 161–169, 2004.
Warneke, C., de Gouw, J., Kuster, W. C., Goldan, P. D.,and Fall, R.: Validation of atmospheric VOC measurementsby proton-transfer-reaction mass spectrometry using a gas-chromatographic preseparation method, Environ. Sci. Technol.,37, 2494–2501, 2003.
Warneke, C., McKeen, S. A., de Gouw, J. A., Goldan, P. D.,Kuster, W. C., Holloway, J. S., Williams, E. J., Lerner, B. M.,Parrish, D. D., Trainer, M., Fehsenfeld, F. C., Kato, S., At-las, E. L., Baker, A., and Blank, D. R.: Determination of ur-ban volatile organic compound emission ratios and comparisonwith an emissions database, J. Geophys. Res., 112, D10S47,doi:10.1029/2006JD007930, 2007.
Warneke, C., van der Veen, C., Luxembourg, S., de Gouw, J. A.,and Kok, A.: Measurements of benzene and toluene in ambi-ent air using proton-transfer-reaction mass spectrometry: cali-bration, humidity dependence, and field intercomparison, Int. J.Mass. Spectrom., 207, 167–182, 2001.
White, M. L., Russo, R. S., Zhou, Y., Ambrose, J. L., Haase, K.,Frinak, E. K., Varner, R. K., Wingenter, O. W., Mao, H., Talbot,R., and Sive, B. C.: Are biogenic emissions a significant sourceof summertime atmospheric toluene in the rural NortheasternUnited States?, Atmos. Chem. Phys., 9, 81–92, doi:10.5194/acp-9-81-2009, 2009.
White, M. L., Russo, R. S., Zhou, Y., Mao, H., Varner, R. K., Am-brose, J., Veres, P., Wingenter, O. W., Haase, K., Stutz, J., Tal-bot, R., and Sive, B. C.: Volatile organic compounds in north-ern New England marine and continental environments duringthe ICARTT 2004 campaign, J. Geophys. Res., 113, D08S90,doi:10.1029/2007JD009161, 2008.
Wyche, K. P., Blake, R. S., Willis, K. A., Monks, P. S., and Ellis, A.M.: Differentiation of isobaric compounds using chemical ion-ization reaction mass spectrometry, Rapid Commun. Mass Spec-trom., 19, 3356–3362, 2005.
Zhao, J. and Zhang, R.: Proton transfer reaction rate constants be-tween hydronium ion (H3O+) and volatile organic compounds,Atmos. Environ., 38, 2177–2185, 2004.
Zhou, Y., Varner, R. K., Russo, R. S., Wingenter, O. W., Haase,K. B., Talbot, R., and Sive, B. C.: Coastal water source ofshort-lived halocarbons in New England, J. Geophys. Res., 110,D21302, doi:10.1029/2004JD005603, 2005.
Atmos. Meas. Tech., 3, 959–980, 2010 www.atmos-meas-tech.net/3/959/2010/