a comparison of ionic 2 versus react native and android in terms...
TRANSCRIPT

Linköping University | IDA Master Thesis | Computer Science
Spring2017 | LIU-IDA/LITH-EX-A--18/005--SE
A comparison of Ionic 2 versus React Native and Android in terms of performance, by comparing the performance of applications
Filip Asp
Handledare/Tutor, Arunkumar Palanisamy, Oskar Karlsson Examinator, Kristian Sandahl

硕士学位论文
Dissertation for Master’s Degree
(工程硕士)
(Master of Engineering)
通过不同应用程序的性能比较 Ionic 2与
React Native和 Android的性能
A comparison of Ionic 2 versus React Native and
Android in terms of performance, by comparing the
performance of applications
艾飞鹏
2017年 9月
Linköping University
UnUniversity

Upphovsrätt
Detta dokument hålls tillgängligt på Internet – eller dess framtida ersättare – under 25 år från
publiceringsdatum under förutsättning att inga extraordinära omständigheter uppstår.
Tillgång till dokumentet innebär tillstånd för var och en att läsa, ladda ner, skriva ut enstaka
kopior för enskilt bruk och att använda det oförändrat för ickekommersiell forskning och för
undervisning. Överföring av upphovsrätten vid en senare tidpunkt kan inte upphäva detta
tillstånd. All annan användning av dokumentet kräver upphovsmannens medgivande. För att
garantera äktheten, säkerheten och tillgängligheten finns lösningar av teknisk och administrativ
art.
Upphovsmannens ideella rätt innefattar rätt att bli nämnd som upphovsman i den omfattning
som god sed kräver vid användning av dokumentet på ovan beskrivna sätt samt skydd mot att
dokumentet ändras eller presenteras i sådan form eller i sådant sammanhang som är kränkande
för upphovsmannens litterära eller konstnärliga anseende eller egenart.
För ytterligare information om Linköping University Electronic Press se förlagets hemsida
http://www.ep.liu.se/.
Copyright
The publishers will keep this document online on the Internet – or its possible replacement – for
a period of 25 years starting from the date of publication barring exceptional circumstances.
The online availability of the document implies permanent permission for anyone to read, to
download, or to print out single copies for his/hers own use and to use it unchanged for non-
commercial research and educational purpose. Subsequent transfers of copyright cannot revoke
this permission. All other uses of the document are conditional upon the consent of the copyright
owner. The publisher has taken technical and administrative measures to assure authenticity,
security and accessibility.
According to intellectual property law the author has the right to be mentioned when his/her
work is accessed as described above and to be protected against infringement.
For additional information about the Linköping University Electronic Press and its procedures
for publication and for assurance of document integrity, please refer to its www home page:
http://www.ep.liu.se/.
© Filip Asp

Classified Index: TP311 U.D.C: 681
Dissertation for the Master’s Degree in Engineering
A comparison of Ionic 2 Versus React Native and
Android in terms of performance, by comparing the
performance of applications
Candidate: Filip Asp
Supervisor: Yang Xiaozong, Professor
Associate Supervisor: Kristian Sandahl, Professor
Industrial Supervisor: Oskar Karlsson, Developer
Academic Degree Applied for: Master of Engineering
Speciality: Software Engineering
Affiliation: School of Software
Date of Defence: September, 2017
Degree-Conferring-Institution: Harbin Institute of Technology

Thesis for Master’s Degree at HIT and LiU
I
摘 要
现今几乎人人都有一台智能手机,随着越来越多的人使用智能手机,越来越
多的手机应用被开发出来。每种智能手机操作系统都有其自己的应用程序库,直
到几年前,开发商还不得不为每个操作系统开发单独应用程序以覆盖整个市场。
但现如今出现了一些跨平台框架,这些框架使开发人员能够用一份代码实现所有
的操作系统上的应用程序。能够用一套代码适用于所有操作系统使得应用程序变
得更加易于维护和演进。本论文探讨了两个跨平台开发框架 React Native 和 Ionic,
目的是为了评估 Ionic 2 是否在性能方面有资格成为跨平台框架。为了评估,本
论文用 Ionic 2 重写了一个基于 React Native 的程序,然后使用 AndroidViewClient
和 Trepn 分析器重点评估了两个应用程序的性能。 AndriodViewClient 被用来为
程序做自动化测试,该程序在 Android 设备的操作系统之外运行,可以用来控制
设备的 GUI。CPU 负载,内存使用量,电池电量使用情况,应用程序的大小以及
Android 软件包的大小被选用作为评估分析的指标。 Trepn 分析器是安装在设备
上的应用程序,它可以监测的硬件的使用情况,所以被用于测量 CPU 负载,内
存使用量及电池电量使用情况。结论是,原生 Android 应用程序在性能方面优于
React Native 和 Ionic 2,而 React Native 具有比 Ionic 2 更好的性能,尤其是在刚
启动应用程序时。除了启动时的区别,其他方面差异不大。因此,除非开发人员
想要开发一个资源利用率非常高效的应用程序,否则 Ionic 2 是可以胜任作为一
个跨平台开发工具的。
关键词:Ionic,React Native,Android,性能,Angular

Thesis for Master’s Degree at HIT and LiU
II
Abstract
Nowadays almost everyone has a smart phone. In addition, as more people use
smart phones more applications are being developed for smart phones. Each operating
system on the smart phone market has its own applications. Up until a few years ago,
developers had to develop an exclusive application for each operating system in order
to cover the whole market. A number of cross-platform frameworks have emerged.
These frameworks enable developers to use one code base for every operating system.
To be able to use most of the code for all platforms makes it easier to maintain and
evolve the application. Two of the frameworks that allow cross-platform development
are React Native and Ionic. The purpose and goal of the thesis is to evaluate if Ionic 2
is eligible to use as a cross-platform framework in terms of performance. The method
used to achieve the goal is based on replication. An application made in React Native
is replicated by using Ionic 2. The applications are then evaluated with focus on
performance. The applications are evaluated using AndroidViewClient and Trepn
profiler. AndriodViewClient is run outside of the OS of the Android device and can
control the GUI of a device. AndroidViewClient is used to automate the tests. The
metrics used for evaluating the performance are CPU load, memory usage, battery
power usage, the size of the application and the size of the Android package kit. Trepn
profiler is an application that is installed on the device. Trepn profiler has access to
the hardware of the device and is therefore used to measure the first three mentioned
metrics.
Keywords: Ionic; React Native; Android; Performance; Angular

Thesis for Master’s Degree at HIT and LiU
III
Acknowledgement
First, I would like to thank Attentec for providing the code needed for this project
to happen. I would like to thank Tomas Vidhall and Niclas Hansson for taking their
time to answer various questions about the original codebase every now and then. A
big thanks goes to my friends Zhiming Gao, Jiaqi Qin, Yidan Zhao, Lixiang Dong who
have aided me in numerous encounters with the Chinese language. I would also like to
thank my supervisor Yang Xiaozong who has always showed great interest in my work
even before I had an idea about what this project would be myself. I have also had the
privilege to receive invaluable advice from Kristian Sandahl throughout this thesis.
I would like to thank Tea who has helped me with countless of problems and I
hope she does not work as much as it seems, since she seems to work at al l hours of
the day. A shout out to Nina and to Mrs. Zhao Jian who both have helped me a lot,
especially during my stay in Harbin. I would also like to thank everybody involved in
setting up this Double Degree program between HIT and Liu.
I cannot express big enough gratitude to my supervisor at Valtech, Oskar Karlsson.
He has provided me with invaluable knowledge and advice, I am positive that without
him this project would not have been finished.
Finally yet importantly I would like to say that I am a great believer of the words
“A single person can achieve great things but together people can accomplish the
impossible”. By those words, I would like to thank all my classmates who have
supported and helped me in numerous ways during these five years.
Thesis for Master’s Degree at HIT and LiU
IV
Glossary
ADB Android Debug Bridge is a command-line tool that makes it possible for the
computer to communicate with an Android device. ADB is a client-server
program that include a client, a daemon and a server. The client is run on the
development machine. The client sends commands and can be invoked from a
command-line terminal. The daemon runs commands on a device. The server
runs on the development machine, it manages communication between the
client and the daemon.
AJAX Asynchronous JavaScript And XML is a set of techniques used for web
development by using different web technologies to create asynchronous web
applications. By using AJAX, web applications can send and receive data
asynchronously with the server without interference of the current page by the
actions.
API Application Programming Interface is a specification of how software systems
should communicate with each other. An example of this is how data in a
database should be accessed.
APK Android Package Kit is the file format for the packaged application used by
the Android operating system. The package can be used for installation and
distribution of the application.
ART Android Runtime is an application runtime environment that is used by the
operating system Android. ART replaces Dalvik which was the virtual
machine earlier used by Android.
CLI Command-Line Interface also known as console user interface. It is a means
of communicating with a software program where the client issues commands
to the software program through command lines. The program that handles the
interface is called a command shell.

Thesis for Master’s Degree at HIT and LiU
V
CPU Central Processing Unit is an electronic circuitry within a device. The
circuitry carries out the instructions of a program by performing logical,
control, arithmetic and input/output operations.
DOM Document Object Model is a cross-platform, language-independent
programming interface that handles an XHTML, XML or HTML document as
a tree structure. In the tree structure, each node represents an object, which in
turn represents a part of the document.
FPS Frames Per Second is the frequency of how many images are displayed in an
animated display per second.
GUI/UI Graphical User Interface/User Interface. As the name suggests it is an
interface for a user to interact with an electronic device. When only
mentioning UI the way to interact with the device is through a command line.
While interacting through a GUI enables the user to click different buttons and
icons.
HTML Hyper Text Markup Language. It is the standard markup language for creating
web pages. Web browsers such as Google Chrome, Safari, Mozilla Firefox etc.
receive HTML documents from a server, which are then rendered into web
pages. HTML describes the appearance of the document.
IDE Integrated Development Environment. A software program that provides
assisting facilities for software developers. Generally, IDE contains a source
code editor with code completion and build automation tools. IDEs often
contain several other tools that eases development.
JSON JavaScript Object Notation is an open-standard file format that uses common
readable text for transmitting data objects e.g. values or arrays. It is often used
for communicating asynchronously between a server and an application. It can
replace the XML format in AJAX systems.

Thesis for Master’s Degree at HIT and LiU
VI
JSX JavaScript Xml is a syntax extension to JavaScript. It is recommended to use
when developing in React. It has some similarities with template languages
but has all the same functions as JavaScript.
OS Operating System is the system software, which manages the hardware
components and software resources as well as provides common services for
other software.
REST Representational State Transfer also known as RESTful, are services, which
provide interoperability between computer systems on the internet. Web
services that use REST allow systems to request access to and manipulate text
and textual representations of resources within the service. The manipulation
is made possible through a uniform and predefined set of stateless operations.
SCSS Sass Cascading Style Sheets. Sass is an extension of the css, one of the features
of the extension is that it allows classes and variables. Scss is compiled down
to css code. Css is a language that handles the styling of HTML objects.
SDK Software Development Kit is a set of development tools that enables
development of applications for specified software. It is used to extend
applications with advanced functionalities as well as make it easier for
developers to develop applications for the intended software.
USB Universal Serial Bus is a standard for cable connectors as well as protocols
for how power supply and communication shall be handled between electronic
devices and computers.
XML Extensible Markup Language is a markup language that define rules for
different encoding documents in order to make them readable for humans and
machines.

Thesis for Master’s Degree at HIT and LiU
VII
目 录
摘 要 ................................................................................................................... I
ABSTRACT .......................................................................................................... II
ACKNOWLEDGEMENT ................................................................................... III
GLOSSARY ........................................................................................................IV
CHAPTER 1 INTRODUCTION ........................................................................... 1
1.1 BACKGROUND ............................................................................................... 1
1.1.1 Attentec ................................................................................................. 2
1.1.2 Valtech .................................................................................................. 2
1.2 THE PURPOSE OF THE PROJECT ...................................................................... 2
1.3 THE STATUS OF RELATED RESEARCH ............................................................. 3
1.3.1 Effects on performance and usability for cross-platform application
development using React Native ........................................................................... 3
1.3.2 React Native application development – A comparison between native
Android and React Native ...................................................................................... 4
1.3.3 Evaluation of cross-platform development for mobile devices ............ 6
1.3.4 Evaluating Application Scenarios with React Native .......................... 7
1.3.5 Comparing performance parameters of mobile app development
strategies 7
1.3.6 An empirical analysis of energy consumption of cross-platform
frameworks for mobile development ..................................................................... 8
1.4 MAIN CONTENT AND ORGANIZATION OF THE THESIS ..................................... 9
1.5 METHOD ..................................................................................................... 10
1.5.1 Literature study ................................................................................... 11
1.5.2 Code analysis and requirement elicitation .......................................... 13
1.5.3 Application development .................................................................... 14
1.5.4 User tests ............................................................................................. 15
1.5.5 Performance testing ............................................................................ 17

Thesis for Master’s Degree at HIT and LiU
VIII
1.6 DELIMITATIONS .......................................................................................... 18
CHAPTER 2 ARCHITECTURE AND FUNCTIONALITY OF CROSS-
PLATFORM FRAMEWORKS ................................................................................... 20
2.1 CROSS-PLATFORM APPLICATIONS ............................................................... 20
2.1.1 Generated cross-platform or cross-compiled frameworks.................. 20
2.1.2 Interpreted crossplatform frameworks ................................................ 20
2.1.3 Hybrid HTML5 cross-platform frameworks ...................................... 21
2.1.4 Web applications................................................................................. 21
2.2 ANDROID .................................................................................................... 21
2.2.1 The operating system .......................................................................... 22
2.3 REACT NATIVE............................................................................................ 25
2.3.1 React ................................................................................................... 25
2.3.2 Virtual DOM and bridge ..................................................................... 26
2.4 IONIC 2 ........................................................................................................ 27
2.4.1 UI components and API documentation ............................................. 28
2.5 ANGULAR 2 ................................................................................................. 29
2.6 CORDOVA ................................................................................................... 33
2.7 BRIEF SUMMARY ......................................................................................... 35
CHAPTER 3 SYSTEM REQUIREMENT ANALYSIS ...................................... 37
3.1 THE GOAL OF THE SYSTEM .......................................................................... 37
3.2 THE FUNCTIONAL REQUIREMENTS ............................................................... 39
3.3 THE NON-FUNCTIONAL REQUIREMENTS ....................................................... 40
3.4 BRIEF SUMMARY ......................................................................................... 41
CHAPTER 4 SYSTEM DESIGN ........................................................................ 42
4.1 ARCHITECTURE OF THE SYSTEM .................................................................. 42
4.2 DESIGN AND TEMPLATE OF THE APPLICATION ............................................. 43
4.3 BRIEF SUMMARY ......................................................................................... 49
CHAPTER 5 SYSTEM IMPLEMENTATION AND TESTING ........................ 51
5.1 THE ENVIRONMENT OF SYSTEM IMPLEMENTATION ...................................... 51
5.1.1 Technical condition ............................................................................ 51
5.1.2 Test and evaluation conditions ........................................................... 51

Thesis for Master’s Degree at HIT and LiU
IX
5.2 KEY PROGRAM FLOW CHARTS ..................................................................... 52
5.2.1 Class diagram ...................................................................................... 52
5.2.3 Flow charts .......................................................................................... 54
5.3 KEY INTERFACES OF THE SOFTWARE SYSTEM ............................................. 58
5.3.1 GUI ..................................................................................................... 59
5.3.2 RESTful API in back end ................................................................... 64
5.4 SYSTEM TESTING ........................................................................................ 66
5.5 BRIEF SUMMARY ......................................................................................... 68
CHAPTER 6 PERFORMANCE EVALUATION ............................................... 70
6.1 CPU LOAD .................................................................................................. 70
6.2 MEMORY USAGE ......................................................................................... 71
6.3 BATTERY POWER USAGE ............................................................................. 72
6.4 APPLICATION SIZE AND APK SIZE ............................................................... 73
CHAPTER 7 DISCUSSION ................................................................................ 75
7.1 RESULT DISCUSSION ................................................................................... 75
7.1.1 User tests ............................................................................................. 75
7.1.2 Performance evaluation ...................................................................... 76
7.2 METHOD DISCUSSION ................................................................................. 77
7.3 WORK IN A WIDER CONTEXT ....................................................................... 79
7.3.1 Ethical ................................................................................................. 79
7.3.2 Sustainability ...................................................................................... 79
7.4 FUTURE WORK ............................................................................................ 79
CONCLUSION .................................................................................................... 81
REFERENCES .................................................................................................... 82
STATEMENT OF ORIGINALITY AND LETTER OF AUTHORIZATION .... 87
APPENDIX A ...................................................................................................... 88
CODE FOR THE TEST SCENARIOS ........................................................................ 88
APPENDIX B ...................................................................................................... 94
FORM USED IN THE USER TESTS ......................................................................... 94
APPENDIX C ...................................................................................................... 97

Thesis for Master’s Degree at HIT and LiU
X
CPU LOAD ........................................................................................................ 97
Scenario 1..................................................................................................... 97
Scenario 2..................................................................................................... 99
Scenario 3................................................................................................... 101
Scenario 4................................................................................................... 103
Scenario 5................................................................................................... 105
MEMORY USAGE ............................................................................................. 106
Scenario 1................................................................................................... 107
Scenario 2................................................................................................... 109
Scenario 3................................................................................................... 111
Scenario 4................................................................................................... 113
Scenario 5................................................................................................... 115
BATTERY POWER USAGE ................................................................................. 116
Scenario 1................................................................................................... 117
Scenario 2................................................................................................... 119
Scenario 3................................................................................................... 121
Scenario 4................................................................................................... 123
Scenario 5................................................................................................... 125
APPENDIX D .................................................................................................... 127
HOME PAGE TYPESCRIPT ................................................................................ 127
SERVICES IN TYPESCRIPT ............................................................................... 129
SLIDE AND SEGMENT INTERFACE IN TYPESCRIPT ............................................ 131
ACCORDION .................................................................................................... 132

Thesis for Master’s Degree at HIT and LiU
1
Chapter 1 Introduction
This Chapter will give the reader an idea of the content presented in this report. It
will explain why the subject of cross-platform frameworks are interesting. It will also
describe what goals are the thesis is trying to achieve and the method used to achieving
them.
1.1 Background
Nowadays almost every person in Sweden uses a smartphone [1] and while the
amount of people who use smartphones increase so does the amount of applications
available for the smartphones. Not only does the amount of people who use
smartphones increase but the different areas of what you can use the smartphone for
also increases. In the beginning, you could not do much more than call, use Short
Message Service (SMS) and use it for mail. Now the area of usage has exploded, you
can use your smartphone to pay your bills, send money to your friends, keep various
types of tickets like train and bus tickets, send for a driver, use it for social media, read
the newspaper, play advanced video games, practice languages and the list goes on.
Most of these new areas of usage are enabled to the user through mobile applications.
Different companies develop these applications to satisfy the needs that the user has.
There are three big platforms dominating the market of operating system for
smartphones, they are Android, iOS and Windows phone [2]. When a company
develops an application, they want to develop it to all the platforms simultaneously.
This is because if the company only releases the application to one of the platforms,
technically they do not own the similar application for the other platforms, which
means that anyone could make the exact same application but for another platform.
Companies want their application to be used by as many people as possible therefore
companies develop mobile applications to all three platforms, but when developing an
application to all platforms they must develop a separate application to each platform.
This is both time and resource consuming. If, however the company could use the same
code base for the different operating systems the company could save both time and
resources. It would also ease the process of maintaining and evolving the application
for all the platforms.

Thesis for Master’s Degree at HIT and LiU
2
1.1.1 Attentec
Attentec provided the code used for replication. Attentec is a consulting firm,
which helps their customers with software development and IT solutions. Attenec is
siuated in Linköping and it specializes in web technologies but they also work with
mobile development. Attentec benefit from knowing which frameworks are best suited
for different types of situations.
1.1.2 Valtech
The work performed in this project was done with the help of Valtech. Valtech is
a consulting firm that is situated in Stockholm and just like Attentec help their
customers with software development and IT solutions. Valtech specializes in web
technologies and mobile development. Both Attentec and Valtech can benefit from
knowing which frameworks perform best in different scenarios. As mentioned in 1.1
Background a cross-platform framework can lower the resources needed for
developing an application to more platforms. This can give both companies an edge
when negotiating new contracts with customers.
1.2 The purpose of the project
As described in 1.1 Background, there are more mobile applications being
developed every day, if companies can develop mobile applications using less time
and resources they gladly would. Companies always want to ease the process of
manufacturing. However, some companies would rather not cut resources or time from
manufacturing if it would be at the cost of the quality of the product [3].
In the world of mobile applications, quality can sometimes be measured in user
experience. Many aspects of user experience are often very subjective and therefore
more difficult to measure. A quality factor that can affect the user experience but is
not subjective is the performance.
The purpose of this project is to see if a newly emerged framework called Ionic 2
is eligible to use for developing mobile applications in terms of performance. To find
out if that is the case two questions or issues will be answered.

Thesis for Master’s Degree at HIT and LiU
3
1. What differences are there between Android applications made in React Native
and Android applications made in Ionic 2, in terms of performance?
2. What differences are there between applications made in Ionic 2 and
applications made in Android with native development, in terms of
performance?
1.3 The status of related research
This section will show some research that this project is based on or is directly
affected by.
1.3.1 Effects on performance and usability for cross-platform
application development using React Native
Tomas Vidhall and Niclas Hansson are the authors of “Effects on performance and
usability for cross-platform application development using React Native” [4]. In their
project, four applications were produced in total. Two applications were developed in
React Native which allowed them to use very much of the same code base to produce
one application for Android and one application for iOS. When developing an
application exclusively for an OS it is recommended to use the language and IDE
provided by the organization behind that OS. When developing applications using the
language, SDK and IDE provided by the organization behind the OS, then the
developer would be developing a native application for that OS. One application was
developed natively for iOS and one application was developed natively for Android.
This meant there were two applications for iOS and respectively two applications for
Android. Performance tests were run on all applications. The tests for Android and iOS
were not identical because it was not possible to use exactly the same tools for the
different OS but the tests for each application using the same OS were identical. [4]
The metrics chosen for evaluation were FPS, CPU load, memory usage,
application size and APK size. The tool they used for measuring the FPS and the
memory usage was Systrace [5]. The tools used for measuring the CPU load was ADB
Shell, the ADB shell is a standard tool included in the Android development package
[6]. The CPU tests showed that the average difference of CPU load between the

Thesis for Master’s Degree at HIT and LiU
4
Android applications was 1-3% higher in the application developed in React Native.
There were sample points where the CPU usage spiked in the application developed in
React Native. These points were caused by user input events. The memory usage tests
showed that, similar to the CPU usage the Android application developed in React
Native had higher spikes than the native counterpart did. The application developed in
React Native also had higher mean memory usage similar to that of the CPU usage [4].
The FPS tests surprisingly showed that the Android application developed in React
Native dropped less frames than the native application did. The response time tests did
not show that any framework certainly was faster. There were five different test runs
and the Android application developed in React Native had a lower response time in
three of those cases. The size of the application and the APK made in React Native
were bigger than the natively developed application in Android. The APK size, which
is the size of the file, used to install the application, was 2.4 MB on the natively
developed framework while the size of the React Native APK file was 8.4 MB. The
size of the native application was 13.39 MB while the size of the React Native
application was 23.45 MB. [4]
1.3.2 React Native application development – A comparison between
native Android and React Native
In “React Native application development – A comparison between native Android
and React Native” [7], the author obtained an already existing Native Android
application called Budget Watch. The application was replicated using React Native.
The two applications were then compared using user tests, where the users were asked
if they could tell which application was made in React Native and which application
was made using native code. Some of the users could not tell the difference. The author
made measurements using Trepn profiler [8].
In the project, three scenarios were used when measuring the performance. In the
first test, the applications were run but being idle for 30 seconds. In the second test a
set of actions were performed:
Navigate to budgets
Pressing “Add budget” icon
Saving budget
Pressing “Edit budget” button

Thesis for Master’s Degree at HIT and LiU
5
Deleting budget
In the third test a different set of actions were performed:
Navigate to transactions
Pressing “Add transaction” icon
Open calendar
Open camera
Take picture
Save transaction
The different metrics followed the same pattern during test one for both
applications. During the first test, the average CPU load was 57.60 % for Android and
57.89% for React Native. The average Memory usage was 1607 Megabytes for the
Android application and 1616 Megabytes for the React Native. The average power
consumption for the Android application was 1362 milli watts and the average power
consumption for the React Native application was 1350 milli watts. [7]
In the second test, the CPU load and the memory usage followed the same pattern.
During the second test, the average CPU load for Android was 36.14 % and 41.64 %
for the React Native application. The average memory usage for the Android
application was 1620 MB and the average for React Native was 1672 MB. The average
power consumption had some minor variations by one second or so. The average power
consumption of the Android application was 1749 milli watts and the average of the
React Native was 1803 milli watts. [7]
All the metrics of the third test followed the same pattern. During the third test, the
average CPU load was 37.88% for the Android application and the average 41.76% for
the React Native application. The average memory usage for the Android application
was 1582 MB and it was 1655 MB for the React Native application. The average power
consumption for the Android application was 1992 milli watts and 1972 milli watts for
the React Native application.
The author concludes that the main reason for the Native Android performing better
than the React Native application is that React Native does not build in ART. React
Native applications are run in an embedded instance of V8, which means that the
applications do not use the same runtime. ART is designed for Android while V8 is

Thesis for Master’s Degree at HIT and LiU
6
designed for running on a variety of systems, which means it is not optimized for
Android in the same way that ART is. [7]
1.3.3 Evaluation of cross-platform development for mobile devices
The author of “Evaluation of cross-platform development for mobile devices” [9],
J. Friberg made a case study of the possibility to use cross-platform frameworks for
application development. The goal of the study was to see which type of cross-platform
methodology was preferred for the vacation booking application the company CGI
used. There are several different types of case studies e.g. exploratory, descriptive,
explanatory or improving [10]. J. Friberg did an exploratory case study.
From the study, he states there are four different types of cross-platform
development i.e. web, hybrid, interpreted and cross-compiled [11]. He states that the
main advantages with web applications are that they do not require an installation and
since they are never installed, they do not need to be updated on the device. The
disadvantages with web applications are that the application cannot be used without an
internet connection and that the application might suffer from bad performance due to
bad internet connection. He further states that the main advantage for hybrid
applications is that hybrid applications can perform native platform features. The main
disadvantage is that the hybrid applications executions are performed in the web
browser and therefore have worse performance than native applications. [11, 12]
He also states that interpreted applications provide the native look and feel well
but when it comes to reusing the code for the GUI on the different platforms, it varies
depending on the interpreters. He also states that applications that are cross-compiled
can deliver all the native features and interact with the devices’ hardware, software
and native GUI components. [11, 12]
Finally, J. Friberg concludes he agrees with Xanthopoulos and Xinogalos, that
there is no solution, which is preferred in all cases. The best solution depends on what
is being developed and each scenario has a preferred methodology. He further
concludes that in his case the best solution was a hybrid applications using Cordova
based Icenium together with jQuery mobile. [9]

Thesis for Master’s Degree at HIT and LiU
7
1.3.4 Evaluating Application Scenarios with React Native
The authors of “Evaluating Application Scenarios with React Native” [13], A.
Lelli and V. Bostrand made an evaluation about whether React Native is viable to use
for development of applications in Android. The purpose of their thesis was to identify
in what situations React Native is an eligible framework for developing applications
instead of developing native applications. They compared the React native application
to the native counterpart, by using different components and activities [13]. The
activities that were compared were List views, Startup Time, Computationally intense
activities, graphical intense activities, application navigation and native feature
support. The authors limited the scope to solely include android devices. It is therefore
difficult to say if their results are true for iOS as well.
In terms of performance, they concluded that computationally intensive tasks
require at least 27 times more time to execute. React Native applications consumed
124% more battery power and required 25% more time to launch compared to the
native counterpart [13]. In contrast to what O. Axelsson and F. Carlstrom states in
“Evaluating Application Scenarios with React Native” [14], A. Lelli and V. Bostrand
states that React Native do perform well when handling animations. In the conclusion
A. Lelli and V. Bostrand state that React Native is a suitable option for developing
applications when the application does not have heavy requirements in terms of
performance [13].
1.3.5 Comparing performance parameters of mobile app development
strategies
The authors of “Comparing performance parameters of mobile app development
strategies” [15], M. Willocx, J. Vossaert and V. Naessens made an evaluation of the
differences between different mobile development strategies. Their goal was to
evaluate the performance parameters related to general application behavior among
cross-platform frameworks. The different frameworks that were compared in the study
were Famo.us, Intel App Framework, Ionic, jQuery Mobile, Mgwt and Sencha Touch
2. The metrics measured in the thesis were response times, CPU usage, memory usage,
size of the application and battery usage. The tool used to measure Response times was
DDMS, the tool used to measure CPU usage was ADB top, the tool used to measure

Thesis for Master’s Degree at HIT and LiU
8
memory usage was ADB dumpsys meminfo and they measured the diskspace with
what was visible on the device [15].
The result received from their test runs showed that cross-platform frameworks of
the same category showed similar behavior, JavaScript frameworks were the most CPU
intensive cross-platform technology and consumed more memory than native
applications. The authors conclude that cross-platform frameworks can substitute
native development of applications. The best-suited framework depends on what the
application should achieve e.g. if there is existing infrastructure. JavaScript
frameworks can convert existing web applications to mobile applications. If the
developers already have extensive skills within certain web technologies, different
JavaScript frameworks allow the developer to make use of his skills. Some frameworks
specialize in certain areas as Unity for example specializes in support for graphical
components and animated graphics, which are often used in games. Some cross-
platform frameworks use the exact same code base for all the platforms, which
sometime results in the framework not being able to access all the native features.
These types of frameworks are not suitable for development of applications with
specific requirements of hardware access. [15]
1.3.6 An empirical analysis of energy consumption of cross-platform
frameworks for mobile development
The authors of “An empirical analysis of energy consumption of cross-platform
frameworks for mobile development” [16], M. Ciman and O. Gaggi made an
evaluation of the energy consumption of different cross-platform frameworks. They
used two android devices and two iOS devices to make the measurements. Samsung
Galaxy Nexus i9250 and Samsung Galaxy S5 were used for the Android platform and
an iPhone 4 and an iPhone 5 for the iOS platform.
The Galaxy Nexusi9250 was equipped with:
Dual-core 1.2 GHz CPU
1 GB RAM
720 × 1280 px display with 16M colors
The Galaxy S5 was equipped with:
Quad-core 2.5 GHz CPU
2 GB RAM
Thesis for Master’s Degree at HIT and LiU
9
1080 × 1920 px display with 16M colors
The iPhone 4 was equipped with:
1 GHz Cortex CPU
512 MB RAM
640 × 960 px display with 16M colors
The iPhone 5 was equipped with:
Dual-core 1.3 GHz CPU
1 GB RAM
640 × 1136 px display with 16M colors
When making the energy consumption measurements they used the tool Monsoon
PowerMonitor [17]. Their goal was to compare the four different types of cross-
platform frameworks. They limited their scope to use one framework from each type
of cross-platform application. The approaches used for the measurements were a web
application for the web approach, Phonegap for the hybrid application, Titanium for
the interpreted application, MoSync using C++ and MoSync using JavaScript for
cross-compiled applications [16].
They state that the cross-compiled frameworks have the least power consumption
among all the cross-platform frameworks. They found that for all the frameworks, the
update of the GUI represented the most expensive task, which also was the main cause
of the increase in energy consumption. Another task they found was expensive in terms
of energy consumption was. The updating frequency of data retrieved by sensors and
their visualization affects the energy consumption. [16]
1.4 Main content and organization of the thesis
The content provided in the thesis aims to help ease the decision making of
development approach for application developers, given a situation. The thesis should
help the developer to choose framework for development by providing information
about differences in performance between Android applications developed using React
Native and Android applications developed using Ionic 2. The thesis is divided into 8
chapters.
Chapter 1 – Introduction: Describes why the topic of cross-platform frameworks
is very much alive now. The chapter also provides recent work that affects the thesis.

Thesis for Master’s Degree at HIT and LiU
10
In the first chapter it is also stated what the thesis aims to achieve and how to achieve
it. When described how the goals should be achieved two issues are presented. This
chapter also describes what the scope is and what limitations there are to the project.
Chapter 2 – Theory: Provides information on the architecture of the different
frameworks.
Chapter 3 – System Requirement Analysis: This chapter provides what the
developed system aims to achieve. The chapter also provides all the functional and
non-functional requirements set for the system.
Chapter 4 – System Design: Describes how the architecture of the system is set
up. Also shows the design of the application developed in React Native.
Chapter 5 – System Implementation and Testing: Describes under what
circumstances the application was developed, also describes under what circumstances
the performance-tests were executed. The chapter also provides a class diagram and
flow charts of the application. In addition, the whole GUI is shown and the API used
to communicate with the back end is described.
Chapter 6 – Results: Provides all the answers received from the user tests. Also
provides all the values gathered from the five scenarios performed during the
performance tests.
Chapter 7 – Discussion: Consists of a discussion concerning the results, what can
be said about them and what is possible to deduct from them. In addition, it contains a
discussion concerning the replicability, reliability and validity of the method. Finally,
it also contains a discussion concerning the references.
Chapter 8 – Conclusion: Provides what is concluded in this the thesis. In the
chapter, it is described what the answers were to the issues presented in chapter 1.
1.5 Method
This section will describe the method used in this project. It shall enable the project
to be replicable, so that if any person desires to recreate this project in another situation,
it should be clear which steps that person should take. At the time of writing there was
not much documented about the performance of Ionic 2. This project is an exploratory
case study. When performing an exploratory case study there are many different
methods available to use in order to arrive at a conclusion. In this project a form of
experiment was used [18].

Thesis for Master’s Degree at HIT and LiU
11
An application was built called “Val-home” using Ionic 2 as framework, the
application was built to resemble an already existing application. The already existing
application called “Atten-home” was developed using React Native and then
implemented in Android. These applications could then be tested using
AndroidViewClient and Trepn profiler. AndriodViewClient is run outside of the OS
of the Android device and can control the GUI of the device through a USB connection
[19]. Trepn profiler is an application that has access to the hardware of the device,
which it is installed on [20]. Five different metrics were measured, each metric can be
considered part of the performance of each applications. The metrics and the
information gathered gave indications to which framework has the best performance.
This exploratory case study is structured into five parts.
Literature study
Code analysis and requirement elicitation
Application development
User tests
Performance testing
1.5.1 Literature study
A literature study was carried out, following the methodology proposed in [21],
this methodology was chosen because it gives a structured plan of how to gather
information and why certain pieces of information were used. The method consists of
six steps, which are:
1. Motivate why this project is done and why it is important. This was done in 1.1
Background.
2. Formulate questions, which are known to be able to answer. This was done in
1.2 The purpose of the project.
3. Make a predefined plan of how the information should be acquired to answer
the questions.
4. Identify and choose which literature to use for gathering the information needed.
The literature can be articles, books, papers and journals or other types of
information but the earlier mentioned are preferred.

Thesis for Master’s Degree at HIT and LiU
12
5. When a sufficient amount of information is gathered, choose which information
would be relevant to include in the project by evaluating the quality of each
piece of information.
6. Analyze and discuss the result, and finally put together and draw conclusions
from the study.
The plan made for finding information needed in this project included using search
words, which are shown in Table 2. The search words were used in specific databases
and Google Scholar. The plan also included searching for information in the
documentation provided by the company or the community behind the different
frameworks that are used in this study. The documentation sites are shown in Table 1.
Table 1: Documentation web sites used in in literature study
Documentation web sites
Android
Cordova
Ionic
Angular
React Native
Table 2: Search terms used in the literature study
Search terms
Android architecture
Android structure
Cordova
Ionic framework cross-platform
Ionic framework cross-platform performance
Ionic framework
Ionic 2
ADB
ADB server
Trepn
Types of mobile cross-platform frameworks
React Native framework
React Native performance

Thesis for Master’s Degree at HIT and LiU
13
React Native architecture
DOM
Performance comparison cross-platform frameworks
Table 3: Databases used in the literaure study
Databases used
Scopus
ACM Digital Library
IEEEXplore
Springer
ScienceDirect
All five of the databases shown in Table 3 are well renowned databases and each
contains scientific papers, journals and articles from conferences. The pieces of
information are gathered from many different countries. Springer, Scopus,
ScienceDirect and ACM Digital Library are databases with articles about different
areas while the IEEEXplore database main areas are electrical engineering, computer
science and electronics.
1.5.2 Code analysis and requirements elicitation
The product owner of the application Atten-home was Attentec. This meant that
there was no access to the code from the start since the project was performed with the
help of Valtech. Contact with a Consultant manager at Attentec was made, who
allowed access to their git repository of the application. The requirements of the
application that was developed all came from Atten-home. The information about the
Atten-home application was gathered through code reviewing, blackbox testing,
interviewing Tomas Vidhall and Niclas Hansson the authors of “Effects on
performance and usability for cross-platform application development using
React Native” [4], as well as information gathered from their paper.
When designing a system, it is important to get an overview of the project in order
to later break it down into smaller tasks. This action is called divide and conquer [22].

Thesis for Master’s Degree at HIT and LiU
14
To perform divide and conquer, use cases were set up and then divided into functional
and non-functional requirements. Functional requirements shall describe what the
system can do. Each functional requirement shall perform a task and later be tested. In
addition, each functional requirement shall specify which actor wants to perform what
task. An example: An admin wants to view the start page. The focus of the project is
the performance evaluation and there is no need to have different actors, because the
original application “Atten-home” only has one type of actor.
Non-functional requirements consist of two categories:
Design constraints
Quality requirements
Design constraints are requirements, which limit the solution space i.e. it can be a
certain programming language that must be used or a certain framework that has to be
used. Quality requirements are requirements that are possible to measure in some way.
It can be that the response time to a server should not be more than 1.0 second.
Alternatively, it can be security requirements, an example; in order to have access to
the web page you must have a valid certificate.
Since the quality was explored in this project, it was not possible to have a usual
amount of non-functional quality requirements concerning the performance. However,
there were non-functional design constraint requirements since most of the
programming languages and frameworks used were already set.
1.5.3 Application development
The Ionic team recommends Visual Studio for development in Ionic 2 [23].
However several IDEs are eligible for developing Ionic 2 applications. In this project,
an IDE called Webstorm made by JetBrains was used. Angular uses node.JS and as
Ionic is built on top of Angular, Ionic 2 uses node.JS. This means that all libraries and
dependencies are fetched using the npm command. Angular uses TypeScript by default
and it was the language used in this project. TypeScript is a superset of JavaScript.
TypeScript is compiled down to JavaScript when running the application.
The system uses a back end, which works as an API for the application in order to
enable the application to interact with a database. The back was 100% reused from the

Thesis for Master’s Degree at HIT and LiU
15
project made in [4]. For most of the components used in Atten-home, there existed a
counter component in Ionic 2, which meant it was possible to implement an application
with similar functionality. However, some of the components used in Atten-home did
not exist in Ionic 2. Atten-home uses slides together with segments, which means that
a user could change slide by dragging the finger across the screen, the user could al so
change slide by pressing a button called segment at the top of the screen. The
components existed separately but the integration with each of them had to be
developed in Val-home. The Atten-home used graphs that did not have an exact
counterpart in Ionic 2. Therefore, a third-party library [24] that was recommended by
Angular was used to make the graphs. The third component that did not exist in Ionic
2 was a component called accordion, it was used to expand and contract the graphs.
The accordion in Val-home had to be developed. A component that acted differently
was the select component. It was used to change the effect on a radiator page. In React
Native a drop down would appear where the different available values would show
while the select component in Ionic 2 shows a pop up with the different available
values.
1.5.4 User tests
In order to validate that the Val-home application resembles the Atten-home
application enough, a user test was made. In the test, the users had to follow a protocol,
which made the users interact with all the parts of the applications. The users followed
the same protocol in both the applications and the users could choose which application
to start with. This was the protocol.
Open the application.
Push the STATISTICS button.
Open and then close both charts.
Push the ROOMS button.
Push one of the rooms in the list.
Push a lamp in the list.
Push the toggle button.
Change the dimmer.
Push the back button.
Push a radiator.

Thesis for Master’s Degree at HIT and LiU
16
Change the effect of the radiator.
Push the STATISTICS button.
Open and then close both charts.
Close the application.
After each user had made the test, he/she was asked to fill out a form. The form
was created by recommendations from [25]. The questions and what each question
aimed to achieve is shown here:
Would you say the two applications perform the exact same tasks?
The applications have to perform the same tasks if they are to be tested in the
same test. Therefore, the user must feel he/she is doing the same thing in both
applications.
Do you feel there is any difference in functionality between the applications?
Try to describe what you felt worked differently between the applications.
The second question was only asked if the person answered yes to the first
question. Since the performance will mostly depend on the two applications
working the same way, this question aim to validate that the applications
perform tasks the same way. The second question aimed to give understanding
if there was a part of the code that needed revision; some mechanisms were not
possible to develop the same way in Ionic 2 as in React Native.
What design differences did you see when performing the test?
Everything was not designed exactly the same, like the color of the text, the
charts did not have the same design. Therefore, there were supposed to be
differences but the question aimed to find out if there were any design
differences that was missed during development.
Did you feel there was any difference in performance between the two
applications?
Describe when and how you felt there was a difference in performance.
The second question was only asked if the user answered yes on the first
question. This question was asked in order to see if the difference in
performance was noticed or not.
The finished form is displayed in Appendix B.

Thesis for Master’s Degree at HIT and LiU
17
1.5.5 Performance testing
The performance tests measured five metrics: memory usage, CPU load,
application size, APK size and battery power usage. Each metric can be associated
with the performance of the application. In order to achieve minimum human error, an
automation tool called AndroidViewClient was used. AndroidViewClient enables the
tester to make a schema of what tasks the application should perform automatically.
AndroidViewClient identifies what is displayed on the screen and can then interact
with the device through the screen. This enables AndroidViewClient to perform tests
automatically as long as the application behaves the same each run. The schema runs
on the computer and controls the device via an ADB server. This makes it possible to
mimic a typical user interaction. While the schemas were run, the five metrics were
measured. The code used to run the automatic tests is displayed in Appendix A.
When developing Android applications natively, Google recommends using
Android Studio as IDE. Android Studio comes bundled with a variety of tools. One of
them is ADB shell command, which enables the AndroidViewClient to control the
device via USB. The CPU load, memory usage and battery power usage were measured
with the tool called Trepn Profiler. Trepn was considered the best tool in an evaluation
of application profilers [20]. The application size was measured using the default
Android settings and the APK file was measured using the properties settings of the
computer that created the files.
When running the performance tests a set of scenarios were used in order to
measure the different metrics when using different parts of the application. The
scenarios are described below:
1. Expand each graph on the home statistics screen. Wait for 5 seconds.
2. Expand each graph on a room screen. Wait for 5 seconds.
3. Expand each graph on a radiator screen. Wait for 5 seconds.
Rendering the graphs was the most demanding in the application and therefore
showed the biggest difference in performance. In each layer, each of the
applications fetch more data from the back end, therefore all the possible
scenarios with graphs were chosen to be part of the test.
4. Select a lamp. Turn off the lamp. Go back to the room screen. Turn the lamp
back on again. Wait for 5 seconds.
A scenario where data was sent to the back end was also needed in order to get

Thesis for Master’s Degree at HIT and LiU
18
coverage. This scenario was the one where the design and functionality did not
differ at all, therefore this scenario was chosen.
5. Start the application.
It was early noticed that the startup time of the applications were different. In
order to have the other scenarios run at equal pace the startup of the application
had to be done in a separate scenario.
In order to know that the gathered results were persistent the tests were made using
two different Android devices. Using only two devices can be seen as a low number
for mapping the performance of an OS but according to [16, 26, 27] two devices are
still sufficient in order to make estimations and models. A Sony Xperia X Performance
and a Samsung Galaxy S7 were used,
Sony Xperia X Performance [28]:
OS: Android 7.1.1
Battery: Non-removable Li-Ion 2700 mAh battery
Wlan: Wi-Fi 802.11 a/b/g/n/ac, dual-band, Wi-Fi Direct, DLNA, hotspot
CPU: Quad-core (2x2.15 GHz Kryo & 2x1.6 GHz Kryo)
Memory: 3 GB RAM
Samsung Galaxy S7 [29]:
OS: Android 7.0.0
Battery: Non-removable Li-Ion 3000 mAh battery
Wlan: Wi-Fi 802.11 a/b/g/n/ac, dual-band, Wi-Fi Direct, hotspot
CPU: Octa-core (4x2.3 GHz Mongoose & 4x1.6 GHz Cortex-A53)
Memory: 4 GB RAM
1.6 Delimitations
It is difficult to evaluate every aspect of two frameworks, Ionic 2 is able to compile
the code to different OS applications and so is React Native. This project will focus on
the comparison between Android applications made in React Native and Ionic 2. With
that said it is not necessarily true that the results found in this report are also true for
other OS. Instead of developing an application in both frameworks, an already
developed application was studied. The application made with React Native had been
developed for the purpose to investigate the user experience as well as the performance

Thesis for Master’s Degree at HIT and LiU
19
of standard usage of an application in react native. This project is focused on simpler
applications since the application being replicated is not very complex and does not
use heavy calculations. The application has several animations and uses AJAX calls
regularly. Since the conclusion in [4] was that React Native was eligible for
development and the application already existed, this project focused more on the
actual performance testing. Ionic 2 is a new framework, therefore there are not that
many reports or articles made about the framework.

Thesis for Master’s Degree at HIT and LiU
20
Chapter 2 Architecture and functionality of cross-
platform frameworks
This Chapter will describe the different types of cross-platform frameworks and
more in detail about the differences in architecture and functionality of the React
Native and Ionic architecture stacks as well. In addition, this chapter will describe how
both frameworks interact with the Android architecture stack.
2.1 Cross-platform applications
As of today, there are four different types of mobile cross-platform frameworks
namely, generated cross-platform, interpreted cross-platform, Hybrid HTML5 cross-
platform and Web frameworks. [12]
2.1.1 Generated cross-platform or cross-compiled frameworks
Generated cross-platform frameworks can use almost any programming language.
The framework has a specific API and use a specific library. These APIs and libraries
are developed specifically for each framework. The API and the library describes how
the application development should work. Then the frameworks use the existing native
APIs in the different SDKs for the different mobile OSs to create native components.
This means that when developing an application using generated cross-platform
frameworks the application actually consists of native components in the end. An
example of this type of framework is Xamarin. [9, 12]
2.1.2 Interpreted crossplatform frameworks
Interpreted cross-platform frameworks generate native components to GUI. This
means that the end user uses native views and components when interacting with the
application. However, the logic and processing part of the application is implemented
with other technologies such as JS, Java or Ruby etc. React Native belongs to this
category of cross-platform frameworks. [9, 12, 28]

Thesis for Master’s Degree at HIT and LiU
21
2.1.3 Hybrid HTML5 cross-platform frameworks
All the major mobile platforms have very advanced web browsers and in those
cases where the application needs to communicate thorough internet the browser will
be used. This enables developers to use the already existing web view in the device to
show the GUI. Which means the developers can use HTML5 to design their application.
This means that in the end, the application is run through the web view of the web
browser. If the application needs access to any hardware components such as GPS or
the camera, the application will need to invoke those components through the SDK
API. Ionic 2 belongs to this category of cross-platform frameworks. [9, 12, 28, 29]
2.1.4 Web applications
Web applications are entirely based on the devices web browser. The application
does now require installation but is used through the web. Web applications are
developed using web technologies, it can be difficult to access device hardware
components from web applications depending on which APIs are accessible. [9, 12]
2.2 Android
This chapter will give some insight in the operating system Android and explain
how applications work. Android.Inc was founded in 2003 and focused initially on
developing an operating system for cameras. The founders realized that the market was
not big enough, so they changed focus and started developing an operating system for
mobile phones instead. Google later bought the company and continued development
of the operating system. Google later started a consortium with many other different
technology and mobile phone manufacturing companies. They named the consortium
Open Handset Alliance (OHA) [32]. The consortium has then released many different
versions of the operating system. The newest major version in this writing moment is
Android Nougat 7 [33].

Thesis for Master’s Degree at HIT and LiU
22
2.2.1 The operating system
In Figure 1 the full architecture stack is shown, as seen in the figure Android is a
Linux based system. In the bottom of the software stack is the Linux kernel, this allows
the Android platform to have built in security features, and the Linux kernel takes care
of multi-threading and low-level memory management. The second layer in the stack
is the Hardware Abstraction Layer (HAL). HAL provides interfaces for the higher Java
API framework. Different library modules build up the interfaces. The library modules
enable information exchange with different types of hardware in the device, such as
camera, Bluetooth antenna, Global Positioning System (GPS) antenna etc. [34]
The third layer consists of two parts namely, Native C/C++ libraries and Android
Runtime. Every device running on an Android version higher or equal to 5.0 will have
a separate instance of ART and process for each app running. ART executes Dalvik
Executable (DEX) files, files designed specifically for Android. The files are designed
in order to be able for ART to run multiple virtual machines. ART has some major
tasks, which are optimizing garbage collection, ahead of time and just in time
compilation and better debugging support. The other parts of the third layer are the
native libraries. There are many components in the Android stack that are built in C
and C++ among them are the earlier mentioned ART and HAL. Therefore, the Android
platform requires these libraries in order to function. Developers can also access these
libraries through Java APIs, in order to reach different functions in the application. [34]

Thesis for Master’s Degree at HIT and LiU
23
Figure 1: Android architecture stack [35]
The fourth layer consists of the Java APIs. These APIs enable a developer to get
access to the different actions stated below:
A view system which can be used in order to build the GUI for an
application
An activity manager which task is to mange the lifecycle of the application
A notification manager which helps the application display messages and
alerts in the status bar
Content providers which enables the application to gather information
from other application
A resource manager that provides a path to use strings, layout files, graphs
etc. in the device
A feature in Android, which OHA considers important, is that all applications have
equal access to everything in the Android platform. No application should be
prioritized over another.

Thesis for Master’s Degree at HIT and LiU
24
The fifth and ultimate layer is the system applications layer. Every Android device
comes equipped with a set of basic applications. These are applications for handling
email, calendar, short message service, internet browsing, camera, contacts etc.
However, as mentioned earlier these applications do not have a higher priority than
any other application the user would like to use. Any application can become the
default application for performing an assignment for the user, with some exceptions.
An example is the system’s settings application. The system applications provide key
functionalities, which developers can access from an application of their own creation.
This means that a third party application that uses email can invoke the email sending
and receiving functionality from the original email application. [34]
Each application in Android needs application components in order to function,
each type has an own purpose and an own lifecycle. These components can be invoked
by other applications as described earlier. There are four different types of application
components.
Activities
Services
Content providers
Broadcast receivers
In the Java API there is a system called the Intent system. The intent system works
as a middle layer between applications. An Intent is a description of an activity or
operation that is desired by the system or an application. Depending on what kind of
intent is sent the intent can start an activity in the same application, broadcast the intent
or communicate with background services or other applications.
Every application is run as its own process. Therefore, an application does not have
the permission to invoke an activity from another application directly. Instead the
application must call the Intent system to tell the system which activity the application
intends to invoke and why. The system will then start the component which was
required in a new process, when the component has performed the task it will send
back the data to the Intent system which in turn will deliver the data to the original
application. If there are more than one application installed in the android device that
has the required component for performing the task, then the Intent system will ask the
user which application’s component should be used to perform the task. [34]

Thesis for Master’s Degree at HIT and LiU
25
2.3 React Native
React Native is owned by Facebook but was released as an open source framework
early during 2015 [36]. In the beginning, React Native only supported application
development for iOS but later the same year the framework included Android support
as well. It is a native scripting framework, which means that the framework uses the
original components that the different native libraries use, this in turn means that it is
possible to develop an application in React Native, which looks and feels as if the
application had been developed in a native language according to [37]. React Native
uses the Android API to communicate with the native features of the Android stack,
which means that React Native cannot use ART as a runtime, since ART resides one
layer below the Android API. React Native uses much of the same core as the React
framework, which is developed by Facebook but has been released as an open source
framework. The difference between the frameworks is that React operates on the DOM
in a web browser, while React Native operates on a mobile application view [35, 36].
React Native has been known for having good performance except when handling
animations [14].
2.3.1 React
React is a framework that was created by Facebook but was released as an open
source framework in 2013. Facebook started developing React because they had
problems with complex interfaces together with data that changed frequently. The
main idea with React is that a function given a value will generate HTML code. If
React were compared to the MVC model, React would provide the V-view part.
However, React can be implemented on the client side and the server side. In order to
make code written in react more readable Facebook developed a JS syntax extension
called JSX. The extension is similar to XML and needs a compiler in order to compile
JSX code down to JS. It is possible to have a third-party compiler to handle the
compiling of JSX, however when installing React a recommended compiler cal led
babel is installed as well. [37]

Thesis for Master’s Degree at HIT and LiU
26
2.3.2 Virtual DOM and bridge
When an application loads a web page, a DOM is created. A DOM represents and
displays the current state of the web page with a tree structure, using HTML elements.
When changes occur within the web application, for example the application receives
data from a database, there are three different options for restructuring and re-
rendering these changes, these options are described below [35, 37].
Send a new HTML request, which will result in re-rendering the entire page.
The entire DOM needs to be re-rendered.
Using client-side HTML templating, this will result in parts of the page will be
re-rendered. Large parts of the DOM need to be re-rendered
Imperative programming of the HTML DOM changes. The least amount of the
DOM needs to be re-rendered.
Since rendering the DOM is expensive in terms of computing power, it is easy to
conclude that imperative programming is the most efficient option. React uses a virtual
DOM, which is a layer between the code and the DOM. React compares the virtual
DOM with the actual DOM and in that way React can instruct the DOM which
components need to be re-rendered within the tree structure. An example of how it
works is shown in Figure 2. React Native uses the same type of behavior but instead
of using the DOM, it invokes Java APIs to render Android views. The framework uses
an interface called the bridge, which enables React to connect with the native host
platform. By using markup for each component, that describes how each component
should look. This is described in Figure 3. [35, 36]
Figure 2: Virtual DOM [36]

Thesis for Master’s Degree at HIT and LiU
27
React Native can communicate with any platform as long as there is an API. In
React Native, there are three threads active. The main thread, the shadow queue and
the JS thread. The main thread handles the rendering of the Native GUI. The JS thread
runs asynchronous from the native GUI and responds to calls made from the main
thread, then runs the scripts and later sends a call back to the Native GUI. If the call
cannot be made it is stored in a message queue. Before sending a call to the main thread,
the JS thread will convert all existing data types to match the native data types. The
shadow queue handles the layout. The native application main loop runs at 60 FPS, the
JS bridge also runs at 60 FPS in order to maximize performance. Functions used in the
bridge can only be of the type void, this means that event listeners and callbacks must
be used in order to retrieve information from the native side of the application. [35, 36]
Figure 3: React Native Bridge [36]
2.4 Ionic 2
Ionic is an open source, cross-platform framework. The framework was released
on May 12, 2015 [39], and it is built on Angular. When Angular 2 was released, the
team made the decision to stick with having Angular as part of their architecture stack
and Ionic 2 release candidate was released on September 28, 2016 [40], the final
version was later released on January 25, 2017 [41]. Ionic 2 is built on top of Angular
2 which makes the developer able to develop applications using TypeScript or
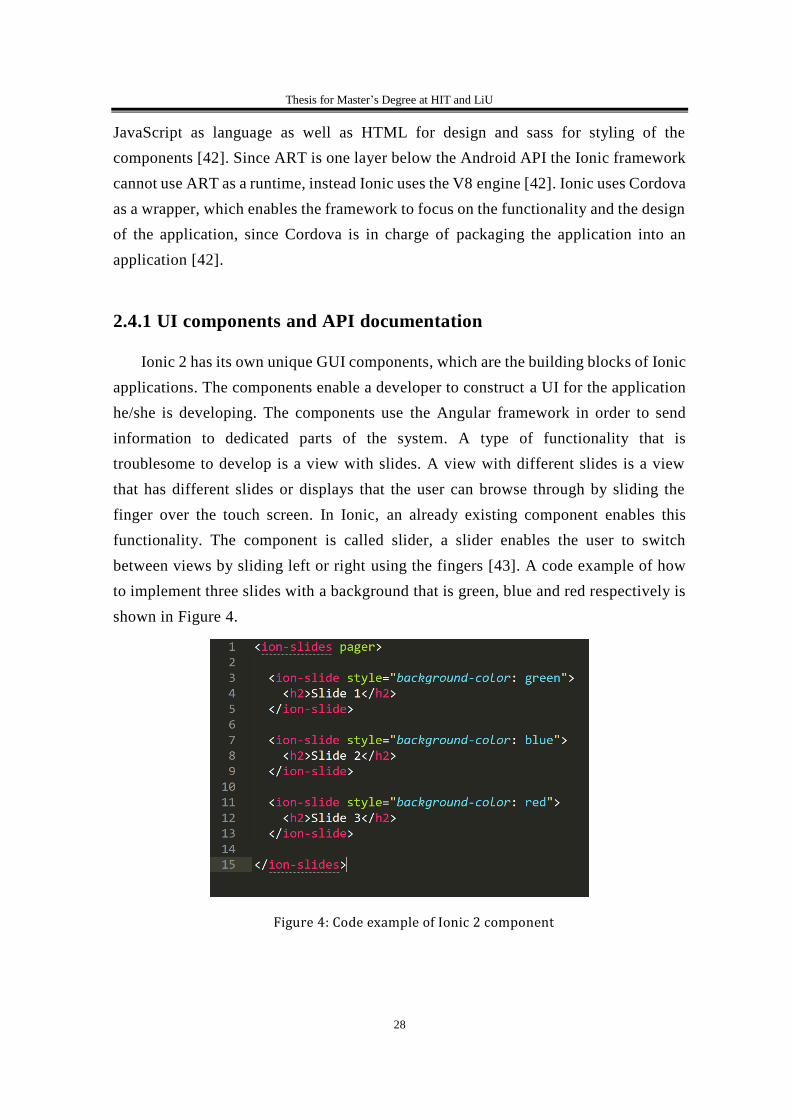
Thesis for Master’s Degree at HIT and LiU
28
JavaScript as language as well as HTML for design and sass for styling of the
components [42]. Since ART is one layer below the Android API the Ionic framework
cannot use ART as a runtime, instead Ionic uses the V8 engine [42]. Ionic uses Cordova
as a wrapper, which enables the framework to focus on the functionality and the design
of the application, since Cordova is in charge of packaging the application into an
application [42].
2.4.1 UI components and API documentation
Ionic 2 has its own unique GUI components, which are the building blocks of Ionic
applications. The components enable a developer to construct a UI for the application
he/she is developing. The components use the Angular framework in order to send
information to dedicated parts of the system. A type of functionality that is
troublesome to develop is a view with slides. A view with different slides is a view
that has different slides or displays that the user can browse through by sliding the
finger over the touch screen. In Ionic, an already existing component enables this
functionality. The component is called slider, a slider enables the user to switch
between views by sliding left or right using the fingers [43]. A code example of how
to implement three slides with a background that is green, blue and red respectively is
shown in Figure 4.
Figure 4: Code example of Ionic 2 component

Thesis for Master’s Degree at HIT and LiU
29
In addition to the Angular framework, Ionic uses its own API, which enable the
developer to add further functionality to the GUI and the components [44]. In Figure
5 is shown a code that uses the API. The code describes how a developer can hide or
show information contained in div elements. The two first divs are shown on the
display depending on the device has Android or iOS as OS. The two later divs are
shown depending on how the device is held by the user.
Figure 5: Code example of Ionic API documentation
2.5 Angular 2
Angular 2 was released in May 2016 [45]. Angular is a framework for developing
front-end web application. It is an open-source framework but Google develops the
greater part of Angular. The aim for Angular 2 is to simplify the testing and
development of single page applications by providing a framework for model-view-
view model (MVVM) and model-view-controller (MVC) architectures on the client
side. It also provides components used in rich internet applications [46].
The Angular 2 framework consists of both core libraries and optional libraries.
Angular uses HTML templates with Angularized markup, then writing component
classes to manage the templates. It is then possible to add application logic in services
as well as boxing components and services in modules. When the application launches,
it bootstraps the root module and then Angular present the application content in a

Thesis for Master’s Degree at HIT and LiU
30
browser and responds to the interactions made by the user according to the instructions
coded. [46]
The Architecture of Angular 2 is shown in Figure 6. There are eight main building
blocks of Angular.
Modules
Dependency injectors
Metadata
Components
Templates
Data bindings
Directives
Services
Modules
Angular applications are modular. Angular has built its own modularity system
called NgModules. An Angular application has to have at least one Angular module
class, which is the root module, named AppModule by default. Every Ngmodule is a
class with a @NgModule decorator. Decorators are methods or functions that modify
the JavaScript classes. Decorators are used in Angular to attach metadata to classes in
order to specify how the classes should work. [46]
Figure 6: Architecture of Angular 2 [46]

Thesis for Master’s Degree at HIT and LiU
31
The NgModule take a single metadata object and store the properties of that
metadata as properties, where the most important properties are shown in the list below.
Declarations
all the view classes are included in this module. In Angular, there are three
different view classes: pipes, directives and components.
Exports
are the subset of declarations, which should be usable in the component
templates.
Imports
the exported classes of other modules and the classes are required by component
templates declared in this module
Providers
create services, which this module contributes to the global collection of
services, the services become available in all the parts of the application.
Bootstrap
only the root module should set this property. It sets the root component, which
host the other application views.
Components
The components control a section of the screen called a view. The components
application logic is specified in a class. The specifications define the components
support for the view. The class in turn interacts with the view through an API of
properties. When the user of the application is using the application, Angular can
terminate, create and update components in the application. [46]
Metadata
In order for Angular to know that a certain class is a component, the class needs
attached metadata. This is done by using decorators, which takes the metadata and
explains it as properties. [46]
Templates
The associated template defines component’s view. The template is a HTML file,
which describes to Angular how the component should be rendered. [46]

Thesis for Master’s Degree at HIT and LiU
32
Data bindings
With data bindings Angular control, the action of pushing data values into the
HTML controls and convert user responses into value updates and actions. The data
bindings are used to coordinate sections of a template with the corresponding section
of a component. When adding a binding markup to a template HTML it will describe
for Angular how to connect the component with the template. [46]
As shown in Figure 7, Angular has four types of data binding syntaxes. Each type of
data binding syntax has directions. The directions go either from the component to the
DOM, or from the DOM to the component or both directions.
Services
Services are not narrowly defined but typically, a service should be a class with a
well-defined purpose. A service should perform one task and that task should be
performed with good quality. Some examples of services are logging, data service,
message bus, application configuration etc.
Services are used to ease the readability and logic of components, which also
makes it easier to detect bugs. A component should never fetch data from a server or
validate input. Those are typical assignments for services. This structure of developing
applications is not required from Angular but is recommended. Angular can help the
developer follow these guidelines through factoring the logic into services and then
connect the services to components through dependency injection. [46]
Figure 7: Data Bindings [46]

Thesis for Master’s Degree at HIT and LiU
33
Dependency injection
Dependency injection supplies a new instance of a class with all the dependencies
the class requires. Dependencies are also services in many cases, as described earlier
Angular can help the developer by providing new components with the services
required. Angular can calculate which service a component requires by scanning the
types of the constructor parameters. [46]
Directives
The templates in Angular are dynamic. This means that when Angular renders the
templates, Angular transform the DOM according to what instructions are given in the
directives. A directive is a component but the decorator has excluded the template-
oriented features, which is to say that a directive is a class with a @Directive decorator
instead of a @Component decorator and the @Component decorator is a @Directive
decorator but with added template-oriented features.
Structural and attribute directives are two other types Angular uses. Structural
directives are used to alter the layout by replacing, removing and adding elements in
the DOM. Attribute directives alter the behavior or appearance of an element. In
templates, Attribute directives resemble regular HTML attributes. [46]
2.6 Cordova
Cordova is an open-source framework. It enables cross-platform development
using HTML-5, JavaScript and CSS-3. Cordova makes the applications execute in
wrappers. A wrapper is a subroutine that calls on another subroutine. Cordova uses the
standard APIs that are available from each device in order to access and make use of
different capabilities i.e. camera, accelerometer sensor, network status etc. [47]

Thesis for Master’s Degree at HIT and LiU
34
Webb application
The web application is implemented as a web page and executes in the web view
seen in Figure 8. Within the web application, exists an “index.html” which references
to the resources that affects the application i.e. CSS, JavaScript, media files, images
etc. Another important file in the application is the “config.xml”, which provides
specifications about the application, like responding to orientation shifts . [47]
Webview
The web view provides the application with the whole user interface on all
platforms. The web view can also be a component inside a larger hybrid component
which mixes the web view component with other native application components. [47]
Plugins
The plugins provide an adapter or interface so that native components and Cordova
component are able to communicate. It also provides bindings to standard device APIs
Figure 8: Architecture of Cordova [47]

Thesis for Master’s Degree at HIT and LiU
35
that enables the JavaScript to invoke native code. There are Core plugins and third-
party plugins. The Core plugins enables the application to access device resources such
as camera, battery, contacts, etc. third-party plugins provide bindings to features,
which are not available in all platforms. It is also possible to develop own plugins.[47]
In Cordova, there are two paths to choose from when developing a mobile
application, namely the Cross-platform, Command-line-interface (CLI) path or the
platform-centered path. As the name indicates the Cross-platform CLI path is preferred.
CLI is a tool, which abstracts away the functionality of lower level shell-scripts. The
CLI copies common web assets into subdirectories for every mobile platform, in these
subdirectories CLI makes configuration changes for each platform, then runs build
scripts in order to generate application binaries. [47]
The platform-centered path should be used when the application is going to be
built for a single platform and there is need to be able to modify the application at a
lower level. Since this project is about measuring two Cross-platform frameworks
against each other, the Cordova CLI is the one, which is used in this project. [47]
2.7 Brief summary
There are four different types of cross-platform frameworks, which are cross-
compiled, interpreted, hybrid and web applications. Cross-compiled frameworks use
an API to convert the code to actual platform components. Interpreted frameworks use
native views and native GUI but the logic part is implemented using other technologies.
Hybrid frameworks use the platform specific web browser in order to present the view,
that way the whole code base can be shared for all platforms, since the only difference
is the styling of the components. Web frameworks use standard web technologies and
are used as any web page.
Native Android applications use the full stack of the Android architecture. Cross-
platform technologies must use the Java API framework to access the different features
and hardware components of the device. The Java API framework is situated in the
fourth layer of the Android stack and ART is situated on the third level. This means
that interpreted and hybrid applications cannot use ART as runtime but has to use some
other runtime. Both React Native and Ionic 2 use V8 engine as runtime. Since ART is
developed specifically for Android and V8 is developed for multi purposes ART will
perform better than V8 engine.

Thesis for Master’s Degree at HIT and LiU
36
React Native is built with the same functionality as React. React Native uses native
views and GUI, and can therefore have the same FPS as native applications. The views
are updated with the virtual DOM that React Native uses. The virtual DOM is first
updated when a part of the view is changed, then the virtual DOM is compared to the
actual view to see what needs to be updated and then the view is updated with those
changes.
Ionic 2 is mainly a library of HTML components and functionality that enable
native look and feel. Ionic 2 is built on Angular and uses Cordova to wrap the web
application into a platform application. Angular uses data bindings to update data to
and from the DOM. Angular also uses special types of decorators called Directives,
which provides instructions how to transform the DOM. Cordova packages web
applications into platform applications. The web view provided by the OS is used to
for applications wrapped using Cordova. Cordova uses an API that interacts with the
platform API in order to invoke platform specific devices and features.
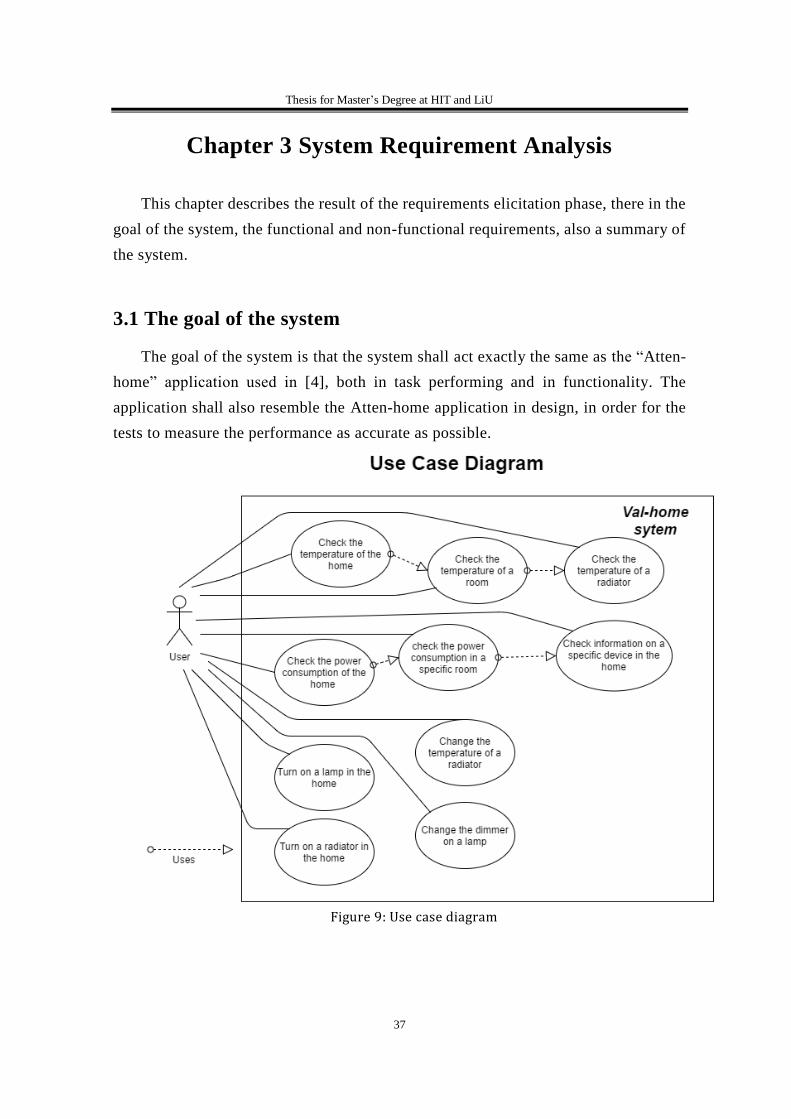
Thesis for Master’s Degree at HIT and LiU
37
Chapter 3 System Requirement Analysis
This chapter describes the result of the requirements elicitation phase, there in the
goal of the system, the functional and non-functional requirements, also a summary of
the system.
3.1 The goal of the system
The goal of the system is that the system shall act exactly the same as the “Atten-
home” application used in [4], both in task performing and in functionality. The
application shall also resemble the Atten-home application in design, in order for the
tests to measure the performance as accurate as possible.
Figure 9: Use case diagram

Thesis for Master’s Degree at HIT and LiU
38
In Figure 9, is shown the use case diagram constructed to define the functionality
and behavior of the application. The following use case description will further explain
the use cases.
Turn on a lamp in the home: A user of the application feels the need to turn on
a lamp in the hallway before he enters his house. The user takes up his
smartphone, enters the Val-home application and from the start screen/home
screen of the application enters room screen, then the device screen. On the
device screen, the user chooses the lamp in the hallway, and then the user turns
on the lamp by touching a button.
Turn on a radiator in the home: A user of the application feels the need to turn
on a radiator in the hallway before he enters his house. The user takes up his
smartphone, enters the Val-home application and from the start screen/home
screen of the application enters the device screen. On the device screen, the
user chooses the radiator in the hallway, and then the user turns on the radiator
by touching a button.
Checks information on a specific device in the home: A user of the application
wants to see some information about the lamp in the living room. The user takes
up his smartphone, enter the Val-home application and from the start screen
enters the room screen, from the room screen enters the screen for the living
room. In the living room screen, the user selects the lamp, and enters the
information screen for the lamp.
Check the power consumption in a specific room: A user is wondering what his
power consumption is in the kitchen. The user takes up his smartphone, enter
the Val-home application and from the start screen enters the room screen, from
the room screen enters the screen for the kitchen and then enters the information
screen. The information screen tells what the accumulated power consumption
is for all the devices in the kitchen.
Check the power consumption of the house: A user is wondering what his power
consumption is in his house. The user takes up his smartphone, enter the Val-
home application and from the start screen enters the information screen. The
information screen tells what the accumulated power consumption is for all the
devices in the house.
Check the temperature of a radiator: A user of the application wants to see the
temperature of a radiator in the living room. The user takes up his smartphone,
Thesis for Master’s Degree at HIT and LiU
39
enter the Val-home application and from the start screen enters the room screen,
from the room screen enters the screen for the living room. In the living room
screen, he selects the radiator and enters the information screen for the radiator.
Change the temperature of the radiator: A user of the application wants to
change the temperature of a radiator in the living room. The user takes up his
smartphone, enter the Val-home application and from the start screen enters the
room screen, from the room screen enters the screen for the living room. In the
living room screen, he selects the radiator and enters the information screen for
the radiator. In the information screen, he writes which temperature the radiator
should have.
Change the dimmer of a lamp: A user of the application wants to change the
dimmer on a lamp in the living room. The user takes up his smartphone, enter
the Val-home application and from the start screen enters the room screen, from
the room screen enters the screen for the living room. In the living room screen,
he selects the lamp and enters the information screen for the lamp. In the
information screen, he draws the range button to which percentage of dimming
the lamp should have.
Check the temperature of a room: A user of the application wants to see the
temperature of the living room. The user takes up his smartphone, enter the Val-
home application and from the start screen enters the room screen, from the
room screen enters the screen for the living room. In the living room screen, he
selects the information screen. The information screen shows what the average
temperature is among the existing radiators in the living room.
Check the temperature of the house: A user is wondering what the temperature
is in his house. The user takes up his smartphone, enter the Val-home
application and from the start screen enters the information screen. The
information screen tells what the average temperature is among all the existing
radiators in the house.
3.2 The functional requirements
The functional requirements of the application are the ones that follow.
1. The user shall be able to view a home-screen.

Thesis for Master’s Degree at HIT and LiU
40
2. The user shall be able to view a list of all rooms in a house.
3. The user shall be able to view a room-screen, which is accessed through the
home screen.
4. The user shall be able to view a list of all devices in a room.
5. The user shall be able to view a device-screen, which is accessed through the
room-screen.
6. The user shall be able to see info and settings about a lamp.
7. The user shall be able to turn on and off a device on the device-screen.
8. The user shall be able to view power consumption of a device.
9. The user shall be able to dim the light of a lamp.
10. The user shall be able to turn on and off a device on the room-screen.
11. The user shall be able to view a stats-screen about a single room.
12. The user shall be able to view a stats-screen about a single device.
13. The user shall be able to view a stats-screen about the entire house.
14. The user shall be able to view power consumption of a house.
15. The user shall be able to view power consumption of a room.
16. The user shall be able to view a line graph.
17. The user shall be able to see info and settings about a radiator.
18. The user shall be able to change the temperature of a radiator.
19. The user shall be able to see temperature of a radiator on the room-screen.
20. The user shall be able to view temperature of the house.
21. The user shall be able to view temperature of a room.
22. The user shall be able to view a line graph that updates in real time.
3.3 The non-functional requirements
As described in 1.5.2 Code analysis and requirements elicitation, the non-
functional requirements consists of two categories.
Design constraints
Quality requirements
Non-functional requirements for the project:
Design constraints
1. The system shall be implemented using TypeScript as language
2. The system shall be implemented using Ionic 2 as framework

Thesis for Master’s Degree at HIT and LiU
41
3. The system shall use MonngoDB as database
4. The server side of the system shall use RESTful API
5. The system shall use Express.js
6. The system shall use Mongoose
7. The server side of the project shall be deployed on an external server
Quality requirements
1. The system may crash maximum once every 50th test run
2. The system shall work, feel and behave as the application in [4]
3.4 Brief summary
The goal of the system is to have the exact same functionality as Atten-home. The
system should therefore be able to:
Turn on a lamp in the home.
Turn on a radiator in the home.
Checks information on a specific device in the home.
Check the power consumption in a specific room.
Check the power consumption of the house.
Check the temperature of a radiator.
Change the temperature of the radiator.
Change the dimmer of a lamp.
Check the temperature of a room.
Check the temperature of the house.
The system uses a back end to send the information and to update the values of the
system. The code for the back end could be reused completely, which means that the
hardware was the only thing that differed for the back end part.

Thesis for Master’s Degree at HIT and LiU
42
Chapter 4 System Design
This chapter will show what architecture the system has as well as the flow of
information through the system.
4.1 Architecture of the system
In order to make the system of Val-home resemble a real situation as well as
making it as equal to the original Atten-home system as possible, a server was set up
on Digital Ocean. The servers’ job was to facilitate the back ends' RESTful API that
in turn communicated with the database, which is demonstrated in Figure 10. There is
no information of what place geographically the server was set up in the Atten-home
system. In the Val-home system the server was set up in Germany, the reason for this
choice was that it was the closest location available.
Figure 10: Architecture of Val-home system
The back end server and the database were both located on the same server. This
was done because it was simple to implement. In discussion with the supervisor at
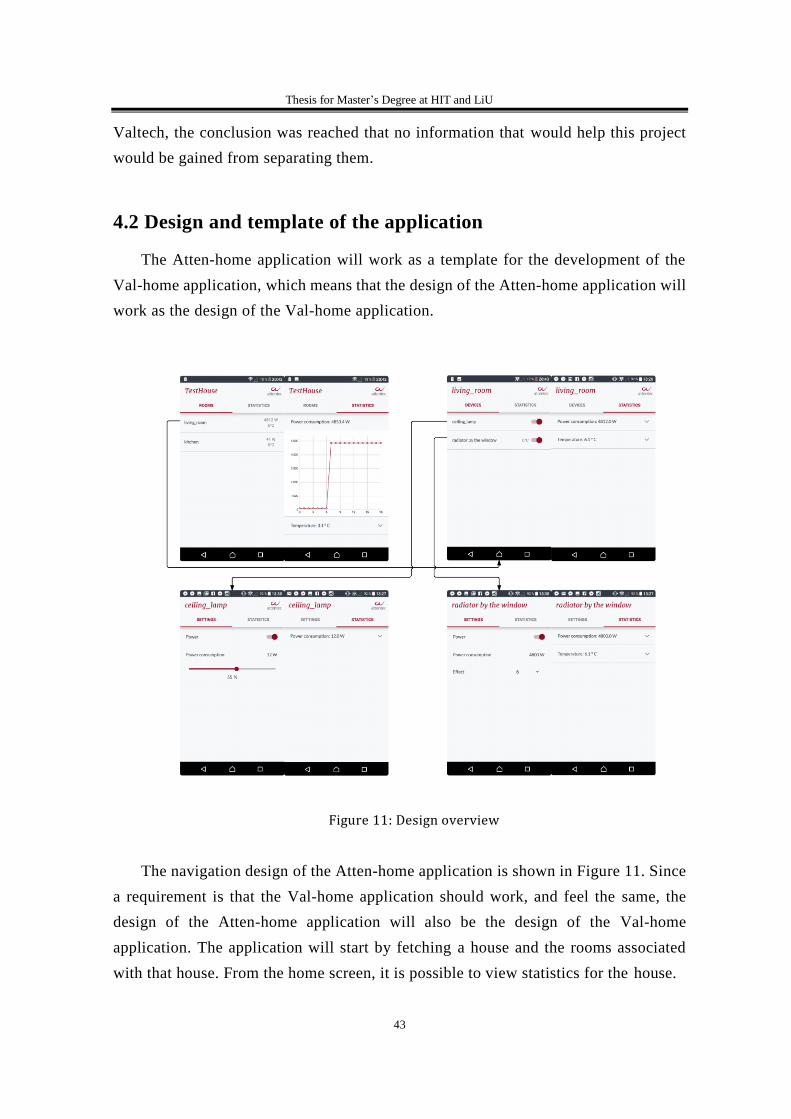
Thesis for Master’s Degree at HIT and LiU
43
Valtech, the conclusion was reached that no information that would help this project
would be gained from separating them.
4.2 Design and template of the application
The Atten-home application will work as a template for the development of the
Val-home application, which means that the design of the Atten-home application will
work as the design of the Val-home application.
Figure 11: Design overview
The navigation design of the Atten-home application is shown in Figure 11. Since
a requirement is that the Val-home application should work, and feel the same, the
design of the Atten-home application will also be the design of the Val-home
application. The application will start by fetching a house and the rooms associated
with that house. From the home screen, it is possible to view statistics for the house.

Thesis for Master’s Degree at HIT and LiU
44
The next screen, which is the room screen, is entered by pressing a room in the list
of rooms. In the room screen exactly like the home screen, it is possible to view
statistics of that room. From the room screen, it is possible to enter two different device
screens depending on what type of device is pressed in the list of devices. If a lamp is
pressed, the lamp screen is entered and if a radiator is pressed, the radiator screen is
entered. In the lamp screen, it is possible to view statistics about the power
consumption and switch settings for the lamp. In the radiator screen, it is possible to
view statistics about the radiator and switch settings for the radiator.
Figure 12: Statistics, Powerconsumption
On the statistics slide of each screen, there is a list with two items, namely power
consumption and temperature. Each item can be expanded using a web component
called accordion. When expanded the item shows a graph of the latest 18 data points,
which can be seen in Figure 12 and in Figure 13.
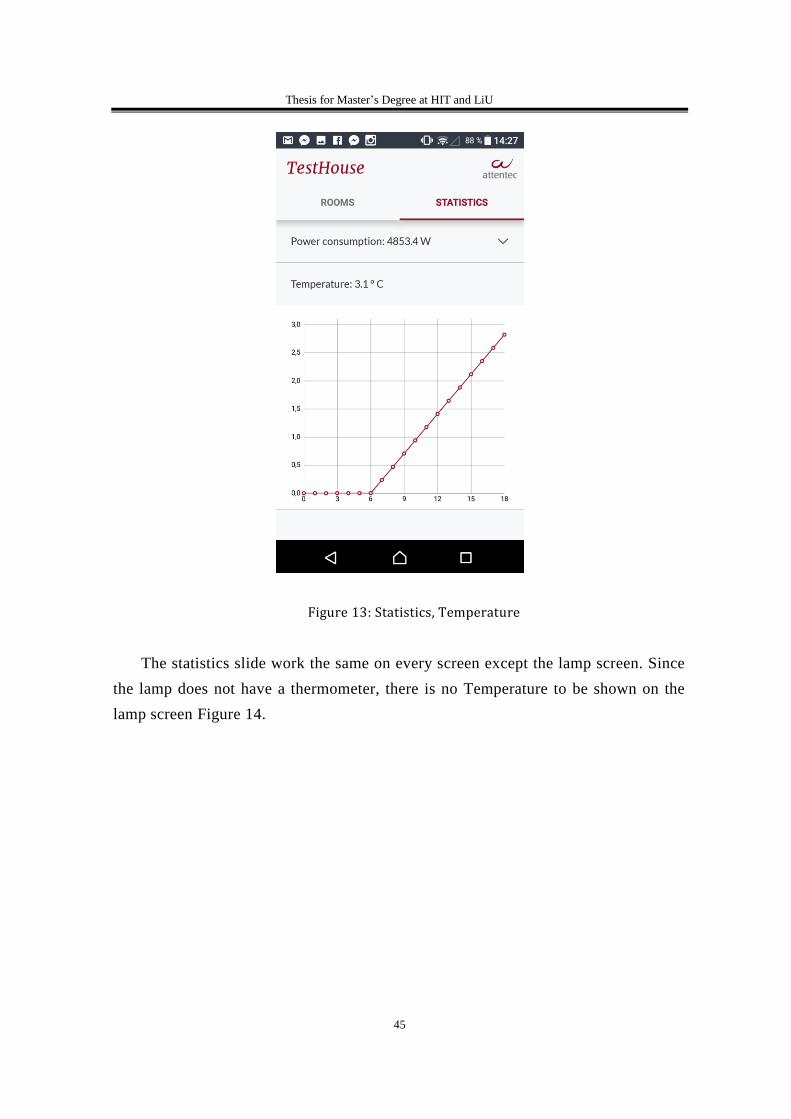
Thesis for Master’s Degree at HIT and LiU
45
Figure 13: Statistics, Temperature
The statistics slide work the same on every screen except the lamp screen. Since
the lamp does not have a thermometer, there is no Temperature to be shown on the
lamp screen Figure 14.

Thesis for Master’s Degree at HIT and LiU
46
Figure 14: Statistics on lamp screen
On the room screen, each device in the list has a toggle button which if pressed
turns on or off that device, this is shown in Figure 15. On the room screen, it is also
possible to navigate to a statistics slide. The statistics slide has the same type of layout
and functionality as the home screen.

Thesis for Master’s Degree at HIT and LiU
47
Figure 15: Room screen
On the settings slide on the lamp screen, a toggle button has the same functionality
as the toggle button on the rooms screen. There is also a range component where it is
possible to change the dimmer of the lamp. As shown in Figure 16, the power
consumption shows 0 if the lamp is turned off, otherwise it shows the maximum value
for the lamp, multiplied by the percentage set by the dimmer.

Thesis for Master’s Degree at HIT and LiU
48
Figure 16: Lamp settings slide
On the settings slide on the radiator screen, a toggle button has the same
functionality as the toggle button on the rooms screen. In addition, a select component
controls the effect of the radiator. As in the lamp screen, the power consumption shows
0 if the power is turned off, otherwise as shown in Figure 17 it shows the original
power consumption of the radiator multiplied by the effect set by the select component.

Thesis for Master’s Degree at HIT and LiU
49
Figure 17: Radiator settings slide
4.3 Brief summary
The system consists of the Android application as a client. The client interacts with
the back end by sending AJAX requests. The back end consists of an API that retrieves
information from a database implemented using MongoDB.
The application shall start with entering the home screen, from there, it shall be
possible to enter a statistics screen or enter a preferred room from a list. When a room
is entered it shall be possible to enter a statistics screen of the room or select a preferred
device of the type lamp or radiator, it shall also be possible to turn on and off the device
from the room screen. If a radiator is selected the radiator screen shall be displayed.
From the radiator screen, it shall be possible to enter a statistics screen of the radiator
and it shall be possible to turn on and off the power of the radiator and change the
effect of the radiator. If a lamp is selected from the room screen, the lamp screen shall

Thesis for Master’s Degree at HIT and LiU
50
be displayed. From the lamp screen, it shall be possible to enter a statistics screen of
the lamp and it shall be possible to turn on and off the power of the lamp and change
the dimmer of the lamp.
Thesis for Master’s Degree at HIT and LiU
51
Chapter 5 System Implementation and Testing
This chapter describes the different conditions set for the system both in the
technical aspect and during the evaluation. In addition, this chapter includes the class
diagrams and flow charts that describe the system. Lastly, the testing of the system is
described.
5.1 The environment of system implementation
This section will describe both the technical conditions used during development
and construction of the application as well as the test conditions.
5.1.1 Technical condition
Ionic is used to build the application
Typescript is used for the logic part of the application
HTML is used for making the UI
CSS is used to style the components
Webstorm is the IDE used for development
The application will only be developed for Android
During development only one Android device is used for testing
5.1.2 Test and evaluation conditions
Versions on development computer:
o OS: Ubuntu 16.04
o Ionic version: 2.3.0
o React Native version: 0.41.2
o Android SDK version: 25.2.3
Version on Device:
o Android version 7.0.0 or later

Thesis for Master’s Degree at HIT and LiU
52
5.2 Key program flow charts
In Ionic 2, the implementation of an application is closely linked to the different
views existing in the application. Each view gets an HTML document containing the
GUI components, a TypeScript file that handles the logic and a scss file that handles
the styling of the HTML components. Together these files make a view. From the
TypeScript file, it is possible to push information when routing to another view.
5.2.1 Class diagram
The classes represented in the class diagram (Figure 18) are the TypeScript files
in the application. The classes with names ending in “page” are the TypeScript files
for the views in the application. The TypeScript files handle all the logic in the
application. When the application receives information from the back end, it is
received as a JSON. Each of the classes that end in “page” has an HTML file, which
contains the HTML components that will be displayed for the user. Each HTML file
is also connected to a scss file, which controls the styling of the components in the
HTML file.
In order to handle the data the application needs to transform the data into readable
variables. The Base, House, Room and Device classes are developed in order to store
the data received in a logic way. The interfaces are used to separate the devices that
are lamps from the devices that are radiators.
As explained in section 2.5 Angular 2 services are used to perform tasks for the
components in Angular. The services HouseApiCallservice, RoomApiCallservice and
DeviceApiCallservice are in charge of sending AJAX calls for interacting with houses,
rooms and devices respectively. The AJAX calls are sent to the back end, which in
turn interacts with the database. The classes Base, Room, House and Device are the
different entities used in the system. Since the values of Lamp and Radiator are so
similar it is better to use interfaces to make the device cover both types instead of using
two almost identical classes. It also makes the system more maintainable if the
developer would want to add more types of devices.
Codes from the major functionalities and classes are shown in Appendix D.

Thesis for Master’s Degree at HIT and LiU
53
Figure 18: Class diagram

Thesis for Master’s Degree at HIT and LiU
54
5.2.3 Flow charts
In this section is presented flow charts representing scenarios 1, 2, 3, and 4 from
the performance tests earlier described in 1.5.5 Performance testing. In Figure 19 is
shown the legend for the flowcharts.
Figure 19: Legend of flow charts

Thesis for Master’s Degree at HIT and LiU
55
Figure 20: Flow chart of scenario 1
In Figure 20 the flow of information for the first scenario is shown. On the home
screen a list is displayed, the list contains the rooms, which are inside the house.
Therefore, the application needs to receive the house and all the rooms belonging to
the house before the home screen can be viewed. In this diagram both the slide with
the list of rooms and the statistics slide are included in the home screen, since there is
no difference in the flow of information. The only difference is, what is displayed for
the user.

Thesis for Master’s Degree at HIT and LiU
56
Figure 21: Flow chart of scenario 2 after entering the home screen
Scenario 2 starts with entering the home screen, which is shown in Figure 20. The
continuation of scenario 2 is shown in Figure 21. The room screen works similar to the
home screen, there is a list of the devices belonging to that room on one slide and there
is a statistics slide. When entering the room screen the application is already in
possession of the information of that room, it was received when entering the home
screen. However, the devices belonging to the room have not yet been fetched which
is what is done before entering the room screen.

Thesis for Master’s Degree at HIT and LiU
57
Figure 22: flow chart of scenario 3 after entering the room screen
Scenario 3 starts with entering the home screen, which is shown in Figure 20, then
entering the room screen, which is shown in Figure 21. The continuation of scenario 3
is shown in Figure 22. Like in scenario 2 when entering the device screen the
information about the device has already been received when entering the room screen.
The Radiator screen contains one slide with a list of settings and one slide with the
statistics. The list of settings contains one item with a toggle button, one item which
show the current power consumption and one item that enables the changing of the
effect.

Thesis for Master’s Degree at HIT and LiU
58
Figure 23: Flow chart of scenario 4 after entering the room screen
Scenario 4 starts with entering the home screen, which is already shown in Figure
20, then entering the room screen, which is shown in Figure 21. The continuation of
scenario 4 is shown in Figure 23. Since there are more steps and backtracking in
scenario 4 the numbers indicate in which order the different actions occur. In scenario
5, the application is started i.e. the house and the rooms belonging to the houses are
fetched and then the test is terminated.
5.3 Key Interfaces of the software system
Then main interfaces of this project are the GUI in the application and the RESTful
API in the back end. Other interfaces that are used are the interface towards which
allows Ionic to use Angular and the interface Cordova uses to access the different
components in the device.

Thesis for Master’s Degree at HIT and LiU
59
5.3.1 GUI
The interface was developed during this project. The some elements, color and
design are not exactly the same as the application Atten-home. The reason, the two
applications were not identical because, the users would be able to tell the difference
between the two applications more easily. In Figure 24 is shown the home screen. On
the home screen is shown a list of the rooms this house has. For the moment, this house
has a living room and a kitchen. Each item in the list also shows the power consumption
and temperature of that room. If a room in the list is pressed, the view will shift to the
room screen for containing that room. On the home screen, it is also possible to either
swipe or press the statistics button to enter the statistics slide.
Figure 24: Val-home home screen
On the statistics slide, there is a list with two components called accordion. If
pressed the accordion will expand and show a chart. In Figure 25, the first accordion
“power consumption” is expanded, and in Figure 26 the second accordion “temperature”

Thesis for Master’s Degree at HIT and LiU
60
is expanded. The accordion component did not exist in Ionic 2 and had to be developed.
Ionic 2 did not have its own charts components; therefore a third party library called
charts.js was used to. Charts.js is a standard library used in Angular. This means that
the charts are not exactly the same as in the original application replicated from [4].
However, both chart libraries are standard for their framework, which means that it is
still possible to compare them in terms of which framework uses the most resources
when using the standard library for charts.
Figure 25: Home screen statistics with expanded power consumption
The room screen and the device screen also have a statistics slide and they work
the same way except for lamp devices, as explained in 4.2 Design and template of the
application, lamps do not have a thermometer and therefore the lamp statistics do not
have a thermometer accordion.

Thesis for Master’s Degree at HIT and LiU
61
Figure 26: Home screen statistics with expanded temperature
When entering any room the room screen will display a list of devices that belongs
to the room. As shown in Figure 27 each device in the list has a toggle button belonging
to that device. If the toggle button is toggled, it will turn on/off the device depending
on the state. On the room screen, it is also possible to navigate to a statistics slide. The
statistics slide has the same type of layout and functionality as the home screen, which
is shown in Figure 25 and Figure 26.

Thesis for Master’s Degree at HIT and LiU
62
Figure 27: Room screen list of devices
As shown in Figure 28 on the lamp screen there is a toggle button, which has the
same function as the toggle button on the room screen. There is a range component
where it is possible to change the dimmer of the lamp. The power consumption displays
the current power that the lamp is consuming e.g. if the power is of it displays 0
otherwise it displays the maximum value for the lamp, multiplied by the percentage
set by the dimmer. The lamp screen has a statistics slide but as explained earlier , that
slide only contains the power consumption.
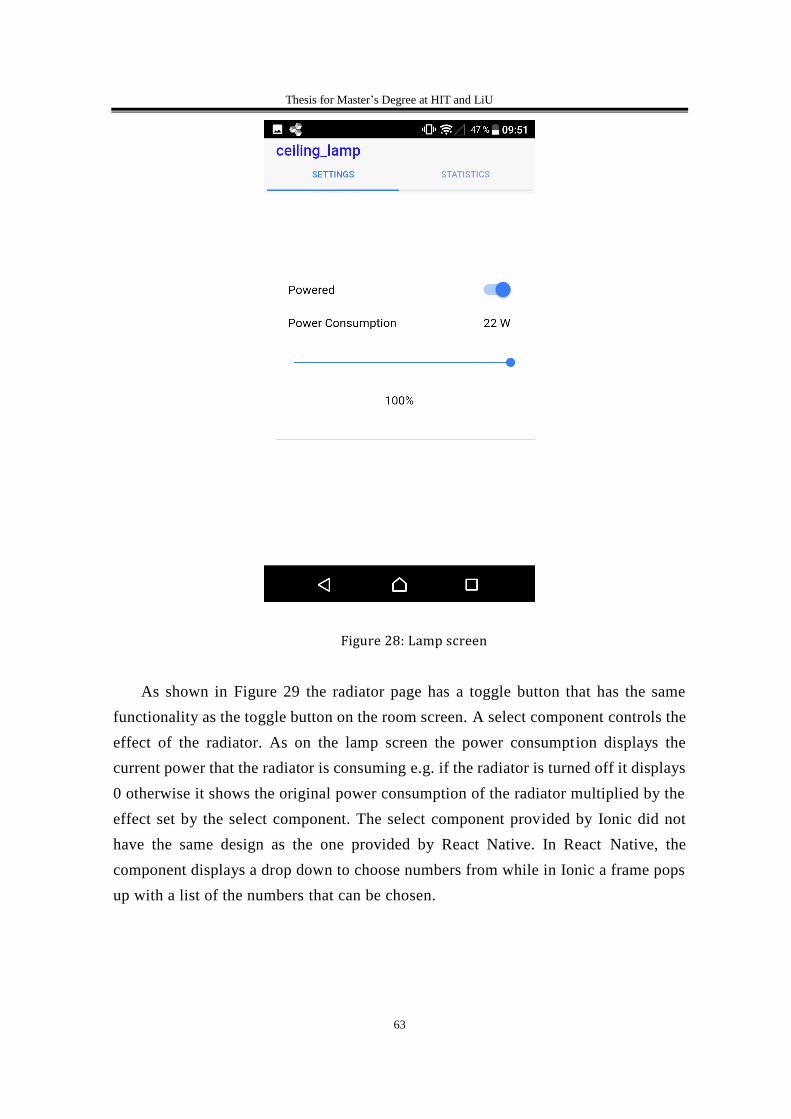
Thesis for Master’s Degree at HIT and LiU
63
Figure 28: Lamp screen
As shown in Figure 29 the radiator page has a toggle button that has the same
functionality as the toggle button on the room screen. A select component controls the
effect of the radiator. As on the lamp screen the power consumption displays the
current power that the radiator is consuming e.g. if the radiator is turned off it displays
0 otherwise it shows the original power consumption of the radiator multiplied by the
effect set by the select component. The select component provided by Ionic did not
have the same design as the one provided by React Native. In React Native, the
component displays a drop down to choose numbers from while in Ionic a frame pops
up with a list of the numbers that can be chosen.

Thesis for Master’s Degree at HIT and LiU
64
Figure 29: Radiator screen
5.3.2 RESTful API in back end
In this section, the different possible commands used in order to interact with the
database are described. The back end receives an AJAX request and depending on the
request the back end will send a command to the database. The ip address of the server
that was set up for this project was 46.101.241.205. That ip address will not be valid
when this project is finished since the server will be taken down. This means that if a
person would want to replicate this project the person will have to set up a server and
use that ip address instead.
The base-url is http:// 46.101.241.205/api/
Houses
Available at http:// 46.101.241.205:3000/api/houses. Send a GET request to this
address in order to get a list of all houses. Query parameters are taken as for example

Thesis for Master’s Degree at HIT and LiU
65
name=exampleName. Send a POST request to this address to create a new house. The
required body value for creating a house is name.
Individual house
Available at http:// 46.101.241.205:3000/api/houses/:id where id is the id of a
house. Send a GET request to this address to get a specific house. Send a PUT request
to this address to update all values of that house. Send a DELETE request to this
address to delete the house and all related objects, which would be all the rooms and
devices the house contains.
Rooms
Available at http:// 46.101.241.205:3000/api/rooms. Send a GET request to this
address to get a list of all rooms. Query parameters are taken as for example
houseId=ID. Send a POST request to this address to create a new room. The required
body values for creating a room are name and houseId.
Individual house
Available at http:// 46.101.241.205:3000/api/rooms/:id where id is the id of a room.
Send a GET request to this address to get a specific room. Send a PUT request to this
address to update all values of this room. Send a DELETE request to this address to
delete the room and all related objects, which would be all devices the room contains.
Devices
Available at http:// 46.101.241.205:3000/api/devices. Send a GET request to this
address to get a list of all devices. Query parameters are taken e.g. roomId=ID. Send a
POST request to this address to create a new device. The required body values for
creating a device are name, roomId and type that is part of devices = [lamp]. Devices
has individual values that can be set. The values powered {Boolean},
powerConsumption {Number} is available on all devices. Lamp has a special value
dimmer {0,100}.
Individual device
Available at http:// 46.101.241.205:3000/api/devices/:id where id is the id of a
device. Send a GET request to this address to get a specific device. Send a PUT request

Thesis for Master’s Degree at HIT and LiU
66
to this address to update all values of that device. Send a DELETE request to this
address to delete the device.
5.4 System Testing
The system test consisted of the user tests. As stated in 1.5.4 User tests, the
application Atten-home made in React Native and the application Val-home made in
Ionic 2 were presented to the user. The user could decide which application to start
with and then followed the same schema in both applications. Every user that
performed the test was working with web-development or with mobile application
development. As shown in Figure 30, 100% thought that both applications performed
the same task. The next important thing is how the applications perform the tasks.
Figure 30: Shares of users asked about the tasks
The greater majority of the users thought the functionality worked the same
between the applications. As shown in Figure 31, 23.1% thought there was differences
in functionality between the applications. They were asked what the differences were.
Their answers:
“Graphs under settings were different, how they were displayed.”
“Dropdown (effect) worked much better in Val-home, in AttenHome the dropdown
was tiny and hard to change. In AttenHome the graphs were to big (need to scroll to
see all data), and in Val-home they were a bit to small.”

Thesis for Master’s Degree at HIT and LiU
67
All of them thought that the displaying of graphs worked differently. Since the
graph was made differently on purpose, it makes the functionality valid for
performance testing.
Figure 31: Share of users asked about the functionality
The users were also asked what they thought was different in design. Most of the
users commented on the charts being different and that the effect select component on
the radiator screen looked different. As explained earlier the charts were made different
on purpose and the select component in Ionic 2 looked and worked different compared
to the select component in React Native. Both of these may have an impact on the
performance but both of them are natural differences between the two frameworks
React Native and Ionic 2.
The users were also asked if they noticed any performance differences. As shown
in Figure 32, 46.2% felt they noticed performance differences. The ones that
answered yes were also asked when and how they felt there was a difference.
They answered:
“Loading time”
“The val home was faster in showing and hiding the diagrams.”
“Val lagged a bit at times, for example when clicking items that displayed a new view,
also when displaying the the graphs.”
“Val had a little longer start up time.”
“Startuptime”

Thesis for Master’s Degree at HIT and LiU
68
“Longer startup time for val and longer time to load graphs”
“Slower startup in Ionic and a tiny bit slower when entering room screen in Ionic”
Almost all the users that felt there was a difference in performance felt that the
startup was slower in the Ionic 2 application than the React Native application.
Figure 32: Share of users asked about performance
5.5 Brief summary
The conditions that were present during development of the application were
definite and used the latest versions and technology at the time. The key interfaces
used in the project were the GUI developed for the application Val-home and the API
used by the back end to enable interaction between the client and the database. The
code for the back end was developed by T. Vidhall and N. Hansson during heir project
in [4]. 100% of the code for the back end could be reused. The GUI of Val-home did
not have an identical look to Atten-home and the reason was so that users would more
easily be able to tell the difference of the applications so they could reference to the
each of the applications during the user tests.
The user tests showed that the users thought that the applications performed the
same tasks and most of the users thought that the functionality was identical. The ones
that commented on differences in functionality mentioned differences that are either
natural differences between the frameworks or differences that needed to be developed

Thesis for Master’s Degree at HIT and LiU
69
differently. The comments made on design differences do not affect the performance.
About half of the users did not notice any difference in performance.

Thesis for Master’s Degree at HIT and LiU
70
Chapter 6 Performance evaluation
This section provides the average values gathered from running performance tests
on the five different scenarios described in 1.5.5 Performance testing. Starting up each
application took different amount of time. Each scenario was run with the application
already started except scenario 5, which consisted solely of starting up the application.
This was done because the results were given in relation to time. Therefore, it was
difficult to compare the results of the different test runs if the actions did not take place
at the exact same time. Each test was made five times, what is shown in the graphs is
the average data points from those five test runs. The results are shown in accordance
to each device that performed the tests.
In Appendix C it is shown that Scenario 5 is the scenario, which shows the biggest
difference in performance. Most importantly, the amount of time the different
applications need to start up. The application made in Ionic 2 takes 6.8 seconds to start
while the React Native application takes 1.8 seconds and the native Android
application takes 1.1 second. The relation between the total amounts of resources used
is therefore even greater than the relation between the average metrics during that
scenario.
6.1 CPU load
The graphs that can be found in CPU load under Appendix C show the CPU load
on the different devices in the different scenarios. The scenarios follow the order given
in 1.5.5 Performance testing. The graphs show that all the applications follow the same
pattern. The graphs scenarios 1, 2, 3 and 4 all show that the React Native application
has a higher and longer CPU load spike in the beginning of each scenarios. The graphs
also show that Ionic 2 has a heavier CPU load when the charts in the application are
expanded. The charts are expanded at 19, 27 and 35 seconds during scenario 1, 2 and
3 respectively. As shown in Table 4 and Table 5, during scenarios 1, 2 and 3 the
average CPU load is higher for the React Native application compared to the Ionic 2
application on the Sony Xperia X Performance device but on the Samsung Galaxy S7
device, it is the reverse. During scenario 4 both devices show that React Native has a
higher average CPU load than Ionic 2. Natively developed Android has the lowest

Thesis for Master’s Degree at HIT and LiU
71
average CPU load in all the test runs except in scenario 1 using Samsung Galaxy S7,
in that test run React Native had the lowest average CPU load.
Table 4: Average CPU load with Sony Xperia X Performance
Average CPU load in each scenario with Sony Xperia X Performance
React Native Ionic 2 Android
Scenario 1 30% 28% 24%
Scenario 2 29% 28% 25%
Scenario 3 31% 30% 25%
Scenario 4 30% 27% 25%
Scenario 5 34% 49% 30%
Table 5: Average CPU load with Samsung Galaxy S7
Average CPU load in each scenario with Samsung Galaxy S7
React Native Ionic 2 Android
Scenario 1 19% 21% 20%
Scenario 2 19% 21% 16%
Scenario 3 21% 22% 17%
Scenario 4 21% 18% 18%
Scenario 5 33% 38% 28%
6.2 Memory usage
The graphs that can be found in Memory usage under Appendix C show the
memory usage on the different devices in the different scenarios. The scenarios follow
the order described in 1.5.5 Performance testing. In Table 6 and Table 7, it is shown
that in all the scenarios Ionic 2 uses more memory than React Native, inspecting the
graphs shows that it is true for every data point. The test runs run with Sony Xperia X
Performance show that natively Android uses the most memory while the test runs run
with Samsung Galaxy S7 show that Ionic 2 and natively Android use almost the same
amount of memory.

Thesis for Master’s Degree at HIT and LiU
72
Table 6: Average memory usage with Sony Xperia X Performance
Average memory usage in each scenario with Sony Xperia X Performance
React Native Ionic 2 Android
Scenario 1 2659048 KB 2687260 KB 2695097 KB
Scenario 2 2559135 KB 2630274 KB 2697818 KB
Scenario 3 2561754 KB 2639946 KB 2693245 KB
Scenario 4 2611640 KB 2650451 KB 2679300 KB
Scenario 5 2628034 KB 2710087 KB 2682380 KB
Table 7: Average memory usage with Samsung Galaxy S7
Average memory usage load in each scenario with Samsung Galaxy S7
Samsung Galaxy
S7
React Native Ionic 2 Android
Scenario 1 3500666 KB 3555632 KB 3572600 KB
Scenario 2 3503890 KB 3554458 KB 3558166 KB
Scenario 3 3493419 KB 3564175 KB 3550109 KB
Scenario 4 3521586 KB 3551798 KB 3563389 KB
Scenario 5 3506166 KB 3557770 KB 3564247 KB
6.3 Battery power usage
Like in earlier sections, the scenarios follow the order described in 1.5.5
Performance testing. The graphs for battery power usage are shown in Battery power
usage under Appendix C. Table 8 and Table 9 both show that Ionic 2 uses more battery
power in total. The graphs in Battery power usage show that Ionic 2 uses more power
particularly when showing the charts in the application which occurs at 19, 27 and 35
seconds during scenario 1, 2 and 3 respectively. During scenario 4 React Native uses
more battery power. The spikes of the React Native application during scenario 4 occur
when the animations of the toggle buttons take place. It is clearer shown in the test run
using the Samsung Galaxy S7 device. Natively Android has the least amount of battery
power usage in all scenarios except scenario 1 using the Samsung Galaxy S7 device,
which is shown in Table 8 and Table 9.

Thesis for Master’s Degree at HIT and LiU
73
Table 8: Average battery power usage with Sony Xperia X Performance
Average battery power usage in each scenario with Sony Xperia X Performance
Sony Xperia X
Performance
React Native Ionic 2 Android
Scenario 1 402795 uW 483387 uW 313969 uW
Scenario 2 342348 uW 443340 uW 324467 uW
Scenario 3 395447 uW 531068 uW 341768 uW
Scenario 4 371400 uW 338496 uW 308926 uW
Scenario 5 1469356 uW 1734053 uW 1354780 uW
Table 9: Average battery power usage with Samsung Galaxy S7
Average battery power usage in each scenario with Samsung Galaxy S7
Samsung Galaxy
S7
React Native Ionic 2 Android
Scenario 1 493447 uW 648522 uW 532542 uW
Scenario 2 537241 uW 601716 uW 465684 uW
Scenario 3 547393 uW 686719 uW 462004 uW
Scenario 4 666478 uW 477251 uW 453412 uW
Scenario 5 1626583 uW 2146919 uW 1483942 uW
6.4 Application size and APK size
The size of the applications when installed on the devices differed.
Sony Xperia X Performance:
React Native: 20.16 MB
Ionic 2: 5.66 MB
Android: 2.68 MB
Samsung Galaxy S7:
React Native: 20.34 MB
Ionic 2: 5.81 MB
Android: 2.67 MB

Thesis for Master’s Degree at HIT and LiU
74
The APK sizes of the different applications:
React Native: 8.2 MB
Ionic 2: 5.6 MB
Android: 2.2 MB

Thesis for Master’s Degree at HIT and LiU
75
Chapter 7 Discussion
This section will discuss the different parts of the project. For example, what could
have been done differently, what are the ethical and sustainable aspects of the project
and what is the replicability, validity and reliability of the method?
7.1 Result Discussion
This section will discuss the users’ answers in the user test, the users seemed to
think that the applications worked and felt the same. It will also discuss the result
gathered from the performance evaluation.
7.1.1 User tests
The criteria for comparing the Ionic 2 application to the React Native and the
Android application were that the applications should work and feel the same. This
was the reason for making the user tests. If the application perform the same tasks and
perform the tasks in the same way, they work the same way. The feel however is more
difficult to compare. The users were asked to tell what design differences they could
see so that the design differences could be evaluated and changed if needed.
All the users felt that the application performed the same tasks. Almost all the
users felt that the functionality of the applications was the same, which is how the tasks
are performed. The ones that felt there was a difference commented that it was the
graphs they felt were a difference and the graphs could not be made the same and was
therefore different on purpose. The design differences were made on purpose because
either the components in Ionic 2 and React Native do not have the exact same design
or the design differences were so small that it did not affect the performance.
The last question aimed to see if any users could notice a performance difference
or if the difference in performance between the frameworks were so small that it had
to be measured. This was done because if the users do not notice any performance
difference, then that is a strong sign that the performance should not be a factor when
deciding which cross-platform framework to use if choosing between React Native and
Ionic 2. Surprisingly, more than half of the users did not notice any differences in
performance at all. The users that noticed a difference in performance all commented

Thesis for Master’s Degree at HIT and LiU
76
that the startup time was longer in the Val-home application. Some users were of the
opinion that the application developed in Ionic 2 responded slower when interacting
with different components, this could be because React Native has a 60 FPS, which
means that the view could be updated faster than Ionic 2, which uses the web view.
The reason why more users did not notice this difference in performance could be that
they only used each application once.
7.1.2 Performance evaluation
When designing the charts in Val-home I was not able to find the exact same chart
that was used in the Atten-home application. Therefore, it does not have to be because
of Ionic 2 that Val-home uses more resources when the applications expanded the
charts. In most of the scenarios, React Native does not use as much resources as Ionic
2. Starting the application was by far the biggest difference in performance. React
Native had a higher CPU load and battery power usage in scenario 1, 2 and 3 when
using the Sony Xperia X Performance device but it was the reverse when using the
Samsung Galaxy S7 device but the difference between them was very small. Both
devices showed that React Native used more CPU load during scenario 4. This is
probably due to the animation even when it such a small animation as a toggling button
it shows that React Native requires more resources.
In scenario 5, Ionic 2 was the big loser in all the metrics and it took much longer
time to start the application developed in Ionic 2. The three applications were so close
in the measurements that if starting the application ergo scenario 5 would be part of
each scenario all the metrics would be higher for the Ionic 2 application. It was
surprising that the memory usage was highest for natively Android in many test runs,
which was not the case in the measurements made in [4]. There can be several reasons
for this, I did not use the same tool for measuring the different metrics but my belief
is that the application was developed for Android 6.0 and might not be as optimized
anymore or that natively Android applications allocate as much memory as they are
allowed in order to perform actions faster.
In “An empirical analysis of energy consumption of cross-platform frameworks
for mobile development” [16] the authors state that updating the GUI was the most
expensive task in terms of energy consumption. This was also true for the applications

Thesis for Master’s Degree at HIT and LiU
77
used in this project. Every major spike in energy consumption in each scenario
correlated to an update of the GUI.
In “Effects on performance and usability for cross-platform application
development using React Native” [4], the authors state that the application developed
in React Native used 1-3% units more on average, than the application developed
natively. I used their applications but I received different number. The results I
received showed that React Native application used 3-5% units more than the natively
developed application. The application developed in Ionic 2 used 2-4% units more than
the natively developed application. This could be because the Android OS version was
not the same or because the tests were not performed on the same devices. Small
variations could be observed between the two devices I used so it is not unthinkable
that variations also exists between the device theys used in their thesis and the ones
used in this thesis.
By looking at the results, the conclusion is that generally Ionic 2 uses more
resources than react Native. However, the differences are not very big. The most
noticeable performance difference for the user was during the startup of the application.
Therefore, I believe that when developing an application the developer should use the
framework he/she feels most comfortable with or choose framework dependent on
other factors that may affect the system, unless the application is very performance
dependent. Then the developer should develop the application using native code and
frameworks.
7.2 Method Discussion
This project was made with [4] as a base. In a way, this is a replicated work of that
study. I got in contact with Attentec to get access to the code of their applications. The
code for the application created during this project is stored publicly on GitHub. If any
person desires to view the code that person can either find it by searching the internet
or contact me. The method can easily be applied for other frameworks as well. Because
of the above stated reasons, this project has a high replicability.
In my opinion, reliability of this study is low. Every part of the stack of the
frameworks constantly evolve and it is therefore impossible to say even when using
the exact same method and the same frameworks that future replicated studies will
show the same result. In 1.2 The purpose of the project, two questions were presented:

Thesis for Master’s Degree at HIT and LiU
78
1. What differences are there between Android applications made in React
Native and Android applications made in Ionic 2, in terms of performance?
2. What differences are there between applications made in Ionic 2 and
applications made in Android with native development, in terms of
performance?
There are multiple ways to measure performance, Battery power usage, CPU load
and memory usage does not provide a full coverage of the total performance of an
application but they give a very good indication. The tests were automated which
removes the human error factor. For making the measurements, Trepn profiler was
used. Trepn profiler gathers values for the whole system, which makes the
measurements more accurate in terms of the possibility to see how the application
affects the whole system. The fact that the whole system is measured could cause
trouble if other applications are running in the background. To avoid this all other
applications were terminated during the tests.
Most of the references used when describing React Native, Ionic 2, Angular 2 and
Cordova come from their own respective documentations. There are both positive sides
and negative sides to that. The positive side is that since they themselves are the
creators of their own framework they will know exactly how the framework is
structured, what positive side effects and what negative side effects there are to the
framework. The negative side is that since their goal is that as many people as possible
like and use their framework they might not be 100% honest in their description of the
framework. However, they are all big organizations behind the frameworks and if there
is something they are hiding in their architecture, it will hurt them when it is discovered,
which means they ought to aim at not hiding vital information. I still chose to use their
documentation since I believed that their documentation was well written and easy to
understand. Another reason was that it was difficult to find documentation about the
frameworks at any other place.
There were not much information about the specific differences between these two
frameworks and this type of application development was new to me. Therefore, it was
reasonable to explore this field development and map out the differences between the
frameworks. Hence, an explorative case study was well suited for this project.

Thesis for Master’s Degree at HIT and LiU
79
7.3 Work in a wider context
This section will describe what type of effects this project and similar projects
might have from a broader ethical and sustainable perspective.
7.3.1 Ethical
Sometimes when a type of work is simplified, it will decrease the number of people
needed to perform that job. Since React Native and Ionic decreases the need to make
an application for each OS, it could be the case here that there will be fewer jobs
needed to develop mobile applications. However as mentioned in 7.1 Result
Discussion, there are still performance differences between native made applications
and applications made in React Native and Ionic 2. Therefore, I believe companies will
still want to develop native applications. At the moment of writing there is a shortage
in in developers in Sweden. These upcoming frameworks can hopefully help with
easing the workload in general for developers in Sweden.
7.3.2 Sustainability
Environmentally this project should not have any big affect. Though the result
show that both React Native and Ionic 2 use more battery power than the natively
developed applications. If cross-platform applications become more usual then people
will and people will use these aplications, their devices will use more battery. By using
cross-platform frameworks, the developers can use one code base instead of several
when maintaining the application. Using one code base also makes it easier to further
evolve and develop the application as well as fixing smaller tweaks or bug fixes. In
that sense, these cross-platform frameworks contribute to a more sustainable
developing climate.
7.4 Future work
Other frameworks solve the same problem as React Native and Ionic are doing.
Xamarain is one example. There could be more comparisons made between these
different frameworks. All of these frameworks keep evolving at a fast pace, which
means that the performance between the frameworks can change. When the
implementation of this project was done a new version of Angular came out. The Ionic

Thesis for Master’s Degree at HIT and LiU
80
framework released a new version shortly after. The new versions of these frameworks
supposedly makes Ionic applications more resource efficient. Therefore, a continuation
of this work could be to replicate this work by using Ionic 3.

Thesis for Master’s Degree at HIT and LiU
81
Conclusion
The application in this project does not explore all types of application
functionality. The conclusion drawn can therefore only be used for applications similar
to the application used in this project. The application does not use any heavy
calculations and is not overly complex. The application uses animations and many
AJAX calls. The purpose of this project was to investigate if Ionic 2 was an eligible
framework for developing cross-platform applications, which was presented in section
1.2 The purpose of the project. It also present two issues, which would help answering
the question:
1. What differences are there between Android applications made in React
Native and Android applications made in Ionic 2, in terms of performance?
2. What differences are there between applications made in Ionic 2 and
applications made in Android with native development, in terms of
performance?
The results showed clearly that Android applications made in React Native used
fewer resources when running compared to Android applications made in Ionic 2,
however the big difference occurred during startup of the application. The size of the
application was in favor of Ionic 2 compared to React Native. The application was
almost 4 times bigger when it was made using React Native compared to Ionic 2.
Generally, the differences were not vast, so when developing a cross-platform
application the developer should use the framework he/she feels most comfortable with
or choose framework based on other specifics that can affect the system.
The results show that the native Android application is more resource efficient
than Ionic 2. However, as was concluded in the thesis made by T. Vidhall and N.
Hansson, React Native does not use vastly much more resources than Android. This
was also the case for Ionic 2. Therefore, unless a developer needs to have a very
resource efficient application he or she can use Ionic 2 to develop an application
towards more platforms. The conclusion drawn from this is that Ionic 2 is an eligible
framework for developing Android applications.
Thesis for Master’s Degree at HIT and LiU
82
References
[1] E. Harrie, “The Swedes and the Internet 2015,” Nordicom - Noridc
Information Centre For Media and Communication Research , 2015. [Online].
Available: http://www.soi2015.se/the-swedes-and-the-internet-2015-
summary/. [Accessed: 11-Mar-2017].
[2] M. Hartmann, T. Zesch, M. Mühlhäuser, and I. Gurevych, “Using
Similarity Measures for Context-Aware User Interfaces,” in ICSC ’08:
Proceedings of the 2008 IEEE International Conference on Semantic
Computing, 2008, pp. 190–197.
[3] M. A. Farooq, R. Kirchain, H. Novoa, and A. Araujo, “Cost of
quality: Evaluating cost-quality trade-offs for inspection strategies of
manufacturing processes,” Int. J. Prod. Econ., vol. 188, pp. 156–166, Jun.
2017.
[4] N. Hansson and T. Vidhall, “Effects on performance and usability
for cross-platform application development using React Native,” M Sc. Thesis
Linköping University, 2016.
[5] “Android Systrace.” [Online]. Available:
https://developer.android.com/studio/profile/systrace-commandline.html.
[Accessed: 03-Mar-2017].
[6] R. Regupathy, “Android Debug Bridge (ADB).,” Unboxing Android
USB, p. 125, 2014.
[7] W. Danielsson, “React Native application development: A
comparison between native Android and React Native,” M Sc. Thesis
Linköping University, 2016.
[8] “Trepn profiler website,” 2017. [Online]. Available:
https://developer.qualcomm.com/software/trepn-power-profiler. [Accessed:
27-May-2017].
[9] J. Friberg, “Evaluation of cross-platform development for mobile
devices ; Utvärdering av cross-platformutveckling för mobila enheter.,” M Sc.
Thesis Linköping University, 2014.
[10] P. Runeson, M. Host, A. Rainer, and B. Regnell, Case study
research in software engineering: Guidelines and examples . John Wiley &
Thesis for Master’s Degree at HIT and LiU
83
Sons, 2012.
[11] C. P. Rahul Raj and S. B. Tolety, “A study on approaches to build
cross-platform mobile applications and criteria to select appropriate approach,”
in 2012 Annual IEEE India Conference, INDICON 2012, 2012.
[12] S. Xanthopoulos and S. Xinogalos, “A comparative analysis of
cross-platform development approaches for mobile applications,” in
Proceedings of the 6th Balkan Conference in Informatics on - BCI ’13, 2013,
no. 6th BCI 2013-Balkan Conference in Informatics, Proceedings, p. 213.
[13] A. Lelli and V. Bostrand, “Evaluating Application Scenarioswith
React Native: A Comparative Study between Native and ReactNative
Development,” Uppsala Univesrsity, 2016.
[14] O. Axelsson and F. Carlstrom, “Evaluation Targeting React Native
in Comparison to Native Mobile Development,” 2016.
[15] M. Willocx, J. Vossaert, and V. Naessens, “Comparing Performance
Parameters of Mobile App Development Strategies,” in Proceedings of the
International Conference on Mobile Software Engineering and Systems , 2016,
pp. 38–47.
[16] M. Ciman and O. Gaggi, “An empirical analysis of energy
consumption of cross-platform frameworks for mobile development,”
Pervasive Mob. Comput., Oct. 2016.
[17] “Monsoon PowerMonitor,” 2017. [Online]. Available:
https://www.msoon.com/LabEquipment/PowerMonitor/. [Accessed: 01-Mar-
2017].
[18] R. K. Yin, “Case study research: Design and methods.,” Appl. Soc.
Res. Methods Ser., vol. 18, no. 2, pp. 54–56, 2013.
[19] D. T. Milano, “AndroidViewClient,” 2017. [Online]. Available:
https://github.com/dtmilano/AndroidViewClient. [Accessed: 26-Apr-2017].
[20] A. Bakker, “Comparing energy profilers for android,” in 21st
Twente Student Conference on IT, 2014, vol. 21.
[21] C. Forsberg and Y. Wengström, Att göra systematiska
litteraturstudier : värdering, analys och presentation av omvårdnadsforskning.
Stockholm : Natur & Kultur, 2016, 2016.
[22] M. Unterkalmsteiner, T. Gorschek, R. Feldt, and Klotins, “Assessing
requirements engineering and software test alignment—Five case studies,” J.

Thesis for Master’s Degree at HIT and LiU
84
Syst. Softw., pp. 62–77, 2015.
[23] “Ioinic getting started.” [Online]. Available:
https://ionicframework.com/getting-started/. [Accessed: 20-Mar-2017].
[24] “Chart.js,” 2017. [Online]. Available: http://www.chartjs.org/.
[Accessed: 24-Mar-2017].
[25] P. P. Phillips and B. Phillips, J. J., Aaron, Survey Basics. ASTD
Press, 2013.
[26] J. Berrocal et al., “Early analysis of resource consumption patterns
in mobile applications,” Pervasive Mob. Comput., vol. 35, pp. 32–50, Feb.
2017.
[27] A. Merlo, M. Migliardi, and P. Fontanelli, “Measuring and
estimating power consumption in Android to support energy-based intrusion
detection,” J. Comput. Secur., vol. 23, no. 5, pp. 611–637, Aug. 2015.
[28] “Sony.com.” [Online]. Available:
https://www.sonymobile.com/se/products/phones/xperia-x-
performance/specifications/. [Accessed: 10-May-2017].
[29] “Gsmarena,” 2017. [Online]. Available:
http://www.gsmarena.com/samsung_galaxy_s7-7821.php. [Accessed: 03-Apr-
2017].
[30] K. Whitehead, “Building a Mobile App: Ionic Vs React Native Vs
Native,” Simpleweb blog, 2016. [Online]. Available:
https://simpleweb.co.uk/building-a-mobile-app-ionic-vs-react-vs-native/.
[Accessed: 26-May-2017].
[31] F. Massart, “React Native vs Ionic: A Side-by-Side Comparison,”
2017. [Online]. Available: https://www.codementor.io/fmcorz/react-native-vs-
ionic-du1087rsw. [Accessed: 13-Apr-2017].
[32] “Open handset alliance.” [Online]. Available:
http://www.openhandsetalliance.com/. [Accessed: 01-Jan-2017].
[33] S. Sameer, “Android 7.0 Nougat: a more powerful OS, made for
you,” The official Android blog, 2016. [Online]. Available:
https://blog.google/products/android/android-70-nougat-more-powerful-os-
made/. [Accessed: 26-Feb-2017].
[34] “Android platform architecture,” 2017. [Online]. Available:
https://developer.android.com/guide/platform/index.html. [Accessed: 10-May-

Thesis for Master’s Degree at HIT and LiU
85
2017].
[35] “Android Source,” 2017. [Online]. Available:
https://source.android.com/. [Accessed: 12-May-2017].
[36] B. Eisenman, Learning React Native: Building Native Mobile Apps
with JavaScript. O’Reilly Media, 2015.
[37] “Github React,” 2017. [Online]. Available:
https://facebook.github.io/react/. [Accessed: 08-Apr-2017].
[38] J. Warén, “Cross-platform mobile software development with React
Native,” Haaga-Helia ammattikorkeakoulu, 2016.
[39] B. Sperry, “Announcing Ionic 1.0!,” Ionic Blog, 2015. [Online].
Available: http://blog.ionic.io/announcing-ionic-1-0/. [Accessed: 01-May-
2017].
[40] M. Hartington, “Announcing the Ionic 2 release candidate,” The
official Ionic blog, 2016. [Online]. Available: http://blog.ionic.io/announcing-
the-ionic-2-release-candidate/.
[41] M. Lynch, “Announcing Ionic 2.0.0 Final,” Ionic Blog, 2017.
[Online]. Available: http://blog.ionic.io/announcing-ionic-2-0-0-final/.
[Accessed: 20-Apr-2017].
[42] “IONIC.COM.” [Online]. Available:
https://ionicframework.com/docs/. [Accessed: 15-Mar-2017].
[43] “Ionic Components,” Ionic Docs, 2017. [Online]. Available:
https://ionicframework.com/docs/components/#overview. [Accessed: 15-Mar-
2017].
[44] “Ionic API Docs,” Ionic Docs, 2017. [Online]. Available:
https://ionicframework.com/docs/api/. [Accessed: 12-Mar-2017].
[45] F. Lardinois, “Google launches final release version of Angular
2.0,” Techcrunch, 2016. [Online]. Available:
https://techcrunch.com/2016/09/14/google-launches-final-release-version-of-
angular-2-0/. [Accessed: 17-Mar-2017].
[46] “Angular Architecture,” Angular Documentation, 2017. [Online].
Available: https://angular.io/docs/ts/latest/guide/architecture.html. [Accessed:
20-Feb-2017].
[47] “Cordova overview,” 2017. [Online]. Available:
https://cordova.apache.org/docs/en/latest/guide/overview/index.html.

Thesis for Master’s Degree at HIT and LiU
86
[Accessed: 01-May-2017].

Thesis for Master’s Degree at HIT and LiU
87
Statement of Originality and Letter of Authorization
学位论文原创性声明
Statement of Originality
本人郑重声明:此处所提交的学位论文《中文题目 English Title》,是本人
在导师指导下,在哈尔滨工业大学攻读学位期间独立进行研究工作所取得的成果。
且学位论文中除已标注引用文献的部分外不包含他人完成或已发表的研究成果。
对本学位论文的研究工作做出重要贡献的个人和集体,均已在文中以明确方式注
明。
作者签名: 日期: 年 月 日
学位论文使用权限
Letter of Authorization
学位论文是研究生在哈尔滨工业大学攻读学位期间完成的成果,知识产权归
属哈尔滨工业大学。学位论文的使用权限如下:
(1)学校可以采用影印、缩印或其他复制手段保存研究生上交的学位论文,
并向国家图书馆报送学位论文;(2)学校可以将学位论文部分或全部内容编入
有关数据库进行检索和提供相应阅览服务;(3)研究生毕业后发表与此学位论
文研究成果相关的学术论文和其他成果时,应征得导师同意,且第一署名单位为
哈尔滨工业大学。
保密论文在保密期内遵守有关保密规定,解密后适用于此使用权限规定。
本人知悉学位论文的使用权限,并将遵守有关规定。
作者签名: 日期: 年 月 日
导师签名: 日期: 年 月 日
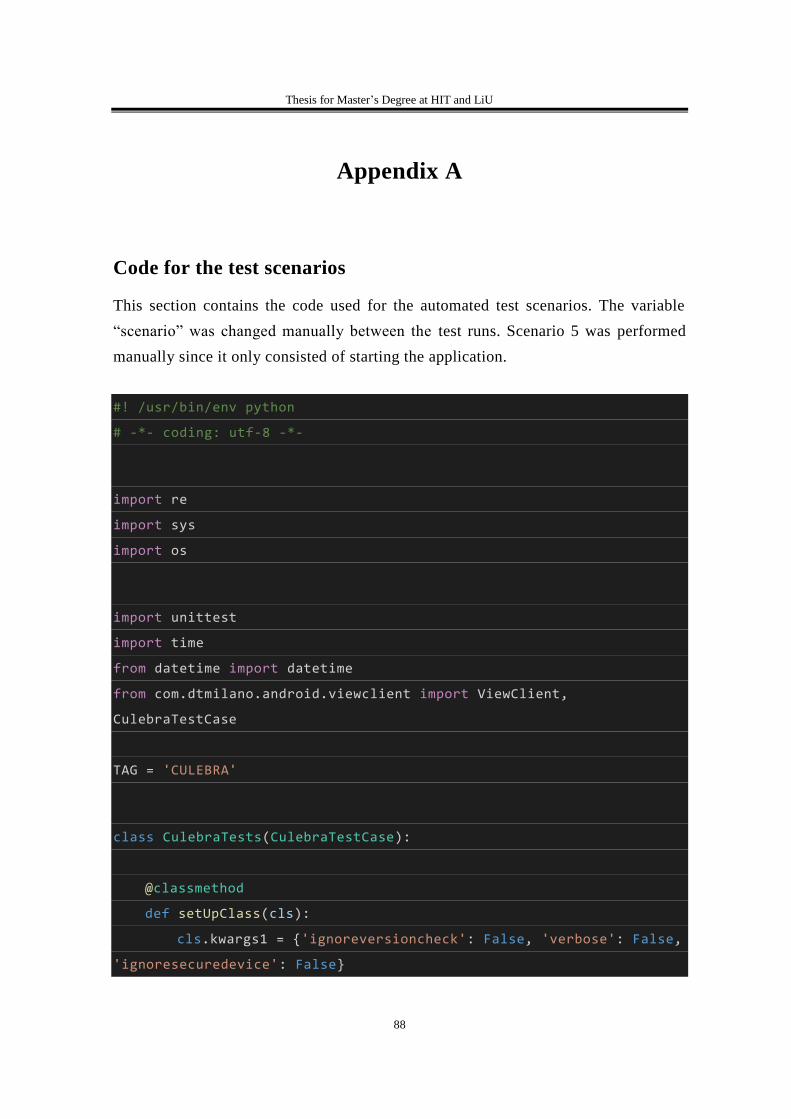
Thesis for Master’s Degree at HIT and LiU
88
Appendix A
Code for the test scenarios
This section contains the code used for the automated test scenarios. The variable
“scenario” was changed manually between the test runs. Scenario 5 was performed
manually since it only consisted of starting the application.
#! /usr/bin/env python
# -*- coding: utf-8 -*-
import re
import sys
import os
import unittest
import time
from datetime import datetime
from com.dtmilano.android.viewclient import ViewClient,
CulebraTestCase
TAG = 'CULEBRA'
class CulebraTests(CulebraTestCase):
@classmethod
def setUpClass(cls):
cls.kwargs1 = {'ignoreversioncheck': False, 'verbose': False,
'ignoresecuredevice': False}

Thesis for Master’s Degree at HIT and LiU
89
cls.kwargs2 = {'forceviewserveruse': False,
'useuiautomatorhelper': False, 'ignoreuiautomatorkilled': True,
'autodump': False, 'startviewserver': True, 'compresseddump': True}
cls.options = {'start-activity': None, 'concertina': False,
'device-art': None, 'use-jar': False, 'multi-device': False, 'unit-
test-class': True, 'save-screenshot': None, 'use-dictionary': False,
'glare': False, 'dictionary-keys-from': 'id', 'scale': 0.5, 'find-
views-with-content-description': True, 'window': -1, 'orientation-
locked': None, 'save-view-screenshots': None, 'find-views-by-id':
True, 'log-actions': False, 'use-regexps': False, 'null-back-end':
False, 'auto-regexps': None, 'do-not-verify-screen-dump': False,
'verbose-comments': False, 'gui': True, 'find-views-with-text': True,
'prepend-to-sys-path': False, 'install-APK': None, 'drop-shadow':
False, 'output': 'reactNativeTestCase1.py', 'unit-test-method': None,
'interactive': False}
cls.sleep = 5
def setUp(self):
super(CulebraTests, self).setUp()
def tearDown(self):
super(CulebraTests, self).tearDown()
def preconditions(self):
if not super(CulebraTests, self).preconditions():
return False
return True
def testSomething(self):
if not self.preconditions():
self.fail('Preconditions failed')
_s = CulebraTests.sleep
_v = CulebraTests.verbose

Thesis for Master’s Degree at HIT and LiU
90
t0 = time.time()
scenario = 1
self.vc.dump(window=-1)
self.vc.findViewWithTextOrRaise(u'AttenHome').touch()
t_start = time.time()
print("teststarted at " + str(t_start-t0))
self.vc.sleep(_s)
self.vc.dump(window=-1)
if scenario == 1
self.vc.findViewWithTextOrRaise(u'STATISTICS').touch()
t1 = time.time()
print("Pressed Stats tab at " + str(t1-t0))
self.vc.sleep(_s)
self.vc.dump(window=-1)
self.vc.findViewWithTextOrRaise(re.compile('Power
consumption*')).touch()
t2 = time.time()
print("Expanded power consumption graph at " + str(t2-
t0))
self.vc.sleep(_s)
self.vc.dump(window=-1)
self.vc.findViewWithTextOrRaise(re.compile('Temperature*')).touch()
t3= time.time()
print("Expanded temperature graph at " + str(t3-t0))
self.vc.sleep(_s)
self.vc.dump(window=-1)
elif scenario == 2

Thesis for Master’s Degree at HIT and LiU
91
self.vc.findViewWithTextOrRaise(re.compile('living_room*')).touch()
t_room = time.time()
print("roomscreen entered at " + str(t_room-t0))
self.vc.sleep(_s)
self.vc.dump(window=-1)
self.vc.findViewWithTextOrRaise(u'STATISTICS').touch()
t1 = time.time()
print("Pressed Stats tab at " + str(t1-t0))
self.vc.sleep(_s)
self.vc.dump(window=-1)
self.vc.findViewWithTextOrRaise(re.compile('Power
consumption*')).touch()
t2 = time.time()
print("Expanded power consumption graph at " + str(t2-
t0))
self.vc.sleep(_s)
self.vc.dump(window=-1)
self.vc.findViewWithTextOrRaise(re.compile('Temperature*')).touch()
t3= time.time()
print("Expanded temperature graph at " + str(t3-t0))
self.vc.sleep(_s)
self.vc.dump(window=-1)
elif scenario == 3
self.vc.findViewWithTextOrRaise(re.compile('living_room*')).touch()
t_room = time.time()
print("roomscreen entered at " + str(t_room-t0))
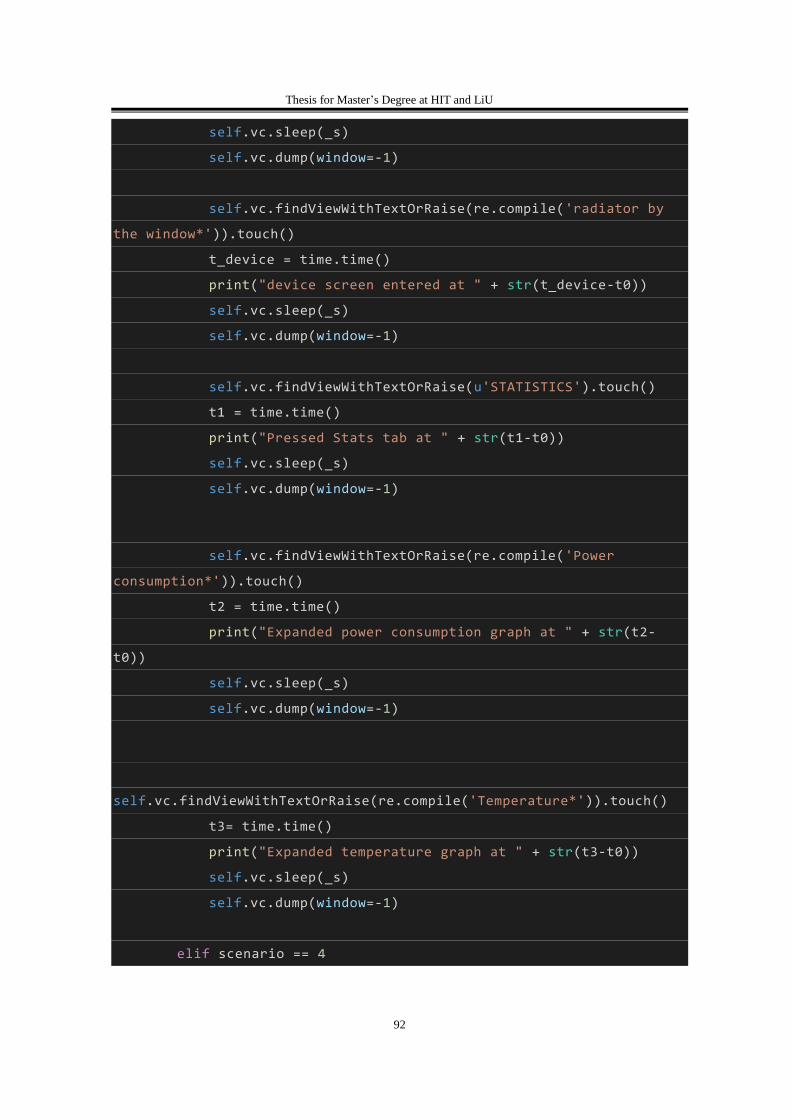
Thesis for Master’s Degree at HIT and LiU
92
self.vc.sleep(_s)
self.vc.dump(window=-1)
self.vc.findViewWithTextOrRaise(re.compile('radiator by
the window*')).touch()
t_device = time.time()
print("device screen entered at " + str(t_device-t0))
self.vc.sleep(_s)
self.vc.dump(window=-1)
self.vc.findViewWithTextOrRaise(u'STATISTICS').touch()
t1 = time.time()
print("Pressed Stats tab at " + str(t1-t0))
self.vc.sleep(_s)
self.vc.dump(window=-1)
self.vc.findViewWithTextOrRaise(re.compile('Power
consumption*')).touch()
t2 = time.time()
print("Expanded power consumption graph at " + str(t2-
t0))
self.vc.sleep(_s)
self.vc.dump(window=-1)
self.vc.findViewWithTextOrRaise(re.compile('Temperature*')).touch()
t3= time.time()
print("Expanded temperature graph at " + str(t3-t0))
self.vc.sleep(_s)
self.vc.dump(window=-1)
elif scenario == 4

Thesis for Master’s Degree at HIT and LiU
93
self.vc.findViewWithTextOrRaise(re.compile('living_room*')).touch()
t_room = time.time()
print("roomscreen entered at " + str(t_room-t0))
self.vc.sleep(_s)
self.vc.dump(window=-1)
self.vc.findViewWithTextOrRaise(re.compile('ceiling_lamp*')).touch()
t_device = time.time()
print("device screen entered at " + str(t_device-t0))
self.vc.sleep(_s)
self.vc.dump(window=-1)
self.vc.findViewByIdOrRaise("id/no_id/9").touch()
t_powered = time.time()
print("device screen power at " + str(t_powered-t0))
self.vc.sleep(_s)
self.vc.dump(window=-1)
self.device.press('KEYCODE_BACK')
t_back = time.time()
print("back button at " + str(t_back-t0))
self.vc.sleep(_s)
self.vc.dump(window=-1)
self.vc.findViewByIdOrRaise("id/no_id/11").touch()
t_poweron = time.time()
print("room screen power at " + str(t_poweron-t0))
self.vc.sleep(_s)
self.vc.dump(window=-1)
if __name__ == '__main__':
CulebraTests.main()
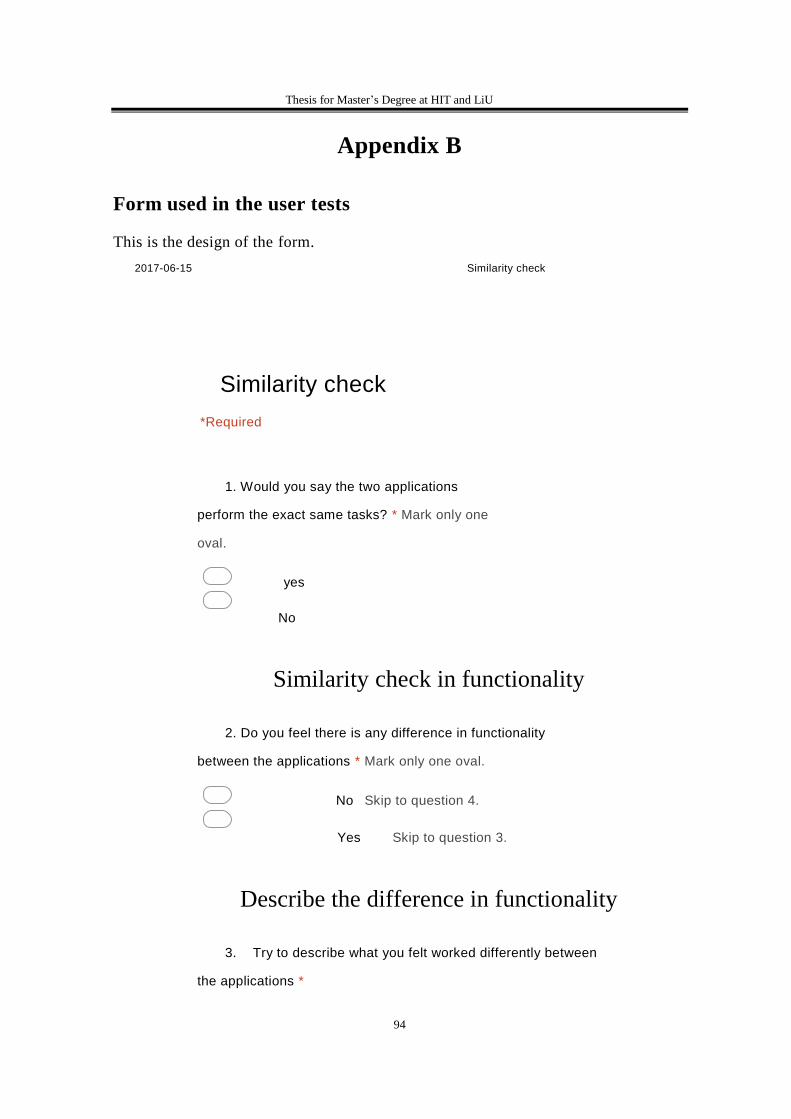
Thesis for Master’s Degree at HIT and LiU
94
Appendix B
Form used in the user tests
This is the design of the form.
20170615 Similarity check
Similarity check
*Required
1. Would you say the two applications
perform the exact same tasks? * Mark only one
oval.
yes
No
Similarity check in functionality
2. Do you feel there is any difference in functionality
between the applications * Mark only one oval.
No Skip to question 4.
Yes Skip to question 3.
Describe the difference in functionality
3. Try to describe what you felt worked differently between
the applications *

Thesis for Master’s Degree at HIT and LiU
95
4. What design differences did you see when performing
the test? *
5. Did you feel there was any difference in performance
between the two applications? * Mark only one oval.
yes Skip to question 6.
no Stop filling out this form.
Performance differences
https://docs.google.com/forms/d/1LSH6R17eylwq0W8iJTPW8vEUKlqivevP34rNKwPZj8Y/edit 1/2
20170615 Similarity check
6. Describe when and how you felt there was a difference in
performance. *
Design and performance

Thesis for Master’s Degree at HIT and LiU
96
Powered by

Thesis for Master’s Degree at HIT and LiU
97
Appendix C
This section provides the values and graphs gathered from running performance
tests on the five different scenarios described in 1.5.5 Performance testing. Starting up
each application took different amount of time. Each scenario was run with the
application already started except scenario 5, which consisted solely of starting up the
application. Each test was made five times, what is shown in the graphs is the average
data points from those five test runs. The results are shown in accordance to each
device that performed the tests.
CPU load
The graphs: Figure 33, Figure 34, Figure 35, Figure 36, Figure 37, Figure 38,
Figure 39, Figure 40, Figure 41 and Figure 42 show the CPU load on the different
devices in the different scenarios. The scenarios follow the order given in 1.5.5
Performance testing.
Scenario 1
Figure 33: CPU load of scenario 1, using Sony Xperia x Performance

Thesis for Master’s Degree at HIT and LiU
98
The average CPU load when using Sony Xperia X Performance was:
React Native: 30%
Ionic 2: 28%
Android: 24%
Figure 34: CPU load of scenario 1, using Samsung Galaxy S7
The average CPU load when using Samsung Galaxy S7 was:
React Native: 19%
Ionic 2: 21%
Android: 20%

Thesis for Master’s Degree at HIT and LiU
99
Scenario 2
Figure 35: CPU load of scenario 2, using Sony Xperia x Performance
The average CPU load when using Sony Xperia X Performance was:
React Native: 29%
Ionic 2: 28%
Android: 25%

Thesis for Master’s Degree at HIT and LiU
100
Figure 36: CPU load of scenario 2, using Samsung Galaxy S7
The average CPU load when using Samsung Galaxy S7 was:
React Native: 19%
Ionic 2: 21%
Android: 16%

Thesis for Master’s Degree at HIT and LiU
101
Scenario 3
Figure 37: CPU load of scenario 3, using Sony Xperia x Performance
The average CPU load when using Sony Xperia X Performance was:
React Native: 31%
Ionic 2: 30%
Android: 25%

Thesis for Master’s Degree at HIT and LiU
102
Figure 38: CPU load of scenario 3, using Samsung Galaxy S7
The average CPU load when using Samsung Galaxy S7 was:
React Native: 21%
Ionic 2: 22%
Android: 17%

Thesis for Master’s Degree at HIT and LiU
103
Scenario 4
Figure 39: CPU load of scenario 4, using Sony Xperia x Performance
The average CPU load when using Sony Xperia X Performance was:
React Native: 30%
Ionic 2: 27%
Android: 25%

Thesis for Master’s Degree at HIT and LiU
104
Figure 40: CPU load of scenario 4, using Samsung Galaxy S7
The average CPU load when using Samsung Galaxy S7 was:
React Native: 21%
Ionic 2: 18%
Android: 18%

Thesis for Master’s Degree at HIT and LiU
105
Scenario 5
Figure 41: CPU load of scenario 5, using Sony Xperia x Performance
The average CPU load when using Sony Xperia X Performance was:
React Native: 34%
Ionic 2: 49%
Android: 30%

Thesis for Master’s Degree at HIT and LiU
106
Figure 42: CPU load of scenario 5, using Samsung Galaxy S7
The average CPU load when using Samsung Galaxy S7 was:
React Native: 33%
Ionic 2: 38%
Android: 28%
Memory usage
The graphs: Figure 43, Figure 44, Figure 45, Figure 46, Figure 47, Figure 48,
Figure 49, Figure 50, Figure 51 and Figure 52 show the memory usage on the different
devices in the different scenarios. The scenarios follow the order described in 1.5.5
Performance testing.

Thesis for Master’s Degree at HIT and LiU
107
Scenario 1
Figure 43: Memory usage of scenario 1, using Sony Xperia X Performance
The average Memory usage when using Sony Xperia X Performance was:
React Native: 2659048 KB
Ionic 2: 2687260 KB
Android: 2695097 KB

Thesis for Master’s Degree at HIT and LiU
108
Figure 44: Memory usage of scenario 1, using Samsung Galaxy S7
The average Memory usage when using Samsung Galaxy S7 was:
React Native: 3500666 KB
Ionic 2: 3555632 KB
Android: 3572600 KB
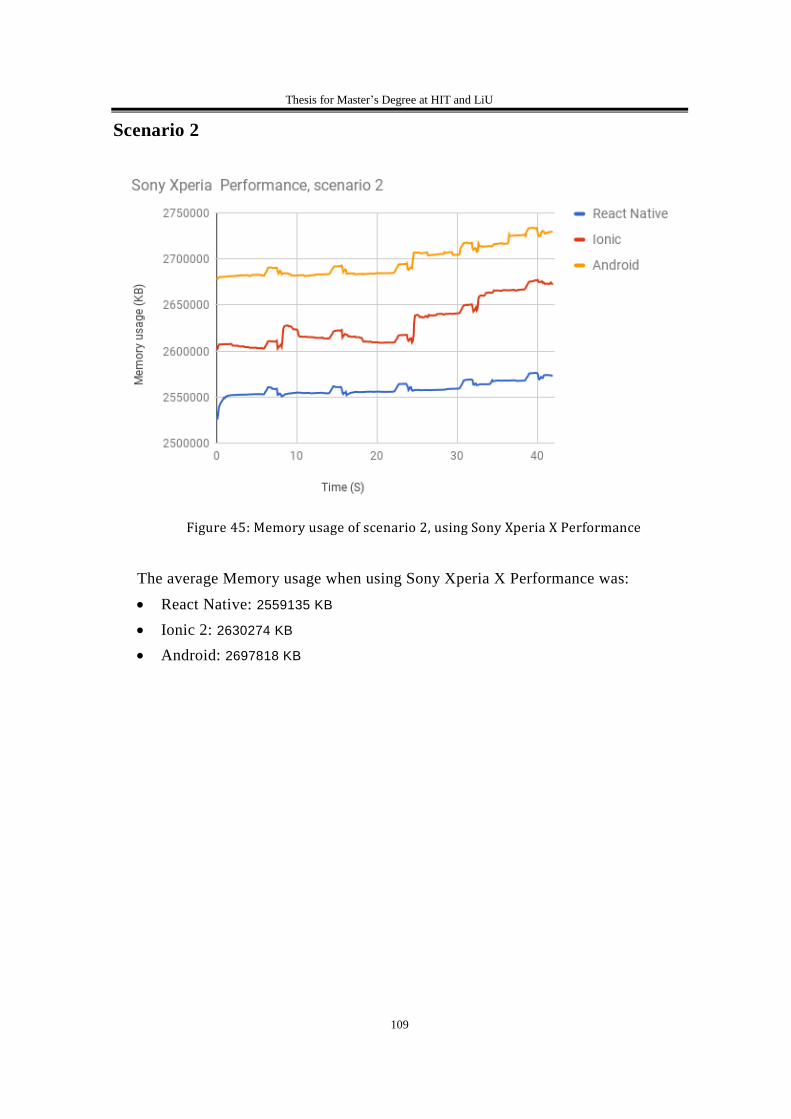
Thesis for Master’s Degree at HIT and LiU
109
Scenario 2
Figure 45: Memory usage of scenario 2, using Sony Xperia X Performance
The average Memory usage when using Sony Xperia X Performance was:
React Native: 2559135 KB
Ionic 2: 2630274 KB
Android: 2697818 KB

Thesis for Master’s Degree at HIT and LiU
110
Figure 46: Memoy usage of scenario 2, using Samsung Galaxy S7
The average Memory usage when using Samsung Galaxy S7 was:
React Native: 3503890 KB
Ionic 2: 3554458 KB
Android: 3558166 KB

Thesis for Master’s Degree at HIT and LiU
111
Scenario 3
Figure 47: Memory usage of scenario 3, using Sony Xperia x Performance
The average Memory usage when using Sony Xperia X Performance was:
React Native: 2561754 KB
Ionic 2: 2639946 KB
Android: 2693245 KB

Thesis for Master’s Degree at HIT and LiU
112
Figure 48: Memory usage of scenario 3, using Samsung Galaxy S7
The average Memory usage when using Samsung Galaxy S7 was:
React Native: 3493419 KB
Ionic 2: 3564175 KB
Android: 3550109 KB

Thesis for Master’s Degree at HIT and LiU
113
Scenario 4
Figure 49: Memory usage of scenario 4, using Sony Xperia x Performance
The average Memory usage when using Sony Xperia X Performance was:
React Native: 2611640 KB
Ionic 2: 2650451 KB
Android: 2679300 KB

Thesis for Master’s Degree at HIT and LiU
114
Figure 50: Memory usage of scenario 4, using Samsung Galaxy S7
The average Memory usage when using Samsung Galaxy S7 was:
React Native: 3521586 KB
Ionic 2: 3551798 KB
Android: 3563389 KB

Thesis for Master’s Degree at HIT and LiU
115
Scenario 5
Figure 51: Memory usage of scenario 5, using Sony Xperia x Performance
The average Memory usage when using Sony Xperia X Performance was:
React Native: 2628034 KB
Ionic 2: 2710087 KB
Android: 2682380 KB
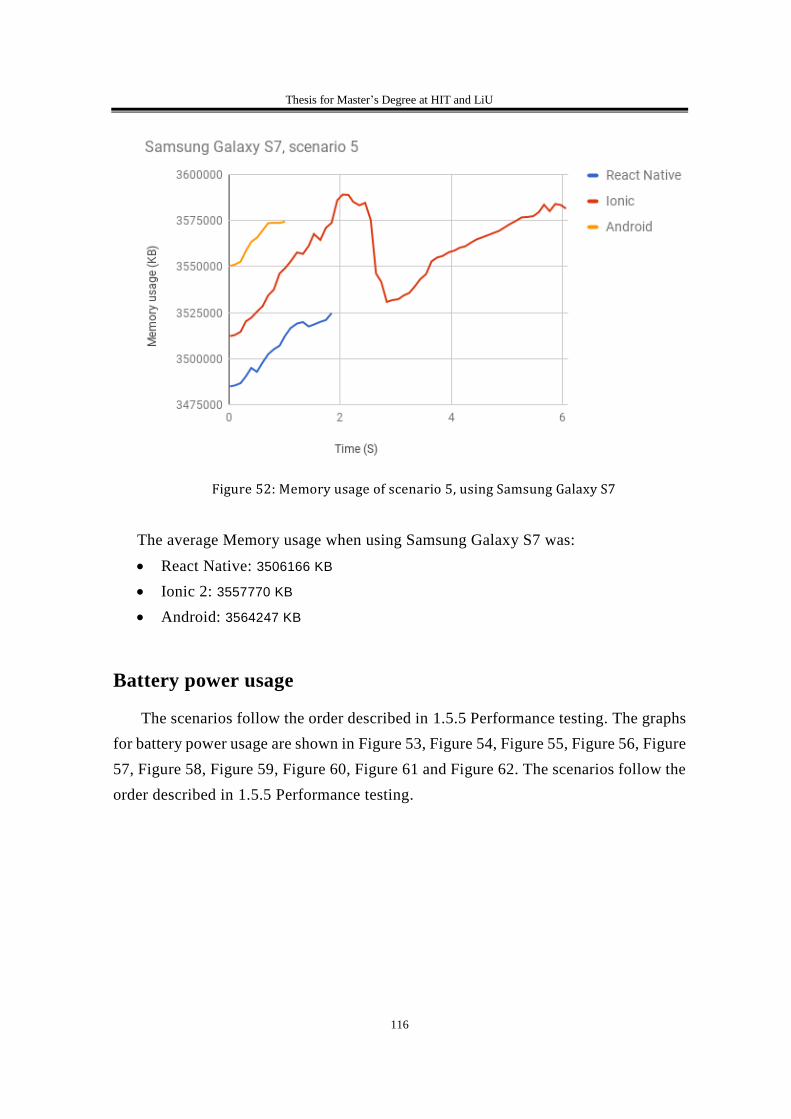
Thesis for Master’s Degree at HIT and LiU
116
Figure 52: Memory usage of scenario 5, using Samsung Galaxy S7
The average Memory usage when using Samsung Galaxy S7 was:
React Native: 3506166 KB
Ionic 2: 3557770 KB
Android: 3564247 KB
Battery power usage
The scenarios follow the order described in 1.5.5 Performance testing. The graphs
for battery power usage are shown in Figure 53, Figure 54, Figure 55, Figure 56, Figure
57, Figure 58, Figure 59, Figure 60, Figure 61 and Figure 62. The scenarios follow the
order described in 1.5.5 Performance testing.

Thesis for Master’s Degree at HIT and LiU
117
Scenario 1
Figure 53: Battery power usage of scenario 1, using Sony Xperia X Performance
The average battery power usage when using Sony Xperia X Performance was:
React Native: 402795 uW
Ionic 2: 483387 uW
Android: 313969 uW

Thesis for Master’s Degree at HIT and LiU
118
Figure 54: Battery power usage of scenario 1, using Samsung Galaxy S7
The average battery power usage when using Samsung Galaxy S7 was:
React Native: 493447 uW
Ionic 2: 648522 uW
Android: 532542 uW
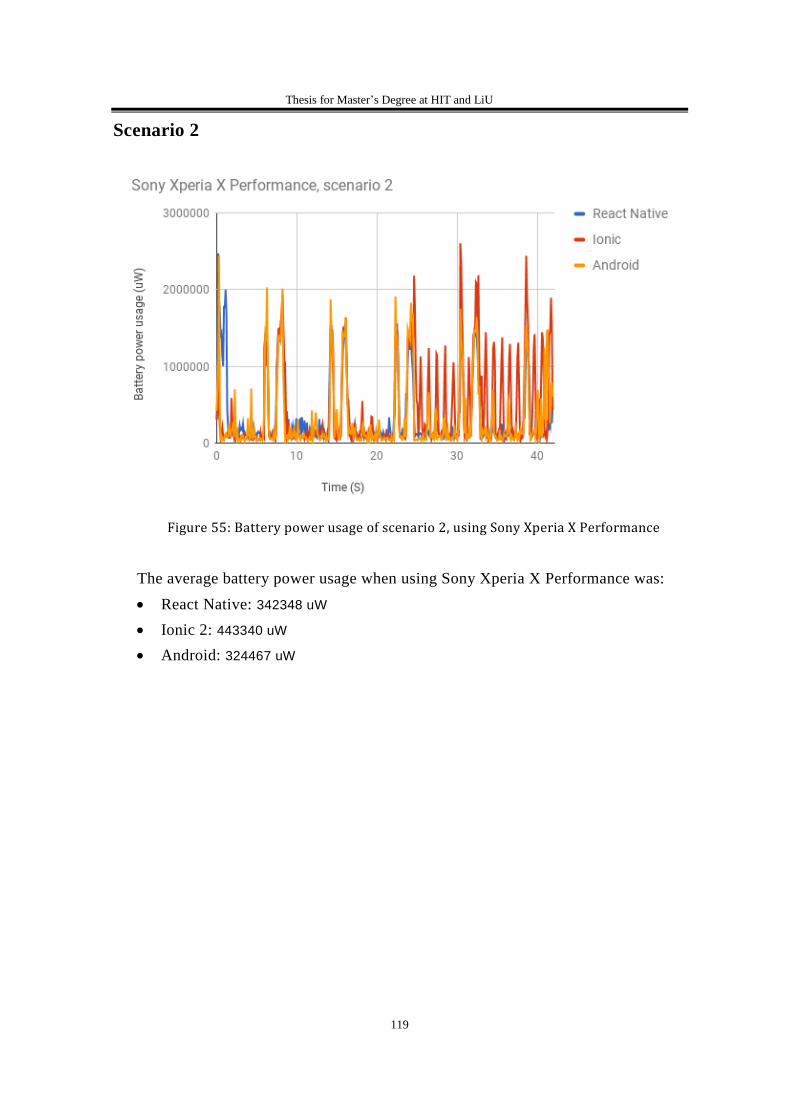
Thesis for Master’s Degree at HIT and LiU
119
Scenario 2
Figure 55: Battery power usage of scenario 2, using Sony Xperia X Performance
The average battery power usage when using Sony Xperia X Performance was:
React Native: 342348 uW
Ionic 2: 443340 uW
Android: 324467 uW
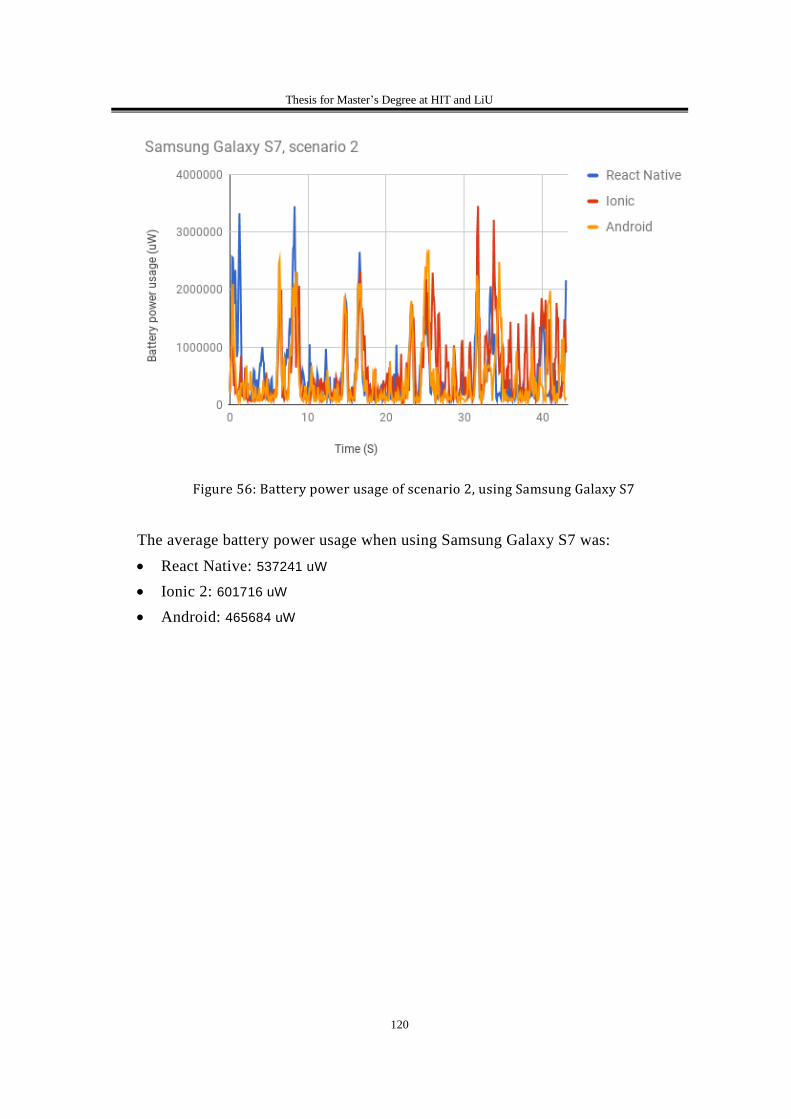
Thesis for Master’s Degree at HIT and LiU
120
Figure 56: Battery power usage of scenario 2, using Samsung Galaxy S7
The average battery power usage when using Samsung Galaxy S7 was:
React Native: 537241 uW
Ionic 2: 601716 uW
Android: 465684 uW

Thesis for Master’s Degree at HIT and LiU
121
Scenario 3
Figure 57: Battery power usage of scenario 3, using Sony Xperia X Performance
The average battery power usage when using Sony Xperia X Performance was:
React Native: 395447 uW
Ionic 2: 531068 uW
Android: 341768 uW

Thesis for Master’s Degree at HIT and LiU
122
Figure 58: Battery power usage of scenario 3, using Samsung Galaxy S7
The average battery power usage when using Samsung Galaxy S7 was:
React Native: 547393 uW
Ionic 2: 686719 uW
Android: 462004 uW

Thesis for Master’s Degree at HIT and LiU
123
Scenario 4
Figure 59: Battery power usage of scenario 4, using Sony Xperia X performance
The average battery power usage when using Sony Xperia X Performance was:
React Native: 371400 uW
Ionic 2: 338496 uW
Android: 308926 uW

Thesis for Master’s Degree at HIT and LiU
124
Figure 60: Battery power usage of scenario 4, using Samsung Galaxy S7
The average battery power usage when using Samsung Galaxy S7 was:
React Native: 666478 uW
Ionic 2: 477251 uW
Android: 453412 uW

Thesis for Master’s Degree at HIT and LiU
125
Scenario 5
Figure 61: Battery power usage of scenario 5, using Sony Xperia X Performance
The average battery power usage when using Sony Xperia X Performance was:
React Native: 1469356 uW
Ionic 2: 1734053 uW
Android: 1354780 uW

Thesis for Master’s Degree at HIT and LiU
126
Figure 62: Battery power usage of scenario 5, using Samsung Galaxy S7
The average battery power usage when using Samsung Galaxy S7 was:
React Native: 1626583 uW
Ionic 2: 2146919 uW
Android: 1483942 uW

Thesis for Master’s Degree at HIT and LiU
127
Appendix D
This appendix consists of code from the Val-home application.
Home page TypeScript
In Ionic 2, every page has a selector. Each page can have either HTML code or a
separate file, which is specified in the templateUrl. Every page in the application has
at least one provider which is a service used for requests to the back end. Every page
has a constructor. The NavController is in charge of jumping between the pages and
the NavParams is in charge of pushing values between the pages.
@Component({
selector: 'page-home',
templateUrl: 'home.html',
providers: [HouseApiCallsservice]
})
export class HomePage implements OnInit{
@ViewChild(Slides) slides: Slides;
selectedSegment: string;
houses: House[];
house: House;
rooms: Room[];
roomList: Room[];
shownPowerChart = false;
shownTemperatureChart = false;
constructor(public loadingCtrl: LoadingController, private
apicallsservice: ApiCallsservice, public navCtrl:
NavController, public navParams: NavParams) {
this.selectedSegment = 'first';
}
togglePowerChart() {
if (this.isPowerChartShown()) {
this.shownPowerChart = false;

Thesis for Master’s Degree at HIT and LiU
128
} else {
this.shownPowerChart = true;
}
};
isPowerChartShown() {
return this.shownPowerChart;
};
toggleTemperatureChart() {
if (this.isTemperatureChartShown()) {
this.shownTemperatureChart = false;
} else {
this.shownTemperatureChart = true;
}
};
isTemperatureChartShown() {
return this.shownTemperatureChart;
};
When entering a room from the home screen the information for the room selected is
saved and pushed to the next state, which is a child page. The same procedure is made
when entering a lamp-page or a radiator page from the room screen.
itemTapped(event, item) {
this.navCtrl.push(RoomsPage, {
room: item
});
}
The ngOnInit is run before the constructor is. When starting the application a
loading screen is introduced. The loading screen stays until all the rooms have been
loaded. Since the service uses promises that are asynchronous, a forkjoin needs to be
introduced in order to know when the promise has been fulfilled. The switchmap is
then used to request data updates about the house every second. The switchmap is used
in every page to request updated data every second. This is not the best way to
implement an updating function but it mimics the updating function of the Atten-home.

Thesis for Master’s Degree at HIT and LiU
129
ngOnInit():
void {
let loader = this.loadingCtrl.create({
content: "Please wait...",
});
loader.present();
Observable.forkJoin( this.apicallsservice.getHouses(),
this.apicallsservice.getRooms())
.subscribe(p => {
this.houses = p[0];
this.house = this.houses[0];
this.rooms = p[1];
this.roomList = this.rooms.filter(h => h.houseId ===
this.houses[0]._id);
loader.dismissAll();
});
const source = Observable.interval(1000);
source.switchMap(e => Observable.forkJoin(
this.apicallsservice.getHouse(this.house._id)))
.subscribe(h => {
this.house.powerData = h[0].powerData;
this.house.temperature = h[0].temperature;
});
}
Services in TypeScript
The services used in the application are used for requesting data. The different
ApiCallServices have the same functionality but they are used for different requests.
The service DeviceApiCallService is shown here:
getDevices():
Observable<Device[]>
{
let devices$ = this.http

Thesis for Master’s Degree at HIT and LiU
130
.get(this.baseUrl + 'devices', {headers:
this.getHeaders()})
.map(mapDevices);
return devices$;
}
getDevice(id): Observable<Device> {
let device$ = this.http
.get(this.baseUrl + 'devices/' + id, {headers:
this.getHeaders()})
.map(mapDevice);
return device$;
}
updateDevice(device): Observable<Response> {
console.log(this.baseUrl + 'devices/' +
device._id);
console.log(JSON.stringify(device));
let response$ = this.http
.put(this.baseUrl + 'devices/' + device._id,
JSON.stringify(device), {headers: this.getHeaders()})
return response$;
}
private getHeaders(){
let headers = new Headers();
headers.append('Accept', 'application/json');
headers.append('Content-Type',
'application/json');
return headers;
}
}
function
mapDevices(response:Response):
Device[]{
return response.json().map(toDevice);
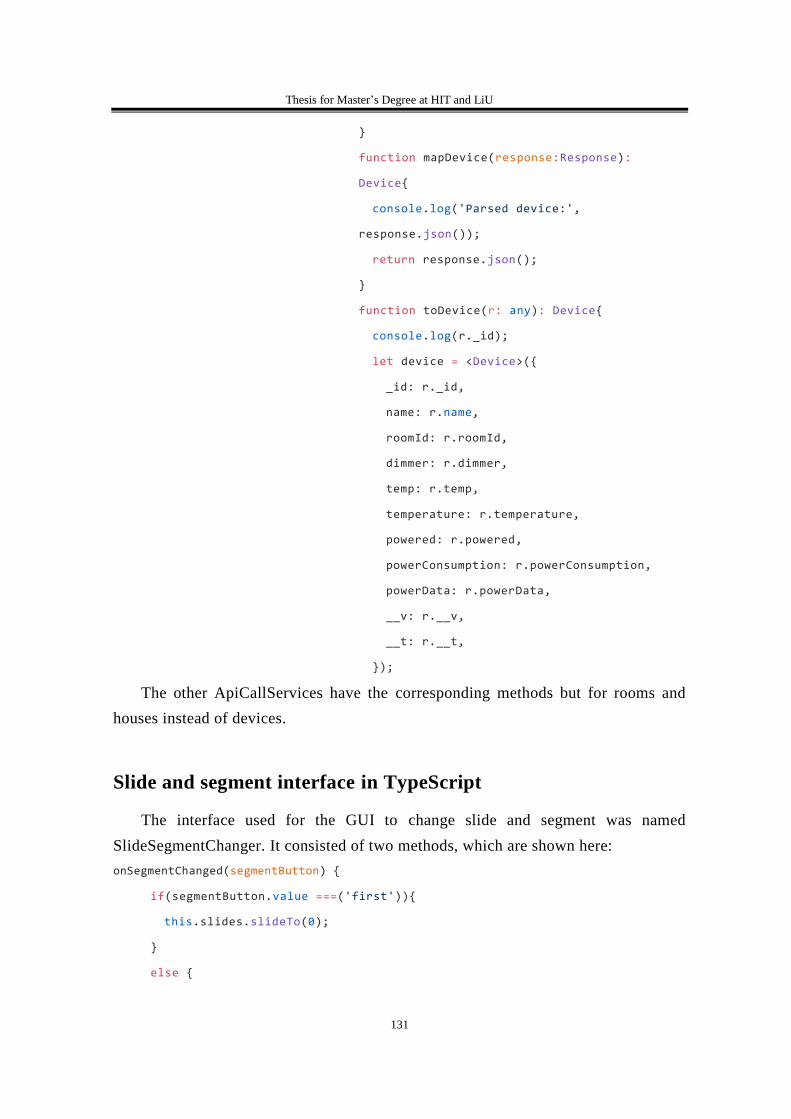
Thesis for Master’s Degree at HIT and LiU
131
}
function mapDevice(response:Response):
Device{
console.log('Parsed device:',
response.json());
return response.json();
}
function toDevice(r: any): Device{
console.log(r._id);
let device = <Device>({
_id: r._id,
name: r.name,
roomId: r.roomId,
dimmer: r.dimmer,
temp: r.temp,
temperature: r.temperature,
powered: r.powered,
powerConsumption: r.powerConsumption,
powerData: r.powerData,
__v: r.__v,
__t: r.__t,
});
The other ApiCallServices have the corresponding methods but for rooms and
houses instead of devices.
Slide and segment interface in TypeScript
The interface used for the GUI to change slide and segment was named
SlideSegmentChanger. It consisted of two methods, which are shown here:
onSegmentChanged(segmentButton) {
if(segmentButton.value ===('first')){
this.slides.slideTo(0);
}
else {

Thesis for Master’s Degree at HIT and LiU
132
this.slides.slideTo(1);
}
}
onSlideChanged(slider) {
const currentSlide = this.slides.getActiveIndex();
if(currentSlide === 0){
this.selectedSegment = 'first';
}
else {
this.selectedSegment = 'second';
}
console.log(currentSlide);
}
The selectedSegment was connected through a ngModel in the HTML code:
<ion-segment [(ngModel)]="selectedSegment" (ionChange)="onSegmentChanged($event)">
The Ionslide was a function already existing in Ionic 2. The function listened to a
change event.
<ion-slides #mySlider (ionSlideDidChange)="onSlideChanged($event)">
Accordion
The accordion was made by making a class with TypeScript, which sole purpose
was to show a chart. The class could later be used in the HTML code.
@Component({
selector: 'linechart',
template: '<canvas #lineCanvas></canvas>',
})
export class LineChart {
@ViewChild('lineCanvas') lineCanvas;
@Input() points;
lineChart: any;
ngOnChanges(changes: SimpleChanges) {
if(this.points){

Thesis for Master’s Degree at HIT and LiU
133
console.log(this.points);
this.lineChart = new Chart(this.lineCanvas.nativeElement,
{
type: 'line',
options: {
animation: false
},
data: {
labels: ["1", "2", "3", "4", "5", "6", "7", "8", "9",
"10", "11", "12", "13", "14", "15", "16", "17", "18"],
datasets: [
{
label: "Power Data",
fill: false,
lineTension: 0.1,
backgroundColor: "rgba(110,0,0,0.4)",
borderColor: "rgba(1100,0,0,1)",
borderCapStyle: 'butt',
borderDash: [],
borderDashOffset: 0.0,
borderJoinStyle: 'miter',
pointBorderColor: "rgba(110,0,0,1)",
pointBackgroundColor: "#fff",
pointBorderWidth: 1,
pointHoverRadius: 5,
pointHoverBackgroundColor: "rgba(220,0,0,1)",
pointHoverBorderColor: "rgba(220,0,0,1)",
pointHoverBorderWidth: 2,
pointRadius: 1,
pointHitRadius: 10,
data: this.points.slice(this.points.length-19,
this.points.length-1),
spanGaps: false,
}

Thesis for Master’s Degree at HIT and LiU
134
]
}
});
}
}
}
The class needs to be included as an NgModule in the app.module.ts. When a
boolean is set the code below is displayed which enables the chart to be shown and
hidden depending on the boolean.
<ion-
item>
<ion-card>
<ion-card-header>
Power data Chart
</ion-card-header>
<ion-card-content>
<linechart style="display: block"
[points]="house?.powerData"></linechart>
</ion-card-content>
</ion-card>
</ion-item>