a comparison of male and female pathological …a comparison of male and female pathological...
TRANSCRIPT

A Comparison of Male and Female Pathological Gamblers
Tony Toneatto Clinical Research Department
Centre for Addiction and Mental Health
Roberta Boughton Problem Gambling Service
Centre for Addiction and Mental Health
Diane Borsoi Clinical Research Department
Centre for Addiction and Mental Health
June 2002
Research findings, results, interpretations and conclusions expressed in this report are those solely of the author and are not necessarily those of the Ministry of Health and Long Term Care.
This research was supported by contract RFP99-044 from the Ontario Substance Abuse Bureau of the Ministry of Health and Long-Term Care.

A Comparison of Male and Female Pathological Gamblers
2
Abstract
Very little is known how female problem gamblers differ from male problem gamblers.
Virtually all of the available empirical research has been conducted on male gamblers. This
study systematically explored gender differences on a wide range of psychiatric, psychological
social, and gambling-related variables. The sample consisted of 148 females and 112 males
recruited from the community. All participants were classified into 3 groups according to DSM-
IV criteria. Pathological Gamblers endorsed at least 5 out of 10 DSM (n = 125; 52 males, 73
females) symptoms for pathological gambling. Problem gamblers endorsed between 1 and 4
DSM symptoms (n = 101; 44 males, 57 females). Asymptomatic gamblers endorsed no DSM
symptoms (n = 33; 17 females, 16 males). The only consistent pattern of findings was related to
gambling severity. Pathological gamblers tended to score in a more dysfunctional direction on
all measures compared to problem gamblers who in turn scored worse than the asymptomatic
gamblers. There were very few gender differences and even fewer gender-gambling severity
interactions. This suggests that male and female gamblers may be more similar than different on
common measures of psychiatric and psychosocial functioning. Differences between male and
female gamblers would more likely be attributable to differences in the severity of gambling than
to gender-specific differences.

A Comparison of Male and Female Pathological Gamblers
3
Introduction
Despite the increasing prevalence of all forms of gambling within North American society
within the past several years and the corresponding increase in the numbers of individuals
seeking counseling for problem gambling, our knowledge about the nature of problem gambling
in women, compared to men, is scarce (Mark & Lesieur, 1992). The vast majority of empirical
studies have either included only male gamblers or an insufficient number of women to permit
meaningful comparisons. Mark and Lesieur (1992), who have reviewed this literature, found
that only 5 studies had addressed pathological gambling in women. These studies, however,
were primarily of women who attended Gamblers Anonymous, hardly a representative source of
women problem gamblers. Furthermore, where sizeable of women gamblers have been studied,
differences in sampling, methodology and assessment have made comparisons with other studies
including women difficult. Consequently, the findings of empirical gambling research cannot be
readily generalized to women gamblers.
The lack of knowledge about female problem gamblers is of considerable import as
epidemiological studies in the United States and Canada indicate that women and men gamble at
fairly similar rates in the general population. Up to a third of problem gamblers may be women
(Shaffer, Hall, & Bilt, 1997). With women comprising a substantial proportion of clinical
populations, their neglect in research has yielded a strong male bias in the conceptualization of
problem gambling and it’s treatment. Without this critical data, treatment and prevention efforts
directed at women will lack sensitivity to the unique clinical issues that may significant to this
population. This may result in less effective treatments or prevention efforts, increased drop out
from treatment and higher relapse rates. Prior to describing a proposal to increase our
knowledge of women problem gamblers, the available knowledge will be briefly reviewed.

A Comparison of Male and Female Pathological Gamblers
4
Literature Review
The available data suggest that women, compared to men, generally have a later onset of
gambling (Lesieur & Rosenthal, 1991), report a shorter duration between non-problem and
problem gambling (Rosenthal, 1992; Lesieur, 1988), tend to gamble within a social context,
focus on games that are not considered to require skill (e.g., bingo, slot machines) or intended to
enhance social functioning or esteem (Lorenz, 1990; Rosenthal, 1992), tend to wager smaller
amounts, and adopt gambling as a means to cope with dysphoric emotions (Rosenthal, 1992).
Gambling Patterns
Volberg and Banks (1990), Lesieur (1988), and Hraba and Lee (1996) have suggested
that the scope of gambling (i.e., number of gambling forms engaged in by women) is narrower
among women, who tend to prefer legal forms of gambling especially bingo or slot machines.
Men, however, tend to be broader in their gambling, encompassing both illegal and legal
activities and gambling on activities believed to require skill (e.g., cards, race track) but also on
activities not normally associated with gambling (e.g., stocks, real estate) (Toneatto et al., 1997).
In their study of lottery gamblers, Hraba and Lee (1996) did not find any gender differences in
the frequency, wagering, leisure time spent gambling, loss of control or number of gambling-
related consequences.

A Comparison of Male and Female Pathological Gamblers
5
Socioeconomic Variables
The Problem Gambling Service of the Centre for Addiction and Mental Health (CAMH)
and the Ontario Gambling Helpline have found that female gamblers seeking treatment have
tended to be middle aged (approximately 42 years of age), with a third reporting education
beyond high-school, and generally employed. In contrast, a study by Alberta Alcohol and Drug
Abuse Commission (1994) found that female problem gamblers tended to be uneducated and
living on lower incomes compared to non-gambling females. Boughton (in preparation) has
noted that this may be one factor leading to the observation that women develop a gambling
more rapidly than men (i.e., less financial resources to cushion losses, greater proportion of
income spent gambling). This may consequently explain the greater debt load observed in male
problem gamblers compared to females (3-8:1 ratio; Lesieur & Blume, 1991; Brown &
Coventry, 1997). The observation that women tend to prefer non-skill games such as lotteries,
slot machines and bingo may also be a correlate of the available financial resources they are able
to devote towards gambling as these games tend to be relatively inexpensive and often widely
available. For example, a study of 52 female compulsive gamblers attending Gamblers
Anonymous in Las Vegas found that 90% developed their problem playing video poker. Martin
and Kirkcaldy (1998) have noted that men attach more value and importance to money as
symbolic of importance, prestige, acceptance, recognition, and power, consistent with the desire
for dominance that may characterize male psychology to a greater degree than for women. Thus,
the meaning women assign money (and money gambled) may differ.

A Comparison of Male and Female Pathological Gamblers
6
Social Variables
Social factors, unique to women, appear to be implicated in the development of problem
gambling. These variables can act through a variety of pathways. Gambling may not only be a
rewarding escape from marital or relational distress but can also take place within a rewarding
social context in and of itself. Brown and Coventry (1997) found that boredom, isolation and
loneliness were common gambling triggers for women. Dysfunctional family history,
encompassing parental alcoholism, problem gambling and psychiatric illness has been reported
among problem gambling women (Lesieur & Blume, 1991; Custer & Milt, 1985; Lesieur,
1988). Hraba and Lee (1996) found that childhood exposure to gambling, frequent marriages
and residential moves, lack of religious affiliation and armed forces service distinguished
problem gambling women from men. Rates of childhood physical and sexual abuse was found
to be higher among female problem gamblers than in national samples (32.5% vs 1-2%;
Specker et al. 1996) and has been considered a precipitating factor in pathological gambling
among women. Abuse has been reported less frequently by male problem gamblers.
Dissatisfaction within the marital dyad also appears to be a common correlate among female
problem gamblers. Separation, divorce, or never having been married characterized women
problem gamblers more than men (Lesieur , 1988; Lesieur & Blume, 1991).
Psychiatric Comorbidity
Problem gamblers have been shown to suffer from considerable concurrent psychiatric
symptomatology. Reviews of this literature have shown affective disorders, anxiety disorders,
and attention deficit disorder to be particularly common (Lesieur & Blume, 1991; Rosenthal,
1992, McCormick, Russo, Ramirez & Taber, 1984; Linden, Pope and Jonas, 1986). Similar
A Comparison of Male and Female Pathological Gamblers
7
results have been reported by the Problem Gambling Service of the CAMH in their study of 53
women problem gamblers (unpublished data). Analyses by gender have been few due to
insufficient number of women included in such research. An exception is the Specker et al.
(1996) study. They found almost all of a sample of 40 problem gamblers (which included 15
women) to have had a lifetime mood disorder and most female (but few male) gamblers to have
had a lifetime anxiety disorder diagnosis. Specker et al., (1996) found avoidant personality
disorder to occur more frequently among women gamblers and may be associated with a pattern
labeled ‘female avoidant gambler’ to describe women who choose gambling activities that are
isolating. Escape gambling has generally been considered to be more common among female
problem gamblers whereas men have tended to be described as action gamblers (Custer & Milt,
1985; Lesieur, 1988). Blaszczynski and Steel (1998) found women had higher rates of
dependent personality disorder (68% vs. 42%) but lower rates of obsessive-compulsive
personality (14% vs. 38%) and passive-aggressive disorder (14% vs. 43%), as measured by
questionnaire, in 22 women and 60 men seeking treatment for problem gambling.
Cognitive Distortions
In recent years cognitive distortions among gamblers has been the focus of experimental
study (Ladouceur, Gaboury, Dumont & Rochette, 1988; Walker, 1992; Toneatto, 1999).
Toneatto et al. (1997) recruited heavy gamblers from the community and interviewed them about
specific tactics and strategies used to increase the chance of winning at gambling. Women
significantly favored non-skill games (i.e., bingo, lottery playing) while men favoured skill
games (outcome (i.e., card-playing, sports lotteries, horse-track betting). There were no
significant sex differences in the number of distortions reported. Only one of the 13 types of

A Comparison of Male and Female Pathological Gamblers
8
cognitive distortions showed a sex difference with more men than women (85% vs. 25%)
adopting a Skill Orientation (gambling systems, exaggerated confidence). Similar sex differences
in gamblers have been reported by Rosenthal (1992) and Lorenz (1990).
Addictive Disorders
While higher rates of alcoholism and other substance use has been reported among
gamblers than in the general population (e.g., Abbott & Volberg, 1991, Ladouceur, Dube, &
Bujold, 1994) there is little data regarding the effect of gender on substance use among
pathological gamblers.
In a recent study, Toneatto and Skinner (2000) studied the relationship between gender
and patterns of licit, illicit and prescribed psychoactive substance use and abuse in a sample of
treatment-seeking pathological gamblers. More women reported lifetime use of psychiatric
medications, abuse of medications, treatment for abuse of medications, medication use at the
time of seeking treatment for gambling, and medication use during the twelve month follow-up
period post-treatment. Frequencies for the use of psychiatric medications also showed analogous
significant gender differences. Several gender differences in individual substance use were also
observed. Women were more likely to report greater lifetime use of anti-depressants, anxiolytics,
and sedatives and greater use of these substances during the one-year post-gambling treatment
follow-up period. There were no gender differences in proportion of individuals reporting
lifetime use of any specific drugs, history of drug problems, drug treatment, or drug use either at
pre-treatment or during the one- year follow-up.
Men were more likely than women to be drinking alcohol in the month prior to seeking
treatment for gambling (64.3% vs. 26.0%, respectively) and during the 12 month follow-up

A Comparison of Male and Female Pathological Gamblers
9
period (69.7% vs. 38.7%). Men also consumed significantly more alcohol drinks on any one day
in the month prior to treatment than did women. There were no significant differences, however,
in the proportion of men (12.9%) and women (9.1%) who reported an alcohol problem at the
time of seeking treatment for problem gambling.
Summary
Understanding the phenomenology of problem gambling among women has been
hampered by the almost exclusive reliance on men in the research literature. This has limited the
generality of these findings and underscored the need to systematically explore the
phenomenology of problem gambling among women. Understanding women problem gamblers
may have implications for the conceptualization of problem gambling among women and in
identifying key variables that may be important in prevention and treatment. Studies that have
included women have not had sufficiently large sample sizes to allow meaningful comparisons to
be made. The assessment methods have tended to rely on scales and tests of uncertain reliability
and validity rendering the results suspect. Based on the studies that are available several
variables have been identified, of both theoretical and clinical relevance, which merit further
investigation and replication.
Goals and Objectives of Study
The goal of the study was to compare men and women who met criteria for problem
gambling on a wide range of theoretically-relevant variables believed, based on the empirical
literature and clinical evidence, to be associated with problem gambling. As this is an
exploratory study, the emphasis will be placed on collecting the necessary data and expanding

A Comparison of Male and Female Pathological Gamblers
10
the knowledge base that will allow evaluation of alternative models of gambling rather than
testing any specific theory. Consequently, formal hypotheses will not be tested in this study.
The proposed study has several improvements over the existing literature. Firstly, the
sample will include both problem gamblers and non-problem gamblers sampled from several
populations. Many of the existing studies have assessed non-representative samples of women
gamblers (e.g., Gamblers Anonymous attenders). Secondly, efforts were made to recruit
comparable numbers of men and women, in numbers that were determined by a power analysis
to permit meaningful statistical comparisons. Thirdly, all subjects received the identical
assessment protocol.
Research Design
Participants
Subjects were recruited primarily from advertisements placed in major urban newspapers.
The primary inclusion criterion was a concern for their gambling behaviour. Few exclusion
criteria were used to screen out subjects who called (i.e., lack of permanent address, in crisis) in
order to recruit a wide and representative sample of gamblers. Those who agreed to participate
in the study were mailed out the questionnaire package. Those who returned completed
packages were mailed $40 in their choice of gift certificates.
Assessment Package
The assessment consisted of two sets of questionnaires, gambling-related and non-
gambling-related. Each of these will be briefly described below.
The non-gambling-related questionnaires included:
• The Index of Self-Esteem (ISE; Hudson, 1992), a 25-item scale measuring the degree and
severity of self-esteem problems. The ISE yields two scores, a cut-off score suggesting the

A Comparison of Male and Female Pathological Gamblers
11
presence of a clinically significant problem, and higher cut-off score indicating the individual
is experiencing severe stress. Reliability (internal consistency [alpha = .93], test-re-test [r =
.92]) and validity (known groups, construct, discriminant) of the ISE is strong.
• The Relationship Assessment Scale (RAS; Hendrick, 1988), a measure of satisfaction in
relationships. This 7-item scale is quickly administered and is not limited to romantic
relationships. Acceptable internal consistency for this measure exists (alpha = .86). Good
concurrent validity (high correlation with other relationship measures) and predictive validity
(distinguishing between couples who stay together or break up) is also supportive. Norms
for the RAS are available.
• The Problem-Solving Inventory (PSI; Heppner & Petersen, 1982), a 35-item instrument
measuring how individuals believe they react to personal problems they encounter in their
daily lives. There are three sub-scales: problem-solving confidence, approach-avoidance
style, and personal control. The instrument is normed, possesses good internal consistency
(alphas range from .72 to .85 on the sub-scales and .90 for the entire test). There is good test-
retest reliability. The validity of the PSI has been extensively substantiated as well.
• The Brief Symptom Inventory (BSI; Derogatis, 1993; Derogatis & Melisaratos, 1983)
consists of 53 symptoms designed to measure nine dimensions of psychopathology
experienced by individuals within the past week. The Global Severity Index (GSI), based on
the mean rating for all 53 items, is scored on a 5-point scale ranging from 0, ‘not at all’ to 4
‘extremely’ and provides an overall index of current emotional distress. Internal consistency
coefficients for the nine sub-scales cluster around .80 with test-retest correlations ranging
from .68 to .91 over a two-week period (Derogatis & Melisaratos, 1983). The GSI has a
stability coefficient of .90 over a two-week period.

A Comparison of Male and Female Pathological Gamblers
12
• The Boredom Proneness (BP; Famer & Sundberg, 1986) is a 28-item instrument measuring
tendencies to boredom. Good internal consistency has been reported (.79) and good test-
retest reliability (.83). The construct validity of the BP scale has been established. Norms
for undergraduate samples are available.
• The Belief in Personal Control Scale (BPCS; Berrenberg, 1987) is a 45-item questionnaire
that measures three dimensions of personal control: general external control, exaggerated
control, and God-mediated control. High internal reliability of the factors (.85-.97) and very
good construct validity, have been reported. Norms were established on undergraduate
samples.
• The Index of Clinical Stress (ICS; Abell, 1991) is a 25-item instrument measuring degree of
personal stress as perceived by the individual but not associated with life event indices.
Norms were established on patients and family members attending a family practice situated
within a medical center. Internal consistency of the ICS is high (alpha = .96) and fair
construct validity has been reported.
• The Dissociative Experiences Scale (DES; Bernstein & Putnam, 1986) is a 28-item
instrument measuring dissociation along a continuum from minor to major psychopathology.
Norms have been established on normals and a wide range of psychopathological
populations. Split-half reliability has been very good with most coefficients over .90. Test-
retest reliability was also quite acceptable (r = .84). Predictive and construct validity appears
to be quite good.
• The Multidimensional Scale of Perceived Social Support (MSPSS; Zimet, Dahlem, Zimet, &
Farley, 1988) is a 12-item test measuring perceived social support from three sources: family,
friends and a significant other. Norms are available from an ethnically and socio-

A Comparison of Male and Female Pathological Gamblers
13
economically diverse normal sample. Alphas for the internal consistency of the sub-scales
and the overall scale are excellent, all over .90. Good factorial, construct and concurrent
validity has been reported.
• The Magical Ideation Scale (MIS; Eckblad & Chapman, 1983) is a 30-item instrument
designed to measure magical thinking and invalid causation (e.g., telepathy, clairvoyance).
Psychometric properties of the instrument are reported to be quite adequate and norms for
undergraduate samples are available.
• The Self-Control Schedule (SCS; Rosenbaum, 1980) is a 36-item instrument assessing the
application of self-control methods to solving behavioural problems. Internal consistency is
excellent with alphas ranging between .72 and .91 as is test stability with correlations at four
weeks of .86. Construct validity of the SCS is also quite acceptable.
The gambling-related questionnaires include the following:
• The Gambling Behaviour Interview consists of a general overview of the subjects’ gambling
history including important milestones (e.g., age began to gamble, age gambling first became
a problem), frequency of gambling, reasons for gambling, history of treatment for gambling,
psychiatric history, and substance use history.
• the Diagnostic and Statistical Manual (DSM; American Psychiatric Association, Fourth
Edition, 1995) criteria for pathological gambling, the South Oaks Gambling Screen (SOGS;
Lesieur & Blume, 1985), and the Gamblers Anonymous Twenty Questions (GA20; Gamblers
Anonymous). These questionnaires will provide a measure of the severity of the gambling
problem.
• The Gambling Expectancy Questionnaire (GEQ) is a 49-item instrument measuring the
gambler's expectations of gambling (e.g., win money, relax, socialize, escape depression,

A Comparison of Male and Female Pathological Gamblers
14
etc.) and provides information on the function of the gambling behaviour. The psychometric
properties of this instrument are currently being established in a large sample of problem
gamblers, non-problem gamblers, and non-gamblers.
• The Gambling Cognition Questionnaire (GCQ) is a 60–item instrument measuring
maladaptive beliefs and attitudes held by the gambler that may impact on gambling. Internal
consistency reliability (alpha’s over .85 for 13 sub-scales) and concurrent validity is high
(e.g., correlated with measures of gambling severity, negative consequences).
• The Gambling Urge Questionnaire (GUQ) measures situations that elicit urges to gamble
and is based on a similar measure used in a recently completed study on untreated recovery
from gambling. The psychometric properties of this instrument are currently being
established in a large sample of problem gamblers, non-problem gamblers, and non-
gamblers.
• The Readiness to Change Gambling Questionnaire (RCG) is a 12-item instrument is based
on the Stages of Change (Prochaska & DiClemente, 1984) and evaluates how prepared the
individual is to modify their gambling behaviour. The psychometric properties of this
instrument are currently being established in a large sample of problem gamblers, non-
problem gamblers, and non-gamblers.
• The Inventory of Gambling Situations (IGS) is a 63-item instrument that measures situations
in which a gambler is likely to gamble heavily. The IGS has received extensive
psychometric evaluation (Turner & Littman-Sharp, unpublished data) and yields scores on
several clinically meaningful sub-scales. The psychometric properties of this instrument are
currently being further established in a large sample of problem gamblers, non-problem
gamblers, and non-gamblers.

A Comparison of Male and Female Pathological Gamblers
15
Data Analysis
Categorical variables were analyzed using chi-square contingency tables crossing the
three levels of Gambling Group (pathological gamblers, problem gamblers, asymptomatic
gambler) and the comparison variable. Continuous variables were analyzed using analysis of
variance with Gambling Group (pathological gamblers, problem gamblers, asymptomatic
gambler) and Gender (male, female) specified as the independent variables. Post-hoc
comparisons were conducted using Student-Newman-Keuls test.
Results
Classification of the Sample
All participants were classified into 3 groups according to DSM-IV criteria. Pathological
Gamblers endorsed at least 5 out of 10 DSM (n = 125; 52 males, 73 females) symptoms for
pathological gambling. Problem gamblers endorsed between 1 and 4 DSM symptoms (n = 101;
44 males, 57 females). Asymptomatic gamblers endorsed no DSM symptoms (n = 33; 17
females, 16 males). Note that Asymptomatic Gamblers may include individuals who have
recovered from a gambling problem as well as individuals who are gambling severely but who
may not have reported any DSM symptoms.
Sample Description
A total of 260 men and women participated in the study. Female respondents comprised
56.9% of the sample. Table 1 displays the demographic characteristics of the sample by gender
and gambling Group. About three-quarters of the male pathological gamblers were non-partnered
compared to half of the female pathological gamblers. The rates did not differ greatly across the
three samples. Rates of post-secondary education were similar across all three types of gambler

A Comparison of Male and Female Pathological Gamblers
16
and across gender. Unemployment rates were higher for the pathological gamblers than for the
problem gamblers.
Table 1. Demographic variables, by Gender and Gambling Group.
Asymptomatic
Gambler Problem Gambler
Pathological Gambler
Males n/%
Females
n/%
Males n/%
Females
n/%
Males n/%
Females
n/% n=16 n=17 n=44 n=57 n=52 n=73 M (SD) Age (years) 44.9
(13.7) 47.9
(14.3) 43.0
(10.4) 41.7
(12.8) 42.2
(11.7) 45.2
(11.4) Marital Group:1
Married/Partnered 6 (37.5)
10 (58.8)
15 (34.1)
24 (42.1)
14 (26.9)
34 (46.6)
Not married/partnered 10 (62.5)
7 (41.2)
29 (65.9)
33 (57.9)
38 (73.1)
39 (53.4)
Education Level: 1 Secondary or less 6
(37.5) 9
(52.9) 21
(47.7) 31
(54.4) 23
(44.2) 38
(52.1) Post-secondary 10
(62.5) 8
(47.1) 23
(52.3) 26
(45.6) 29
(55.8) 35
(47.9) Employment Group: 1
Employed 5 (33.3)
8 (47.1)
29 (65.9)
35 (61.4)
25 (49.0)
33 (45.2)
Not employed 10 (66.7)
9 (52.9)
15 (34.1)
22 (38.6)
26 (51.0)
40 (54.8)
1Chi-square analyses significant at p < .05. Gambling Behaviour
Table 2 describes the gambling habits for the sample. Lottery, scratch tickets, casino
games, and bingo were the most popular gaming activities. Men participated primarily in
lotteries, scratch tickets, sport lotteries, and slot machines. Women participated most frequently
in lotteries, scratch tickets, bingo, slot machines, and pull tabs.

A Comparison of Male and Female Pathological Gamblers
17
Table 2. Description of gambling behaviour in previous year, by gender.
Number Engaging in
Activity M (SD) Frequency
per year Yes, it's a problem
N (%) n=112
Males n=148
Females
Males
Females
Males
Females Gambling activity:
Lottery 97 129 97.6 (69.4)
126.3 (131.4)
27 (27.6)
28 (21.5)
Scratch tickets 64 101 104.2 (108.8)
130.6 (147.3)
18 (28.1)
32 (31.1)
Pull tabs 25 50 106.5 (129.2)
76.6 (116.0)
8 (30.8)
13 (25.5)
Card games (private) 34 28 54.9 (62.7)
45.0 (72.7)
12 (35.3)
2 (7.1)
Casino card games 37 22 56.9 (87.3)
31.1 (48.6)
19 (51.4)
10 (45.5)
Casino table games 19 8 58.2 (74.5)
40.3 (69.1)
12 (60.0)
2 (25.0)
Casino slot machines 42 79 54.6 (77.6)
61.7 (89.4)
21 (50.0)
43 (54.4)
Casino video gambling 11 16 55.3 (112.0)
37.2 (53.1)
6 (50.0)
5 (31.3)
Stock market 10 11 45.3 (33.8)
23.5 (53.1)
6 (54.5)
7 (63.6)
Race track 39 29 50.7 (84.8)
59.8 (123.0)
25 (61.0)
12 (41.4)
Real Estate 2 2 3.0 (1.4)
53.0 (72.1)
1 (50.0)
1 (50.0)
Sports lotteries 53 16 148.4 (125.0)
91.4 (123.0)
31 (56.4)
6 (37.5)
Sports betting 25 5 92.6 (116.3)
56.1 (61.3)
17 (63.0)
2 (40.0)
VLTs 9 12 129.7 (145.1)
44 (50.2)
5 (55.6)
8 (66.7)
Bingo 25 98 41.2 (64.3)
96.3 (85.2)
10 (38.5)
46 (44.2)
Table 3 shows the gaming activities reported to be the most problematic for this sample.
The gambling activities that were identified as the greatest concern to the male pathological
gamblers were casino card games, track betting and sports lotteries. The gambling activities that
were identified as the greatest concern to the female pathological gamblers were casino card
games followed by bingo. Among the male problem gamblers, casino card games was most

A Comparison of Male and Female Pathological Gamblers
18
frequently reported to be a problem; for the female problem gamblers, bingo was the most
frequently reported to be a problem.
Table 3. Most problematic gambling activity by Gender and Gambling Group.
Asymptomatic
Gambler Problem Gambler
Pathological Gambler
Males N/%
Females
N/%
Males N/%
Females
N/%
Males N/%
Females
N/% Most problematic gambling
activity: n=16 n=17 n=44 n=57 n=52 n=73
Casino card games 0 0 9 (22.5)
13 (27.7)
13 (27.1)
22 (32.4)
Bingo 0 2 (20.0)
2 (5.0)
19 (40.4)
2 (2.1)
21 (30.9)
Lottery 0 0 6 (15.0)
2 (4.3)
1 (2.1)
2 (2.9)
Scratch tickets 0 2 (20.0)
1 (2.5)
5 (10.6)
5 (10.4)
3 (4.4)
Race track 0 0 3 (7.3)
2 (4.3)
9 (18.8)
2 (2.9)
Sports lotteries 1 (14.3)
0 4 (10.0)
0 8 (16.7)
0
Slot machines 0 0 1 (2.5)
1 (2.1)
3 (6.3)
5 (7.4)
VLTs 0 0 1 (2.5)
1 (2.1)
2 (4.2)
2 (2.9)
Sports betting 0 0 4 (10.0)
0 1 (2.1)
0
Pull tabs 0 1 (10.0)
1 (2.5)
2 (4.3)
0 0
Card games (private) 1 (14.3)
0 1 (2.5)
0 1 (2.1)
1 (1.5)
Stock market 0 0 1 (2.5)
0 2 (4.2)
0
Casino video gambling 1 (14.3)
0 0 0 0 1 (1.5)
Gambling Severity
As Table 4 shows, the Pathological Gamblers endorsed about 7 out of 10 DSM symptoms. The
problem gamblers endorsed approximately 2.5 symptoms. Table 4 also shows the means for two
other common screening measures: the South Oaks Gambling Screen (current and lifetime) and
Gamblers Anonymous Twenty Questions. There were no gender differences for any of the

A Comparison of Male and Female Pathological Gamblers
19
groups. A Gambling Group effect was found for all of the gambling severity measures. In each
case, the Asymptomatic Gamblers scored significantly lower than the Problem Gamblers who in
turn scored significantly lower than the Pathological Gamblers. A Gender effect was observed
for both age of onset of gambling and of problem gambling. Women generally reported
beginning gambling and developing a problem with gambling at a later age than men. Women
tended to begin gambling in their early 20s and to develop a problem in their mid-30s; men
tended to begin gambling in their mid-teens and to develop a problem in their late 20s.
Table 4. Gambling severity measures by Gender and Gambling Group.
Asymptomatic
Gambler Problem Gambler
Pathological Gambler
Males
M (SD)
Females M (SD)
Males
M (SD)
Females M (SD)
Males
M (SD)
Females M (SD)
n=16 n=17 n=44 n=57 n=52 n=73 DSM symptoms1 0 0 2.3
(1.1) 2.5
(1.2) 7.0
(1.4) 6.8
(1.4) SOGS-lifetime1 3.0
(2.7) 2.7
(4.4) 7.3
(4.6) 7.0
(4.2) 12.3 (4.8)
10.5 (4.5)
SOGS-current1 1.1 (1.3)
1.6 (1.8)
5.2 (3.0)
5.3 (3.5)
12.7 (3.4)
11.0 (3.4)
GA Twenty Questions1 4.3 (4.8)
3.4 (4.8)
8.0 (4.6)
8.0 (4.0)
15.0 (3.6)
13.1 (3.7)
Age first reported gambling2 16.5 (6.1)
24.8 (13.4)
17.3 (5.8)
20.9 (8.7)
18.3 (9.6)
24.9 (13.7)
Age gambling a problem2 17.4 (5.1)
32.0 (15.3)
28.6 (12.7)
30.8 (12.8)
26.9 (11.4)
35.8 (13.3)
1Statistically significant effect of Gambling Group 2Statistically significant effect of Gender
Psychiatric Treatment History
Psychiatric treatment history for male and female participants and their family members
is found in Table 5. A large proportion of the participants had received some form of mental
health counselling in their lives (with over half of the Pathological Gamblers reporting contact

A Comparison of Male and Female Pathological Gamblers
20
with a psychiatrist) and about one-third had been prescribed medication for depression or anxiety
(with elevated rates for the pathological gamblers). One-quarter of the sample had a family
member who had been treated for an addiction problem and who had been hospitalized for an
emotional problem. There were no gender differences on these variables.
Table 5. Psychiatric and Gambling Treatment History, by Gender and Gambling Group. Asymptomatic
Gambler Problem Gambler
Pathological Gambler
Males n/%
Females
n/%
Males n/%
Females
n/%
Males n/%
Females
n/% Participant ever… n=16 n=17 n=44 n=57 n=52 n=73
Hospitalized for emotional problems
1 (6.3)
0 6 (13.6)
9 (15.8)
11 (21.2)
19 (26.0)
Treated by a psychiatrist 4 (25.0)
3 (18.8)
13 (29.5)
18 (31.6)
27 (51.9)
38 (52.1)
Treated by a psychologist /counselor
7 (43.8)
6 (37.5)
12 (27.3)
20 (35.1)
32 (61.5)
40 (54.8)
Prescribed anti-anxiety medication
5 (31.3)
3 (18.8)
13 (29.5)
16 (28.1)
23 (44.2)
33 (45.2)
Prescribed anti-depressant medication
6 (37.5)
5 (31.3)
14 (31.8)
21 (36.8)
24 (46.2)
40 (54.8)
Prescribed anti-psychotic medication
1 (6.3)
0 3 (6.8)
5 (8.8)
4 (7.7)
6 (8.2)
Attended GA (% yes) 0 12 14 4 37 16 Attended other gambling treatment (% yes)
6.3 0 4.9 3.6 28 25
Immediate family member….
Hospitalized for emotional problems
4 (25.0)
2 (12.5)
6 (13.6)
13 (22.8)
14 (26.9)
26 (35.6)
Treated by a psychiatrist 5 (31.3)
6 (37.5)
9 (20.5)
20 (35.1)
18 (34.6)
29 (39.7)
Had an addiction problem 5 (31.3)
7 (43.8)
15 (34.1)
25 (43.9)
27 (51.9)
46 (63.0)
Treated for an addiction problem
2 (12.5)
2 (12.5)
6 (13.6)
12 (21.1)
16 (30.8)
21 (28.8)
With a gambling problem 1 (6.3)
5 (31.3)
10 (22.7)
20 (35.7)
21 (40.4)
37 (50.7)

A Comparison of Male and Female Pathological Gamblers
21
Rates of counselling, treatment for addictions and gambling problems in the participants
family were also elevated with the rates for the families of Pathological Gamblers tending to be
elevated.
Table 5 also shows the gambling treatment history for male and female participants. The
majority of the participants had never attended any treatment for gambling. However, men were
more likely to report having attended Gamblers Anonymous (GA) in comparison to women. A
small proportion of the sample had attended non-GA treatments for gambling.
Social Environment Variables
Table 6 shows that Pathological Gamblers were significantly less satisfied with their
relationships than were Problem Gamblers, as measured by the Relationship Assessment Scale.
There were no significant gender differences on this measure. On the Multidimensional
Perceived Social Support Scale, social support from friends and significant others were found to
show main effects of Gender and Gambling Group. Thus, women felt more supported by friends
and by significant others than did the men. Pathological Gamblers reported less support from
friends and significant others compared to either Problem Gamblers or Asymptomatic Gamblers.
There were no significant differences in the perceived support of family.

A Comparison of Male and Female Pathological Gamblers
22
Table 6. Social environment variables, by Gender and Gambling Group. Asymptomatic
Gambler Problem Gambler
Pathological Gambler
Scale
Males
M (SD)
Females M (SD)
Males
M (SD)
Females M (SD)
Males
M (SD)
Females M (SD)
n=16 n=17 n=44 n=57 n=52 n=73 Relationship Assessment
Scale1* 25.3 (8.5)
28.9 (4.5)
25.1 (6.4)
25.4 (7.1)
22.4 (6.8)
22.5 (8.7)
Perceived Social Support by:
Family 18.9 (5.4)
20.9 (6.9)
16.4 (6.6)
19.1 (6.8)
17.6 (5.5)
17.6 (6.2)
Friends 1, 2 19.8 (4.1)
22.4 (4.4)
18.3 (5.1)
20.7 (5.1)
16.3 (6.0)
18.4 (6.1)
Significant Other 1, 2 19.2 (4.9)
22.5 (4.7)
19.4 (6.4)
22.0 (3.6)
16.9 (6.6)
20.7 (6.6)
*n=145
1Statistically significant effect of Gambling Group 2Statistically significant effect of Gender 3Statistically significant interaction effect of Gambling Group X Gender
Personality and Psychiatric Variables
On all measures, a significant effect of Gambling Group was found. On the Brief
Symptom Inventory, a measure of recent psychiatric distress, Pathological Gamblers scored
higher than both the Problem Gamblers and Asymptomatic Gamblers on all of 9 sub-scales and
the Global Severity Index.
Similarly, on the Inventory of Clinical Stress, the Pathological Gamblers scored higher
than both the Problem Gamblers and Asymptomatic Gamblers. Similar findings were obtained
on the Index of Self-Esteem. On the Boredom Proneness Scale, Pathological Gamblers were
more likely to experience boredom than Problem Gamblers who in turn were more likely to
experience boredom than Asymptomatic Gamblers.

A Comparison of Male and Female Pathological Gamblers
23
Table 7. Personality and psychiatric variables, by Gender and Gambling Group. Asymptomatic
Gambler Problem Gambler
Pathological Gambler
Scale
Males
M (SD)
Females M (SD)
Males
M (SD)
Females M (SD)
Males
M (SD)
Females M (SD)
n=16 n=17 n=44 n=57 n=52 n=73 Inventory of Clinical Stress1 63.2
(20.3) 65.3
(34.3) 71.3
(24.5) 75.5
(24.2) 93.6
(24.1) 101.2 (30.0)
Dissociative Experiences Scale1, 2 11.4 (10.1)
5.3 (4.5)
14.9 (16.6)
10.8 (9.3)
17.7 (15.4)
13.8 (13.3)
Index of Self-Esteem1 38.1 (11.6)
40.7 (15.2)
42.5 (12.1)
43.1 (12.4)
53.3 (13.0)
53.4 (17.0)
Boredom Proneness1 10.5 (5.0)
9.0 (5.7)
12.3 (5.0)
12.2 (6.0)
16.8 (5.9)
15.6 (5.9)
Magical Ideation Scale1 6.1 (5.0)
5.6 (4.5)
6.2 (4.4)
5.3 (4.1)
9.3 (7.1)
7.1 (4.9)
Brief Symptom Inventory: 1 Global Severity Index 1 1.7
(.6) 1.4 (.6)
1.6 (.5)
1.8 (.6)
2.3 (.8)
2.4 (.8)
Interpersonal Sensitivity1 1.8 (.8)
1.6 (.9)
1.8 (.8)
1.9 (.8)
2.4 (1.0)
2.9 (1.2)
Somatization1 1.7 (.7)
1.4 (.6)
1.4 (.5)
1.7 (.8)
1.9 (.8)
2.1 (1.0)
Depression1 1.7 (.7)
1.5 (.9)
1.9 (.7)
2.0 (.8)
2.6 (1.0)
2.7 (1.1)
Phobic Anxiety1 1.3 (.4)
1.2 (.4)
1.4 (.6)
1.4 (.6)
1.9 (.9)
2.0 (.9)
Obsessive-Compulsive1 2.0 (1.0)
1.5 (.7)
1.8 (.7)
2.0 (.9)
2.4 (.9)
2.6 (1.0)
Anxiety1 1.7 (.6)
1.5 (.9)
1.6 (.5)
1.7 (.6)
2.3 (.9)
2.4 (1.0)
Paranoid Ideation1 1.9 (.8)
1.3 (.5)
1.9 (.8)
1.9 (.8)
2.3 (.9)
2.5 (1.0)
Hostility1 1.5 (.5)
1.4 (.5)
1.5 (.5)
1.6 (.6)
2.0 (.8)
2.2 (.9)
Psychoticism1 1.5 (.6)
1.3 (.7)
1.7 (.7)
1.6 (.6)
2.4 (.9)
2.3 (1.0)
1Statistically significant effect of Gambling Group 2Statistically significant effect of Gender 3Statistically significant interaction effect of Gambling Group X Gender
On the Magical Ideation Scale, a significant effects of Gambling Group was found with
Pathological Gamblers reporting greater likelihood of experiencing magical thinking than both
the Problem Gamblers and Asymptomatic Gamblers.

A Comparison of Male and Female Pathological Gamblers
24
Scores on the Dissociative Experiences Scale was characterized by both a Gender and
Gambling Group effect with males scoring higher on dissociative experiences and Pathological
Gamblers scoring higher than the Asymptomatic Gamblers.
Coping Variables
Table 8 shows a significant effect of Gambling Group on the Self-Control Schedule
scores with Pathological Gamblers experiencing greater difficulty than either the Problem
Gamblers or the Asymptomatic Gamblers.
Table 8. Coping Skill Variables, by Gender and Gambling Group. Asymptomatic
Gambler Problem Gambler
Pathological Gambler
Scale
Males
M (SD)
Females M (SD)
Males
M (SD)
Females M (SD)
Males
M (SD)
Females M (SD)
n=16 n=17 n=44 n=57 n=52 n=73 Self-Control Schedule1 145.3
(17.8) 135.1 (20.4)
135.1 (16.7)
135.3 (19.7)
128.1 (18.0)
123.0 (21.6)
Problem-Solving Inventory: Total Score1 86.7
(16.0) 89.8
(14.2) 96.4
(14.9) 94.7
(18.3) 105.9 (16.9)
108.0 (22.3)
Approach-Avoidance Style1 45.9 (10.1)
49.1 (8.1)
49.8 (7.6)
50.0 (10.5)
53.3 (8.9)
54.0 (10.7)
Problem-Solving Confidence1 25.1 (6.3)
26.3 (7.4)
29.3 (6.5)
27.7 (6.8)
33.2 (7.6)
34.1 (9.8)
Personal Control1 15.7 (3.0)
14.4 (4.7)
17.2 (3.7)
17.0 (3.9)
19.3 (3.0)
19.9 (4.3)
Belief in Personal Control Scale:
General External Control1 64.3 (9.0)
65.7 (12.2)
61.9 (10.0)
62.9 (7.2)
58.5 (10.6)
58.7 (11.2)
Exaggerated Personal Control2 57.6 (9.2)
49.9 (9.3)
51.8 (10.1)
50.6 (9.2)
52.6 (9.9)
52.9 (10.0)
God-Mediated Control3 30.7 (12.1)
27.1 (9.4)
32.0 (10.2)
26.8 (9.7)
28.4 (10.5)
30.7 (10.7)
1Statistically significant effect of Gambling Group 2Statistically significant effect of Gender 3Statistically significant interaction effect of Gambling Group X Gender
A Comparison of Male and Female Pathological Gamblers
25
On the Problem-Solving Inventory a significant effect of Gambling Group was found on
the total score and on each sub-scale. Pathological Gamblers reported less Personal Control and
Problem-Solving Confidence, and a more Avoidant problem-solving style than both the Problem
Gamblers and the Asymptomatic Gamblers.
On the Belief in Personal Control Scale, a measure of locus of control, Pathological
Gamblers were found to score lower on a measure of External Locus of Control than either
Problem Gamblers or Asymptomatic Gamblers. On a measure of Internal Locus of Control (i.e.,
exaggerated personal control) a gender effect was obtained with men scoring higher than women.
On the God-mediated Control sub-scale, an interaction between Gender and Gambling Group
was discovered with men scoring higher on this scale than women except for the Pathological
Gamblers where the reverse pattern was obtained.
High-Risk Situations for Gambling
Table 9 contains the results of the Inventory of Gambling Situations (IGS) by gender and
gambling Group. Due to the large number of individual contrasts on this instrument, the total
score and sub-scale score comparisons were evaluated against a p<.01 level of significance.
There was a significant main effect of Gambling Group on the total IGS score as well as on all
twelve sub-scale scores. Problem gamblers were more likely to gamble heavily than were non-
problem gamblers in a variety of situations including Positive Affect (e.g. confident, relaxed),
Negative Affect (e.g. depressed), Interpersonal Conflict, Need for Control, Need for Excitement,
and Interpersonal Situations (e.g. challenged to a bet).

A Comparison of Male and Female Pathological Gamblers
26
Table 9. Inventory of Gambling Situations sub-scales and total score, by Gender and Gambling Group. Asymptomatic
Gambler Problem Gambler
Pathological Gambler
Sub-Scale
Males
M (SD)
Females M (SD)
Males
M (SD)
Females M (SD)
Males
M (SD)
Females M (SD)
n=16 n=17 n=44 n=57 n=52 n=73 Total Score 1 12.4
(14.9) 11.9
(12.2) 28.1
(16.5) 28.6
(14.0) 54.3
(13.5) 52.4
(16.6) Winning and chasing1 11.3
(13.7) 11.8
(14.6) 28.7
(19.5) 32.7
(19.3) 66.4
(16.3) 62.7
(22.7) Conflict with others1 4.2
(9.7) 4.9
(9.9) 10.7
(16.7) 12.6
(13.2) 39.2
(24.9) 42.2
(28.5) Need to be in control1 6.9
(12.0) 6.5
(13.5) 20.6
(21.8) 15.9
(17.6) 50.9
(20.5) 44.3
(27.0) Need for excitement1 22.5
(21.9) 18.8
(20.1) 43.7
(24.8) 42.8
(22.4) 63.5
(15.6) 67.7
(21.1) Negative emotions1 5.6
(13.1) 7.5
(14.2) 23.1
(19.8) 27.0
(19.9) 53.6
(21.0) 65.0
(26.1) Pleasant emotions1 21.8
(22.9) 27.9
(29.9) 46.9
(25.0) 45.7
(22.2) 57.8
(16.7) 57.3
(22.8) Social pressure to use1 11.9
(14.3) 10.1
(11.8) 23.6
(15.5) 26.1
(13.6) 48.9
(17.6) 45.7
(16.2) Confidence in skill1, 2 18.3
(20.3) 13.0
(15.9) 41.0
(25.3) 31.6
(20.0) 61.4
(15.9) 49.3
(23.8) Pleasant social situation1 16.7
(18.8) 14.5
(17.0) 27.3
(22.7) 30.3
(21.4) 43.3
(22.5) 41.1
(24.7) Testing personal control1 6.7
(13.8) 6.2
(12.3) 22.6
(19.7) 21.3
(17.4) 49.4
(17.6) 42.5
(23.0) Urges and temptations1 13.4
(17.0) 14.6
(17.3) 33.8
(20.5) 36.4
(18.1) 63.7
(15.7) 67.9
(18.7) Worried about debts1, 2, 3 8.9
(20.6) 4.4
(8.8) 12.4
(17.2) 14.1
(16.3) 52.4
(26.9) 32.5
(27.9) 1Statistically significant effect of Gambling Group 2Statistically significant effect of Gender 3Statistically significant interaction effect of Gambling Group X Gender
In addition to a main effect of Gambling Group, there was also a significant effect of
Gender on the Confidence in Gambling Skill sub-scale with men gambling more heavily than
women in situations that required confidence in gambling skills (e.g. felt I could profit from
careful gambling). On the Worry about Debts sub-scale (e.g. about to get caught unless I came
up with some money fast), there were significant effects of Gambling Group and Gender and a
A Comparison of Male and Female Pathological Gamblers
27
significant interaction effect. The interaction effect revealed that when worried about debts,
male problem gamblers gambled more heavily than female problem gamblers.
Gambling Cognition Variables
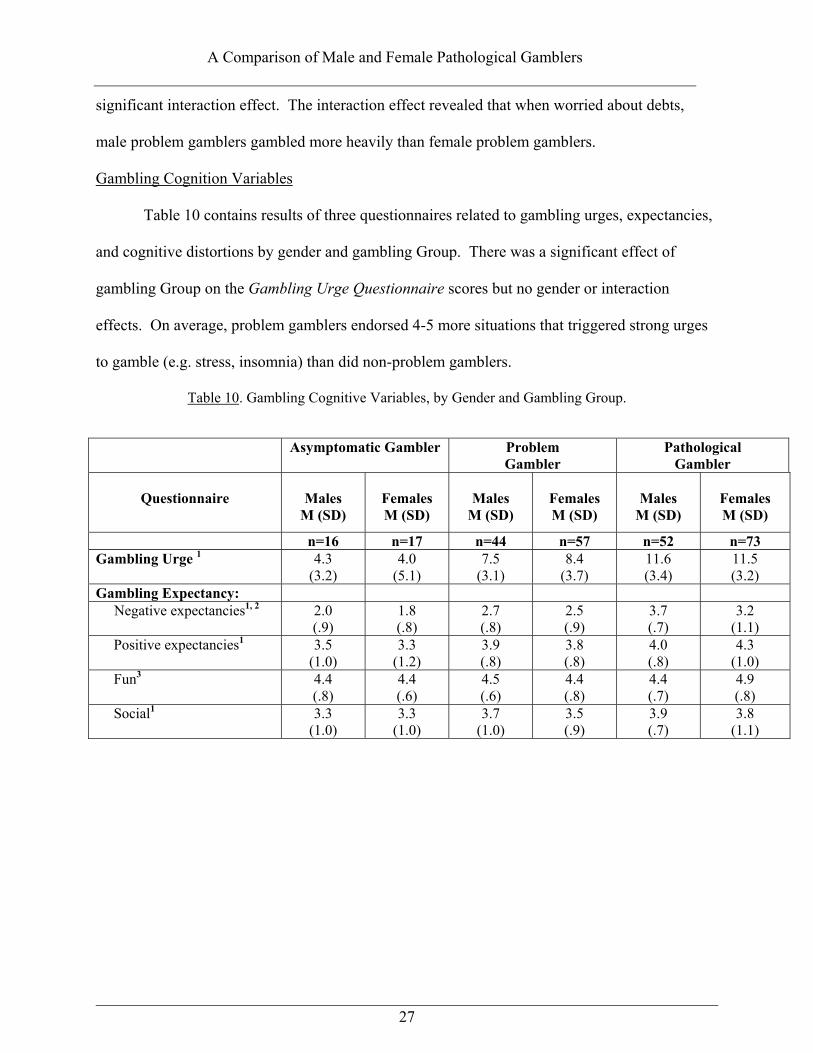
Table 10 contains results of three questionnaires related to gambling urges, expectancies,
and cognitive distortions by gender and gambling Group. There was a significant effect of
gambling Group on the Gambling Urge Questionnaire scores but no gender or interaction
effects. On average, problem gamblers endorsed 4-5 more situations that triggered strong urges
to gamble (e.g. stress, insomnia) than did non-problem gamblers.
Table 10. Gambling Cognitive Variables, by Gender and Gambling Group. Asymptomatic Gambler Problem
Gambler Pathological
Gambler
Questionnaire
Males
M (SD)
Females M (SD)
Males
M (SD)
Females M (SD)
Males
M (SD)
Females M (SD)
n=16 n=17 n=44 n=57 n=52 n=73 Gambling Urge 1 4.3
(3.2) 4.0
(5.1) 7.5
(3.1) 8.4
(3.7) 11.6 (3.4)
11.5 (3.2)
Gambling Expectancy: Negative expectancies1, 2 2.0
(.9) 1.8 (.8)
2.7 (.8)
2.5 (.9)
3.7 (.7)
3.2 (1.1)
Positive expectancies1 3.5 (1.0)
3.3 (1.2)
3.9 (.8)
3.8 (.8)
4.0 (.8)
4.3 (1.0)
Fun3 4.4 (.8)
4.4 (.6)
4.5 (.6)
4.4 (.8)
4.4 (.7)
4.9 (.8)
Social1 3.3 (1.0)
3.3 (1.0)
3.7 (1.0)
3.5 (.9)
3.9 (.7)
3.8 (1.1)
A Comparison of Male and Female Pathological Gamblers
28
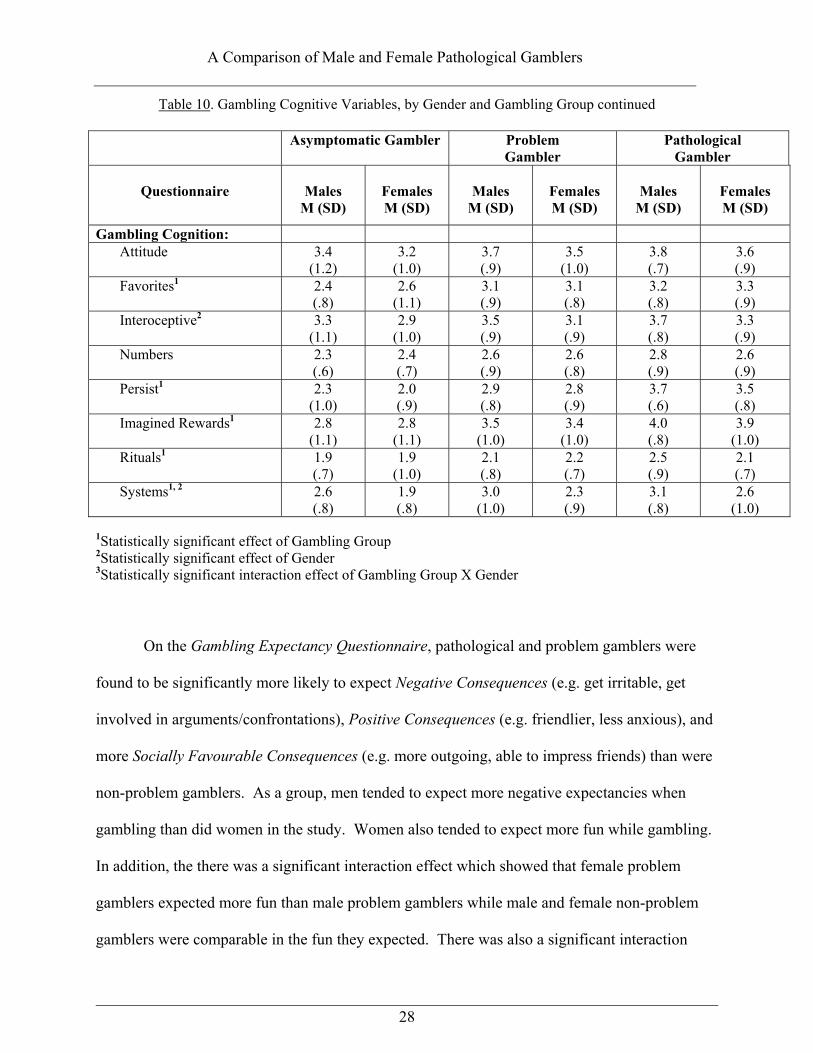
Table 10. Gambling Cognitive Variables, by Gender and Gambling Group continued Asymptomatic Gambler Problem
Gambler Pathological
Gambler
Questionnaire
Males
M (SD)
Females M (SD)
Males
M (SD)
Females M (SD)
Males
M (SD)
Females M (SD)
Gambling Cognition: Attitude 3.4
(1.2) 3.2
(1.0) 3.7 (.9)
3.5 (1.0)
3.8 (.7)
3.6 (.9)
Favorites1 2.4 (.8)
2.6 (1.1)
3.1 (.9)
3.1 (.8)
3.2 (.8)
3.3 (.9)
Interoceptive2 3.3 (1.1)
2.9 (1.0)
3.5 (.9)
3.1 (.9)
3.7 (.8)
3.3 (.9)
Numbers 2.3 (.6)
2.4 (.7)
2.6 (.9)
2.6 (.8)
2.8 (.9)
2.6 (.9)
Persist1 2.3 (1.0)
2.0 (.9)
2.9 (.8)
2.8 (.9)
3.7 (.6)
3.5 (.8)
Imagined Rewards1 2.8 (1.1)
2.8 (1.1)
3.5 (1.0)
3.4 (1.0)
4.0 (.8)
3.9 (1.0)
Rituals1 1.9 (.7)
1.9 (1.0)
2.1 (.8)
2.2 (.7)
2.5 (.9)
2.1 (.7)
Systems1, 2 2.6 (.8)
1.9 (.8)
3.0 (1.0)
2.3 (.9)
3.1 (.8)
2.6 (1.0)
1Statistically significant effect of Gambling Group 2Statistically significant effect of Gender 3Statistically significant interaction effect of Gambling Group X Gender
On the Gambling Expectancy Questionnaire, pathological and problem gamblers were
found to be significantly more likely to expect Negative Consequences (e.g. get irritable, get
involved in arguments/confrontations), Positive Consequences (e.g. friendlier, less anxious), and
more Socially Favourable Consequences (e.g. more outgoing, able to impress friends) than were
non-problem gamblers. As a group, men tended to expect more negative expectancies when
gambling than did women in the study. Women also tended to expect more fun while gambling.
In addition, the there was a significant interaction effect which showed that female problem
gamblers expected more fun than male problem gamblers while male and female non-problem
gamblers were comparable in the fun they expected. There was also a significant interaction
A Comparison of Male and Female Pathological Gamblers
29
effect of positive expectancies of gambling where female problem gamblers tended to report
more positive expectancies than male problem gamblers while male and female non-problem
gamblers showed similar levels of positive expectancies.
Table 10 also shows the analysis of the Gambling Cognition Questionnaire which
revealed a significant effect of gambling Group on 4 of the 8 sub-scales: Superstitious Behaviour
(e.g., favourite places or people), Persistence (e.g. tell myself not to give up even if losing),
Imagined Rewards of Gambling, and Systems. There was also a significant effect of Gender on
Systems and Interoceptive Cues (e.g. rely on intuition, gut feeling) sub-scales. Generally, men
were more likely to believe that these strategies would increase their chance of winning when
compared to women.
Discussion
The goal of this study was to compare male and female gamblers on a wide array of
relevant psychological, psychiatric and social variables. To this end, a sample of 260 subjects
were recruited, of whom approximately half of whom met diagnostic criteria for pathological
gambling and an additional large proportion met diagnostic criteria for sub-clinical or problem
gambling. The sample could be described as early middle-aged, low-to-moderate income, with
the majority achieving at least a secondary school education. About half of the sample were
employed at least part-time. Almost half of the women were in relationships while the majority
of men were not. Lotteries (including scratch tickets) were the most common forms of gambling
reported by men and women. Men, in addition, preferred sports lotteries and casino slot
machines. Women, in addition, preferred bingo and casino slot machines. The women self-
identified bingo and casino card games as the most problematic type of gambling. Analogously,

A Comparison of Male and Female Pathological Gamblers
30
men self-identified casino card games, sports lotteries and the race- track betting as the most
problematic type of gambling.
Elevated rates of psychopathology and psychiatric treatment were observed for the
gamblers (and their families) in this study. Rates of psychiatric hospitalization, medication
usage and counselling did not differ between the sexes but were consistent with other research in
this area indicating that pathological gamblers are struggling with other difficulties as well.
Attendance at gambling self-help groups or other gambling-specific treatment was very low.
In a series of analyses of variance, specifying Gambling Group (pathological gamblers,
problem gamblers, asymptomatic gambler) and Gender (male, female) as the independent
variables, very few interactions emerged between gender and gambling severity. The most
consistent finding that emerged was a strong Gambling Group effect. That is, individuals who
were classified as pathological gamblers tended to score worse on the psychometric measures.
For example, gamblers had less satisfying relationships, less social support, great levels of stress,
more dissociative experiences, less self-esteem, more prone to boredom and magical thinking,
more psychiatric symptoms, poorer problem-solving skills, and a greater tendency towards
external locus of control. There were sex differences on a few measures, such as on measures of
dissociation, social support and magical thinking, with men always scoring in the more
psychopathological direction. However, there were no interaction effects on measures of
personality, coping and psychiatric symptoms, suggesting that male and female pathological
gamblers do not differ greatly on measures of psychiatric, psychological or social functioning.
Instead, gamblers always score in a more disturbed direction on these measures. This suggests
that gender is not a critical variable in understanding the psychosocial environment of the
pathological gambler.

A Comparison of Male and Female Pathological Gamblers
31
On various measures of gambling behaviour, a similar pattern emerged with pathological
gamblers scoring higher on measures of high-risk situations, gambling urges, distorted
cognitions and gambling expectancies than non-pathological gamblers. In addition, there were
several sex differences on specific sub-scales. For example, females were less likely to gamble
heavily if they were highly confident or worried about debts, relied less on gambling systems or
internal cues (e.g., hunches, gut feelings) when they gambled, and had fewer negative
expectancies than did men. There were very few interaction effects and these should not be
over-interpreted as chance would determine that a few significant interactions would emerge.
The weight of the results strongly suggest that male and female pathological gamblers
resemble each other more than they differ. In general, pathological gamblers display a wide
range of interpersonal, psychiatric, social and psychological difficulties which may be
functionally associated with their gambling pathology and require clinical intervention. The role
of gender seems to be much less critical. However, the findings of this study cannot be extended
to gamblers who are seeking treatment, for whom the effect of gender may be an important
variable.

A Comparison of Male and Female Pathological Gamblers
32
References
Abell, N. (1991). The index of clinical stress: A brief measure of subjective stress for research
and practice. Social Work Research and Abstracts, 27, 12-15.
Abbott, M., & Volberg, R. (1991). Gambling and problem gambling in New Zealand: A report
on Phase One of the National Survey. Wellington, NZ: Department of Internal Affairs
Alberta Alcohol and Drug Addiction Commission (1994). Adult gambling and problem
gambling in Alberta, Summary Report.
American Psychiatric Association (1994). Committee on Nomenclature and Statistics.
Diagnostic and statistical manual of mental disorders, fourth edition. Washington, DC.
American Psychiatric Association.
Bernstein, E.M., & Putnam, F.W. (1986). Development, reliability and validity of a
dissociation scale, Journal of Nervous and Mental Disease, 174, 727-735.
Berrenberg, J. (1987). The belief in personal control scale: A measure of God-mediated and
exaggerated control. Journal of Personality Assessment, 51, 194-206.
Blaszczynski, A., & Steel, Z. (1998). Personality disorders among pathological gamblers.
Journal of Gambling Studies, 14, 51-71.
Boughton, R. (in preparation). Gender and Gambling.
Custer, R., & Milt, H. (1985). When Luck Runs Out. New York: Facts on File Publications.
Derogatis, L.R., & Melisaratos, N. (1983). The Brief Symptom Inventory: An introductory
report. Psychological Medicine, 13, 595-605.
Derogatis, L. R. (1993). Brief Symptom Inventory (BSI): Administration, Scoring, and
Procedures Manual, Third Edition. Minneapolis, MN: National Computer Systems.
A Comparison of Male and Female Pathological Gamblers
33
Eckblad, M., & Chapman, L.J. (1983). Magical ideation as an indicator of schizoptypy. Journal
of Consulting and Clinical Psychology, 51, 215-225.
Famer, R., & Sundberg, N. (1986). Boredom proneness- the development and correlates of a new
scale. Journal of Personality Assessment, 50, 4-17.
Hendrick, S. (1988). A generic measure of relationship satisfaction. Journal of Marriage and the
Family, 50, 93-98.
Heppner, P. & Petersen, C.H. (1982). The development of a personal problem solving inventory.
Journal of Counseling Psychology, 29, 66-75.
Hraba, J., & Lee, G. (1996). Gender, gambling, and problem gambling. Journal of Gambling
Studies, 12, 83-101.
Hudson, W. (1992). The WALMYR assessment scales scoring manual. Tempe AZ: WALMYR
Publishing Co.
Ladouceur, R., Gaboury, A., Dumont, M., & Rochette, P. (1988). Gambling: relationship
between the frequency of wins and irrational thinking. Journal of Psychology, 122, 409-
414.
Ladouceur, R., Dube, D., & Bujold, A. (1994). Prevalence of pathological gambling and related
problems among college students in the Quebec metropolitan area. Canadian Journal of
Psychiatry, 139, 289-293.
Lesieur, H.R. & Blume, B. (1987) The South Oaks Gambling Screen (SOGS): A new
instrument for the identification of pathological gamblers. American Journal of
Psychiatry, 144, 1184-1188

A Comparison of Male and Female Pathological Gamblers
34
Lesieur, H., & Blume, S.B. (1991). Evaluation of patients treated for pathological gambling in a
combined alcohol, substance abuse, and pathological gambling treatment unit using the
Addiction Severity Index. British Journal of Addiction, 86, 1017-1028.
Lesieur, H.R. (1988). Altering the DSM-III criteria for pathological gambling. Journal of
Gambling Behavior, 4, 38-47.
Lesieur, H.R. & Rosenthal, R,J. (1991). Pathological gambling: A review of the literature.
Journal of Gambling Studies, 7, 5-39.
Linden, R., Pope, H., & Jonas, J. (1986). Pathological gambling and major affective disorder.
Journal of Clinical Psychiatry, 47, 41-53.
Lorenz, V. (1990). Compulsive gambling hotline: Fiscal year 1990 final report. Baltimore:
National Center for Pathological Gambling, Inc.
Mark, M., & Lesieur, H. (1992). A feminist critique of problem gambling research. British
Journal of Addiction, 87, 549-565.
Martin, T., & Kirkcaldy, B. (1998). Gender differences on the EPQ-R and attitudes to work.
Personality and Individual Differences, 24, 1-5.
McCormick, R., Russo, A.M., Ramirez, L., & Taber, J.I. (1984). Affective disorders among
pathological gamblers seeking treatment. American Journal of Psychiatry, 141, 215-218.
Prochaska, J.O., & DiClemente, C.C. (1984). The Transtheoretical Approach: Crossing
traditional boundaries of therapy. Dow Jones-Irwin: Homewood, Ill.
Rosenbaum, M. (1980). A schedule for assessing self-control behaviors. Behavior Therapy, 22,
109-121.
Rosenthal, R.J. (1992). Pathological gambling. Psychiatric annals, 22, 72-78

A Comparison of Male and Female Pathological Gamblers
35
Shaffer, H.J., Hall, M. N. & Vanderbilt, J. (1997) Estimating the prevalence of disordered
gambling behavior in the United States and Canada: A meta-analysis. (Boston, Harvard
Medical School Division on Addictions).
Shorkey, C., & Whiteman, V. (1977). Development of the Rational Behavior Inventory: Initial
validity and reliability. Educational and Psychological Measurement, 37, 527-534.
Specker, S., Carlson, G., Edmonson, K.M., Johnson, P., & Marcotte, M. (1996).
Psychopathology in pathological gamblers seeking treatment. Journal of Gambling
Studies, 12,
Toneatto, T. (1999). Cognitive psychopathology of problem gambling. Substance Use and
Misuse.
Toneatto, T and Skinner, W. (2000). Substance abuse patterns among treatment-seeking problem
gamblers. e-Journal of Gambling Research, Issue 1.
Toneatto, T., Blitz-Miller, T., Calderwood, K., Dragonetti, R., & Tsanos, A. (1997). Cognitive
distortions in heavy gambling. Journal of Gambling Studies, 13, 253-266
Turner, N., & Littman-Sharpe, N. The Inventory of Gambling Situations.
Volberg, R.A., & Banks, S.M. (1990). A review of two measures of pathological gambling in the United
States. Journal of Gambling Studies, 6, 153-163.
Walker, M.B. (1992). The psychology of gambling. Pergamon Press: Oxford.
Zimet, G.D., Dahlem, N., Zimet, S., & Farley, G. (1988). The multidimensional scale of
perceived social support. Journal of Personality Assessment, 52, 30-41.