a comparison of milk production in -...
TRANSCRIPT

the medium level or an additional 15 pounds of milk to produce an additionalpound of weaning weight.
Milk production levels of cows of both breeds were similar and low duringAugust when forage intake of the calves was estimated. The lack ofa differencein milk production between the medium and high levels makes interpretationof the data difficult. Based on previous studies at this station, none of the milkproduction levels at the time of the trial would be expected to affect calfforageintake. The overall greater forage intake by the larger Charolais x Holsteincalves may reflect their greater size and capacity to consume forage.
References:
Wyatt, R.D., Leon Knori, M.B. Gould, and Robert Totusek. 1976. OklahomaAgri. Exp. Sta. MP-96: 38-42.
A Comparison of Milk Production InAngus and Hereford Cattle Under Range
Condi tions
M.A. Omar, R. R. Frahm, R. H. Mizelland A. B. Cobb
Story in BriefFor six consecutive summers from 1967 through 1972 milk production
data and calf weights were obtained on 144 Hereford cow-calf pairs and 315Angus cow-calf pairs. On the average, Angus cows produced 5.05 poundsmore milk per day during the six-month lactation period than Hereford cows.The lactational pattern for both Hereford and Angus cows indicated that milkproduction tended to increase up to the third month oflactation and declinedthereafter. On the average, Angus calves consumed 5.05 pounds more milk perday, gained 0.15 pounds more per day to weaning, weighed 32 pounds more atweaning and were fatter at weaning than Hereford calves. Hereford calves
In cooperation with U.S.D.A., Agricultural Research Service, Southern Region.
1977 Animal Science Research Report 17

required 5.95 pounds of milk to produce a pound of gain while Angus calvesconsumed 8.25 pounds of milk for each pound of gain. Thus, Hereford calvesrequired 27.7 percent less milk per pound of gain than Angus calves. Prewean-ing calf gain was highly correlated with average daily milk production of thedam in Herefords (0.78) and moderately correlated in the Angus (0.44).
Introduction
The percentage of cows in the herd weaning calves and the weaningweight of those calves constitute the two most important traits affecting netincome in a cow-calf operation. Calf weaning weight is jointly determined bythe genetic potential of the calf for growth and the amount of milk receivedfrom the dam. Genetically improving calf growth rate and/or level of milkproduction of the cows should result in increased herd productivity as long asreproduction is not adversely affected in the process.
Most beef cattle herd improvement programs place some emphasis onincreased growth rate. In order to achieve maximum production, cows in theherd must be capable of producing sufficient milk to allow the calves to attaintheir full genetic potential for growth. It is important that the cows in the herd,whether purebred or commercial, produce milk at a level sufficient to optimizetotal production under the management system imposed and for the kind ofcalves produced.
The purpose of this study was to estimate milk production of Herefordand Angus cows managed under range conditions and to determine therelationship between the cow's level of milk production and calfperformance.
Materials and Methods
The study involved 144 Hereford cow-calf pairs and 315 Angus cow-calfpairs. Cattle involved in this study were a sample from a long term geneticimprovement study being conducted at the Southwestern Livestock and For-age Research Station, EI Reno, Oklahoma. Calves were born in February,March, and April and remained with their dams without creep feed untilweaning at an average age of205 days. Cattle were managed on native rangeand bermuda grass pastures as a single herd except for a 60-day breedingseason (May I to July I) when they were allotted to single sire breedingpastures.
Milk production estimates were obtained at monthly intervals from Aprilto September for a period of six years from 1967 to 1972. Milk production wasestimated on Hereford cows in 1967 and 1970 and Angus cows in 1968, 1969,1971, and 1972. The calf suckling technique was used to estimate daily milkyield of the dam. On the day prior to the milk production test, calves wereseparated from their dams around 10:00 a.m. Calves were returned to theirdams at 6:00 p.m. and allowed to nurse. This was simply a pretest milkout in
18 Oklahoma AgriculturalExperiment Station
order to place cows and calves on an equal basis relative to udder fill andhunger. After nursing, calves were immediately separated from their dams. At6:00 a.m. and 6:00 p.m. on the following day, calves were weighed beforenursing, allowed to nurse their dams (which took approximately 15-20 minut-es) and reweighed immediately after nursing. Difference in pre- and post-nursing weights was used as an estimate of milk production of the dam for al2-hour period. Thus, the sum of these two 12-hour milk production estimates(6:00 a.m. and 6:00 p.m.) provided an estimate of milk production of the damfor a 24-hour period.
Results and Discussion
Milk production and calf performance vary greatly from year to year dueto large fluctuations from one year to the next in general climatic conditionsand its influence on the quantity and quality of forage available particularlyduring the lactation period. Comparisons between Angus and Hereford cattlein this study need to be made with some caution since different years wereinvolved for each breed. However, since several years were involved, theyear-to-year fluctuations tend to average out. Thus, the average over two yearsfor Herefords and four years for Angus does provide some indication of therelative level of milk production and subsequent calfperformance for these twobreeds.
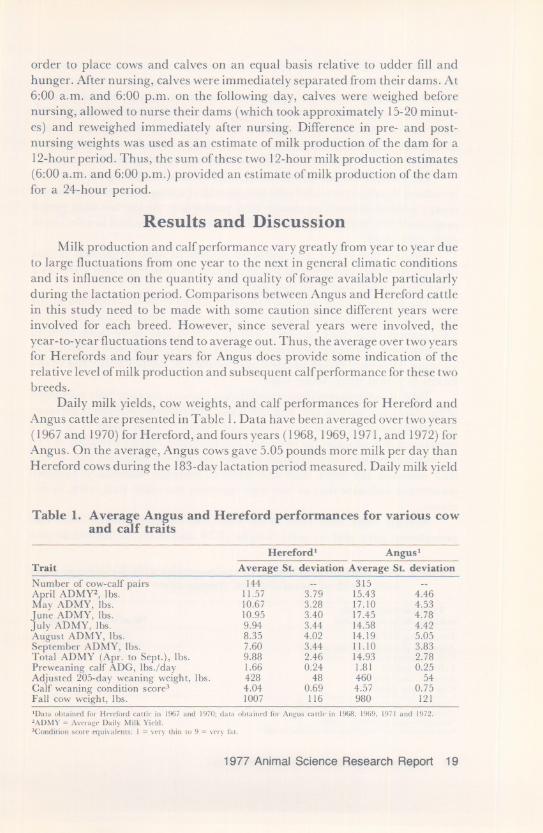
Daily milk yields, cow weights, and calf performances for Hereford andAngus cattle are presented in Table I. Data have been averaged over two years(1967 and 1970) for Hereford, and fours years (1968, 1969, 1971, and 1972) forAngus. On the average, Angus cows gave 5.05 pounds more milk per day thanHereford cows during the l83-day lactation period measured. Daily milk yield
Table 1. Average An~us and Hereford performances for various cowand calf traIts
Trait
Number of cow-calf pairsApril ADMY2, Ibs.May ADMY, Ibs.June ADMY, Ibs.July ADMY, Ibs.August ADMY, Ibs.September ADMY, Ibs.Total ADMY (Apr. to Sept.), Ibs.Preweaning calf ADG, Ibs./dayAdjusted 205-day weaning weight, Ibs.Calf weaning condition score3Fall cow weight, Ibs.
Hereford' Angus'
Average St. deviation Average St. deviation144 -- 315
11.57 3.79 15.43 4.4610.67 3.28 17.10 4.5310.95 3.40 17.45 4.789.94 3.44 14.58 4.428.35 4.02 14.19 5.057.60 3.44 11.10 3.839.88 2.46 14.93 2.781.66 0.24 1.81 0.25428 48 460 544.04 0.69 4.57 0.751007 116 980 121
'Data ohtained for Hacford callie> in 1967 and 1970; data ohtailwd for An~us cattlc' in 1968. 1969. 1971 and 1972.2AD~fY = :\\'('ra~(' Daily ~Iilk Yield.3{:ondition SCOffN)uivalrnts: I = \Try thin to 9 =\"C'fy fat.
1977 AnimalScience Research Report 19
increased gradually from the first to third month of lactation after which itbegan to decline; whereas, milk production in Herefords decreased slightly thesecond month, increased the third month, and declined gradually thereafter.Both breeds exhibited a decline in milk production from the first month to thesixth month. Hereford cows reduced their daily milk yield by 3.2 poundsduring the lactation period; whereas, the Angus cows in the sixth monthaveraged only 1.2 pounds less milk per day than during the first month.
The general increase in milk production by the cows during the first threemonths oflactation coincided with lush growth of spring grass which providedenergy needed to reach maximum milk production. As the lactation periodprogressed, less nutritious grass was available, and this resulted in a decline indaily milk yield.
Another factor that may influence decline in milk production is thatcalves tend to become less and less dependent on milk from their dams as amajor nutritional source as they get older.
The higher level of milk production in Angus cows was reflected in thegrowth performance of their calves. On the average, Angus calves consumed5.05 pounds more milk per day, gained 0.15 Ib./day more from birth toweaning, were 32 pounds heavier at weaning, and were in fleshier condition atweaning. However, Hereford cows were heavier in the fall at the end of thelactation period than Angus cows.
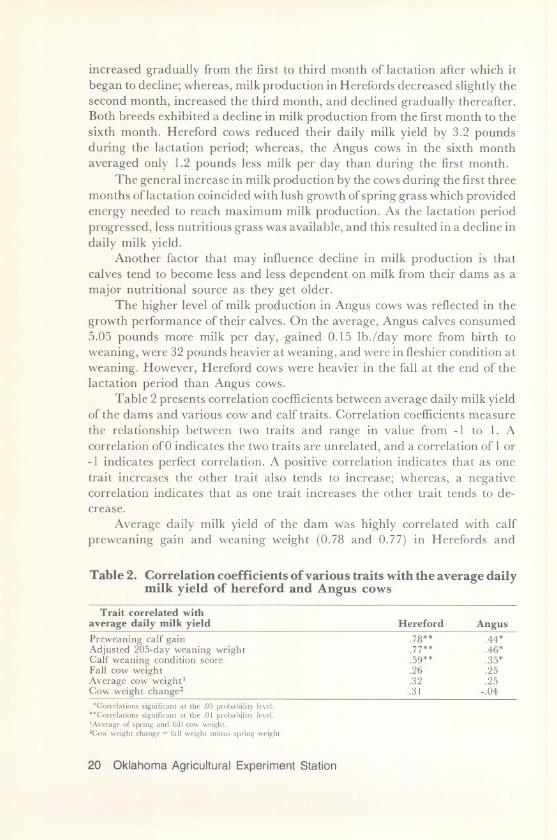
Table 2 presents correlation coefficients between average daily milk yieldof the dams and various cow and calf traits. Correlation coefficients measure
the rela tionshi p between two traits and range in value from -I to I. Acorrelation of 0 indicates the two traits are unrelated, and a correlation of I or
-1 indicates perfect correlation. A positive correlation indicates' that as onetrait increases the other trait also tends to increase; whereas, a negativecorrelation indicates that as one trait increases the other trait tends to de-crease.
Average daily milk yield of the dam was highly correlated with calfpreweaning gain and weaning weight (0.78 and 0.77) in Herefords and
Table 2. Correlation coefficients of various traits with the average dailymilk yield of hereford and Angus cows
Trait correlated with
average daily milk yield
Preweaning calf gainAdjusted 205-day weaning weightCalf weaning condition scoreFall cow weightAverage cow weight'Cow weight change2
Hereford
.78".77".59".26.32.31
Angus.44'.46'.35'.25.25
-.04
.CorrC'lalions significant a1 the .05 probability lev('1."Correlations significant at the .01 probability le\'el.
IAverage of spring and fall cow \'H'igh1.2Cow w('ight chang(> = fall weight minus spring w('ight.
20 Oklahoma Agricultural Experiment Station
moderately correlated (0.44 and 0.46) in Angus. These correlations were largeenough to reinforce the idea that preweaning calf growth is highly dependenton milk production of the dam. These data would suggest that 59 percent and21 percent of the variation in calf weaning weights could be attributed todifferences in milk production of the dams for Hereford and Angus, respective-ly. Increased levels of milk production was associated with a higher degree offleshiness in calves at weaning as evidenced by the correlations of 0.59 and 0.35with weaning condition score for Hereford and Angus, respectively.
Although the correlations were not large, there was a tendency within abreed for the heavier cows to produce more milk. The relationship between thechange in cow weight from spring to fall and milk yield is somewhat uncertainranging from a modest 0.31 in Herefords to essentially no relationship -0.04 inAngus. Neither cow weight or weight change would be as useful as indicatorsof differences in milk production as calf preweaning gain or weaning weightswould be.
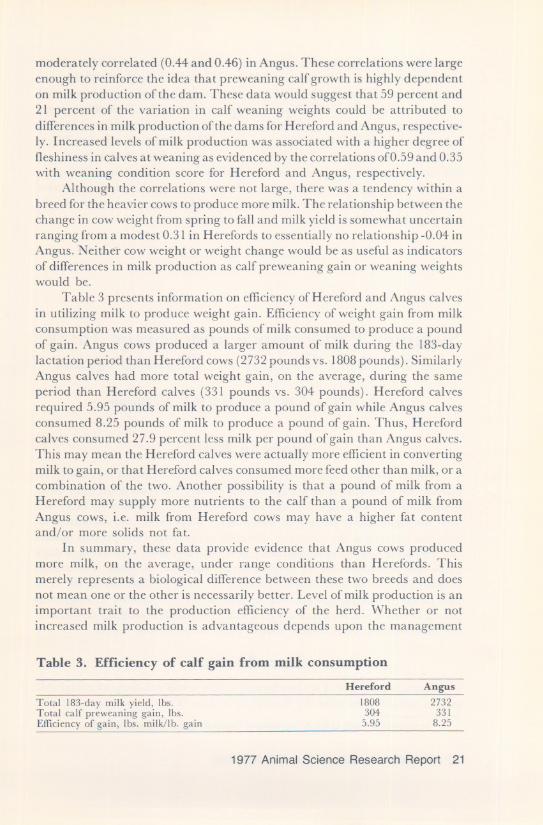
Table 3 presents information on efficiency of Hereford and Angus calvesin utilizing milk to produce weight gain. Efficiency of weight gain from milkconsumption was measured as pounds of milk consumed to produce a poundof gain. Angus cows produced a larger amount of milk during the 183-daylactation period than Hereford cows (2732 pounds vs. 1808 pounds). SimilarlyAngus calves had more total weight gain, on the average, during the sameperiod than Hereford calves (331 pounds vs. 304 pounds). Hereford calvesrequired 5.95 pounds of milk to produce a pound of gain while Angus calvesconsumed 8.25 pounds of milk to produce a pound of gain. Thus, Herefordcalves consumed 27.9 percent less milk per pound of gain than Angus calves.This may mean the Hereford calves were actually more efficient in convertingmilk to gain, or that Hereford calves consumed more feed other than milk, or acombination of the two. Another possibility is that a pound of milk from aHereford may supply more nutrients to the calf than a pound of milk fromAngus cows, i.e. milk from Hereford cows may have a higher fat contentand/or more solids not fat.
In summary, these data provide evidence that Angus cows producedmore milk, on the average, under range conditions than Herefords. Thismerely represents a biological difference between these two breeds and doesnot mean one or the other is necessarily better. Level of milk production is animportant trait to the production efficiency of the herd. Whether or notincreased milk production is advantageous depends upon the management
Table 3. Efficiency of calf gain from milk consumption
Total 183-day milk yield, Ibs.Total calf preweaning gain, Ibs.Efficiency of gain, Ibs. milk/lb. gain
Hereford
1808304
5.95
Angus2732
3318.25
1977 Animal Science Research Report 21
system (particularly quantity and quality offorage available) and the geneticpotential for growth of the calves produced. Ifforage is abundant and the cowsare being crossed to bulls from larger, growthier breeds, increased milkproduction may be desired. However, ifforage is somewhat limited, increasedmilk production may result in cows with an inadequate nutritional level toreproduce normally. Whether or not it would be economically feasible tosupplement the range nutrition of the cows to permit normal reproduction inthis circumstance depends upon the prevailing feed costs and the selling priceof additional weaning weight of calves. The producer should strive for a level ofmilk production in the cow herd that will provide adequate nutrition for thecalves produced to maximize profit in most years.
Summer Performance and Forage Intakeof Stockers Grazed on Bermudagrass
B.R. Wilson, G.W. Horn and W.E. McMurphy
Story in BriefForage intakes of eight steers grazing a 5.4-acre Midland bermudagrass
pasture were measured at approximately 28-day intervals from May 24 toSeptember 15, 1976. Digestible dry matter intakes (lb./ 100 lb. steer body wt.)were not significantly correlated with average daily gains, and accounted foronly two percent of the variation of stocker gains. Digestible protein intakes~(lb. DP/head/day) were significantly (P<.OI) correlated with average dailygains and accounted for 38 percent of the variation of gains. The resultsindicate (I) that protein supplementation for 30 to 45 days during the laterpart of the bermudagrass growing season, or (2) that pasture managementpractices that would maintain a high-quality bermudagrass forage throughoutthe summer may hold stocker weight gains to acceptable levels.
Introduction
A major criticism of bermudagrass is that it will not support acceptablestocker weight gains after the first 60 to 75 days of the growing season. The
In cooperation with U.S.D.A., Agricultural Research Service, Southern Region.
22 Oklahoma Agricultural Experiment Station