a comparison of police and criminal personality
TRANSCRIPT

Eastern Illinois UniversityThe Keep
Masters Theses Student Theses & Publications
1975
A Comparison of Police and Criminal PersonalityCharacteristics as Measured by the MMPIDale Ray FuquaEastern Illinois UniversityThis research is a product of the graduate program in Psychology at Eastern Illinois University. Find out moreabout the program.
This is brought to you for free and open access by the Student Theses & Publications at The Keep. It has been accepted for inclusion in Masters Thesesby an authorized administrator of The Keep. For more information, please contact [email protected].
Recommended CitationFuqua, Dale Ray, "A Comparison of Police and Criminal Personality Characteristics as Measured by the MMPI" (1975). MastersTheses. 3542.https://thekeep.eiu.edu/theses/3542

PAPER CERTIFICATE #2
TO: Graduate Degree Candidates who have written formal theses.
SUBJECT: Permission to reproduce theses.
.
The University Library is receiving a numb�r of requests from other
institutions asking permission to reproduce dissertations for inclusion
in their library holdings. Although no copyright laws are involved, we
feel that professional courtesy demands that permission be obtained
from the author before we allow theses to be copied.
Please sign one of the following statements:
Booth Library of Eastern Illinois University has my permission to lend
my thesis to a reputable college or university for the purpose of copying
it for inclusion in that institution's library or research holdings.
;2-/f'-?.) Date
I respectfully request Booth Library of Eastern Illinois University not
allow my thesis be reproduced because ����������������
Date Author
pdm

A Comparison of Police and Criminal Personality
Characteristics as Measured by the MMPI (TITLE)
BY
Dale Ray Fuqua .. -
THESIS
SUBMITIED IN PARTIAL FULFILLMENT OF THE REQUIREMENTS
FOR THE DEGREE OF
Master of Arts
IN THE GRADUATE SCHOOL, EASTERN ILLINOIS UNIVERSITY
CHARLESTON, ILLINOIS
197.5 YEAR
I HEREBY RECOMMEND THIS THESIS BE ACCEPTED AS FULFILLING THIS PART OF THE GRADUATE DEGREE CITED ABOVE
lrX- 1 9-ZJ I DATE
__ __ J

ACKNOWLEDGEMENTS
I am extremely grateful to Dr. Frank Hustmyer,
who directed thie thesis . It wa s with his interest a nd
extensive guidance that thts project became an interest1nf!
and educational experience.
I a m also grateful to Dr . Francis Sunnners fer his
advice, encouragement a nd support. I would like to thank
Dr. Herbert Morice for his efforts , which were essentia l
i n completing this project.
A special note of thanks goes to Mr. William .Kirk,
who supplied much of the clinical information needed in
completing this project. ·

ABSTRACT • • •
INTRODUCTION •
METHCDS . • • •
Subject� .
Appera tus
•
•
•
•
•
Procedure s .
R8SULTS . • •
Table l
Table 2
Figure l
Figure 2
Figure 3
Figure 4
DI SC US SI ON •
REFERENCES •
• •
• •
• •
•
•
•
•
• •
• •
TABLE OF CCNTENTS
• •
• •
• •
• •
• •
• •
• •
• •
• •
•
• •
• •
• •
• •
• •
•
•
•
•
•
•
•
•
•
• •
• •
• •
• •
• •
• •
• •
• •
•
• •
• •
• •
• •
• •
• •
• •
• •
• •
• • • • •
• •
• •
• •
• •
• •
•
•
•
•
•
• •
• •
• •
• •
• ..
• •
• •
• •
• •
• •
•
• •
• •
• •
• •
• •
• •
• •
• •
• •
• •
• •
• •
• • • •
• •
• •
• •
• •
• •
• •
• •
• •
• •
• •
• •
• •
• •
• •
•
• •
• •
• •
• •
• •
• •
• •
• •
• •
• •
• •
• •
• •
• •
• •
• •
• •
• •
• •
• •
• •
• •
• •
• •
•
• •
• •
• •
• •
• •
• •
• •
• •
• •
• •
• •
• •
• •
• •
• •
•
•
•
•
•
•
•
•
•
•
•
•
•
•
•
• •
• •
• •
• •
• •
• •
• •
0 •
• •
•
• •
• •
• •
• •
• •
Page
• 1
•
•
•
•
•
•
•
•
•
•
•
•
•
•
3
9
9
10
10
12
14
21
15
17
22
2.�

INTRODUCTION
The police officer ha s a lways b6en the source of
some controversy, but of late the public .ha s become
skeptical of the policemen 's role a s a n authoritarian
figure ( Niederhoffer, 1967 ) . The "typical cop" has
been evaluated in a multitude of studies dealing with
a lmost every facet of life. Niederhoffer ( 1967 )
suggests that the police officer transforms into an
authoritarian personality by vi�tue of the professional
role .
The personality characteristics of the police
officer have a lso been a source of great concern for
many scholars . The psychological needs of the police
officer were the target uf study by Simon, Wilde, e nd
Cristal ( 1973 ) . Using the Edwerre Personal Prefe��nce
Schedule they found that police officers sccred higher
than normal ma les on need for exhibition, chang e ,
heterosexuality, end aggression. The police officers
scored lower en the need for a ffilia tion, aba sement ,
nurturance , and endurance .
Another study ( F enster a nd Locke , 1973) questioned
the existence of neuroticism among police officers,
The findings of this study would indica te that on the
basis of performance on the Eysenck Personality
-3-
'I
l J

-4-
Inventory (form A), neuroticism is not a characteristi�
of the police officer.
Parker and Roth (19 7 3 ) administered several
personality measures to a sample group of police officers.
They suggest from their findings, that police officers
generally withdrew from "healthy" social contact. This
withdrawal, according to Parker and Roth, is a learned
function end is directly related to the profession.
Although the studies are consistently differing
in their findings, the persistence of such studies,
especially in the last fifteen years, indicates e
great social concern with the police profession.
Another class of individuals of great social in
terest is the "criminal personality". Althoup:h the term
"police officer" is a working definition in itself there
remains some difficulty in defining the term "criminal".
Scott ( 1969 ) makes the point that in general the
classification of an individual as a criminal is initially
done by the court system. Being that conviction and
incarceration are easily observed classifications
of persons, the present study will use these concepts
to define the term "criminal".
The research dealing with the "crirr.inel personality" is
practically unlimited. This interest in the "criminal
personality'' ranges frcm biological (Linder, Golcr.�n,
Dinitz, and Allen 1970 ) to psychosocial (Tunin, �ahsr,

-5-
and Smith, (1973). Smith end Austrin (1974) related
socialization to criminal behaviors. Woodbury (1973)
investigated the psychological concept of attitude as
it related to criminal orientations.
The particular point of inter�st here is similiarities
between t�A personality O f the police Officer SnC the
personelity of the crimlnal. This interest was
originally generated from empirical observation by the
author. As a veteran police officer and as a student
of psychology, the author has been in the unique position
of observing the environments and the behavoirs of both
groups. Both the police officer and the criminal appear
on the surface to be operating within similier environments,
and in many situations display similier behaviors.
For example, the violence, the strong group
identification, limited 9ocial exposure, and the rigid
social expectations are ell related to both criminal
and police environments (Lefkowitz, 1975; Jasmine,
1971.i ) . Further both groups ere opera ting frc·m positions
of social extremes, the police protectin� society and
the criminal resisting society.
At this p�int it is apnropriete to outline snd
describe the term environment as it applies to these
two groups. The police officer is limited in his

-6-
social contacts because of the nature of hi s work.
Genera lly the poli ce officer i s prohibited from frequent
ing establishments of poor reputation, a nd t t i s the
author's observa tion that the police officer ha s a
strong tendency t o choose hi s social activities with
other polic e officers . This limited social a tmosphere
ie encouraged by the fact tha t police officers are re
quired to maintain the most hea lthy appea rance, as they
are constantly reminded that the public i s aroused by
any disruptive behavior on the part of a "keeper of the
peace". The environment of a police officer i s then
restricted to persons of simi liar interests which en
courages constant exposure t o police practice a nd c on
versati on. The conversa tion generally consi s ts of who
owns the biggest gun with the most killing power, who
made the last arrest, a nd other such references to
violence a nd general poli ce i nterests.
Wherea s the police offi cer i� restricted under the
threa t cf professional consequence s , the criminal i s
restricted to hi s own closed social group so a s not to
allow a ny leaks in "clas sified i nforma tion" . The
crimina l code, i n feet, i s actually must stri cter than
that of the police o�ficer. Whereas the offi cer might
leak i nformation to the wrong person end consequently be
suspended for a peri cd o f five days without pay, the
criminal who leaks i nformation most likely would fa ce

puni s hment t ha t i s much more s e vere. The crim ina l , t ee,
mus t be constantly on guard a g �i ns t frequent i ng the wrong
e s tabli s hment for two reasons . Not onl y would the criminal
f a ce s e vere puni s hment from w i t hi n his own group, but the
g enera l publi c i s hig hl y hos t i l e toward convicted felons .
Because of t hese factors and others, the criminal i s trapped
i n hi s own envi ronment where he i s expected t o di spla y
a nt i -soci a l behavior.
Berman ( 1971 ) adds s ome weight t o the concept of
simili a ri t i es between these two gro1lps. The sub�ects
cf Berman's study were 100 appli ca nt s to correctiona l
offi cer's pos i t i on s . A compa rable �roup of 1.nma tes
served a s a second set cf subjects. During t he course
of t he study both groups were admi ni s tered the Minnesota
Mul t iphasic Persona l i t y Inventory ( MMPI). Berman found
i n his s tudy that the most obvi ous similia r i t i e s between
t he appli ca nt s a nd t he i nma t e s occurred on sca le 4
( Ps ychopa t hi c Devi a te ) a nd s cale 9 ( Hypoma ni c ) . This
would indi cate that both groups show emoti onal shallow-
nes s , a l i enati on from soci a l cus t oms , and rel a ti ve in-
abi lity to profi t from soci a l s anct i on ( Berma n , 1971).
Dahlstrom, Wels h, and Dahlstrom ( 197 1 ) chara cte rize
the 49 profile a s persons wit h clear manifestat icns
of p s ychopa t hi c b e havior, overa cti ve , impulsi ve, i r
respcnsible, untrustworthy, s ha l low a ·na superfi cal
i n their relat i onships.

-8-
Whether or not Berma n 's study wi ll be relat ed to the
findings of the present study i s yet to be seen. However,
Berma n's findings do a dd w eight to the empi ri ca l observa
t i ons.of the author. The psychologica l a nd socia l im
pllc&ti ons of Berma n's study are a stounding. c�.petent
research i n sim111ar sett ings must follow.

METHODS
Subjects:
The subjects of thi s etudy were divided i nt o two
groups. The first group consisted of twenty police
offi cers from C oles County, I l li noi s. The sub jects
volunteered to parti cipate in the study with no prior
knowledge of the topic or i nterest s . The mea n age of
thi s group wa s 3I . 6 years end the average educatione�
level wa s 12. 25 yea r s .
7he second group c onsi sted o f twenty inma tes frorr.
the Coles County Jail. �hese subjects were i ncarcerated
for a variety or offenses ranging from one traffic
violation to several forcible felonies. Thi s group of
twenty was a time-sample of 26 inma tes a t the jail . The
parti cipa ting inmates ha d no prior knowledge of the
study ' s topic or i nterests. The mean age of the irunate
group wa s 29 .4 years , a nd their average educational level
was 11.6 years .
The mean age of the two groups wa s very comparable.
�-

-10-
Educa ti on wa s not c ontrolled mainly due to the a lready
limited number of potenti a l subjects i n the inmate popula
ti on . However, i t i s a pparent that the educa tion sta tus
of sub j ects from the two groups was comparable. All
subjects from both groups were C a ucasion male s .
Apparatus :
The test used i n thi s study was the Mi nnesota Multi
phasic Personality Inventory (MMPI ) . The MMPI i s a
personality i nventory designed t o eli cit self-descripti ons
on several different clini cal measures (Dahlstrcm, Welsh,
and Dahlstrom, 1971).
Proc edures :
The procedures used in this study were relati vely
simple . Bo�h groups wer� admtni stered the MMPI after
volunteering to take a personality test for research
purposes . Standard i nstructions were read to the group
from the front of the MMPI test bocklet (Hathaway and
McKinley, 1943). No time 11�1t was imposed.
The forty answer sheets were sc ored by ha nd . Individual
profile! were prepared for each of the forty sub jects .
Mean scores for both groups were obtained for e�ch of
the fourteen scales used (?, L , F , K , Hs, D, Hy, Pd, Mf,
Pa, �t , Sc, Ma, end Si ) . Profiles were constructed on
the ba sis of the mean scores with the K factor added .

-11-
All mean s�ores weretronsformed to T-sco!'es usinz the
tabled T v&lue given 1n Hathaway a nd McKi nley's Revi sed
�anual (lq51) . To de thi s , it ts necessary to round
each mean sccre to the nearest whole number.
�ext the profiles were coded numeri cally, nrovidlng
a n easily recognizable tool ba sed on the prominent features
of the profile . This also wa s done in accordance with the
procedure outlined by Hatheway a nd McKinley (1951 ) . This
entire procedure was then repea ted for only those
subject ' s within the two groups who ha d a r score of
less th.a n seventy for the F scale. Finally a t-test
of uncorrelated s c ores we s calcula ted at the .o5
level .

RESULTS
The following codes were discovered for the respective
groups of this study:
Police - 4'897625130
Inma tes - 489 ' 6721350
2.4:9 . 7 : 12 . l
3 .6 :13.4 :10.9
Generally the po2i tion of the sc�le in the code
gives a general relationship of the scale to all other
scales. The scales a re arranged from left to right
with the highest score on the left and the lowest score
on the right . Research done on particular codes is
generally done with respect to the scale order in the
code .
The original coding system devi sed by Hathawa y
was used in preparing the codes . · An accent mark ( ' )
i s inserted so a s to divide the scores of seventy er above
from the scale scores fa lli ng below seventy. All
numbers to the left of the accent mark are of seventy or
above, while all numbers t o the right of the accent
mark are of less than seventy. I n the 0ode for police
officers, scale 7, a nd scale 6 are underlined. This
occurs when the scales have the same T score, or when the
T scores fa ll within one point of each other. This
procedure allows the clinician an opportunity to dis-
-12-

-13-
regard the immedi ate order of the scales involved .
To the far right of the codes one may observe three
numbersaeperated by colon s . These figures represent
the scale score of the L, F , K, scales respectively .
Although thi s relatively simple coding procedure
allows for e more concise comparison of the profile, it
is still es sential that the clinician know the actual
scale scores.
The possibility that these results occurred by
chance alone was tested at the .o5 level of significance
using the t-test for uncorrelated means . The resu lts
show the component parts and the resultant t stat1stic
---------��----------------------------�----------------
I nsert Table l about here
-------�---------------:-------�-----------------------�
for each of the ten clinical scales as well as for
validity scales L, F, K . Significance was found
for scales Land Me et the .OS leve l . (See table 1)
------------------------------------------------------�-
I nsert Figure 1 about here
----------------------�-�-----------------------------�-
Figure l represents the �raphical profiles fer the

TABLE l
Results From t-test For Uncorrlated Means
( N=20) ( N=20) I I I Scale (Inmates) (police) Sx I Sy I - I x y I
L 3.60 I 2.35 1.846 1.694
F 13.4 0 9 .65 7 .5ll� 6.276
K 47.40 49 .55 7.32 6 . 74
Hs 61.10 57 .l+O 13.92 11 .54
D 63.9� I 60. 75 15.54 16�52
Hy 59 . 20 56.55 10.47 11.46
I Pd Bo.Bo I 72.05 14.23 15.55
Mf 59.4S 58.JO 7.03 7.63
Pa 67.80 I 63.0;; 13.20 12.66
Pt 6!.t..65 63.5� 12.03 12.35 i
Sc 7g .25 ! 67.60 20.13 19 . 35 I i Ma 72.95 64.75 -. 1 9 1 �. 10.29
Si 56.15 56.10 8.79 io�·56
I I '
v
38
38
38
38
38'.I •·
38
38
38
�fi -'
38
38
38
38
.I I
I I I
I I
I ' . ' I I I
I I
t
2 A 210�'•
1 . 7 12
0.96
0. <?l
(' 6� . -
o. ':"6
1 f):.. . .
o.u.c
1 .16
c.2e
l.Rj
2 .11�:-
0.02
'* -131er.1fi-f jCfn� a.t I· 05 level I
l I I I I
I I I I
I
r j i
:
:
I
.
I
! -
!
I
.
I '
i :
I . ! i
.
.

FJGW�E: 1
PROFILSS p;(:Jr: (.,!) ,.'I Tl� Mi:.� N SC Lt� SCO:U:S Police
120 100
90 80 70 6 0 50 40 30
20 10
I
I
i l I
1
i I I I i i
T � \(
I
I ...
;· " I/
37 65 50
L F K
1 2 3 4 5 6 7 8 9 0 Mc:: n Mv Pd Mf P� Pt Sr Mr:i Si
T T ' I : I I
l I 1 I I I I 1 � _j
I I � ·- .. . - __..... -· -
I I / '\. � I / ---. � I ......... .........,J' ',V ! '; I ! i -- ·
i I
- � I
·-1 - -- i I i t - --,_ ·-,___. '
I I
__ _J � --· · -I i
L 5 7 6 1 5 7 72 58 6 3 6 4 68 65 56
Inmates
2 3 4 5 6 7 8 9 0 hs D Ny Pd Mf Pa Pt Sc Ma Si
i 2 o r._, ---1----+��;_:-_ -.._--J�---�------t------+-=-- �-=--=-�-=-=�==:=-1·�·----4-- ··-=_:1==:=� 100 +---+---+--+---+��..+-.4 --f---+---+---'--4---t---1---'--'---J
90 t--+--+--�-+--l�-+---'-�
!�: )\·=:=��� t��::=-�.:):-" , ··-1 so 1
�-
..
___ .__ ----- -t +- : . 4o, . - -H' ._ ... __ J
I ' I 301---1·-· - .. ·-· · · --.... ·- _ ..... -- - � I 20
i -��-. -'---!
10+---+--+---t--+--t---+---+--+--+---l�-l--t--4----+---+---+-� I. ·-' -·--· ··--· ·--- - ... " ·-- ---- ·----- ·- - . -.. ·-- -- t __ · -· ··--J 48 74 48 61 6 4 59 81 59 66 65 79 73 56
(N:20)

two �roups , plotted on the basis cf the actual mean sca le
scores. This figure a llows a visual comparison of the
general profile configurations of the two groups .
-----------------�-----------�-------------------�----
Insert Figure 2 about here
------------------------------------�-----------------
Another interesting comparison can be made on the
basis of the number of "hi�h" individual scale scores
from each group . The a s signment of a high point would
be s omewhat arbitrary, however, being that a T score
of seventy is generally accepted a s the upper end of
the normal range , it is use d . Figure 2 shows in the
form of a graph the percentage of individua ls whose
T scores fall above sevPnty for the inma te group a s
opposed to the same figure for the police group.
BAsica lly this comparison provides for a more in
dividua l evaluation of the profiles than does the
comparison of mea ns .
I t is apparent tha t both group profiles show
a high F score . Hathaway and McKinley ( 195 1 )
state "if the F score is hip:h, the other scales a re
likely to be invalid either because the subJect
wes careless or unable to comprehend the 1tems11• For the

10�
95%
9()%
85%
80%
75%
10'/o
65%
60'1/o
55%
....._ __
�
. - .
I I r·-I l I I I
I I .
� I
I I .
j !
I I I I 1:. --i I ' i I '
I I
! !
:
--i-·-1 I
'
I i
: I
•
- -
•
• � '
� I I
FIGFRE 2
PERCEN1AGE CF �-SCLR�S AGOVF 70
t i I
! I I I ;
... � " ' I
I I
I
I I -4-
: I l I !
I� .
l I I
i I I I I I
. ; I ' � 1 1 1
'
l
I
·---- -·�- --
, I
'\ I
\ \, I
I
I . !
l "'' I
)\ ! i I I
\� i ·: i
·� :
I I I I
50%
45%
40%
35%
Jo%
25%
,..o� c. /<J
I
I
I I I ' \ �I ,
-yit-\ /f "' I
�\ I v \ -.r --- -\ .,/ N� I LI \ i i I �
I I ':. I i
- . - - ·- �- I \_ / LI " v '/ '
I J I ' /. 1 I ' I I I • I
10�
. ... . I .. // � l 1 :
: ., ' ·. ' '°'- . --- .... I I t . I I I
SCAI.:::3: ? L � K Hs D Hy Pd Mf � Pt Sc Ms Si D'.��C'IES PC I I CE SCCRES: 0 0 PCIICE: ( N=20)
DElJC-TES f NMATE SCORES: X X IN�1AT2S: (•N=20)
I

-16-
inmate group the averege T score on the F scale is
74, while the average score for the poli ce gr?up
is 65. A s stated earlier seventy is somewhat ar
bi trari ly assigned e s the upward limit of normality.
The fact that the obtained score i s slightly above
the arbitrarily a�si�ned high point for the inmate
group and slightly below for the police group could
possibly bri4g up the ouestion of validity tn the
overall results of this study .
I t seems unlikely that the entire fincings cf
this study should be abandoned or nullified because
of F scores that are near an arbitrarily assigned
high-point. Dahlstrom, Welsh, and Dahlstrom (1960)
give several varying factors which can add to high
F scores. Also the relatively high F scores found
here would not have the .:ame affect that an extremely
hiph F score , of say 85 or &bove , would have.
Whether or not the clinician' s personal position
would support or oppose a particular interpretation
of the relatively high F scores obtained in this present
research, dces net eli�inate the pos?ibility that the
general validity of these findings could be affected
to whatever degree by the F scores of 64 and 74 . For
this reason a second analysis of the findings was

-19-
initiated. By providing both sets of date, it is hoped
that the criticism of the study will be li�ited to state
ments of personal preference.
The procedure designed to compensate for the high
F scores simply consisted of removing from both groups
the individual profiles containing an F score greater
then 12 (equal to T score 70) . Within the police group
five individual profiles were found with F scales exceed
ing T score seventy. Ten such profiles were found in the
inmate group. After removing these "high" F score profiles,
N for the police group equalled fifteen. and N for the
inmate group �quelled ten.
'l'he following codes were established for the res
pective groups after the F score exceeding T score 70
were removed:
Police + '2!!:875620
Inmates + 4'896257031
2.5:6 . 6:12 . 3
3 . 0:7.6 : 10 . 5
A brief examination of these codes indicates that only
scele 4 (Pd) of the inmate group exceeds T score 70 .
In the code for the police group scales 9 end 4 were
within one point of each other, and scales 2 and 0
were likewise within one point of each other. It is
also suggested that these codes be compared to the
group codes provided earlier for the full groups to

-20-
determine the effects er removing F scale scores exceed
ing T score 70.
-------------------------- -----------------------------
Insert Table 2 about here
--- ------------------- ----- --- ------�--------- ---------
A t-test for significance provided the statistical
information to check for the significance at the .05
level for mean scale scores of the groups after F
scale scores exceeding T score 70 were removed. The
data computed from this test is shown in table 2 .
St�nificance was not found on any scales. It is
apparent to the observant reader that the t statistic
sho�n on table one end two for scales L and F were
com:uted on the basis c- raw scores. On both tables
ell other comp�tations were done on the basis of T scores.
Raw scores were used for scales L end F in order to
make more accurate detert?linations, due to the fact
that tabled T scores for these two scales are arbitrariJy
assigned, and do not derive from mathmatical fo�ulations
(Hat�away and McKinley,(1951).
The general configurations cf th� two rrour profiles
nay be visually inspected on the graphs shown on �i�ure 3.
------ ----- ---------- - -- ----------------------- ----- --
Insert Fi�ure 3 shout hero
--------------------------------- ------------------��-

Sea lee
L
F t
K
Hs
D ·�
Hy
Pd
Mf
Pa
Pt
Sc • He . Si
•
TARLE 2
Results From t-test For Uncorrelated Means (Where F 70)
(Inmates) (Police) - -
x (N�l5) Sx Sy ( N=lO) J.OC 2.U.6 2.00 1.92
7 .60 . 6.60 2 . 36 2.87
46.60 50.00 q.13 7.05
54.80 53.40 14.80 8.54
60.00 5U..86 16.19 13.82
55.20 53.06 10.45 8.Rl
71.80 65.06 11.17 9.63
59.00 57 .66 6.32 7.73
61.so 56,l.3 9.10 9.96
58.�c 59.46 9.5o 10.97
68.90 61.06 15.77 15.80
6 5.70 65.73 1� 67 - .. 10.50
58.::o 54.20 8.,32 ll.L.O
'
�
v t
23.00 o.66
23.00 0.91
2J.OO 1.05
23.00 0.,30
23.00 0.99
23.00 o . 55
23.00 1.60
23. ()() 0 } � • l _
23.00 1 36 . -
23.00 0.13
23.00 1.21
23.00 o.oo
23.oc 1.0?.

FIGUiE 3
PROFILES P;{t:,f', RC::D 1.iITH Mf.. N SC: LL: sco�r::s
J 120
100 90 8 0 70 6 0
50
I
t I
I ' I--
40
30
20
10
120 100
90
80
70
6 0 50
40 30
20
10
! i
j ' !
i ' : I I
i '
l I
I
t I
Police ( F<.: 12)
1 2 3 4 5 6 7 8 9 0
J:'---{--·T-· ·11{�· ...
! ' I
! ' I
�-____...
D .... II _J
i ! ; l i J l
- - - -· -� .. __.---r .. -- �--·
: ' f � . .
<LJ�.f._l_g. RL¥ f·:a ! ' I I
! I ! - -
I
I �--..._._ . ...-.. -... j l I I ! ! .:.. ! .)� l . ...-"'-
Si I
I --� ; #""'i�
I • -,.-.--.... ......__. __ ! ; : ;
� - 'i ' I I ! ' I I I ! i :
' ; I I I i ! ! ±±==i·-· --- ·---· ! . I
I ; i I . I 44 5 9 50 53 6 1 55 6 5 58 56 5 9 6 1 6 6 54
T F K I
; ! i l I I r I
/ ""-. . ' 1
I
4 6 6 1 4 7
Inmates
1 2 3 4 5 6 7 8 9 0 Its D Wy_l?fLMf Pa Pt Sc Ma Si .. -· ... __ ; ___ J__ ·-·· t-. -·�-- •• ·.+-J-···--
I I i
I ' I
I I '
. ' -t i �--· I
I i
i i ' I / '-.., � ! - ,...__
............ � - I - + T I . ' I . i ! I ! ! I
i I I I
� i i I I i
i I
! I I ...... 55 6 1 55 72 6 6 6 2 59 &)9 6 8 SS'
r
.-l..--!-·· ;
. . I I i I {11=15)
. l
'
! I
! '
i I I I . '
;
O<= 10) l I
I l I '
I i I l
- 23-
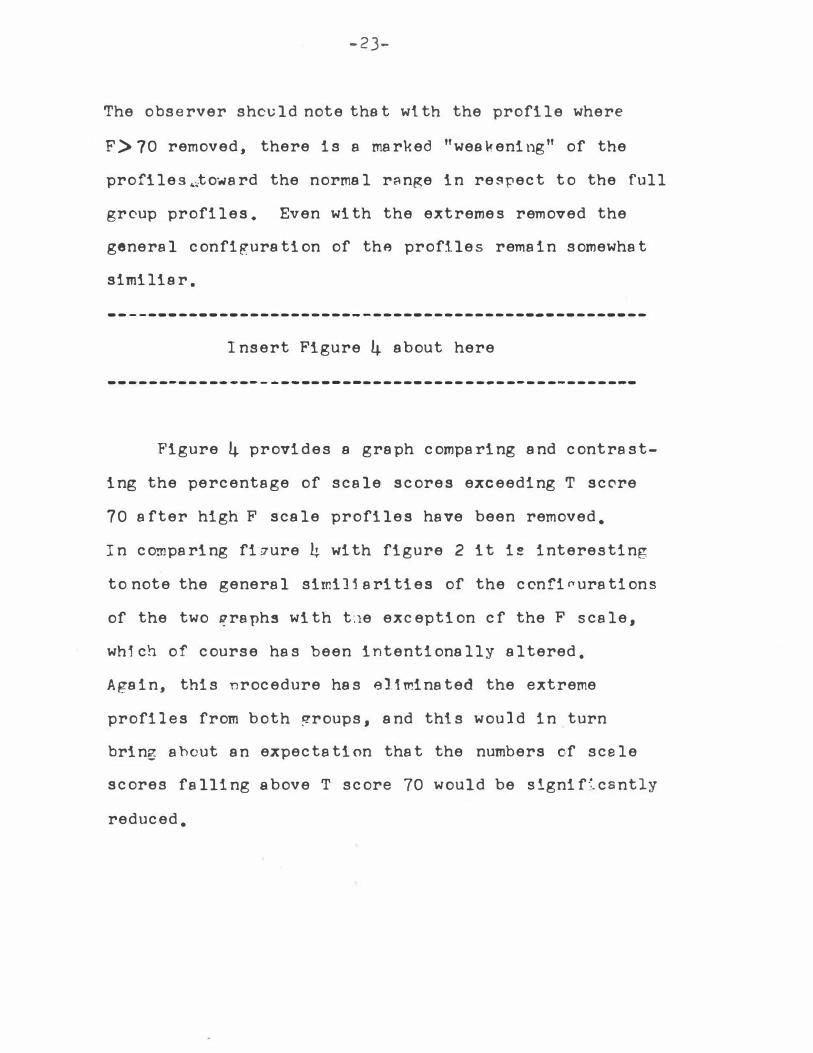
The observer shculd note the t with the profile where
F> 70 removed, there is a marked "wee\,(ening" of the
profiles�toward the normal rBn�e in re�pect to the full
group profiles. Even with the extremes removed the
general confipuration of the profiles remain somewhat
similiar.
------------------------------------------�----------
Insert Figure 4 about here
---------------- - - - -- - - - ----------- -----------------
Figure 4 provides a graph comparing and contrast
ing the percentage of scale scores exceeding T score
70 after high F scale profiles have been removed.
In comparing fi7ure 4 with figure 2 it i! interesting
to note the general sirr.i11arities of the ccnfirrurations
of the two f?raphs with t.1e exception cf the F scale,
wh1ch of course has been intentionally altered.
Again, this nrocedure has eli�inated the extreme
profiles from both �roups, and this would in turn
bring ahout an expectation that the numbers of scele
scores falling above T score 70 would be signif�csntly
reduced.

F I G O R .t� 4
FERCENTAGE OF T-SCC:RES ABOVE 70 wHI::RE F < 12
100% l I
'
; I 95%
9 o%
85%
Bo%
- ---- -- 1- --- -- ··-� - -t - ·- -· -._ ___
75%
?Ofc
-·
- ··--·-
65%
60%
55%
50%
45%
4o%
35%
3o%
25<%
2Cffc,
- ----
15%
10%
----
, _
I
--
SALES: ?
DENCTES
DENOTES
i
I
l F ? C L1 CE
I NMATE
!
I
• I
i '
1 ·
I
i\ I I \ I
:
I I � � � • '
... lo..
_//
-K Hs D Hyi . t
SCORES : 0
SCORES : X
'
:
I I ! ' ;
i I I i I i
J !. I I I I I i I I
! I . '
I � ' . I I ' I I I
i I t
I l i l I I :
I i
I I I '
i ,, i
I . • I I I
I ! I
�-� I
I � � � •
J !' -I ! :
:
i !
i - - ·-
I :
"' ' I ' � \LI I . .
I l ! \ ',, t ·- -· 1 '· I 1
I \ I j l : I ---
\' 1 l I ! '
\ I �: . ' I
\ I II ' l I i ; 4-f/ ; '.
I ' ' . , t .]' I . i '
nt j ) • ' � i '
w i I r-
T : ! . I i
Pd M f Pa Pt Sc ff .. • i:j Si '
0 PCLICE: { N=l5 )
x ! !\TMP .. �ES : ( N=lO)

DI SCITSSICN
Limi ta ti ons:
Any resea rch employing the MMPI i s prone to certain
weaknesses ; weaknes se s that are i nherent in the testing
tool i tself . Hathaway a nd McKinley ( 1951 ) were keenly aware
of the weaknesses of interpretation using the MMPI , a s
discussed i n their Revi sed Manual . They readily admit that
the M�PI results a lone are insuffici ent for evaluation
wi thout the subjective evaluation of the "clinician in
terms of hi s concepts of the significance of the symptoms
to the sub j e ct ' s self concept, to the prognosis, and
reletive to the particular cultural milieu of the sub j ect" .
Hathaway e nd McKinley go eheed to point out the fact
that profiles often show " c onsiderable variability''
from one test to the other. Thi s variability would
seem less i nfluential for group means, but it must still
b e considered.
Norman ( 1972) a ddresses himself to the general
weaknesses of single factor persona lity evaluation by say
ing tha t in light of the va st complexity of human behavior
discovered in recent years " • • • it i s ureasonebl� • • •
to expect any single fixed forma t t o be a suffi ci ent means
-25-

- 26-
for assessing human personali ty for all purposes . " Th�
aweeome task of devising an all i nclusive personality
i nventory seems obviously futile . However, of the two
alterna tives, not undertaking persona lity assessment and
assessing personality within given limitations, i t would
seem most reasonable to proceed within limitations.
One obvious limitati on that can be indivi dually
attributed to this study is a geographi cal limitati on.
All subj ects involved in the study are taken from Coles
County, I llinois . I f the hypothesis is accepted, there
are simi liarities between the two groups, can we general
ize the findings to other similiar areas? It would not
be reasonable to try to apply these findings to Chicag o .
The two areas e re obviously too different . However,
it would be reasonable to apply these findings to �imiliar
areas, such as neighbori!'lg c ount1·es, or to other areas
of similiar population characteristics.
Another possible limitation of this study is imposed
by the relatively high F scale scores obtained for both
groups. Selected rese�rch suggests that the high F scale
in many profiles might indicate on overall validity probl�m
for the profile (Gough, 1956) . However, there i s e sec ond
possibi lity ( Ha theway and McKinley, 1951) . Defensiveness
is responding to the questi ons would show a distortion very
much like the one showing on a high F score . Of both

-27-
�roups it can very readily be presented that defensive
ness would be strong chara cteri stic .
One of the most prominent a spects of the policeman' s
behavior i s hi s socio-occupational i solation ( Lefkowi tz,
1975 ) . Bui lt into thi s isola ti on are several defensive
constructs. such a s professional expecta tions, ·designed
to promote the i solati on. A resea rch project such a s the
present one would logically present a n i ntrusion to the
socio-occupational i s ola tion, and i n turn the potenti a l
for e high F scale scor� , based o n a defensive distortion.
The inma te ' s personal situation wculd also seem to
promote defensiveness i n the research situation presented
here . The fact that all subj ect ' s tested ln the inma te
group were incarcerated a t the time cf testing, has several
defensive implicati ons . First of all the self-conceot
of such individua l ' s hav� most likely begun defensive
reactions to compensate for the fa ct that they a re in
jail . Next they a re requested to participate in a
rese& rch project being conducted by a person whom i s
known to be a police offi cer. This may cause a defensive
reaction in the inmate group . Fina ll y , no expla nati on
wa s given a s to the underlying purpose of the research.
A lthough confidentiality wa s promi sed to the inmates,
there i s no rea son to believe that they totally accepted
thi s . A fter all the researcher was one of the �rcup of
pe�sons directly responsible fer their i ncarceration or
tempcrary loss of freedom. Surely the inma tes were a t

-28-
least minimally apprehensive in regard to the intent
of the testing.
Obviously a defensive reaction cculd well be an ex
planation for the htgh F score obtained, at least
in part . Another matter tc be considered here is the
actual F scale score. The mean for the police group
{ 65) is within the normal range , falling at one and
one half _normal standard deviations above the normal
mean { 50). I n respect to the inmate group ' s F scale
score of 74 - 2.40 normal standard deviations above
mean 50 is slightly above the upp�r range of
normality . Being that this score is only slightly above
normal to begin with, it seems the t the defensive
factor for the inmate group would reduce the negative
implications of this scale score as it pertains to
validity . This would mcst likely not be the case
if the F scale were considerably hi�her. qoweve r ,
in the event the� t�e observer oisa�rees with th� s
line cf thinking, he is free to make comnarisons
on the basis of the F scale scores tha t fall b e l ow
the T s c ore 7 � ms r k , as they have been made eveil-
a ble ( See figures ), 4, and table 2 ) .
Another factor to be considered is the similierity
of individuals making up the two groups. This question

-29-
needs little attention i n regard to the pol i c e group .
The i ndividua l s wi thin the group a re a l l of simi liar
professi onal intere s t s , and of like i ncome s . The inmate
group does not share these attributi cns . The i nma tes
come from di fferent professi ons, and from di fferent
ec onom i c s i tuations . The i nmat e s were i ncarcerated for
e v a r i ety of o ffense s . Althouph the i nmate group i s ma de
up of individuals who were a ll i ncarcerated, ether va riables
arc involv e d . However, thi s study emplc·yed the inma te
group beca use i t WE S a n avai lable sample .
The hypothe s i s that "the groups are simi liar in
persone lity characteri stics" dces not lend itsel f
to sta tistical evslueti on. The worki ng hypothe sis " the
groups a re not di s similier" i s equally di fficult to prove .
Here , again, it i s important that the climi cien �ake a
sub .� ective j udgement a s to a c cepti ng or re j ect ing
the hypothes i s . Being that the research supports
eva luation on the basis of high points and genera l
profi le configurati ons , recall that the prof ile codes ob-
tained a re :
Police
I nma tes
+ 4 • 89�25130
+ 489 1 6721.J.20
On the basis of these profile codes, severa l sirni liariti e s
can be seen. For the fi rst three scales 4 ( Pd ) , 8 ( Sc ) ,

· 30-
a nd 9 (Ma) the order is identical in both profiles .
For scales 4 end 8 no statistical significance was
fouhd (See table 1) . Significence we s found for
scale 9 e t the . o5 level. Sca le 4 for both profile codas
exceeded T score 70. Scales 8 and 9 for the police groP;
fell shortly below the T score 70 point , while scales 8
and 9 fell above the T score 70 point for the 1��e te
group. The fourth end fifth high points fer the police
group were sca les 7 ( Pt) and 6 ( Pa ) respectively , a nd the
line under scales 7 a nd 6 in this code indica te tha t the
scores of these two scales were within one point of each
other, e nd hence their order is ra ther ambiguous. For tne
inma te group scale 6 wa s fourth in high point order end
scale 7 was fifth. Thus the high point ord�r of t�e firs�
five sce.1. ... a ro1.· uo"n codes is very similia� .
Recall tha t Berman ( 1971) found s1m1lierities
between applicants for prison guard positions and prison
inma tes " occur most vividly" on scales 4 and 9 . "'t-i1 s is
extremely interesting when compa red to the findings of
the present study. High pcint scales of 4 and 8 e re
characterized by the terms unpredictable, irr.plu sive , and
non-conforming ( Dahlstrom, Welsh, and Dahlstrom, 1960 ) .
High point scales of 4 and 9 are cha racterized by the
terms impulsive , irresponsible , and untrustworthy, showing
a more de''ni�• tendency· toward psychopathic beha vior
(Dahls trom, Welsh, and Dahlstrom, 1960 ) . The sirr.1 11e rities

-31-
between these two profiles are obvi ous . The largest
differences lie with the fact that the undesirable
element of the 49 profiles are more ree dily observed
a s psychopathic due to the energizing effect of the hypo
mania ( Scale 9) . The obtained c odes for both the poli ce
e nd inmate groups are 48 , but �he third high point i s
scale 9 , giving these profi les the energizing effects
of the hypoma nia .
Berrean ( 1971) goes on to say tha t the 49 profile
indicatee " emotiona l shellownees, alienation from social
customs , a nd rela tive inability to profit from socia l
sancti on" . These a t tributes would also apply to the codes
obtained for the poli ce a nd inmate grcups . Gilberstadt a nd
Duker ( 1965 ) characteri ze the 49 profile typed a s soci ope thic .
Behovior of this profile i s chara cteri zed e s en individ-
ual with e low frustra t � on tolersnce end a tendency to
act out their a nti-social feeling s . Hathaway and Monachesi
( 1961) found that the 4 e nd 9 profile types were some-
what withdrawing, urunotivated, resi st�nt to ac cept norms ,
and could be expected i n general to di splay problem beha vi or .
'I'he l�8 e nd 49 profile can b e summarized a s very s1mi liar,
with the 49 profile being more inclined toward totally un
acceptable behaviors. The logical c onclusion to be drawn
i s that these e re s ome ma j or similierities between the
poli ce and irunate groups , a s well a s betwe8n thi s research

-32-
a nd Berma n ' s .
I n looking a t Figure 1 , i t i s apparent that althou�h
there are some marked similiari ties in the �refi les i n the
general configura tions , there i s also a general eleve tion
of the inma te ' s mea n T scores above the mean T scores of
the police group . The exact eleva ti on can be �een i n
the following for the high point scale s :
Scales
Police
I nmates
Pd ( 4)
72
81
Sc ( 8 )
67
79
Ma ( 9 )
65
73
Pt ( 7 )
64
65
Pa ( 6 )
63
68
I n evalue tin� thi s elevation in resoect to the hyoothesis
that "there are si miliari ties between the oolice and � nres te
grcup , '' e t ftrst ' glance o�e mi�ht be deceived . However,
taking into considerati on that the eleva tion i s fai rly
consi stent throughout the sca le s , and the results ere
less deceiving, when the constraints of social expect
ati ons a re considered. A lthough both groups are i s ola ted
from " normal" socia l conta cts to some extent , the oolice
group must be aware of soci a l expectati ons to func t i on
effectively ( Kelly, 1975 ) . The inmate on the ether hand
would logica lly be less incli ned to keep a keen awareness
of social expectati ons . Being less aware o f sccial
sanction, the i nmate would be mere li kely to r e s pond to

-33-
the individual MMPI i tems i n a way less c onsi stent with
the s ocial norm .
Another plausible explanation for the inma tes '
elevetion would certai nly be their 1�..mediate personal
si tua tion. Whereas the police of ficers were tested
during non-stressful periods i n their life, the inmates
were tasted during incarceration. Carter ( 1973 ) tested
the effects of i ncarceration on women, and found that
there were some significant differences between incar
cerated a nd non-carcerated women. Carter found incarcera ted
women have poorer morale, more authority conflict, family
problem�, e nd mani fest hostility. It would seen unavoid
able that incarcera ti on would have some effect on males
also. This effect c ould quite possibly be i ndicated by the
elevation of the i nmates sc ores on the various scales .
Figure 2 provides the source of a c omparison of the
number of scores fa lling above T score 70 for both groups .
Although they are sli¥htly differing in number, there
seems to be a simi liar trend throughout the scales of both
groups for the number of ' high individual scale scores
per scale . Again we s ee a slight elevation of the i nmate
group, but the genera l di stribution is very similiar
for both group s .
A lthough the first five high points are most mean
ingful in evaluation, the remai ning five scales deserve

-31+-
menti on. The fi v e low pcint s c a l e s a ll fell wi thin
the �orma l ra nge for both grcup proft l e s . The fi�e
scales were d i s tributed wi thin the c od e s a s fellows :
Scale Posi t i on - 6 th
- 2( D )
7 th 8 th 9 th 10th
5 ( Mf ) l ( Hs ) J( Hy ) O( Si ) Poli ce
I nma te s - 2{ D ) l( Hs ) J( Hy ) 5( Mf ) O( Si )
Notice that s imi l i a ri ties exi s t i n even these s c e le s c ore s ,
a l though not a s d i s t i nc tively e � wi th the five hi�h point
s c a le s . Sixth p o s i t i o n i s occupied by scele 2 for both
groups , and likewi se tenth posi t i on i s occupied by scale O
for bot� groups . I n the i nma te code scale 3 and 5 a re with
in one point of each other a nd therefore, the posi t i on i s
relatively unimportant .
I n respect t o the pr ofile codes in genera l , the simil
i a ri ties are evi d en t . Given tha t the interpreta tion of
cf results t s a c cura t e , the hypothe s i s i s a cceptdd .
I t i s , a s di scus sed ea rlier, questi onable a s to the
a c tual a ffect of the relativ&ly high F sc&le s c cres for
the poli ce a nd inmate group s . 'l'he ra ti ona le cf not
empha s i z i nR the F s c a l e s c ores i n thi s study ha s been
presente d , but for the sake of those who would not agre e ,
the police a nd inma te profi l e s wi l l be evaluated w i th the

-35•
F sca le scores exceeding T score 70 elimina ted .
Police + ' 948756,.gQ
I nmates + 4 ' 896257031
These c odes derive from the profiles shewn on
figure 3 . The only scale score exceeding T score 70
i s scale 4 in the inmate code . The following is a
breakdown of the scale po!ition for the two groups :
Sca le Posi tion - 1st
Police
I nma tes
9
4
2nd
4
8
3rd 4th 5th 6th 7th 8th 9th lC
8 7 5 6 2 0
9 6 2 5 7 0 3 l
These figures obviously do not display the similiari ties
of the first group code s . For the police group, scale 9
a nd 4 a re within one point of each other, and consequently
their posi tions with respect to one a nother are not a e
decisive i n the code a s the poe1t1one of the other scale s .
Scales 2 a nd 0 o f the police c ode have the same rela tion
ship. The inmat e code he s not changed in respect to the
first four high point scal e ! .
The high point 9 profile 1. s chara cteri zed by hyper
� ctivity a nd some di splay bi zarre e nd unusual beha vi ors ,
a s well a s tendencies toward depression ( Gi lberstsdt and

-36-
Du ker, 1956 ) . Dahlstrom, Welsh, a nd Dahl s trom ( lq6 o )
sug(!est tha t the 49 prof i l e sho1Jld b e consulted i n
understanding the 48 pro fi l e a l s o . A d d to t h i s the
fact tha t i n the 94 pr ofile obta , ned for the police
group with i ndividua l prof i l e s where F :>70 a re re
mov e d , the 9 scale a nd the 4 s c a le a re w i thin one
point. Thi s would greatly reduce the v i s u a l �ffecte
o f removing high F s c ores for the police group c od e ,
Figure 4 prov i d e s for a compa ri s on o f the per
centage of high s c a l e s c ore s for ea ch group on each
s c a l e a fter high F scale profiles a r e remov e d . Note
first the simi liari ty, .a n d sec end the decline of the
eleva t i on of the i nma t e group above the police group.
1he following s c a l e compa ri s on further i l lustra t e s the
decline of the i nma te elev a t i on a fter the high F s c a l e
profi l e s have been re�c v e d :
Scale - Pd
Police · - 65
I nma te s - 72
Sc
6 1
6 1
M a
6 6
6 6
Pt
59
59
Pa
56
62
I t i s apparent that the a c t u a l scale s c ores for the
two groups a re c l o s e r a fter the high F s c a le profi l e s
a r e remcved. However, the s c a l e posi t i ons wi thi n the
later c odes are l e s s simi l i a r . Also tne tende ncy of the

- 37 -
profi l e s toward the nor�el re n�e a fter remcving hi gh F
s c c l e prof i l es c a n b e obs e rved by contra s ti ng the fraphs
on Fi fure 1 a nd Figure 3 .
A s s ta t e d en rli e r , i t i s not s � r p r i s i ng tha t i n re
moving the extreme sca l e s c o r e , the profi l e s tend to a p
proa c h a c los e r representa t i on of norrGa lity . The fa c t
tha t the rea j or charecteri s t i c s o f the ori gina l prof i l e s
re�e 1 n s cme�hat i nta c t i n spi te cf e limi na ti ng the ex
t re�e s , could be c c�s trued s o a s t o su�pcrt the c�i c� n � l
J � � c � c lu s i o n , the pre s e nt c l i n i c a l i nt erpre ta ti on
c :' the i n'!. ta l fi ndings would t end t o enc ourage the a c c e p t
a n c e of the hypothe si s tha t " the gr oups a r e simi l i a r i n
perscr.r: l i t y che ra c t e ri s ti c s " . This c l i ni c e l i n t e rp r e t a t i c n
i s V ff!'Y r e l 1 a nt upc!l th e c li n i c i a n ' s c ompetence a n d experi
e n c e , and f or thi s rea s c n c ri t ica l i nt erpre ta t i cn of the
f i n di ngs a re e ncoura g e d . Both p ol i c e a nd inmate groups of
the s tudy obta i ne d a relatively high F s c a l e s c ore . 1hi s
fa c t pos sibly c rea t e s a need t o control for ve li �i t y . P ft P r
e J i �i r.a t i �g the inci v i dual pro fi le s wi th a n F s ce l e s c ore
exc e e d i ng T s c ore 70 e nd constructing prof i l e s c� thi s b& E i s .
several £ B ne ra l simi l i a ri t i e s rem a i n i nta c t . Tti s c ou l �
s e rv e t 0 rei nf orc e t h e ori g i na l fi �dings end the o c c o pt a n c e cf
-:he hypothe s i s . Howev er , on t h e ba s i s of the prcfi l e R wi th-
0ut P � c B l e s core exc ee di ng 70, ·a c c e pter:ce cf t � e b.Jpc thesis
s t: s r. -s l e s s l i k el y . I n re�ard to the Bema n stuc�r , t t s e err:s

- ;, e -
a pparent tha t s 1 mi l1 a r per s ona l i ty a ttributes c e n b e
expre s s e d i n extremely di f f e r e nt s o c i a l a c tivi ti e s .
Berman ( 19 71 ) m o k e s lhe point ths t a s s a ultive or a cting
out behe•,-i ors c a nr..ct be d eterrr. i ne d e n the ba s i s of Y.!'1PI
resul t s . I n hi s s t u c y Berman �·:a s c on c ernAc lr.-ith the
r:i r.i l� c.; :-i t i e s <- f t hu ;·.1e.rd a ppli cants a nd the pri s on
inma t e s on s c a l e s 4 a nd 9 . He felt the t a c tiviti e s en
courc � i ng the a c ti n g cut of hos ti lity a nd a�gre s s i on
were ce l le d for i n regard t o the i nma te popula �i on .
The f�ndin�s of the p�esent study su�g e s t the t the
i nd: � � dua l s f r om �oth groups have s t m i l i a r pe�sc�a 1 i t y
cha�� � t �ris t i c s . Yet c � a grcup l s sufferi �g the u l t 1 ms t e
� c c � & l � e j ec t i on e nd the 0ther i s auite func t i c �a l . The
c l i n i c a l impl i ca ti o n of thi s s tudy i n respect to the i nrea te
r.rc�r. , c ou l d e a s i ly p c i nt to tra i ning the aggressiv e ,
h c s t :. l e i nd i v i d ua l to '.' e c t out" hi s hosti lity e nc a gp-re � s � �·:-.
i n soci e l ly a c c eptable wa y s . I n this we �ight divert
p c t o nti n l cri mi n� l offend ers .
rhere i s a que s ti on a s t o the scurce cf the poli c e
rra n ' s persona l i t y . The qu e s ti on a s t o whether the
p c l i c ems n trings hi s perscne l i ty to the pro�essi cn er
whe ther he i s c ondi ti oned b y the s o c i o - o c c�,a t � on a l i s
c l e t ! on 0 f hi s profe s s i on re�eins unanswered ( Lefkcwi t z ,
l0 7S ) . �he s o c i a l 1 rrpl ! : a t i o�s c f thi s � � udy � o u l �

-39 -
strongly support the remova l o f the i s ola tion from the
police offi cer ' s environment . The i s ola tion and secrecy
a t trtbuted t o the profe s s l on would seem to support the
hos t i l e , a��ressive a nd e nti - s ocial pe�sonality
chara cteri s ti c s found in the police grou p . Perhaps
requiring the poli c e offi cer to f uncticn more i n line
with the genera l flow of society would serve to a t tra c t
more s o cia ble i ndividua l s t c the pro f e s s i on, or a t
lea s t remove the possibi l i ty tha t the police profe s s i on
condi ti ons the pol i c e offi cer i nt o the persona lity type
found i n thi s s tudy .
Unti l changes i n the s ys tem can be ma de , a l l seg
ments of soci ety should be ma de aware cf the unhealthy
predi cament found i n this study . Definitely the c ourts ,
a nd the s oci a l agenc i e s should b e aware of the
per .. v�a l i t y s tructures of the poli c e offi c e r . The poli ce
profe s s i on i t self should re-eva luate rscruiting proced
ures a s we l l a s day to day rcut i ne procedures govern1ng
poli c e onera ti ons . But regard l e s s of the speci f 3 c
course o f a c t i on t o b e taken, i t i s a pparent that a t
l e a s t locolly the law enfo�cement system needs i�med
ie te a t tenti on .

REFERENCES
Berman, ( Snibble & Snibble ) , The Urban �oli ce i n
Transi ti on, 1973, 253 .
Ca rter, Rose Mari e , MMPI chara cteri s ti c s of inca rcera te d
a nd non-i ncarcerated women, 'l'hesi s , 197 3 .
Cronbach, Lee J . , Essentials o f Psychologi cal Testing,
1970 .
Dahlstrom, W . , Welsh, G . ,. a nd Dahlstrom L . , An MMPI Handbook,
Minneapoli s : University of Minnesota Press ,
1972, 1 , 3 , 273 .
Fenster, A . , a nd Locke , B . , Neuroti c i sm among policemen;
A n examina tion of police personali ty , Journal
of Applied Psychology, 1973, 2]_, 358-359 .
Gilberstadt, H . , and Duker, J . , A Handbook f or Clinical
and A ctuaria l MMPI I nterpretati on, 1965, 3-5 .
Gough, H . C . , Ba s i c Readings on the MMPI , 1956, 321-327 .
Ha thawa y , 3 . R . a nd McKi nley J . C . , Minnesota Mul ti nhasic
Persona l i ty I nventory - Manual Revis ed, 1951 ,
5 , 18-25 .

-41-
Hathaway s . R . a nd Monaches1 E . :U . , A n A tlas of Juvenile MMPI
Profi l e s , 1961 , 112-115 .
Jasmine, F . , Diversion a s a n a lternate to i ncarceration,
Personal and Gui dance Journa l , 1974, 2.J, 140-141 .
Kelly, R . , On Improving Polic e-Community Rela t i ons, Journal
Of Social I s sues, 1975, 31 , 65-66.
Lefkowi tz, J . , Psychologic a l A ttributes of Policemen: a Review
of Resea rch a nd Opi nion; Journal of Social I ssues,
1975, J.!, 3-21 .
Lindner, L . , Goldman , N . , a nd Allen, H . , Anti s oci a l personality
type with cardia c lability, Archieves of G ener�l
Psychia try, 1970, 23, 260-265 .
Niederhoffer, A . , Behind the Shi eld : The Police Crban Society,
New York : Double Da y , 1967, 253 .
Norman, W . T ., Objective Persona lity Assessment , 1972,
61-62.
Parker Jr . , c . , and Roth, M . , The rela t t cnship b e tween
s elf-di sclosure, pers ona lity, and a dimension of
j ob performance of policemen, J curna 1 of Poli ce
Science and Adminstra tion, 1973, 1, 282-286 .

Sc o t t , P . � . , Crime e nd eeli nquency, British Medical J ournal ,
1969 , 1, 424-426 .
Simon, w . , Wilde, v . , and Cristal , R . , Psychol ogical need!
of professional police personnel, Psycholo?ical
Reports, 1973, �. 313-314.
Tupin, J . , Mahar, D . , and Smith, D . , Two types of vi olent
offenders with psychosocial descriptors, Disease
of the Nervous System, 1973, 2!1, 356-363 .
Welsh, G . S . e nd Dahlstrom W.G . , Basic Readings on the MMPI ,
1956, 3-4.
Woodbury, R . , Delinquents attitude toward the juvnile justice
system, Psychologica l Reports, 1973, �, 1119-1124.