a comparison of random forest and bagging for different
TRANSCRIPT

Study carried out by the Data Science PracticeSpecial thanks to Elijo BYLYKBASHI
JUIN 2020
A comparison of Random Forest and Bagging for different numbers
of trees

Notes Coperneec
SummaryIntroduction 2
1 Explanation of the algorithms 21.1 The Bagging method . . . . . . . . . . . . . . . . . . . . . . . . . . . . . . . . . . . . . . . . . . . . . . . . . . . . . 21.2 The Random Forest method . . . . . . . . . . . . . . . . . . . . . . . . . . . . . . . . . . . . . . . . . . . . . . . . . 2
2 The Train-Test Split/Cross-Validation 3
3 Methodology and Related Research 3
4 Results 4
Conclusion 5
References 5
SummaryIntroduction 1
1 Explanation of the algorithms 11.1 The Bagging method . . . . . . . . . . . . . . . . . . . . . . . . . . . . . . . . . . . . . . . . . . . . . . . . . . . . . 11.2 The Random Forest method . . . . . . . . . . . . . . . . . . . . . . . . . . . . . . . . . . . . . . . . . . . . . . . . . 1
2 The Train-Test Split/Cross-Validation 2
3 Methodology and Related Research 2
4 Results 3
Conclusion 4
References 4

Notes Coperneec 1
Introduction
Expecting combined classifiers to perform be�er than a sin-gle classifier is an important guideline of Machine Learning.Therefore, we can expect a be�er classification performancewhen we have numerous decision trees from the same dataset, as opposed to having only one decision tree. For instance,the authors in [1] show empirically that a random forest com-posed of 100 trees yields a signicative (although small) im-provement in Accuracy. In fact, techniques such as RandomForests and Bagging, base their predictions on the combina-tion of the outcomes of all the decision trees that composethem.
These two algorithms rely heavily on the decision treetechnique. For more information on the decision tree algo-rithm, you can look at [2]. These algorithms (Random For-est and Bagging) draw with replacement n elements from theoriginal data set. They repeat the process k times to createk di�erent (yet very similar) samples. A�erwards, for everysample a decision tree is created. However, there are some dif-ferences (which we will explain in this note) in the way thesetrees get generated by each algorithm.
The Random Forest algorithm was initially designed asan alternative to Bagging in order to achieve be�er results.Nonetheless, there’s no theory which guarantees such result.While the Random Forest might be expected to perform bet-ter than Bagging, there might be data sets whose structure isbe�er fi�ed for the bagging algorithm. The expected superi-ority of the Random Forest (and Bagging) on decision trees isalso an empirical result. For instance, in [3] amodified versionof the decision trees outperforms the Random Forest.
The objective of this note is to benchmark the perfor-mance (in terms of accuracy) of these two algorithms, for dif-ferent numbers of trees and for a specific type of datasets.A corrected version of the student test (see [2] p. 159) is thenused to test whether the mean of the performance gaps is sig-nificant or not.
More specifically, the 8 data sets we consider in this studyare of a small size (inferior to 1000 observations). Secondly,they have less than 10 explanatory variables. Finally, the ex-plained variable in all these data sets takes only two values(ex. 0 and 1).
We conclude that despite the number of trees used todevelop our algorithms, there are no significant di�erencesin terms of Accuracy between the two algorithms. In thefollowing section we present and explain these two algo-rithms. In section 3 we talk about the train/test split andcross-validation. In section 4 we display our methodologyand the related research. In section 5 we present our results.In the last section we state the conclusions of our research.
1 Explanation of the algorithms
1.1 The Bagging methodSuppose you have a sample of n elements (E1, …, En), whereeach element Ei for i 2 1, . . . , n has the following struc-ture. Furthermore, Xi,j 2 R for j 2 1, . . . , k and i 2 1, . . . , n.Whereas, Yi 2 0, 1, . . . l for i 2 1, . . . , n, such variable repre-sents the number of our classes/labels.
When we perform the bagging algorithm, we need to de-termine the number of decision trees. Such number is a hyperparameter of the Bagging algorithm and can only be deter-mined through the process of parameter tuning. That is, youneed to try di�erent values until you find the most perform-ing one. This process is called hyper parameter search andthere are techniques advising how to perform it e�iciently.These techniques aren’t the goal of this note so we won’t talkabout them. For a general overview of these techniques, theiradvantages and downfalls,see [4].
Now let’s explain the algorithm. Suppose that we decidedto have T trees. The bagging algorithm consists in repeatingthe following process T times:
1. We extract with replacement n elements from our orig-inal sample of size n.
2. We build a decision tree algorithm given the sample atstep 1.
Obviously, at the end of such a process we have T decisiontrees. Now, suppose you have an element. Suppose further-more that we know the value of its explanatory variables butwe don’t know the value of its explained variable and we aimat predicting it using the Bagging algorithm. To do so, thebagging algorithm proceeds as follows:
1. For each of the T trees predict a class/label for the ele-ment.
2. Look at all the classes predicted by the T trees andchoose the modal class.
1.2 The Random Forest methodThe samples of the bagging method tend to be very similar,for obvious reasons. Furthermore the variables on which ev-ery tree does the cuts tend to be very similar. Therefore thetrees composing the Bagging algorithm are highly correlated.Such correlation a�ects our predictions negatively. The ran-dom forest algorithm comes as a potential solution to avoidsuch problem. More specifically, at each cut of each tree, therandom forest algorithm limits the number of features (vari-ables) where the cut can happen. Let’s look at the above ex-ample, where each E element has k features among which wecan do the cut. Every time the algorithm has to perform a cutin a tree, it randomly determines p features (p<k, usually pis the square root of k) among which the cut should happen.The trees obtained with such a method don’t su�er from cor-relation. Moreover Breiman proves theoretically in his paper
Notes Coperneec 2
that even when we increase the number of trees to infinity,the random forest algorithm doesn’t su�er from over-fi�ing.For more information see [5].
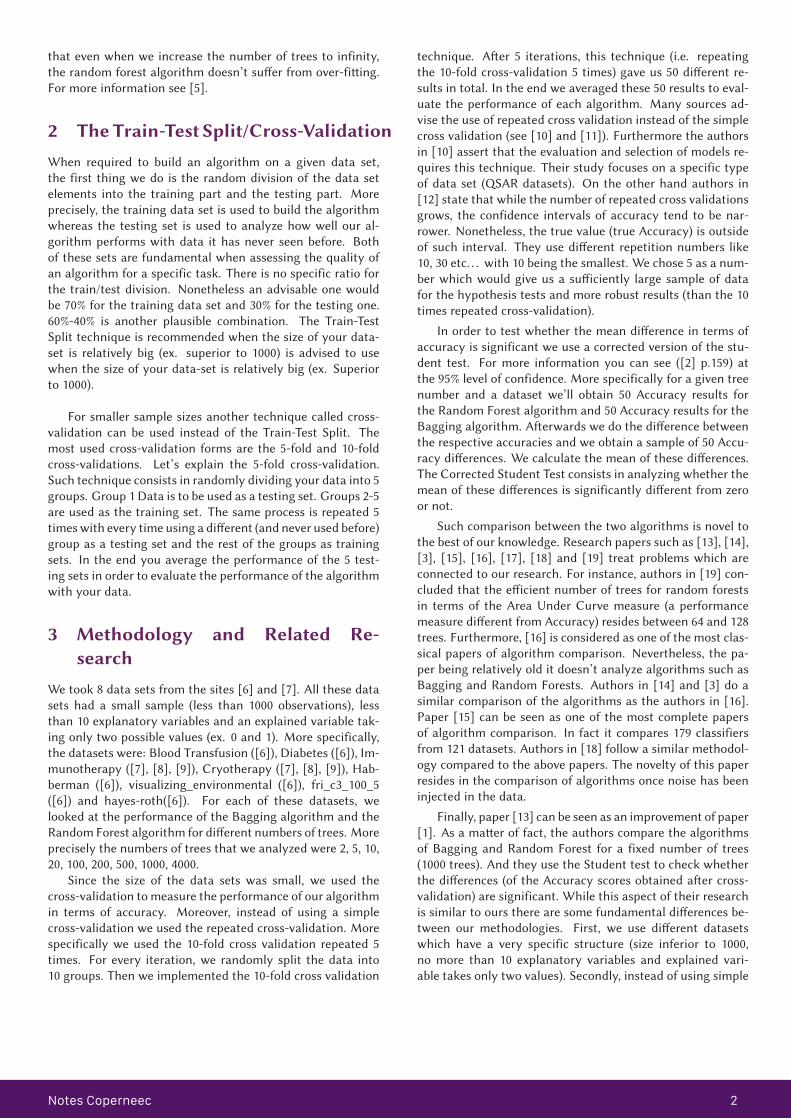
2 TheTrain-Test Split/Cross-ValidationWhen required to build an algorithm on a given data set,the first thing we do is the random division of the data setelements into the training part and the testing part. Moreprecisely, the training data set is used to build the algorithmwhereas the testing set is used to analyze how well our al-gorithm performs with data it has never seen before. Bothof these sets are fundamental when assessing the quality ofan algorithm for a specific task. There is no specific ratio forthe train/test division. Nonetheless an advisable one wouldbe 70% for the training data set and 30% for the testing one.60%-40% is another plausible combination. The Train-TestSplit technique is recommended when the size of your data-set is relatively big (ex. superior to 1000) is advised to usewhen the size of your data-set is relatively big (ex. Superiorto 1000).
For smaller sample sizes another technique called cross-validation can be used instead of the Train-Test Split. Themost used cross-validation forms are the 5-fold and 10-foldcross-validations. Let’s explain the 5-fold cross-validation.Such technique consists in randomly dividing your data into 5groups. Group 1 Data is to be used as a testing set. Groups 2-5are used as the training set. The same process is repeated 5timeswith every time using a di�erent (and never used before)group as a testing set and the rest of the groups as trainingsets. In the end you average the performance of the 5 test-ing sets in order to evaluate the performance of the algorithmwith your data.
3 Methodology and Related Re-search
We took 8 data sets from the sites [6] and [7]. All these datasets had a small sample (less than 1000 observations), lessthan 10 explanatory variables and an explained variable tak-ing only two possible values (ex. 0 and 1). More specifically,the datasets were: Blood Transfusion ([6]), Diabetes ([6]), Im-munotherapy ([7], [8], [9]), Cryotherapy ([7], [8], [9]), Hab-berman ([6]), visualizing_environmental ([6]), fri_c3_100_5([6]) and hayes-roth([6]). For each of these datasets, welooked at the performance of the Bagging algorithm and theRandomForest algorithm for di�erent numbers of trees. Moreprecisely the numbers of trees that we analyzed were 2, 5, 10,20, 100, 200, 500, 1000, 4000.
Since the size of the data sets was small, we used thecross-validation to measure the performance of our algorithmin terms of accuracy. Moreover, instead of using a simplecross-validation we used the repeated cross-validation. Morespecifically we used the 10-fold cross validation repeated 5times. For every iteration, we randomly split the data into10 groups. Then we implemented the 10-fold cross validation
technique. A�er 5 iterations, this technique (i.e. repeatingthe 10-fold cross-validation 5 times) gave us 50 di�erent re-sults in total. In the end we averaged these 50 results to eval-uate the performance of each algorithm. Many sources ad-vise the use of repeated cross validation instead of the simplecross validation (see [10] and [11]). Furthermore the authorsin [10] assert that the evaluation and selection of models re-quires this technique. Their study focuses on a specific typeof data set (QSAR datasets). On the other hand authors in[12] state that while the number of repeated cross validationsgrows, the confidence intervals of accuracy tend to be nar-rower. Nonetheless, the true value (true Accuracy) is outsideof such interval. They use di�erent repetition numbers like10, 30 etc. . . with 10 being the smallest. We chose 5 as a num-ber which would give us a su�iciently large sample of datafor the hypothesis tests and more robust results (than the 10times repeated cross-validation).
In order to test whether the mean di�erence in terms ofaccuracy is significant we use a corrected version of the stu-dent test. For more information you can see ([2] p.159) atthe 95% level of confidence. More specifically for a given treenumber and a dataset we’ll obtain 50 Accuracy results forthe Random Forest algorithm and 50 Accuracy results for theBagging algorithm. A�erwards we do the di�erence betweenthe respective accuracies and we obtain a sample of 50 Accu-racy di�erences. We calculate the mean of these di�erences.The Corrected Student Test consists in analyzing whether themean of these di�erences is significantly di�erent from zeroor not.
Such comparison between the two algorithms is novel tothe best of our knowledge. Research papers such as [13], [14],[3], [15], [16], [17], [18] and [19] treat problems which areconnected to our research. For instance, authors in [19] con-cluded that the e�icient number of trees for random forestsin terms of the Area Under Curve measure (a performancemeasure di�erent from Accuracy) resides between 64 and 128trees. Furthermore, [16] is considered as one of the most clas-sical papers of algorithm comparison. Nevertheless, the pa-per being relatively old it doesn’t analyze algorithms such asBagging and Random Forests. Authors in [14] and [3] do asimilar comparison of the algorithms as the authors in [16].Paper [15] can be seen as one of the most complete papersof algorithm comparison. In fact it compares 179 classifiersfrom 121 datasets. Authors in [18] follow a similar methodol-ogy compared to the above papers. The novelty of this paperresides in the comparison of algorithms once noise has beeninjected in the data.
Finally, paper [13] can be seen as an improvement of paper[1]. As a ma�er of fact, the authors compare the algorithmsof Bagging and Random Forest for a fixed number of trees(1000 trees). And they use the Student test to check whetherthe di�erences (of the Accuracy scores obtained a�er cross-validation) are significant. While this aspect of their researchis similar to ours there are some fundamental di�erences be-tween our methodologies. First, we use di�erent datasetswhich have a very specific structure (size inferior to 1000,no more than 10 explanatory variables and explained vari-able takes only two values). Secondly, instead of using simple
Notes Coperneec 3
that even when we increase the number of trees to infinity,the random forest algorithm doesn’t su�er from over-fi�ing.For more information see [5].
2 TheTrain-Test Split/Cross-ValidationWhen required to build an algorithm on a given data set,the first thing we do is the random division of the data setelements into the training part and the testing part. Moreprecisely, the training data set is used to build the algorithmwhereas the testing set is used to analyze how well our al-gorithm performs with data it has never seen before. Bothof these sets are fundamental when assessing the quality ofan algorithm for a specific task. There is no specific ratio forthe train/test division. Nonetheless an advisable one wouldbe 70% for the training data set and 30% for the testing one.60%-40% is another plausible combination. The Train-TestSplit technique is recommended when the size of your data-set is relatively big (ex. superior to 1000) is advised to usewhen the size of your data-set is relatively big (ex. Superiorto 1000).
For smaller sample sizes another technique called cross-validation can be used instead of the Train-Test Split. Themost used cross-validation forms are the 5-fold and 10-foldcross-validations. Let’s explain the 5-fold cross-validation.Such technique consists in randomly dividing your data into 5groups. Group 1 Data is to be used as a testing set. Groups 2-5are used as the training set. The same process is repeated 5timeswith every time using a di�erent (and never used before)group as a testing set and the rest of the groups as trainingsets. In the end you average the performance of the 5 test-ing sets in order to evaluate the performance of the algorithmwith your data.
3 Methodology and Related Re-search
We took 8 data sets from the sites [6] and [7]. All these datasets had a small sample (less than 1000 observations), lessthan 10 explanatory variables and an explained variable tak-ing only two possible values (ex. 0 and 1). More specifically,the datasets were: Blood Transfusion ([6]), Diabetes ([6]), Im-munotherapy ([7], [8], [9]), Cryotherapy ([7], [8], [9]), Hab-berman ([6]), visualizing_environmental ([6]), fri_c3_100_5([6]) and hayes-roth([6]). For each of these datasets, welooked at the performance of the Bagging algorithm and theRandomForest algorithm for di�erent numbers of trees. Moreprecisely the numbers of trees that we analyzed were 2, 5, 10,20, 100, 200, 500, 1000, 4000.
Since the size of the data sets was small, we used thecross-validation to measure the performance of our algorithmin terms of accuracy. Moreover, instead of using a simplecross-validation we used the repeated cross-validation. Morespecifically we used the 10-fold cross validation repeated 5times. For every iteration, we randomly split the data into10 groups. Then we implemented the 10-fold cross validation
technique. A�er 5 iterations, this technique (i.e. repeatingthe 10-fold cross-validation 5 times) gave us 50 di�erent re-sults in total. In the end we averaged these 50 results to eval-uate the performance of each algorithm. Many sources ad-vise the use of repeated cross validation instead of the simplecross validation (see [10] and [11]). Furthermore the authorsin [10] assert that the evaluation and selection of models re-quires this technique. Their study focuses on a specific typeof data set (QSAR datasets). On the other hand authors in[12] state that while the number of repeated cross validationsgrows, the confidence intervals of accuracy tend to be nar-rower. Nonetheless, the true value (true Accuracy) is outsideof such interval. They use di�erent repetition numbers like10, 30 etc. . . with 10 being the smallest. We chose 5 as a num-ber which would give us a su�iciently large sample of datafor the hypothesis tests and more robust results (than the 10times repeated cross-validation).
In order to test whether the mean di�erence in terms ofaccuracy is significant we use a corrected version of the stu-dent test. For more information you can see ([2] p.159) atthe 95% level of confidence. More specifically for a given treenumber and a dataset we’ll obtain 50 Accuracy results forthe Random Forest algorithm and 50 Accuracy results for theBagging algorithm. A�erwards we do the di�erence betweenthe respective accuracies and we obtain a sample of 50 Accu-racy di�erences. We calculate the mean of these di�erences.The Corrected Student Test consists in analyzing whether themean of these di�erences is significantly di�erent from zeroor not.
Such comparison between the two algorithms is novel tothe best of our knowledge. Research papers such as [13], [14],[3], [15], [16], [17], [18] and [19] treat problems which areconnected to our research. For instance, authors in [19] con-cluded that the e�icient number of trees for random forestsin terms of the Area Under Curve measure (a performancemeasure di�erent from Accuracy) resides between 64 and 128trees. Furthermore, [16] is considered as one of the most clas-sical papers of algorithm comparison. Nevertheless, the pa-per being relatively old it doesn’t analyze algorithms such asBagging and Random Forests. Authors in [14] and [3] do asimilar comparison of the algorithms as the authors in [16].Paper [15] can be seen as one of the most complete papersof algorithm comparison. In fact it compares 179 classifiersfrom 121 datasets. Authors in [18] follow a similar methodol-ogy compared to the above papers. The novelty of this paperresides in the comparison of algorithms once noise has beeninjected in the data.
Finally, paper [13] can be seen as an improvement of paper[1]. As a ma�er of fact, the authors compare the algorithmsof Bagging and Random Forest for a fixed number of trees(1000 trees). And they use the Student test to check whetherthe di�erences (of the Accuracy scores obtained a�er cross-validation) are significant. While this aspect of their researchis similar to ours there are some fundamental di�erences be-tween our methodologies. First, we use di�erent datasetswhich have a very specific structure (size inferior to 1000,no more than 10 explanatory variables and explained vari-able takes only two values). Secondly, instead of using simple
cross-validation we use repeated cross-validation which givesus a larger sample of data (50 instead of 10) which is moreconvenient to perform Student-like tests. Thirdly, we use acorrected version of the Student test which avoids the “artifi-cial increase” of the test statistic as a result of the large sam-ple. By doing so, we avoid falsly rejecting H0 (mean di�erenceof Accuracies between the two algorithms = 0) as a result ofthe increase of the sample size. Futhermore, the confidencelevel for this test is 95% instead of 99%, which proves to be astronger proof given the results we get later (If we don’t re-ject H0 at the 95% confidence level we’re not going to rejectit at the 99% confidence level but not vice-versa). Forthly, andmost importantly, we compare the results (the average Ac-curacy) between the two algorithms for di�erent numbers of
trees (and not for a single number of trees).
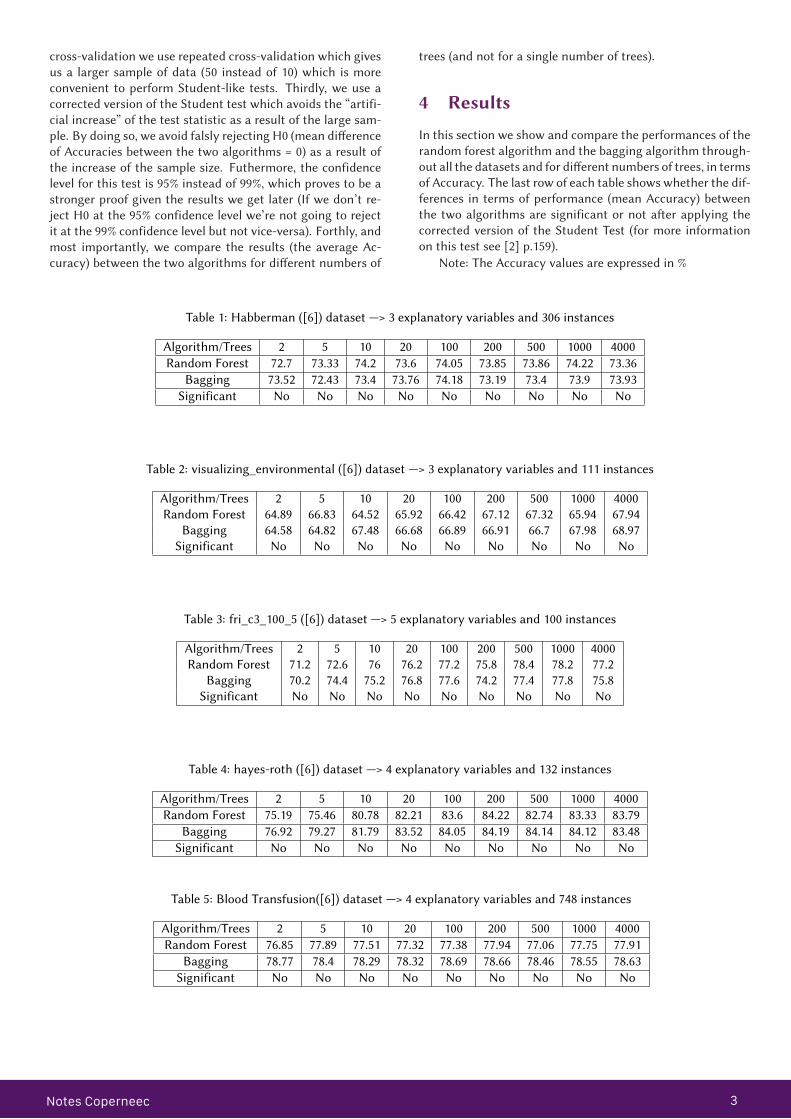
4 ResultsIn this section we show and compare the performances of therandom forest algorithm and the bagging algorithm through-out all the datasets and for di�erent numbers of trees, in termsof Accuracy. The last row of each table shows whether the dif-ferences in terms of performance (mean Accuracy) betweenthe two algorithms are significant or not a�er applying thecorrected version of the Student Test (for more informationon this test see [2] p.159).
Note: The Accuracy values are expressed in %
Table 1: Habberman ([6]) dataset —> 3 explanatory variables and 306 instances
Algorithm/Trees 2 5 10 20 100 200 500 1000 4000Random Forest 72.7 73.33 74.2 73.6 74.05 73.85 73.86 74.22 73.36
Bagging 73.52 72.43 73.4 73.76 74.18 73.19 73.4 73.9 73.93Significant No No No No No No No No No
Table 2: visualizing_environmental ([6]) dataset —> 3 explanatory variables and 111 instances
Algorithm/Trees 2 5 10 20 100 200 500 1000 4000Random Forest 64.89 66.83 64.52 65.92 66.42 67.12 67.32 65.94 67.94
Bagging 64.58 64.82 67.48 66.68 66.89 66.91 66.7 67.98 68.97Significant No No No No No No No No No
Table 3: fri_c3_100_5 ([6]) dataset —> 5 explanatory variables and 100 instances
Algorithm/Trees 2 5 10 20 100 200 500 1000 4000Random Forest 71.2 72.6 76 76.2 77.2 75.8 78.4 78.2 77.2
Bagging 70.2 74.4 75.2 76.8 77.6 74.2 77.4 77.8 75.8Significant No No No No No No No No No
Table 4: hayes-roth ([6]) dataset —> 4 explanatory variables and 132 instances
Algorithm/Trees 2 5 10 20 100 200 500 1000 4000Random Forest 75.19 75.46 80.78 82.21 83.6 84.22 82.74 83.33 83.79
Bagging 76.92 79.27 81.79 83.52 84.05 84.19 84.14 84.12 83.48Significant No No No No No No No No No
Table 5: Blood Transfusion([6]) dataset —> 4 explanatory variables and 748 instances
Algorithm/Trees 2 5 10 20 100 200 500 1000 4000Random Forest 76.85 77.89 77.51 77.32 77.38 77.94 77.06 77.75 77.91
Bagging 78.77 78.4 78.29 78.32 78.69 78.66 78.46 78.55 78.63Significant No No No No No No No No No
Table 6: Diabetes ([6]) dataset —> 8 explanatory variables and 768 instances
Algorithm/Trees 2 5 10 20 100 200 500 1000 4000Random Forest 72.89 74.86 75.61 75.59 75.8 75.62 75.67 75.75 75.3
Bagging 75.2 75.9 75.72 75.82 75.64 76.2 75.62 75.8 75.75Significant No No No No No No No No No
Table 7: Immunotherapy ([15,18,19]) dataset —> 7 explanatory variables and 90 instances
Algorithm/Trees 2 5 10 20 100 200 500 1000 4000Random Forest 80.89 81.56 83.33 84 83.56 84 83.78 84 83.56
Bagging 82.89 82.67 84.67 84.89 84.22 83.78 83.33 82.89 82.89Significant No No No No No No No No No
Table 8: Cryotherapy ([15,18,19]) dataset: —> 6 explanatory variables and 90 instances
Algorithm/Trees 2 5 10 20 100 200 500 1000 4000Random Forest 82.88 85.78 86.67 86 89.56 88.22 90 90.89 91.33
Bagging 83.33 84.44 84.89 85.11 85.11 85.11 85.33 84.22 83.78Significant No No No No No No No No No
Conclusion
The superiority of an algorithm [13] compared to another de-pends on numerous factors such as the structure of the al-gorithm and also the dataset at hand. In this paper we con-clude that there aren’t significant di�erences between the al-gorithms of Bagging and Random Forest in terms of Accuracy,for every number of trees and data set that we use (as long asthe data sets fulfill the conditions specified at the beginningof our paper). Therefore, it could be more e�icient to use oneof these two algorithms. Like many other conclusions in ma-chine learning, our results remain empirical and they can befurther consolidated by doing a similar study with other datasets fulfilling the same conditions as the data sets in this pa-per.
References
[1] O.H. et al. Lawrence. Comparing pure parallel ensemblecreation techniques against bagging., 2003.
[2] I.H. et al. Wi�en. Data mining: Practical machine learn-ing tools and techniques, third edition., 2011.
[3] Warda M. El-Talbany, M.E. An empirical comparisonof tree-based learning algorithms: An egyptian rice dis-eases classification case study., 2016.
[4] De Moor B. Claesen M. Hyperparameter search in ma-chine learning, 2015.
[5] L. Breiman. Random forests, 2001.
[6] Open ml.
[7] R.E. et al Banfield. A comparison of ensemble creationtechniques, 2004.
[8] F. et al Khozeimeh. An expert system for selecting warttreatment method, 2017.
[9] F. et al Khozeimeh. Intralesional immunotherapy com-pared to cryotherapy in the treatment of warts., 2017.
[10] D. et al. Krstajic. Cross-validation pitfalls when select-ing and assessing regression and classification models.,2014.
[11] Uci machine learning repository.
[12] Blockeel H. Vanwinckelen G. On estimating model ac-curacy with repeated cross-validation., 2011.

‘Notes Coperneec 4
Table 5: Blood Transfusion([6]) dataset —> 4 explanatory variables and 748 instances
Algorithm/Trees 2 5 10 20 100 200 500 1000 4000Random Forest 76.85 77.89 77.51 77.32 77.38 77.94 77.06 77.75 77.91
Bagging 78.77 78.4 78.29 78.32 78.69 78.66 78.46 78.55 78.63Significant No No No No No No No No No
Table 6: Diabetes ([6]) dataset —> 8 explanatory variables and 768 instances
Algorithm/Trees 2 5 10 20 100 200 500 1000 4000Random Forest 72.89 74.86 75.61 75.59 75.8 75.62 75.67 75.75 75.3
Bagging 75.2 75.9 75.72 75.82 75.64 76.2 75.62 75.8 75.75Significant No No No No No No No No No
Table 7: Immunotherapy ([15,18,19]) dataset —> 7 explanatory variables and 90 instances
Algorithm/Trees 2 5 10 20 100 200 500 1000 4000Random Forest 80.89 81.56 83.33 84 83.56 84 83.78 84 83.56
Bagging 82.89 82.67 84.67 84.89 84.22 83.78 83.33 82.89 82.89Significant No No No No No No No No No
Table 8: Cryotherapy ([15,18,19]) dataset: —> 6 explanatory variables and 90 instances
Algorithm/Trees 2 5 10 20 100 200 500 1000 4000Random Forest 82.88 85.78 86.67 86 89.56 88.22 90 90.89 91.33
Bagging 83.33 84.44 84.89 85.11 85.11 85.11 85.33 84.22 83.78Significant No No No No No No No No No
Conclusion
The superiority of an algorithm [13] compared to another de-pends on numerous factors such as the structure of the al-gorithm and also the dataset at hand. In this paper we con-clude that there aren’t significant di�erences between the al-gorithms of Bagging and Random Forest in terms of Accuracy,for every number of trees and data set that we use (as long asthe data sets fulfill the conditions specified at the beginningof our paper). Therefore, it could be more e�icient to use oneof these two algorithms. Like many other conclusions in ma-chine learning, our results remain empirical and they can befurther consolidated by doing a similar study with other datasets fulfilling the same conditions as the data sets in this pa-per.
References
[1] O.H. et al. Lawrence. Comparing pure parallel ensemblecreation techniques against bagging., 2003.
[2] I.H. et al. Wi�en. Data mining: Practical machine learn-ing tools and techniques, third edition., 2011.
[3] Warda M. El-Talbany, M.E. An empirical comparisonof tree-based learning algorithms: An egyptian rice dis-eases classification case study., 2016.
[4] De Moor B. Claesen M. Hyperparameter search in ma-chine learning, 2015.
[5] L. Breiman. Random forests, 2001.
[6] Open ml.
[7] R.E. et al Banfield. A comparison of ensemble creationtechniques, 2004.
[8] F. et al Khozeimeh. An expert system for selecting warttreatment method, 2017.
[9] F. et al Khozeimeh. Intralesional immunotherapy com-pared to cryotherapy in the treatment of warts., 2017.
[10] D. et al. Krstajic. Cross-validation pitfalls when select-ing and assessing regression and classification models.,2014.
[11] Uci machine learning repository.
[12] Blockeel H. Vanwinckelen G. On estimating model ac-curacy with repeated cross-validation., 2011.
[13] R.E. et al Banfield. A comparison of ensemble creationtechniques, 2004.
[14] Niculescu-Mizil A Caruana R. An empirical comparisonof supervised learning algorithms using di�erent perfor-mance metrics., 2006.
[15] M. et al Fernández-Delgado. Do we need hundreds ofclassifiers to solve real world problems?, 2014.
[16] R.D et al. King. Statlog: Comparison of classificationalgorithms on large real-world problems., 1995.
[17] P. et al. Latinne. Limiting the number of trees in randomforests., 2001.
[18] R.E. et al Banfield. An empirical comparison of decisiontrees and other classification methods, 1998.
[19] T.M. et al. Oshiro. How many trees in a random forest,2012.
A propos de Coperneec«From Revolution to Performance»
Coperneec est un cabinet de conseil cross-sectoriel spécialistede la valorisation de la Data. Nous intervenons sur l’ensemblede la chaîne des savoir-faire autour de la Data Science, la DataAnalyse et du Data Management.
Nos méthodes et techniques scientifiques éprouvées perme-�ent de résoudre des problématiques dans tous les secteursde l’industrie.
Notre vocation : extraire la connaissance à partir des donnéeset pérenniser les avancées technologiques qui en découlent.La R&D est au cœur de notre ADN et les expertises de nosconsultants (data scientists, data analysts, data engineers)sont en permanence challengées afin d’accompagner au plusprès les révolutions technologiques et scientifiques.
Contactez-nousAymeric [email protected] 88 69 67 75
est une marque de

AWALEE NOTES 5‘
Notes Coperneec 5
[19] T.M. et al. Oshiro. How many trees in a random forest,2012.
A propos de Coperneec«From Revolution to Performance»
Coperneec est un cabinet de conseil cross-sectoriel spécialistede la valorisation de la Data. Nous intervenons sur l’ensemblede la chaîne des savoir-faire autour de la Data Science, la DataAnalyse et du Data Management.
Nos méthodes et techniques scientifiques éprouvées perme-�ent de résoudre des problématiques dans tous les secteursde l’industrie.
Notre vocation : extraire la connaissance à partir des donnéeset pérenniser les avancées technologiques qui en découlent.La R&D est au cœur de notre ADN et les expertises de nosconsultants (data scientists, data analysts, data engineers)sont en permanence challengées afin d’accompagner au plusprès les révolutions technologiques et scientifiques.
Contactez-nousAymeric [email protected] 88 69 67 75
est une marque de
Table 5: Blood Transfusion([6]) dataset —> 4 explanatory variables and 748 instances
Algorithm/Trees 2 5 10 20 100 200 500 1000 4000Random Forest 76.85 77.89 77.51 77.32 77.38 77.94 77.06 77.75 77.91
Bagging 78.77 78.4 78.29 78.32 78.69 78.66 78.46 78.55 78.63Significant No No No No No No No No No
Table 6: Diabetes ([6]) dataset —> 8 explanatory variables and 768 instances
Algorithm/Trees 2 5 10 20 100 200 500 1000 4000Random Forest 72.89 74.86 75.61 75.59 75.8 75.62 75.67 75.75 75.3
Bagging 75.2 75.9 75.72 75.82 75.64 76.2 75.62 75.8 75.75Significant No No No No No No No No No
Table 7: Immunotherapy ([15,18,19]) dataset —> 7 explanatory variables and 90 instances
Algorithm/Trees 2 5 10 20 100 200 500 1000 4000Random Forest 80.89 81.56 83.33 84 83.56 84 83.78 84 83.56
Bagging 82.89 82.67 84.67 84.89 84.22 83.78 83.33 82.89 82.89Significant No No No No No No No No No
Table 8: Cryotherapy ([15,18,19]) dataset: —> 6 explanatory variables and 90 instances
Algorithm/Trees 2 5 10 20 100 200 500 1000 4000Random Forest 82.88 85.78 86.67 86 89.56 88.22 90 90.89 91.33
Bagging 83.33 84.44 84.89 85.11 85.11 85.11 85.33 84.22 83.78Significant No No No No No No No No No
Conclusion
The superiority of an algorithm [13] compared to another de-pends on numerous factors such as the structure of the al-gorithm and also the dataset at hand. In this paper we con-clude that there aren’t significant di�erences between the al-gorithms of Bagging and Random Forest in terms of Accuracy,for every number of trees and data set that we use (as long asthe data sets fulfill the conditions specified at the beginningof our paper). Therefore, it could be more e�icient to use oneof these two algorithms. Like many other conclusions in ma-chine learning, our results remain empirical and they can befurther consolidated by doing a similar study with other datasets fulfilling the same conditions as the data sets in this pa-per.
References
[1] O.H. et al. Lawrence. Comparing pure parallel ensemblecreation techniques against bagging., 2003.
[2] I.H. et al. Wi�en. Data mining: Practical machine learn-ing tools and techniques, third edition., 2011.
[3] Warda M. El-Talbany, M.E. An empirical comparisonof tree-based learning algorithms: An egyptian rice dis-eases classification case study., 2016.
[4] De Moor B. Claesen M. Hyperparameter search in ma-chine learning, 2015.
[5] L. Breiman. Random forests, 2001.
[6] Open ml.
[7] R.E. et al Banfield. A comparison of ensemble creationtechniques, 2004.
[8] F. et al Khozeimeh. An expert system for selecting warttreatment method, 2017.
[9] F. et al Khozeimeh. Intralesional immunotherapy com-pared to cryotherapy in the treatment of warts., 2017.
[10] D. et al. Krstajic. Cross-validation pitfalls when select-ing and assessing regression and classification models.,2014.
[11] Uci machine learning repository.
[12] Blockeel H. Vanwinckelen G. On estimating model ac-curacy with repeated cross-validation., 2011.
[13] R.E. et al Banfield. A comparison of ensemble creationtechniques, 2004.
[14] Niculescu-Mizil A Caruana R. An empirical comparisonof supervised learning algorithms using di�erent perfor-mance metrics., 2006.
[15] M. et al Fernández-Delgado. Do we need hundreds ofclassifiers to solve real world problems?, 2014.
[16] R.D et al. King. Statlog: Comparison of classificationalgorithms on large real-world problems., 1995.
[17] P. et al. Latinne. Limiting the number of trees in randomforests., 2001.
[18] R.E. et al Banfield. An empirical comparison of decisiontrees and other classification methods, 1998.
[19] T.M. et al. Oshiro. How many trees in a random forest,2012.
A propos de Coperneec«From Revolution to Performance»
Coperneec est un cabinet de conseil cross-sectoriel spécialistede la valorisation de la Data. Nous intervenons sur l’ensemblede la chaîne des savoir-faire autour de la Data Science, la DataAnalyse et du Data Management.
Nos méthodes et techniques scientifiques éprouvées perme-�ent de résoudre des problématiques dans tous les secteursde l’industrie.
Notre vocation : extraire la connaissance à partir des donnéeset pérenniser les avancées technologiques qui en découlent.La R&D est au cœur de notre ADN et les expertises de nosconsultants (data scientists, data analysts, data engineers)sont en permanence challengées afin d’accompagner au plusprès les révolutions technologiques et scientifiques.
Contactez-nousAymeric [email protected] 88 69 67 75
est une marque de