a comparison of the eco-efficiency of two prodution … · a comparison of the eco-efficiency of...
TRANSCRIPT

ECN-I--01-003 1
February 2001 ECN-I--01-003
A comparison of the eco-efficiency of two production routesfor methanol
J.A. HugillJ.P OverbeekS. Spoelstra
Revisions
A First draft version for internal review 19 January 20011 Definitive version 2 February 2001
Made by J.A. Hugill
Approved by S. Spoelstra
ECN Energy Efficiencyin Industry
Checked by J.P. Overbeek
Issued by J.A. Hugill
Processes & Systems

2 ECN-I--01-003
PrefaceThis document is the final report of the ENGINE project ‘Eco-efficiency of chemical processes’(project nr. 76188) which was carried out in the period August 1999 – December 2000.
AbstractTo achieve sustainable development in the chemical industry, there is a need for methodologiesto assess the eco-efficiency of alternative and novel technologies.
The aim of this project was to use a case study to investigate the application of existing tools toassess eco-efficiency. The case study compared the conventional methanol production processwith a novel route using a photo-electrochemical (PEC) reactor.
The Exergy Analysis showed that the exergetic efficiency (for the production phase) of the PECprocess was much lower than that of the conventional process. However, exergy from the sun isfree and abundant, and in such processes there can be large exergy losses without directenvironmental consequences.
The Life Cycle Analysis revealed that the two process routes have a similar overallenvironmental impact. The impact is dominated by the production phase for the conventionalprocess, but by the construction phase for the PEC process. To improve the PEC process,priority should in principle be given to optimising the materials of construction, rather thanimproving the exergetic efficiency as such. Nevertheless, insofar as the large size of the PECreactor is related to its low exergetic efficiency, we can still conclude that it makes no sense tosquander exergy, even free exergy.

ECN-I--01-003 3
CONTENTS
SUMMARY 4
1. INTRODUCTION 5
2. METHANOL PRODUCTION ROUTES 72.1 Conventional 72.2 Photo-electrochemical 9
3. METHODOLOGY 11
4. ANALYSES 174.1 Conventional process 17
4.1.1 Exergy analysis 184.1.2 Life-Cycle Assessment 22
4.2 Photo-electrochemical process 234.2.1 Exergy analysis 234.2.2 Life Cycle Assessment 24
4.3 Comparison 25
5. CONCLUSIONS AND RECOMMENDATIONS 295.1 Process routes 295.2 Methodology 295.3 Recommendations 30
REFERENCES 31
GLOSSARY OF SYMBOLS AND ABBREVIATIONS 31
APPENDIX A: ECO-INDICATOR ‘95 33
APPENDIX B: CONVENTIONAL PROCESS: FLOWSHEETS 37
APPENDIX C: CONVENTIONAL PROCESS: MODELLING OF THE WATER RECYCLE LOOP 43
APPENDIX D: CONVENTIONAL PROCESS: HEAT AND MATERIAL BALANCES 45
APPENDIX E: CONVENTIONAL PROCESS: STEAM SYSTEM FLOWSHEETS 51
APPENDIX F: CONVENTIONAL PROCESS: STEAM SYSTEM HEAT AND MATERIAL BALANCES 53
APPENDIX G: CONVENTIONAL PROCESS: HEAT INTEGRATION OF SECTION 1 55
APPENDIX H: CONVENTIONAL PROCESS: CALCULATION OF ELECTRICITY AND STEAM IMPORTS 57
APPENDIX I: CONVENTIONAL PROCESS: EXERGY ANALYSIS 59

4 ECN-I--01-003
SUMMARY
In order to achieve sustainable development in the chemical industry, there is a need for a set ofmethodologies with which to assess the relative merits of alternative and novel technologies onthe basis of sustainability or eco-efficiency. However there is a gap between the existingmethods of chemical process synthesis/design and those of Life Cycle Analysis LCA.
The aim of this project was to use a case study to investigate the possibilities and pitfalls ofapplying existing tools - the process design tool Aspen Plus together with the exergy subroutineEXERCOM, and the LCA tool SimaPro - to assess eco-efficiency. The case study was based ona process of industrial interest, namely the production of methanol. Two totally different routesto produce methanol were compared. One is the conventional route, by reforming of natural gasand synthesis of methanol. The other route uses a photo-electrochemical (PEC) reactor in whichCO2 and water are used as feedstock and the reaction is driven by solar energy.
A considerable effort was required to perform the exergy analysis and the LCA on theconventional process, starting from the process flowsheet. In addition to modelling the processflowsheet as such, attention had also to be given to modelling of the steam system, and the heatintegration, before even an approximate overall steam/electricity balance could be obtained.Furthermore, the program EXERCOM was found to have a limited functionality. Exergies ofmaterial streams are calculated, but exergies of heat streams, exergy losses in (sub)systems, andexergetic efficiencies all had to be calculated manually. We conclude that such a detailedmodelling approach is probably only justified when it is desired to identify the specific causesof the exergy losses or environmental impacts in a process. If we only wish to calculate overallvalues for the process, then it is preferable to adopt a black box approach at the highest possiblelevel of agglomeration – however this approach requires data on the overall processperformance which may not always be readily available.
The exergy analysis showed that the exergetic efficiency of the conventional process is about 68%, while that of the PEC process is only about 5 %. However, exergy from the sun is free andabundant, and in such processes there can be large exergy losses without direct environmentalconsequences. We conclude that exergetic efficiency as normally defined (based on theproduction phase only) is not a useful concept when comparing processes driven by solarenergy with their conventional counterparts. To be of more use, the exergy analysis would haveto be extended to include (like the LCA) the construction/demolition phases.
The LCA revealed that the two process routes have a similar overall environmental impact. Forthe conventional process, the construction/disposal phases make a negligible contribution to thetotal environmental impact, which is dominated by the production phase. For the PEC process,although the production and disposal phases are beneficial to the environment, the total(adverse) environmental impact is dominated by the construction phase.We conclude that LCA is a useful tool to compare novel processes with their conventionalcounterparts. For novel processes based on solar energy (and probably other renewable energysources) LCA can reveal the potentially key contribution made by the construction/demolitionphases to the total environmental impact. Such observations can help guide processdevelopment.
To improve the PEC process, priority should in principle be given to optimising the materials ofconstruction, rather than improving the exergetic efficiency as such. Nevertheless, insofar as thelarge size of the PEC reactor is related to its low exergetic efficiency, we can still conclude thatit makes no sense to squander exergy, even free exergy.

ECN-I--01-003 5
1. INTRODUCTION
In the framework of sustainable development, the chemical industry is interested in indicatorsfor sustainability or eco-efficiency. Not only does it realise that sustainable thinking can providebusiness benefits, the chemical industry also tries to project a more sustainable image towardsthe consumers/public. Producing in a sustainable way will in the end lead to a sustainablecompany.
This calls for a need of a set of methodologies with which to assess the relative merits ofalternative and novel technologies on the basis of sustainability or eco-efficiency. Thesemethodologies must take into account factors such as exergy efficiency (i.e. use of primaryenergy), environmental impact, and depletion of natural resources, in the context of the entirelife cycle of the process/product. But the currently applied methodologies for chemical processsynthesis and design (e.g based on flowsheeting programs such as Aspen Plus) are limitedinsofar as they are mainly concerned with existing technologies, do not have a specific focus oneco-efficiency, and miss the insights of a life cycle approach. On the other hand, currentlyapplied methodologies for environmental life cycle analysis LCA (e.g. based on the programSimaPro) have been rarely applied to chemical processes, and never applied at the stage ofprocess synthesis and design. To put it crudely, a gap exists between the methods of processdesign and the methods of LCA. We have to bridge that gap if we want to develop a sustainablechemical industry.
In the long term, the objective is to develop a methodology or instrument to assess thesustainability or eco-efficiency of industrial processes/process chains. For the present project theobjective is to further investigate the possibilities and pitfalls of applying existing tools as aprocess design tool (Aspen Plus) together with an LCA tool (SimaPro) to do so. Previousstudies have been performed on a chemical heat pump and on two production routes for MethylIsobutyl Ketone, see [1, 2].
In the current project, one case study is used to further investigate the above and other issues.The case study is based on a process of industrial interest, namely the production of methanol.Two totally different routes to produce methanol are compared. One consists of theconventional way by reforming of natural gas and synthesis of methanol. The other way uses aphoto-electrochemical (PEC) reactor in which CO2 and water are used as feedstock and thereaction is driven by solar energy.
Chapter 2 describes both the conventional methanol production process and the production ofmethanol in a photo-electrochemical reactor. The concept of eco-efficiency as well as themethods of exergy analysis and Life Cycle Assessment are addressed in Chapter 3. Chapter 4deals with the analysis results, followed by the conclusions and recommendations in Chapter 5.

6 ECN-I--01-003
ECN-I--01-003 7
2. METHANOL PRODUCTION ROUTES
This chapter describes the two production routes for methanol which have been studied in thisproject.
2.1 ConventionalThere are about 95 methanol plants worldwide with a total capacity of 34 Mt/y. About 80% ofmethanol is produced from natural gas, and methanol production is concentrated in regionswhere natural gas is cheap and available. In the Netherlands, Methanor (a joint venture of Akzo-Nobel, DSM, and Dyno) produces 780 kt/y (about 14 % of European production) in Delfzijl.
The main applications of methanol are as a solvent (4% worldwide), in gasoline blending (2%)and in the manufacture of formaldehyde (35%), MTBE (27%), acetic acid (10%) and otherchemicals.
The conventional methanol process is licensed by• Synetix (formerly ICI) (60% of production worldwide, including the Methanor plant).• Lurgi (30%).• Others (Haldor Topsoe, Kellogg, Krupp Uhde).
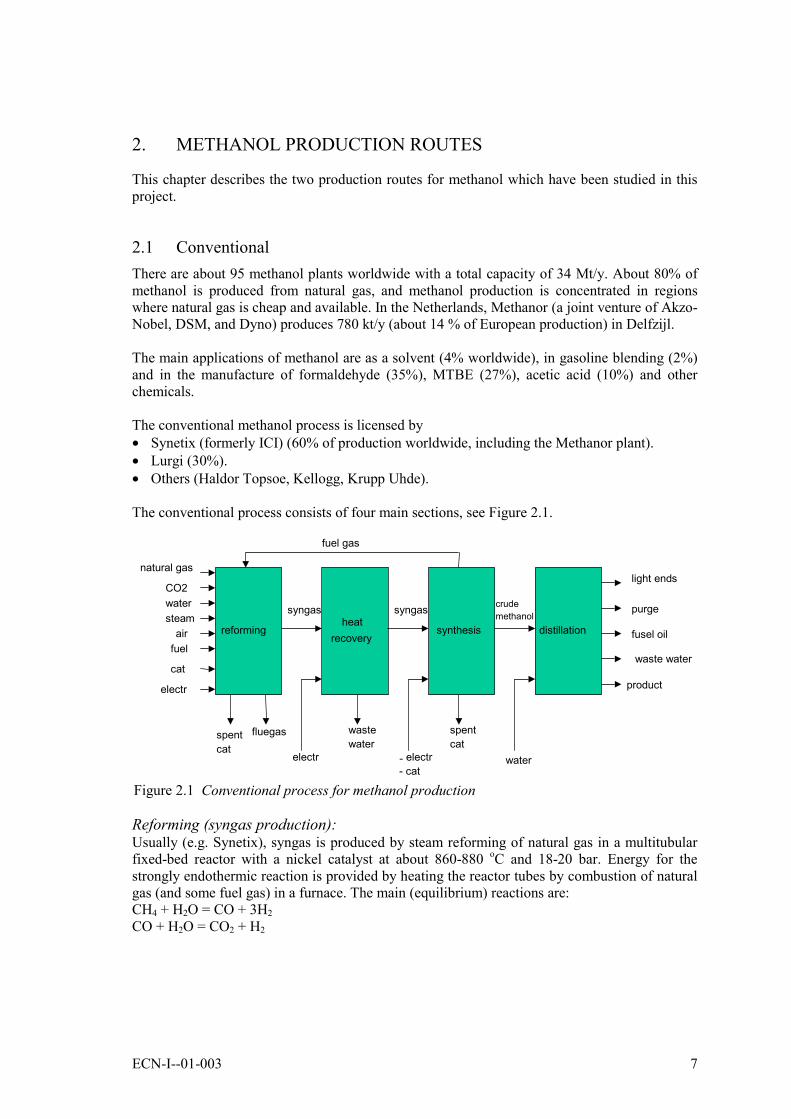
The conventional process consists of four main sections, see Figure 2.1.
Reforming (syngas production):Usually (e.g. Synetix), syngas is produced by steam reforming of natural gas in a multitubularfixed-bed reactor with a nickel catalyst at about 860-880 oC and 18-20 bar. Energy for thestrongly endothermic reaction is provided by heating the reactor tubes by combustion of naturalgas (and some fuel gas) in a furnace. The main (equilibrium) reactions are:CH4 + H2O = CO + 3H2CO + H2O = CO2 + H2
synthesis distillationheat
recoveryreforming
natural gas
CO2water
airfuel
cat
electr
spentcat
fluegas wastewater
spentcat
electr - electr- cat
syngas syngas crudemethanol
water
light ends
purge
fusel oil
waste water
product
fuel gas
steam
Figure 2.1 Conventional process for methanol production

8 ECN-I--01-003
Steam reforming gives syngas with a H2 /CO ratio which is too high for the methanol synthesisstep. This can be dealt with by:• hydrogen purge downstream of the synthesis reactor (e.g. Synetix),• addition of CO2 to the syngas (either upstream or downstream of the reformer).
CO2 addition is most often practised when CO2 is available from a nearby ammonia plant. Insome processes (e.g. Lurgi), syngas of an optimum composition is produced by using partialoxidation of natural gas in addition to steam reforming.
Heat recovery:The syngas is cooled and compressed before entering the synthesis loop.
Methanol synthesis:The methanol synthesis reactor uses a fixed bed of copper-based catalyst at 200 – 280 oC and 80- 100 bar. The main (equilibrium) reactions are:CO + 2H2 = CH3OHCO2 + 3H2 = CH3OH + H2O
Both reactions are exothermic, so the reactor is normally cooled in order to maximise theequilibrium conversion. Different process licensors use various methods of reactor cooling. Themethanol concentration at the reactor outlet is only about 7-8 %. The reactor effluent is cooledto 40-45 oC to condense the crude methanol product, and the unreacted gases are recycled backto the reactor inlet. A purge is taken from the recycle gas to remove inerts and any surplushydrogen. The purge gas is used as fuel in the reformer furnace.
Distillation (methanol purification):A two- or three-column distillation system removes water and other by-products.
More details about conventional methanol production are given in a recent report [3].

ECN-I--01-003 9
2.2 Photo-electrochemical
The concept under study is shown below in Figure 2.2. The concept works in the following way.A semiconductor photocatalyst on the left (anode) side absorbs light resulting in the promotionof an electron from the valence band to the conduction band, leaving a hole behind. This chargeseparation is the first essential step. For a n-type semiconductor, the holes will move to theinterface with the water. The reaction between the water and the holes results in the formationof oxygen and protons.
H2O + 2h+ => ½ O2 + 2H+
The protons are able to diffuse to the right (cathode) side through a proton conductingmembrane. The electrons that were created in the semiconductor are also able to move to thecathode by an electrical connection and possibly a bias voltage. At the cathode the proton andelectrons react with the carbon dioxide present to form chemicals. To form for examplemethanol, the following reaction occurs.
6H+ + 6e- + CO2 => CH3OH + H2O
The type of product that is formed depends on the electrocatalyst that is used at the cathode side.The overall reaction for the production of methanol becomes:
2 H2O + CO2 => CH3OH + 3/2 O2
For this principle to work the bandgap of the photocatalyst semiconductor should be larger thanthe redox potentials of both half reactions. However, a too large bandgap would imply that thesemiconductor would not absorb visible light. In addition, the band edges potentials at theinterface between the photocatalyst and the water should match the redox potentials needed tosplit the water. The most widely used semiconductor is titanium dioxide (TiO2) due to the factthat it is very stable, its bandgap is high enough, it is not toxic, it is widely available, and low incost. The disadvantage of TiO2 is that it has a bandgap of about 3 eV(rutile), implying onlyabsorption of UV-light.
More information on this reactor can be obtained from for example [4].
�������������������������������������������������������������������������������������������������������������������������������������������������������������������������������������������������������������������������������������������������������
��������������������������������������� ���� ���� ���� ���� ���� ���� ���� ���� ���� ���� �����
������� ���� ���� ���� ���� ���� ���� ���� ���� ���� ���� ���� ���� ���� ���� ���� ���� ���� ���� ���� ���� ���� ���� ���� ���� ���� ���� ���� ���� ���� ���� ���� ���� ���� ���� ���� ���� ���� ���� ���� ���� ���� ���� ���� ���� ���� ���� ���� ���� ���� ���� ���� ���� ���� ���� ���� ���� ���� ���� ���� ���� ���� ���� ���� ���� ���� ���� ���� ���� ���� ���� ���� ���� ���� ���� ���� ���� ���� ���� ���� ���� ���� ���� ���� ���� ���� ���� ���� ���� ���� ���� ���� ���� ���� ���� ����
�������� ���� ���� ���� ���� ���� ���� ���� ���� ���� ���� ���� ���� ���� ���� ���� ���� ���� ���� ���� ���� ���� ���� ���� ���� ���� ���� ���� ���� ���� ���� ���� ���� ���� ���� ���� ���� ���� ���� ���� ���� ���� ���� ���� ���� ���� ���� ���� ���� ���� ���� ���� ���� ���� ���� ���� ���� ���� ���� ���� ���� ���� ���� ���� ���� ���� ���� ���� ���� ���� ���� ���� ���� ���� ���� ���� ���� ���� ���� ���� ���� ���� ���� ���� ���� ���� ���� ���� ���� ���� ���� ���� ���� ���� ���� ����
�������� ���� ���� ���� ���� ���� ���� ���� ���� ���� ���� ���� ���� ���� ���� ���� ���� ���� ���� ���� ���� ���� ���� ���� ���� ���� ���� ���� ���� ���� ���� ���� ���� ���� ���� ���� ���� ���� ���� ���� ���� ���� ���� ���� ���� ���� ���� ���� ���� ���� ���� ���� ���� ���� ���� ���� ���� ���� ���� ���� ���� ���� ���� ���� ���� ���� ���� ���� ���� ���� ���� ���� ���� ���� ���� ���� ���� ���� ���� ���� ���� ���� ���� ���� ���� ���� ���� ���� ���� ���� ���� ���� ���� ���� ���� ����
�������� ���� ���� ���� ���� ���� ���� ���� ���� ���� ���� ���� ���� ���� ���� ���� ���� ���� ���� ���� ���� ���� ���� ���� ���� ���� ���� ���� ���� ���� ���� ���� ���� ���� ���� ���� ���� ���� ���� ���� ���� ���� ���� ���� ���� ���� ���� ���� ���� ���� ���� ���� ���� ���� ���� ���� ���� ���� ���� ���� ���� ���� ���� ���� ���� ���� ���� ���� ���� ���� ���� ���� ���� ���� ���� ���� ���� ���� ���� ���� ���� ���� ���� ���� ���� ���� ���� ���� ���� ���� ���� ���� ���� ���� ���� ����
�������� ���� ���� ���� ���� ���� ���� ���� ���� ���� ���� ���� ���� ���� ���� ���� ���� ���� ���� ���� ���� ���� ���� ���� ���� ���� ���� ���� ���� ���� ���� ���� ���� ���� ���� ���� ���� ���� ���� ���� ���� ���� ���� ���� ���� ���� ���� ���� ���� ���� ���� ���� ���� ���� ���� ���� ���� ���� ���� ���� ���� ���� ���� ���� ���� ���� ���� ���� ���� ���� ���� ���� ���� ���� ���� ���� ���� ���� ���� ���� ���� ���� ���� ���� ���� ���� ���� ���� ���� ���� ���� ���� ���� ���� ���� ����
�������� ���� ���� ���� ���� ���� ���� ���� ���� ���� ���� ���� ���� ���� ���� ���� ���� ���� ���� ���� ���� ���� ���� ���� ���� ���� ���� ���� ���� ���� ���� ���� ���� ���� ���� ���� ���� ���� ���� ���� ���� ���� ���� ���� ���� ���� ���� ���� ���� ���� ���� ���� ���� ���� ���� ���� ���� ���� ���� ���� ���� ���� ���� ���� ���� ���� ���� ���� ���� ���� ���� ���� ���� ���� ���� ���� ���� ���� ���� ���� ���� ���� ���� ���� ���� ���� ���� ���� ���� ���� ���� ���� ���� ���� ���� ����
�������� ���� ���� ���� ���� ���� ���� ���� ���� ���� ���� ���� ���� ���� ���� ���� ���� ���� ���� ���� ���� ���� ���� ���� ���� ���� ���� ���� ���� ���� ���� ���� ���� ���� ���� ���� ���� ���� ���� ���� ���� ���� ���� ���� ���� ���� ���� ���� ���� ���� ���� ���� ���� ���� ���� ���� ���� ���� ���� ���� ���� ���� ���� ���� ���� ���� ���� ���� ���� ���� ���� ���� ���� ���� ���� ���� ���� ���� ���� ���� ���� ���� ���� ���� ���� ���� ���� ���� ���� ���� ���� ���� ���� ���� ���� ����
�������� ���� ���� ���� ���� ���� ���� ���� ���� ���� ���� ���� ���� ���� ���� ���� ���� ���� ���� ���� ���� ���� ���� ���� ���� ���� ���� ���� ���� ���� ���� ���� ���� ���� ���� ���� ���� ���� ���� ���� ���� ���� ���� ���� ���� ���� ���� ���� ���� ���� ���� ���� ���� ���� ���� ���� ���� ���� ���� ���� ���� ���� ���� ���� ���� ���� ���� ���� ���� ���� ���� ���� ���� ���� ���� ���� ���� ���� ���� ���� ���� ���� ���� ���� ���� ���� ���� ���� ���� ���� ���� ���� ���� ���� ���� ����
�������� ���� ���� ���� ���� ���� ���� ���� ���� ���� ���� ���� ���� ���� ���� ���� ���� ���� ���� ���� ���� ���� ���� ���� ���� ���� ���� ���� ���� ���� ���� ���� ���� ���� ���� ���� ���� ���� ���� ���� ���� ���� ���� ���� ���� ���� ���� ���� ���� ���� ���� ���� ���� ���� ���� ���� ���� ���� ���� ���� ���� ���� ���� ���� ���� ���� ���� ���� ���� ���� ���� ���� ���� ���� ���� ���� ���� ���� ���� ���� ���� ���� ���� ���� ���� ���� ���� ���� ���� ���� ���� ���� ���� ���� ���� ����
�������� ���� ���� ���� ���� ���� ���� ���� ���� ���� ���� ���� ���� ���� ���� ���� ���� ���� ���� ���� ���� ���� ���� ���� ���� ���� ���� ���� ���� ���� ���� ���� ���� ���� ���� ���� ���� ���� ���� ���� ���� ���� ���� ���� ���� ���� ���� ���� ���� ���� ���� ���� ���� ���� ���� ���� ���� ���� ���� ���� ���� ���� ���� ���� ���� ���� ���� ���� ���� ���� ���� ���� ���� ���� ���� ���� ���� ���� ���� ���� ���� ���� ���� ���� ���� ���� ���� ���� ���� ���� ���� ���� ���� ���� ���� ����
�������� ���� ���� ���� ���� ���� ���� ���� ���� ���� ���� ���� ���� ���� ���� ���� ���� ���� ���� ���� ���� ���� ���� ���� ���� ���� ���� ���� ���� ���� ���� ���� ���� ���� ���� ���� ���� ���� ���� ���� ���� ���� ���� ���� ���� ���� ���� ���� ���� ���� ���� ���� ���� ���� ���� ���� ���� ���� ���� ���� ���� ���� ���� ���� ���� ���� ���� ���� ���� ���� ���� ���� ���� ���� ���� ���� ���� ���� ���� ���� ���� ���� ���� ���� ���� ���� ���� ���� ���� ���� ���� ���� ���� ���� ���� ����
�������� ���� ���� ���� ���� ���� ���� ���� ���� ���� ���� ���� ���� ���� ���� ���� ���� ���� ���� ���� ���� ���� ���� ���� ������������������������������������������������������������
�����������������������������������������������������������������
e-
O2
H2O
Photocatalyst Electrocatalyst
CO2
H2, CH4
Proton separator(nafion)
Light (hν)
Figure 2.2 Concept of a photo-electrochemical reactor for methanol production

10 ECN-I--01-003

ECN-I--01-003 11
3. METHODOLOGY
The concept of eco-efficiency was first coined in 1992 by the Business Council for SustainableDevelopment. It was further defined at the first Antwerp workshop on Eco-efficiency in 1993 asbeing ‘reached by the delivery of competitively priced goods and services that satisfy humanneeds and bring quality of life, while progressively reducing ecological impacts and resourceintensity throughout the life cycle, to a level at least in line with the earth’s estimated carryingcapacity’. Eco-efficiency is a management philosophy. It encourages businesses to becomemore competitive, more innovative and more environmentally responsible. Eco-efficiency linksthe goals of business excellence and environmental excellence. Eco-efficiency embraces cleanerproduction concepts such as efficient use of raw materials, pollution prevention, sourcereduction, waste minimisation and internal recycling and reuse. It captures the idea of pollutionreduction through process change as opposed to the earlier end-of-pipe approaches. Eco-efficiency also features a life cycle perspective that follows products from the raw materialthrough to final disposal stages. Put in simple terms, the vision of eco-efficiency is to ‘producemore from less’. Reducing waste and pollution, and using less energy and fewer raw materials isobviously good for the environment. It is also self-evidently good for business because it cutscompanies’ costs, and eventually avoids potential environmental liabilities. It is, therefore, aprerequisite to the long-term sustainability of business.
The World Business Council of Sustainable Development (WBCSD) has identified sevensuccess factors for eco-efficiency:• reduce the material intensity of goods and services,• reduce the energy intensity of goods and services,• reduce toxic dispersion,• enhance material recyclability,• maximise sustainable use of renewable resources,• extend material durability,• increase the service intensity of goods and services.
Translating Eco-efficiency into numbers is a difficult task. While indices such as energy andwater use are easy to measure, others such as non-product output (or waste) are not uniformlydefined. In turn, this makes it difficult to compare the figures of different companies. Therelevance of various types of emissions and environmental burdens also varies from business tobusiness. The elements to be included in an Eco-efficiency performance profile are therefore amatter of intense debate.
There is no shortage of measurement methods. The problem is that there is no standardmethodology and no agreed, common set of indicators to quantify Eco-efficiency. Becausecompanies and organisations use different systems, there is confusion, and even scepticism,about some of industry's claims. The need for co-ordination and standardisation is critical.
Eco-efficiency is the merging of product or service value and ecological aspects into anefficiency ratio. This means maximising value while minimising adverse environmental impact,i.e. minimising use of resources and adverse environmental consequences from emissions.WBCSD developed the following basic formula to estimate eco-efficiency:
influencetalenvironmenvalueserviceorproductefficiencyeco =−

12 ECN-I--01-003
However, there is no universally accepted set of terms for the numerator and de-nominatorelements in this formula. Therefore, numerous ways to calculate eco-efficiency exist, andspecific parameters must be established based on the individual needs of companies and theirstakeholders. For example, ‘product or service value’ may be defined in terms of the number ofproducts, their economic value, or a measure of the need they fulfil for the public.Environmental influence encompasses elements of the use of resources and energy, as well asemissions of substances to air, water, and land that could have adverse environmental impacts.The use of eco-indicator points per kg product resulting from a Life Cycle Assessment or theuse of cumulative exergy losses per kg product represent a way of indicating environmentalinfluence per product quantity.
Exergy analysisExergy is a concept which follows from a combination of the first and second laws ofthermodynamics. Exergy is a measure for the quality of energy and corresponds to themaximum available work which can be obtained when taking a system through reversibleprocesses to equilibrium with the environment. In real processes, irreversibilities always occur.This leads to a loss of exergy or loss of available work.
An exergy analysis is a powerful tool for providing insight into the inefficiencies of processes.It pinpoints the exact location of the losses. A decrease of the exergy loss of a processautomatically leads to a decrease of the demand of primary fuels for that process. Exergyanalysis is not a new concept but has up till now mainly been applied to energy conversionprocesses, like gas turbines, combined heat and power stations, combined cycles, etc… The useof exergy analysis in the chemical industry is increasing.
The quantity of exergy can be subdivided into three components, namely the physical, mixing,and chemical exergy. The physical exergy is the maximum amount of work which can beobtained when a system comes to thermal and mechanical equilibrium with the environment(p0,T0). The mixing exergy corresponds to the minimum necessary work to separate a mixture atthermal and mechanical equilibrium (p0,T0) into the separate components. Alternatively, it is themaximum amount of work which is released by this process.
The chemical exergy is the maximum amount of work which can be obtained from a componentwhen taking this component from thermal and mechanical equilibrium (p0,T0) to chemicalequilibrium with the substances occuring in the natural environment. This also equals theminimum amount of work necessary to create this component from environmental substances.
In calculating exergy, it is very important to define a reference or environmental condition. It iscommon to use p0 = 1.01325 bar and T0 = 298.15 K as these reference conditions. These arebased on [5]. This reference also states the reference substances and their environmentalconcentrations for use in the calculation of the chemical exergy. Reference [5] contains tableswith the standard chemical exergy (i.e. the chemical exergy at reference conditions) of a largenumber of substances.
Life Cycle AssessmentA Life Cycle Assessment (LCA) is a cradle-to-grave approach to a specific product or process.It evaluates the environment impact of any product or process considering the total life cycle,including design, construction, use, dismantling, and recycling. The purpose of an LCA is tocompare different products or processes which have the same function. The methodology isalready very well developed and in the Netherlands there is a very good description of how toperform an LCA, see [6, 7]. An LCA consists of the following components.

ECN-I--01-003 13
Goal and ScopeThe specific application of the LCA is defined within this component. Elements hereof are theobjective of the study (product information, product innovation, product regulation, policystrategies), the target group (consumers, producers, authorities), and the depth of the study.Another element of this component is the definition of the functional unit of the system underconsideration. This unit describes the central function of the product or process. For the purposeof this study the functional unit is the production of 100 kton of methanol by either theconventional process or in a photo-electrochemical reactor.
InventoryWithin this component an overview is compiled which contains all processes which make upthe life cycle, the so called process tree. This also determines the system boundaries withinwhich the LCA will be performed. Thereafter data collection starts of all processes underconsideration. This is a labour-intensive task and concerns data about the in- and outflowsfrom/to the economy (products, services, materials, energy, waste to be treated) and in- andoutflow from/to the environment (raw materials, energy carriers, space, emissions, radiation,noise, heat, light, disasters). Hereafter rules have to be applied which allocate the impacts tomultiple economic products, if this is the case. The last step of the inventory component consistsof making an impact table. This table contains the quantified environmental impact or emissionsof each process/product per functional unit.
System boundaries In order to establish the material use for the construction phase for both production routes aneducated guess must be made to estimate the amount of construction materials needed. Theenvironmental impact of transporting the materials to the site is included. The other informationneeded regarding the construction phase is the energy use during construction, required tools,additional overhead/infrastructure and capital goods as well as the use of land. It is almostimpossible to make an estimate of these figures and their environmental impact. Accordingly,we consider these aspects to fall outside the system boundaries – it is implicitly assumed thattheir environmental impact is negligible in comparison to the other contributions. The transport of feedstock as well as maintenance activities during the production phase alsofall outside the system boundaries – again, it is implicitly assumed that these activities have anegligible effect. The remaining aspects such as feedstock, energy use, emissions, waste,products and by-products all fall within the system boundaries. Although from previous studies it is known that the demolition phase of a system or productmakes a very small contribution to the overall environmental impact, an attempt has been madeto take the demolition phase into account.

14
Figure 3.1 System boundaries for the methano ClassificationThe classification component translates the eeffects. These effects present the contributiogreen house effect, ozone layer destruction, etcwhich determines the contribution of that pproblem. For each environmental problem thfactor and summed up. This results in total scodifferent scores, they are normalised. In practiprocess/product to an environmental problem iEuropean Union to the same problem.
EvaluationDuring the evaluation, the profile consistingproblems is assessed. For this one needs a wother. One way to do this is to multiply each The Eco-indicator ’95 method (see Appendix Athe total environmental effect.
Capital goods
Land use
Transport
Maintenance anol)
Energy
Tools
OverheadConstruction
Production
Disposal
MaterialenE-use (elctr./h
MaterialenFeedstock
l pr
nvin t. Foarte eresce,s co
ofay sco) i
MaterialenProductionprocess
oduction case
ronmental impacts to o environmental probr each emission there
icular emission to a mission is multiplied for each problem. To this means that the compared to the contrib
the scores on the into compare the differre with a weighting fas such a way to come
Emiss
Mater
E-use
MaterialenWaste
relevlemsis a cspec with be antrib
ution
divident pctor
up w
ions
ials
MaterialenBy-products
MaterialenProduct (meth
MaterialenE-output
MaterialenEmissions
MaterialenMaterials
eat)
Waste
MaterialenTransport
ECN-I--01-003
ant environmental like acidification,lassification factorific environmental the classificationble to compare theution of a specific of for example the
ual environmentalroblems with each and sum them up.ith one number for

ECN-I--01-003 15
The analysis described above can be followed by an improvement analysis in which theknowledge that has been gathered is used to improve the product/process. The analyses reportedin this document have been performed with the commercially available software packageSimaPro, version 4.0, see [8, 9].

16 ECN-I--01-003

ECN-I--01-003 17
4. ANALYSES
4.1 Conventional processProcess flowsheet modellingThe starting point for the process modelling was a flowsheet and data provided in thedocumentation of an Aspen Plus course [10]. It would have been preferable to have data froman actual plant, or from a generic design provided by a process licensor. However we wereunable to acquire sufficient information from either an end-user (Methanor) or the processlicensors (Synetix, Lurgi). The advantage of the source used is that we knew from the outsetthat sufficient information was available to construct a reasonably detailed and self-consistentAspen Plus model. The disadvantage is that although we know the flowsheet is that of a‘typical’ methanol plant, the exact origin of the data is not known.
The overall flowsheet of the process modelled was already shown in Figure 2.1. The detailedflowsheet is given in Appendix B. In this particular flowsheet, only steam reforming is usedproduce syngas, as in the Synetix process, but carbon dioxide is added to the natural-gasfeedstock in order to produce an optimal syngas composition. The methanol synthesis reactoruses direct cooling, as in the Lurgi process. The flowsheet was modelled using Aspen Plus 10.1.(One small feature of the flowsheet, a water recycle loop, was not modelled in Aspen Plus butdealt with by an approximate procedure; this is explained in Appendix C.) The resultant heatand material balances are given in Appendix D. The production of methanol is 61809 kg/h.
Steam system modellingIn order to provide a sufficient basis for the exergy analysis, it was necessary to complement theprocess model with a model for the associated steam system. The function of the steam systemis to use the heat extracted from various parts of the process (ultimately from the exothermicreactors) to generate steam at various pressure levels and to generate electricity. The steam isthen used at other points in the process (as process steam and as a heat source for e.g. the
reforming heatrecovery synthesis distillation
steam systemBFW condensate
water
process steam
electricity
heat
electricity import
steamimport
Figure 4.1 The relationship of the steam system to the process

18 ECN-I--01-003
reboilers of distillation columns). The electricity is used to drive equipment such ascompressors. The relationship of the steam system to the process is illustrated in Figure 4.1.
The flowsheet for the steam system was designed on the basis of a global description given byLurgi [11] and is shown in Appendix E. It is very simple, feasible system. No attempt was madeto develop an optimum flowsheet, which would certainly be much more complicated. Theflowsheet was modelled using Aspen Plus 10.1 (a separate model from the process model). Theresultant heat and material balances are given in Appendix F.
Heat integrationMost of the heat sources and heat sinks in the process/steam-system flowsheets were tiedtogether by links already defined in the flowsheet structures. However, once the flowsheets hadbeen modelled, it remained to deal with a number of ‘unassigned’ heat sources and heat sinks.In practice this concerned four heaters in the reforming section whose heating requirementscould be met by use of heat recovered from the reformer-furnace flue-gas cooler, together withMP/LP steam from the steam system. A simple, feasible heat integration scheme was designedwhich takes into account the temperature levels of the various heat sources/sinks. Details of thisdesign are given in Appendix G. A more optimum design could probably be made by use of arigorous pinch analysis, but such an analysis would logically have to include optimisation of thesteam system and indeed a re-assessment of all source/sink links defined in the originalflowsheet. Such an exercise was not justified in the scope of the current work.
Electricity and steam importsAfter completion of the flowsheet models and the heat integration study, the requirement forimport of electricity and steam could be assessed on the basis of the overall balances. Details aregiven in Appendix H. An import of 13160 kW electricity and 18676 kW LP steam is required.The former figure corresponds to 213 kWh/ton methanol, which is an order of magnitudegreater than the value quoted by Lurgi, 20 kWh/ton [11]. Furthermore, the information fromLurgi suggests that no import of steam should be required. Some of these differences may bedue to the fact that our steam system and heat integration are not fully optimised. Neverthelesssuch large differences are somewhat surprising.
4.1.1 Exergy analysisExergies of material and heat streamsThe subroutine EXERCOM Version 2 (licensed from Jacobs Comprimo) was used togetherwith the Aspen Plus flowsheet models to generate exergy values for all the material streams.These exergy values are given together with the heat and material balances in Appendices D andF. However, EXERCOM does not provide exergy values for the heat streams. In theEXERCOM User Manual it is recommended to calculate such exergy values from thecorresponding enthalpies (heat duties) by use of Carnot factors. This is unambiguous only incases where heat is derived from a material stream under isothermal conditions (e.g.condensation of steam in a reboiler). However in general the material stream will change intemperature (e.g. a process stream in a heat exchanger) in which case the use of Carnot factormust be based essentially on some approximation for the average temperature (unless the entireenthalpy-temperature profile of the stream would be available, which is not the case with theAspen Plus output). To avoid the use of approximations in such cases, we opted for acalculation based on a simple exergy balance for the unit in question, by adopting theconvention that the internal exergy loss in the unit is zero. This is illustrated for the case of acooler in Figure 4.2.

ECN-I--01-003 19
In effect, any internal exergy loss in this unit is assigned to the heat stream and will beultimately be accounted for as part of the exergy loss at the point where the heat streamencounters another unit (in this case a heater) or crosses a system boundary (see below).Although this convention is obviously not realistic, this lack of realism has no effect on the finalresults – it is a convenient means of ‘book-keeping’ the exergy flows without any loss ofaccuracy.
Exergy losses at system boundariesThe internal exergy loss within any defined system can be calculated as the sum of the exergyflows into the system minus the sum of the exergy flows out of the system. Boundaries betweensystems present no problem for material flows but care must be taken with heat flows. This isbecause the heat is usually generated in one system at a high temperature and used in anothersystem at a lower temperature. There is then an exergy loss associated with this temperaturedecrease which is not accounted for in either system separately. (This is true independent ofwhich of the methods mentioned above is used to calculate the exergies of the heat flows). It istherefore necessary to check all system boundaries for exergy losses associated with heat flows.This is illustrated in Figure 4.3.
E(in) E(out)
E(heat) = E(in) - E(out)
material stream material stream
Figure 4.2 Calculation of the exergy of a heat flow
E1(in) E1(out)
E1(heat) = E1(in) - E1(out)
material stream material stream
E2(in) E2(out)
material stream material stream
E2(heat) = E2(out) - E2(in)
exergy loss = E1(heat) - E2(heat)system boundary
Figure 4.3 Calculation of exergy losses at system boundaries

20 ECN-I--01-003
We see that in this case the exergies of the heat flows in each system have been calculated asmentioned above, by conventionally assuming that internal energy losses in the units concerned(cooler and heater) are zero. All exergy loss is then calculated at the point where the heat flowcrosses the system boundary. At first sight it may seem to be a disadvantage of this approachthat no attempt is made to calculate the distribution of this exergy loss between the cooler andthe heater. In physical reality however, the cooler/heater combination must be a single heatexchanger and so it is actually quite realistic just to calculate a single exergy loss. The apparentsplit between cooler and heater is actually just an artifact of the process flowsheet model. If theabove case had been considered as one system, and modelled as a single heat exchanger, thenthe internal exergy loss of the heat exchanger would have been calculated (exergies of materialflows in minus flows out) exactly equal to the loss calculated here.
Cumulative exergy losses for electricity and steam importsThe procedures described above enable the exergy losses to be calculated for the overall system(process plus steam system). In the present context, most of the input streams (natural gas, CO2,water) can be considered to be primary resources. This means that we neglect any cumulativeexergy loss which may have been incurred in producing these streams from the environment.However, for the electricity and steam imports, this cumulative exergy loss is not negligible,and should be included in the exergy analysis. This is equivalent to extending the systemboundaries to include the production of the electricity and steam from primary resources (e.g.natural gas, coal, or oil). This question was addressed in a previous project, and here we makeuse of the correlation derived in that work [2]:cumulative exergy loss = 1.32 * exergy output (electricity or steam).This correlation was based on co-generation of electricity and steam based on an oil-firedfurnace – it corresponds to an overall exergetic efficiency (output/input) of 43 %.
ResultsExergy losses were calculated for each of the main flowsheet sections, and for all the boundariesbetween sections. Details of the calculations are given in Appendix I. The results aresummarised in Table 4.1.
It can be seen that about 40 % of the exergy loss occurs in the reforming section, with a further7 % lost at its interface (A), which includes the recycle of heat from the flue-gas cooler. Theremaining 53 % is fairly evenly divided among the other sections. This result is not unexpectedbecause it is well known that steam reforming with a gas-fired furnace is exergetically veryinefficient.
The exergy losses could easily be calculated a lower agglomeration level (e.g. at unit operationlevel) in order to identify the main causes of the exergy losses more precisely. However such adetailed exergy analysis is beyond the scope of the current project.
The calculated total specific exergy loss of 10.8 GJ/t can be compared with the value of 14.3GJ/t which has been given for the Methanor plant in Delfzijl [12]. It is interesting that the modelcalculation predicts a lower total loss than the literature value, despite the fact (mentionedabove) that the electricity and LP steam imports may have been overestimated in the model.This may be because the modelled process uses CO2 in addition to natural gas as a feedstock,whereas the Methanor plant does not do this. Such a use of CO2 can be expected to improve theexergetic efficiency.

ECN-I--01-003 21
Table 4.1 Exergy losses for the conventional methanol processExergy losses Internal External Total Total
kW kW kW %
Section 1 reforming 67097 7052 74149 40,1Section 2 heat recovery 135 8556 8691 4,7Section 3 synthesis loop 12850 9150 22000 11,9Section 4 distillation 290 16694 16984 9,2Section 5 steam system 15358 2440 17798 9,6Section 6 steam system 2534 1077 3611 2,0Interface A 1 with 5,6 13078 0 13078 7,1Interface B 3 with 6 805 0 805 0,4Interface C 4 with 2,6,BL 3594 0 3594 1,9Import LP steam exergy 5187 kW 6847 0 6847 3,7Import electricity exergy 13160 kW 17371 0 17371 9,4
TOTALS 139959 44969 184928 100
Methanol production:mass flow kg/h 61809exergy of product kW 384176specific exergy of product kJ/kg methanol 22376
GJ/ton methanol 22,4
Specific exergy loss in process kJ/kg methanol 10771GJ/ton methanol 10,8
Relative exergy loss (exergy loss/exergy product) 0,4814
Efficiency (exergy product/exergy input) 0,6751
Exergy of feedstock:Natural gas kW 425478Carbon dioxide kW 3747Total kW 429225Exergy feedstock/exergy product 1,1173
Total specific exergy loss including feedstockGJ/ton methanol 33,1
Notes:• (Cumulative) exergy losses for imported LP steam and electricity are calculated using the
factor (exergy loss/exergy output) = 1.32 [2]. See further explanation in the text. They arehere classified as internal losses, but in fact they would be partly external (CW etc.)
• The total specific exergy loss ‘including feedstock’ is calculated by adding the specificexergy loss to the specific exergy of the product. This sum is equal to the total specificexergy input for the process.

22 ECN-I--01-003
4.1.2 Life-Cycle AssessmentThe ecological impact of the three different life stages of the conventional methanol plant willbe discussed separately.
Construction phaseThe materials needed for the construction of the conventional methanol plant are mainlyconcrete and steel. In [13] a detailed LCA-study has been performed on a hydrogen productionplant. The second column in Table 4.2 presents the material quantities for a 1.5 million Nm3/dayhydrogen plant. When these quantities are normalised to the capacity of the plant (about 210MW, HHV) the third column in Table 4.2 is calculated. Then these values are extrapolated to amethanol plant under the assumption that the two processes are to some extent similar and theplants, on a MW-basis, need the same amount of construction materials. The fourth columnshows the calculated quantities for a 434 MW (HHV) methanol plant. This capacity correspondsto 550 kton methanol per year.
Table 4.2 Material quantities for construction of a conventional methanol plantMaterial H2-plant
(ton)H2-plant(kg/MW)
Methanol plant(ton)
Concrete 12041 56736 24623Steel 3272 14872 6454Aluminium 27 123 53Iron 40 182 79
The environmental impacts of the materials needed for the construction of the methanol planthave been taken from the SimaPro database. Likewise this has been done for the energy use. Allconstruction materials are assumed to be transported over an average distance of 100 km to theconstruction site.
For the allocation of the construction phase of the plant to the production of methanol thefollowing is used. The production plant has a capacity of 550 kton methanol per year and a lifetime of 30 years. The production of 100 kton methanol (functional unit) has therefore anallocation factor of 0.00606.
The contribution of the construction phase to the environmental impact of the production of 100kton methanol amounts to 483 Ecopoints. The use of oxysteel has by far the largest contribution(about 90 %). Other materials, transport and operations hardly make any impact on the result.
Production phaseThe data concerning the energy use and product flows have been obtained from the Aspen Plusmodel. Data on emissions have been obtained from the SimaPro database.
The methanol synthesis catalyst is known to be cuprous oxide on ceramic pellets. The reformeruses a nickel catalyst. No specific information could be found about the quantity of catalysts norabout the regeneration processes. The amounts of catalyst have been calculated from theestimated sizes of the reactors. Generic data about catalyst regeneration processes (e.g. energyrequirement) have been taken from Ullmann’s Encyclopedia of Industrial Chemistry; howeverno information on emissions was available. The energy required for regeneration was found tohave a negligible environmental impact.
Table 4.3 presents the calculated Ecopoints for the production phase of the conventionalprocess. Subdivision has been made to allocate the contribution of the separate processes.Clearly the process-related emissions and the use of electricity constitute the largestcontributions. (However, as mentioned in section 4.1, the electricity import calculated from theAspen Plus model may be an over-estimate compared to an actual plant.)

ECN-I--01-003 23
Table 4.3 Ecological impact of the production phase of 100 kton methanol by the conventionalprocess
Process Ecological impact(kPt)
Share(%)
Emissions 31.8 47.7Electricity use (import) 34.0 50.9Heat use (LP steam import) 0.96 1.4Total 66.8 100
Disposal phaseIt is assumed that the used materials at the end of life of the methanol plant are processed withavailable recycling techniques. This recovery of materials has a beneficial effect whichoutweighs the impact of the transport, emissions, and energy use in this disposal phase. As withthe construction phase, an allocation factor of 0.00606 has been applied to convert the lifetimeproduction of methanol to 100 kton. Table 4.4 presents the results for the disposal phase.
Table 4.4 Ecological impact of the disposal phase of the conventional process responsible forthe production of 100 kton methanol
Process Ecological impact(Pt)
Transport 7.03Emissions and energy use 17.7Recycling and recovering -102Total -77
4.2 Photo-electrochemical processThis section describes both the exergy analysis and LCA on the PEC-reactor.
4.2.1 Exergy analysisOne could argue about the use of exergy analysis when solar energy is involved. Exergyanalysis is normally used to locate losses of primary energy in order to reduce these losses. Thisis particularly useful when fossil energy carriers play an important role. It seems only ofacademic interest to look at exergy losses when the abundant energy supply of the sun isinvolved. Nevertheless, an exergy analysis of the PEC-system is carried out for the sake ofcompleteness.
The exergy analysis is performed for the following reaction:
2 H2O + CO2 => CH3OH + 3/2 O2
The reaction is driven by solar energy. If an energetic efficiency of 5 % is assumed, a solarradiation of 100 W will result in 5 W of methanol. This efficiency is an reasonable number thatcould be obtained by these devices, see also [4]. Based on a higher heating value of 22670 kJ/kgmethanol this corresponds to 0.794 g/h, or 0.0248 mol/h. The mass balance becomes:
H2O in : 0.0496 mol/h = 0.893 g/hCO2 in : 0.0248 mol/h = 1.092 g/hCH3OH out : 0.0248 mol/h = 0.794 g/hO2 out : 0.0372 mol/h = 1.191 g/h

24 ECN-I--01-003
The incoming water stream is assumed to be at 20 ºC. The incoming CO2-stream and alloutgoing streams are assumed at 80 ºC. All streams are at atmospheric pressure and are assumedto consist of only one component. This leads to the following exergy values, based onEXERCOM. Petela in [14] has studied the exergy value of solar energy. Based on this theexergy of solar energy is equal to 0.9327 times its energy content.
H2O in : 0.0496 mol/h = 0.0124 WCO2 in : 0.0248 mol/h = 0.138 WCH3OH out : 0.0248 mol/h = 4.967 WO2 out : 0.0372 mol/h = 0.0424 WSolar energy : = 93.27 W
The total exergy loss or destruction equals (93.27 + 0.0124 + 0.138) – (4.967 + 0.0424) = 88.41W. In this calculation, the production of oxygen is considered to be a useful by-product. Thetotal loss corresponds to 401 GJ/t methanol, with a total exergy input of 424 GJ/t.
The exergetic efficiency defined as outgoing/incoming equals 5.4 %. If the efficiency is definedas the change in exergy caused by the chemical reaction divided by the incoming solar exergy,the efficiency becomes 5.2 %. So the difference between the two definitions is very small. Wesee that there is very little additional information gained by doing an exergy analysis comparedto the energy values.
4.2.2 Life Cycle AssessmentConstruction phaseThe construction of the photo-electrochemical reactor consists mainly of steel and polyethylenefor the housing of the device, see Table 4.5. Any wiring or infrastructure of the production sitehas not been taken into account. The presented data originates from internal ECN sources. It isbased on a solar irradiation of 1000 kWh/m2/yr and an efficiency of 5 %.
Table 4.5 Material quantities for the production of 1 ton methanol per year by a photo-electrochemical reactor
Part Material Quantity (kg)Support Stainless steel 1259Housing Polyethylene (PE) 1008Anode Titanium 11Photocatalyst Titanium dioxide 0.054Proton conductor Nafion 9Cathode Copper 22Electrocatalyst Zinc oxide 0.065
All construction materials are supplied by truck across an average distance of 100 kilometres. Inaddition, the reactors produced are transported by truck over a distance of 100 kilometres to theplace of destination. The manufacturing processes to construct the device from the materials(welding, extrusion, drying) have also been taken into account.
The functional unit of this study is set at a production of 100 kton of methanol. When a life timeof 20 years is assumed for the photo-electrochemical reactor, 5000 reactors of the size presentedin Table 4.5 are needed to produce this quantity of methanol. The ecological impact of theconstruction of these 5000 reactors is quite high and amounts to 101 kEcopoints.

ECN-I--01-003 25
Production phaseAs could be expected, the ecological benefit of the photo-electrochemical way of producingmethanol is achieved during its production phase. When in operation, the reactor converts CO2and water into oxygen and methanol. The reactor does not exhaust any harmful emissions nordoes it need any external energy input. There are avoided emissions because the conventionalproduction of oxygen is avoided. The total of these contribution amounts to –24.9 kiloEcopints
Disposal phaseFor the dismantling of the photo-electrochemical production system of methanol it is assumedthat conventional recycling techniques are used. This assures a reuse of a large part of thematerials. Transport necessary to take away the materials is taken into account. Table 4.6 givesan overview of the ecological impact during this phase.
Table 4.6 Ecological impact of the disposal phase of a photo-electrochemical reactorresponsible for the production of 100 kton of methanol
Process Ecopoints(Pt)
Transport 426Emissions and energy use 6700Recycling and recovering -19000Total -11874
4.3 ComparisonThree kinds of comparisons will be made in this chapter. First, the results of the exergy analysesfor both the conventional and the photo-electrochemical production are compared. Next, thesame will be done for the LCA-results of both routes. The last comparison is made between theresults of the exergy analysis and the LCA.
Exergy analysisThe total exergy loss for the conventional process was found to be 10.8 GJ/ton methanol, for atotal exergy input of 33.1 GJ/ton. This corresponds to an exergetic efficiency (exergyproduct/exergy input) of 68 %.
The total exergy loss for the photo-electrochemical methanol production is 401 GJ/tonmethanol, for a total exergy input of 424 GJ/ton. This corresponds to an exergetic efficiency(exergy product/exergy input) of 5 %. However 99.8 % of the exergy input is solar energy.
The first conclusion would be that the conventional process is by far more efficient with respectto the use of exergy. However, if one would not assign a exergy value to solar energy because itis free and abundant, the efficiency of the photo-electrochemical conversion would be fargreater than 100 %. Clearly, exergetic efficiency is not a very useful concept for systems thatinvolve solar energy.
Life Cycle AssessmentThe results of the LCA are separated into the three life stages construction, production, anddisposal. The comparison will be made accordingly.
Construction phaseFigure 4.4 presents the comparison of the production phase of the two routes. Clearly, theamount of materials needed for the construction of the photo-electrochemical reactor has a verylarge ecological impact compared to the conventional route.

26 ECN-I--01-003
Production phaseFigure 4.5 shows the same comparison for the production phase of both routes.
Figure 4.4 Comparison of the ecological impact of the construction phase of a plant producing100 kton methanol
Figure 4.5 Comparison of the ecological impact of the production phase of 100 kton methanol

ECN-I--01-003 27
Disposal phaseSince the SimaPro software does not provide for the option to show two disposal phases ofdifferent production routes in one figure, two figures are provided below. Figure 4.6 and Figure4.7 show the construction and disposal phases compared to each other. This gives an indicationof the amount of environmental benefit that is gained during recycling compared to the impactmade during construction.
Figure 4.6 Comparison of the ecological impact of the construction and disposal phases of theconventional methanol process
Figure 4.7 Comparison of the ecological impact of the construction and disposal phases ofthe photo-electrochemical methanol process

28 ECN-I--01-003
Total life cycleTable 4.7 below shows the comparison for the total life cycle, including construction,production, and disposal phase.
Table 4.7 Comparison of the total life cycle ecological impact of both methanol productionprocesses
Conventional process Photo-electrochemical reactor(Pt) % (Pt) %
Construction phase 483 0.7 101000 157.3Production phasee 66800 99.4 -24900 -38.8Disposal phase -77 -0.1 -11874 -18.5Total impact 67206 100 64226 100
This leads to the conclusion that based on the present information the photo-electrochemicalproduction of methanol has a comparable environmental impact over its life cycle compared tothe conventional process. In other words, the ecological pay-back time of this process equals itslifetime. This could of course improve if the efficiency of the reactor increases and therefore theamount of materials needed decreases. In addition, other materials can be considered for theconstruction of specifically the support. On the other hand, the analysis of the PEC reactor doesnot yet take into account all the peripheral systems (infrastructure) which will finally berequired for a commercial plant.
Exergy versus LCATraditionally, an exergy analysis is restricted to the production phase of a process, while anLCA often extends its system boundaries to include the construction/disposal phases as well.For the conventional methanol process, the LCA is anyway dominated by the production phase,so the difference has no significance in practice. It is likely that the same is true for bulkchemicals processes in general. However, for the PEC process, the LCA highlights the key roleof the construction phase which the conventional exergy analysis cannot detect. This wouldprobably also be true for other novel processes driven by solar energy.
In principle, there is no reason why an exergy analysis could not be extended to include theconstruction/disposal phases. In a way, this is already done implicitly as part of the LCA,insofar as this is concerned with the calculation of the primary energy use.
In our previous work comparing two conventional production routes for MIBK [2], we noticed arough correlation between exergy losses and environmental impact. We suspected that such acorrelation would apply to many chemical processes, since the total environmental impact willoften result mainly from the use of primary energy in the production phase. However, thecurrent work illustrates the fact that this correlation is not valid for processes powered by solarenergy. In such processes there can be large exergy losses without environmental consequencesin the production phase.
Nevertheless there may still be some less direct correlation. The low exergetic efficiency of thePEC process can perhaps be correlated with the low material efficiency (requirement for a largereactor) which in turn is related to the large environmental impact of the construction phase. Sowe could conclude that it never makes sense to squander exergy, even free exergy.
For the conventional process, the import of electricity contributes 9 % to the exergy loss, but51 % to the environmental impact. However, this difference may be at least partly due to a lackof consistency between the calculation methods. Whereas the exergy analysis assumed that theelectricity is produced on site (together with steam) by an oil-fired furnace, the LCA assumedthat electricity is taken from the grid (average European electricity park). The latter would havea higher impact due to the contribution of coal-fired power stations.

ECN-I--01-003 29
5. CONCLUSIONS AND RECOMMENDATIONS
5.1 Process routes• For the conventional methanol process, the construction/disposal phases make a negligible
contribution to the total environmental impact, which is dominated by the production phase.It seems likely that this is true for bulk chemical processes in general.
• For the PEC methanol process, the production and disposal phases are beneficial to theenvironment, and the total (adverse) environmental impact is dominated by the constructionphase. It seems likely that this would also be true for other novel processes based on sunenergy.
• Although the PEC process has a much lower exergetic efficiency than the conventionalprocess, this observation is of little direct consequence because exergy from the sun is freeand abundant.
• The rough correlation between exergy losses and environmental impact, which waspreviously observed for conventional processes [2], does not apply to processes powered bysolar energy. In such processes there can be large exergy losses without environmentalconsequences.
• Overall the PEC process has an environmental impact comparable to that of the conventionalprocess. This is not due to the low exergetic efficiency as such, but rather to the materials ofconstruction.
• To improve the PEC process, priority should in principle be given to optimising the materialsof construction, rather than improving the exergetic efficiency as such.
• Nevertheless, insofar as the large size of the PEC reactor is related to its low exergeticefficiency, we can still conclude that it makes no sense to squander exergy, even free exergy.
• The energy required for catalyst regeneration in the conventional methanol process makes nosignificant contribution to the environmental impact of the process. However, in the absenceof more information (especially regarding emissions), we cannot yet extend this result to theentire use of the catalysts in the process. We can certainly not yet draw any conclusions forcatalytic processes in general.
5.2 MethodologyA considerable effort is required to perform an exergy analysis and an LCA on a chemicalprocess, when starting from the process flowsheet:• Even when (as in the present work) a complete basis for an Aspen Plus model of the process
itself is available, attention must also be given to modelling of the steam system, and the heatintegration, before even an approximate overall steam/electricity balance is obtained.
• Regarding the exergy analysis, the program EXERCOM has a limited functionality. Exergiesof material streams are calculated, but exergies of heat streams, exergy losses in(sub)systems, and exergetic efficiencies must all be calculated manually.
In view of this, we conclude that such a detailed modelling approach is probably only justifiedwhen it is desired to identify the specific causes of the exergy losses or environmental impactsin a process. If we only wish to calculate overall values for the process, then it is preferable toadopt a black box approach at the highest possible level of agglomeration – however thisapproach requires data on the overall process performance which may not always be readilyavailable.
LCA is a useful tool to compare novel processes with their conventional counterparts. For novelprocesses based on solar energy (and probably other renewable energy sources) LCA can revealthe potentially key contribution made by the construction/demolition phases to the totalenvironmental impact. Such observations can help guide process development.

30 ECN-I--01-003
Exergetic efficiency as normally defined (based on the production phase only) is not a usefulconcept when comparing processes driven by solar energy with their conventional counterparts.To be of more use, the exergy analysis would have to be extended to include (like the LCA) theconstruction/demolition phases.
5.3 RecommendationsDuring the course of this project, ECN management has decided that the subject of eco-efficiency (of industrial processes) will not be further developed as an R&D topic in its ownright. Accordingly, the above-mentioned long-term objective, to develop a new methodology,will not be pursued. However, in view of the encouraging results obtained in this and previousstudies, it is recommended to:• apply the existing techniques on an ad-hoc basis in support of other technological
developments,• continue with a minimal gatekeeping activity to maintain awareness of developments in this
field, especially of commercial software products and their applications.

ECN-I--01-003 31
REFERENCES
[1] Spoelstra, S.: Eco-efficiency van een chemische warmtepom., ECN-I--98-048. ECN,Petten, October 1998.
[2] Spoelstra, S., and J.A. Hugill: A comparison of the eco-efficiency of two productionroutes for MIBK. ECN-CX--99-020. ECN, Petten, February 1999.
[3] Hugill, J.A.: Applications of syngas. ECN-CX--00-057. ECN, Petten, May 2000.[4] Spoelstra, S.: Techo-economische beoordeling van een fotoelektrochemische reactor.
ECN-I--01-001. ECN, Petten, Januari 2001.[5] Szargut, J., D.R. Morris, and F.R. Steward: Exergy analysis of thermal, chemical en
metallurgical processes. 1988, New York: Hemisphere Publishing Corporation.[6] Heijungs, R.: Milieugerichte levenscyclusanalyses van produkten - Achtergronden,
NOH 9254. CML, Leiden, 1992.[7] Heijungs, R.: Milieugerichte levenscyclusanalyses van produkten - Handleiding, NOH
9253. CML, Leiden, 1992.[8] PRé Consultants B.V.: SimaPro 4 User Manual. PRé Consultants B.V, Amersfoort,
November 1997.[9] PRé Consultants B.V.: SimaPro 4 Database Manual. PRé Consultants B.V,
Amersfoort, November 1997.[10] Anonymous: Introduction to Aspen Plus: Course Notes. Aspen Technology Inc., Jan
1999.[11] Anonymous. Integrated Low Pressure Methanol Process. Lurgi Information Brochure,
Frankfurt, December 1998.[12] Struker, A. and K. Blok: NEEDIS Sectorstudie Organische Chemie. NDS-95-001.
Ecofys, Utrecht, December 1995.[13] Spath, P.L. and M.K. Mann: Life Cycle Assessment of Hydrogen Production via Natural
Gas Reforming. NREL/TP-570-27637. NREL, Golden, August 2000.[14] Petela, R.: Exergy of heat radiation. Journal of Heat Transfer, 1964. 86: p. 187-192.[15] Goedkoop, M.: Eco-indicator-95, Eindrapport. NOH-9514. NOVEM/RIVM, Utrecht,
1995.
GLOSSARY OF SYMBOLS AND ABBREVIATIONS
E exergyp0 reference pressure (for exergy calculation)T0 reference temperature (for exergy calculation)
BFW boiler feed waterBL battery limits (system boundary of entire site)CW cooling waterHHV higher heating valueHP high pressure (steam)LCA Life Cycle AnalysisLP low pressure (steam)MIBK methylisobutylketoneMP medium pressure (steam)MTBE methyltertiarybutyletherNG natural gasPEC photo-electrochemicalPt eco-pointsWBCSD World Business Council for Sustainable Development

32 ECN-I--01-003

ECN-I--01-003 33
APPENDIX A: ECO-INDICATOR ‘95
The description of the eco-indicator ’95 method below is closely based on a CD-ROM which isdistributed by PRé Consultants B.V. More information can be found in [15].
After the inventory and classification phases have been completed, the environmental effects oftwo products can be compared. The results however prove to be difficult to interpret. Oneproduct or process causes e.g. more winter smog and acidification, but scores better on the otherenvironmental effects. Thus the LCA does not reveal which is the better product or process.What is missing is the mutual weighting of the effects. Although the LCA method describeshow this should be, this weighting is almost never carried out because of a lack of data. TheEco-indicator ‘95 has plugged this gap.
The first step in any further interpretation consists of comparing the scores with another value.PRe Consultants B.V. developed an inhabitant-equivalent for this, i.e. the environmental effectsthat an average European causes in a year. In LCA terminology this is called the normalisationstep. The values are normalised to the average European. The effects are now compared on thescale of inhabitant equivalents.Normalisation reveals which effects are large and which are small in relative terms. However, itdoes not yet say anything about the relative importance of the effects. A small effect can verywell be the most important. A weighting step is therefore necessary to achieve an overall result.All effects are now scaled to a certain measure of seriousness. In this example the seriousness isindicated in Eco-indicator points.
The problem, of course, lies in determining the weighting factors. Much consideration has beengiven to setting up the Eco-indicator value. After detailed analysis of the options the so-calledDistance-to-Target principle was chosen for determining the weight factors. This principle hasalready been in use for some years in the Swiss Ecopoints weighting system. The underlyingpremise is that there is a correlation between the seriousness of an effect and the distancebetween the current level and the target level. Thus if acidification has to be reduced by a factorof 10 in order to achieve a sustainable society and smog by a factor of 5, then acidification isregarded as being twice as serious; the reduction factor is the weighting factor.
The term ‘target level’ still embodies a major problem. What is a good target level, and how cansuch a level be defined? The above-mentioned Swiss Ecopoints method uses political targetlevels from government policy papers. These levels are often defined on the basis of acompromise between feasibility (cost) and desirability.
For the Eco-indicator ’95 it was decided to define target levels that are independent of politicsand are based on scientific information. The problem then arises again that scientists havedifferent views on what constitutes a good target level. One of the reasons for this is thatdifferent environmental problems cause different types of damage. Smog, for example, resultsin health complaints, while acidification causes major damage to forests. To ensure that thetarget level for acidification is equivalent to that for smog a correlation must be established withthe damage caused by the effect. The premise is that the target level for each effect yieldsuniformly serious damage. The following damage levels are assumed to be equivalent:• The number of fatalities as a consequence of environmental effects. The level chosen as
acceptable is 1 fatality per million inhabitants per year.• The number of people who become ill as a consequence of environmental effects. This
refers in particular to winter and summer smog. The acceptable level set is that smogperiods should hardly ever occur again.
• Ecosystem degradation. A target level has been chosen at which ‘only’ 5% ecosystem

34 ECN-I--01-003
degradation will still occur over several decades.
Setting equivalents for these damage levels is a subjective choice that cannot be scientificallybased. It is therefore also possible to make different assumptions which could cause theweighting factors to change.
To establish a correlation between these damage levels and the effects a detailed study wascarried out of the actual state of the environment in Europe. The current status of each effectwas determined and by what degree a particular effect has to be reduced to reach the damagelevel defined for it. Much work has been carried out particularly by the Dutch National Institutefor Public Health and Environmental Hygiene (RIVM) in this field. Detailed maps of Europeare now available in which the environmental problems are shown in a high degree of detail.These data were used to determine the current level of an environmental problem and by whatfactor the problem must be reduced to reach an acceptable level. The table below lists theweighting factors and the criteria applied.
Environmental effect Weightingfactor
Criterion
Greenhouse effect 2.5 0.1°C rise every 10 years, 5% ecosystem degradationOzone layer depletion 100 Probability of 1 fatality per year per million
inhabitantsAcidification 10 5% ecosystem degradationEutrophication 5 Rivers and lakes, degradation of an unknown number
of aquatic ecosystems (5% degradation)Summer smog 2.5 Occurrence of smog periods, health complaints,
particularly amongst asthma patients and the elderly,prevention of agricultural damage
Winter smog 5 Occurrence of smog periods, health complaints,particularly amongst asthma patients and the elderly
Pesticides 25 5% ecosystem degradationAirborne heavy metals 5 Lead content in children's blood, reduced life
expectancy and learning performance in an unknownnumber of people
Waterborne heavy metals 5 Cadmium content in rivers, ultimately also impacts onpeople (see airborne)
Carcinogenic substances 10 Probability of 1 fatality per year per million people
This table reveals that high priority must be given to limiting substances causing ozone layerdamage and the use of pesticides. The latter is becoming a very serious problem in theNetherlands in particular. Furthermore, a great deal of consideration must be given to thediffusion of acidifying and carcinogenic substances.
The weighted environmental effects can now be added to obtain one single value: the eco-indicator. The figure below shows the weighting method in a schematic way.

ECN-I--01-003 35
Effect
COSO
Pb
Greenhouse effect
Ozone layer depl.
Eutrophication
Winter smog
CFC
Health
Fatalities
Ecosystem
Impact
Heavy metals
Pesticides
Carcinogenics
Summer smog
impairment
impairment
Acidification
Valuation
Subjective
assessment
Damage
damage
PAH
DDTVOC
NO
Dust
Cd
P
Eco-indicatorvalue
Result
22x
It is apparent from the table that a number of effects that are generally regarded asenvironmental problems have not been included. The following reasons can be advanced for theomission of a number of effects:• Toxic substances that are only a problem in the workplace
Many substances are only harmful if they occur above a certain concentration. Such harmfulconcentrations can occur relatively easily in the workplace, while the concentration in theoutside atmosphere often remains very low and well below the damage threshold. Thishappens because the substances are generally greatly diluted and because many substancesdisappear from the atmosphere because of natural decomposition processes. Only substancesthat actually occur in harmful concentrations in the atmosphere are included in the Eco-indicator, while the rest are disregarded. This means that a product with a low Eco-indicatorscore can still cause poor working conditions because substances are released that areharmful locally.
• Exhaustion (depletion) of raw materialsIf a product made of very rare raw materials is used this rarity is not expressed in theindicator; after all, the fact that a substance is rare does not cause any damage to health. Theemissions arising from extraction of the raw materials are included and are usually extensivebecause ever lower-grade ores have to be used. Incidentally, the term ‘exhaustion’ is verydifficult to define. Alternatives are available for most raw materials, and recycling couldenable raw materials to remain in circulation for much longer. In fact minerals neverdisappear from the Earth; at worst they are diffused in an unfortunate manner.
• WasteThe fact that waste occupies space is not particularly important in environmental termsbecause the amount of ecosystem lost to the mountains of waste is relatively small comparedwith the damage to ecosystems caused, for example, by acidification. However, thesubstances released by waste (heavy metals, or CO2 on incineration) are very important.These latter effects are included in the indicator, but the quantity of waste in itself is not partof the assessment process.
• Other environmental effectsThere are a number of local environmental effects which are recognised as having an effecton our society but which are not included in the eco-indicator. Examples of this are thethermal pollution of surface water, the occupation of space, the emission of foul-smellinggases, noise, and the emission of radiation.
As a result of these differences the Eco-indicator can be seen as an indicator of emissions, andraw materials depletion and the use of space by waste must be evaluated separately at present.

36 ECN-I--01-003

ECN-I--01-003 37
APPENDIX B: CONVENTIONAL PROCESS: FLOWSHEETS
Section 1: Reforming (without furnace)
CO 2CO M P
CO 2 CO M PCO 2
KN O CKO U T
CH 4CO M P
N ATG AS CO M PN G
SATU R ATE
4
CIR CH 2O
SATG AS
R ECYCH 2O
MIX E R
M 1
MIX E R
M 2
M KU PST 12
FEED H TR
R EFFEED
R EFO R M ER
H EATQ
BO ILER
H EATH 2O
S19S15MIXER
M IX3
S28
H EATN H 2O
N EW H 2O

38 ECN-I--01-003
Section 1A: Reforming furnace
FU R N ACE
FU EL
H O TAIR
PU R G E1
PU R G E2
FLU EG AS
H EATQ
CO O L5
FLU EG AS2
H EATAIR
AIR

ECN-I--01-003 39
Section 2: Heat recovery
BO ILER
BO ILER
S2
CO OL1
S3
CO OL2
S4 S5
CO OL3
CO OL4
S7
S8
FL1
S11
FL2
S10
FL3
S9
S12
SYN CO M P
TO LOO P
MIXER
B10S13

40 ECN-I--01-003
Section 3: Methanol synthesis
M I XER
M IX1
TO LO O P
S27
S1
M EO H R XR
S16
E121
S17
S18
E122
S20
S26
S21
FSPLI TSPLIT1
S30
CIR C
S25
E223
S22
E124
S23
FL4
S24
FL5
F S P L IT SPLIT2
PU R G E1
MIX E R M IX2
FL5
PU R G E2
CR U D E

ECN-I--01-003 41
Section 4: Distillation
TO PPIN G TO PFEED
SECPU R G E
LTEN D S
R EFIN E
MIX E R
M IX4
M KW ATER
CR U D E
R EFIN IN G
BTM S
LIQ PU R G E
PR O D U CT
FU SELO IL

42 ECN-I--01-003

ECN-I--01-003 43
APPENDIX C: CONVENTIONAL PROCESS: MODELLING OF THEWATER RECYCLE LOOP
Section 1 of the process flowsheet (the reformer section) contains two input water streams(CIRCH2O and NEWH2O) and one output water stream (S15). In reality the stream S15 isrecycled back to CIRCH2O, but this recycle loop has not been modelled in Aspen Plus. Thiswas because addition of another recycle loop to such a flowsheet (which already containsseveral recycle loops) would lead to severe computational (convergence) problems for theAspen Plus model. Instead of a rigorous Aspen Plus calculation, an approximate procedure wasused whereby the flow of NEWH2O (the pure water make-up stream) was adjusted manually sothat the mass flows of CIRCH2O and S15 were equal. This procedure leads to a mismatch in thecompositions, because whereas CIRCH2O is assumed in the Aspen Plus model to be a purewater stream, S15 is calculated by the model to contain small quantities of dissolved gases(CH4, CO2, …).
(In reality some of this gas might be deliberately flashed off before recycling the water, but thispossibility has not been further considered here.) A more rigorous approach, including recyclingof the dissolved gases, would introduce small changes in the entire flowsheet, with the overallresult of a slightly higher methanol production. However since such changes would be at thelevel of less than 1%, they are of no practical consequence, and the approximate procedure usedhere is considered to be adequate.
In the exergy analysis, the exergies of the above-mentioned streams are included in the exergybalance, in order to ensure a consistent calculation of the internal exergy losses. However theexergy of stream S15 is not counted as an external exergy loss, because in reality this exergy isrecycled.

44 ECN-I--01-003


50 ECN-I--01-003

ECN-I--01-003 51
APPENDIX E: CONVENTIONAL PROCESS: STEAM SYSTEMFLOWSHEETS
Section 5: Steam system part 1
BOILER
BOILER
BFW S2
HPSTEAM
HPFLASH
HPCOND
HPVAPHPTURB
M PSTEAM
M PFLASH
M PVAP
M PCO ND
F S P L IT
SPLIT
M PVAP3
M PVAP2
M KUPST
M PHEAT
M PCO ND 2
M PTU RB
LPSTEAM
LPFLASH
LPCON D
LPVAP
LPH EAT
LPCON D2

52 ECN-I--01-003
Section 5: Steam system part 2
E121
S17
BFW
S18
LPSTEAM
M EOH R XR
LPSTEAM 2
LPH EAT
LPCO ND


ECN-I--01-003 55
APPENDIX G: CONVENTIONAL PROCESS: HEAT INTEGRATIONOF SECTION 1
There are four heaters in section 1 (reforming):• make-up water heater,• recycle water heater,• air heater,• feed heater.
The heating requirements can be partly met by use of heat recovered by the flue gas cooler,however this is not sufficient and must be supplemented by MP and LP steam from the steamsystem. The way this heat integration has been done is summarised in the Table.
Heat integration of section 1
Flue gas cooler MP steam LP steam900 – 150 oC 226 – 200 oC 140 –120 oC
Make-up water heater 20 - 86,8 oC 3326Make-up water heater 86,8 - 148 oC 3142Recycle water heater 148 - 195 oC 18651 7641Air heater 20 - 120 oC 6892Air heater 120 - 366 oC 16957Feed heater 204 - 560 oC 31509
TOTALS (kW) 67117 10783 10218
The design philosophy behind this integration takes into account the temperature levels of thevarious heat sources/sinks, as follows. Since the flue gas cooler provides heat at the highesttemperature level, this heat should be used at the highest possible level (feed heater, air heater,recycle water heater). However the needs of the air heater below 120 oC can be more efficientlymet by use of LP steam. On this basis the needs of the feed heater and air heater are completelymet, however the needs of the recycle water heater are only partly met. This shortfall must besupplied by MP steam. The needs of the make-up water heater can be supplied by a mixture ofMP and LP steam (N.B. The transition temperature of 86.8 oC applied here has been determinedby the availability of MP steam from the steam system, otherwise 120 oC would have been amore logical choice – in other words we are using a higher MP/LP steam ratio than reallyrequired for this heater).
This straightforward design approach avoids pinch points and results in a feasible, practical andreasonably efficient design. A more optimum design could probably be made by use of arigorous pinch analysis, however this is beyond the scope of the current work.

56 ECN-I--01-003

ECN-I--01-003 57
APPENDIX H: CONVENTIONAL PROCESS: CALCULATION OFELECTRICITY AND STEAM IMPORTS
Electricity balance kW
Required sect.1 CO2 compressor 2511sect.1 NG compressor 396sect.2 syngas compressor 13378sect.3 recycle compressor 2255sect.4 0
TOTAL 18540
Generated sect.5 HP turbine 4349sect.5 MP turbine 1031sect.6 0
TOTAL 5380
IMPORT 13160
LP steam balance EnthalpykW
Required sect.1 heaters 10218sect.2 0sect.3 0sect.4 refining reboiler 39821
TOTAL 50039
Generated sect.5 to sect. 1 8331sect.6 to sect. 1 1887sect.6 to sect. 4 21145
TOTAL 31363
IMPORT to sect. 4 18676

58 ECN-I--01-003

ECN-I--01-003 59
APPENDIX I: CONVENTIONAL PROCESS: EXERGY ANALYSIS
Section 1: ReformingFlow from/to Flow Temp. Pres Enthalpy Exergy Reference
kg/h deg.C bar kW kW App.,Stream no.STREAMS INNatural gas BL 29952 26 21,7 425478 NATGASCarbon dioxide BL 24823 43 1,4 3747 CO2Make up water BL 39654 20 27,5 587 NEWH2OMake up steam from MP steam (sect.5) 45267 226 26 13180 MKUPSTAir BL to furnace 240000 20 1 224 AIRFuel (natural gas) BL to furnace 7004 26 21,7 101548 FUELFuel recycle from section 3 8489 45 75,6 78615 PURGE1Fuel recycle from section 3 2477 46 5 7502 PURGE2Water recycle from S15 410000 195 27,5 25219 CIRCH2O
STREAMS OUTSyngas to Section 2 139696 860 18 552113 BOILERFluegas from furnace to atmosphere 257970 150 1 7052 FLUEGAS2Condensate 0 0 KNOCKOUTWater recycle to CIRCH2O 410000 26835 S15
HEAT INMake up water heater from LP/MP steam 20 - 148 6468 1018 HEATNH2ORecycle water heater from MP steam/flue gas 148 -195 26292 8653 HEATH2OAir heater from LP steam/flue gas 20 - 366 23849 7885 HEATAIRFeed heater from flue gas 204- 560 31509 16854 FEEDHTR
HEAT OUTFlue gas cooler to heaters 900- 150 67117 40320 COOL5
ELECTRICITY IN to CO2 compressor 2511 2511 COMPCO2to NG compressor 396 396 CH4COMP
ELECTRICITY OUT 0 0
NET FLOWS (IN-OUT)
0 67097 calc.
EXERGY LOSSESInternal 67097External fluegas to atmosphere 7052Total 74149Notes:* Steam import is 10218 kW LP steam, 10783 kW MP steam, 21001 kW total* The external water recycle, stream out S15, stream in CIRCH2O, is not rigorously modelled (see App. C)* The furnace-reformer duty is 126138 kW* Exergies of heat flows in/out of units are calculated from: Exergy of heat flow in = exergy (material flow out) - exergy (material flow w in) Exergy of heat flow out = exergy (material flow in) - exergy (material flow out)

60 ECN-I--01-003
Section 2: Heat recovery
Flow from/to Flow Temp. Pres Enthalpy Exergy Referencekg/h deg.C bar kW kW Unit/Stream
STREAMS INSyngas from sect. 5 (BOILER) 139696 166 18 510624 S2
STREAMS OUTSyngas to section 3 86301 40 82.5 506284 TOLOOPCondensate to waste water treatment 53396 106 17 1411 S13
HEAT IN 0 0
HEAT OUTCooler to sect.4 (refining) 166 - 136 18188 5256 COOL1Cooler to sect. 4 (topping) 136 - 104 15233 3771 COOL2Cooler to CW 104 - 85 4867 955 COOL3Cooler to CW 85 - 40 5478 674 COOL4Syngas compressor to CW ? 13868 5516 SYNCOMP
ELECTRICITY IN syngas compressor 13378 13378 SYNCOMP
ELECTRICITY OUT 0 0
NET FLOWS (IN-OUT) -1 135 calc.
EXERGY LOSSESInternal flash vessels 135External condensate, CW 8556Total 8691
Notes:* The boiler is included in section 5 (steam system)* Exergies of heat flows in/out of units are calculated from: Exergy of heat flow in = exergy (material flow out) - exergy (material flow in) Exergy of heat flow out = exergy (material flow in) - exergy (material flow out)* All exergy losses in the 2 coolers and the compressor have been attributed to external losses with CW. In fact some of these losses are internal losses.

ECN-I--01-003 61
Section 3: Synthesis loop
Flow from/to Flow Temp. Pres Enthalpy Exergy Referencekg/h deg.C bar kW kW Unit/Stream
STREAMS INSyngas from section 2 86301 40 82,5 506284 TOLOOPprocess stream return from section 6 (E121) 315655 150 82,5 2674690 S18
STREAMS OUTprocess stream to section 6 (E121) 315655 240 82,5 2682600 S17Crude methanol to section 4 75348 46 5 390113 CRUDEFuel gas purge to section 1 (furnace) 8489 45 76 78615 PURGE1Fuel gas purge to section 1 (furnace) 2477 46 5 7502 PURGE2
HEAT IN 0
HEAT OUTSynthesis reactor to steam system 240 5726 2399 MEOHRXRAir cooler lost to air 123 - 60 39573 8230 E223Cooler to CW 60 - 45 6420 920 E124
ELECTRICITY IN recycle compressor 2255 2255 CIRC
ELECTRICITY OUT 0 0
NET FLOW (IN-OUT) -13 -68494 12850 calc.
EXERGY LOSSESInternal 12850External losses with air and CW 9150Total 22000
Notes:* The heat exchanger E121 is included in section 6* The exergy of the heat stream from the synthesis reactor has been calculated with the Carnot factor at 240 degC* Exergies of heat flows in/out of all other units are calculated from: Exergy of heat flow in = exergy (material flow out) - exergy (material flow in) Exergy of heat flow out = exergy (material flow in) - exergy (material flow out)* All exergy loss from the 2 coolers has been attributed to external losses with air and CW. In fact some of the loss is internal.

62 ECN-I--01-003
Section 4: Distillation
Flow from/to Flow Temp. Pres Enthalpy Exergy Referencekg/h deg.C bar kW kW Unit/Stream
STREAMS INCrude methanol from section 3 75348 46 5 390113 CRUDEMake-up water BL 10000 40 5 145 MKWATER
STREAMS OUTLight ends (CO2, methanol) to furnace? 1388 44 1 2700 LTENDSSecondary purge 12 44 1 71 SECPURGELiquid purge 1 75 1 6 LIQPURGEFusel oil 559 86 1 2891 FUSELOILBottoms (water) to river 21579 119 2 1812 BTMSProduct 61809 75 2 384176 PRODUCT
HEAT INTopping reboiler from sect.2 (COOL2) 86 15235 2588 TOPPINGRefining reboiler from sect.2 (COOL1) 119 18188 4360 REFININGRefining reboiler from LP steam
(sect.6 + import)119 39821 9545
HEAT OUTTopping condenser to CW < 44 11162 2133 TOPPINGRefining condenser to CW < 75 56367 12672 REFINING
ELECTRICITY IN 0
ELECTRICITY OUT 0
NET FLOW (IN-OUT) 0 290 calc.
EXERGY LOSSESInternal 290External purges, bottoms, CW 16694Total 16984
Notes:* The exergies of the heat streams to the reboilers are calculated by use of Carnot factors at the operating temperatures* The exergies of the heat streams from the condensers are calculated by exergy balances on the distillation columns; this implies that all exergy losses from the distillation columns have been attributed to external losses with CW from the condensers. In fact some of these losses are internal losses.* Light ends and fusel oil have been considered as useful by-products and do not contribute to the external exergy losses

ECN-I--01-003 63
Section 5: Steam system part 1
Flow from/to Flow Temp. Pres Enthalpy Exergy Referencekg/h deg.C bar kW kW Unit/Stream
STREAMS INBFW BL 88000 20 100 1510 BFWprocess stream from section 2 to BOILER 139696 860 18 552116 BOILER
STREAMS OUTHP flash condensate BL 430 310 100 63 HPCONDMP flash condensate BL 9302 226 26 732 MPCONDMP condensate BL 19065 200 26 1221 MPCOND2LP flash condensate BL 1009 140 3,5 37 LPCONDLP condensate BL 12927 120 3,5 387 LPCOND2Make up steam to section 1 45267 226 26 13180 MKUPSTprocess stream from BOILER to section 2 139696 166 18 510624 S2
HEAT IN 0 0
HEAT OUT to sect.1 (MP steam heat) 226 - 200 10783 4330 MPHEATERto sect.1 (LP steam heat) 140 - 120 8331 2314 LPHEATER
ELECTRICITY IN 0
ELECTRICITY OUT HP turbine 4349 4349 HPTURBMP turbine 1031 1031 MPTURB
NET FLOWS (IN-OUT) 0 -1 15358
EXERGY LOSSES:Internal 15358External condensates to BL 2440Total 17798
Notes:* This section includes the heat exchanger BOILER* Exergies of heat flows in/out of units are calculated from:
Exergy of heat flow in = exergy (material flow out) - exergy (material flow in) Exergy of heat flow out = exergy (material flow in) - exergy (material flow out)

64 ECN-I--01-003
Section 6: Steam system part 2
Flow from/to Flow Temp. Pres Enthalpy Exergy Referencekg/h deg.C bar kW kW Unit/Stream
STREAMS INBFW BL 36000 20 3,5 504 BFWprocess stream from section 3 to E121 315655 240 82,5 2682600 S17
STREAMS OUTCondensate BL 36000 120 3,5 1077 LPCONDprocess stream from E121 to section 3 315655 150 82,5 2674690 S18
HEAT INfrom synthesis reactor 140 5726 1594 MEOHRXR
HEAT OUTto sect. 1 (LP steam heat) 140 - 120 1887 524 LPHEATto sect. 4 (LP steam heat) 140 - 120 21145 5873 LPHEAT
ELECTRICITY IN 0 0
ELECTRICITY OUT 0 0
NET flows (IN - OUT) 0 2534 calc.
EXERGY LOSSES:Internal losses in E121 2534External condensate to BL 1077Total 3611
Notes:* This section includes the heat exchanger E121* Exergies of heat flows in/out of units are calculated from: Exergy of heat flow in = exergy (material flow out) - exergy (material flow in) Exergy of heat flow out = exergy (material flow in) - exergy (material flow out)

ECN-I--01-003 65
Interface A: Section 1 (reforming): external flue-gas heat recycle and interface
with Sections 5 and 6 (steam systems)
Flow from/to Temp. Enthalpy Exergy Referencedeg.C kW kW App.,Stream no.
HEAT INfrom sect. 1 (flue gas cooler) 900 - 150 67117 40320 COOL5from section 5 (MP steam) 226 - 200 10783 4330 MPHEATER
from section 5 (LP steam) 140 - 120 8331 2314 LPHEATERfrom section 6 (LP steam) 140 - 120 1887 524 LPHEAT
HEAT OUTTo sect. 1 (make up water heater) 20 - 148 6468 1018 HEATNH2OTo sect. 1 (recycle water heater) 148 -195 26292 8653 HEATH2OTo sect. 1 (air heater) 20 - 366 23849 7885 HEATAIRTo sect. 1 (feed heater) 204 - 560 31509 16854 FEEDHTR
NET FLOWS (IN-OUT) 0 13078
EXERGY LOSSESInternal 13078ExternalTotal 13078
Interface B: Interface between Section 3 (synthesis loop) and Section 6 (steam system)
Flow from/to Temp. Enthalpy Exergy Referencedeg.C kW kW App.,Stream no.
HEAT INFrom sect. 3 (synthesis reactor) 240 5726 2399 MEOHRXR
HEAT OUTto section 6 (LP steam generation) 140 5726 1594 MEOHRXR
NET FLOWS (IN-OUT) 0 805
EXERGY LOSSESInternal 805ExternalTotal 805

66 ECN-I--01-003
Interface C: Section 4 (distillation): interface with Section 2 (heat recovery),
Section 6 (steam system), and BL
Flow from/to Temp. Enthalpy Exergy Referencedeg.C kW kW App.,Stream no.
HEAT INfrom sect. 2 cooler 166 - 136 18188 5256 COOL1from sect. 2 cooler 136 - 104 15233 3771 COOL2from sect. 6 (LP steam) 140 - 120 21145 5873 LPHEATfrom BL (import steam) 140 - 120 18676 5187
HEAT OUTto sect. 4 (topping reboiler) 86 15235 2588 TOPPINGto sect. 4 (refining reboiler) 119 18188 4360 REFININGto sect. 4 (refining reboiler) 119 39821 9545
NET FLOWS (IN-OUT) -2 3594
EXERGY LOSSESInternal 3594ExternalTotal 3594
Note:The exergy of the import steam is calculated assuming the same exergy/enthalpy ratio asthe LP steam from section 6