a comparison of the effectiveness of two proprietary
TRANSCRIPT

Shannon, P. W., 2017. A comparison of the effectiveness as pastoral fertilisers of two proprietary phosphate products compared to
superphosphate. In: Science and policy: nutrient management challenges for the next generation. (Eds L. D. Currie and M. J.
Hedley). http://flrc.massey.ac.nz/publications.html. Occasional Report No. 30. Fertilizer and Lime Research Centre, Massey University,
Palmerston North, New Zealand. 13pp
1
A COMPARISON OF THE EFFECTIVENESS OF TWO
PROPRIETARY PHOSPHATE PRODUCTS COMPARED TO
SUPERPHOSPHATE AS PASTORAL FERTILISERS
P. W. Shannon
Shannon Agricultural Consulting
48 Tiki Road, RD 2, Te Awamutu
Email: [email protected]
Abstract
A field trial was established by Terracare Fertilisers Ltd on an Allophanic soil on the side of
Mount Pirongia in March 2009. This trial compared phosphorus applied to pasture at 20, 40,
80 and 120 kg/ha in three forms of fertiliser – conventional superphosphate, a fully-reverted
dicalcic product, DP65, and a proprietary product from Terracare, RePlenish, which contains
dicalcium phosphate as part of its composition.
The trial continued for three and a half years, until December 2012 during which time the
fertiliser treatments were re-applied twice giving a total of three applications.
Pasture was harvested whenever the ryegrass component of the sward reached the three-leaf
stage, and production (in terms of dry matter (DM) yield) was recorded for each plot.
The site was soil sampled (0-75mm) at the start of the trial, and then just before each re-
application of treatment fertilisers as well as on completion.
There were significant responses to both the rate and form of P fertiliser throughout the trial.
In the first year, RePlenish out-yielded both superphosphate and DP65, with the size of the
difference tending to increase from 4 to 7% over superphosphate as the rate of P applied
increased.
Year two results again showed that RePlenish treatments out-yielded superphosphate, while
DP65 was intermediate between the two. The RePlenish yield increases ranged from 9 to
20% between 20 and120 kg P/ha, while DP65 gave 6 to 9% increases, over superphosphate at
equivalent rates of P. RePlenish treatments again yielded more pasture growth in year 3, with
increases over those from superphosphate ranging from 6 to 12% between 20 and 120 kg
P/ha; DP65 gave yield increases of 4 to 8%.
Averaged over the duration of the trial, the annual yield for the control treatment was 8,450
kg DM/ha, while at 120 kg P/ha/year, superphosphate gave 11,010 kg DM/ha, RePlenish,
12,500 kg DM/ha and DP65, 11,680 kg DM/ha.
An economic analysis, based on “normal” P-rates of 20-40 kg P/ha showed that the marginal
cost of changing fertiliser to either alternative product from superphosphate was less than the
cost of providing extra feed from outside sources.
The pattern of soil Olsen-P tests differed between fertilisers. Superphosphate increased Olsen
P more than either DP65 or RePlenish, with test results on the 120 kg P/ha treatments
reaching 31 on the superphosphate 22 on the RePlenish, and 19 on the DP65, treatments.
DP65 at higher rates increased soil pH more than the other two forms of P. Along with this,

2
DP 65 also reduced the amount of exchangeable aluminium – which can be toxic to root
growth – in the soil whereas increasing rates of P as superphosphate increased Al levels
Introduction
Dicalcic fertilisers are made by reacting superphosphate with limestone to produce a fertiliser
which contains dicalcium phosphate (DCP) as opposed to the monocalcium phosphate (MCP)
found in superphosphate. These fertilisers have been made and sold in New Zealand for at
least 50 years.
Over time, the performance of dicalcic fertilisers has been claimed to be superior to
superphosphate. However, these claims are typically anecdotal, and such research in New
Zealand that has been done usually shows the performance of the two forms of P fertiliser to
be very similar (Edmeades, 2000). The data Edmeades reviewed showed that when compared
to fertilisers containing MCP, DCP fertilisers yielded between 10% less, to 21% more pasture
growth. The average yield-difference was close to zero, from which Edmeades (loc. cit.)
concluded that either form of P was as effective as the other.
Edmeades (2000) described two mechanisms by which dicalcium phosphate fertilisers could
be more effective than monocalcium phosphate P fertilisers; viz:
1. These products contain predominantly dicalcium phosphate (DCP) (CaHPO4), rather
than the more soluble monocalcium phosphate (MCP) (Ca(H2PO4)2) present in water-
soluble P (WSP) fertilisers. It is claimed that DCP is utilized more efficiently because
it better matches the plant's demand for phosphorus (P).
2. The dissolution of DCP produces alkali and thus less fertiliser P is "fixed" by reaction
with active soil Fe and Al oxides and less P is adsorbed onto the surface of soil
minerals. This also results in a more efficient source of P for plant growth:
Ca HPO4 + H2O = Ca2+
+ H2PO4- + OH
-
If either effect was operating for any of the trials reviewed, the outcome should have been
greater levels of production at equivalent rates of P applied. He concluded (Edmeades 2000)
that the data he examined provided little evidence for the operation of either of these effects,
citing evidence of other contributing factors, such as the liming effect of the DCP fertilisers
applied, which typically contained excess lime as well as the liming effect outlined in the
above reaction.
Overseas research (eg. Brennan and Bolland, 2005, on wheat rather than pasture) appears to
support the conclusions drawn in New Zealand. However, in a laboratory and greenhouse
study, Probert and Larsen (1970 a and b) found that while powdered DCP released P at a
similar rate to MCP, when granulated, the release-rate of P from DCP increased over time
relative to MCP such that, at 103 days post-application, DCP granules released P faster than
equivalent-sized MCP granules. All the results reported above (Edmeades 2000 and Brennan
and Bolland 2005) used powdered DCP as this was the form (especially in New Zealand) in
which the DCP fertilisers were supplied.
One of the disadvantages of the dicalcic fertilisers compared to superphosphate has been that,
as they contain less total P than superphosphate (typically 4% compared to 9%) and incur
extra costs in manufacture, the “on-ground” cost of these fertilisers in terms of equal amounts
of P applied, is higher. The higher transport and spreading costs associated with the need for
higher rates of material needed to supply the same amount of P also contribute to the cost
differential.
In addition to this, concerns about the safety of spreading powdered products by aircraft
prompted Terracare to change their manufacturing process to produce granulated product. All
3
the material used in trials sponsored by Terracare was therefore granulated, unlike that used
on the previous work.
In a bid to overcome the transport and spreading disadvantages, Terracare Fertilisers of Te
Awamutu formulated a proprietary product – “RePlenish” - containing 9% total P. This was
done by using materials other than superphosphate to provide the P in the final product.
Before launching the product, Terracare commissioned a glasshouse pot trial comparing the
RePlenish with superphosphate (SSP) and reactive phosphate rock (RPR). This trial
compared a control, and the three forms of fertiliser applied to supply 33, 66 and 99 kg P/ha.
This trial used a low P soil with a pH of 5.9 and showed that RePlenish produced more
ryegrass growth than either superphosphate or RPR (P W Shannon, pers com.). With the
yield from the top rate of RePlenish set at 100, the top rate of superphosphate produced a
yield of 72 and the top rate of RPR, a yield of 25. The control produced a yield rating of 15.
Also of note was that the rating advantage to RePlenish increased as the rate of P applied
increased.
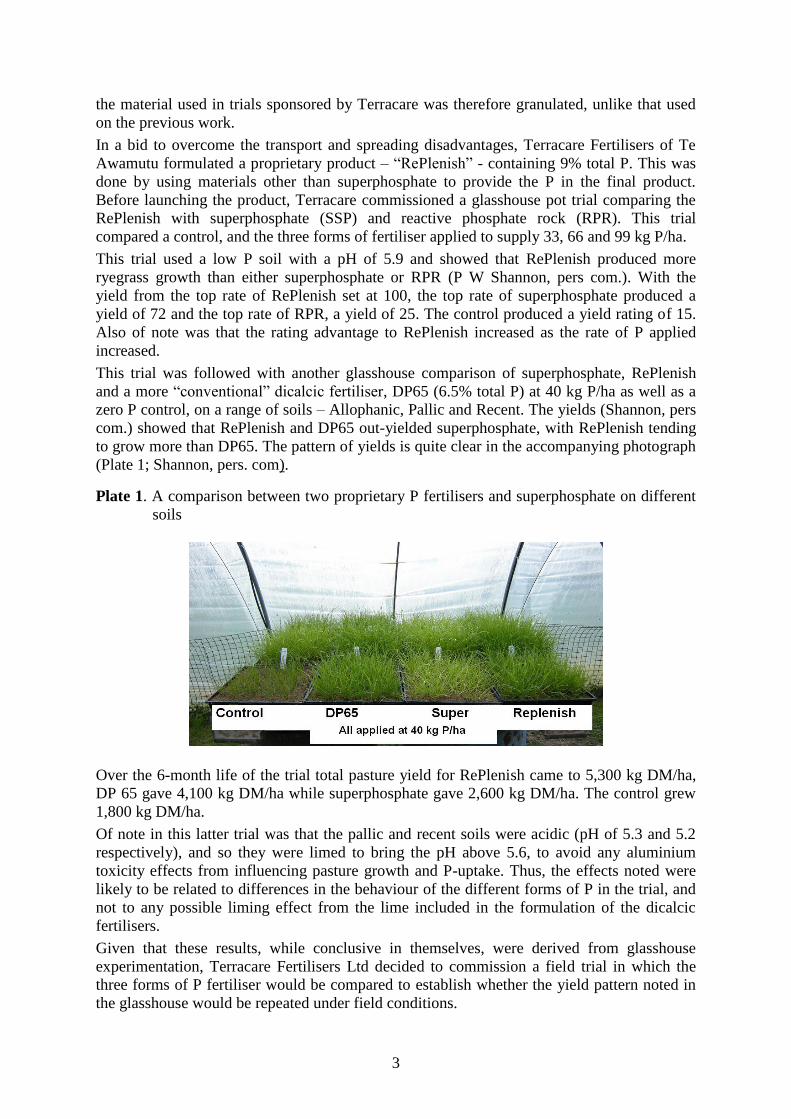
This trial was followed with another glasshouse comparison of superphosphate, RePlenish
and a more “conventional” dicalcic fertiliser, DP65 (6.5% total P) at 40 kg P/ha as well as a
zero P control, on a range of soils – Allophanic, Pallic and Recent. The yields (Shannon, pers
com.) showed that RePlenish and DP65 out-yielded superphosphate, with RePlenish tending
to grow more than DP65. The pattern of yields is quite clear in the accompanying photograph
(Plate 1; Shannon, pers. com).
Plate 1. A comparison between two proprietary P fertilisers and superphosphate on different
soils
Over the 6-month life of the trial total pasture yield for RePlenish came to 5,300 kg DM/ha,
DP 65 gave 4,100 kg DM/ha while superphosphate gave 2,600 kg DM/ha. The control grew
1,800 kg DM/ha.
Of note in this latter trial was that the pallic and recent soils were acidic (pH of 5.3 and 5.2
respectively), and so they were limed to bring the pH above 5.6, to avoid any aluminium
toxicity effects from influencing pasture growth and P-uptake. Thus, the effects noted were
likely to be related to differences in the behaviour of the different forms of P in the trial, and
not to any possible liming effect from the lime included in the formulation of the dicalcic
fertilisers.
Given that these results, while conclusive in themselves, were derived from glasshouse
experimentation, Terracare Fertilisers Ltd decided to commission a field trial in which the
three forms of P fertiliser would be compared to establish whether the yield pattern noted in
the glasshouse would be repeated under field conditions.
4
Materials and Methods
The site selected for this trial was located on the slopes of Mount Pirongia on a site accessed
via Sainsbury Road, at 38.0038 S, 175.1656 E at an altitude of 205m a.s.l. The topsoil is a
clay loam of Allophanic origin. Initial soil tests (0-75mm depth) showed that it had an
average soil pH of 5.9, while Olsen P levels averaged 14 and Resin P, 12. ASC levels were
high, averaging 99. Soil potassium levels were adequate with test levels of 10 (Quick Test
(QT) units). Sulphur reserves were high (Total S averaged 1336 mg/kg), while soil
exchangeable calcium (Ca) averaged 6 and magnesium (Mg), 19 QT units.
The trial site pasture was in a low-fertility state, as would be expected from the generally low
soil P levels. There was some ryegrass and white clover (origins unknown) present in the
sward; it was expected that, with the improvement in soil P levels resulting from the
application of fertilisers over the next three years, that pasture composition would improve.
The trial was laid out on the 11th
of November 2008, and trimmed off to a 3cm residual using
a rotary mower.
Fertilisers for the site were drawn from stocks held at Terracare (superphosphate) or
manufactured on a small granulation plant (DP65 and RePlenish) according to the
composition then in use by Terracare in the manufacture of commercial stocks. Sufficient
quantities were made or held to provide for the trial needs for three years. The fertilisers were
stored in plastic bins with sealed tops to avoid contamination.
Prior to application, representative samples were sent to Eurofins’ Hamilton laboratory to be
tested for total P, citric soluble and water soluble P, total Ca and total S. The amounts needed
for each plot for each treatment were calculated from the results obtained.
Treatments for the trial were all combinations of rates of 20, 40, 80 and 120 kg P/ha/yr and
forms of P fertiliser (RePlenish (RPL); DP65, and Superphosphate (SSP)), plus a zero P
control.
Each treatment was replicated 5 times, with the trial being laid out as a randomised complete
block design; this gave a site with 65 plots in five blocks of 13.
Fertilisers were applied on 13/03/2009, and the trial was harvested thereafter whenever the
ryegrass plants present on-site had reached the 3-leaf regrowth stage.
Treatment fertilisers were re-applied on 16/05/2010 and 09/08/2011 just after a trial harvest
was taken, so that fertilisers could be applied with little or no risk of being removed in
harvested material. Prior to each re-application, the stored fertilisers were re-sampled and re-
analysed to check that composition had not changed appreciably in storage. The results are
given in Table 1.
Soil samples were taken from each plot (0-75mm) immediately before the fertilisers were
applied, and again at the end of the trial on 23/12/12.
Basal fertilisers – potassium chloride (50% K) and borate 48 (15% B) were applied every 6
months to all treatments to provide 70 kg K and 1 kg B/ha.
At each harvest, two strips 460mm wide were cut from each plot using a rotary lawnmower,
and the herbage material collected was placed in a plastic bag and sealed. The remainder of
the pasture on each plot was then mowed off to the same height and the cut material was
spread over the plot.
The collected material from each plot was weighed, then a sub sample of approximately 100g
was withdrawn from the bulk material, placed into a paper bag and dried in a forced-draught
drying oven set at 100C for 24 hours, after which they were re-weighed.

5
Plot dry matter yield was then calculated using the percentage DM reading obtained from the
sub-sample.
In March 2011, it was decided to spray out the trial-site and re-sow with ryegrass (Lolium
perenne cv Samson) and white clover (Trifolium repens cv Kopu II) because the expected
improvement in pasture composition had not occurred. Accordingly, the site was sprayed on
28/03/2011with glyphosate (36% a.i.) diluted 100:1. On 01/04/2011 the area was mown off to
ca. 1 cm, after which it was scarified and the seed was broadcast over the site to achieve a
sowing rate of 20 kg of ryegrass and 3 kg of white clover/ha. The site was then rolled to
improve seed/soil contact.
Production harvests recommenced on 23/09/2011, a month after the third application of trial
fertilisers.
While some data analysis was carried out after each harvest, the main data analysis was
centred on annual yields, which were obtained from the summing of all harvests taken
between fertiliser applications.
An initial one-way analysis of variance (ANOVA) was carried out using the Data Analysis
PakTM
available with Microsoft Excel 2016. The results of this analysis were used to
determine the Least Significant Difference for the results. Next, the P-treatment plot yields
were analysed using the “Two-Way ANOVA – With Replication” facility in Excel. The
results of this analysis were used to determine if there were treatment responses to both the
rates of P applied, and to the forms of P fertiliser used (SSP, RePlenish and DP65) in the trial.
Finally, the results were plotted in a scatter-plot chart, and the curve-fitting function in Excel
was used to establish trend lines (yield vs P applied) for each form of P-fertiliser. A power
function (y= a*rateb) was selected as the basis for the curve-fitting as it gives a diminishing-
response curve which generally follows the way fertiliser responses change with increasing
rates of applied nutrient.
Soil test results were also analysed using the same protocol, to determine if there were
significant effects relating to both the rate of P applied and the form of P-fertiliser.
A significance level of p<0.05 was used as the determinant of a significant response; if the
significance level was greater than this, but less than 0.10, the effect noted is described as a
trend.
Results and Discussion
Fertiliser analysis
Fertiliser composition is shown in Table 1. The pattern of results was as expected –
superphosphate having most of its total P present in citric soluble form and a high proportion
as water soluble P, while in comparison RePlenish had a slightly lowered proportion of citric
soluble P and a markedly lower proportion of water-soluble P. DP65 showed a pattern typical
of “reverted superphosphates” with proportionately lower citric and very low water soluble, P
levels.
Pasture Yield In the first year (Figure 1) there was a strong response to increasing rates of phosphorus
applied (p<0.002), and a significant difference (p<0.02) between the RePlenish treatments
and those of superphosphate and DP65, which were not significantly different from one
another; indeed, the DP65 treatments tended to grow less than the superphosphate treatments.

6
Table 1. Results of trial fertiliser analyses throughout the trial
Analytes
Year
2009 2010 2011
Total P %
SSP 9.44 9.24 9.35
RPL 9.73 9.84 9.81
DP65 7.16 7.02 7.29
Citric-soluble P %
SSP 8.25 8.19 8.12
RPL 7.76 7.44 7.47
DP65 5.05 4.82 4.84
Water-soluble P %
SSP 7.36 7.75 7.41
RPL 4.79 4.2 3.95
DP65 0.41 0.26 0.28
Note: SSP = superphosphate; RPL = RePlenish.
The size of the difference between the RePlenish and Superphosphate treatments tended to
increase as the rate of P increased – the range being from 4 to 7% between 20 and 120 kg
P/ha. In contrast, DP65 yields tended to be around 98% of those measured for
superphosphate.
In the second year (Fig. 1), there was again a significant response to increasing rates of P
(p<0.006), and a significant difference to responses to different forms of P (p<0.009). This
year, DP65 tended to out-yield superphosphate, while RePlenish out yielded both
superphosphate and DP65. Again, the differences between amounts of pasture grown tended
to increase as the rate of P increased, with yields from RePlenish increasing from 9 to 20%
between 20 and 120 kg P/ha and 6 to 9% for DP65 compared to superphosphate at the same
rate of P applied.
By the third year (Fig 1), both RePlenish and DP65 tended to out-yield superphosphate
(p<0.10), with little difference in yields between RePlenish and DP65. There was still a
significant response to increasing rates of P (p<0.07).
The size of the difference in yields ranged from an 6% increase at 20 kg P/ha up to a 12%
increase over superphosphate at 120 kg P/ha/yr for RePlenish, and from 4% to 8% over
superphosphate for DP65 over the same range of P inputs.
Accumulated pasture yield over the three years (Fig 2) show that RePlenish out-yielded both
superphosphate and DP65 (p<0.03), while DP65 tended to give more growth than
superphosphate. There was also a strong response to increasing rates of P (p<0.003). The size
of the yield increase over superphosphate ranged from 7% at 20 kg P/ha to 13% at 120 kg
P/ha for RePlenish and from 2 to 5% for DP65 again with reference to superphosphate.
The trends displayed in these results imply that over time, both RePlenish and DP65 can
grow more pasture than superphosphate when applied at equivalent rates of P. Also, if the
results are compared between years, it shows that the differences between RePlenish and
DP65 and superphosphate tended to increase over time; for example, at 120 kg of P/ha/yr, the
advantage to RePlenish over superphosphate went from 7% at year 1 to 20% in year 2 and
12% in year 3. DP65 went from -2% in year 1 to an 8% increase in year 3.

7
Figure 1. The effect of rates and forms of P on pasture yield throughout the trial.
Figure 2. The effect of rates and forms of P on pasture yield – accumulated yield, years 1-3
This pattern of responses was like that implied in the P-release study from dicalcic P fertiliser
granules carried out by Ramakrishnan and Perrot (2004), who used a technique designed by
Perrot and Kear (2000) to leach P from different P fertilisers. A similar pattern of responses
could also be inferred from the results of Devine et al (1968), who found that granular
dicalcic phosphates initially released P more slowly than superphosphate, but, over time,
gave higher levels of available P in the soil than those from superphosphate.
The practical implications of these results are that both RePlenish and DP65 appear capable
of either (a) supporting higher rates of pasture growth than superphosphate at the same rate of
P applied or (b) supporting the same amount of pasture growth with less P than would be
needed from superphosphate. These results also indicate that one or both of the outcomes
stipulated by Edmeades (2000) as indicating that dicalcic P fertilisers were capable of out-
performing superphosphate, were being achieved.
Point (a) above is demonstrated in Table 2 which shows how the relative agronomic
efficiency (RAE) as defined in Bolan et al, (1990) varied over time through the trial. Apart
from year 1 for DP65, both RePlenish and DP65 had a RAE of greater than 1. Also, the RAE
tended to increase with time for both products, which indicates that the supply of plant-
available P was accumulating in the soil in a manner similar to that described by Devine et al
(1968).
24,000
26,000
28,000
30,000
32,000
34,000
36,000
38,000
40,000
0 20 40 60 80 100 120 140
Acc
um
ula
ted
3 y
r p
astu
re g
row
th (
kg D
M/h
a)
Rate of P (kg P/ha/yr)
Effect of rate and form of P applied on pasture growth -years 1-3
Control SSP
RPL DP65
SSP trendline RPL trendline
DP65 trendline LSD 0.05

8
Table 2. Changes in Relative Agronomic Effectiveness(RAE)* of RePlenish (RPL) and
DP65 with reference to Superphosphate(SSP) over the duration of the trial.
RPL DP65
Year 1 124 92
Year 2 181 137
Year 3 165 141
Years 1-3 152 119
Years 2-3 173 139
*These values are derived from the fitted trend lines rather than the raw data.
Point (b) is shown in Figure 3, which shows how the substitution-value between either
RePlenish or DP65 decreases as the target yield increases. This means that, under similar
conditions to those found on the current trial-site, where either RePlenish or DP65 is used,
less total P will need to be applied to achieve a given yield target than if superphosphate was
used. If this trend is found on other sites, it means that the risk of P-loss to waterways could
be reduced as less total P would be present in the soil.
A similar pattern of substitution values between superphosphate and RePlenish was found in
the initial glasshouse pot trial (P W Shannon, pers comm.)
Figure 3. The change in substitution-rate between superphosphate and RePlenish or DP65,
based on accumulated yield, years 1-3
Economic Effectiveness While the proprietary products produced higher pasture yields than superphosphate, the
production of these products adds further costs over those of making superphosphate. This
means that they cost more than superphosphate.
If the rate of P application is maintained, these results predict that changing fertilisers would
lead to higher rates of pasture growth and hence, an increase in feed supply. Another way to
increase stock feed supplies is to purchase additional feed from off-farm.
For the purposes of this paper, a cost-comparison was made using a farm running 12.5 rsu/ha
and growing (at 65% pasture utilisation) 10,490 kg DM/ha/yr., with a maintenance fertiliser
requirement of 20 kg P/ha/yr. If the fertiliser was to be changed to either RePlenish or DP65,
the trial results predict that production would be increased as outlined in Table 3.
The outcome of the comparison shows that the marginal change in costs to provide the same
increase in feed supply would be lower where the fertiliser policy was changed rather than by
using imported feed.
0.0
0.2
0.4
0.6
0.8
1.0
1.2
25,000 26,000 27,000 28,000 29,000 30,000 31,000 32,000 33,000 34,000
Sub
situ
tio
n v
alu
e
Pasture yield over yrs 1-3 (kg DM/ha)
Replenish vs SSP
DP65 vs SSP
9
Table 3. A comparison of the difference between extra costs in applying RePlenish or DP65,
and purchasing supplementary feed to supply the same increase in feed supply.
Superphosphate RePlenish DP65
Pasture growth (kg DM/ha/yr) 10,490 11,180 10,740
Yield increase (kg DM/ha/yr)
690 250
Fertiliser rate (kg/ha) to supply 20 kg P/ha1
220 220 310
Fertiliser cost (applied) ($/ha)2
$99 $134 $159
Cost increase from superphosphate ($/ha)
$34 $59
Amount of maize silage needed (kg DM/ha)3
660 240
Maize silage cost ($/ha)
$254 $92
Saving (silage cost less increased fertiliser cost)
$220 $33
Notes: 1. Superphosphate and RePlenish currently have 9%, while DP65 has 6.5%, total P.
2. Prices as at February 2017, plus $30/T cartage and $100/T spreading.
3. Maize silage is costed at $305/T, with 10.5 MJME/kg DM and allowing for 70%
utilisation (fed in-field).
A similar exercise with a scenario needing 40 kg P/ha as superphosphate, yielded cost-
savings of $465/ha for RePlenish, and $85/ha for DP65.
Soil Test results
Soil Olsen P
It was obvious from year 2 onwards that soil Olsen P test readings were lower on the
RePlenish and DP65 treatments than on those topdressed with superphosphate. This has
important ramifications in that if the effectiveness of fertiliser applications are judged by the
change in soil test levels, then the immediate perception could be that the RePlenish or DP65
were not as effective as superphosphate. However, the pasture growth measurements showed
that the application of these P fertilisers often resulted in higher pasture growth-rates than
those achieved from using superphosphate.
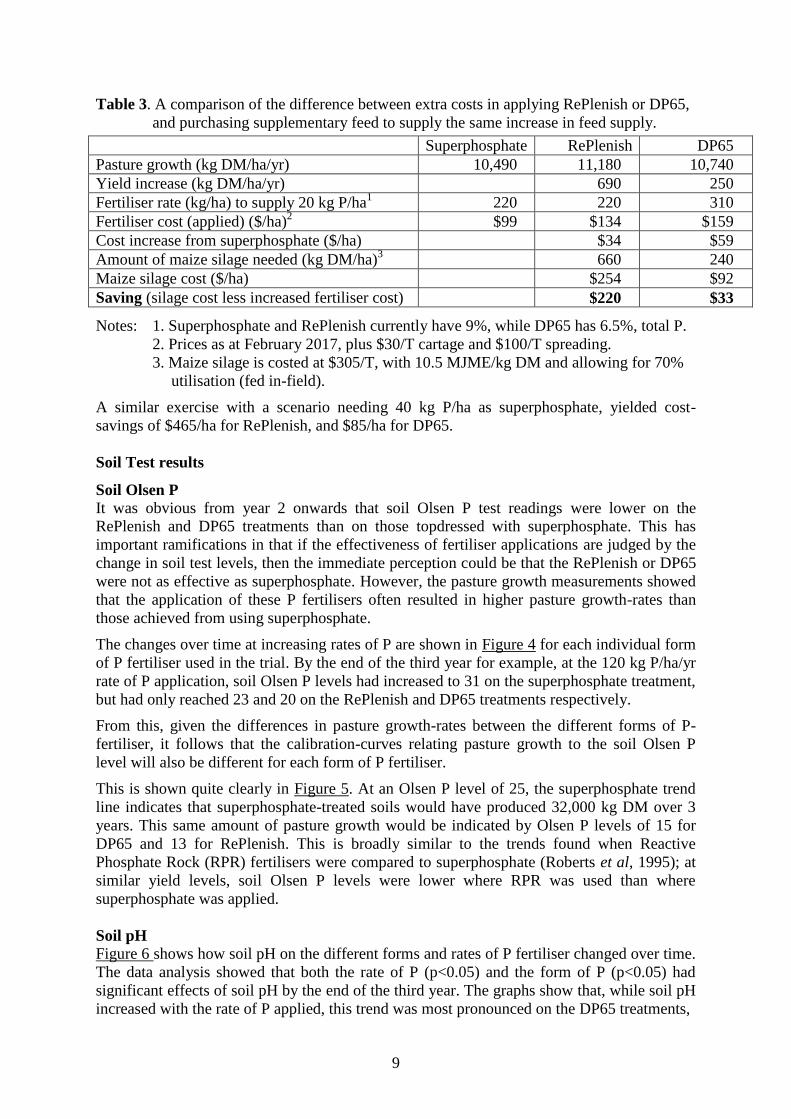
The changes over time at increasing rates of P are shown in Figure 4 for each individual form
of P fertiliser used in the trial. By the end of the third year for example, at the 120 kg P/ha/yr
rate of P application, soil Olsen P levels had increased to 31 on the superphosphate treatment,
but had only reached 23 and 20 on the RePlenish and DP65 treatments respectively.
From this, given the differences in pasture growth-rates between the different forms of P-
fertiliser, it follows that the calibration-curves relating pasture growth to the soil Olsen P
level will also be different for each form of P fertiliser.
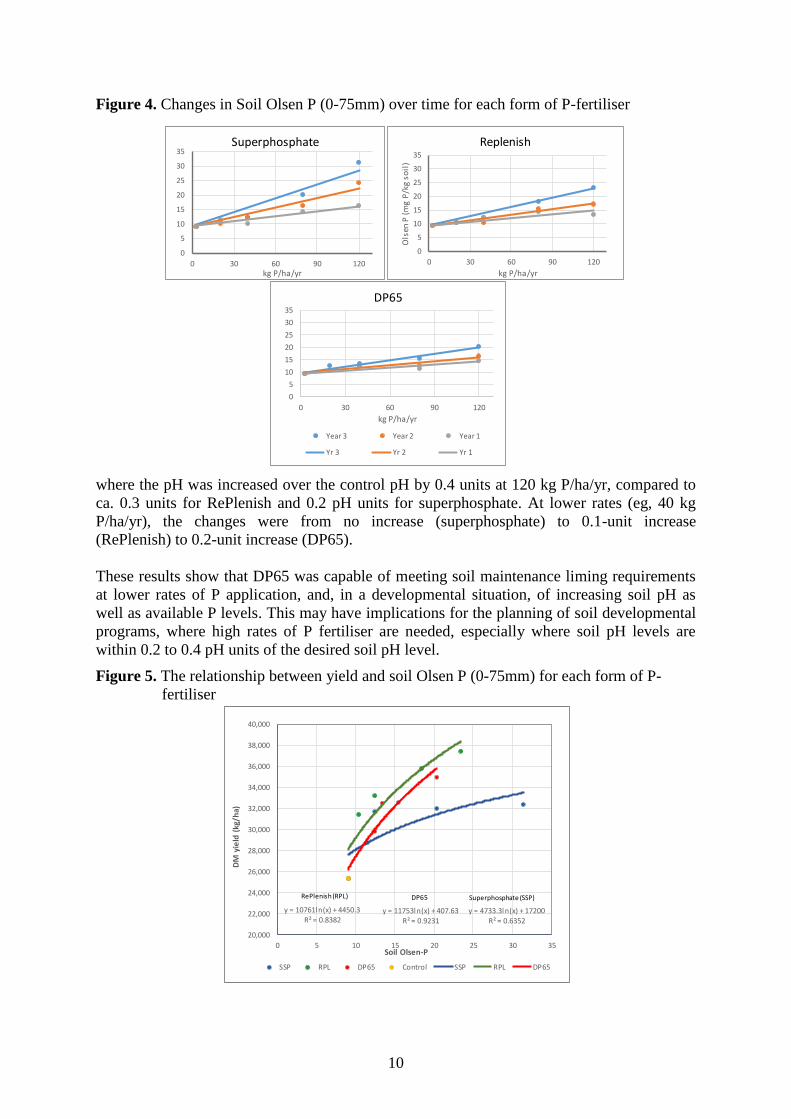
This is shown quite clearly in Figure 5. At an Olsen P level of 25, the superphosphate trend
line indicates that superphosphate-treated soils would have produced 32,000 kg DM over 3
years. This same amount of pasture growth would be indicated by Olsen P levels of 15 for
DP65 and 13 for RePlenish. This is broadly similar to the trends found when Reactive
Phosphate Rock (RPR) fertilisers were compared to superphosphate (Roberts et al, 1995); at
similar yield levels, soil Olsen P levels were lower where RPR was used than where
superphosphate was applied.
Soil pH Figure 6 shows how soil pH on the different forms and rates of P fertiliser changed over time.
The data analysis showed that both the rate of P (p<0.05) and the form of P (p<0.05) had
significant effects of soil pH by the end of the third year. The graphs show that, while soil pH
increased with the rate of P applied, this trend was most pronounced on the DP65 treatments,
10
Figure 4. Changes in Soil Olsen P (0-75mm) over time for each form of P-fertiliser
where the pH was increased over the control pH by 0.4 units at 120 kg P/ha/yr, compared to
ca. 0.3 units for RePlenish and 0.2 pH units for superphosphate. At lower rates (eg, 40 kg
P/ha/yr), the changes were from no increase (superphosphate) to 0.1-unit increase
(RePlenish) to 0.2-unit increase (DP65).
These results show that DP65 was capable of meeting soil maintenance liming requirements
at lower rates of P application, and, in a developmental situation, of increasing soil pH as
well as available P levels. This may have implications for the planning of soil developmental
programs, where high rates of P fertiliser are needed, especially where soil pH levels are
within 0.2 to 0.4 pH units of the desired soil pH level.
Figure 5. The relationship between yield and soil Olsen P (0-75mm) for each form of P-
fertiliser
0
5
10
15
20
25
30
35
0 30 60 90 120kg P/ha/yr
Superphosphate
0
5
10
15
20
25
30
35
0 30 60 90 120
Ols
en P
(m
g P
/kg
soil
)
kg P/ha/yr
Replenish
0
5
10
15
20
25
30
35
0 30 60 90 120
kg P/ha/yr
DP65
Year 3 Year 2 Year 1
Yr 3 Yr 2 Yr 1
y = 4733.3ln(x) + 17200
R² = 0.6352
y = 10761ln(x) + 4450.3R² = 0.8382
y = 11753ln(x) + 407.63
R² = 0.9231
20,000
22,000
24,000
26,000
28,000
30,000
32,000
34,000
36,000
38,000
40,000
0 5 10 15 20 25 30 35
DM
yie
ld (
kg/h
a)
Soil Olsen-P
SSP RPL DP65 Control SSP RPL DP65
RePlenish (RPL) DP65 Superphosphate (SSP)

11
However, given the relatively high soil pH level at the start of the trial, it is unlikely that the
performance of either DP65 or RePlenish was enhanced by a liming effect; earlier work
(Edmeades et al, 1985) having shown that pasture growth responses to increases in soil pH
from a starting pH of 5.9 are unlikely to occur.
Soil Exchangeable Aluminium
High levels of exchangeable aluminium (exch Al) in soils can reduce plant growth. Legumes
such as white clover, important for biological nitrogen fixation, are more sensitive than
grasses. While levels on the trial site tended to be low (< 3 mg/kg) the trends shown here may
have implications for sites with higher soil exch Al levels.
Figure 6. Changes in soil pH (0-75mm) after three years for each form of P fertiliser
Data analysis showed that, while there was no significant effect of rate of P fertiliser on soil
exchangeable aluminium (exch Al) levels, there was a significant effect of form of P fertiliser
used (p<0.01). This showed that soil exch Al levels in soils treated with superphosphate were
higher than those on soils treated with either DP65 or RePlenish. There was also a significant
form by rate interaction (p<0.05). This latter came about because (Figure 7) increasing rates
of P as superphosphate tended to increase soil exch Al levels, while increasing P rates tended
to decrease exch Al where DP65 was used. RePlenish tended to have no effect on soil exch
Al.
Figure 7. Changes in soil Exchangeable Al (0-75mm) with different forms and rates of P
fertiliser (end of year 3)
0.0
0.1
0.2
0.3
0.4
Superphosphate RePlenish DP65
Ch
an
ge i
n s
oil
pH
fro
m c
on
tro
l
20 kg P/ha 40 kg P/ha 80 kg P/ha 120 kg P/ha
0.0
0.2
0.4
0.6
0.8
1.0
1.2
1.4
1.6
1.8
2.0
Control SSP RPL DP65
Soil
Exch
Al
(mg/
kg)
Control 20 kgP 40 kg P 80 kgP 120 kgP

12
The effects of DP 65 and Superphosphate were most pronounced at the higher rates of P
applied – that is, decreases in soil exch Al were lower at the lower rates of P applied as DP65;
while the increases with superphosphate also tended to be smaller at the lower P-rates. This
means that where maintenance P is being applied (maintenance P rates tend to be between 20
and 40 kg P/ha/year) then the effect of the type on fertiliser on soil exch Al levels may be
small.
Conclusions 1. RePlenish and DP65 caused higher rates of pasture growth than superphosphate over
the three-year period of the trial
2. DP65 was slower to act than RePlenish in that yield increases did not occur until the
second year of the trial
3. The differences in response can lead to either an increase in production for the same
amount of P input, or to needing less P to achieve a given level of production.
4. Using either alternative product to increase feed supply would be more profitable than
importing extra feed.
5. DP 65 at higher rates (80 or 120 kg P/ha/yr) can increase soil pH whereas
superphosphate and RePlenish are not likely to produce any change.
6. Increasing rates of DP65 decreased soil exchangeable Al levels while increasing rates
of superphosphate increased soil exchangeable Al.
7. The yield-soil Olsen P relationship is different for the different P fertilisers; at
equivalent rates of P, superphosphate increased soil Olsen P more than RePlenish or
DP65.
Note: Terracare have advised that the product DP65 has been re-branded as uPgrade.
References
Bolan, M. S.; R. E. White and M. J. Hedley (1990). A review of the use of phosphate rocks as
fertiliser in Australia and New Zealand. Australian Journal of Experimental Agriculture
30: 297-313.
Brennan, R. F. and M. D. A. Bolland (2005). Effectiveness of Dicalcium Phosphate
Compared with Superphosphate for Wheat Grown on Acidic Sandy Soils. Journal of Plant
Nutrition 28:725-736.
Cornforth, I.S.; Sinclair, A.G. 1984. (Eds) Fertiliser and lime recommendations for pastures
and crops in New Zealand. Second revised edition, Ministry of Agriculture and Fisheries,
Private Bag, Wellington. 76pp.
Devine, J R; D. Gunary and S. Larsen (1968) Availability of phosphate as affected by
duration of fertilizer contact with soil. The Journal of Agricultural Science 71: 359-364
Edmeades, D.C., (2000): The Agronomic effectiveness of lime-reverted and dicalcic
superphosphates: a review. New Zealand Journal of Agricultural Research 43: 1-6
Edmeades, D.C.; Pringle, R.M.; Mansell, G.P.; Shannon, P.W.; Ritchie J.; Stewart, K.M.
1985. Effects of lime on pasture production on soils in the North Island of New Zealand 5.
Description of a lime recommendation scheme. New Zealand journal of experimental
agriculture 13: 47–58.
Hill Laboratories. The Resin P test. Hill Laboratories Technical Note KB Item 3162 Ver. 4.

13
Morton, J. D.; Roberts, A. H. C. 1999: Fertiliser use on New Zealand sheep and beef farms.
Revised Edition. Auckland, New Zealand. New Zealand Fertiliser Manufacturer's
Association. 36 p
Probert, M. E.; S. Larsen (1970) The stability of dicalcium phosphate dihydrate in soil. I.
Laboratory studies. European Journal of Soil Science 21 (2), 353–358
Probert, M. E.; S. Larsen (1970) The stability of dicalcium phosphate dihydrate in soil. II. Pot
experiments. European Journal of Soil Science 21 (2), 359–363
Roberts, A. H. C.; A. G. Sinclair; P. D. Johnstone; W. H. Risk; L. C. Smith; M. B. O'Connor;
L. Nguyen; J. D. Morton; P.W. Shannon: 1994. Changes in soil Olsen P over six years
with annual applications of triple superphosphate or reactive phosphate rock (Sechura).
New Zealand Journal of Agricultural Research, 37: 229-237
Saggar, S, M.J. Hedley, R.E.White, K.W. Perrot, P.E.H. Gregg, I.S. Cornforth, A.G. Sinclair
(1999). Development and evaluation of an improved soil test for phosphorus, 3: field
comparison of Olsen, Colwell and Resin Soil P tests for New Zealand pasture soils.
Nutrient Cycling in Agroecosystems 55 (1): 35-50.