a comparison of the effects of fluoride and chloride ions
TRANSCRIPT
Portland State University Portland State University
PDXScholar PDXScholar
Dissertations and Theses Dissertations and Theses
5-29-1969
A Comparison of the Effects of Fluoride and Chloride A Comparison of the Effects of Fluoride and Chloride
Ions Upon the Activity of Yeast Alcohol Ions Upon the Activity of Yeast Alcohol
Dehydrogenase Dehydrogenase
Ellen J. Hannan Portland State University
Follow this and additional works at: https://pdxscholar.library.pdx.edu/open_access_etds
Part of the Chemistry Commons
Let us know how access to this document benefits you.
Recommended Citation Recommended Citation Hannan, Ellen J., "A Comparison of the Effects of Fluoride and Chloride Ions Upon the Activity of Yeast Alcohol Dehydrogenase" (1969). Dissertations and Theses. Paper 458. https://doi.org/10.15760/etd.458
This Thesis is brought to you for free and open access. It has been accepted for inclusion in Dissertations and Theses by an authorized administrator of PDXScholar. Please contact us if we can make this document more accessible: [email protected].

Portland State University Portland State University
PDXScholar PDXScholar
Dissertations and Theses Dissertations and Theses
5-1-1969
A comparison of the effects of fluoride and chloride A comparison of the effects of fluoride and chloride
ions upon the activity of yeast alcohol ions upon the activity of yeast alcohol
dehydrogenase dehydrogenase
Ellen J. Hannan Portland State University
Follow this and additional works at: https://pdxscholar.library.pdx.edu/open_access_etds
Let us know how access to this document benefits you.
Recommended Citation Recommended Citation Hannan, Ellen J., "A comparison of the effects of fluoride and chloride ions upon the activity of yeast alcohol dehydrogenase" (1969). Dissertations and Theses. Paper 458. https://doi.org/10.15760/etd.458
This Thesis is brought to you for free and open access. It has been accepted for inclusion in Dissertations and Theses by an authorized administrator of PDXScholar. Please contact us if we can make this document more accessible: [email protected].

AN ABSTRACT OF THE THESIS OF Ellen J. Hannan for the Master of Arts in
Chemistry presented May 29,· 1969.
Title: A Comparison of the Effects of Fluoride and Chloride Ione Upon
the Activity of Yeast Alcohol Dehydrogenase.
APPROVED BY MEMBERS OF THE THESIS COMMITTEE:
--
Gordon Kilgour
Very little is known about the effect of hydrofluoric acid and of
the fluoride ion on enzyme systems. The purpose of this work was to
determine the effect of hydrofluoric acid and of tha fluoride ion on the
enzyme, yeast alcohol dehydrogenase and to distine;uish between the effect
of the fluoride ion and of hydrofluoric acid. The rate of the enzyme re
action was followed sp,ctrophotometrically at 34o m}J- on the Cf.l'Y 14
Model spectrophotometer according to the method of Racker. The data
C '
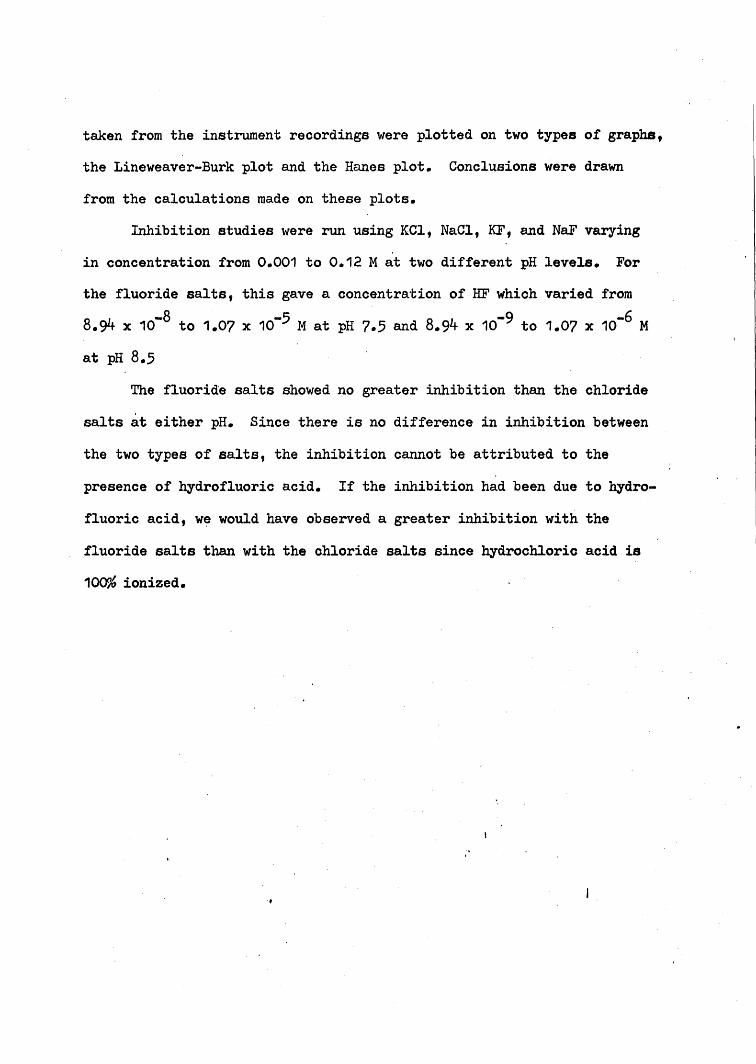
taken from the instrument recordings were plotted on two types of graphs,
the Lineweaver-Burk plot and the Hanes plot. Conclusions were drawn
from the calculations made on these plots.
Inhibition studies were run using KCI, NaCl, KF 9 and NaF varying
in concentration from 0.001 to 0.12 M at two different pH levels. For
the fluoride salts, this gave a concentration of HF whioh varied from
8.94 x 10⁻⁸ to 1.07 x 10⁻⁵ M at pH 7.5 and 8.94 x 10⁻⁹ to 1.07 x 10⁻⁶ M
at pH 8.5
The fluoride salts showed no greater inhibition than the chloride
salts at either pH. Since there is no difference in inhibition between
the two types of salts, the inhibition cannot be attributed to the
presence of hydrofluoric acid. If the inhibition had been due to hydro-
fluoric acid, w~ would have observed a greater inhibition with the
fluoride salts than with the chloride salts since hydrochloric acid is
10<Y'~ ionized.
'f
A COMPARISON OF THE EFFECTS OF FLUORIDE AND CHLORIDE IONS
UPON THE ACTIVITY OF YEAST ALCOHOL DEHYDROGENASE
by
ELLEN J. HANNAN
A thesis submitted in partial fulfillment of therequirements for the degree of
MASTER OF ARTS
in
CHEMISTRY
Portland State University1969
'ORllAND STATEUNIVERSilY UBR'All
TO THE OFFICE OF GRADUATE STUDIES t
The members of the Committee approve the thesis of Ellen J.
Hannan presented May 29. 1969.
-Gary Gard(
APPROVED:
of· Chemistry
) ..,'
j..~,.,,,..r"
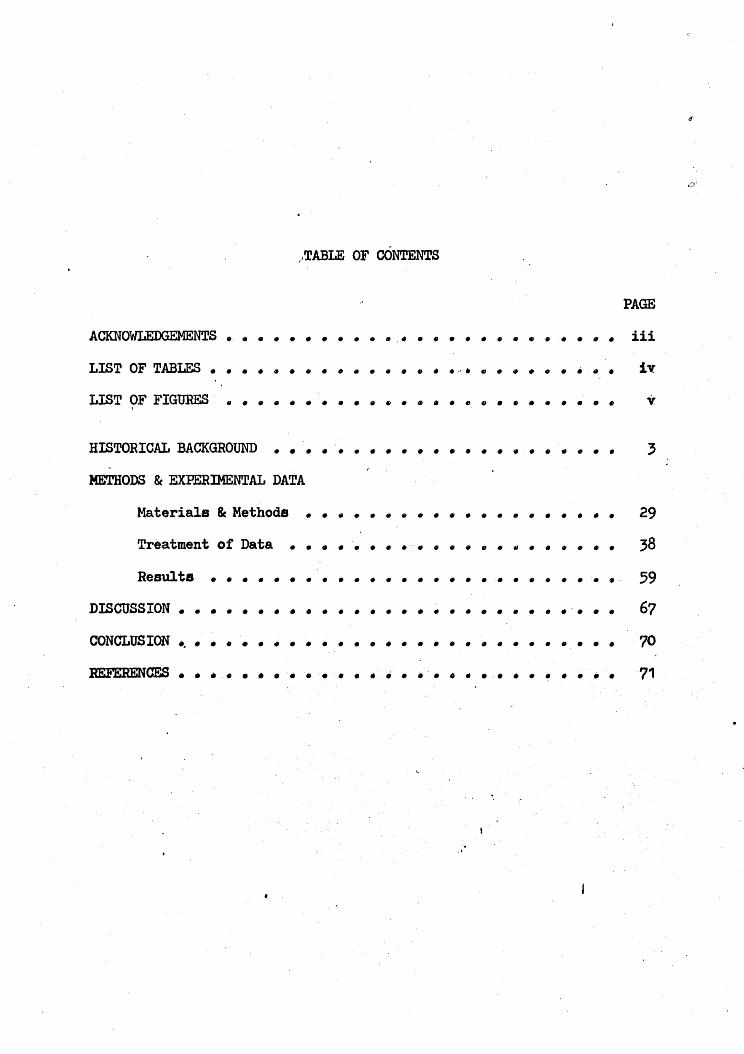
(,TABLE OF cONTENTS
ACKNOWLEOOEMENTS • • • • • • • • • • • • • • • • • II • " • II . " .PAGE
iii
LIST OF TABLES • • • • • • • • • • • • • • • •..• II • • • " • .'. . iv
LIST OF FIGURESI
• • • • • • • • • • • • • • • II • • II • • • • • •
HISTORICAL BACKGROUND • • II • • • • • • • • II • • • • • • • • • • 3
METHODS Be EXPERIMENTAL DATA
Materials &Methods . '. . • • • • • • II • • • • • • • • • • 29
Treatment of Data • • • • . . . .'. . . . . . . . . . . .. 38
Results
DISCUSSION
• • • • • • • • • •
• • • • • • • • • • • •
• • • • • • • • • • • • • • • •
. . . .. . . . . . ...'. . .59
67
CONCLUSION _. • • • • • • • • • • • • • • • • • • • • • • • " • •• 70
REbERENCES • • • • • • • '.. .• • • • " • .'. 0 III •.• • • • • • •• 71

::
iii
ACKNOWLEDGEMENTS
The author wishes to express he~ sincere gratitude to Dr. Elaine
Spencer for her understanding and guidance during this research project;",-
"Dr. John Mickelsen for his, help and encouragement; Lou Livingston for
his assistance; and Roger Brown for his assistance with the graphs.
. The author wishes also to exprees her appreciation to her husband,~.
Rich~t for his help and understanding, and to her parents.
I,

iv
LIST OF TABLEs
\\.
\
\TABLE PAGE
I Amino Acid Composition of YADH •••••• ~ ••••••••• 4
II Physical 'and Chemical Properties of lADH • • • 0 • ~ • • I}. 5
III Relative Rates of Oxidation of Alcohols by YAnH I} DO. •• 6
IV Michaelis Constants • • • • • • 0 0 • • 0 e ~ ~ • 12
V Inhibition Constants of N' -alkylnicotinamide and
VI Interaction Constants of Various Inhibitors
n-alkylammonium Chlorides •
• ., .., •• 0'.
VII Inhibitors of YADH • • • 0 • •
• • • • • •
. ... ., . .,
• ., til til
" • 0 .,
• til e
• 0 til
16
18
25
.'

FIGURE
LIST OF FIGURES
PAGE
v
1 YADH - Coenzyme complex • • • • • • • • • • • • • • • • 13
2 Standard Assay Graph .. .. • • • • • • • .. • • • • • • .. 31
3 Absorption Spectrum of YADH • • • • • • • • • • • • • • 33,
4 Michaelis ,Plot" pH 8.5 • • • • • • • • • • .. • • • • • 34
5' Michaelis Plot, pH 7.5 • • • • • • • • • • • • • • • 35
6 Michaelis Plot, pH 8.5 • • • • • • • • • • • • • • • • 36
7 Michaelis Plot, pH 7.5 • • • • • • • • • • • • • • • • 37
8 'Lineweaver-Burk Plot, KGl, pH 8.5 • • .. • • .. ~ • .. • • 40
9 Hanes Plot 9 KGl, pH 8.5 • .. .. • .. .. • • • .. • • • • • • 41
10 Lineweaver-Burk Plot, NaCl, pH 8.5 • • .. • • .. • • .. • 42
11 , Lineweaver-Burk Plot, KF, pH 8.5 •• • • • • ~ • • • .. 43
12 Lineweaver-Burk Plot, NaF,' pH 8.5 • .. • • • • • • • • 44
13 Lineweaver-Burk Plot, NaGl, pH 8.5 • .. • .. • .. .. ~ • • 45
14 Linewaaver-Burk Plot, KGl, pH 8.5 '. • • • • • .. .. • • 46(.~-, ~
15 Lineweaver-Burk Plot, NaF, pH 8.5 • .. .. .. • • • " • • 47
16 Lineweaver-Burk Plot, KF, pH 8.5 • • .. .. .. • .. .. .. • 48
17 Lineweaver-Burk Plot, NaGI, pH 7.5 .. • • .. • • • • • .. 49
18 Lineweaver-Burk Plot, KCl, pH 7.5 I 50.. .. • • .. • • • • •
19 Lineweaver -Burk Plot 9 KF t pH 7.5 • • • .. • • • .. .. • 51
20 Hanes Plot, KF,'pH 7.5 • • .. .. • .. .. .. • • • .. • .. .. • .52"
21 Lineweaver-Burk Plot, NaF, pH 7.5 .. • • .. • .. • ~ • • .53
i'~'
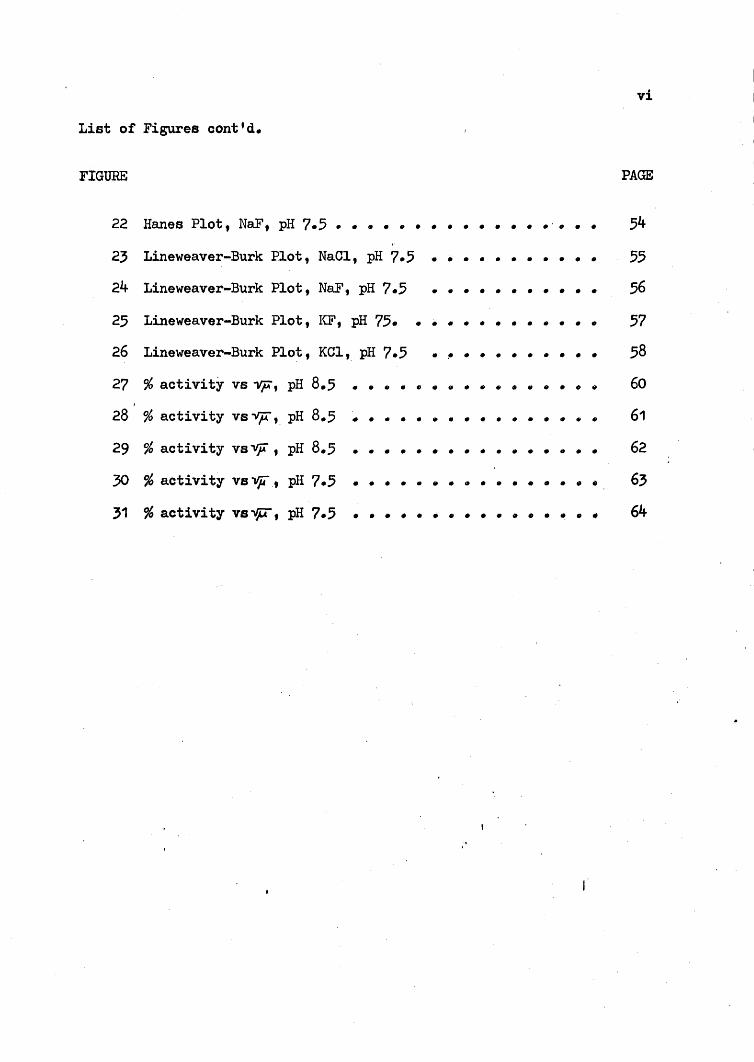
List of Figures cant'd.
FIGURE
vi
PAGE
22 Hanes Plot, NaF t pH 7.5 • • • • • • • • • • • • • • • • • 54
23 Lineweaver-Burk Plot, NaCI, pH 7.5 • • • • • • • • • • • 55
24 Lineweaver-Burk Plot, NaF, pH 7.5 • • • • • • • • • • • 56
25 Lineweaver-Burk Plot, KF, pH 75. • • • • • • • • • • • • 57
26 Lineweaver-Burk Plot, KCI, pH 7.5 • !' • • • • • • • • • 58
27 %activity VB -vjA, pH 8.5 • • • • ~ " ClI • • • " " 0 • • • 60
28 %activity VB""fi",. pH 8.5 • • • • • • • • • • • • • • " • 61
29 %activity vaVF , pH 8.5 • • • • • • • • • • • • • • • • 62
30 %activity va~, pH 7.5 • • • • • " • 0 • • • • • • .. • 63
31 %activity vs~, pH 7.5 • • • • • • • • • • • • • • • • 64
"

INTRODUCTION
Dehydrogenases constitute one group of a class of enzymes involved
in biological oxidation and reduction. They form an essential link to
the respiratory chain in both plants and animals. Alcohol dehydrogenase
is specific for the oxidation of ethanol or the reduction of acetalde-
hyde. In the mammalian system, it occurs in the liver and is considered
a detoxifying system catalyzing the oxidation of ethanol. In yeast,
alcohol dehydrogenase can catalyze either oxidation or reduction depend-
ing upon the conditions. Under anaerobic cond{tio~s, it will form the
ethanol, while under aerobic conditions it will oxidize it. Alcohol
dehydrogenase is a typical diphosphopyridine nucleotide-dependent dehy-
drogenase and conclusions dravffi from its study may well apply to other
dehydrogenase systems.
Some inorganic fluorine containing compounds are known to have a
high toxicity level for rats (1). It has been thought that their tox
icity is caused by their hydrolysis to produce HF (1). It is known that
these compounds hydrolyze very little in pure water (2), and the amount
of HF or fluoride ion produced, therefore, is very small. Since the
toxicity levels of fluoride ion and HF for enzyme systems have not been
extensively studied, it cannot be determined whethe~ the above explana-
tion for the toxicity of these fluorine compounds is correct or not.
The purpose of this work was to determine the effect of theI
fluoride ion on an enzYme system and to distinguish between the effect
of the fluoride ion and of HF. The chloride salts were studied at the

HISTORICAL BACKGROUND
Alcohol dehydrogenase (ADH) is a diphosphopyridine nucleotide
linked metalloenzyme catalyzing the reaction:
+ADH '> DPNH + +
Although catalyzing the same reaction, the yeast and the liver enzymes
differ widely in their physical properties. This study will be limited
to the yeast enzYme.
Work on crude preparations of yeast alcohol dehydrogenase (YADH)
was begun in 1935, and in 1937, YADH was purified enough to give a
crystalline enzyme. This was first accomplished by Negelein and Wulf
using brewer's yeast (3). Their methods have since been modified and
improved by Racker (4) and Hayes and Velick (5).
YADH can be obtained relatively easily in pure form and is stable
for long periods of time in the dry state or in solution at pH 7 and
oOe (6). It has a molecular weight of 150,000, calculated from sedi-
mentation velocity and diffusion measurements (5), and is composed of
19 amino acids as shown in Table I. YADH requires the presence of the
coenzyme nicotinamide adenine dinucleotide (NAD+ or DPN+, NADH or DPNH) ,
for activity. For a more complete list of physical and chemical prop-
erties, consult Table II.
YADH is specific for straight chain primary alcohols. Oxidizing
ability decreases with an increase in chain length (19, 20). lThe rate.of oxidation decreases in the follo~ling order: ethyl alcohol = allyl
alcohol, n-propyl alcohol, n-butyl alcohol, n-pentyl alcohol, isopropyl
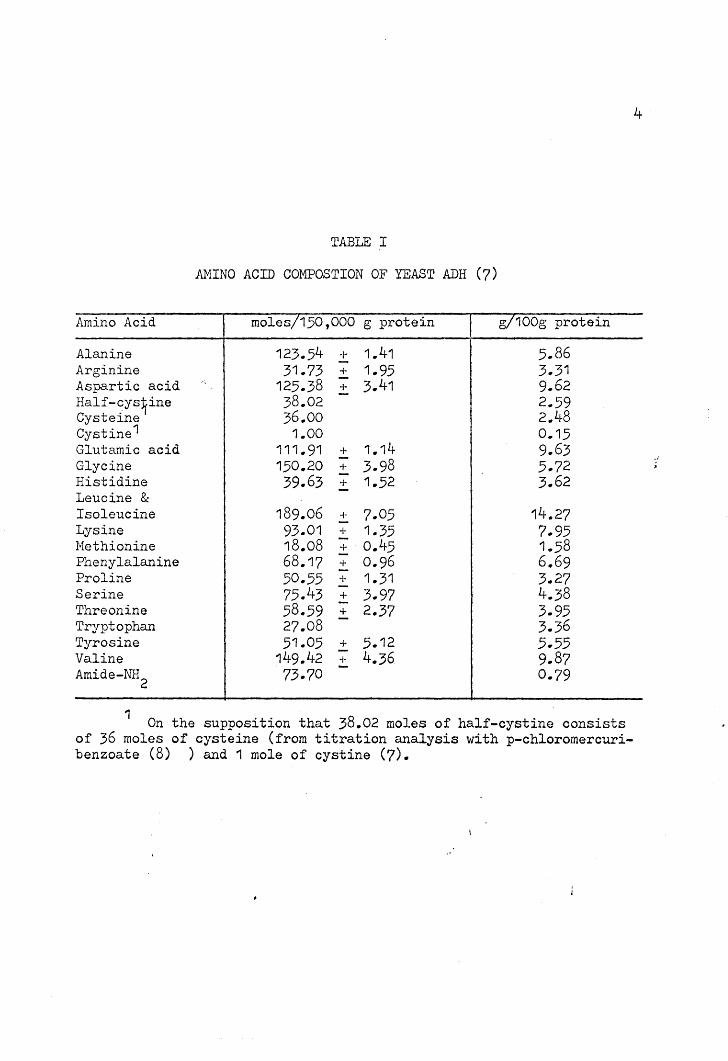
TABLE I
AMINO ACID COMPOSTION OF YEAST ADH (7)
Amino Acid moles!150,000 g protein g/100g protein
Alanine 123.54 -I- 1.41 5.86Arginine 31.73 + 1.95 3.31-Aspartic acid '. 125.38 + 3.41 9.62Half-cys~ine 38.02 2.. 59Cysteine 36.00 2.48Cystine1 1.00 0.15Glutamic acid 111.91 + 1.14 9.63- 3.98Glycine 150.20 + 5.72Histidine 39.63 + 1.52 3.62Leucine & -Isoleucine 189.06 ;- 7.05 14.27Lysine 93.01 + 1.35 7.95Nethionine 18.08 - 0.45 1.58+Phenylalanine 68.17 - 0.96 6.69+Proline 50.55 + 1.31 3.27
75.43 - 4.38Serine + 3.97Threonine 58.59 - 2.37+ 3.95
27.08 - 3.36TryptophanTyrosine 51.05 + 5.12 5.55Valine 149.42 + 4.36 9.. 87Amide-NH
2 73.70 - 0.79
4
1 On the supposition that 38.02 moles of half-cystine consistsof 36 moles of cysteine (from titration analysis with p-chloromercuribenzoate (8) ) and 1 mole of cystine (7).
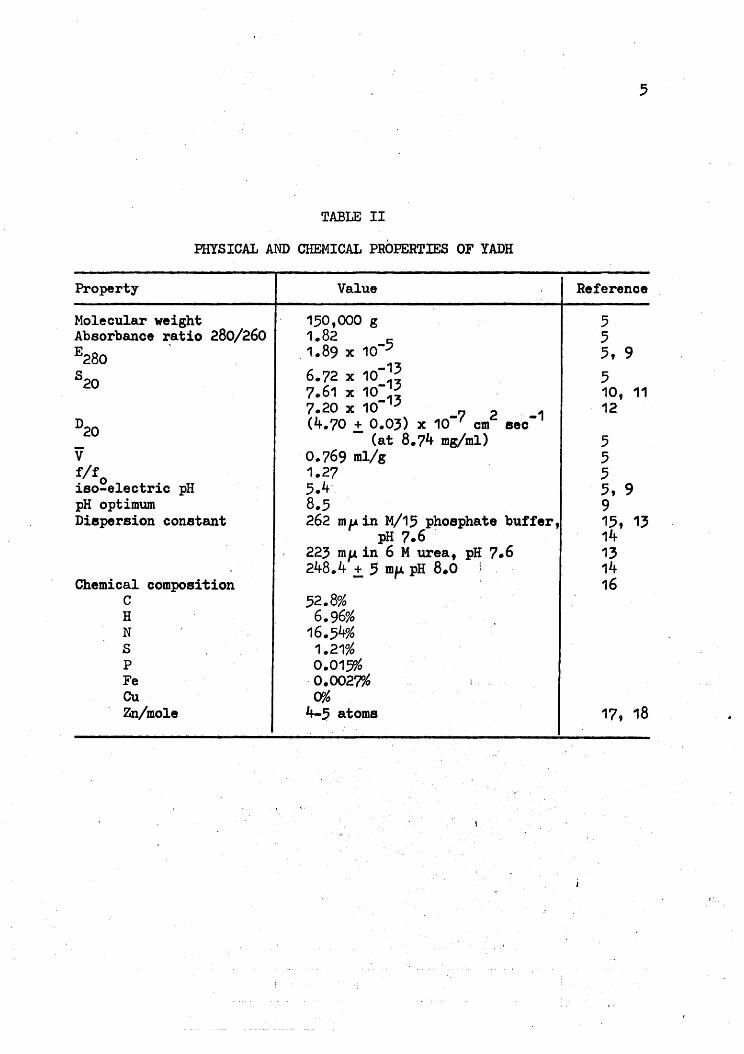
Property
TABLE II
PHYSICAL AND CHEMICAL PROPERTmS OF YADH
Value
5
Referenoe
I. ,
Molecular weightAbsorbance ratio 280/260E
280'
S20
D20Vf/f• 0 1 t· HJ.so-e ec rJ.c ppH optimumDispersion constant
Chemical composi1;ionCHNSPFeCuZn/mole
150,000 g1.82 5
.1.89 x 10-6 -13.72 x 10_137.61 x 10_137.20 x 10 -7 2 .-1(4.70 + 0.03) x 10 em sec
- (at 8.74 mg!ml)0.769 rnl/g1.275.4'8.5262 mp. in M/15 phosphate buffer,
pH 7.6 .223 mp. in 6 M urea, pH 7.6248.4 ± 5 mp. pH 8.0 : .
52.8%6.96%
16.54%1.21%0.01~,,6
·0.0027%0%
4-5 atoms
555, 9510, 1112
5555, 9915, 1314131416
17, 18
6
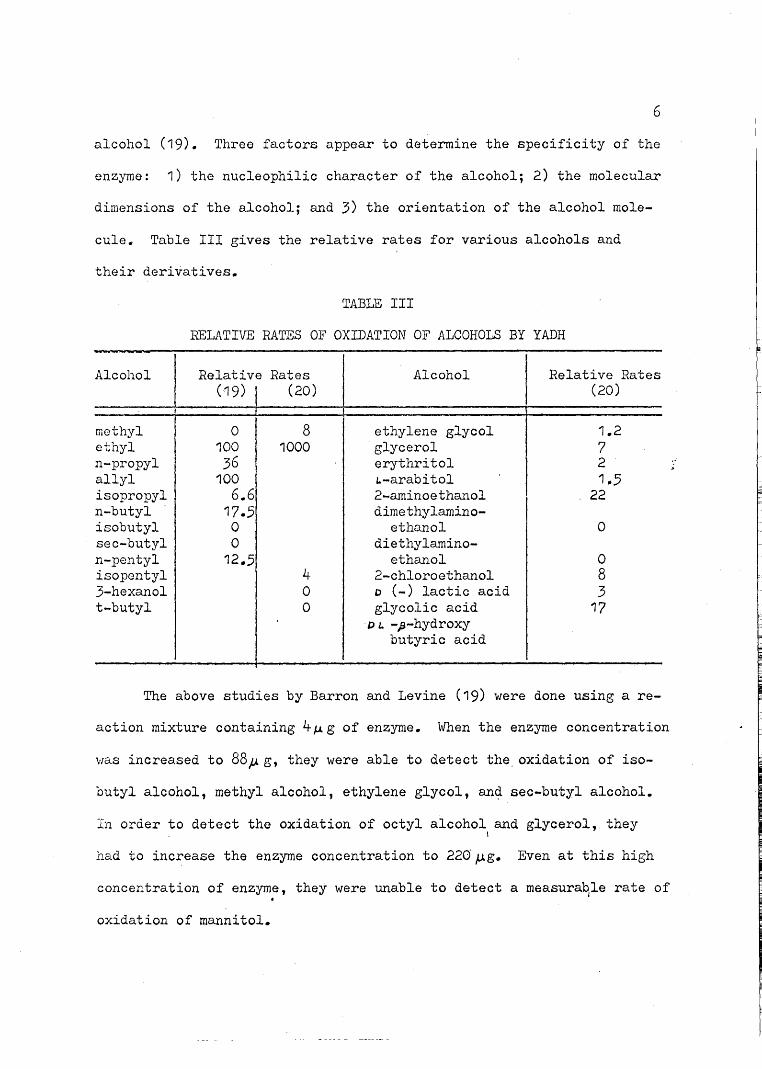
alcohol (19). Three factors appear to determine the specificity of the
enzyme: 1) the nucleophilic character of the alcohol; 2) the molecular
dimensions of the alcohol; and 3) the orientation of the alcohol mole-
cule. Table III gives the relative rates for various alcohols and
their derivatives.
TABLE III
RELATIVE RATES OF OXIDATION OF ALCOHOLS BY YADH-
Alcohol Relative Rates Alcohol Relative Rates(19) I (20) (20)
methyl 0 8 ethylene glycol 1.2ethyl 100 1000 glycerol 7n-propyl 36 erythritol 2allyl 100 to-arabitol 1.5isopropyl 6.6 2-aminoethanol 22n-butyl 17.5 dimethylamino-isobutyl 0 ethanol 0sec-butyl 0 diethylamino-n-pentyl 12.5 ethanol 0isopontyl 4 2-chloroethanol 83-hexanol 0 o (-) lactic acid 3t-butyl 0 glycolic acid 17
D L. -J3-hydrox:ybutyric acid
The above studies by Barron and Levine (19) were done using a re-
action mixture containing 4~g of enzyme. When the enzyme concentration
,,.,as increased to 88;;. g, they were able to detect the oxidation of iso-
butyl alcohol, methyl alcohol, ethylene glycol, an~ sec-butyl alcohol.
In order to detect the oxidation of octyl alcohol and glycerol, theyI
had to increase the enzyme concentration to 220~g. Even at this high
concentration of enzyme, they were unable to detect a measura~le rate of
oxidation of mannitol.
7
Zinc and sulfhydryl groups are both essential for the activity of
YADH. Essential groups may play an active role in the binding of the
substrate or the coenzyme, or they may be responsible for the quaternary
structure of the enzyme, or for electronic effects during catalysis.
Zinc, which is known to hold the four monomolecular units together form-
ing the active enzyme (21), may also be necessary for the binding of the
coenzyme.
Kagi and Vallee (21) studied the role of the zinc in the quater-
nary structure of the enzyme using chelating agents. When YADH is ex-
posed to chelating agents, it dissociates into four equal monomeric
units. The loss of activity is proportional to this dissociation and
to the loss of zinc. One of the more commonly used chelating agents is
1,10-phenanthroline (OP). OP shows two types of inhibition depending
upon the reaction conditions.
OP shows an instantaneous reversible inhibition (22) and a time
d d t . 'bl' h'b't' (23) DP~T+ w~ll protect the enzymeepen en ~rrevers~ e ~n ~ ~ ~on • H ~
against the first type of inhibition, but when the enzyme is incubated
+with OP in the absence of DPN , the second type of inhibition is ob-
served. Addition of DPN+ after incubation of OP with the enzyme has no
effect upon the inhibition. DPN+ can compete with OP for the active
+site of the enzyme, but DPN cannot displace OP once it is bound. The
substrates show no protective effect for either typ~ of inhibition.
DPN+ can protect against the first type qf inhibition because the
allowed to be in close contact for an extended period of time, a second
structure of the enzyme has not yet changed. When the enzyme and OF arej
mole of OP will bind to the zinc and thus change the structure of the
8
enzyme. In this way, the enzyme is inactivated irreversibly.
Since the substrates have no effect on the inhibition, it is
assumed that if the zinc is involved in the binding, it is the binding
of the coenzyme. It may be that the zinc is close to the binding site
+of the coenzyme, and the binding of the OP sterically blocks the DPN
binding site. The work of Kagi and Vallee (21) did not demonstrate
conclusively that the zinc is involved in the active site.
Using the emission spectrograph, Vallee and Hoch (17) determined
the zinc content of YADH to be four atoms of zinc per mole of enzyme.
Pfleider, Jeckel, and Wieland, as quoted by Wallenfels and others (18),
found the zinc content to be around five atoms per mole of enzyme usingi!
the dithizone method. This is in agreement with the work of Wallenfels
and coworkers who used the X-ray fluorescence method (24).
The sulfhydryl content of YADH has been determined by many inves-
tigators with many variations. The number of sulfhydryl groups seems to
vary with the enzyme preparation and with the method of determinat~on
used. Wallenfels and Bund (8) showed that there was a linear relation-
ship between the activity of the enzyme preparation and the number of
free sulfhydryl groups. Using the optical method of Boyer (25), which
uses p-chloromercuribenzoate (PCMB) as the sulfhydryl reagent, Wallenfels
and Sund (8) found the number of sulfhydryl groups to vary from 4 to 36 •
PCMB reacts with the, sulfhydryl groups of the enzyme to form the\
mercaptide. The optical absorption of peME is then increased. Boyer
found that the increase in the neighborhood of 250 to 255 mf is linearlyI
related to the number of sulfhydryl groups, therefore, the n~ber of sulf-
hydryl groups ,can be determined from the increased absorption. Excess

9
peME does not add appreciably to this increased absorbance.
When Wallenfels and Sund (8) titrated the enzyme with silver ni
trate and followed the reaction amperometrically, they found an average
of 21 free sulfhydryl groups. This is close to the values found by
Barron and Levine (19). Using the same method, Barron and Levihe found
YADH to contain 18-19 moles of sulfhydryl groups per mole of enzyme.
Hoch and Vallee (26) arrived at a value of 25 moles of free sulfhydryl
groups per molecule using the silver nitrate amperometric method.
Hoch and Vallee also used PCMB and found a value of 16 free sulf
hydryl groups. Barron and Levine titrated the enzyme with iodosobenzo
ate and determined a value of 22.5 moles of free sulfhydryl groups per
mole of enzyme.
In some proteins, all the sulfhydryl groups are necessary for ac
tivity. YADH is believed to be a member of this group. Barron and
Levine (19) showed that inhibition occurred after the addition of enough
PCMB to titrate 6.3% of the sulfhydryl groups and was not complete until
all the sulfhydryl groups had been titrated. The exact role of the
sulfhydryl groups cannot be determined from the above information. To
show that the sulfhydryl groups are involved in the active site more
work had to be done.
The next step was the titration of the sulfhydryl groups in the
presence of both .coenzyme and substrate. Barron and Levine (19) and
Wallenfels and coworkers (18) found the number of, free sulfhydryl groups
to decrease in the presence of the coenzyme and substrate. Hoch and
Vallee (26), however, ~id not find this to be true using both the PCMB
method and the silver nitrate method.
10
vfuitehead and Rabin (27) found iodoacetamide to be a very specific
sulfhydryl reagent. The number of free sulfhydryl groups was determined
before the addition of iodoacetamide and then again after the addition
of iodoacetamide. The number of sulfhydryl groups was found to be con-
sistently reduced by four. YADH had already been shown to have four
active sites (5). It was, therefore, assumed that this represented one
sulfhydryl group per active site. YADH lost 95% of its activity after
reaction with four moles of iodoacetamide. In view of the previous work
by Barron and Levine (19), PCMB must not act directly on the sulfhydryl
groups in the active sites. PCMB appears to show no preference for the
sulfhydryl groups, whereas iodoacetamide appears to act immediately upon;,
the sulfhydryl groups in the active sites.
Iodoacetic acid appears to have the same quality of specificity
as iodoacetamide. Harris (28) made use of this fact and used iodoace
tic-1 (14C) acid to determine the partial amino acid sequence of the
active site. After inhibiting the enzyme with iodoacetic-1 (14C) acid,
he digested the carbo,xymethylated enzyme with trypsin. The radioactive
fragments were separated from the rest of the fragments and subjected
to amino acid analysis. Another sample of the radioactive fragment was
partially hydrolyzed with chymotrypsin. This hydrolysis gave five pep-
tides which were further degraded. Putting all his information together,
mainly from overlapping fragments, he obtained the following sequence
* \for the active site of YADH: Tyr.Ser.Gly.Val·~ys-His·Thr.Asp.Leu-His·
Ala-Try·His·Gly·Asp.(Try-Pro·Leu-Pro-Thr)-Lys. The sequence in posi-I
tions 16-20 could not be rigorously established by his methods.
Iodoacetic acid and iodoacetamide do not cause denaturation as
they inactivate. +Both DPN and DPNH protected against inactivation,
11
while ethanol had no effect, and acetaldehyde enhanced inactivation.
From this, one would tend to conclude that the coenzyme is bound at or
near the sulfhydryl groups.
Hayes and Velick (5) first studied the binding of the coenzyme,
DPN+, to YADH by means of the ultracentrifuge. They found that four
moles of coenzyme were bound per mole of enzyme. They also found that
there was competition between the reduced and oxidized forms of the
coenzyme, with DPNH having a greater affinity for the enzyme as can be
seen by looking at the Michaelis constants in Table IV.
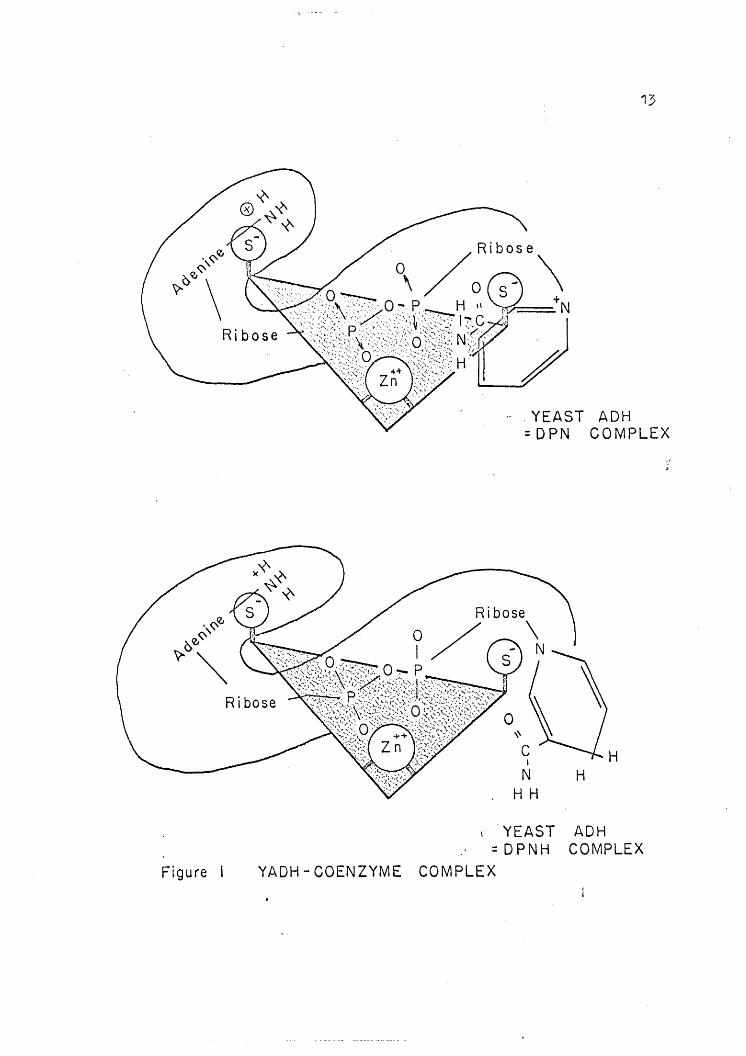
Van Eys, Kaplan, and Ciotti (34, 35, 36) have studied extensively~
the binding of the coenzyme. They have,in fact, proposed a mechanism
for the binding. The mechanism involves binding of the coenzyme in
three places on the enzyme: 1) the adenine group to a sulfhydryl group
of the enzyme; 2) the pyrophosphate group to the zinc; and 3) the pyri-
dinium nitrogen to a second sulfhydryl group (34). See Figure 1.
Their proposed binding mechanism was based on inhibition studies
of pyridine derivatives and the work of Barron and Levine (19) on the
sulfhydryl groups. Van Eys and coworkers used three types of pyridine
derivatives: 1) free pyridine bases, 2) N-methylpyridinium salts, and
3) analogues of DPN+.
Inhibition by the free pyridine bases was found to be proportion-I
al to the pK of the ring nitrogen. This led t.o the choice of theo a
N-methylpyridinium salts as inhibitors. The inhibitory action wasI
greater the stronger the electronegativity of the side chain. Van Eys
and coworkers found that the inhibiting species was actually the pyri-

TABLE IV
MICHAELIS CONSTANTS
Conditions
12
Ileferencea
ADH-EtOH 0.10 23°C, pH 6.0 290.074 2 23°C, pH 7.15 291.8 x 10:2 26°C 5'
°1.3 x 10 2 25 C, pH 8.45 301.4 x 10⁻² R.~., pH 8.2 311._,6 x 10:2 20oC, pH 7.7 322.1 x 10 25 C, pH 903 33
ADH-DPN+ -42.6 x 10 dissociation 5-4 gonstant
1.7 x 10_4 26 C '51_6 x 10_4 23~C, pH 6.0 292.3 x 10 23 C, pH 7.15 29
-4· 23~C, pH 6.0ADH·Acet 0.54 x 124 291.~4x 10 23oC, pH 7.15 2910 -4 26 C 51.8 x 10 \ -.' dissociation 5
constant
4 -5 ° . 29ADH-DPNH o. 3 x 125 23oC, pH 6.01.0 x 10_
5 230C, pH 7.15 292.3 x 10_5
26, C .51.3 x 10 dissociation 5
constant
13
,YEAST ADH=DPN COMPLEX
CI
NHH
HH
Figure
YEAST ADH= DP NH COMPLEX
YADH - COENZYME COMPLEX

14
dinium ion.
fJ -Picoline was the only analogue of DPN+ which inhibited DPN+
+reduction. It was found to be competitive with respect to DPN. It
had little effeot on the reverse reaction, while the pyridine analogue
had no effect on the forwardreaotion, but inhibited strongly the re-
duction of acetaldehyde.
Since pyridinium ions inhibit the forward reaction, a negatively charged
group must be important in the binding of DPN+ but not in the binding
of DPNH. Combining this information with that of Barron and Levine (19)
who showed a decrease of eight sulfhydryl groups, they prqposed the bind-
ing of the coenzyme to the enzyme as shown in Figure 1.
The pyrophosphate group is proposed to be more important in the ,
binding of DPNH than in the binding ,of DPN+, and the pyridinium ring
nitrogen is more important in the binding of DPN+.
The mechanism of the coenzyme being bound at at least two sites on
the enzyme is in agreement with the work of Anderson and his coworkers
(37, 38,39, 40, 41). Anderson's work was directed more towards descri-
bing the type of interactions that take place at the binding site than
trying to show exactly what groups are involved in the binding.
According to Anderson, there are two different sites involved in
the binding of the coenzyme to the enzyme. One iS1referred to as the
"pyridinium ring". region, and the other is the "adenine" region. The
"pyridinium ring" region is near a relatively non-polar area w~e~e hydro
J>hobic interactions' enhance binding.
15
To interact with the "pyridinium ring" region, they used N-alkyl-
nicotinamide chlorides, which are structurally related to the coenzyme,
and n-alkylammonium chlorides which are not related to the coenzyme.
Fl~om Table V, it can ,be seen that the inhibition increases with an
increase in the chain length of the substituent. Adenosine diphosphate
(ADP) and adenosine diphosphoribose (ADPR) were used as inhibitors of
the adenine region (41). In later studies, adenylic acid (AMP) was
also used.
To show that these two binding sites are independent, Anderson
and Fonda (42) did some multiple inhibition studies using the N-alkyl-
nicotinamide (butyl to heptyl inclusive) and n-alkylammonium chlorides
(butyl to octyl inclusive) and AMP and ADPR. The adenine inhibitors
inhibited both the oxidation of ethanol and the reduction of acetalde-
hyde, but the pyridinium inhibitors inhibited only the oxidation of
ethanol.
In multiple inhibition studies, the ratio of the initial velocity
without inhibitor to the initial velocity with inhibitor is plotted
versus the concentration of this inhibitor. The concentration of the
second inhibitor is kept constant. This is done for different concen-
trations of the second inhibitor giving a family of lines. If the two
inhibitors are mutually independent, the lines will converge. The point
of intersection is equal to ~Kr. Kr is the inhibition constant for the
first inhibitor and ~is the interaction constant for the pair of in-
,I
;
hibitors. It is usually less than one. If the two inhibitors are muI
tually exclusive, the series of lines will be parallel with an interac
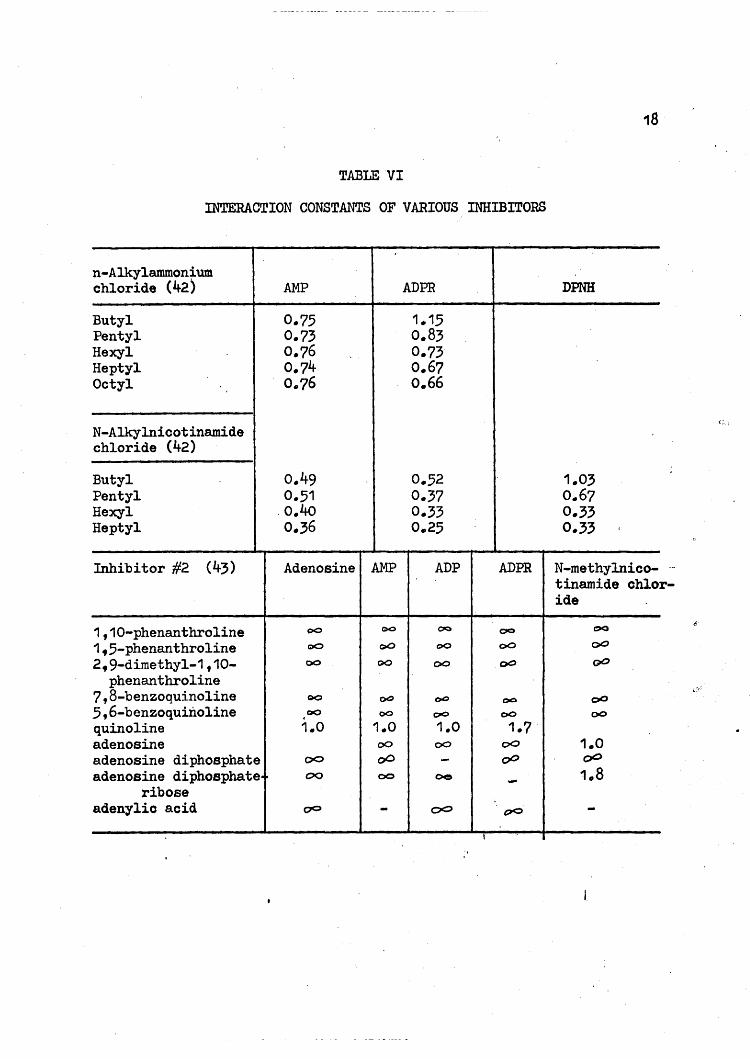
tion constant of infinity. Some typical examples of interaction con-

TABLE V
INHIBITION CONSTANTS OF N' -ALKYLNICOTINAMIDE AND n-ALKYLAMMONIUM CHLORIDES
Alkyl group N'-alkylnicotinamide (37, 39) n-alkylammonium chloride (38)K. Comments K. Comments
1 1
-2 competitive withmethyl 6.51 x 10_2 +propyl 5.72 x 10 2 respect to.DPNbutyl 4.62 x 10⁻² and non-competi-
8.?4 x 10:~pentyl 2.85 x 10:2 tive with respect inhibit both the oxidationhexyl 1.61 x 10 3 to 3~44 x 10_2 of EtOH.and the reductionheptyl .- 8.86 x 10:3 ethanol 1.61 x 10 3 of acetaldehyde. For theoctyl 4.85 x 10_3 mixed inhibition 8.9 x 10-
3 reduction, a higher concen-nonyl 2.24 x 10_3 (octyl through 2.88 x 10- tration is necessary. Itdecyl . 1.33 x 10_4 dodecyl) is more complex. Low con-undecyl . 7.63 x 10_4 centrations activate.dodecyl It.25 x 10 2
comp. with respect to DPN+benzyl 1.18 x 10-lauryl mixed
~
- )
~
0\
_\~'-
it i l\illnu,\\~mIIUm\tW'lI~\iLnlm.lli:\...h\,\tU\ilmt...MIfu\iMIIi\lm[iiii1.b.MI.\t illlwmil,UlalAilii\i,('iti,1 ill "t. .0.
'"
17
stants are given in Table VI.
From the interaction constants, it can be seen that the two types
of inhibitors are independent of each other, supporting the two site
mechanism. As a matter of fact, there seems to be a slight enhancement
between the adenine inhibitors and the N-alkylnicotinamide chlorides.
The binding of DPNH is independent of the binding of the N-alkylnico-
tinamide chlorides, but it is not independent of the adenine binding
site.
There is still the question of the pyrophosphate group. Van Eys,
Ciotti and Kaplan (35) have postulated that it is bound to the zinc
because the pyrophosphate group. shows activation at low concentrationsp
and inhibition at high concentrations, the same as OP. Anderson and
Re~1olds (44) showed that the Kr with respect to DPN+ for ADP was close
to the KI
for AMP and that it was the adenine group rather than the
phosphate group which was involved in the binding. The KI's with re
spect to DPNH were quite different and they concluded that the pyro-
phosphate group may be more important for the binding of the DPNH.
This agrees with the work of Van Eys, Ciotti and Kaplan.
There haven't been many studies on the binding of the substrate
to the coenzyme. It is known that only one molecule of ethanol is
oxidized at a time even though there are four molecules of coenzyme
bound (20). Barronmd Levine (19) did some work with the binding of
the substrate using substituted derivatives of ethanol.
Barron and Levine (19) postulated that the terminal methyl group
was involved in binding to the active center. Substitution oi an amine
group and an acyl group for one of the hydrogens of the methyl group
18
TABLE VI
INTERACTION CONSTANTS OF VARIOUS INHIBITORS
C:,.\,
r-
n-Alkylammon~um
chloride (42) AMP ADPR DPNH
Butyl 0.75 1.15Pentyl 0.73 0.83Hexyl 0.76 0.73Heptyl 0.74 0.67Octyl 0.76 0.66
N-Alkylniootinamidechloride (42)
Butyl 0.49 0.52 1.03Pentyl 0.51 0.37 0.67Hexyl .0.40 0.33 0.33Heptyl 0.36 0.25 0.33
Inhibitor #2 (43) Adenosine AMP ADP ADPR N-methylnioo-tinamide chloide
1,10-phenanthroline 00 C>O CIa 00 OQ
1.5-phenanthroline 00 e>O QO 00 00
2,9-dimethyl-1,10- 00 QO 00 00 QO
phenanthroline7,8-benzoquinoline QO ()Q t>O oc 005,6-benzoquinoline 00 00 00 00 00
quinoline 1.0 1.0 1.0 1.7adenosine 00 00 00 1.0adenosine diphosphate 00 00 - 00 00
adenosine diphosphate.~ 00 00 oe - 1.8ribose
adenylic acid 00 - 00 (70 -I

19
+produced a loss of ability to reduce DPN. The substituted derivatives
of ethanol did not inhibit the rate of oxidation of ethanol"however,
when they were present in a concentration five times as great as the
concentration of ethanol. Fluoroethanol and chloroethanol caused com-
plete inhibition 'when present in'this 'same ration of 5:1, and fluoro
ethanol caused ~~ inhibition when present in the ratio of 0.33:1. Sub
stitution of OH with ON, NH2, or COOH had no effect. Westheimer (45) .
also postulates that the methyl group is bound to the enzyme.
Most of the rest of the work that has been done involving the
substrate has involved kinetic studies which have been designed to. de-
termine whether the binding between the coenzyme, the substrate, and
the enzyme is ordered or random.
an ordered binding.
Recent nmr studies show evidenoe of
The nmr studies are based on the line widths in the spectra. The
line widths are sensitive to the degree and type of moleoular motions
occurring in the sample. An increase in the width of the line is 88S0-
ciated with a decrease in molecular motion, particular~y rotational.
This increase in line width is observed when a small molecule is bound
to a large molecule.
There are no observable differences between the spectrum of ethanol
and the spectrum of ethanol and enzyme (46, 47). It may be that the
substrate is bound to the enzyme but not in a stereospecific manner as
it is in the presence of the coenzyme. There was' an observed change in. +
the spectrum when DPN was added. with slight broadening of the lines andI
a decrease in intell8it~. Without further etudy, Hollis and his cowork-
ere are not willing to conclude that this ahows binding of ethanol in

20
. +the presence of DPN. They think that it may be due to a preferential
binding of DPNH and acetaldehyde.
They did show, however, that there did exist a binary complex
between the coenzyme and the enzyme. They found a greater interaotion
between the adenine protons and the enzyme than between the nicotinamide
protons and the enzyme. Earlier workers (48) had shown the interaction
of the pyridine ring and the enzyme. The nmr should be helpful in fur-
ther studies on the binding of the coenzyme and substrate and the bind-
ing of the inhibitors.
'Up until this time, the only conclusions on a random versus or-
dared mechanism have been based on kinetic studies. The early kinetio
form of the Michaelis-Menten equation:
coenzyme.
All the work that has been done supports a ternary complex mecha-
(1)v (e) (8)
v = (K + (8) )(K + (0) )s 0
where V is the maximal velocity, (e) is the concentration of the coen-
constant for the substrate, and K is the Michaelis constant for thec
zyme, (8) ia the concentration of the substrate, K is the Michaeliss
studies on YADH were done by Negelein and Wulff (49) and Hayes and
Velick (5),. YADH was shown to follow a rate equation of the general
- 1
nism (50, 51, 52, 53, 54). Hayes and Velick (5) assumed the formation
of binary complexes between the enzyme and. the coen~ym.e, but they did. ,
not consi~er the binary comple~eB with the sub~trate. Dalziel (55)
concludes that there is no direct evidence for the existence of the. I
bin&17 complexes with the substrate, but Silverstein and Boyer (5')
:---=:1- j
III
i~
III~
21
conclude that they exist_
Silverstein and Boyer's conclusion is based on the existence of
an equilibrium between the ethanol and acetaldehyde which reaches a
peak and then drops with an increase in the concentration of the coen-
zyme. The interconversion of the coenzyme stays essentially constant,
and is quite considerable even in the presence of high substrate con-
centrations.
Silverstein and Boyer proposed a random binding mechanism invol-
ving all four binary complexes and the two ternary complexes. Up until
this time, the interconversion of the ternary complexes was believed
to be the slow step. They showed that the dissociation of the coenzyme ~(
from the ternary complex was the slow step, and not the interconversion
of the ternary complex.
All the above work is based on initial velocity studies or equi-
librium studies. Wratten and Cleland (52) using product inhibition
studies showed that YADH follows an ordered Bi Bi mechanism. The rate
equation for this mechanism was derived by Cleland (56). Several terms
in this rate equation will drop out if a rapid equilibrium exists where
the interconversion of the ternary complex is rate limiting. They will
also drop out if the ternary complex is essentially nonexistent. Wratten
and Cleland showed that these terms did not drop out. There is an exist-
ence of a ternary complex, but it is not rate-limiting.\
In their product inhibition studies, theY,found both ethanol and
acetaldehyde to be noncompetitive inhibitors with respect to each other,
• +and DPNH was a competitive inhibitor with respect to DPN. This is in
agreement with the work of Hayes and Velick (5).
22
This recent work of Wratten and Cleland together with the nmr
studies of Hollis favor ordered binding of the coenzyme and the sub-
strate with the coenzyme binding first. Both of them must be bound in
order for the reaction to till~e place.
The reac~ion catalyzed by YADH is stereospecific for both the co-
enzyme and the substrate. The transfer of hydrogen is from one side of
the alpha carbon of ethanol to one side of the pyridine ring at the 4
position (45, 57, 58). This is a direct transfer from the substrate to
the coenzyme involving no exchange with the solvent (58, 59).
The stereospecificity towards ethanol was sho\~ using ethanol
which had been prepared enzymatically from two different deuterated
sources. Part of the ethanol was prepared enzymatically from deutera-
ted acetaldehyde, and the other part was prepared from the deuterated
reduced form of the coenzyme. When thedeuterated ethanol produced
from the acetaldehyde was used as the substrate in the enzyme reaction,
all the deuterium was found in the acetaldehyde and none in the DPNH.
When the ethanol produced from the oxidation of DPND was used as the
substrate, all the deuterium was found as DPND and none in the acetal-
dehyde (58). If there were no specificity towards the ethanol, there
should be an equal chance of deuterium occurring in the acetaldehyde
or in the coenzyme.
The stereospecificity towards the coenzyme was sho\Vll using enzy-I
matically prepared DPND and chemically prepare4 DPND. The enzymatical-
ly prepared DPND transferred all its deuterium to the acetaldehyde to• I
form monodeutereoethanol, while the chemically prepared DPND transferred
6~~ of its deuterium to the acetaldehyde (57). Since the enzyme is
23
stereospecific with respect to the coenzyme, it can use only one form
of the coenzyme. It has been shown through the use of deuterium that
there are two forms of the coenzyme. In one form, the deuterium is
above the plane of the pyridine ring. In the other, it is below the
plane of the ring. The first form is 'referred to as form A and the
second form is form B. YADH is speoifio for form A. This explains the
differenoe between the transfer of deuterium by the enzymatioally pre-
pared DPND and the ohemioally prepared DPND. The enzymatic prepara-
tion yields only.,the A form, while the ohemically prepared DPND is a
mixture of the two forms. With form B, YADH transfers the hydrogen
rather than the deuterium.
As already mentioned, the solvent does not enter into the oxida-
tion reduction reaotion. The transfer of hydrogen is direot from the
substrate to the ooenzyme, but this does not exolude the possibility
that an amino aoid group of the enzyme may help in.this transfer.
Sohellenberg has studied this possibility using both tritium labeled
coenzyme and substrate (60, 61). He found that the ooenzyme had to be
present in order for the labeling of the enzyme by the substrate to take
plaoe, but the substrate did not have to be present for labeling by the
ooenzyme to take place.
He interrupted the reaction at equilibrium with several different
. denaturing agents (heat, HCl04~ NaOH) to show that·the labeling was not
a function of denaturation. Through f~ther studjies, Sohellenberg was
able to show that this labeling took plaoe on the p-oarbon of the tryp
tophan residue (61). }3oth·Schellenberg and Palm (62) showed llabeling to
take plaoe non-enzymatically, but this labeling did not take place on
.'

24
the tryptophan residue. More evidenoe is necessary before it can be
conclusively stated that the tryptophan residue takes part as an inter
mediate in the hydrogen transfer from the substrate to the coenzyme.
There still remains at least one question about hydrogen trans
fer. This is the question of what is'actually transferred. It may be
a hydrogen ion and two electrons, a hydride ion, or a hydrogen atom and
one electron. Vennesland and ooworkers are still working on this ques
tion, but so far they have not been able to answer it.
Much of what is known about enzymes has come through inhibition
stUdies. Borne of these studies have been used in the preoeding pages
to describe certain aspects of the enzyme. The inhibition studies that
have thus far been carried out with YADH will be organized in tabular
form including a short desoriptive commeht about the inhibition that
was observed.
...
."
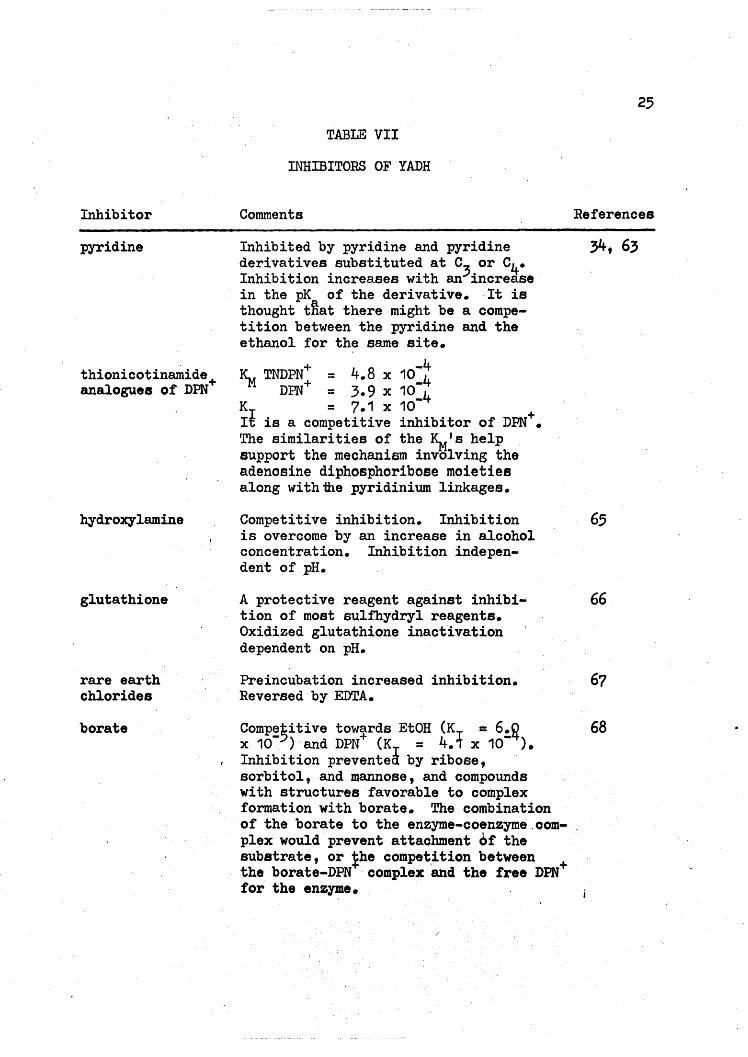
Inhibitor
pyridine
thionicotinamide+analogues of DPN
hydroxylamine
glutathione
rare earthchlorides
borate
TABLE VII
INHmITORS OF YADH
Comments
Inhibited by pyridine and pyridinederivatives substituted at C
3or C4•
Inhibition increases with an increasein the pK of the derivative. It isthought tftat there might be a competition between the pyridine and theethanol for the same site.
+ 8 -4~ TNDPN+ = 4. x 10_4
DPN = 3.9 x 10_4Kr = 7.1 x 10It is a competitive inhibitor of DPN+.The similarities of the ~'s helpsupport the mechanism involving theadenosine diphosphoribose moietiesalong withthe pyridinium linkages.
Competitive inhibition. Inhibitionis overcome by an increase in alcoholconcentration. Inhibition independent of pH.
A protective reagent against inhibition of most sulfhydryl reagents.Oxidized glutathione inactIvationdependent on pH.
Preincubation increased inhibition.Reversed by EDTA.
Compegitive towards EtOH (Kr =6.~x 10- ) and DPN+ (K = 4.i x 10- ).Inhibition prevente~ by ribose, 'sorbitol t and mannose, and compoundswith structures favorable to complexformation with borate. The combinationof the borate to the enzyme-coenzyme.oomplex would prevent attachment 6f thesubstrate, or the competition between
~, +the borate-DPN 'complex and the free DPNfor the enzyme.
25
References
34, 63
6.5
66
67
68

26
TABLE VII (oont'd)
Inhibitor Comments Referenoes
O(-tocopherol,propyl gallate,nordihydroguaiaretic aoid
Inhibited at low conoentration.Caused an aooeleration of the inactivation by the impurities of the
- +distilled water. DPN proteoted theenzyme.· Inhibition by propylgallateretarded or eliminated by EDTA.
69, 70
37, 3839, 4042
36, 40:.:
41. 42
41,.. 42
36, 44, 71
72, 73
See Text-and Table V.n-alkylammoniumchlorides .NJ.alkylniootinamide chlorides
adenosine
adenine diphosphate (ADP)
Reversed by inoreasing the concentra-. + 6-L+
t~on of DPN ; KI = 5. x 10 •
Competitive wi~3 respect to DPN+;K =8.45 x 10 • Competes with 1,10ptenanthroline (OP). See Table VI.
adenine diphos- Competitive wi~~ respeot to DPN+;phoribose (ADPR) KI =2.65 x 10 • Competes with OPe
adenylic acid (AMP) Reversible inhibition. KI =4.8 x 10⁻⁴•
Roussin's salt Competitive with res~~ct to ~?N+.[Fe4~3(N02~K Reversible. K = 10 to 10 •
Rea~ts with only one ohemioal group,m:-:s and the NH group of the imidazoler~tig.
phenobarbital Competitive wit~2respeot to DPN+;(Kr = 2.§~ x 10 and DPNH (KI =4., x 10 ).
74, 75
dyes Fuschin and malaohite gr~en oompetitive with respeot to DPN and DPNH. .Crystal violet is non-oompetitive.
bromopyruvate . Irreversible. Inhibition deoreaseswith inoreasing pH•.
N-ethylmaleimide· Irreversible. Coenzyme proteotsagainst inhibition. Inhibition inoreases with increasing pH.
76
77
·77j .
! I ..
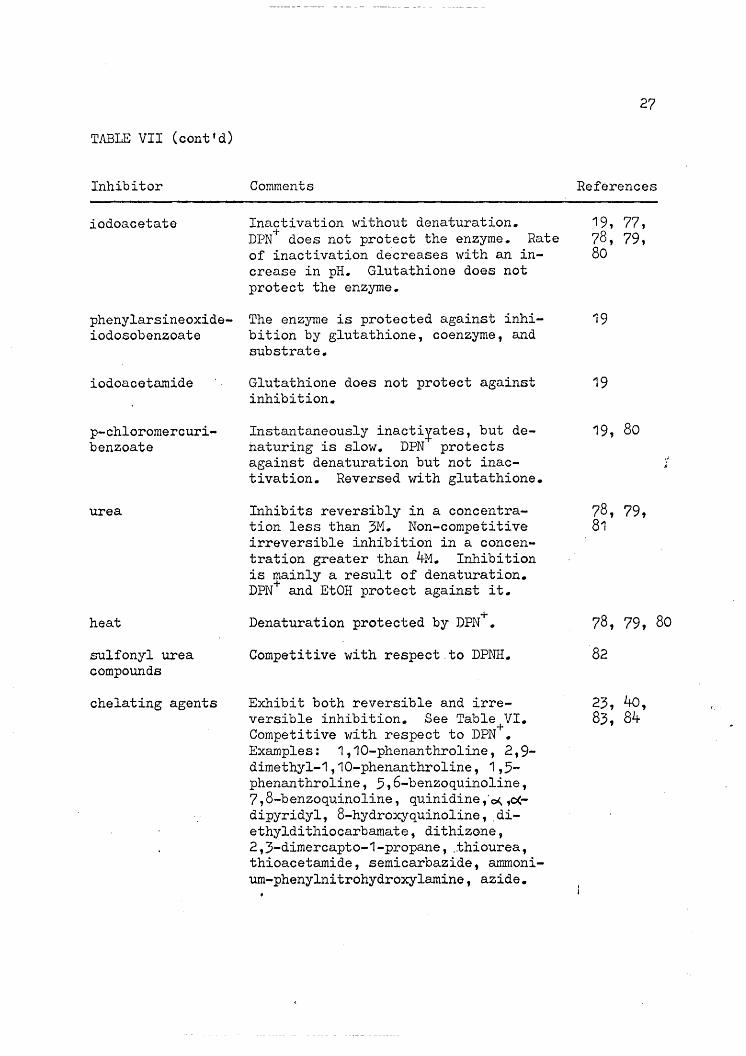
TABLE VII (cont'd)
Inhibitor
iodoacetate
phenylarsineoxideiodosobenzoate
iodoacetamide
p-chloromercuribenzoate
urea
heat
sulfonyl ureacompounds
chelating agents
Comments
Inactivation without denaturation.-\-
DPN does not protect the enzyme. Rateof inactivation de'creases with an increase in pH. Glutathione does notprotect the enzyme.
The enzyme is protected against inhibition by glutathione, coenzyme, andsubstrate.
Glutathione does not protect againstinhibition.
Instantaneously inacti¥ates, but denaturing is slow. DPN protectsagainst denaturation but not inactivation. Reversed with glutathione.
Inhibits reversibly in a concentration less than 3M. Non-competitiveirreversible inhibition in a concentration greater than 4M. Inhibitionis mainly a result of denaturation.DPN+ and EtOH protect against it.
Denaturation protected by DPN+.
Competitive with respect ,to DPNH.
Exhibit both reversible and irreversible inhibition. See Table VI.Competitive with respect to DPN+.Examples: 1,10-phenanthroline, 2,9dimethyl-1,10-phenanthroline, 1,5phenanthroline, 5 ,6-benzoquinoline ,7, 8-benzoquinoline, quinidine,.~ ,0(
dipyridyl, 8-hydroxyquinoline, ,diethyldithiocarbamate, dithizone,2,3-dimercapto-1-propane, ,thiourea,thioacetamide, semicarbazide, ammonium-phenylnitrohydroxylamine, azide.
27
References
19, 77,78, 79,80
19
19
19, 80
78, 79,81
78, 79, 80
'82
23, 40,83, 84
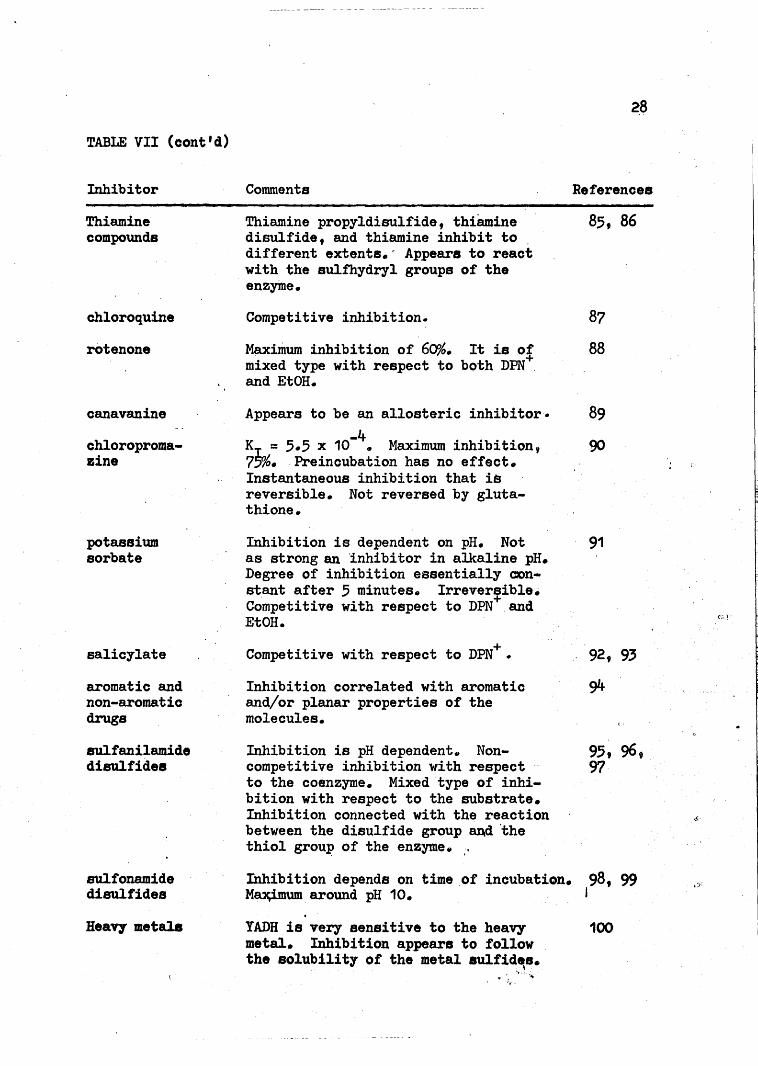
TABLE VII (cont'd)
Inhibitor
Thiaminecompounds
chloroquine
rOtenone
~8
Comments References
Thiamine propyldisulfide, thiamine 85, 86disulfide, and thiamine inhibit todifferent extents.' Appears to reactwith the sulfhydryl groups of theenzyme.
Competitive inhibition. 87
M~imum inhibition of 60%. It is of 88mixed type with respect to both DPN ,and EtOH.
Appears to be an allosteric inhibitor. 89
K =5.5 x 10⁻⁴• Maximum inhibition, 90
7~~. Preincubation has no effect.Instantaneous inhibition that isreversible. Not reversed by gluta-thione.
canavanine
chloropromazine
potassiumsorbate
salicylate
aromatic andnon-aromatiodrugs
Inhibition is dependent on pH. Notas strong an 'inhibitor in alkaline pH.Degree of inhibition essentially constant after 5 minutes e Irreversible.Competitive with respect to DPN+ andEtOH.
+Competitive with respect to DPN •
Inhibition correlated with aromaticand/or planar properties of themolecules.
91
92, 93
su1fanilamidedisulfides
sulfonamidedisulfides
Inhibition is pH dependent e Noncompetitive inhibition with respectto the coenzyme. Mixed 'type of inhibition with respect to the substrate.Inhibition connected with the reactionbetween the disulfide group ~d 'thethiol group of the enzymee
Inhibition depends on time of incubation. 98, 99M~ around pH 10. I
e.
Heavy metals YADH is very sensitive to the heavymetal. Inhibition appears to followthe solubility of the metal sulfides•
.,\"';'" ' ...
100
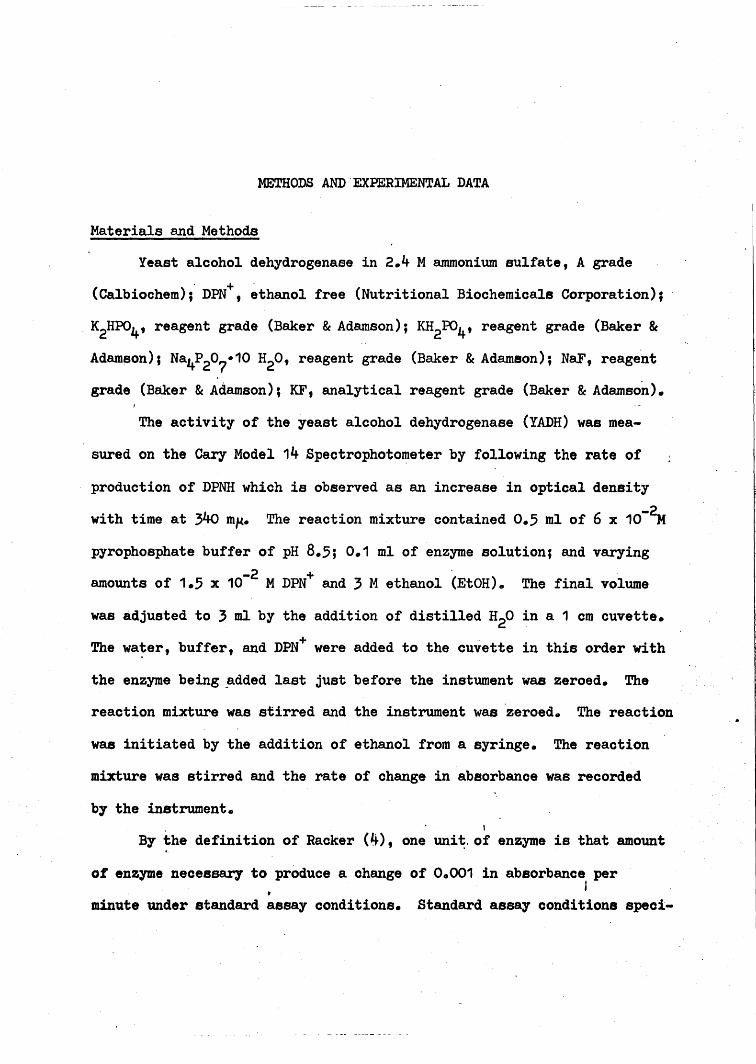
METHODS AND· EXPERIMENTAL DATA
Materials and Methods
Yeast alcohol dehydrogenase in 2.4 Mammonium sulfate, A grade
(Calbiochem);' DPN+, ethanol free (Nutritional Biochemicals Corporation);
. K2HP04 , reagent grade (Baker & Adamson); KH2P04, reagent grade (Baker &
Adam~on); Na4P207·10 H20, reagent grade (Baker &Adamson); NaF, reagent
grade (Baker &Adamson); KF, analytical reagent grade (Baker &Adamson).
The activity of the yeast alcohol dehydrogenase (YADH) was mea
sured on the Cary Model 14 Spectrophotometer by following the rate of
production of DPNH which is observed as an increase in optical density
with time at 340 m~. The reaction mixture contained 0.5 ml of 6 x 10-~
pyrophosphate buffer of pH 8.5; 0.1 ml of enzyme solution; and varying-2 + '
amounts of 1.5 x 10 MDPN and 3 Methanol (EtOH). The final volume
was adjusted to 3 ml by the addition of distilled H20 in a 1 cm cuvette.
+The wa~er, buffer, and DPN were added to the cuvette in this order with
the enzyme being ~dded last just before the instument was zeroed. The
reaction mixture was stirred and the instrument was ·zeroed. The reaction
was initiated by the addition of ethanol from a syringe. The reaction
mixture was stirred and the rate of change in absorbance was recorded
by the instrument.,
By the definition of Racker (4), one unit. of enzyme is that amount
of enzyme necessal7 to produce a change of 0.001 in absorbance perI•
minute under standard assay conditions. Standard assay conditions speci-
f1 0.5 ml of pyrophosphate buffer of pH 8.5; 0.1 ml of enzyme solution;
0.1 ml of DPN+ and 0.1 ml of ethanol. The volume is adjusted to 3 ml
by the addition of 2.2 ml of distilled H20. Once the activity of the
enzyme solution was determined, it was diluted with 10-2 M potassium,
phosphate buffer of pH 7.5, to give an enzyme solution containing
approximately 400 to 600 units per 0.1 ml for use in inhibition studies.
A standard assay graph is shown in Figure 2.
The activity of the solution for the standard assay graph is cal-
'culated from the'change in absorbance for a 15 second interval during
the initial part of the reaction while the reaction is linear with time.
For this solution, the change was 0.100 in 15 seoonds. This is a change;
of 0.400 absorbance 'units per minute. Aooording to the definition of
Racker, this solution contained 400 units of enzyme. Since 0.1 ml of
the enzyme solution was added, the activity of this solution was 4,000
units/ml. This is the lower limit of aotivity for inhibition studies.
To determine the protein content of an enzyme solution, Warburg
and Chr~stian (101) worked out a method based on absorption which does
not require the use of a standard curve. This method gives the protein
concentration of enzyme solutions fairly accurately even though enzymes
vary in their amino acid composition. Warburg and Christian developed
a series of faotors whioh' relate the absorbanoe of an enzyme solution
at 280 mp to the protein concentration. These factors correlate the
ratio of the absorbance of tyrosine and ·tryPto~pa.h at 280 mp. and 260 mJA
to the total protein conoentration. They also account for absorbanceI
due to nucleic acids at these wavelengths, since nuoleic acids are often
present in crude enzyme preparations. These correction factor$9 when

Figure 2. Standard A .Absorban ssay GraphCh ce vs ti
art speed 8 . m~:'. ~~/mJ.n.
31

32
multiplied by the absorbance at 280 mp, give the protein content of the
enzyme solution in mg/ml.
Figure 3 shows the absorption spectrum between 260 and 280 mp for
the enzyme solution used for the standard assay graph. The absorbance
~t 260m,.,. is 0.415 and at 280· mp. is 0.401. The A28c1~260 ratio is 0.966•
. From the table given by Chaykin (102), the factor is 0.76;. When this
is multiplied by the absorbance at 280 mp, one finds that this enzyme .
solution contained 0.307 mg of protein per milliliter.
One can now calculate the specific activity of this enzyme solu-
tion. This is an indication of the purity of an enzyme solution, and
is particularly valuable during recrystallization. To determine this
(~. \.
value, one divides the activity by the protein content.
zyme solution, it was 13,029 units/mg.
For this en-
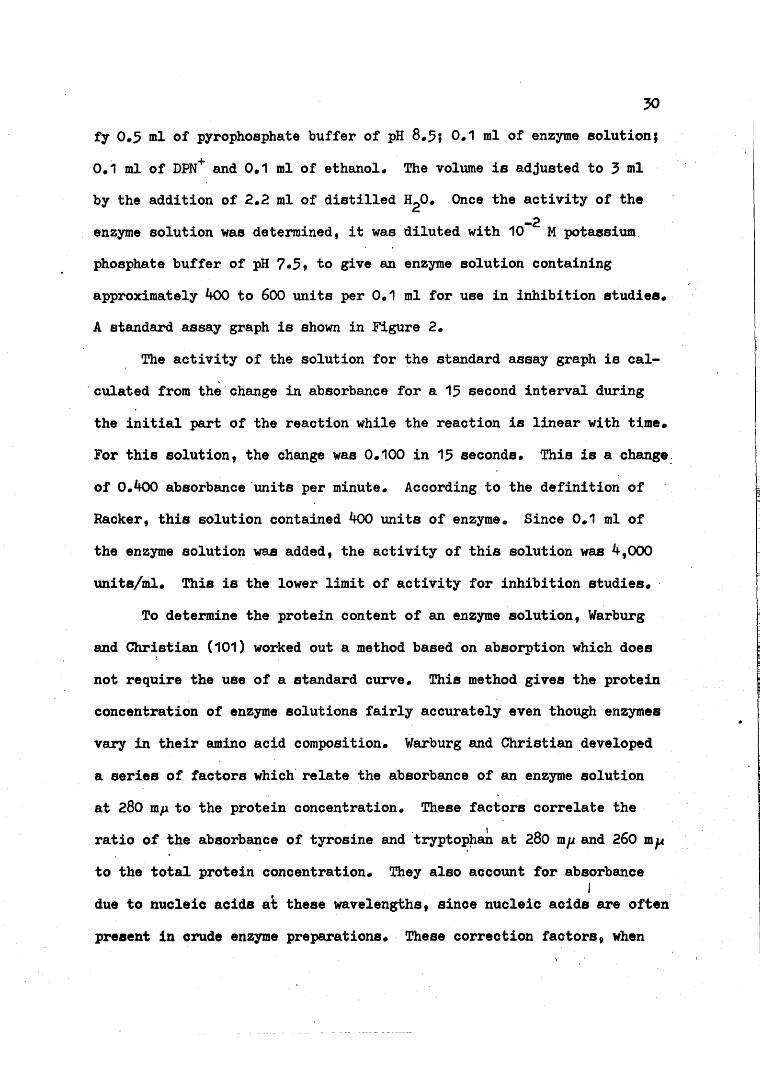
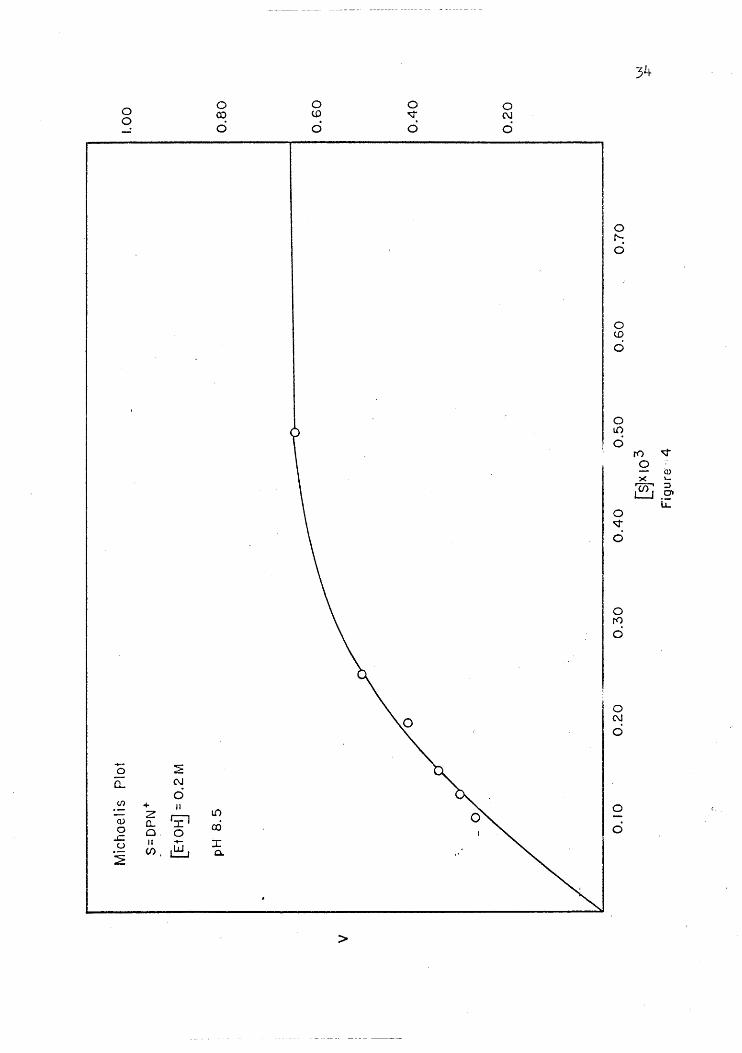
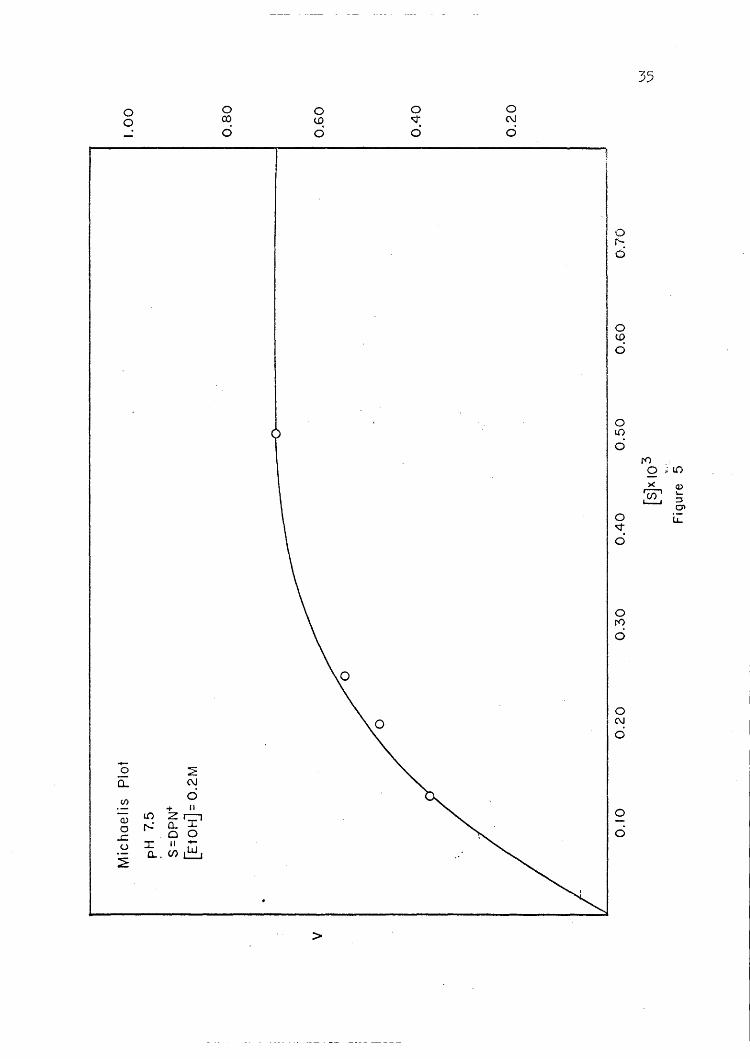
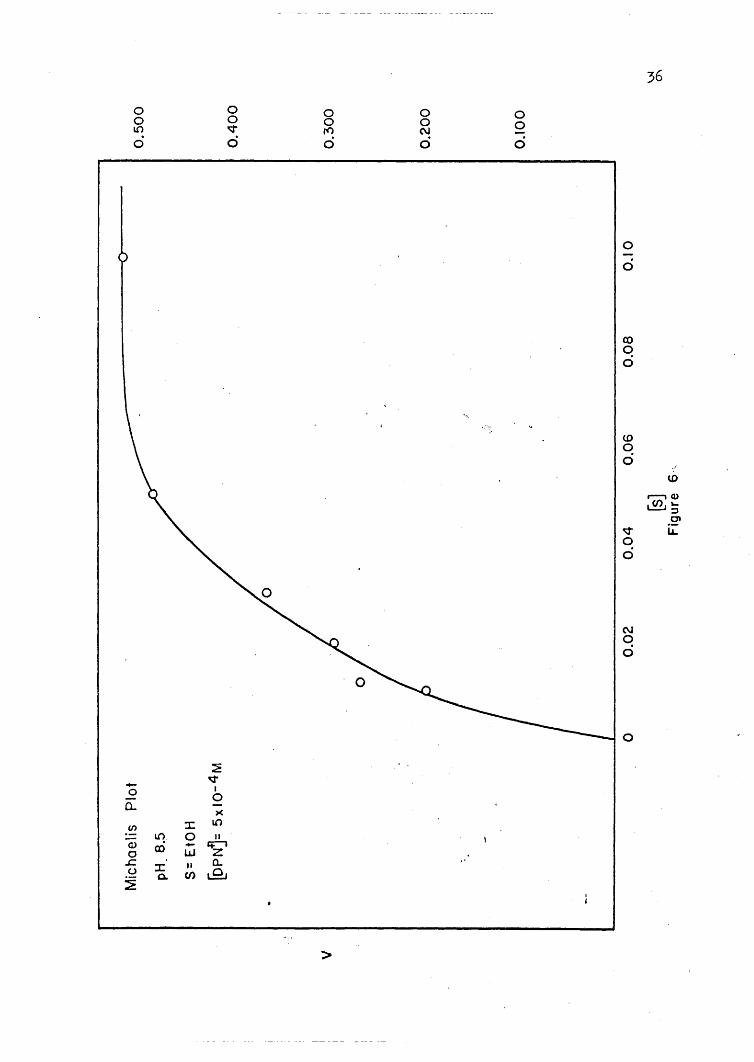
Plots of initial velocity versus substrate concentration and of
initial velocity versus coenzyme concentration are presented in Figures
4 through 7. These· plots show that the enzyme reaction reaches a point
of 'saturation above which further addition of substrate or coenzyme does
not increase the'rate of reaction. In ~ enzyme reaction,· such as that
of YADH, where the reaction is dependent on both a coenzyme and a sub-
strate,' it is very important to keep the concentration of the one that
is being held constant at a point of saturation; so that the change in
the reaction rate is due only to the substance bein~ varied.. I
For the inhibition studies with NaF, KF, ~aCl, and KCl, the enzyme
solutions varied from approximately 400 to 700 units. The salt solutionsI,
varied from 0.001 to 0.12 Min concentration. Both potassium and 8od-
ium salts were used to show any possible effect of the cation. ~e salt
.:".)"

33
iII;
I~
Figure 3. truro of. . Spec seAbsorpt~on D hydrogena •t Alcohol eYeas .
,
oo
oOJ
o
o<.D
o
ovo
oC\J
o
or--:o
o<.0o
I - :E0
a.. C\J
I 0If) + II
Z fJ:lLO
I(]) 0...0 O. 0
ro.c:!! u II - :r:
I :2:CJ), ~ ~
~!1lElill;;;l
I >
~
=::
0LO
0r<> ~
0a>
>< \-
7if' :J
L:..:.J 01
~0--r0
or<>o
oC\J
o
oo
oo
oCO
o
o~o
o"':o
oC\J
o
10r'-c)
o~o
35
-oQ..
(/)
Q)
o.cu
~
:?:C\J
o+ II
L{)ZC1r..: Cl. I
00I II -0... (J) ~
>
0If)
0r<>
XL()0>< Q)
ru=;' ~
L..-..t ::JQ')
0 l.L~
0
or<>o
oC\J
o
o
o
36
0 0 0 0 00 0 0 0 0LO "'1" rO (\J
0 0 0 0 0
oo
cooo
wq0
-'
W
,......., Q)
LE1'-~
.2'~ LL00
~~
(\J~ q~~ 0
a
i~
0
I ~- ~
0 I
I0
Q..)(
(f) :I: LO
i - U1. 0 II
I<l) co - ~a lLJ
.J::. :I: u a-u C/) 8~
a.=1§
~a
I >
~

-oa..(/)
~V
I
o)(
J: L{)
o . ... "w'Z1,,' a.(J)L.QJ
>
oo
ill~0
r'-,..--, C1)
~~
:::JC))
V ~
00
C\Joo
o
(.
38
solution was added to the reaotion mixture in the cuvette immediately
before the reaction was started to prevent any possible effect of time
of contact in inhibiting or activating the reaotion.
Some of the inhibition studies were done holding the DPN+ concen
tration constant at 5 x 10⁻⁴ Mwhile t~e ethanol concentratio~ was
varied from 0.01 to 0.1 M. During the rest of the studies, the ethanol
concentration was held constant at 0.2 M while the DPN+ concentration
was ~aried from 5 x 10⁻⁵ to 5 x 10⁻⁴ M.
The inhibition studies were conducted at two different pH levels.
Since pH 8.5 is the optimum pH ofCthe enzyme (9), it was ohosen as one
pH, and pH 7.5 was chosen as the other one because it is closer to
physiological pH. For the studies at pH 7.5, the pyrophosphate buffer
of pH 8.5 was replaced with 0.5 ml of 6 x 10⁻² M pyrophosphate buffer
of pH 7.5.o 0. The reactions were run at 27 C .:!:. 0.5 o. Since there is no con-
stant temperature bath on the instrument, the temperature of the reac-
tion mixture was recorded at the beginning and at the end of the reac-. 0
tion, and found to vary not more than 0.5 O. A thermometer was kept
inside the cell compartment to check variation in cell compartment
temPerature. This was found not to vary mare than 1°0.
Treatment of Dat~
The initial velocities of the reactions wer~ determined from the
instrumen~ recordings6 These data were then graphed in two different
ways. One method made,use Gfthe Michaelis-Mentenequation (103):
(S) + ~
C1
39
Lineweaver and Burk (103) rearranged this equation in such a manner that
the v and (S) were linear functions of each other. Using the followingo
equation,
+
they graphed 1!vovs 1/{S). Graphically, 1!VMax will be. the y intercept
,and ~/VMax will be the elope. In this type of graph, 1!v tends to show
little variation at high substrate concentrations.
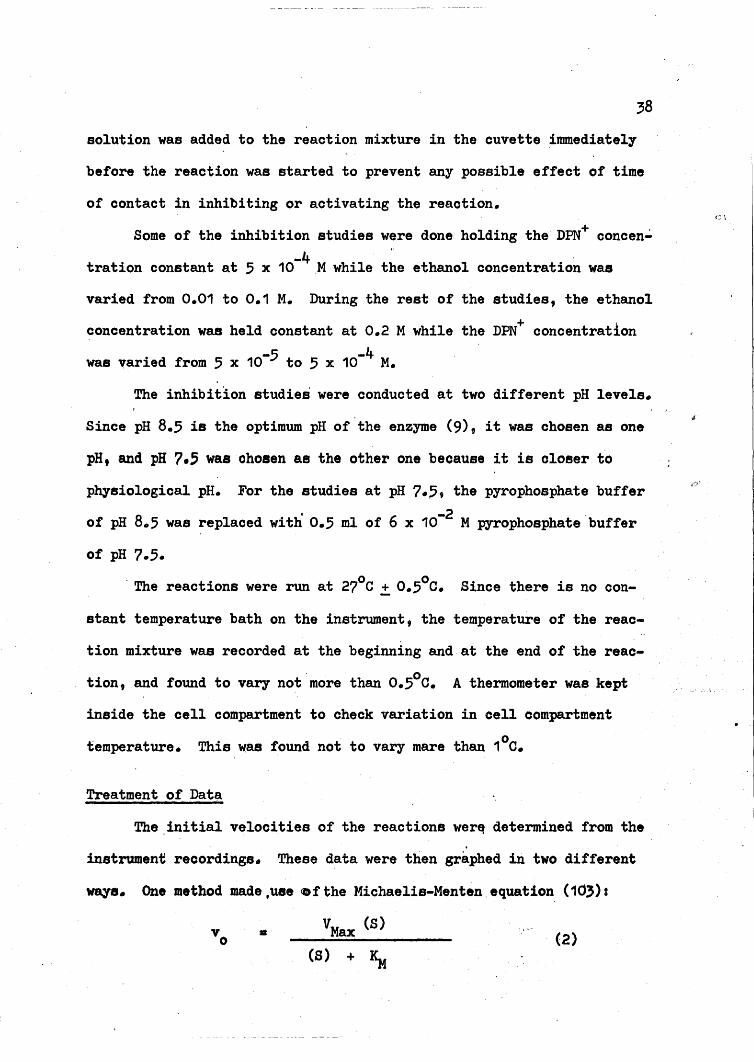
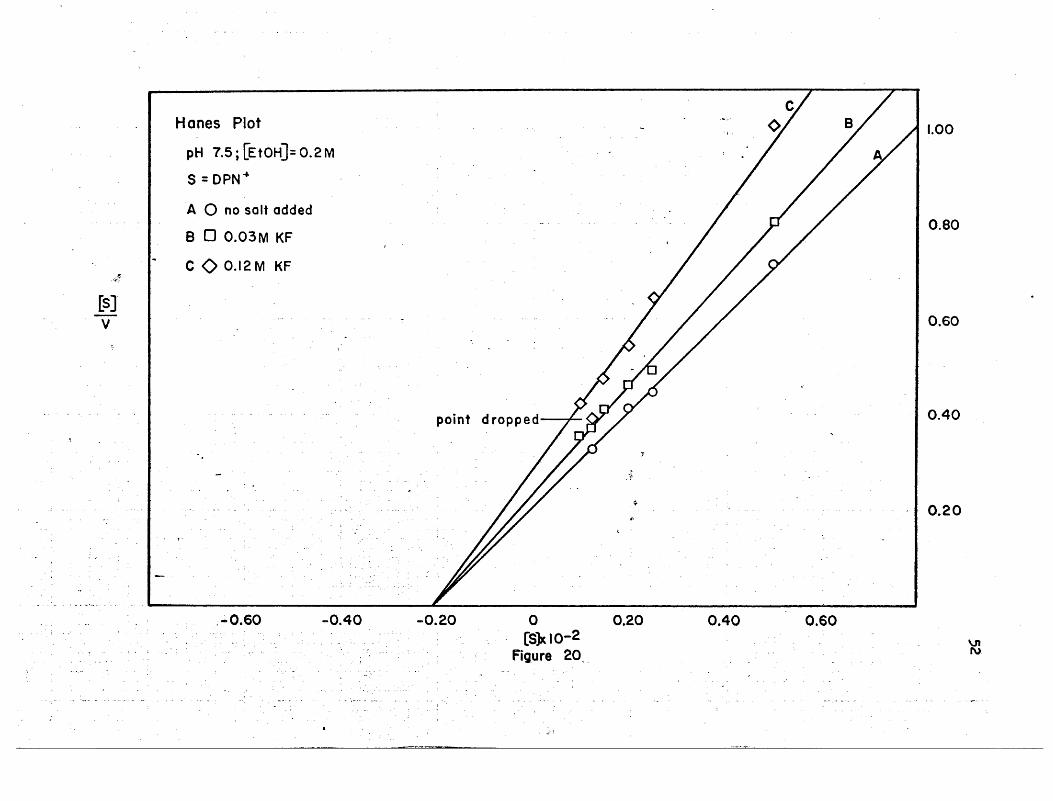
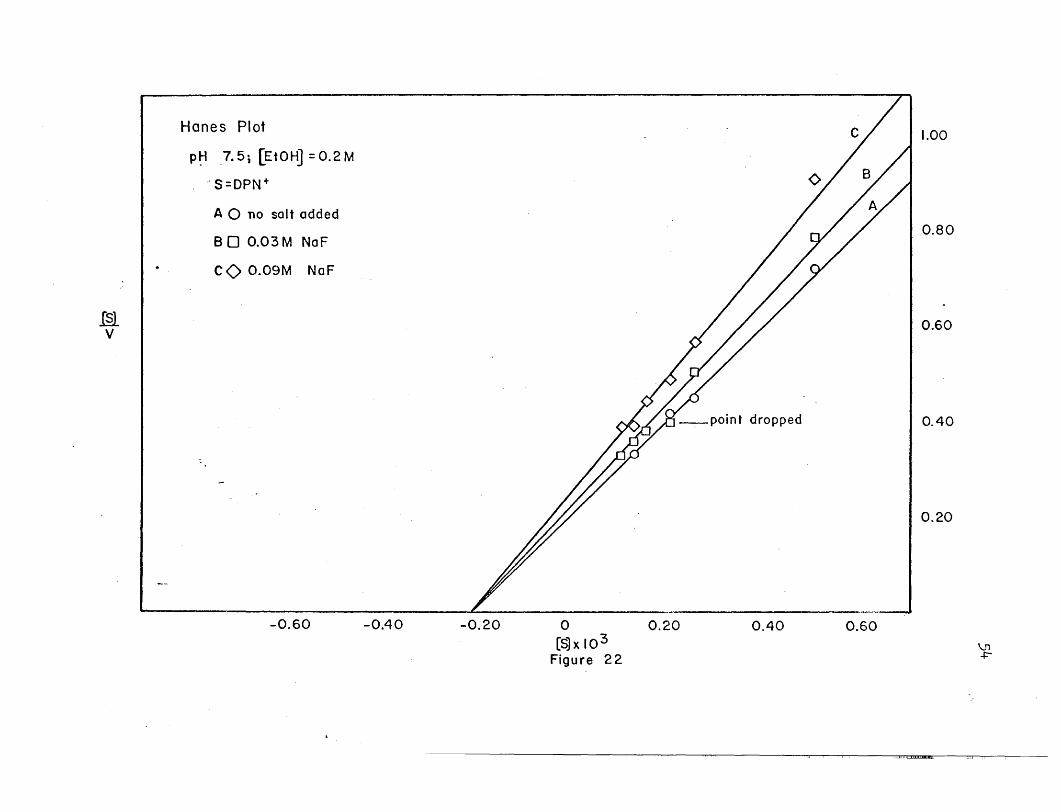
The other method of graphing the data is called a Hanes plot.
The Hanes plot tends to place a more even distribution on the points
even though it is based on the same originai equation (10,). Han••
rearranged the equation to read (103):
= + (4)
Hanes graphed (S)!vo vs (8), where the slope equals 1/VMax and the y
intercept equals KM/VMax.
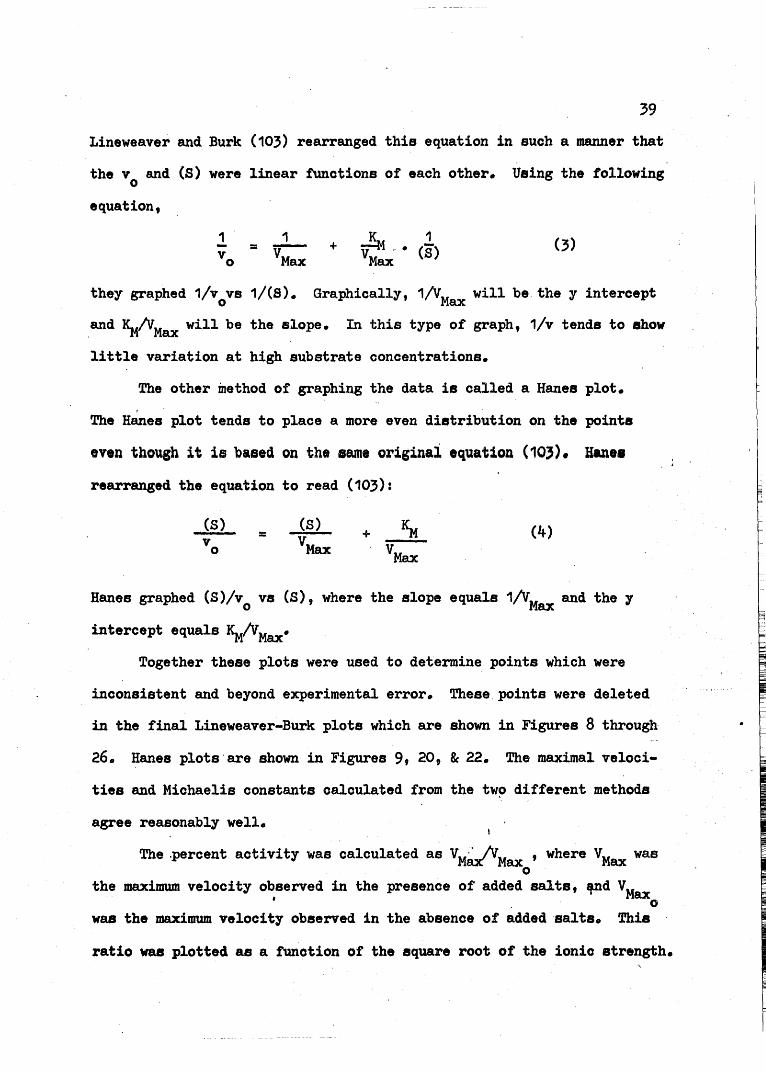
Together these plots were used to determine points which were
inconsistent and beyond experimental error. These points were deleted
in the final Lineweaver-Burk plots which are shown in Figures 8 through
26. Hanes plots' are shown in Figures 9, 20, Be 22. The maximal veloci
ties and Michaelis constants calculated from the two different methods
agree reasonably well.
The .percent activity was calculated as VM~Max ' where VMax waso
the maximum velocity observed in the presence of added salts, ~d VM• ax. 0
was the maximum velocity observed in the absence of added 'saltso This
ratio was plotted as a function of the square root of the ionic strength.

I[. I .IWWIIIIfl",lDIllDllliillllUllUillllllJ.all1illI11lll1!l11DillllllllDDlIIUIDlUlLlIU. !. ,j, ..__ILL.UJIIIIIIII.lIJlllIJIILUm]JI[JJD L.U:.J:lliW.,
1V
Lineweaver - Burk Plot
pH. 8.,5; [EtOH] =0.2M
S=DPN+
A 0 no salt added
BOO.OIM KCI
C <> 0.09 M KCI
5.00
4.00
3.00
2.00
1.00
-20 o 20 40 60_1- x 10-2[S]
Figure 8
80 100
g
j ~. I [Wmll[I'---IffiUJDIffijIllDlLllllillill.limW~~lIIll1Un.I!DlllllIIIIlDIUIJILl ..... ! •••• L:1 1... :.:JIJlDLII.1![lI!llJIU.lJI~JJll LHUlIlL .... JI .Li JllIilIll':·;.:...:.
[5]v
Hanes PlotpH 8. 5; ~tOHJ = 0.2M
S =DPN+
A0 no salt added
B 00.01 M KCI
cO 0.09M KCI
point dropped
1.00
0.80
0.60
0.40
0.20
-0.60 -0.40 -0.20 o
~1 xl03
Figure 9
0.20 0.40 0.60
+-J
-- _.. ----.._------
pH8.~ [EtO~=0.2M
S =DPN+
~N
4.00
3.00
2.00
"":'
5.00
1.00
10080.
.;
i ..
"
tiS
40 60
TsJ x10-2
.. Figure 19'-?,
20o-20
A 0 no salt added
B 0 0.03M. NoCI
C<> 0.12M NoCI
Lineweaver - Burk Plot
~.,
-40
IV
it, i liiilil,luoia=..i=u::aCiliiUil\\Mw(b:Hi i,uii\lU_lIi,I.."CUllm.«i.wLMUic.iui"iwilCiiian"O([,K : n:nwmim(l]ujiii i1kiiii-j hL •..i.·(j~

~
2.00
1.00
10080
I
~.
•
$
6040. I :
. . .[SJx 10-2
. Figure II
20o
Lineweover- Burk Plot - / 15.00-P~ ~.5; [E tOH] =0.2 M
S =DPN+
A 0 no sa It added . - ,.- -- /// I 4.00
B 0 0~03M KF
.~ I C 0 0.09M ·KF
[I)I /.// I 3.00V --_ .. -.- -
~
..;
~
It 1~lmllllll_IUIIIm1ljllllmlilllil~IOO.mIJ"lmllllll:1II_OIlIlmldlllllUllIIIUILil II. 1.1 ullJlmIUllil~uIlIllU1Il] ID Illdilll II II ttiliL
j[ liji~~~~I(~.l~I••'IIUIO[_IJJH!.JJlI.~f.lllil.lI~JJ'1J1HHUill~;.. I II .
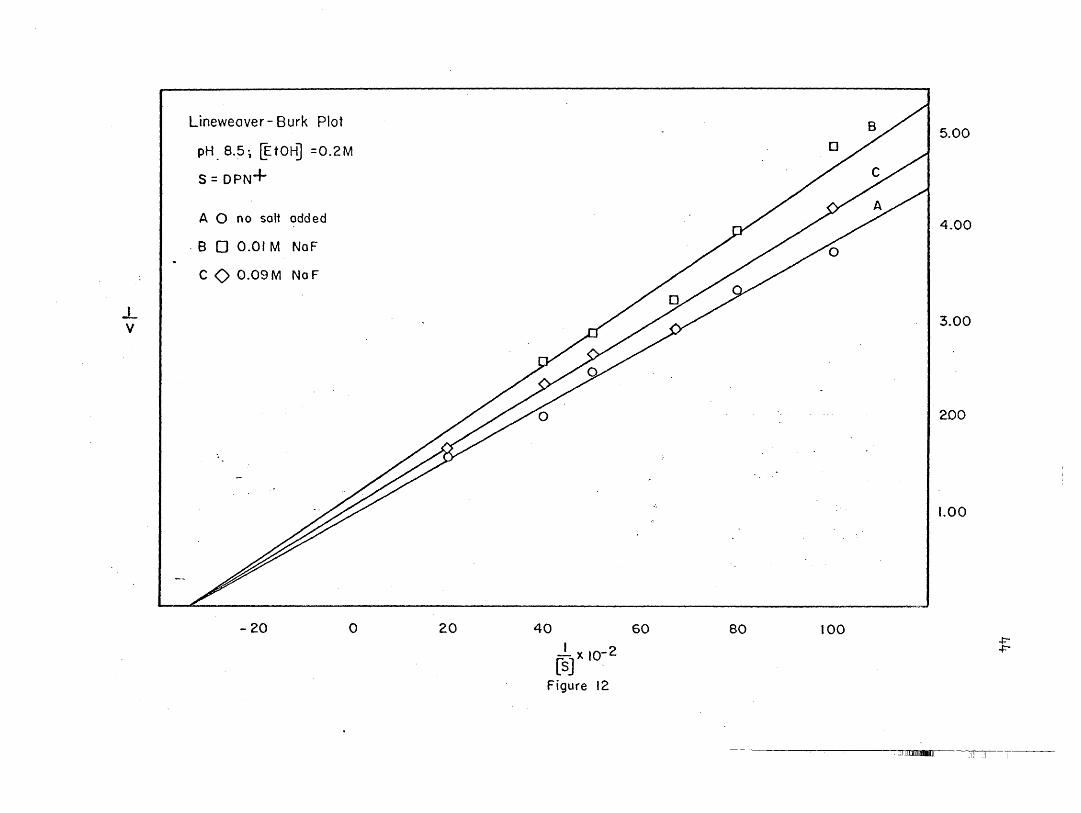
Lineweaver - Burk Plot
pH. 8,5, [EtOH] =O,2M
S =DPN+
A 0 no salt added
. B 0 0.01 M NoF
C 0 0.09M NoF
1v
lillllL:~: .... I!
5.00
4.00
3.00
200
1.00
- 20 o 20 40 60
-l x 10-2[s] .
Figure 12
80 100
-- - -,- .. J2lIlulllIIlllllDI .'11
++-
IV
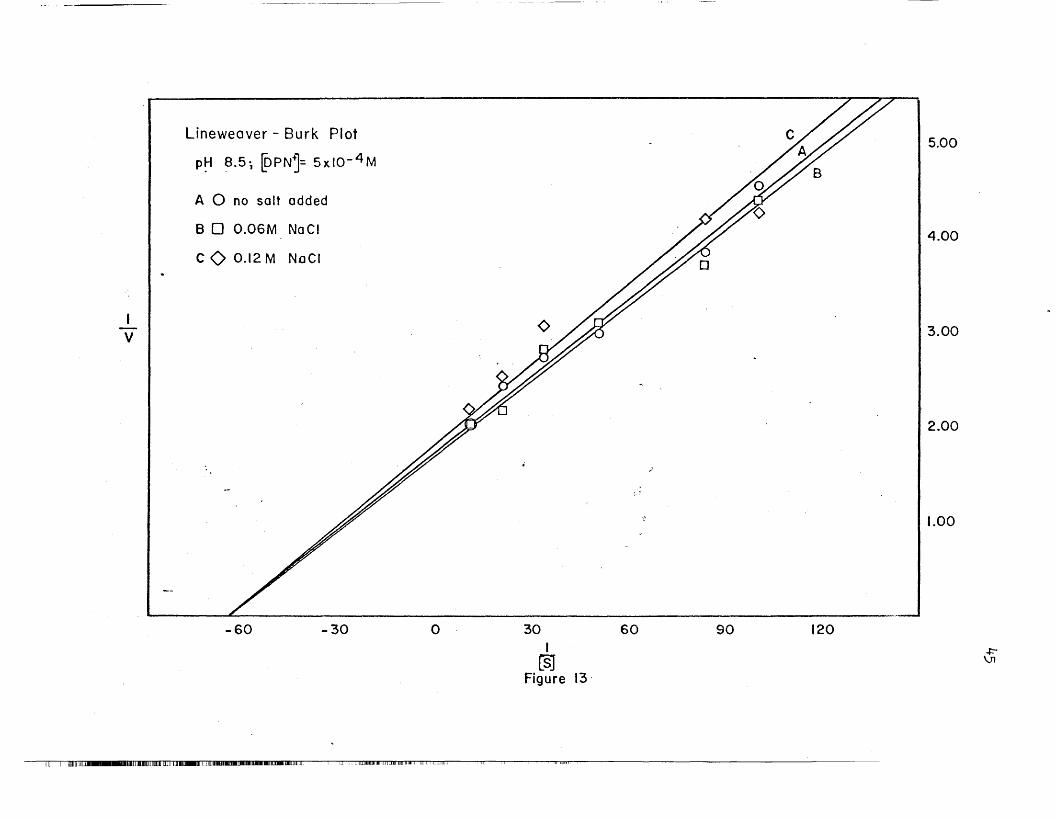
Lineweaver - Burk Plot
p~ ~.5, ~PN'j= 5x10- 4 M
A 0 no salt added
B 0 O.06M Noel
C 0 0.12 M Noel
5.00
4.00
3.00
2.00
1.00
-60 -30 o 30 601
[SJFigure 13·
90 120
+\J1
I r I· Illllll.iIlIll-.ulIDIIlIIIIIIJ[llllIIIll[llll,UlliJ-.JIIIIIIIIIIII,IIIIIIIIII[JJIIIIIWIIIlgmICDIIIllllnJIl][ n-r'CTlrnll'"l1TllrfTClllfllIJrlllrT--.rr-rn:r:-:m=-~--,-,--~~~-~~~-------~
IV
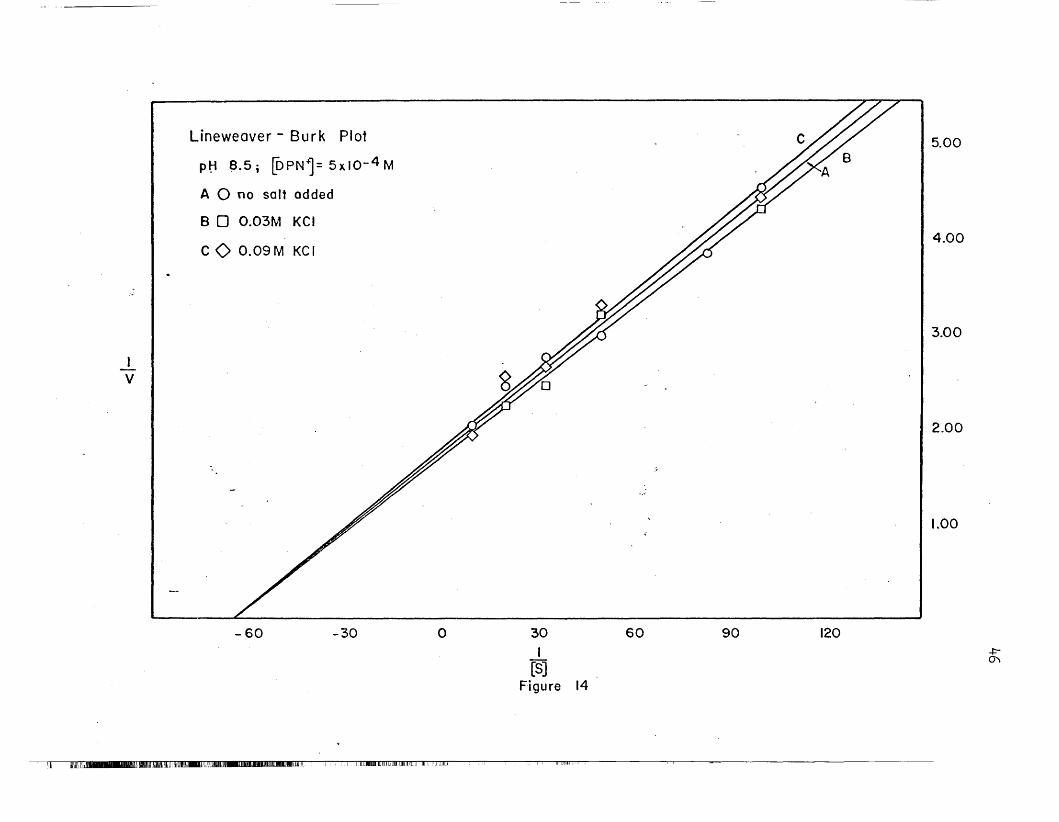
Lineweaver - Bur k PI of
pti 8.5 i [OPNj= 5x10- 4 M
A 0 no salt added
B 0 O.03M KCI
cO 0.09M KCf
5.00
4.00
3.00
2.00
1.00
-60 -30 o 30
f[S]
Figure 14
60 90 120+:~
lUTlIDlllllli~lIIlnUlll\WlIIIJ1III~IIIIl.m,I,.,'IJlIRllnl_UIIIIIllDlllmIilIDIlllUll,.11 DI.-i.II.UWIIlIIIIUllliJIIIIH.nnn 1U1,llf'UII.1 RI-I:1lTI' -~- -- ._--,~---~

IV
Lineweaver - Burk Plot
pH.8.5 [DPNJ= 5x10⁻⁴ M
S =EtOH
A 0 no salt added
B 0 0.01 M NaF
C 0 0.06M NaF
5.00
4.00
3.00
2.00
1.00
-60 -30 o 30I
[SJFigure 15
60 90 120
-+:----J
II \ \ml\lll\llJl..-mllIllIlUIJII!IlIII.[]III,n_lJjIIIlUIIII~llIIIIIlIIIIIIUII\lIII~IIIlDlIIII!IIUl niT '.. MWllllE1Illu;:[unlw:Tllll III [TCTilli] 11----cT,-----,;--r -...,,lni.""liI""'I.r.,----""T------,----~
- "
3.00
&
5.00
4.00
1.00
2.00
120
<>.
90
j-
~
60
:~
:i.-1i"
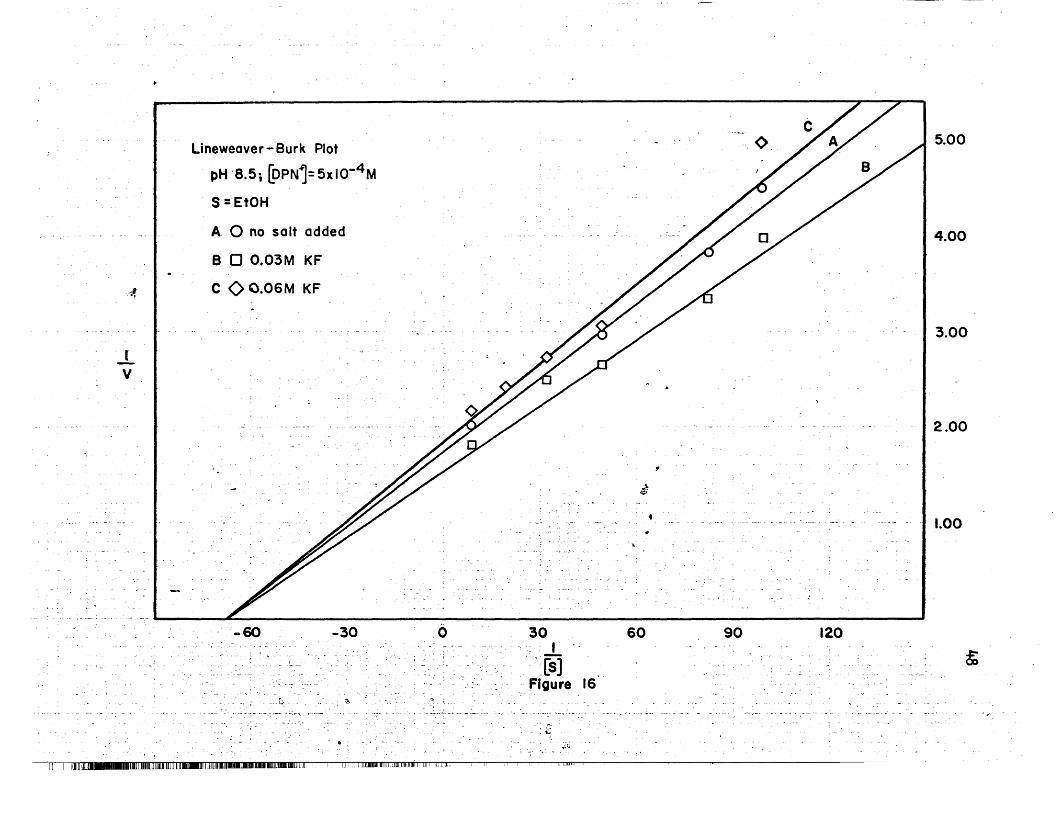
30':. f··-[S]Figure 16
, "
A 0 no salt added
. .
Lineweaver-Burk Plot
~H '8.5; [oPNj=5xI0-4 M
S=EtOH
B 0 0.03M KF
-";f leOO.06M KF
_lV
\&
5.00
3.00
4.00
2.00
.- 1.00
1008060
.,
.J
- If
...
·20 40. ·1 x io":'2~- 00Fi.Qure 17
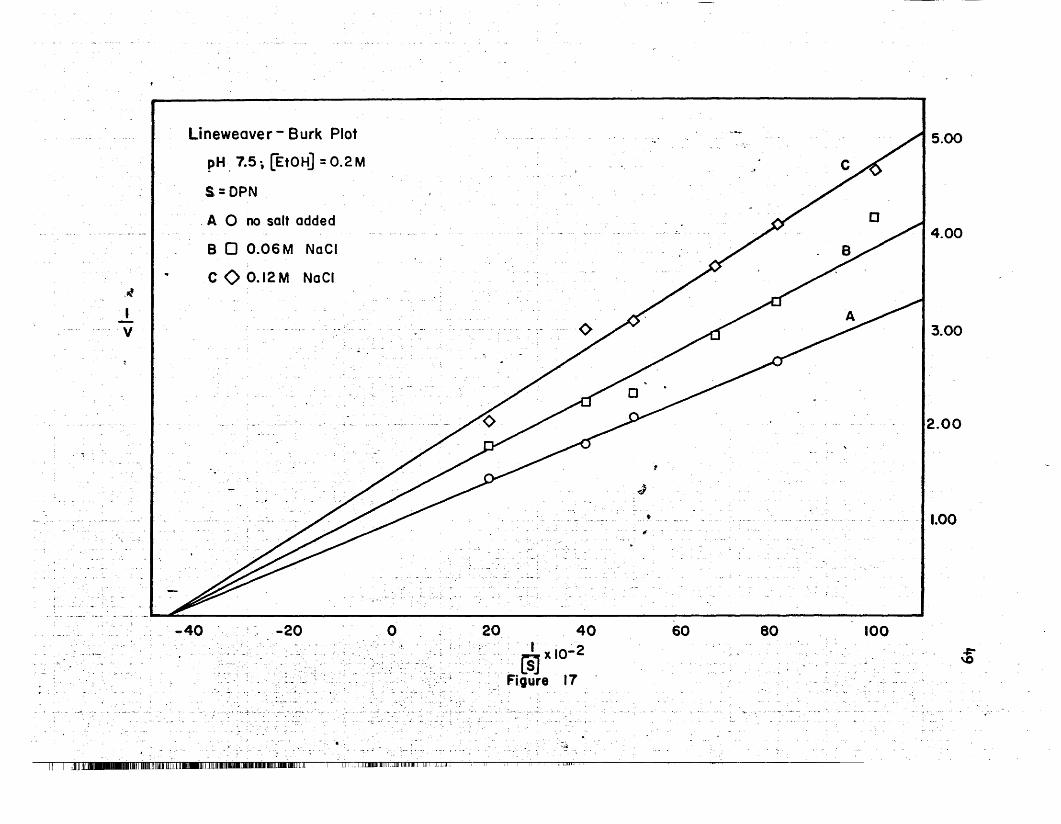
o-20
B 0 O.06M Noel
COO.12M Noel
-A 0 no salt added
Lineweaver - Burk Plot
pH. 7.5 i LEtOH] =0.2 M
S=DPN
-40
,4
1- ·v
,
<. . ... ,_.. _ " •• I ,e: ,
-:" '(-
"-_-r-.
-'-'V
to
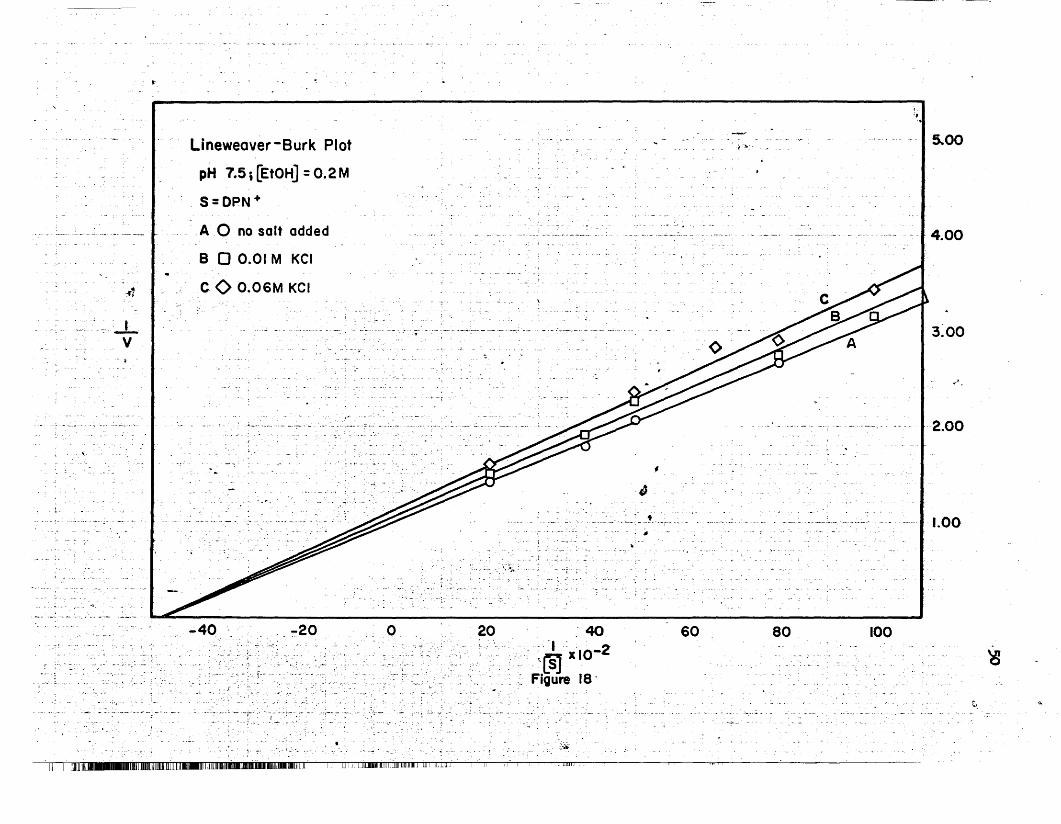
Lineweaver-Burk Plot
pH 7.5 i [EtOH] =0.2 M
S=DPN+
A 0 no salt added
B 0 0.01 M KCI
cO 0.06M KCI
-40 _ .' 40-, t'~(SJ 'x 10-2
'_ Figure 18'
t#
, -
60
,e""
-
80 100
:,
5..00
4.00
3~00
-2.00
1.00
\J4
'tI
,
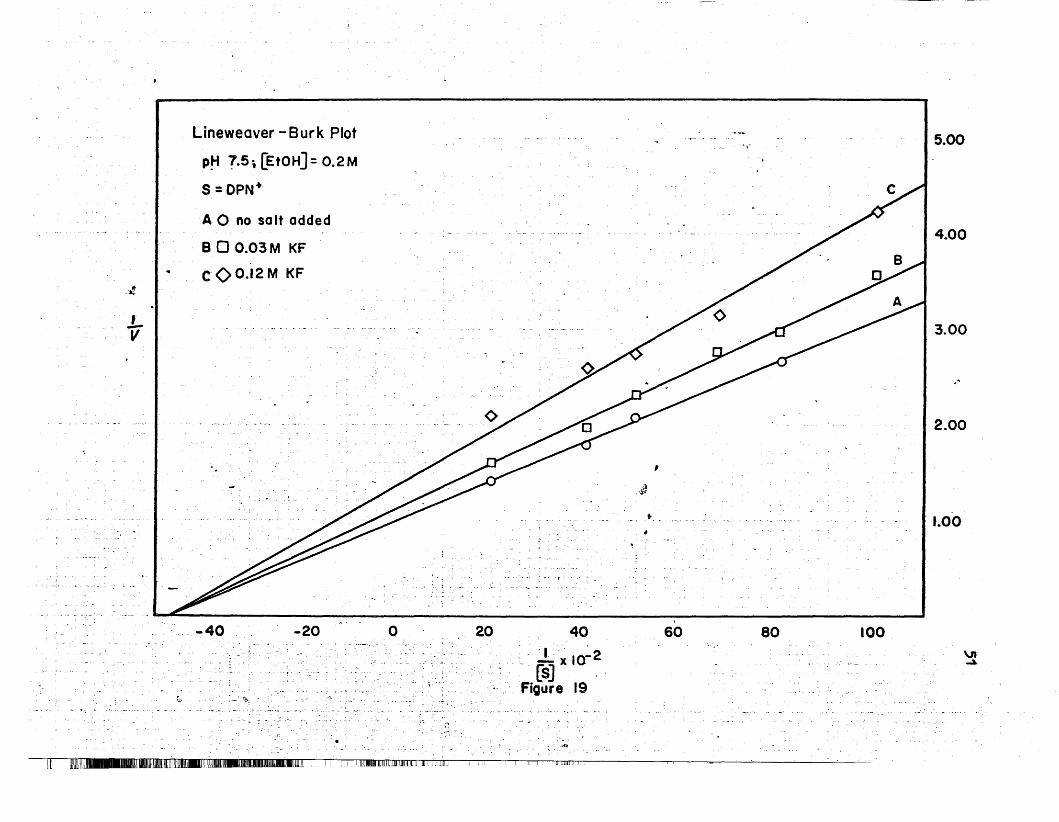
A 0 no sa It added
B 0 0.03M KF
C00.l2M KF
4.00
VI~
.'
3.00
2.00
5.00
1.00
10080
'.'to
60
,
~
to
.j}
,'~'"
~ >'idO\
20 40
. J.>x IO~2[s] "
Figure 19
~ .- --
o-20
Lineweaver -Burk Plot
p~ ?5, [EtOH]= O.2M
s= DPN·
.-40
1V
.~
1[. I [mIm!!IlB......IDIlLIIIIlllilliDlL~:L:'IlllIUlWI_~IIIIlDBlDWI[lL:. '... :_._J.:L.:.:: ~.~Jl:DJIID.DllJIJHllllLlllll;lJIL.l ..IID_l. _.l.t~~m;.;.: ••
\.nN
0.80
0.60
0.20
0.40
1.00
0.600.40
.;.
.,1
o 0.20[S)x 10-2
Figure 20
-0.20-0.40.~0.60
point dropped "
A 0 no salt added
8 0 0.03M KF
C 0 O.l2M f<F
Hanes Plot
pH 7.5; [EtOH]: 0.2 M
S : DPN+
..-.rJ
[5}V

I! 11~1~_llIOOI[IIlli~~11UI~I_mIII[[l_"IJJllj.HWnlllliilll~]JlllJL[lLlill_L . -'..II III .1ll1lJl1lJ.L .1 I
1 :or
V
Lineweaver - Burk Plot
pH 7.5 t [EtOHJ =0.2M
S = OPN+
A 0 no salt added
B 0 O.03M NaF
C 0 0.09M NoF
;. ~
6
y
<>
5.00
4.00
3.00
.'
2.00
t.oo
·-40 -20 o
,
20 .40 60
- 1 -2[SJ X.IO
Figure 21
~...~
80 100
\J'\\If
I~. I. [Wmimll~m1llDffilIUUjlllWlmI~~lIIl11U ...nnOllllllJl[!IL L.!:JI I .: ..JJU!JllIIII.llliIlllllllllJleJlILJ JD [:.I~lllliL JIlI:llIlL.:.•..•'
\Jl+-
0.80
0.40
0.20
1.00
0.600.40
__point dropped
0.20o(5] x 103
Figure 22
-0.20-0040-0.60
A 0 no salt added
B 0 0.03M NaF
CO 0.09M NaF
Hanes Plot
p~ .7.5; [EtOH] =0.2 M
.' S=DPN+
ill I / / / I 0.60V

I
V
Lineweaver - Burk Plot
pH. 7.5,[DP~]= 5x10⁻⁴ M
S =EtOH
A 0 no salt added
B 0 0.01 M NaCI
C 0 0.12 M NaCI
<> 10.00
8.00
6.00
4.00
2.00
-140 -100 -60 -20I
(S]Figure ~3
20 60 100
\.n\.TJ
H I [mm'II[J_m1nmll]I[~mlmrnlm.T]illlnnlll.lIlIIllDlgUIOCUIIIIUlI.J1 1IIlIlJJIIIIUlIlIUuwllJ IlllllliU.1 ,II "I ill LJiILI ,
I~ I. [~I~,[llfII_WUIOOILllillI~I]U~I~lIIIII~UI!llm[[IL . ..Jl!!.n1111M~UillltllmIJIIJ JIT I.JEll[L
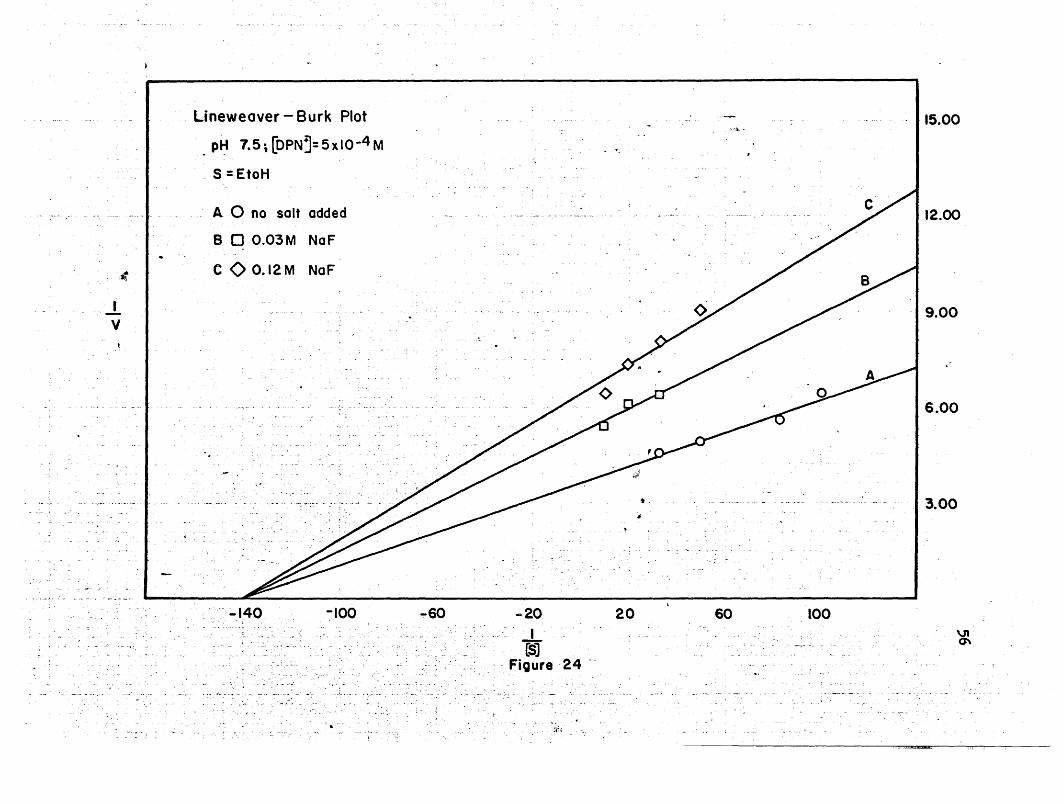
Lineweaver - Burk Plot
PI-:' 7.5; [DPN~=5xIO-4M
5 =EtoH
.Ii !l I OlrJIU:I.l..,
15.00
<_I.V
A. 0 no salt added
B OO.03M NaF
C OO.12M NaF
t'.
#
12.00
9.00
6.00
3.00
~140 ~IOO -60 ..,,20 20
...L(5]
Figure·24 .-
,!i';
60 100\J10\
JI 111~_gOOI[Illi1.]Uj."'.UmL_JL]UJJ]II.I1][HlIllI~JJIUJJlnlli. I.J.l! I.l l0I1Li-i.
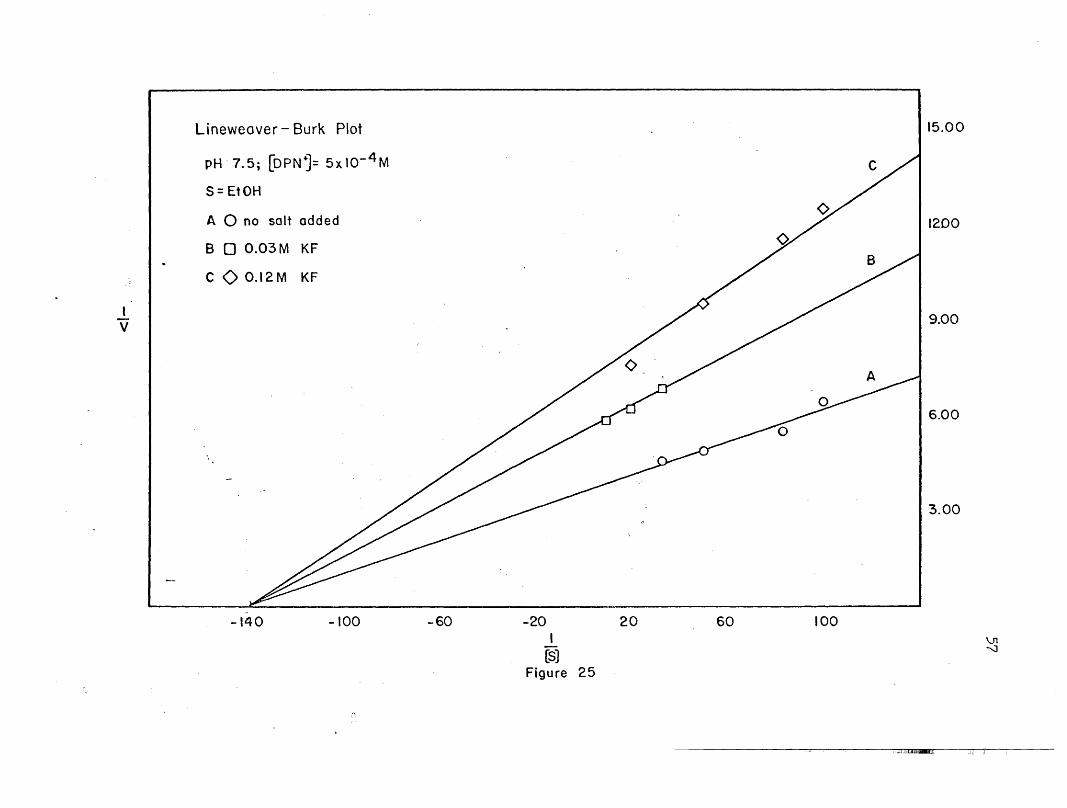
Lineweaver - Burk Plot
I;
15.00
IV
pH'7.5; [OPNj= 5x10- 4 M
S= EtOH
A 0 no salt added
B 0 0.03M KF
C OO.12M KF
1200
9.00
6.00
3.00
-140 -100 -60 -20 20I
(5)Figure 25
60 100
il:Ii1i j[[CU:,~ll1r-
\..n--J
II 1.1~1~_UIUU1lliJill.J!~lm~I_IJDUlJU .. Ii JJ!!.. :1WlIJt][JUIJWIJtJ IN II.E][!. l !
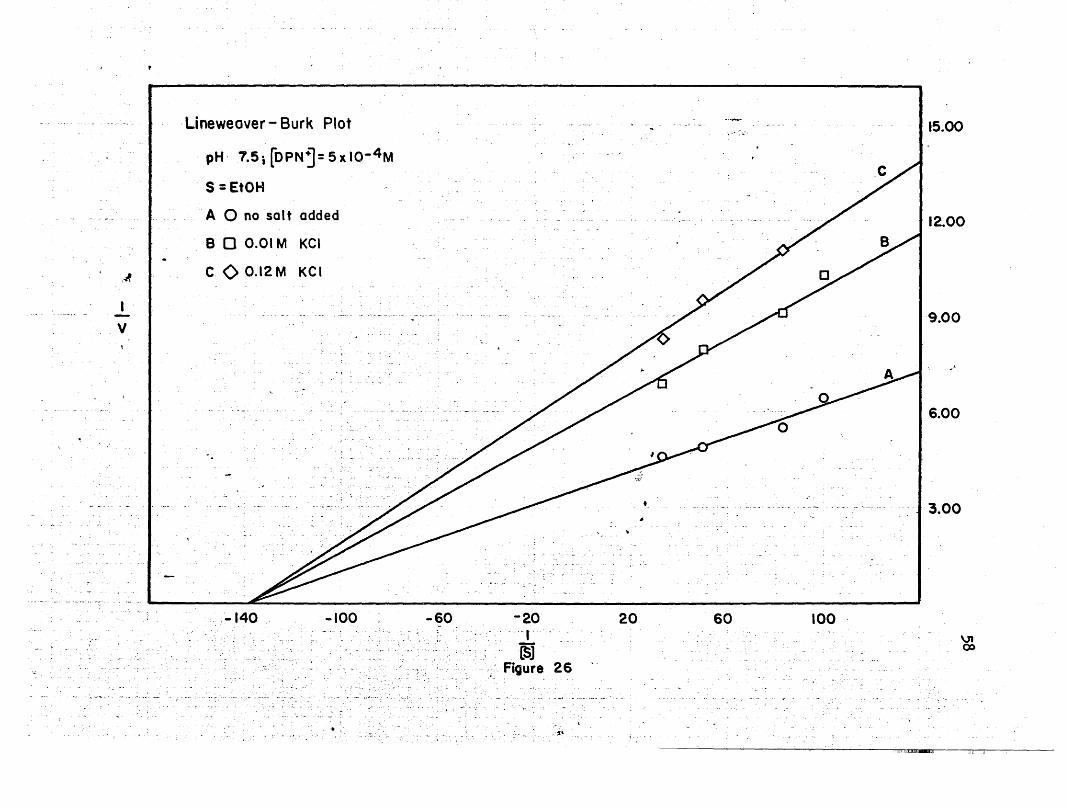
.Lineweaver - Burk Plot
,WnllLL:l.c .. .J J
"_. ->...', 15.00
,OA
I
.. v
. pH-7.5; [OPNj= 5 x IO-4M
S =EtOH
A 0 no salt added
B 0 0.01 M Kel
COO.12M KCI
-100 -60 -20- -r
LSJ; Figure 26
..~.
20 60 100
12.00
9.00
6.00
3.00
VI():)

59
See graphs 27 through 31-.
Sinoe the ionio strength is based on the concentration of ions in
solution, it was necessary to calculate the species in solution in the
The pyrophosphate buffer contri-•
These were then used in the following equation to calculate~ 2~.
the ionic strength:p =. cizi, 2
butes an ionic strength of 0.07 in the reaction mixture at bot~ pH
pyrophosphate buffer. This was done using the Henderson-Hasselbalchr •
i 1 (salt) it'· i 1equat on: pH = pKa + og(acid) • The predom nan specJ.es n a~ u-
-4 -3 -2tion in the pyrophosphate buffer were: P207 9 HP207 ,H2P207 ,and
-2HP04 •
levels.
Results
The Lineweaver-Burk plots show that at pH 7q5, the maximal velo-
city decreases with an increase in salt concentration, while the
Michaelis constants remain the same. At pH 8.5, the maxi~al velocity
decreases with an increase in salt concentration when the concentra-
tion of ethanol is held constant and the DPN+ concentration is'varied;,('.
\
and it increases at low salt concentrations, and decreases at high salt
concentration when the DPN+ concentration is held ,constant and theetha-
pH 8.5 . -43 x ,1O
pH 7.5 2"x 10-4
pH 8.5. -2
1.5 x 10
pH 7.5 7 x 10⁻²
The average values for the Michaelis constanta ares
ADH·DPN+

I[ I [Wm['IIlI.II.IIIIIIIIUJmlW[illIIILJ[]j~IIrllillllll~I_--nmI1IIIlImU ..JIU...LIlIlIIlII.lL11I.IllJIII.UmUlJu L IUlUJ..
~
40
20
100
60
-80
-~
I'
o Noel
o KF
~ NaF
pH 8.5 variation of [OPN+]
o _Kel.~~.
:>.-i>-Co)
«~

.-i
?~Ei
0~ -a' ~3 ....; 0
c:~ .~-i' 0
~
0>
i to
en:I:
I 0-
IlII~ u. . Url
I 0 LL 0 UZ ~ Z ~
~ 0 0 <l <>~a
I;;;;;;;
61I 1~ j
I~ I [mm,[IIIB__lDIll.11rnJlillIIL[]]]Jill.IIDmnilll]IIII~I nnUlllm[JL
.\~~
..Jl !'.iDIIIJI.UIlUlII.llmUIJ ]I. LI.Ll!!U. .1,11
.."z
:>.~
1 .~Ucr~
-- ---- --. ----------J.-~----- -~
" ,..,.,,
----work of Whitaker 8 Tappe I
X KCI
® NaCI
--- present work
o KCI
o NaCI ,
.,c.'.,\
u "0
-----~--X
150
120
90
, '
60
pH 8.5· varidtion of [EtOH]
0.10 0.15 0.20 0.25 0.30
..,. t.
..
0.35 0.40 0.45
30
29
~.
.'
. -"~
0\I\)
"
I[ I. [Wm,[IIII__mU.Dll!lillIll[[]]U~InIllIJIlllUIIIIEIIlJIlaII__~mJL , ,J.:L!..!..cJrullIll,lLliI.lUJlllJI~]JU.lE I.,U:..lmCL
~.."" ..;
>-:-.">4:u<t~
,0 NaCI
o KCI
~ KF
o NaE.:pH ,7.5 variation of [EtOH]
J
"f
~
,
. - ~ ·ja
100
80
60
40
20
..
"Q.27 0.30 0.33
'.
0.36-rp.
',Figure 30
,~-
0.39 0.42 0.45
0\\,III

o2 o
CDofQ
o~
. r-
",
. ' . ......
r;Iza..8....
0
c:0-0...0> ....
10 (\I'
,...: . I 00 U. J: .'
.~ :ll:: Q.
0 0 <l 0 "1'-1"
-.e ~IIAIIOV %
65o 0All these values are given for 27 C ~ 0.5 C. They agree rea8o~ably well
with those given in the literature as can be seen by referring to Table
IV in the historical background section.
The maximal velocity varies with the different enzyme solutions.
Since the maximal velocity changes and the Michaelis constants do not.
the inhibition observed is the classical non-competitive type. The
inhibition is greater at pH 7.5 than at pH 8.5.
, At pH 805. the inhibition is very slight, regardless of whether
the coenzyme concentration or the substrate concentration is being
varied. The maximum inhibition is ry/o when the ethanol concentrati'on is
varied and 1&/0 when the DPN+ concentration is varied. The maximum ac-
tivation is 13% when the ethanol concentration is varied. There is no
activation observed with the variance of the DPN+ conoentration. There
is no observable difference between the fluoride and the chloride salts.
In the plots of per cent activity VB the ~during the variation of the
DPN+ concentration, NaCl and KF show almost a linear relationship between
the per cent activity and the"VjA. KCl and NaF show a sharper decrease
and then level off to almost the Bame point as NaCl'and KF.
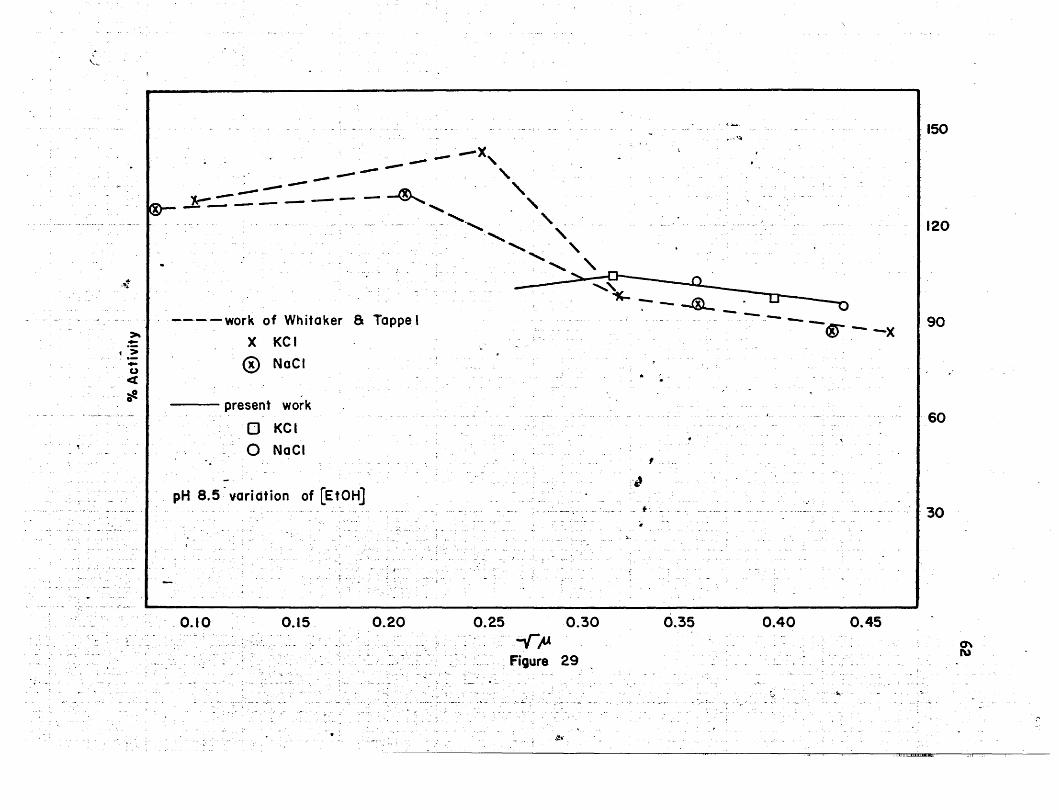
In the plots of per cent activity vs the Y,ltduring the variation of
the ethanol concentration. the chloride salts are essentially the same
with both showing some activation at the lower ionic strength. This
agrees with the previous work of Whitaker and Tappel (104). In Figure 29,. \
their points can be seen along with the present. work. Combining points. '
for the sodium and potassium chloride together. a straight line is formed• I
which parallels the line that Whitaker and Tappel drew combining their
data on sodium and potassium 'chloride.
,~
.:"):
I
I;
I1
II .j
66
At pH 7.5, the inhibition shows a definite difference between the
variation of the ethanol conoentration and the variation of the DPN+
concentration. With the variation of the DPN+ concentration, the maxi
mum inhibition is 34%, and it is 49% with the variation of the ethanol
concentration. There is no observable activation at this pH. The
chloride and fluoride salts inhibit to approximately the same extent.
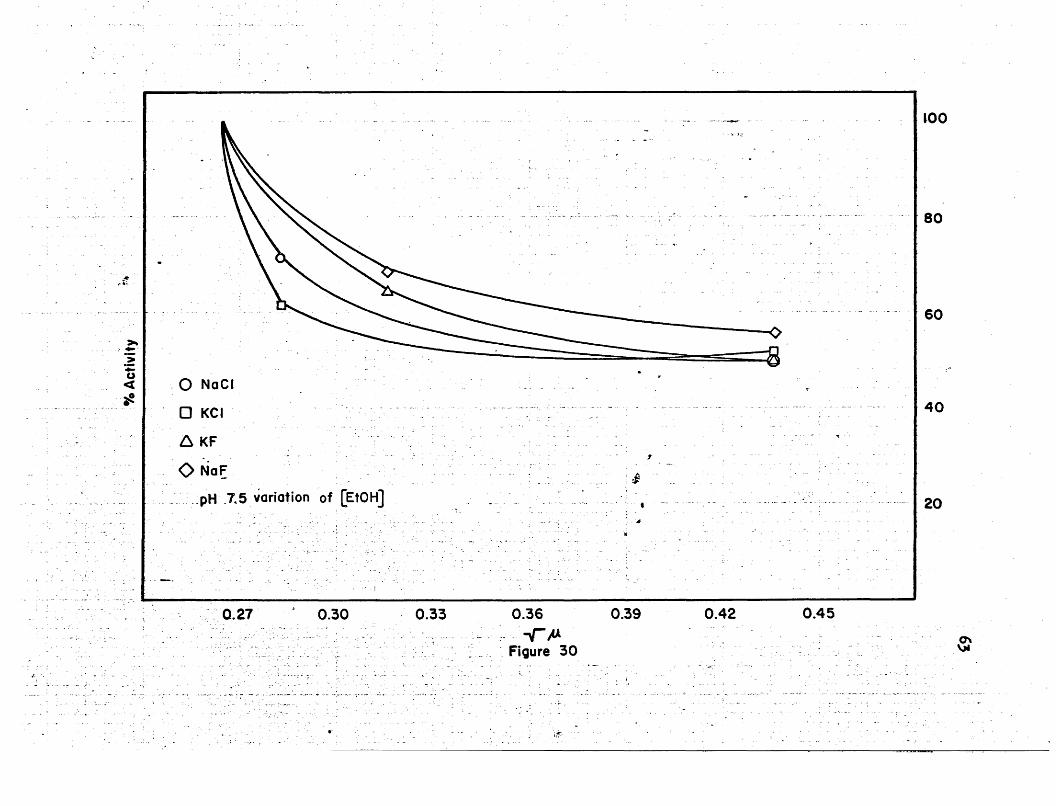
The inhibition increases much more rapidly at the lower salt con- -
centrations with the variation of the concentration of ethanol than when
the ooncentratiori of DPN+ is varied. With the variation of the ethanol
concentration, the inhibition levels off quite readily after the initial
sharp decrease in activity. This can be seen in the plot of the per
cent activity V8 the 1Ifi in Figure 30.
In Figure 31 is shown-the plot of the per cent activity V8 ,the
for the variation of the DPN+ concentration. When the data for-sodium
and potassium fluoride are combined, they form almost a straight line.
NaCl gives a straight line, and KCl gives a straig~t line after a
small diP: .They all come down to essentially the same per cent acti
vit7 at high salt concentration (66% to 73%).
(,j",1
DISCUSSION
The oxidation of ethanol by YADH is inhibited to a very small ex-
tent at pH 8.5 by the potassium and sodium .salts of chlorine and fluorine.
It is essentially the same whether the concentration of ethanol or of
DPN+ is being varied, ~,.6 and 18% respectively. With the variation of
the ethanol concentration, a maximum activation of 13% is observed.
This activation is not observed when the DPN+ concentration is varied.
The activation occurs at low salt concentrations with increasing inhi-
bition occurring as the salt concentration is increased.
The inhibition is almost a linear function of the --Iji. • It is
of the non-competitive type as shown by the constancy of the Michaelis
constants and the general decrease in the maximal velocity when these
values are determined from the Lineweaver~Burk plots. The inhibition is
more a general halide effect than a specific 'halide effect, since there
is no observable difference between the two different halides.
As already shown by Whitaker and Tappel (104), there is no differ-
ence between the potassi~ and sodium salts. The percent inhibition
and the type of inhibition are the same for the potassium salts and the
sodium salts. It does not appear that the cation has any specific· effect
..:~'
on the inhibition. The ~nhibition may be due to an ionic strength effect,, ;,, .
but this oannot be stated definitely from this ,study since only halide
salts were used.I
The greatest inhibition observed in this study was a~ pH 7.5. At
this pH. the enzyme is slightly less active than 'at pH 8.5 (9). At pH
68
7.5, when fluori4e salts are uae~, there is a,small amount of HF present.
It varies in concentration from 8.94 x 10⁻⁸ to 1.07 x 10⁻⁵ M. The ob-
served inhibition cannot be attributed to the pr~sence of this HF, since
there is no difference between the chloride and fluoride salts and HOI
is known to be 1000~ ionized.
The degree of inhibition is much greater when the ethanol concen
, tration is varied than when the DPN+ concentration is varied. The eth-
anol' must be exerting some protec,tive effect either by attaching to the
activ~ site and~eacting with the DPN+ or by sterically blocking the
DPN+ from the ions. The latter of these two possibilities can be ruled
out. If the inhibition was based upon reaction of the ions with the
DPN+,the degree of inhibition should be greater when the DPN+ concen-'
tration is varied since th~ DPN+ would not'be available in excess and
any reduction in the concentration of DPN+ would have a greater effect
on the rate of reaction.
The order of binding of coenzyme and substrate was discussed in
the historical section of this work. It was shown that recent evidence
points towards an ordered binding with the coenzyme binding first. It
was shown by nmr studies that it was necessary for the ooenzyme to bind
before the ethanol would bind. This could be interpreted as an a110-
steric effect by the coenzyme~ That is, the coenzyme changes the struc-
ture of the enzyme in such a way as to facilitate the binding of theI
ethanol•.
The coenzyme may be functioning in this SarDe way during jthe
fluoride and chloride ion inhibition. It faoilitates the interaction
of the anion at or near the binding site of the ethanol by making the
69 .
site more readily available to the ion. By attaching near the site
of the ethanol binding, the anion may be interfering by blocking the
ethanol binding site without actually binding directly at the ethanol
binding site. The attraction of the ~ion is tighter than the binding
of the ethanol, so that even though the ethanol and fluoride ion are
competing for the same site, the kinetics are non-competitive. Non-
competitive kinetics are observed whenever an inhibiting speci~s binds~
at or near either the substrate or the coenzyme site irreversiBly. Since
the inhibitor binds irreversibly at or near the same site as the sub-
strate, it is Been to have a greater inhibitory effect when the sub-
strate is being varied than when the substrate is ~eld constant at a
high concentration. The ethanol binding is less affected by the presence
of the ion when it is present in a high ooncentration than when it ia
present at a low concentration.
CONCLUSION
The higher halide salta of pota~sium and sodium exhibit a non
competitive type inhibition with respect to both ethanol and DPN+. The
fluoride salts show no greater inhibition than the chloride salts even
at pH 7.5, although the per cent of inhibition is greatly increased
from' that at pH 8.5. This inhibition at pH 7.5 is not due to the pre
sence ,of HF. Fluorine containing compounds, toxic in qUite small amounts
are yet little hydrolyzed to !IF or the fluoride ion. Any effect they
may have on thi~ enzyme system cannot,be attribute4 to hydrolysis.

71
REFERENCES
1. Lester, D., and Greenberg, L. A. (1950), Arch. Ind. Hyg. and Occup.Med. 2, 30.
2. Roberts, H. L. (1961), Quart. Rev. 15, 30.
3. Negelein, E., and Wulff, H. J. (1937), Biochem. Z. 289, 436.
4. Racker, E. (1·950), J. BioI. Chern. 184,.313.
5. Hayes, J. E.". and Velick, S. F., (1954), J. BioI. Chem. 207, 225.
6. Vallee, B. L. (1955), Advan. Protein Chern. 101 317.
7. Wallenfels, K., and Arens, A. (1960), Biochem. z. 332, 217.
8. Wallenfels, K., and Sund, H. (1957), Biochem. z. 329, 17.
9. Keleti, T. (1958), Acta. Physiol. Acad. Sci. Hung. 13, 103.
'0. Theorell, H., and Bonnichsen, R. (1951), Acta. Chern. Scand. 5, 1105.
11. Kuff, E. L., Hageboom, G. H., and Striebich, M. J. (1955), J. BioI.Chern. 212, 439.
12. Hageboom, G. H., and Kuff, E. L. (1954), J. BioI. Ohern. 210, 733.
13. Sund, H. (1960), Biochem. Z. 333, 205.
14. Jirgensons, B. (1959), Arch. Biochem. Biophys. 85, 532.
15.·· Jirgensons, B. (1962), 'Photochem. Photobiol. 1, 59.
16. Negelein, E., and Wulff, H. J. (1937), Biochem. Z. 293, 351.
17. Vallee, B. L., and Hoch, F. L. (1955), Froc. Natl. Acad. Sci. U. S.41, 327.
18. Wallenfels, K., Sund, H., zarnitz, M. L., Malhotra, O. P., and Fischer,J. (1959) in Sulfur in Proteins, Benesch, R., Benesch, R. E.,Boyer, P. D., Klotz, I. M., Middlebrook, W. R. t Szent-Gyorgi,A. G., and Schwarz, D..' R., New York, Academic Press, p. 215.
f I19. Barron, G. t and Levine, S. (1952), Arch Biochel1'1.Biophys. 41, 175•.
20. Van Eys, J. t and Kaplan, N.O. (19.57), J. Amer. Chem. Soc. 79, 2782.
( .~, ~
72
21. Kagi, J. H. R., and Vailee. B. L. (1960), J. BioI. Chern. 235, 3188.
22. Hoch, F. L., and Vallee, B. L. (1954), J. BioI. Chem. 221, 491.
23. Hooh, F. L., Vallee, B. L., and Williams, R. J. P. (1958), 'J. BioI.Chem. 232, 453.
24. Wallenfels, K., Sund, H., Faesaler, A., and Burchard, W. (1957),Biochem. z. 329, 31.
25. Boyer, P. D. (1954), J. Amer. Chern. Soc. 76, 4331.
26. Hoch, F. L., and Vallee, B. L. (1959) in Sulfur in Proteins, Benesch,R., Benesch, R. E., Boyer, P. D., Klotz, I. M., Middlebrook,W. R., Szent-Gyorgyi, A. G., and Schwarz, D. R., Eds., NewYork, Academic Press, p. 245.
27. Whitehead, E.' P., and Rabin, B. R. (1964), Biochem J. 90, 532.
28. Harris, J. I. (1964), Nature 203, 30.
29. Nygaard, A. P., and Theorell, H. (1955), Acta. Chern. Scand. 9, 1551.:
30. Aono, Y. (1958), Osaka Diagaku Igaku Zassi 10, 619 (CA 52,15620h).
31. Ebisuzaki, K., and Barron, E. S. G. (1957) Arch. Biochem. Biophys.69, 555.
32. Gierer, A. (1955), Biochim. Biophys. Acta. 17, 111.
33. Levy, H. R., Loewus, F. A., and Vennesland, B. (1957), J. Amer.Chem. Soc. 79, 2949.
34. Van ,Eys, J., and Kaplan, N. o. (1957), Biochim. Biophys. Acta. 23, 574.
35. Van Eys, J., Ciotti, M. M., and. Kaplan, N. o. (1957), Biochim. Biophys.Acta. 23, 581.
36. Van Eys, J., Ciotti, M. M., and Kaplan, N. o. (1958), J. BioI. Chern.231, 571.
37. Anderson, B. M., ReYnolds, M. L., and Anderson, C. D. (1965) Biochim.Biophys. Acta. 99, 46.
38. Andereon, B. M., and Reynolds, M. L. (1965), Biochim. Biophyse Acta.96, 45.
39. Anderson, B. M., and Anderson, C. D. (1964), Bioc~em. Biophys. Res.Commun. 16, 258. I
40. Anderson, B. M., Reynolds, M. L., and Anderson, C. D. (1966), Biochim.1Biophyse Aota. 113, 235.

73"41. Anderson, B. M., Reynolds, M. L , and Anderson, C. D. (1965), Arch.
Biochem. Biophys. 111, 202.
··42. Anderson, B. M., and Fonda, M. L. (1967), Arch. Biochem. Biophys.120, 49.
43. Anderson, B. M., and Reynolds, M. L. (1966), Arch. Biochem. Biophys.114, 299.
44. Anderson, B. M., and Reynolds, M. L. (1965), Arch. Biochem. Biophye.111, 1.
45. Vennesland, B., and Westheimer, F. H. (1954), in The Mechanism ofEnzyme Action, McElroy, W. D., and Glass, B., Baltimore,John Hopkins Press, p. 357.
46. Hollis, D. P., Bolen, J. L., and Kellum, J. M. (1966), Biochem.Biophys. Res. Commun.22, 135.
47. Hollis, D. P., (1967), Biochemistry 6, 2080.
48. Jardetzky, 0., Wade, N. G., and Fischer, J. J. ,(1963), Nature 197,183.
49. Negelein, E., and Wulff, H. J. (1937), Biochem. Z. 289, 436.
50. Alberty, R. A. (1953), J. Amer. Chem.Soc lP 75, 1928.
51. Thompson, J. F. (1963) Biochemistry 2; 224.
52. Wratten, C. C., and Cleland, W. W. (1963) Bi~chemistry 2, 935.
53. Silverstein, E., and Boyer, P. D. (1964), J. BioI. Chern. 239, 3908.
54. Nygaard, A. P., and Theorell, H. (1955), Acta. Chem. Scand. 9, 1300.
55. Dalziel, K. (1963), J. BioI. Chern. 238, 2850.
56. Cleland, W. W. (1963), Biochim. Biophys. Acta. 67, 104.
57. Fisher, H. F., Conn, E. E., Vennesland, B., and Westheimer, F. H."(1953), J. BioI. Chern. 202, 687.
58. Vennesland, B. (1955), Disc. Faraday Soc, 20, 240.I
59. Westheimer, F. H., Fisher, H. F., Conn, E• .'E., and Vennesland, B.(1951), J. Amer. Chern. Soc. 73, 2403.
60. Schellenberg, K. ~. (1965), J. BioI. Chern. 240, 1168•.
61. Schellenberg, K. A. (1966), J. BioI. Chern. 241, 2446.
62. Palm, D. (1966), Biochem. Biophys. Res. Commun. 22, 151.
PORnAND STAlE m~r~ERS1TI UThnrt~{~
(.:. ~.

, 74
63. Atkinson, M. R., Eckermann, G., and Lilley, R. M. (1967), Biochem.J. 104, 872.
64. Anderson, B. M., Anderson, C. D., Lee, J. K., and Stein, A. M.(1963), Biochemistry 2, 1017.
65. Kaplan, N. 0., and Ciotti, M. M. (1953), J. Biol. Chern. 201, 785.
66. Stepanauskas, M., Adrian, B., Hoffman, D., Jacobs, K. A. t Nash, P. t
Schmottlach, B., Walz, I., Weber, R., Scheuch, D., andRapport, S. (1964), Acta. Biol. Med. Ger. Supple 3, 258(CA 64,2343g).
67. Clayton, R. A. (1954), Arch. Biochm. Biophyso 85, 559.
68. Rousch, A. H., and Gowdy, B. B. (1961) Biochim. Biophys. Acta. 52,200. "
69. Neifakh, E. A. (1962), Dokl. Ak~d. Nauk. SSR 142, 1405 (CA 57,1266f).
70. Tappel, A. L., and Maro, A. G. (1954), J. Agr. Food Chern. 2, 554.
71. Hoch, F. L., Martini R. G., Wacher, W. E. C., and Vallee, B. L.(1960), Arch. Biochem. Biophys. 91, 166.
72. Duclaux, D. (1960), Biochim. Biophys. Acta. 39, 33 (CA 54,22771d).
73. Duclaux, D. (1964), Biochim. Biophys. Acta. 89, 1. (OA 59,10409f).
74. Guidi~te, A., and Casole, L. (1963), Boll. Soc. Ital. BioI. SPero39, 1691 (OA 61,5198d).
75. Guiditte, A., and Casole, L. (1965), Biochim. Biophys. Acta. 110, 17.
76. Masuda, M. (1958), Osaka Daigaku Izaku Zasshi 10, 595 (OA 52,15620d).
77. Rashed, N., and Rabin, B. R. (1968), ·Eur. J. Biochem. 5, 147(CA 69,33156h).
78. Okunuki, K., Hagihara, B., Sikuzu, I., Nazaki, M., Yamashito, J. t andYonetani, T. (1955), Symp. Enzyme Chern. 11, 99. (CA 50,14827h).
79. Sekuzu, I., Hagihara, B., Hattori, F., Shibato~ T., Nazaku, M., andOtunsuhi, K.· (1957), J. Biochem. (toyko) .44, 587. (CA 52 t 1302gl.
I
Bo. Okunuki, K. 9 Hagihara, B., Sikuzu, I., Nazaku, M., Yamashit, J.and YOnetani, T. (1954), Symp. Enzyme Chem. 10, 143 (OA 49,14833g). . I
81. Ohta, T., and Ogura, Y. (1962), Karo Kagahu Shimpozinmu 18 t 121(OA 59,11815c).
82. Wochecker, K. (1957), Biochim. Biophys. Acta•. 35, 849.
r~.\

75
83. Hoch, F. L., .Williams, R. J. P., and Vallee, B. L. (1958), J. BioI.Chern. 232, 465.
84. Vallee, B. L., Hoch, F. L., Adelatein, S. J., Wacker, W. E. C.(1956), J. Amer. Chern. Soo. 78, 5879.
85. Kawasaki, O. Ichikawa, T., and Kaliye, Y. (1964), Bitamin 30, 299(OA 62,2976d).
86. Kawasaki, C., Ichikawa, T., and Kaliye, Y. (1966), Bitamin 34, 514.(OA 66,8463m).
87•. Fiddick, R. and Heath,'H. (1967), Nature 213,628.
88. Balcavage, W. x., and Mattoon, J. R. (1968), Nature 215, 166.
89. Tschiersch, B. (1966), Tetrahedron Lett~ra 28, 3237.
90. Khouw, L. B., Burbridge, T. N., and Sutherland, V. o. (1963), Biochim. Biophya. Acta. 73, 173.
91. Martoadiprawito, W., and Whitaker, J. R. '(1963), Biochim. Biophys.Acta. 77, 536.
92. Hines, W. J. W., and Smith, M. JG H. (1964), Nature 201, 192.
93. Burke, J. F., and Whitehouse, M. W. (1965), Biochim. Pharm. 14, 1039.
94. Vogel, W., Snyder, R., and Schulman, M. P. (1964), J. Pharmacol. .Exptl. Therap. 146, 66.
95. Brighenti, L. (1963), Biochim. Pharmacol 12, 1091.
96. Brighenti, L. (1964), Boll. ChimoFarm. 103, 257 (OA 61, 8575f).
97. Maseoli, P. (1967), Farmacista 22; 138 (OA 67,29427p)
98•. Brighenti, L. (1959), Boll. Soc. Ital. BioI. Spero 35, 560 (OA 55,15596e).
998 Brighenti, L. (1959), Boll. Soc. Ital. BioI. Spero 35, 1751 (OA 56,13238b).
100. Snodgrass, P. J., Vcillee, B. L., and Hoch, F. L~ (1960), J. BioI•. Chern. 235,' 504. ' e
101. Warburg, 0., and Christian, W., (1941), Biochem. Z. 310, 384.
102. Chaykin, S., (1966'), Bioohemistry Laboratory Techniques, ~ew York,John Wiley &Sons, Inc., p. 18.
103. l>ixon, M., and Webb, E. C. (1964), Enzymes, New York, Aoademic Press,p. 69.
=
76I
104. Whitaker, J. R., and Tappel, A. L. (1962), Biochim. Bi~phY~. Acta.62; 310.
..
C:;i