a comparison of the interaural time sensitivity of neurons in the
TRANSCRIPT
The Journal of Neuroscience, August 1992, 12(E): 32003216
A Comparison of the Interaural Time Sensitivity of Neurons in the Inferior Colliculus and Thalamus of the Unanesthetized Rabbit
Terrence Ft. Stanford, Shigeyuki Kuwada,a and Ranjan Batra”
The University of Connecticut Health Center, Department of Anatomy, Farmington, Connecticut 06032
The localization of low-frequency sounds (~3 kHz) along the azimuth involves comparing the ongoing difference in the time of arrival of a sound at the two ears. Information about interaural time differences (ITDs) is derived from an initial comparison performed in the superior olivary complex. How- ever, little is known about which aspects of this information are transformed as it ascends the brainstem. To address this issue, we compared the ITD sensitivity of neurons in the inferior colliculus (IC) and auditory thalamus, successive stations in the auditory pathway.
We found ITD sensitivity in the IC and thalamus to be similar in several respects. At both levels, the large majority of neurons responded maximally to ITDs within the range that a rabbit would normally encounter (+-300 psec) and pre- ferred ipsilateral delays, delays that would be created by sounds in the contralateral sound field. The range of fre- quencies over which ITD sensitivity was expressed was also similar in the midbrain and thalamus.
Several differences were also apparent. In comparison to IC neurons, neurons in the thalamus responded over more restricted ranges of ITD, responded at lower rates, and, in response to monaural stimulation, showed an increased in- fluence of inhibition. Finally, a greater proportion of thalamic units had characteristic delays corresponding to interme- diate discharge rates.
The preservation of a bias for ipsilateral delays from IC to thalamus suggests that a representation of contralateral az- imuths is present at both levels. Similarities between the two levels suggest that information about ITDs is faithfully trans- mitted from midbrain to thalamus. Differences in ITD sen- sitivity, such as the sharper tuning for ITDs, suggest that the thalamus is not a simple relay. Enhanced sensitivity to ITDs should translate to better-defined azimuthal receptive fields, and therefore may be a step toward achieving an optimal representation of azimuth within the auditory pathway.
The localization of sounds along the azimuth is accomplished using interaural differences in time and intensity. A sound lo- cated off the median plane arrives sooner and is louder at the
Received Dec. 30, 199 I ; revised Mar. 12, 1992; accepted Mar. 17, 1992.
This study is part of a doctoral dissertation by T.R.S. We thank Dr. Douglas Oliver for his thoughtful and generous advice, especially concerning the anatomical subdivisions ofthe IC and auditory thalamus. We thank Dr. Constantine Trahiotis for lively discussions of this work. We also thank Ahmed M. Khan for his help in data analysis. This work was supported by NIH Grant NS-18027 to S.K.
Correspondence should be addressed to Terrence R. Stanford, Ph.D., Depart- ment of Psychology, University of Pennsylvania, 38 15 Walnut Street, Philadel- phia, PA 19104.
aPresent address: Department of Anatomy, University of Connecticut Health Center, 263 Farmington Avenue, Farmington, CT 06032. Copyright 0 1992 Society for Neuroscience 0270-6474/92/123200-17$05.00/O
nearer ear due to the difference in path length and the acoustic shadowing effects of the head, respectively. For sounds of low frequency (< about 3 kHz), shadowing effects are minimal, leaving only the interaural time difference (ITD) as a potent cue.
In this study, we focus our attention on the sensitivity of neurons of the auditory thalamus to the ITDs of low-frequency sounds. Our approach is to compare ITD sensitivity in the thalamus to that in the immediately preceding auditory station, the inferior colliculus (IC).
Neurons that are sensitive to the ITDs of low-frequency sounds have been recorded in the caudal brainstem (Moushegian et al., 1967; Goldberg and Brown, 1969; Caird and Klinke, 1983; Langford, 1984; Yin and Chan, 1990) midbrain (Rose et al., 1966; Geisler et al., 1969; Brugge et al., 1970; Stillman, 1971; Kuwada et al., 1979, 1987; Yin and Kuwada, 1983; Yin et al., 1986; Camey and Yin, 1989) thalamus (Altman et al., 1970a,b; Aitkin and Webster, 1972; Starr and Don, 1972; Aitkin, 1973; Ivarsson et al., 198 1, 1988) and auditory cortex (Brugge et al., 1969, Brugge and Mezenich, 1973). However, little is known about the transformations in the code for sound location that potentially occur at each level of the auditory pathway. Is in- formation about ITDs simply relayed or does further processing occur at successive levels?
The above question cannot be answered by comparing pre- vious reports because of differences in species and methodology. Moreover, prior studies have used anesthetized preparations. We have shown that barbiturate anesthesia alters the ITD sen- sitivity of neurons in the IC (Kuwada et al., 1989). Nitrous oxide, another commonly used anesthetic, is known to have potent effects on the responses of visual neurons (Mandl et al., 1980; Reinis et al., 1985). Because different anesthetics may alter ITD sensitivity in different ways, and a given anesthetic may differentially alter the response properties of neurons at different levels of the auditory system, conclusions based on a comparison of existing studies would be, at best, tenuous. We have circumvented these problems by using the same stimulus paradigms to study cells in the thalamus and IC, and by re- cording from the unanesthetized rabbit.
Materials and Methods Experimental animal. Dutch Belted rabbits (1.5-2.5 kg; n = 19) were chosen as the experimental animal because they adapt well to the re- straint required when using an unanesthetized preparation. With light restraint and little prior training, most rabbits will remain still for a period of 2 or more hours. Only rabbits with clean external ears were used.
Surgical procedures. Our surgical procedures have been described previously (Kuwada et al., 1987; Batra et al., 1989). Briefly, aseptic surgery was performed in two stages. For each stage, rabbits were deeply anesthetized with either a combination of halothane (4%) and ketamine
The Journal of Neuroscience, August 1992, f2(9) 3201
(i.m., 50 mg/kg) or a mixture of ketamine (35 mg/kg) and xylazine (5 mg/kg) delivered intramuscularly. During the initial surgery, skin and muscle were retracted to expose a dorsal region of the rabbit’s skull. Dental acrylic and anchoring screws were used to fix a restraining bar to the left side of the skull, while the area of the skull above either the right IC or thalamus was left exposed. The second stage of surgery was performed several days later, at which time, a small hole (2-4 mm) was made in the skull to allow for electrode entry. After drilling the hole, the exposed dura was rinsed with sterile saline, treated with a topical antibiotic (bacitracin), and covered with sterilized Silastic (Dow Com- ing, 382).
Also during the second stage, fitted ear molds were made for sound delivery. An ear mold was formed by first inserting a metal tube into the ear canal and then pressing ear impression compound (Audisil, Coe Labs) around it. Once the mold had been removed from the ear, the metal tube was extracted and replaced with a sound delivery tube made from electrical shrink tubing. The sound delivery tubes were of equal length and diameter and were positioned similarly for the two ear molds. The tip of the sound delivery tube reached to within 2 cm of the tym- panum when the ear mold was inserted into the rabbit’s ear.
Recordingprocedures. The rabbit was placed in a body stocking from which its head protruded, and was seated in a padded cradle and further restrained using nylon straps. The stocking and straps provided only mild restraint, their primary purpose being to discourage movements that might cause injury to the rabbit. The rabbit’s head was fixed in position by clamping to the head bar. Next, the Silastic covering was removed, and lidocaine, a topical anesthetic, was applied to the dura for approximately 5 min. Once the dura was desensitized, it could be penetrated without inducing pain.
Typically, a rabbit participated in daily recording sessions over a period ofabout 2 months. Each session lasted approximately 2 hr, during which the rabbit sat in a double-walled, sound-insulated chamber. The rabbit was monitored by video camera, and the session was terminated if the rabbit showed any signs of discomfort. The rabbit’s comfort was a priority for ethical, and for practical reasons, since any movement would disrupt neural recordings.
Recordings from single cells and multineuron clusters were made with glass-coated, platinum-iridium microelectrodes (tip diameter of 2-4 Fm). The neural signals were filtered between 300 and 3000 Hz and amplified SOOO-10,000 times. Impulses were timed with an accuracy of 10 psec.
Acoustic stimulation and calibration. Stimuli were generated by a digital stimulation system (Rhode, 1976b) and delivered independently to the two ears through Beyer DT-48 earphones. Each earphone was tightly coupled to the custom-fitted ear mold to form a sealed system. Stimuli were pure tones with linear rise/fall times of4.0 msec. Stimulus levels and phases were initially referenced to a standard calibration and later corrected using the actual calibration for that animal. Acoustic calibration was performed after the animal was killed using procedures identical to those already described (Kuwada et al., 1987, 1989; Batra et al., 1989).
Sensitivity to ITDs was assessed at several frequencies and at one or more stimulus levels, usually 20-40 dB above threshold. Because the calibrations were performed post-mortem, stimulus level was not iden- tical across frequency. However, we considered level to be nominally equivalent ifwithin f 5 dB of the mean stimulus level for all frequencies presented. We report here the responses at the level for which the unit displayed the most linear relationship between mean interaural phase and stimulus frequency (Yin and Kuwada, 1983). I f two or more stim- ulus levels yielded equivocally linear plots, we chose the level that evoked ITD sensitivity over the widest frequency range.
Localization of recording sites. Electrolytic lesions were made during the last recording session. Lesions were made by passing 10 PA of positive current for 20 set through the electrode. Generally, lesions were made at two depths, a known distance apart (l-2 mm), to provide a reference for plotting the depths of previous recordings. In some cases, more than one set of lesions was made at different rostrocaudal or mediolateral positions to provide reference for electrode positions along these two dimensions.
Four to six days after the lesions were made, the animal was killed by an overdose of sodium pentobarbital. The brain was exposed and the head immersed in a 10% formal-saline solution for approximately one week. The brain was then removed from the skull, fixed by im- mersion for one month, and then immersed in a 30% sucrose, 10% formol-saline solution for 2 d. Near transverse sections were made in
the plane of the electrode penetrations. Frozen sections were cut at 30 or 60 pm and stained with cresyl violet.
To reconstruct recording sites, a camera lucida drawing was first made of the relevant sections. The recording sites were localized using the lesion sites as benchmarks and plotted on a standard series of sections. Nissl cytoarchitecture was used to define the subdivisions ofthe auditory thalamus (Morest, 1965; Imig and Morel, 1984; Merest and Winer, 1986).
Results Sensitivity to ITDs was well characterized for a total of 166 units recorded in the IC, and 135 units in the thalamus. All units were sensitive to changes in the ITD of low-frequency tones (~2500 Hz) as determined using a binaural beat stimulus. Fifty-four percent of the recordings from the IC and 53% of the recordings from the auditory thalamus were from single neu- rons, while the remainder were from small clusters of cells. Responses from single and multiple units were compared using each of our measures of ITD sensitivity, and no significant differences (two-tailed t tests, p > 0.05) were found. All figures display the responses from single neurons except for those il- lustrating distributions. Results based on analysis of 85 of the 166 IC units appeared in an earlier report (Kuwada et al., 1987).
Recording sites
The locations of the additional recordings in the IC did not differ appreciably from those that we previously reported (Ku- wada et al., 1987). Briefly, all ITD-sensitive neurons were found within the lateral two-thirds of the IC. The recording sites in- cluded the central nucleus, dorsal cortex, and lateral nucleus. Some recordings were made within the boundaries of the bra- chium of the IC.
The recording sites in the thalamus were plotted on 10 equally spaced (300 pm) transverse sections (Fig. 1). Using Nissl cy- toarchitecture, the rabbit’s medial geniculate body (MGB) was divided into ventral (V), medial (M), and dorsal (D) divisions similar to those described for the cat (Mores& 1964, 1965). The ventral division (sections l-9 of Fig. 1) was characterized by a relatively homogeneous population of small, densely packed cells. In contrast, the dorsal division comprised several regions of differing cell size and packing density. The ventral border of the dorsal division could be distinguished by a group of cells that were elongated along the mediolateral axis. The medial division was bounded laterally by the ventral division and dor- sally by the dorsal division (sections l-7). Cells in the medial division were loosely arranged and varied in size.
The lateral part of the posterior thalamic group (PO]) lay ros- trally (Fig. 1, section 8) and seemed to form between the ventral and medial divisions ofthe MGB. The Pol appeared as a discrete group ofsmall cells, separated from the ventral division by fibers that form the thalamic radiations (T). Both cell size and packing density of the Pol were similar to that of the ventral division.
The shaded areas in Figure 1 represent the recording sites of 85% (115 of 135) of the ITD-sensitive units recorded in the thalamus and demonstrate that units were recorded along nearly the entire rostrocaudal extent of the MGB. Included within the estimated boundaries of the recording sites were parts of the ventral (sections 2 and 3, 5-9), dorsal (sections 4-6), and medial divisions (sections 2 and 3). Recordings made at more rostra1 levels were localized to the Pol (sections 9 and 10). In some cases, recording sites appeared to extend beyond the confines of the MGB or Pol. For example, in section 2, it appears that

3202 Stanford et al. - ITD Sensitivity in the IC and Thalamus of the Rabbit
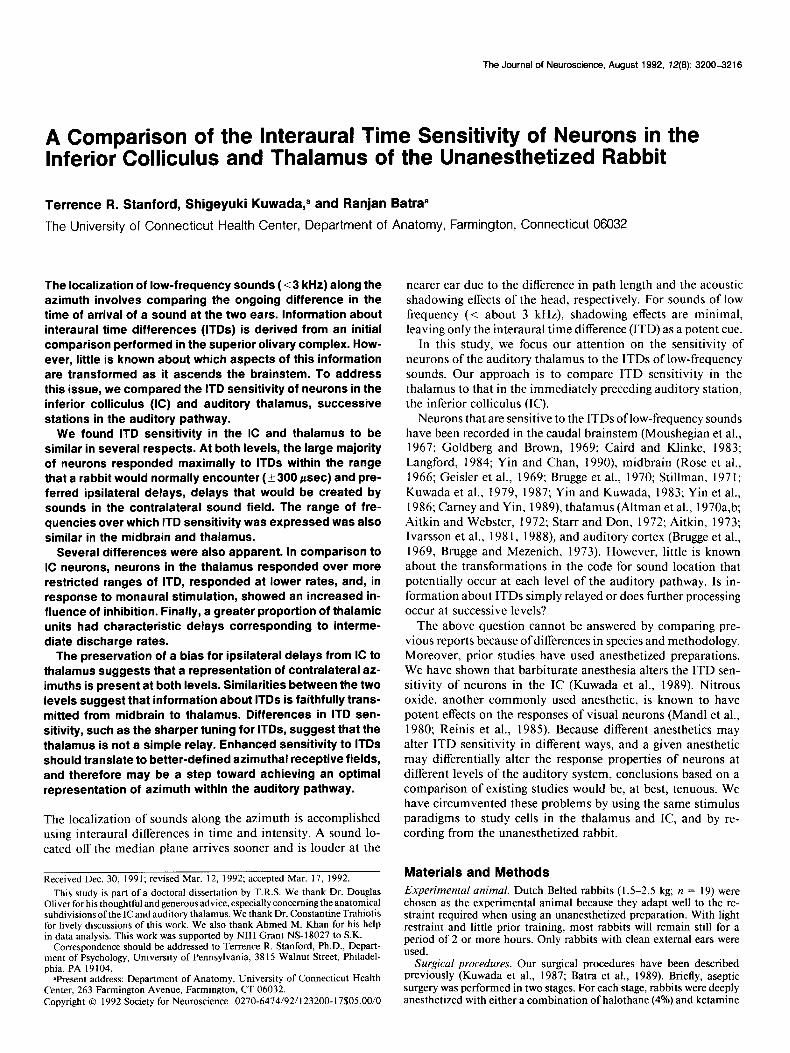
Figure I. Recording sites of ITD-sensitive units in the thalamus. Recording sites (shaded areas) were plotted on a standard series of transverse sections spaced 300 pm apart, from caudal (I) to rostra1 (10). The number (N) of recordings in each section is as indicated. Recording sites (shaded ureas) were reconstructed relative to sites of electrolytic lesions. Sites of electrolytic lesions are indicated as solid spots. BIC, brachium of inferior colliculus; D, dorsal, A4, medial, and V, ventral divisions of MGB; Pol, lateral part of the posterior thalamic group; T, thalamic radiations; LP, lateral posterior nucleus; LGd, dorsal, LGv, ventral lateral geniculate; VB, ventrobasal complex; OT, optic tract.
some of the recordings were from the brachium of the IC, where- as in section 10, recordings were localized to the lateral edge of the ventrobasal complex (VB) and thalamic radiations (T).
Although ITD-sensitive units were recorded in thalamic regions that could be distinguished based on cytoarchitecture, qualitatively ITD sensitivity did not seem to differ. For this reason we consider them as a single population.
Sensitivity to ITDs in the thalamus
Sensitivity to ITDs in the thalamus was qualitatively similar to that previously described for units in the IC of the rabbit (Ku- wada et al., 1987). Sensitivity to ITDs was assessed using a 1 Hz binaural beat stimulus (Kuwada et al., 1979, 1987; Yin and Kuwada, 1983). The binaural beat was created by delivering tones that differ by 1 Hz to the two ears. The 1 Hz difference, or beat frequency, produced a continuously changing phase dif- ference at the two ears, resulting in a continuous sweep through a range of contralateral and ipsilateral delays of up to one period of the stimulating sinusoid. Previous studies have shown that the sensitivity to ITDs assessed using binaural beats is com- parable to that measured in response to interaurally delayed tones (Kuwada et al., 1979, 1987) and may be accomplished in approximately one-seventh the time (Kuwada et al., 1979).
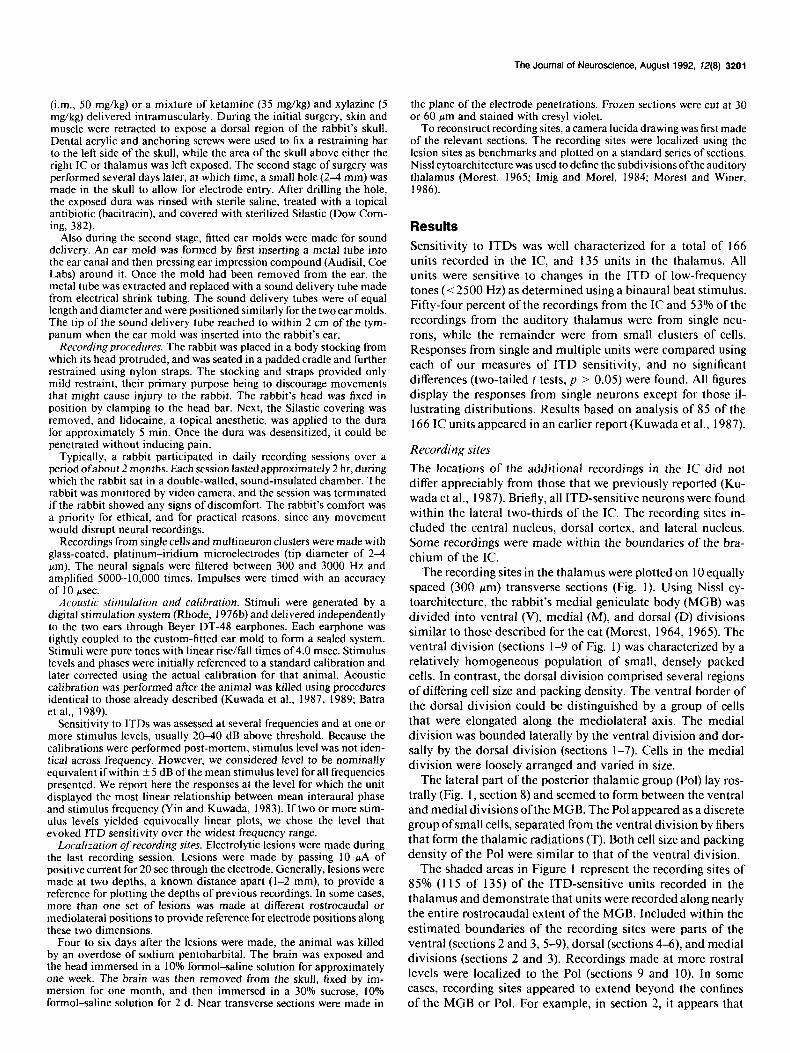
Our analysis of ITD sensitivity for a neuron in the MGB is illustrated in Figures 2 and 3 (top row). The peristimulus time histograms (PSTHs; Fig. 2A) show responses to the binaural beat for selected frequencies of stimulation. In each case, the tone delivered to the contralateral ear is greater by 1 Hz. The stimulus was presented for 4.1 set every 4.3 set and was repeated five times. During each presentation there were four complete cycles of interaural phase change. For each cycle of interaural phase change, there is a corresponding burst of activity indi- cating that this neuron was sensitive to ITDs.
Period histograms (Fig. 2B) were calculated from the re- sponses to the binaural beat to determine the average response rate as a function of interaural phase difference. Vector arith- metic (Goldberg and Brown, 1969; Yin and Kuwada, 1983; Kuwada et al., 1987) was used to determine the degree to which the response was synchronized to the beat frequency (1 Hz), and to estimate the mean interaural phase ofthe response. The mean interaural phase (4) shown above each period histogram, pro- vides an estimate of the interaural phase difference at which the response was maximal.
For each unit, mean interaural phases were used to estimate characteristic delay (CD). Figure 3A (top) shows the mean in- teraural phases at all the stimulus frequencies to which this
The Journal of Neuroscience, August 1992, 72(E) 3203
200 A 1400/1399 Hz
11200/l 199 Hz I
a
1 600/599 Hz 1
+ = 0.01 L.-A 0 1
TIME (msec) INTERAURAL PHASE
(cycles)
lzcl L
neuron was tested. The points were fit with a straight line using a weighted, least-squares procedure (Kuwada et al., 1987). The slope of this line yielded an estimate of CD, which for this unit was -4 psec (ipsilateral delay). The y-intercept at 0 Hz provided an estimate of the characteristic phase (CP), which was 0.03 cycles. The CD is the ITD for which the responses to all fre- quencies reach a common relative amplitude (Rose et al., 1966). The CP estimates the relative response level to which the CD corresponds (Yin and Kuwada, 1983). A CP of 0.0 or 1 .O cycles indicates that the CD corresponds to a maximal discharge, whereas a CP of 0.5 cycles indicates a CD corresponding to a minimal discharge. Intermediate values of the CP indicate that the CD corresponds to an intermediate discharge rate. For this
-1 ipsi
0 contra
1
INTERAURAL DELAY
(msec)
Figure 2. Responses of an MGB neu- ron to 1 Hz binaural beat stimuli. Each row illustrates the response at the car- rier frequencies (contra/ipsi) indicated. The stimulus to each ear was 4.1 set in duration delivered once every 4.3 set, and repeated five times. A, PSTHs. B, Interaural phase histograms. These his- tograms were constructed by first omit- ting the initial 100 msec of the response and then averaging the remainder to show the response over 1 cycle of in- teraural phase change. Mean interaural phases (6) of the responses are shown. C, ITD curves showing the response over ? 1 msec. These curves were cre- ated by replotting the period histo- grams as a function of ITD. In this and all subsequent figures, ipsilateral delays are negative and contralateral delays are positive.
cell, the CP indicates that the CD occurs near the peak discharge at all frequencies.
The delay curve is another measurement of ITD sensitivity. It is a plot of discharge rate as a function of ITD at a particular frequency. The delay curves (Fig. 2C) were generated by re- plotting the period histograms (Fig. 2B) as a function of the equivalent ITD. By convention, positive delays are delays of the stimulus to the contralateral ear. Each delay curve shows the response over a 1 msec range of contralateral and ipsilateral delay. For frequencies with periods of less than 1 msec (> 1000 Hz), the delay curves were extended to 1 msec by simply re- peating the pattern of the period histogram.
Figure 3B (top) shows representative delay curves superim-

3204 Stanford et al. * ITD Sensitivity in the IC and Thalamus of the Rabbit
A UNIT: Ml 1 X2
1 UNIT: M07M5
UNIT: M38R5
0 2400
FREQUENCY (Hz)
-; -. ipsl j) contra 1
C
1 PD = 30 psec
1 PD = -542 psec
1 PD = -182 ,usec
-1 ipsi 0 contra 1
INTERAURAL DELAY (milliseconds)
Figure 3. Types of ITD sensitivity observed in the thalamus. Each row shows the responses of a different neuron. The top row illustrates the responses from the same neuron as in Figure 2. A, Plots of mean interaural phase versus frequency. The fine is a weighted, least-squares fit; the slope of the line is the CD, and the phase intercept is the CP. B, Superimposed ITD curves. The ITD curves for every frequency are not shown, but were chosen to represent the entire frequency range. The CD is indicated by an arrow. C, Composite curves. These were obtained by averaging all the individual ITD curves. Peak delays (PDs) were calculated by fitting a parabolic arc to the top 30% of the peak of the composite curve. Units in A and C are from MGB; the unit in B is from Pal. The unit in the top row shows a CD near maximal discharge, the unit in the middle row shows a CD near minimal discharge, and the unit in the bottom row shows a CD at an intermediate discharge level.
posed on the f 1 msec time axis. The arrow marks the CD of this unit (-4 psec). Note that the delay curves all show a max- imal discharge near this ITD, consistent with a CP that is near 0 cycles.
Composite delay curves were generated by averaging the in- dividual delay curves to provide an average profile of a unit’s response to ITDs. In the IC, a composite curve is representative of a unit’s ITD sensitivity to a sound containing a band of frequencies (Yin et al., 1986). The position of the peak of the composite curve, or peak delay, is an estimate of the ITD at which the neuron’s response was most vigorous, and the peak width is an index of the breadth of tuning to ITDs. To estimate the peak delay, the peak and trough of the composite curve were defined by locating the points of highest and lowest response rate. The height ofthe peak was defined as the difference between the peak and trough and a least-squares parabolic fit to the upper 30% of the peak was performed. The ITD corresponding to the
vertex of the parabola was the peak delay. The peak width was measured at a point 30% below the peak.
Along with the unit described above, Figure 3 shows the responses of two additional thalamic units. While the unit in the top row had a CD near maxima1 discharge, the unit in the middle row had a CD (- 8 rcsec) near minimal discharge (CP = 0.58 cycles). Correspondingly, the delay curves were near their minima at this delay (Fig. 3B). The unit in the bottom row did not show a CD near maximal or minimal discharge. Neither the peaks nor troughs of the delay curves were aligned; instead, they shifted as a function of frequency while the slopes of the curves near 0 msec delay appeared aligned. This is consistent with the intermediate CP of this unit (0.76 cycles), and with its CD, which corresponds to a point close to the intersection of these slopes (- 9 psec).
Figure 3C shows composite delay curves for each unit. As described, the composite curve provided a profile of the unit’s

The Journal of Neuroscience, August 1992, 12(E) 3205
0.0 0.6 1.2
0.8 1.2 1.6 2.0 2.4 <-500 -400-200 0 200 400 >500
FREQUENCY (kHz) CHARACTERISTIC DELAY (psec)
Ill 2.4 3.0 3.6
FREQUENCY RANGE (octaves) COMPOSITE PEAK DELAY (psec)
Figure 4. Frequency sensitivity of units in the IC (open bars) and thalamus (solid bars). A, Distributions of the frequencies at which ITD sensitivity was observed for units in the IC and thalamus. More than 75% of the units in both the IC and thalamus were ITD sensitive at frequencies between 500 and 1100 Hz. B, Distributions of frequency range over which units were sensitive to ITD. The ranges were defined in octaves for each unit by determining the lowest and highest frequen- cies at which responses were significantly synchronized to the beat fre- quency. N = 166 for the IC, and N = 135 for the thalamus.
Figure 5. Sensitivity of neurons in the IC (open bars) and thalamus (solid bars) to interaural delays. A, Distribution of CD. B, Distribution of composite curve peak delay. N = 166 for the IC, and N = 135 for the thalamus.
bars are used to represent units in the thalamus, and open bars to represent units in the IC.
sensitivity to ITDs across frequencies. Since the composite curve is built up from the individual delay curves, composite curve shape depends on their alignment, and is therefore predictably related to the CD and CP. For units with CDs corresponding to a maximal discharge (CP near 0.0 or 1 .O cycles), the composite curve is reasonably symmetric about a central peak (Fig. 3C, top). Composite curves for units with CDs corresponding to minimum discharge have a central trough flanked by peaks of near equal amplitude (Fig. 3C, middle), while those for units with CDs corresponding to intermediate discharge rates are asymmetric, having a single peak immediately adjacent to a single trough (Fig. 3C, bottom). The peak delay is shown and estimates the ITD that evoked the largest average response.
We now provide quantitative comparisons to determine the degree to which ITD sensitivity in the thalamus is similar to, or different from, that in the IC. In subsequent figures, solid
36
0
Frequency sensitivity
Units in the thalamus and IC showed ITD sensitivity at similar frequencies. Figure 4A shows the distribution of all frequencies at which ITD sensitivity was observed for units in the thalamus and IC. The means were similar for the thalamus (967 Hz) and the IC (928 Hz). The lower and upper frequency limits of ITD sensitivity were also similar for units in thalamus (100 and 2400 Hz) and the IC (100 and 2200 Hz).
Units in the thalamus and IC were also similar with regard to the breadth of frequency (in octaves) to which they were sensitive to ITDs (Fig. 4B). The extremes of a unit’s frequency range were defined by the lowest and highest frequencies at which the response was significantly synchronized to the beat frequency (p < 0.00 1; Mardia, 1972; Rhode, 1976a). The mean ranges for units in the thalamus and IC were 1.72 and 1.57 octaves, respectively. These means may slightly underestimate the actual breadth of tuning, because, in a few instances, the

3206 Stanford et al. * ITD Sensitivity in the IC and Thalamus of the Rabbit
0.25 0.50 0.75 .oo
CHARACTERISTIC PHASE (cycles)
Figure 6. Distributions of CP for units in the IC (open bars) and thal- amus (solid barsl A CP of 0.0/l .O + 0.125 cvcles indicates a CD cor- respoiding to maximal discharge. A CP of 0.i + 0.125 cycles indicates a CD corresponding to minimal discharge. Other CPs indicate CDs corresponding to intermediate discharge levels. N = 166 for the IC, and N = 135 for the thalamus.
entire frequency range could not be assessed. The difference in means was significant (t = 2.15, df = 299, p < 0.05), but small (0.15 octave), and was mainly attributable to the seven IC units that responded over very restricted frequency ranges (~0.6 oc- tave). Excluding these units, the difference in means for the two samples (0.10 octaves) was not significant (t = 1.46, df = 292, p > 0.05).
Characteristic delay, peak delay, and characteristic phase Figure 5 compares the distributions of CD (Fig. 5A) and peak delay (Fig. 5B) for units in the thalamus and IC. The distribu- tions of CD and peak delay for thalamic units were biased toward delays of the ipsilateral stimulus, delays that would be created by sounds in the contralateral sound field. This contra- lateralization was similar to that seen in the IC. Specifically, 77% (104 of 166) of the thalamic units and 78% (130 of 166) of the IC units had CDs corresponding to ipsilateral delays. A comparable bias was observed for peak delays: 75% of the peak delays for thalamic units and 85% for IC units corresponded to ipsilateral delays.
The majority of units in both the thalamus (85%) and IC (83%) had CDs within -t300 Fsec. The majority of peak delays were also within this range. However, peak delays beyond k300 psec were more common for thalamic units (37%) than for IC units (16%).
The fraction of units in the thalamus with CDs corresponding to maximal discharge decreases relative to that in the IC, while the fraction of thalamic units with CDs corresponding to inter- mediate and minimal discharge increases (Fig. 6). To determine this, we divided the interaural phase into eight equal bins (0.125 cycles/bin). Two bins lay around 0.0 or equivalently 1 .O cycles, and two more lay around 0.5 cycles. The remaining four bins were intermediate and lay between those around 0.011.0 and 0.5 cycles.
Only 34% of thalamic units had CPs near 0.0 or 1.0 cycles, while this was true for 57% of IC units. More than half (52%) of the thalamic units had intermediate CPs, while this was true
for only 35% of IC units. Finally, a slightly higher percentage of thalamic units (14% vs 8% in IC) had CPs near 0.5 cycles.
In both the thalamus and IC, a feature of units with CDs corresponding to intermediate discharge was that the medial slopes of their delay curves were aligned (e.g., Fig. 3B, bottom). Consequently, their composite curves were asymmetric and had slopes that rose steeply between their maxima and minima. Examples of composite curves from six units, three each from the IC and thalamus, are shown in Figure 7. Each curve shows the asymmetry characteristic of units with intermediate CPs. It was usually true that the slopes, and therefore the CDs (arrows), corresponded to ITDs within ?300 psec.
Peak width of the composite curve
The composite curves of units in the auditory thalamus had narrower peaks than those for units in the IC. If the composite curve reflects a neuron’s receptive field on the azimuth, then the peak width is an index of receptive field size. The mean peak width for thalamic units (229 wsec) was significantly less (t = 4.9, df = 299, p < 0.001) than that for IC units (292 psec). Figure 8 shows the distributions of peak width for units in the thalamus and IC. The modes of the distributions differed also, the modal peak width for thalamic units (175 psec) being some 50 Fsec narrower than that for IC units (225 rsec). In all, 46% of the thalamic units had peak widths of 200 psec and below, whereas this was true for only 22% of the IC units.
The narrower peaks of composite curves were largely due to the narrower peaks of the underlying delay curves. Figure 9A plots the mean peak width of the delay curves for units in the thalamus (solid circles) and IC (open circles). The peak widths of the delay curves at each frequency were determined by the same method used to determine peak widths for the composite curves. For each stimulus frequency between 300 and 1500 Hz, the mean peak width for units in the thalamus was significantly smaller @ < 0.05) than that for units in the IC. For both pop- ulations, mean peak width increased as a function of increasing stimulus period; however, the percentage difference remained relatively constant across frequency (Fig. 9B). On the average, the peaks of the delay curves were 27% narrower for units in the thalamus. This was consistent with the difference in mean peak width of the composite curves (21%) for the two popula- tions.
Other factors that could have produced narrower peaks of composite curves did not appear to play major roles. The nar- rower composite curve peaks for thalamic units were not a result of better alignment of the peaks of their delay curves since, relative to the IC, fewer units in the thalamus had CDs near peak discharge (CPs near 0.0/l .O cycles) (Fig. 6). Nor were they due to a bias for higher frequencies. Units in the thalamus were not sensitive to ITDs at higher frequencies than those in the IC (Fig. 4).
Peak rate of the composite curve Units in the thalamus tended to respond at lower rates than those in the IC. Figure 10 shows the distributions of composite peak rate, defined as the discharge rate at the peak delay. The mean peak rate for thalamic units (35.5 spikes/set) was about half that for IC units (67.5 spikes/set) and this difference was highly significant (t = 8.02, df = 299, p < 0.001). Fifty-three percent of IC units had composite peak rates in excess of 60 spikes/set, whereas this was true for only 10% of thalamic units.

The Journal of Neuroscience, August 1992, 12(E) 3207
I’D = -227 psec PD = -226 psec CD = 28 bsec CD = - 84 pet
PD = -105 psec CD = 45 psec
unit: XO7Y 1 CP = 0.79 cyc
PD = 29 /.~eec CD = -295 psec CP = 0.34 cyc
-1 ipsi O contra 1
unit: M36N CP = 0.83 cyc
PD = -230 pet CD = -101 wsec
unit: M46F
PD = 281 psac CD = 50 psec CP = 0.27 cyc
Figure 7. Composite delay curves for units with intermediate CPs: examples of three units each from the IC (left col- umn) and thalamus (right column). For
-1 ipsi 0 contra 1 each unit, composite peak delay (PD), CD, and CP are shown. CDs also in-
INTERAURAL DELAY (milliseconds) dicated by arrows. Thalamic units lo- calized to MGB.
Phase-locking to contralateral and ipsilateral tones
The initial processing of ITDs requires that inputs from each side be phase-locked to the stimulus frequency. Is the ability to phase-lock retained by ITD-sensitive neurons in the IC and thalamus? To answer this question, phase-locking to the tones delivered to either the ipsilateral or contralateral ears was as- sessed from the responses to the binaural beat.
The degree to which a unit phase-locked to the beat frequency or to the tone at either ear was determined by techniques that we have already used for assessing phase-locking to modulated tones (Batra et al., 1989). Since the frequencies of the tones to the two ears were different, the phase-locking to the binaural beat, ipsilateral tone, and contralateral tone could be evaluated separately. This was done by calculating synchronization coef-
ficients (r) for each of the tonal frequencies and the beat frequency (Goldberg and Brown, 1969; Yin and Kuwada, 1983; Kuwada et al., 1987). Synchrony to the beat frequency was used as an index of ITD sensitivity. Whether or not a response was phase- locked was assessed statistically (p < 0.001, Rayleigh test of uniformity; Mardia, 1972; Rhode, 1976a).
Fewer than one-quarter of the 166 units in the IC exhibited phase-locking to tones at either the contralateral (24.1%) or ipsilateral(22.9%) ears. Those that phase-locked did so poorly, rarely having synchronization coefficients (r) exceeding 0.5 (con- tra, 0.25 f 0.14; ipsi, 0.23 f 0.12; mean f SD). In the thalamus, phase-locking to tones was observed for an even smaller per- centage of units (15.6%) and synchronization coefficients were even lower than those for units in the IC (contra, 0.21 + 0.07; ipsi, 0.21 f 0.08).

3208 Stanford et al. * ITD Sensitivity in the IC and Thalamus of the Rabbit
50 150 250 350 450 >500
COMPOSITE PEAK WIDTH (,usec)
Figure 8. Distributions of composite peak width for units in the IC (open bars) and thalamus (solid bars). N = 166 for the IC, and N = 135 for the thalamus.
For units in the thalamus or IC, the degree of phase-locking and the upper frequency limit for phase-locking to the contra- lateral or ipsilateral tones were usually much lower than that for ITD sensitivity. Figure 11 plots the degree of phase-locking
‘O” 1 A _
0 300 600 900 1200 1500
o-
0 300 600 900 1200 1500
FREQUENCY (Hz)
Figure 9. Comparison of peak widths of ITD curves for units in the IC (open circles) and thalamus (solid circles). A, The mean peak widths of ITD curves for frequencies from 300 to 1500 Hz. Error bars reflect SEM. B, The percentage difference [(peak width,, - peak width&peak width,,) x 1001 between the peak widths at each frequency in A.
0 20 40 60 80 100 120 >140
PEAK RATE (spikes/second)
Figure 10. Distributions of composite curve peak rate for units in the IC (open bars) and thalamus (solid bars). Peak rate corresponds to the discharge rate measured at the PD. N = 166 for the IC, and N = 135 for the thalamus.
to the 1 Hz beat and to the tones at each ear as a function of frequency for two units in the IC (Fig. 1 MB) and two in the thalamus (Fig. 11 CD).
The relationship between the upper frequency limits of ITD sensitivity and phase-locking to tones is illustrated in Figure 12 for units in the IC (Fig. 12A,B) and thalamus (Fig. 12C,D). For each unit, the highest frequency for phase-locking to either the contralateral (Figs. 12A,C) or ipsilateral (Fig. 12B.D) tone was plotted against the highest frequency for ITD sensitivity. Nearly all of the points fell below the line of equality, indicating that phase-locking to the tones at either ear did not extend to as high a frequency as ITD sensitivity.
The results shown in Figure 12 are summarized in Table 1. For units in either the IC or thalamus, the mean highest fre- quency for ITD sensitivity was more than twice that for phase- locking to either the contralateral or ipsilateral tones. In com- paring units in the IC to those in the thalamus, the upper fre- quency limits for phase-locking, as well as those for ITD sen- sitivity, were similar; however, relatively fewer units in the thalamus were phase-locked.
Binaural class$ication using monaural tones
We assessed the relative influence of excitatory and inhibitory inputs on ITD-sensitive units by examining their responses to tone bursts presented monaurally. We did this for 43 units in the IC and 59 units in the thalamus. Responses to ipsilateral and contralateral stimulation were classified at the stimulus fre- quency and level at which the unit was most sensitive to ITDs. This classification was based on the sustained portion of the response (after the first 30 msec), relative to the activity while the stimulus was off. If this ratio exceeded 1.75, then the re- sponse was classified as excitatory (E); if it was less than 0.75, the response was classified as inhibitory (I). An intermediate ratio was considered to be no response (0). For example, a unit that showed an excitatory response to contralateral stimulation and an inhibitory response to ipsilateral stimulation was des- ignated EI. It should be noted that in many cases neurons ap- peared to show both excitation and inhibition in response to a monaural stimulus. The categories we use here only indicate the net effect of a stimulus. Units that responded transiently (within

The Journal of Neuroscience, August 1992. 72(B) 3209
\ /
unit: Ml 1 U2 unit: M 1122
I 5 ‘=+ x
0 1500 0
FREQUENCY (Hz)
-30 msec) to either the ipsilateral or contralateral stimulation constituted about 10% of the thalamic and about 25% of IC samples.
Figure 13 shows examples of four common response com- binations for thalamic units, II (Fig. 13A), 00 (B), EI (0, and IE (D). The PSTHs show the activity recorded both during and between stimulus presentations. Thalamic units were more like- ly to respond to contralateral or ipsilateral stimulation with inhibition (contra, 24 of 53; ipsi, 24 of 53) than with excitation (contra, 18 of 53; ipsi, 17 of 53).
Figure 14 shows examples of four common monaural re- sponse combinations observed for IC units: EE, EO, EI, and II. Note that in three of the four examples (Fig. 14,4-C), contra- lateral stimulation evoked an excitatory response. In contrast to the thalamus, many units in the IC responded to contralateral stimulation with excitation (22 of 43) and few with inhibition (12 of 43), while for ipsilateral stimulation, excitation and in- hibition were equally likely (E, 16 of 43; I, 14 of 43). Further- more, when the response to stimulating either ear was excitatory, the response to contralateral stimulation was usually stronger.
Units in the thalamus were generally less excitable and more often inhibited than those in the IC. For the thalamus, the most common response combination was II (12 of 53), whereas for the IC it was EE (11 of 43). The excitatory responses of thalamic units to stimulation of either ear were much weaker than those for IC units. For 18 single neurons in the thalamus, the average discharge rate to an excitatory stimulus (19.8 spikes/set) was less than half that for 19 neurons in the IC (44.8 spikes/set). This difference was significant (t = 3.05, df = 35, p < 0.05).
Discussion
The primary aim of this study was to examine the physiological characteristics of ITD-sensitive cells in the auditory thalamus
Figure 1 I. Relationship between ITD sensitivity and phase-locking to the tones at each ear for two neurons in both the IC (A and B) and thalamus (C and 0). For each neuron, the degree of synchrony to the 1 Hz beat (squares) and the contralateral (triangles) and ip- silateral (circles) tones was extracted from the response to the binaural beat stimulus and is plotted as a function of frequency. Significant synchrony @ < 0.001, Rayleigh test of uniformity; Mardia, 1972; Rhode, 1976a) is indi- cated by a solid symbol. Thalamic units localized to MGB.
1800
and to compare them to those observed for units in the IC. Our results reveal both similarities and differences in the ITD sen- sitivities of neurons at these two levels of the auditory system. In the following, we consider the mechanisms responsible for preserving and transforming aspects of ITD sensitivity along with the possible functional implications of our findings.
Parallel processing of ITDs
Both the auditory thalamus and IC are made up of several distinct regions, distinguishable on the basis of cell type, local circuitry, afferents, and efferents. Undoubtedly, the anatomical differences between subdivisions reflect differences in the role played by each in the processing of auditory information. Units sensitive to ITDs were recorded in several regions of both the thalamus and IC, suggesting that information about ITDs is conveyed in parallel throughout the auditory system. Not sur- prisingly, one pathway for the processing of ITDs includes the central nucleus of the IC and the ventral division of the MGB. The central nucleus of the IC receives dense input from the brainstem auditory nuclei (Roth et al., 1978; Glendenning and
Table 1. Upper frequency limits of phase-locking to contralateral and ipsilateral tones and sensitivity to ITDs (phase-locking to binaural beat)
Tone (Hz) Area Contra Ipsi Beat (Hz)
IC 593 zk 298 543 f 233 1234 + 276
(N= 31) (N = 27) (N = 45)
Thalamus 498 k 223 534 i 201 1180 * 389 (N= 19) (N = 22) (N = 28)

3210 Stanford et al. - ITD Sensitivity in the IC and Thalamus of the Rabbit
E C IL 2000 -
& Thalamus: Contra
zl
2
F Figure 12. Relationship between up- per frequency limits for ITD sensitivity FJ and phase-locking to the contralateral and ipsilateral tones. A-D, Scatter plots
g
of highest frequency for phase-locking (3
to the beat versus highest frequency for I
phase-locking to the tone at the contra- 0 I I I I lateral (A and C) and ipsilateral (B and D) ears for units in the IC (A and E) and 0 2000
Thalamus: lpsi
0 2000
thalamus (C and 0). See Table I for number of units. HIGHEST FREQUENCY FOR ITD-SENSITIVITY (Hz)
Masterton, 1983; Henkel and Spangler, 1983; Aitkin and Schuck, 1985) and sends a strong, topographically organized projection to the ventral division of the MGB (Andersen et al., 1980a; Calford and Aitkin, 1983; Oliver, 1984; Rouiller and de Ribau- Pierre, 1985), which in turn projects to primary auditory cortex (Andersen et al., 1980b). Several studies suggest that the Pol, another region where we recorded ITD-sensitive units, should be included as part of this pathway. Like the ventral division of the MGB, the Pol receives a topographically organized pro- jection from the central nucleus of the IC (Moore and Goldberg, 1963; Tarlov and Moore, 1966; Kudo and Niimi, 1980; An- dersen et al., 1980a) and projects topographically onto primary auditory cortex (Anderson et al., 1980b). Moreover, electro- physiological studies confirm that Pol is tonotopically organized and consists ofneurons with response properties similar to those recorded in the ventral division of the MGB (Imig and Morel, 1985).
The processing of ITDs does not occur exclusively within this primary ascending pathway. Reconstructed recording sites sug- gest that ITD-sensitive neurons in the IC may be found in the dorsal cortex and in the lateral nuclei, while in the MGB, ITDs may be processed in the medial and deep dorsal divisions. Al- though different regions of the IC and thalamus most likely have different roles in the processing of auditory information, there were no obvious differences using our assessments of ITD. Moreover, quantitative comparisons between subdivisions were precluded due to the limited sizes of OUT samples.
Many of the units that were localized to the ventral division
of the MGB lay near the medial border. This location is not consistent with that for the major low-frequency representation observed in the ventral division of the cat (Imig and Morel, 1984). There are several explanations for this observation. First, the low-frequency representation in the cat has both a lateral and a mediolateral component. It is possible that some of our recordings were from the mediolateral component. Second, the frequency representation in the rabbit may be organized differ- ently from that in the cat. For example, in the MGB of the tree shrew the laminae are oriented transversely, while in the cat they are oriented parasagittally (Oliver, 1982). Third, many tha- lamic units were broadly tuned and it was difficult to assess best frequency. Thus, it is possible that we sometimes recorded the low-frequency responses of neurons tuned to higher frequencies.
Relationship of ITD sensitivity and phase-locking
Fewer than one-quarter of the units in either the IC or thalamus phase-locked to the tones at either ear. Units that did phase- lock did so poorly (r < 0.3), and phase-locking was rarely ob- served at frequencies above 700 Hz. Similar findings have been reported for neurons in the IC (Kuwada et al., 1984) and MGB (Rouiller et al., 1979) of the cat.
The IC seems to be the primary site for the loss of monaural temporal information. Phase-locking to frequencies as high as 2-3 kHz is observed in the cochlear nucleus (Lavine, 197 1), the trapezaid body (Brownell, 1975), and the superior olivary com- plex (Moushegian et al., 1967). Thus, the IC seems to act as a

The Journal of Neuroscience, August 1992. Q(8) 3211
CONTRALATERAL IPSILATERAL
50+ , unit: M36R
IPSILATERAL
0 TIME (msec)
150
unit: M461
Figure 13. Four common monaural response combinations for units in the thalamus (A-D). Each row reflects the response of a neuron to contralateral (lefi) and ipsilateral (right) tone bursts. The full repetition interval is shown, and the center tick marks the stimulus duration that was one-half of the repetition interval. A, Inhibition to stimulation of either ear (II). B, No response to stimulation of either ear (00). C, Excitation to contralateral, inhibition to ipsilateral stimulation (EI). D, Inhibition to contralateral, excitation to ipsilateral stimulation (IE). Number of repetitions, stimulus frequency, and intensity (contra/ipsi) were, for A: 40, 1000 Hz, 65/66 dB SPL, B: 30, 550 Hz, 75/79 dB SPL, C: 30, 900 Hz, 64/65 dB SPL; and D: 30, 1500 Hz, 56/58 dB SPL. Recording sites of these units were localized to MGB.
low-pass filter. We have observed a similar filtering in the IC for phase-locking to the low-frequency envelopes of amplitude- modulated tones of high frequency (Batra et al., 1989).
Our results indicate that little, if any, further filtering occurs in the thalamus. There was a slight decline in the percentage of phase-locked units and in the mean synchronization coefficient; however, this might be attributed to an overall reduction in the discharge rates of thalamic units.
Several factors may contribute to the filterlike effect of the IC. First, ITD-sensitive cells in the IC may have long time constants. This membrane characteristic would permit syn- chrony to very low frequencies, such as a 1 Hz binaural beat,
CONTRALATERAL
unit: X42L
120 OB I I unit: X060
unit: 103A
0 150
TIME (msec)
Figure 14. Four common monaural response combinations for units in the IC (A-D, same format as Fig. 13). A, Excitation to stimulation ofeither ear (EE). B, Excitation to contralateral, no response to ipsilateral stimulation (EO). C, Excitation to contralateral, inhibition to ipsilateral stimulation (EI). D, Inhibition to stimulation of either ear (II). Number of repetitions, stimulus frequency, and intensity (contra/ipsi) were, for A: 50, 700 Hz, 56/55 dB SPL; B: 30, 900 Hz, 68169 dB SPL; C 40, 600 Hz, 71/71 dB SPL; and D: 50, 800 Hz, 54/54 dB SPL.
but attenuate synchrony to the higher-frequency tones at either ear. Evidence supporting this hypothesis is lacking because the time constants of cells in the IC have not been measured. An- other factor may be the spatiotemporal integration that would occur if the inputs to IC cells were widely distributed along the somatic and dendritic surfaces (Crow et al., 1978). A third factor may be temporal jitter associated with each additional synapse. Rouiller et al. (1979) observed that phase-locking decreases sys- tematically from the cochlear nucleus to the MGB, presumably because the number of synapses increases along the neural chain. Finally, the integration of two or more phase-locked inputs that are out of phase could serve to abolish phase-locking in the postsynaptic cell (Lavine, 197 1). Although convergence on sin- gle cells in the IC has not been directly demonstrated, potential sources of phase-locked input to the IC include the medial and

3212 Stanford et al. * ITD Sensitivity in the IC and Thalamus of the Rabbit
lateral superior olives, the dorsal nucleus of the lateral lemnis- cus, and the cochlear nucleus.
Convergence and processing of ITDs
Neurons with intermediate CPs were present in the IC, and their proportion increased in the thalamus. A simple network in which phase-locked excitatory inputs from both sides converge on a cell predicts that the cell would show a CD at maximal discharge (CPs near 0.0/l .O cycles). A CD at minimal discharge (CPs near 0.5 cycles) is predicted if the input from one side is inhibitory. Such a simple network does not readily explain CDs at inter- mediate levels of discharge.
It is tempting to speculate that convergence is a factor leading to the occurrence of units with intermediate CPs. If such units result from convergence, it is not surprising that they are more prevalent in the thalamus than in the IC, since with each au- ditory relay comes new opportunity for interaction among af- ferent inputs. The medial superior olive (Goldberg and Brown, 1969; Caird and Khnke, 1983; Langford, 1984; Yin and Chan, 1990) lateral superior olive (Finlayson and Caspary, 199 l), and dorsal nucleus of the lateral lemniscus (Brugge et al., 1970) all have neurons that are sensitive to ITDs, and each projects to- pographically to the central nucleus of the IC (Roth et al., 1978; Brunso-Bechtold et al., 1981; Glendenning et al., 1981; Glen- denning and Masterton, 1983; Henkel and Spangler, 1983; Ait- kin and Schuck, 1985; Shneiderman et al., 1988). Electrophys- iological studies have revealed only a single representation of frequency in the central nucleus of the IC (Aitkin et al., 1972; Merzenich and Reid, 1974); therefore, it is likely that these inputs overlap to a great extent. In the thalamus, convergence among ascending and descending inputs is probable. In addition to receiving strong topographical projections from the IC, both the MGB and Pol receive descending input from the auditory cortex (Andersen et al., 1980b). It is also possible that a single thalamic neuron receives input from more than one IC neuron.
The results of this study and those of others suggest that the proportion of cells with intermediate CPs increases at progres- sively higher stations in the auditory pathway. In the medial superior olive of the cat, nearly all units had CDs corresponding to maximal discharge, while this was not true for neurons in the IC (Yin and Kuwada, 1983; Yin and Chan, 1990). The results of our study show that a further increase in neurons with intermediate CPs occurs between the IC and thalamus.
Other studies in the thalamus did not consider neurons with intermediate CPs, but such neurons appear to have been present. For example, Ivarsson et al. (198 1) reported that cells in the MGB of the cat did not appear to have CDs. However, they did not consider anything other than maximum discharge in their definition of CD. Thus, some units considered not to have had CDs may have had intermediate CPs. In another study, Ivarsson et al. (1988) reported that noise delay curves for thalamic neu- rons were most often asymmetric. Asymmetric composite curves are typical of units with intermediate CPs both in the IC (Yin et al., 1986) and thalamus (Fig. 7). Such asymmetric composite curves have steeply rising slopes that could code small changes in azimuthal location.
Preservation of bias for ipsilateral delays
We have previously reported that the CDs and peak delays of units in the IC of the rabbit show a pronounced bias for ipsi- lateral delays (Kuwada et al., 1987). Data from the additional 8 1 IC units included in this report confirm the original finding.
A primary finding of this study is that a similar bias is observed for units recorded in the auditory thalamus. The preservation of a bias for ipsilateral delays from IC to thalamus is consistent with the strong ipsilateral projections from IC to MGB and Pol (Moore and Goldberg, 1963; Tarlov and Moore, 1966; Andersen et al., 1980a; Calford and Aitkin, 1983; Oliver, 1984).
In the IC, ipsilateral biases have been reported in the cat (Kuwada and Yin, 1983; Yin and Kuwada, 1983; Yin and Chan, 1990) and guinea pig (Palmer et al., 1990). In the thalamus, there is also evidence for a preference for ipsilateral delays in the cat (Altman, 1970b; Ivarsson et al., 1988) and squirrel mon- key (Starr and Don, 1972).
Ipsilateral delays are created by sounds in the contralateral hemifield. Thus, the observed bias for ipsilateral delays suggests
that a contralateral representation of azimuth is present in the IC and preserved in the thalamus. This agrees with the results
ofbehavioral and free-field studies. Jenkins and Masterton (1982) reported that lesions of either the IC or MGB result in deficits in a cat’s ability to localize sounds in the contralateral sound field. Consistent with this, Aitkin et al. (1985) found nearly all spatially tuned neurons in the IC of the cat to have contralateral receptive fields.
We estimate that, for a rabbit, a fully lateralized sound creates an ITD of between 200 and 300 wsec. We measured the inter- tragus distance of our rabbits and based our estimate of maxi- mum interaural delays upon free-field measurements made on cats with various intertragus distances (Roth et al., 1980). Our estimate of the rabbit’s physiological range agrees with that of Heffner and Masterton (1980).
For both the IC and thalamus, the majority of CDs and peak delays were within + 300 psec. The general correspondence be- tween the distributions of CD and peak delay, and the rabbit’s physiological range is further evidence to suggest that these neu- rons contribute to a representation of azimuth.
Tuning for ITDs and inhibitory processing
Units in the thalamus were more sharply tuned for ITDs than were those in the IC. The peak widths observed in the thalamus are similar to those reported for delay curves in the cat (Ivarsson et al., 1988).
The sharper tuning for ITDs in the thalamus was not due to differences in stimulus parameters used when studying the thal- amus and IC. Similar ranges of stimulus frequency and level were used to assess ITD sensitivity at the two sites. Although the mean level was 5.6 dB higher for the thalamus, this difference is small compared to the range of levels employed (-40-80 dB SPL) and is due primarily to thalamic units recorded from a single animal that appeared to have an elevated threshold. Ex- cluding these units, the difference is 2.6 dB and not significant fp > 0.05). In any event, these units did not show exceptional tuning for ITDs, but instead had slightly greater peak widths (mean, 252 wsec) than the thalamic population as a whole.
The process of sharpening the tuning for ITDs may begin in the midbrain and may involve inhibitory mechanisms. Fujita and Konishi (1988) showed that in the IC of the barn owl GABA- mediated inhibition plays a role in restricting the range of ITD over which a neuron responds. One of our earlier findings sug- gests that a similar mechanism may function in the IC of the rabbit (Kuwada et al., 1989). We found that intravenous ad- ministration of sodium pentobarbital, an anesthetic that en- hances GABA-mediated inhibition (Barker and Ransom, 1978; Richter and Holtman, 1982) decreased the widths of composite
The Journal of Neuroscience, August 1992, 12(E) 3213
curve peaks. It is worth noting that administration of barbiturate caused a decline in response rate for all ITDs. Thus, even at the “most favorable” ITD, response rate may be the outcome of a competition between excitatory and inhibitory influences.
A similar inhibitory mechanism may operate in the thalamus to sharpen ITD tuning. Our own observations, and those of others, are consistent with this notion. First, response rates for units in the thalamus were about half those for units in the IC. Second, in response to monaural stimulation, inhibition was more prevalent for units in the thalamus. In contrast to the IC, in which the most common response combination was EE, the II combination was the most common in the thalamus.
Our observation that inhibition is more prevalent in the thal- amus is consistent with the findings of others (Aitkin and Dun- lop, 1968, 1969; Starr and Don, 1972). This increase may reflect the influence of the Golgi II cell, an inhibitory interneuron (Mo- rest, 1975). Inhibitory responses could also arise from direct inhibitory projections from the IC. Neurons immunoreactive for GABA and its precursor have been found in the IC (Penney et al., 1984; Roberts and Riback, 1987). About 20% of stellate and disk-shaped cells in the IC show such immunoreactivity (Oliver and Beckius, 1989). These morphological cell types are known to project to the auditory thalamus (Oliver and Hall, 1978).
We observed more sustained excitation and fewer transient responses than investigators who have used anesthetized prep- arations to study the auditory thalamus. Sustained excitation was reported in 10% of MGB neurons in cats anesthetized with nitrous oxide (Rouiller et al., 1979) or sodium pentobarbital (Calford, 1983). In contrast, we observed sustained excitation in about 50% of thalamic units in response to either ipsilateral or contralateral tone bursts. Aitkin and Prain (1974) also noted an increase in sustained excitation in the thalamus of the un- anesthetized cat.
Differences in the responses of units in the IC and thalamus may, in part, be due to factors such as sleep. We recognize that the responsiveness of units in these two sites may be differen- tially affected by sleep. However, dramatic changes in neural activity that might have suggested a fluctuating state of arousal were never noted. Furthermore, the experimental conditions were not conducive to sleep. Stimuli were presented at irregular intervals and at different frequencies and levels, and the booth was sometimes entered during the 2 hr recording sessions.
“Place code” for sound source azimuth
In his “coincidence model,” Jeffress (1948) proposed a way in which ITD-sensitive neurons could be created and arrayed to represent stimulus position on the azimuth as “place” within the auditory pathway. In this scheme, different ITDs, corre- sponding to different positions on the azimuth, result in different loci of activity within the neural array. The anatomical and physiological substrate of such a “map” of ITD has been found in the owl’s brainstem (Sullivan and Konishi, 1986; Carr and Konishi, 1988). This map is relayed to the central nucleus of the IC, and ultimately contributes the azimuthal component of an auditory “space map” in the external nucleus of the IC (Knudsen and Konishi, 1978). Comparable evidence for a map of ITDs contributing to the formation of a space map is not available in any mammalian system, although recently Yin and Chan (1990) provided evidence for the existence of an ITD map in the medial superior olive of the cat.
Although Yin and Chan’s recent findings argue to the con-
0 ; I I I I I
b
I 1
-500 -400 -300 -200 -100 lb0 200
0 ( I I I I I I I
-500 -400 -300 -200 -100 0 100 200
ipsilateral contralateral
INTERAURAL DELAY (psec)
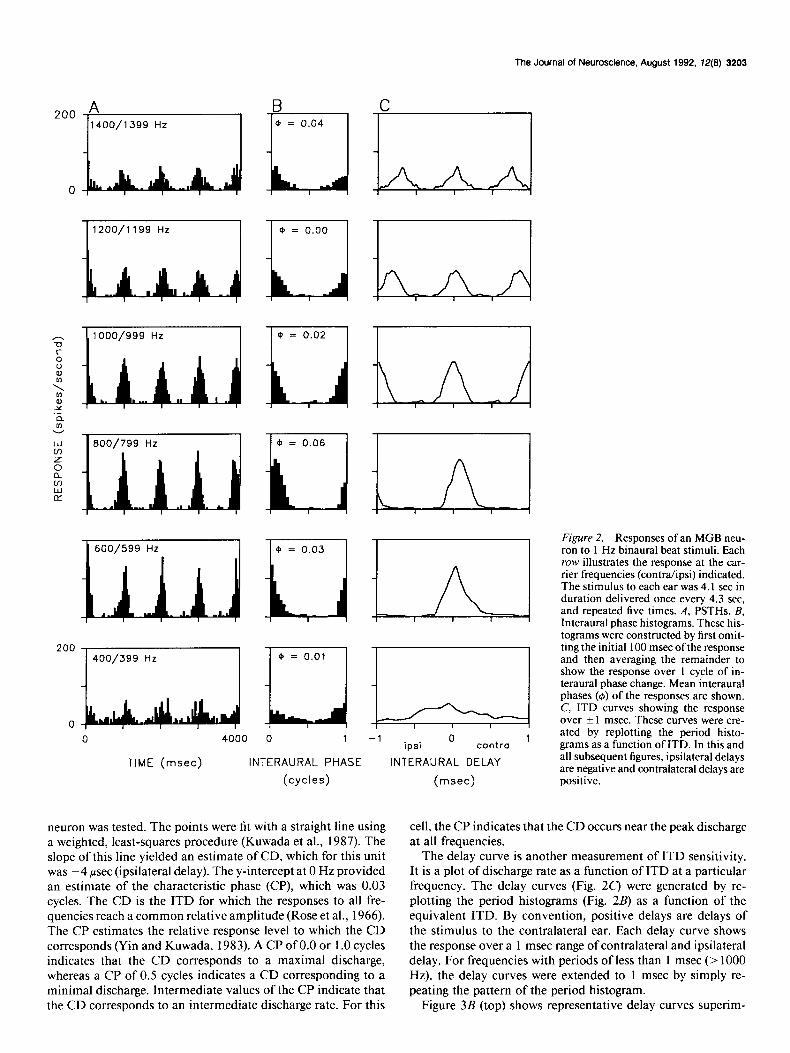
Figure 15. Summed composite curves showing ITD sensitivities of four subpopulations in the IC (A) and thalamus (B). Each subpopulation comprises units with similar peak delays. Composite curves were gen- erated by summing the composite curves of individual units. Summed composite curves were normalized to demonstrate relative activity. From left to right, the four summed composite curves represent the ITD sen- sitivities of units with peak delays near -250, -150, -50, and +50 rrsec.
trary, it has been suggested that ITD-sensitive neurons do not contribute to a “place” representation ofauditory space in mam- mals. Others have noted that most units in the IC of the guinea pig and kangaroo rat are tuned to ITDs beyond those that these animals would normally encounter (Stillman, 197 1; Palmer et al., 1990). Stillman (197 1) further suggested that tuning for ITDs was too crude to support a place code. Starr and Don (1972) raised similar objections, noting that the response profiles for units in the MGB ofthe squirrel monkey were broad and without well-defined peaks.
Our results indicate relatively crude tuning for ITDs. The mean peak width for units in the IC was 292 psec, or nearly half of the entire physiological range (?300 psec). Although thalamic neurons were more sharply tuned (mean, 229 wsec), their receptive fields would still encompass a large part of the physiological range. However, most of the peaks occurred for ITDs within the rabbit’s physiological range.
Despite very coarse tuning for ITDs, sound source position might be encoded as a locus of maximal activity. Even in the barn owl, where a map of auditory space has been demonstrated, neurons have broadly overlapping receptive fields, such that, for any one stimulus position, activity is distributed over a
3214 Stanford et al. * ITD Sensitivity in the IC and Thalamus of the Rabbit
I 000000000 x :~::lororo~lo I I I I I -1 +r;-J tr 5 c ITD = -200 psec 0 A a w loo 1
L ITD = -300 pet
D \1
0000 ulul~lrl
I +-cu m-=tmc\ ++ I I I I
PEAK DELAY OF SUBPOPULATION (pet)
ITD = -100 psec
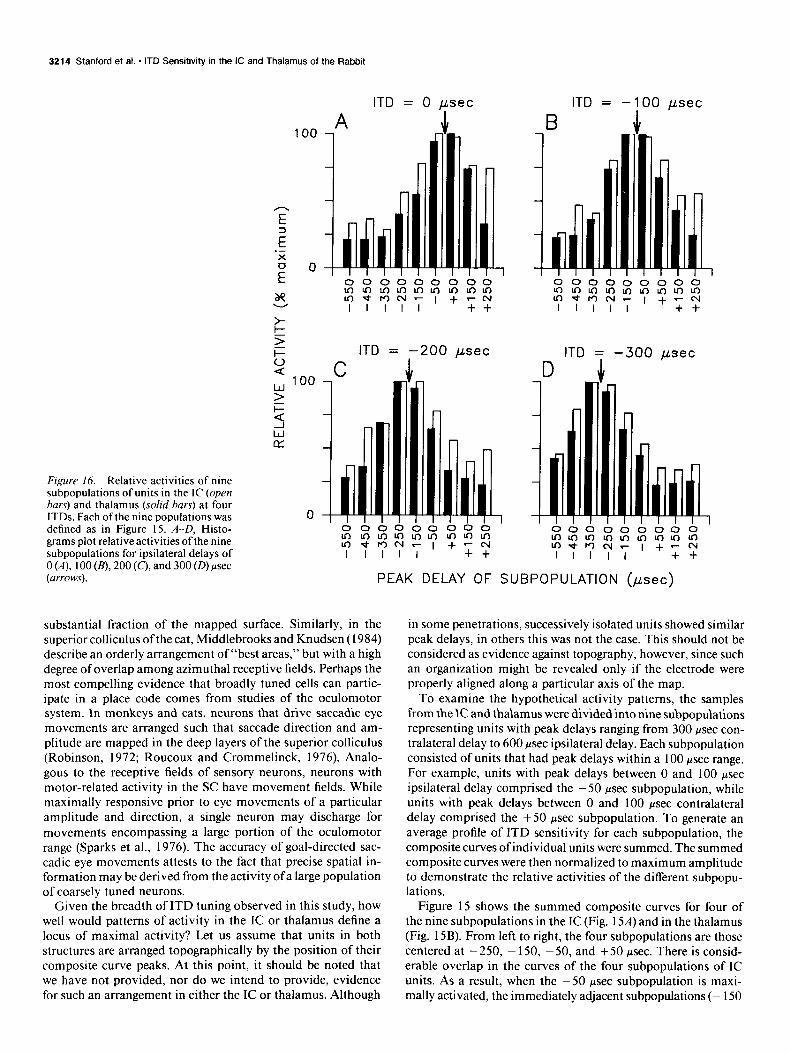
Figure 16. Relative activities of nine subpopulations of units in the IC (open bars) and thalamus (solid bars) at four ITDs. Each of the nine populations was defined as in Figure 15. A-D, Histo- grams plot relative activities ofthe nine subpopulations for ipsilateral delays of 0 (A), 100 (B), 200 (c), and 300 (D) psec (arrows).
substantial fraction of the mapped surface. Similarly, in the superior colliculus of the cat, Middlebrooks and Knudsen (1984) describe an orderly arrangement of “best areas,” but with a high degree of overlap among azimuthal receptive fields. Perhaps the most compelling evidence that broadly tuned cells can partic- ipate in a place code comes from studies of the oculomotor system. In monkeys and cats, neurons that drive saccadic eye movements are arranged such that saccade direction and am- plitude are mapped in the deep layers of the superior colliculus (Robinson, 1972; Roucoux and Crommelinck, 1976). Analo- gous to the receptive fields of sensory neurons, neurons with motor-related activity in the SC have movement fields. While maximally responsive prior to eye movements of a particular amplitude and direction, a single neuron may discharge for movements encompassing a large portion of the oculomotor range (Sparks et al., 1976). The accuracy of goal-directed sac- cadic eye movements attests to the fact that precise spatial in- formation may be derived from the activity ofa large population of coarsely tuned neurons.
in some penetrations, successively isolated units showed similar peak delays, in others this was not the case. This should not be considered as evidence against topography, however, since such an organization might be revealed only if the electrode were properly aligned along a particular axis of the map.
To examine the hypothetical activity patterns, the samples from thelC and thdamus were divided into nine subpopulations representing units with peak delays ranging from 300 wsec con- tralateral delay to 600 psec ipsilateral delay. Each subpopulation consisted of units that had peak delays within a 100 lrsec range. For example, units with peak delays between 0 and 100 psec ipsilateral delay comprised the - 50 psec subpopulation, while units with peak delays between 0 and 100 lrsec contralateral delay comprised the +50 psec subpopulation. To generate an average profile of ITD sensitivity for each subpopulation, the composite curves of individual units were summed. The summed composite curves were then normalized to maximum amplitude to demonstrate the relative activities of the different subpopu- lations.
Given the breadth of ITD tuning observed in this study, how Figure 15 shows the summed composite curves for four of well would patterns of activity in the IC or thalamus define a the nine subpopulations in the IC (Fig. 154) and in the thalamus locus of maxima1 activity? Let us assume that units in both (Fig. 15B). From left to right, the four subpopulations are those structures are arranged topographically by the position of their centered at -250, - 150, -50, and +50 psec. There is consid- composite curve peaks. At this point, it should be noted that erable overlap in the curves of the four subpopulations of IC we have not provided, nor do we intend to provide, evidence units. As a result, when the -50 psec subpopulation is maxi- for such an arrangement in either the IC or thalamus. Although mally activated, the immediately adjacent subpopulations (- 150
1

The Journal of Neuroscience, August 1992, 12(E) 3215
and + 50 Fsec) are activated to about 80% of maximum, while the - 250 psec subpopulation is activated to about 50% of max- imum. For the thalamus (Fig. 15B), the profiles overlap, but not to the extent of those for the IC. This difference reflects the narrower peak widths for units in the thalamus.
The relative activities of each of the nine subpopulations were plotted for simulated ipsilateral delays of 0, 100, 200, and 300 psec and are shown in Figure 16 for both the IC and thalamus. Each histogram (A-D) plots the activities of the nine subpopu- lations for one of these four ITDs. For each ITD, the pattern of activity across the IC and thalamic samples shows a distinct mode. As expected, the most responsive subpopulations are those with peak delays nearest the simulated delays (arrows). For example, at an ITD of0 psec, the + 50 and - 50 psec subpop- ulations are near maximal activity, whereas at an ipsilateral delay of 300 psec, the - 250 and - 350 psec subpopulations are nearest to maximal activity. Note that even though the -450 and -550 psec subpopulations have peak delays beyond the physiological range, they still contribute to the pattern of activ- ity, especially at the longer ipsilateral delays.
The effect of sharper tuning can be seen in the patterns of activity for the thalamus. For each ITD, relative activity de- clines more rapidly across subpopulations tuned to more remote ITDs. As a result, the locus of maximal activity is better defined in the thalamus than in the IC. Whether or not sharpening is a step toward achieving a representation ofazimuth, it seems that, if a large population is considered, even neurons that are quite broadly tuned for ITDs could contribute to the formation of a place code.
Batra RS, Kuwada S, Stanford TR (1989) Temporal coding of enve- lopes and their interaural delays in the inferior colliculus of the un- anesthetized rabbit. J Neurophysiol 61:257-268.
Brownell WE (1975) Organization of the cat trapezoid body and the discharge characteristics of its fibers. Brain Res 94:4 13-433.
Brugge JF, Merzenich MM (1973) Responses of neurons in auditory cortex ofthe macaque monkey to monaural and binaural stimulation. J Neurophysiol 3611138-l 158.
Bruaae JF. Dubrovskv NA. Aitkin LM. Anderson DJ (1969) Sensi- tizty of single neurons in auditory cortex of cat to binaural tonal stimulation: effects of varying interaural time and intensity. J Neu- rophysiol 32: 1005-1024.
Brugge JF, Anderson DJ, Aitkin LM (1970) Responses of neurons in the dorsal nucleus of the lateral lemniscus of cat to binaural tonal stimulation. J Neurophysiol 33:44 1458.
Brunso-Bechtold JK, Thompson GC, Masterton RB (I 98 1) HRP study of the organization of auditory afferents ascending to central nucleus of inferior colliculus in cat. J Comp Neural 197:705-722.
Caird D, Khnke R (1983) Processing of binaural stimuli by cat superior olivary complex neurons. Exp Brain Res 52:385-399.
Calford MB (1983) The parcellation of the medial geniculate body of the cat defined by auditory response properties of single units. J Neu- rosci 3:2350-2364.
Calford MB, Aitkin LM (1983) Ascending projections to the medial geniculate body of the cat: evidence for multiple, parallel auditory pathways through thalamus. J Neurosci 3:2365-2380.
Camey LH, Yin TCT (1989) Responses of low-frequency cells in the inferior colliculus to interaural time differences of clicks: excitatory and inhibitory components. J Neurophysiol 62: 144-l 6 I.
Cat-r CE, Konishi M (1988) Axonal delay lines for time measurements in the owl’s brainstem. Proc Nat Acad Sci USA 85:83 II-83 15.
Crow G, Rupert AL, Moushegian G (1978) Phase locking in monaural and binaural medullary neurons: implications for binaural phenom- ena. J Acoust Sot Am-64:493-50 1.
Finlayson PG, Caspary DM (199 1) Low-frequency neurons in the lateral superior olive exhibit phase-sensitive binaural inhibition. J
References Aitkin LM (1973) Medial geniculate body of the cat: responses to tonal
stimuli of neurons in the medial division. J Neurophysiol 36:275- 283.
Aitkin LM, Dunlop CW (1968) The interplay of excitation and in- hibition in the cat medial geniculate body. J Neurophysiol 3 1:44-6 1.
Aitkin LM, Dunlop CW (1969) Inhibition in the medial geniculate
Aitkin LM, Schuck DM (1985) Low frequency neurons in the lateral
body of the cat. Exp Brain Res 7:68-83. Aitkin LM, Prain SM (1974) Medial geniculate body: unit responses
central nucleus of the cat inferior colliculus receive their input pre-
in awake cat. J Neurophysiol 37:5 12-52 1.
dominantly from the medial superior olive. Hear Res 17:87-93. Aitkin LM, Webster WR (1972) Medial geniculate body of the cat:
organization and responses to tonal stimuli of neurons in the ventral division. J Neurophysiol 35:365-380.
Aitkin LM, Fryman RS, Blake DW, Webster WR (1972) Responses of neurones in the rabbit inferior colliculus. I. Frequency-specificity and topographic arrangement. Brain Res 47:77-90.
Aitkin LM, Pettigrew JD, Calford MB, Phillips SC, Wise LZ (1985)
Neurophysiol 65:598-605. Fujita I, Konishi M (1988) GABA-mediated inhibition contributes to
niscus. J Comp Neural 197:673-703.
neuronal selectivity for interaural time difference in the owl’s inferior
Goldberg JM, Brown PB (1969) Response of binaural neurons of dog
colliculus. Sot Neurosci Abstr 14:1096. Geisler CD, Rhode WS, Hazelton DW (1969) Responses of inferior
colliculus neurons in the cat to binaural acoustic stimuli having wide
superior olivary complex to dichotic tonal stimuli: some physiological
band spectra. J Neurophysiol 32:960-974. Glendenning KK, Masterton RB (1983) Acoustic chiasm: efferent pro-
mechanisms of sound localization. J Neurophysiol 32:6 13-636.
jections of the lateral superior olive. J Neurosci 3: 152 1-l 537. Glendenning KK, Brunso-Bechtold JK, Thompson GC, Masterton RB
Heffner H, Masterton RB (1980) Hearing in Glires: domestic rabbit,
(198 1)
cotton rat, feral house mouse, and kangaroo rat. J Acoust Sot Am
Ascending auditory afferents to the nuclei of the lateral lem-
68:1584-1599. Henkel CK, Spangler KM (1983) Organization of the efferent projec-
tions of the medial superior olivary nucleus in the cat as revealed by HRP and autoradiographic tracing methods. J Comp Neurol 22 1: 416-428. Representation-of stimulus azimuth by low-frequency neurons in the
inferior colliculus of the cat. J Neurophysiol 53:43-59. Altman JA, Syka J, Shmigidina GN (1970a) Neuronal activity in the
MGB of the cat during monaural and binaural stimulation. Exp Brain Res 10:81-93.
Altman JA, Syka J, Shmigidina GN (1970b) Characteristics of the neuronal activity in the medial geniculate body of the cat during monaural and binaural stimulation. Physiol Bohemoslov 19: 177-l 84.
Andersen RA, Roth GL, Aitkin LM, Merzenich MM (1980a) The efferent projections of the central nucleus and pericentral nucleus of the infehor~colliculus in the cat. J Comp Neurbl 194:649-662.
Andersen RA. Knieht PL. Merzenich MM (1980b) The thalamocort- ical and corticothalamic connections of AI, AI1 and the anterior au- ditory field (AAF) in the cat: evidence for two largely segregated systems of connections. J Comp Neurol 194:663-70 1.
Barker JL. Ransom BR (1978) Pentobarbitone uharmacolonv of mam- malian central neuron& grown in tissue culture. J Physiol (Land) 280: 355-372.
Imig TJ, Morel A (1984) Topographical and cytoarchitectonic orga- nization of thalamic neurons related totheir targets in low-, middle-, and high-frequency representations in the cat auditory cortex. J Comp Neural 227:51 l-539.
Imig TJ, Morel A (1985) Tonotopic organization in the lateral part of posterior group of thalamic nuclei in the cat. J Neurophysiol 53: 836-851.
Ivarsson C, de Ribaupierre Y, Barohio A, de Ribaupierre F (1981) Interaural delay sensitive units in the MGB of the cat. In: Neuronal mechanisms of hearing (Syka J, Aitkin LM, eds), pp 245-249. New York: Plenum.
Ivarsson C, de Ribaupierre Y, de Ribaupierre F (1988) Influence of auditory localization cues on neuronal activity in the auditory thal- amus of the cat. J Neurophysiol 59:586-606.
Jeffress LA (1948) A place theory of sound localization. J Comp Phys- iol Psycho1 41:35-39.
Jenkins WM, Masterton RB (1982) Sound localization: effect of uni-

3216 Stanford et al. * ITD Sensitivity in the IC and Thalamus of the Rabbit
lateral lesions in the central auditorv system. J Neurophvsiol47:987- tones and broad band signals in the guinea-pig inferior colliculus. _ _ - _ 1016.
Knudsen EI, Konishi M (1978) Space and frequency are represented separately in the auditory midbrain of the owl. J Neurophysiol 41: 870-884.
- . -
Hearing Res 50:6 l-86. Penney GR, Conley M, Schmechel DE, Diamond IT (1984) The dis-
tribution of glutamic acid decarboxylase immunoreactivity in the diencephalon of the opossum and the rabbit. J Comp Neurol 228:
Kudo M, Niimi K (1980) Ascending projections of the inferior col- liculus. J Comp Neurol 191:545-556.
Kuwada S, Yin TCT (1983) Binaural interaction in low-frequency neurons in inferior colliculus of the cat. I. Effects of long interaural delays, intensity, and repetition rate on interaural delay function. J Neurophysiol 50:98 l-999.
Kuwada S, Yin TCT, Wickesberg RE (1979) Response of cat inferior colliculus neurons to binaural beat stimuli: possible mechanisms for sound localization. Science 206:586-588.
Kuwada S, Yin TCT, Syka J, Buunen T, Wickesberg RE (1984) Bin- aural interaction in low frequency neurons of inferior colliculus of the cat. IV. Comparison of monaural and binaural response prop- erties. J Neurophysiol 5 1: 1306-l 325.
Kuwada S, Stanford TR, Batra R (1987) Interaural phase sensitive units in the inferior colliculus of the unanesthetized rabbit: effects of changing frequency. J Neurophysiol 57:1338-1360.
Kuwada S, Batra R, Stanford TR (1989) Monaural and binaural re- sponse properties of neurons in the inferior colliculus of the rabbit: effects of sodium oentobarbital. J Neurophvsiol 6 1:269-282.
38-56.- Reinis S, Landolt JP, Weiss DS (1985) Effect of nitrous oxide on the
functional characteristics of cells in the extrastriate cortex of the cat. Exp Brain Res 59~463469.
Rhode WS (1976a) A test for the significance of the mean direction and the concentration parameter of a circular distribution. Madison, WI: University of Wisconsin, Department of Neurophysiology.
Rhode WS (1976b) A digital system for auditory neurophysiological research. In: Current computer technology in neurobiology (Brown P, ed), pp 543-567. Washington, DC: Hemisphere.
Richter JA, Holtman JR (1982) Barbiturates: their in vivo effects and potential biochemical mechanisms. Neurobiology 18:275-3 19.
Roberts RC, Ribak CE (1987) GABAergic neurons and axon terminals in the brainstem auditory nuclei of the gerbil. J Comp Neurol 258: 267-280.
Robinson DA (1972) Eye movements evoked by collicular stimulation in the alert monkey. Vision Res 12: 1795-l 808.
Rose JE, Gross NB, Geisler CD, Hind JE (1966) Some neural mech- anisms in the inferior colliculus of the cat which may be relevant to localization of a sound source. J Neurophysiol 29:288-3 14.
Roth GL, Aitkin LM, Andersen RA, Merzenich MM (1978) Some features ofthe spatial organization ofthe central nucleus ofthe inferior colliculus of the cat. J Comp Neurol 182:66 l-680.
Roth GL, Kochhar RK, Hind JE (1980) Interaural time differences:
Langford TL (1984’) Responses elicited from medial superior olivary
I , ,
neurons by stimuli associated with binaural masking and unmasking.
responses in the cat retina, striate cortex, and superior colliculus. Brain
Hear Res 15:39-50. Lavine RA (1971) Phase-locking in response of single neurons in
Res 193:401-414.
cochlear nuclear complex of the cat to low-frequency tonal stimuli.
Mardia KV (1972) Statistics ofdirectional data. New York: Academic.
J Neurophysiol 34:467-483. Mandl G. Desav N. Canadav C (1980) Nitrous oxide modifies visual
Merzenich MM, Reid MD (1974) Representation ofthe cochlea within
implications regarding the neurophysiology of sound localization. J
Roucoux A, Crommelinck M (1976) Eye movements evoked by su- Acoust Sot Am 68: 1643-l 65 1.
perior colliculus stimulation in the alert cat. Brain Res 106:349-363. Rouiller EM, de Ribaupierre F (1985) Origin of afferents to physio-
logically defined regions of the medial geniculate body of the cat: the inferior colliculus of the cat. Brain Res 77:3974 15.
Middlebrooks JC, Knudsen EI (1984) A neural code for auditory space in the cat’s superior colliculus. J Neurosci 4:2621-2634.
ventral-and dorsal divisions. Hear Res 1997-l 14. Rouiller EM, de Ribaupierre Y, de Ribaupierre F (1979) Phase-locked
responses to low frequency tones in the medial geniculate body. Hear Moore RY, Goldberg JM (1963) Ascending projections of the inferior
colliculus in the cat. J Comp Neurol 121:109-136. Morest DK (1964) The neuronal architecture of the medial geniculate
body of the cat. J Anat 98:6 1 l-630. Morest DK (1965) The laminar structure of the medial geniculate
body of the cat. J Anat 99:143-160. Morest DK (1975) Synaptic relationships of Golgi type II cells in the
medial geniculate body of the cat. J Comp Neurol 162: 157-l 94. Morest DK, Winer JA (1986) The comparative anatomy of neurons:
homologous neurons in the medial geniculate body of the opossum and the cat. In: Advances in anatomy, embryology, and cell biology (Beck F, Hild W, Ortmann R, Pauly JE, eds), pp l-96. New York: Springer.
Moushegian G, Rupert AL, Langford TL (1967) Stimulus coding by medial superior olivary neurons. J Neurophysiol 30: 1239-I 26 1.
Oliver DL (1982) A Golgi study of the medial geniculate body in the tree shrew (Tupaiu glib). J Comp Neural 209: l-l 6.
Oliver DL (1984) Neuron types in the central nucleus that project to the medial geniculate body. Neuroscience 11:409-424.
Oliver DL, Beckius G (1989) GABA immunocytochemistry and spec- ulation on inhibitory circuits in the inferior colliculus of the cat. Assoc Res Otolaryngol Abstr 12:9 1.
Oliver DL, Hall WC (1978) The medial geniculate in the tree shrew. I. Cytoarchitecture and midbrain connections. J Comp Neurol 182: 423458.
Palmer AR, Rees A, Caird D (1990) Interaural delay sensitivity to
Res 1:213-226. Shneiderman A, Oliver DL, Henkel CK (1988) The connections of
the dorsal nucleus of the lateral lemniscus. J Comp Neurol 276: 188- 208.
Sparks DL, Holland R, Guthrie BL (1976) Size and distribution of movement fields in the monkey superior colliculus. Brain Res 113: 2 l-34.
Starr A, Don M (1972) Responses of squirrel monkey (Samirisciureus) medial geniculate units to binaural click stimuli. J Neurophysiol 35: 501-517.
Stillman RD (197 1) Characteristic delay neurons in the inferior col- liculus of the kanaaroo rat. EXD Neurol 32:404-4 12.
Sullivan WE, Koniihi M (1986) A neural map of interaural phase difference in the owl’s brainstem. Proc Nat Acad Sci USA 83:8400- 8404.
Tarlov EC, Moore RY (1966) The tecto-thalamic connections in the brain of the rabbit. J Comp Neurol 126:403+22.
Yin TCT, Chan JCK (1990) Interaural time sensitivity in medial superior olive of cat. J Neurophysiol 64:465-488.
Yin TCT, Kuwada S (1983) Binaural interaction in low-frequency neurons in inferior colliculus of the cat. III. Effects of changing fre- quency. J Neurophysiol 50:1020-1042.
Yin TCT, Chan JCK, Irvine DRF (1986) Effects of interaural time delays of noise stimuli on low-frequency cells in the cat’s inferior colliculus. I. Responses to wideband noise. J Neurophysiol 55:280- 300.