a comparison of the measured and computed skin friction distribution on ...€¦ · the national...
TRANSCRIPT
American Institute of Aeronautics and Astronautics 1
A Comparison of the Measured and Computed Skin Friction Distribution on the Common Research Model
Gregory G. Zilliac1 and Thomas H. Pulliam2
NASA Ames Research Center, Moffett Field, CA 94035
Melissa B. Rivers3
NASA Langley Research Center, Hampton, VA 23681 Jordan Zerr4
Wichita State University, Wichita, KS 67260 Maureen Delgado5
Nettie Halcomb6
NASA Ames Research Center, Moffett Field, CA 94035
and
Henry Lee7
NASA Ames Research Center, Moffett Field, CA 94035
Drag arising from skin friction is nearly half of the total drag on a modern commercial transport aircraft under cruise conditions. Computational results of a commercial aircraft configuration known as the Common Research Model (CRM) configuration developed for the AIAA Fourth Drag Prediction Workshop (DPW-IV) show that the predicted skin friction drag can vary by two percent of the total drag depending on the turbulence model chosen and level of approximation employed (i.e. full or thin layer Reynolds Averaged Navier Stokes, RANS) in the governing equations. In the current paper, the Fringe Imaging Skin Friction (FISF) technique has been used to measure the skin friction distribution on the CRM under transonic conditions in the 11 Ft. wind tunnel at NASA Ames. The measured results are compared with RANS results. Although the uncertainty of the FISF measurements caused by temperature effects is relatively high, several significant differences have been observed between the computed and measured skin friction distributions. One such difference is in the vicinity of the wing leading edge where the measured flow is clearly laminar and the computational methodology employed assumed the flow to be fully turbulent.
Nomenclature A surface area CD aircraft drag coefficient ( _SF is skin friction drag)
c f skin friction coefficient
on oil index of refraction
1 Research Scientist, Aero-Physics Branch, M.S. 260-1, AIAA Member 2 Senior Research Scientist, Fundamental Modeling and Simulation Branch, M.S. 258-2, AIAA Member 3 Research Engineer, Configuration Aerodynamics Branch, MS 267, Senior Member AIAA. 4 Student Intern, Aeronautical Engineering Department, AIAA Member 5 Test Engineer, Wind Tunnel Operations Branch, M.S. 227-5, AIAA Member 6 Test Engineer, Wind Tunnel Operations Branch, M.S. 227-5, AIAA Member 7 Researcher, Fundamental Modeling and Simulation Branch, M.S. 258-2, AIAA Member
49th AIAA Aerospace Sciences Meeting including the New Horizons Forum and Aerospace Exposition 4 - 7 January 2011, Orlando, Florida
AIAA 2011-1129
This material is declared a work of the U.S. Government and is not subject to copyright protection in the United States.
Dow
nloa
ded
by N
ASA
Lan
gley
Res
earc
h C
tr o
n Fe
brua
ry 7
, 201
4 | h
ttp://
arc.
aiaa
.org
| D
OI:
10.
2514
/6.2
011-
1129
= =
=
=
American Institute of Aeronautics and Astronautics 2
fq = free stream dynamic pressure S' = inteferometric fringe spacing
wS = wing plan form area t = duration of oil exposure to the air flow
rT = light refraction angle K = span-wise position O = light source wavelength
oP = oil absolute viscosity
wW = wall shear stress
I. Introduction RAG arising from skin friction comprises roughly forty to fifty percent of the total drag on a commercial aircraft under cruise conditions. In recent years the skin friction drag level has declined as aircraft
manufacturers focus on designing cleaner configurations with longer laminar runs. Designs with even lower drag are possible but there are basic physical limitations that lead to diminishing returns. Nevertheless, small drag savings can have a substantial impact on an aircraft design and whether the design is commercially competitive or not. It has been estimated that a 1% drag reduction on a large aircraft is roughly equivalent to ten passengers. Drag reduction is also important from a fuel savings and environment point of view. For instance, on the Boeing 787, it was estimated that 30,000 gallons of fuel per aircraft per year could be saved by eliminating nacelle paint seams. To achieve drag reductions beyond the current state of the art will require among other things, the development of highly accurate and validated computational design tools. The primary aim of this paper is to compare the measured and computationally predicted skin friction distribution on an aircraft in an attempt to highlight areas where discrepancies exists and also areas for further improvement in drag prediction.
Computational modeling of the flow over a commercial aircraft configuration have advance to the point where the best cruise drag predictions are within a few drag counts (¨&D=0.0001) of that measured in wind tunnels (for configurations with transition specified at trip dot locations and with the angle of attack adjusted to match lift). Both computational and wind tunnel drag measurements are typically higher that those found in flight because of Reynolds number scaling and other effects. Nevertheless, computational tools are invaluable in the design process and so it is essential that these tools predict the details of the flow field (e.g. transition location, shock position, separation…etc.) with fidelity. To develop even greater confidence in computed results, Reynolds Averaged Navier Stokes (RANS) codes have been endlessly (but necessarily) validated against measured data and also other computational approaches. The current effort is part of a broader effort to generate a comprehensive dataset on a contemporary commercial aircraft configuration for validation of CFD codes.
In theory, a complete validation dataset of a transonic aircraft configuration would consist of integrated quantities such as force and moment data, flow field data such as temperature and velocity and surface data such as pressure, temperature and skin friction. For many years, the surface pressure distribution has been the principal surface measurement that aerodynamicists studied to gain an insight into how to increase lift and reduce drag yet surface pressure is a poor indicator of flow transition and separation. A relatively recent advance is the development of measurement techniques to measure the surface shear stress distribution (i.e. skin friction). High resolution skin friction measurements show the presence and extent of flow separation zones and where the boundary layer transitions from laminar to turbulent. If the surface pressure and skin friction distributions match between computation and experiment then all the other integrated and flow field comparisons will match equally well.
The Fringe Imaging Skin Friction (FISF) technique used in the current study is considered to be a direct measurement of skin friction and when properly implemented, it is one of the most accurate techniques available. The FISF technique is briefly described in the following section and additional details are given in references 1-7. Of greatest relevance to the current study are the results shown in references 1, 5 and 7 of comparisons between measured and computed skin friction distributions of aerodynamic interest.
This paper presents selected results of a skin friction measurements performed on the Common Research Model (CRM) in the 11 ft wind tunnel at NASA Ames compared to the results of a RANS computations performed on a high resolution grid. The computational approach and additional results including surface pressure distributions,
D
Dow
nloa
ded
by N
ASA
Lan
gley
Res
earc
h C
tr o
n Fe
brua
ry 7
, 201
4 | h
ttp://
arc.
aiaa
.org
| D
OI:
10.
2514
/6.2
011-
1129

American Institute of Aeronautics and Astronautics 3
computed integrated quantities such as lift and drag and effects of grid resolution and various computational approximations can be found in reference 8. These computations are the current state-of-the-art and they were generated as part of the AIAA Drag Prediction Workshop series.
II. Approach A. CRM Transonic Wind Tunnel Test
The CRM wind tunnel model is a 2.7 per cent scale model (see Fig. 1) of a contemporary commercial aircraft configuration that was developed for the fourth Drag Prediction Workshop (DWP-4) initiated by the AIAA Applied Aerodynamics Technical Committee. The configuration was designed to cruise at a Mach number of 0.85 and a lift coefficient of 0.5 at a Reynolds number of 40 million per mean aerodynamic chord. In 2010, the model was tested in the National Transonic Facility at NASA Langley and in the 11 Ft Transonic Wind Tunnel at NASA Ames. The Vascomax nickel alloy and stainless steel wind tunnel model has interchangeable horizontal stabilizers (i.e. tail off, -2o and +2o) and removable flow-through engine nacelles. The model was instrumented with 291 pressure taps, two Kulite pressure transducers, two RTD temperature sensors, and a six-component force and moment balance. During the 11-Ft wind tunnel entry, in addition to the surface skin friction measurements described here, pressure sensitive paint was used to measure the surface pressure distribution, particle imaging velocimetry measurements were performed in the near wake, and infrared surface temperature measurements were recorded for selected wind tunnel runs.
Figure 1. The CRM wind tunnel model (shown as tested without nacelles).
The Fringe Imaging Skin Friction (FISF) technique was used to measure the surface skin friction at points on the wing, fuselage and tail of the CRM in the 11 ft wind tunnel. Measurements were performed on the suction side of the left wing, the pressure side of the right wing, the left fuselage half and on the left tail surfaces (note that no engine nacelles were present). Twenty one runs were performed during the skin friction portion of the test as indicated in the prioritized list in Table 1. D
ownl
oade
d by
NA
SA L
angl
ey R
esea
rch
Ctr
on
Febr
uary
7, 2
014
| http
://ar
c.ai
aa.o
rg |
DO
I: 1
0.25
14/6
.201
1-11
29
American Institute of Aeronautics and Astronautics 4
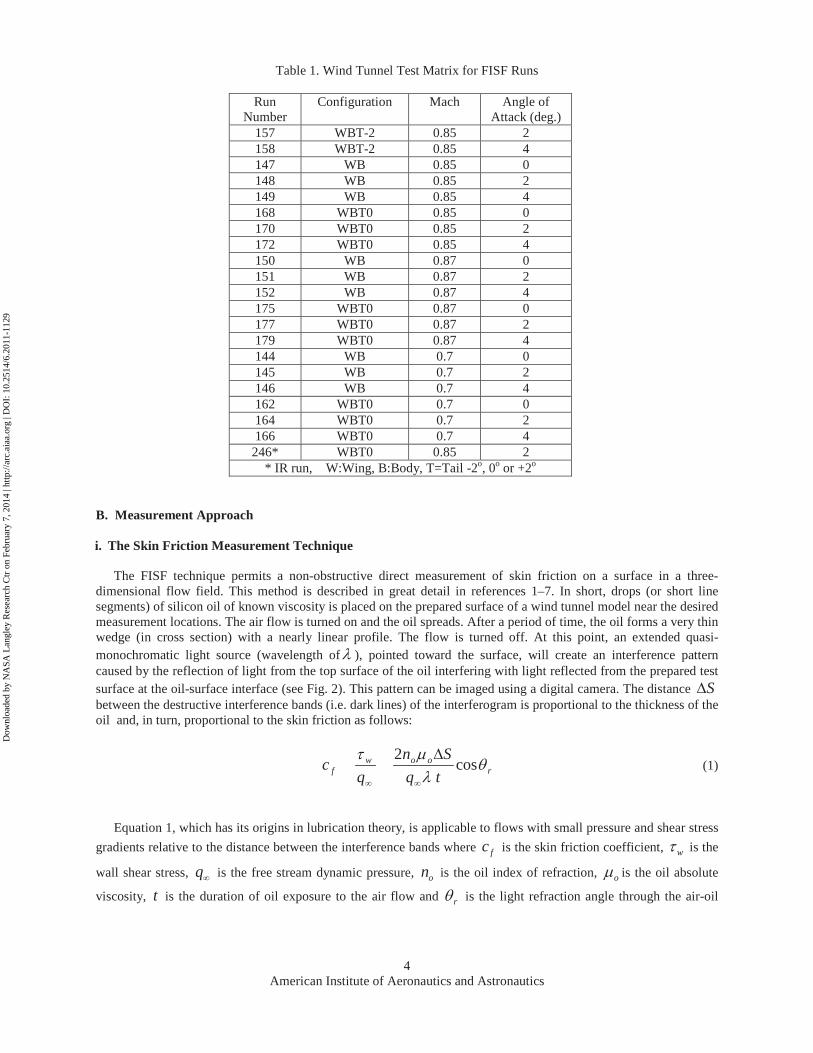
Table 1. Wind Tunnel Test Matrix for FISF Runs
Run Number
Configuration Mach Angle of Attack (deg.)
157 WBT-2 0.85 2 158 WBT-2 0.85 4 147 WB 0.85 0 148 WB 0.85 2 149 WB 0.85 4 168 WBT0 0.85 0 170 WBT0 0.85 2 172 WBT0 0.85 4 150 WB 0.87 0 151 WB 0.87 2 152 WB 0.87 4 175 WBT0 0.87 0 177 WBT0 0.87 2 179 WBT0 0.87 4 144 WB 0.7 0 145 WB 0.7 2 146 WB 0.7 4 162 WBT0 0.7 0 164 WBT0 0.7 2 166 WBT0 0.7 4
246* WBT0 0.85 2 * IR run, W:Wing, B:Body, T=Tail -2o, 0o or +2o
B. Measurement Approach
i. The Skin Friction Measurement Technique
The FISF technique permits a non-obstructive direct measurement of skin friction on a surface in a three-dimensional flow field. This method is described in great detail in references 1–7. In short, drops (or short line segments) of silicon oil of known viscosity is placed on the prepared surface of a wind tunnel model near the desired measurement locations. The air flow is turned on and the oil spreads. After a period of time, the oil forms a very thin wedge (in cross section) with a nearly linear profile. The flow is turned off. At this point, an extended quasi-monochromatic light source (wavelength of O ), pointed toward the surface, will create an interference pattern caused by the reflection of light from the top surface of the oil interfering with light reflected from the prepared test surface at the oil-surface interface (see Fig. 2). This pattern can be imaged using a digital camera. The distance S'between the destructive interference bands (i.e. dark lines) of the interferogram is proportional to the thickness of the oil and, in turn, proportional to the skin friction as follows:
r oow
f tq Sn
q c T
O PW
cos 2
ff
' (1)
Equation 1, which has its origins in lubrication theory, is applicable to flows with small pressure and shear stress gradients relative to the distance between the interference bands where fc is the skin friction coefficient, wW is the
wall shear stress, fq is the free stream dynamic pressure, on is the oil index of refraction, oP is the oil absolute
viscosity, t is the duration of oil exposure to the air flow and rT is the light refraction angle through the air-oil
Dow
nloa
ded
by N
ASA
Lan
gley
Res
earc
h C
tr o
n Fe
brua
ry 7
, 201
4 | h
ttp://
arc.
aiaa
.org
| D
OI:
10.
2514
/6.2
011-
1129

American Institute of Aeronautics and Astronautics 5
interface. In practice, the product tq
o
f
P in equation (1) is often replaced by ³ frunt
o
dtq 0
/1P
when wind tunnel
startup and shutdown transients (i.e. off condition) are a significant portion of the total run time and/or the temperature variation is significant.
Figure 2. Schematic of an FISF oil flow.
This inclusion of the rTcos term in equation (1) arises from the fact that fringe spacing is dependent on the location of the light source relative to the surface of the model or more precisely, the path that the light takes through the oil. If the light source is positioned so that the light rays strike the model normal or near-normal to the surface, then this term is equal or close to 1.0. In some wind tunnel tests, light is bounced off of the walls of the wind tunnel in order to achieve complete and even illumination of the surface. Under these conditions, the rTcosterm can have an appreciable impact on the skin friction measurement. The light refraction angle through the air-oil interface is related to the light incidence angle on the oil by � �oir na TT sinsin . The light incidence angle iTand measurement location are automatically determined as part of the data reduction process through the use of photogrammetry.
During data reduction, the fringe spacing S' in equation 1 is determined using a nine parameter model which is fit to the fringe-intensity distribution using a nonlinear regression algorithm. The advantage of this approach to fringe spacing determination is that the model is derived from the physics of interferometry. It makes allowances for such effects as surface curvature, noise, small optical imperfections and non-uniform lighting. In addition, the whole intensity record is used by the regression to identify the fringe spacing (as opposed to schemes which simply fit the peaks of the intensity distribution). The model is given by:
� � � �2 321
2 321
2 321 cos sPsPPsEsEEsBsBBI ������� (2)
Where I is the intensity, s is the distance along the centerline of the oil streak (in pixels), B , E , and P are the regression coefficients that are determined during the data reduction process (see refs. 1 and 6).
The skin friction coefficient magnitude is calculated by using a fringe spacing found from the regression followed by a conversion of the pixel-based fringe spacing to physical coordinates (via photogrammetry) and application of equation (1). The direction of the skin friction vector is found by determining the orientation of the oil
Dow
nloa
ded
by N
ASA
Lan
gley
Res
earc
h C
tr o
n Fe
brua
ry 7
, 201
4 | h
ttp://
arc.
aiaa
.org
| D
OI:
10.
2514
/6.2
011-
1129
American Institute of Aeronautics and Astronautics 6
path line relative to a fixed coordinate system. The FISF data reduction process has been automated to a degree in a PC-based application called CXWIN5G that was used in the current study (see reference 6).
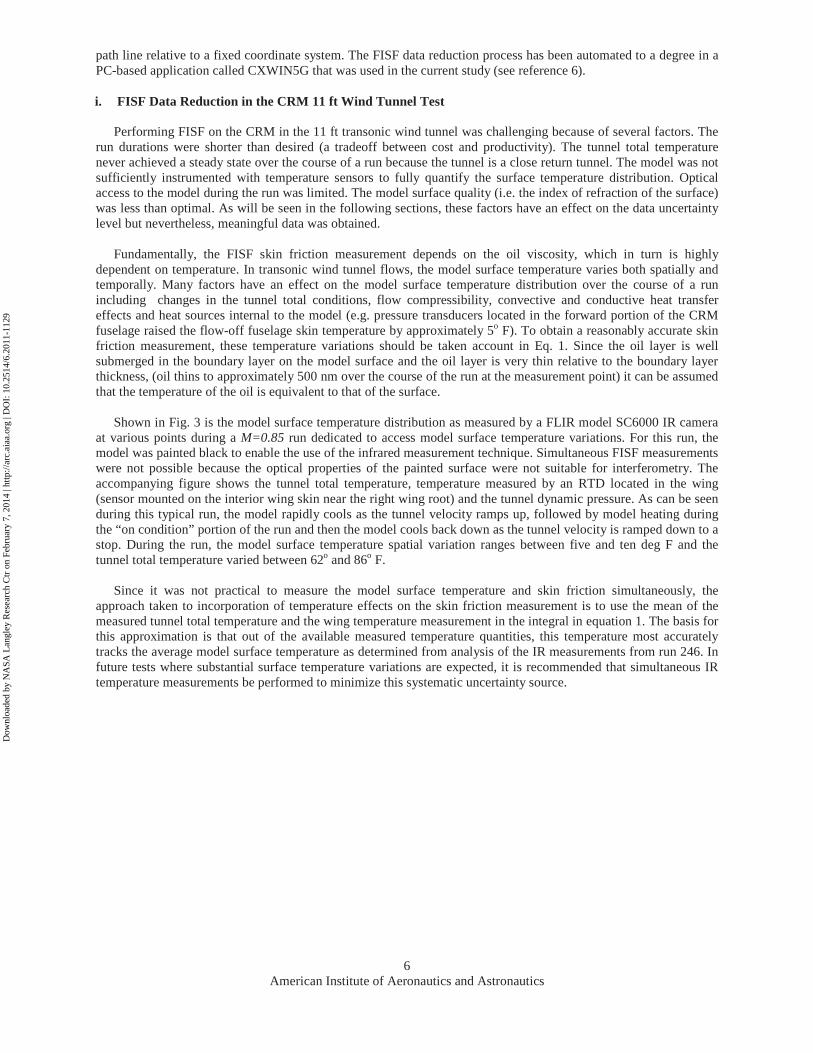
i. FISF Data Reduction in the CRM 11 ft Wind Tunnel Test
Performing FISF on the CRM in the 11 ft transonic wind tunnel was challenging because of several factors. The run durations were shorter than desired (a tradeoff between cost and productivity). The tunnel total temperature never achieved a steady state over the course of a run because the tunnel is a close return tunnel. The model was not sufficiently instrumented with temperature sensors to fully quantify the surface temperature distribution. Optical access to the model during the run was limited. The model surface quality (i.e. the index of refraction of the surface) was less than optimal. As will be seen in the following sections, these factors have an effect on the data uncertainty level but nevertheless, meaningful data was obtained.
Fundamentally, the FISF skin friction measurement depends on the oil viscosity, which in turn is highly dependent on temperature. In transonic wind tunnel flows, the model surface temperature varies both spatially and temporally. Many factors have an effect on the model surface temperature distribution over the course of a run including changes in the tunnel total conditions, flow compressibility, convective and conductive heat transfer effects and heat sources internal to the model (e.g. pressure transducers located in the forward portion of the CRM fuselage raised the flow-off fuselage skin temperature by approximately 5o F). To obtain a reasonably accurate skin friction measurement, these temperature variations should be taken account in Eq. 1. Since the oil layer is well submerged in the boundary layer on the model surface and the oil layer is very thin relative to the boundary layer thickness, (oil thins to approximately 500 nm over the course of the run at the measurement point) it can be assumed that the temperature of the oil is equivalent to that of the surface.
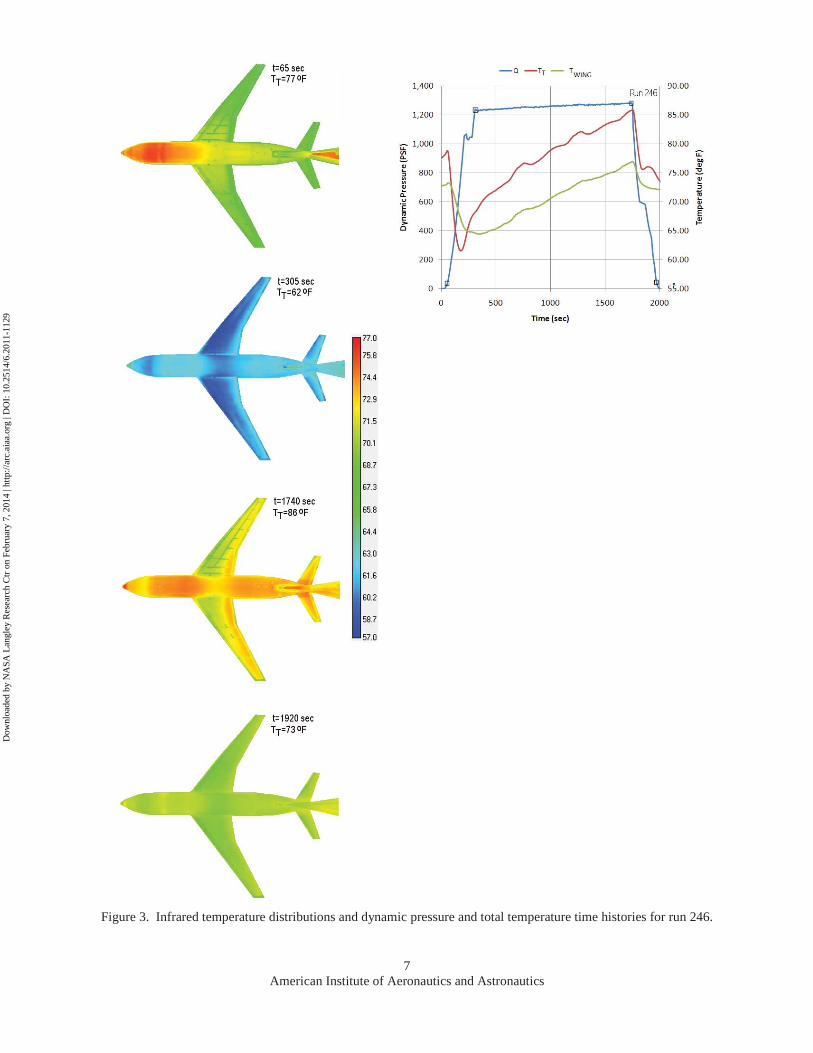
Shown in Fig. 3 is the model surface temperature distribution as measured by a FLIR model SC6000 IR camera at various points during a M=0.85 run dedicated to access model surface temperature variations. For this run, the model was painted black to enable the use of the infrared measurement technique. Simultaneous FISF measurements were not possible because the optical properties of the painted surface were not suitable for interferometry. The accompanying figure shows the tunnel total temperature, temperature measured by an RTD located in the wing (sensor mounted on the interior wing skin near the right wing root) and the tunnel dynamic pressure. As can be seen during this typical run, the model rapidly cools as the tunnel velocity ramps up, followed by model heating during the “on condition” portion of the run and then the model cools back down as the tunnel velocity is ramped down to a stop. During the run, the model surface temperature spatial variation ranges between five and ten deg F and the tunnel total temperature varied between 62o and 86o F.
Since it was not practical to measure the model surface temperature and skin friction simultaneously, the approach taken to incorporation of temperature effects on the skin friction measurement is to use the mean of the measured tunnel total temperature and the wing temperature measurement in the integral in equation 1. The basis for this approximation is that out of the available measured temperature quantities, this temperature most accurately tracks the average model surface temperature as determined from analysis of the IR measurements from run 246. In future tests where substantial surface temperature variations are expected, it is recommended that simultaneous IR temperature measurements be performed to minimize this systematic uncertainty source.
Dow
nloa
ded
by N
ASA
Lan
gley
Res
earc
h C
tr o
n Fe
brua
ry 7
, 201
4 | h
ttp://
arc.
aiaa
.org
| D
OI:
10.
2514
/6.2
011-
1129
American Institute of Aeronautics and Astronautics 7
Figure 3. Infrared temperature distributions and dynamic pressure and total temperature time histories for run 246.
Dow
nloa
ded
by N
ASA
Lan
gley
Res
earc
h C
tr o
n Fe
brua
ry 7
, 201
4 | h
ttp://
arc.
aiaa
.org
| D
OI:
10.
2514
/6.2
011-
1129
Dow
nloa
ded
by N
ASA
Lan
gley
Res
earc
h C
tr o
n Fe
brua
ry 7
, 201
4 | h
ttp://
arc.
aiaa
.org
| D
OI:
10.
2514
/6.2
011-
1129
For the current test, the wind tunnel transient duration (i.e. off condition portion of the run) was typically about 20% to 25% of the total run time. For instance, for run 246, the tunnel reached on condition at 305 sec, shutdown was initiated at 1920 sec and the total run duration was 2000 sec.
i. Measurement Uncertainty
The accuracy of FISF skin friction measurements is dependent on many factors including fringe visibility, camera resolution, temperature, and tunnel startup and shutdown transients. Using the CXWIN5G data reduction application with properly resolved interferometric images in a test where the model surface temperature is known and the wind tunnel startup transients are not significant, one can expect to achieve skin friction measurements that have uncertainties of r 5% and skin friction vector direction uncertainties of r1o as estimated in ref. 1. Unfortunately in large wind tunnels such as the 11 Ft, under transonic conditions, wind tunnel transients and surface temperature variations substantially degrade the skin friction measurement accuracy (e.g. for the 10,000 cs nominal oil viscosity used in this test, a 1o F oil temperature uncertainty leads to a 1.1% c f uncertainty). Therefore as mentioned previously, for greatest measurement accuracy, it is desirable to know the spatial variation of model surface temperature so that P can be accurately determined. The significant uncertainty sources in the skin o
friction magnitude measurements are summarized Table 2.
Table 2. Sources of Uncertainty in the Measured CRM Skin Friction Magnitude
Uncertainty Source
Uncertainty Level (% of cf)
Error type
Remarks
Oil viscosity, ( oP )
r 5.5% Precision* Spatial model surface temperature variations estimated at r 5o F leads to a oP uncertainty of r 0.0106 slugs/ft sec
( r 5.5% of oP ) Wind Tunnel startup and shutdown transients
� 4.4% Bias Uncertainty estimated based on flat plate turbulent boundary layer 1/7th power law. Typical 11 Ft. wind tunnel startup and shutdown times sum to 25% of total run duration. Since ReL is less than the on-condition ReL during tunnel startup and shutdown, measured cf is greater than the true value (because the effect of reduced Reynolds number is to increase cf as predicted by the power law).
Regression and imaging, ( 'S )
r 5.0% Precision Uncertainty estimate based on data in ref. 1. Average peak-to-peak fringe intensity is 17 levels and average number of pixels per fringe is 20
Total
6.1% 14.9%
�
� In locations where the surface temperature is close to the average temperature used in the data reduction, the uncertainty may be less.
* Could be greatly reduced if surface temperature distribution corrections were implemented.
Other uncertainty sources were considered but the uncertainty in the light source wavelength O , oil index of refraction n , free stream dynamic pressure qf were deemed to be small by comparison. The uncertainty in the o
skin friction vector direction is estimated to be r1o based on the resolution of the photogrammetry system.
C. Flow Field Prediction Methodology
The measured skin friction results are compared with those predicted by the RANS solver OVERFLOW. The solution methodology is described in detail in reference 8. The computational results were obtained on overset grids generated as part of the DPW-IV workshop process. The main computational results shown in the current paper are those predicted on the medium grid (16.9 million grid points) using the Spalart-Allmaras turbulence model, a central differencing scheme and run at the CRM cruise design point (i.e. CL=0.5, M=0.85). The Reynolds number based on mean aerodynamic chord is 5 million and the tail incidence is 0 deg. OVERFLOW was run at the computationally determined trimmed cruise angle of attack found of 2.364o which is slightly higher than the 2.0o angle set in the most relevant wind tunnel run (i.e. run 170). From this point on in the paper, the computed results at 2.364o and the
8 American Institute of Aeronautics and Astronautics

American Institute of Aeronautics and Astronautics 9
measured results at 2.0o will simply be referred to as the 2.0o nominal case. A 4o angle-of-attack case was also run specifically for this study.
III. Results and Discussion
The primary objective of the drag prediction workshops is to access the ability of computational techniques to predict drag. In this section, results of the CRM skin friction measurements will be presented and comparisons with RANS predicted skin friction will be made. Some differences have been observed between experiment and computation and these differences will be described. In addition to the results discussed here, one surprising difference discerned from a comparison of the data in Refs. 8 and 9 is the difference in computed and measured angle of attack at the design cruise lift coefficient of 0.5. This angle was found to be 2.364o as computed by RANS (see Ref. 8) and the data in Ref. 9 shows that the measured angle is about 3.0o in both the 11-Ft test and in the National Transonic Facility (NTF) test for the 0o incidence tail configuration at 85.0M and 6105Re uc
(wind tunnel data was corrected for wall effects). Even though this discrepancy exists, the computed and measured drag polars agree reasonably well. At this point, an explanation for this difference has not been put forth but possibly it is related to one or more factors including model deformation in the wind tunnel, wind tunnel walls not being included in the computations, minor differences in the chord-wise shock location or changes in the span-wise loading as a result of flow separation (some minor separation zones are seen in the computational results at
5.0LC ).
During the FISF 11-Ft wind tunnel test data reduction process, several interesting topological features were observed in the CRM skin friction distributions. Since the tail incidence has a minor influence on the skin friction distribution over most of the aircraft, the focus of this section will be on consideration of the CRM Wing-Body-Tail=0 (WBT0) configuration at a Mach number of 0.85, chord Reynolds number of five million and at angles of attack of 0, 2 and 4 degrees.
The computed skin friction results are from RANS computations of the CRM model as computed by the OVERFLOW code using the Spalart-Allmaras turbulence model with central differencing. Shown are results for the medium grid (16.9 million points) at M = 0.85, Re = 5 million and angles of attack of 2.0o and 4.0o (computed 2o
angle of attack results are actually at 2.327o where the computed CL =0.5) for the 0o tail configuration. Plotted are computed surface skin friction contours with the computed vector direction indicated by the black surface particle path lines and the measured data is superimposed as vectors colored by the measured skin friction magnitude. Outliers in the measured data have not been removed. The outliers are typically caused by poor fringe visibility.
One of the most obvious differences between the computational and measured results are the skin friction levels upstream of the wind tunnel model trip strip that is located at 10% of the chord. Plotted in Fig. 4 are computed and measured surface skin friction data. Also displayed is an inset image of the accompanying oil-flow interferometry that the measured skin friction data was derived from. The separation between the fringes (i.e. the dark bands) is proportional to the skin friction magnitude and the oil path line direction is indicative of the direction of the skin friction vector. The RANS computations were run assuming a fully turbulent flow field (contour levels of the predicted RANS skin friction results are predominantly green upstream of the trip location) while the measured skin friction levels on the wing leading edge (i.e. the blue-colored arrows) are those expected for a laminar flow.
The trip dot strip effectively trips the boundary layer as seen in the inset figure. The skin friction magnitude increases from the trip to approximately 40% of the chord and then decreases for this point to the trailing edge. In the vicinity of the trailing edge, the skin friction vector direction points significantly outboard.
A back-of-the-envelope calculation of the impact of the fully-turbulent assumption used in the RANS computations on the drag coefficient under cruise conditions (i.e. at o364.2D ) can be made. The RANS computed 027.0DC and roughly 40% of this drag is from skin friction ( 011.0_ SFDC ). The average
computed skin friction level is 004.0fc in the region forward of the trip strip and the average measured level is
0015.0fc in the same region. The surface area forward of the wing trip strips is about six percent of the total whetted surface area of the aircraft (including the fuselage and horizontal tail). Since the skin friction contribution to the total drag is:
Dow
nloa
ded
by N
ASA
Lan
gley
Res
earc
h C
tr o
n Fe
brua
ry 7
, 201
4 | h
ttp://
arc.
aiaa
.org
| D
OI:
10.
2514
/6.2
011-
1129

American Institute of Aeronautics and Astronautics 10
¸ ¸ ¹
· ¨ ¨ ©
§
» » ¼
º
« « ¬
ª ¸ ¸ ¹
· ¨ ¨ ©
§ � � ¸
¸ ¹
· ¨ ¨ ©
§|| ³
w
whetted
whetted
whetted f
whetted ff
w SFD S
A A
AA c
A A
cdAcS
C _
_
%10__ %90_
_
%10_ %10__
1
Where the subscript 10% refers to the whetted surface area forward of the trip strip and 90% refers to everything else. The skin friction coefficients are the spatially averaged values corresponding to the respective surface areas. The result is that the drag increment incurred by the fully turbulent RANS assumption upstream of the trip location is 00064.0' DC or 2.3% of the total drag on the aircraft.
Figure 4. Surface oil flow interferograms on left-wing suction side at o2D nominal, 85.0M and 6105Re uc .
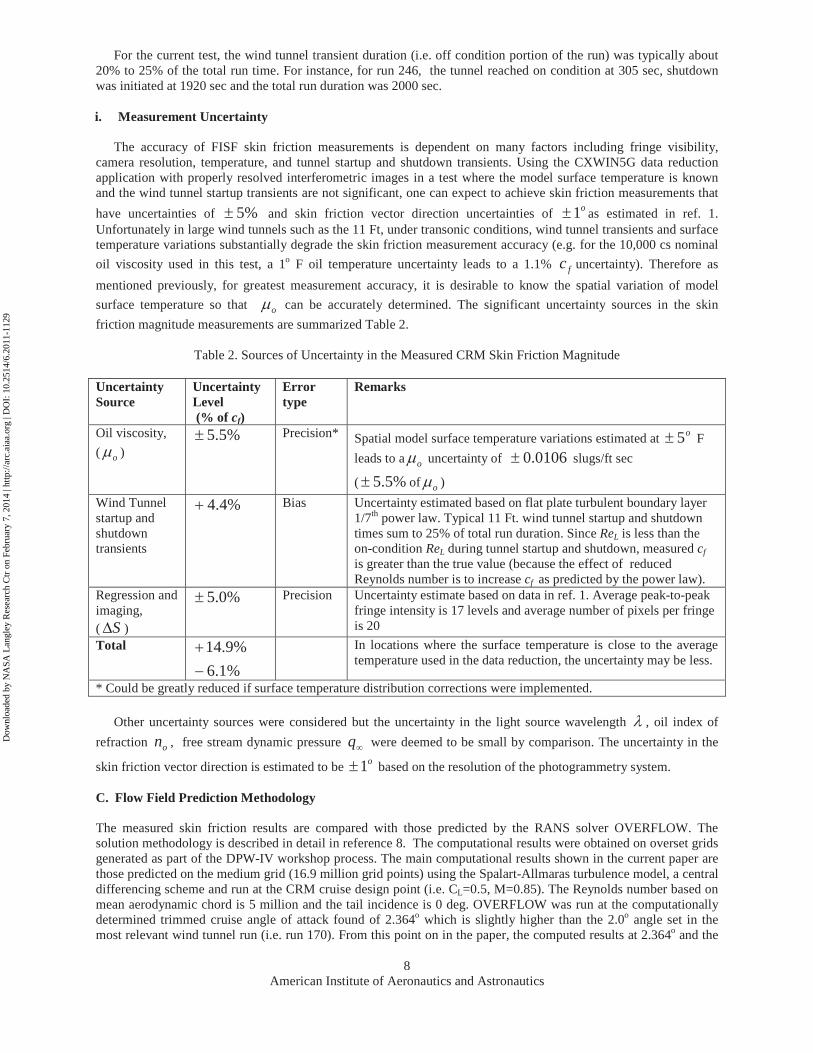
Shown in Fig. 5 is the suction side of the right wing for run number 172 ( o4D ). The shock-induced separation zone is expansive and aft of the shock, the surface flow is predominantly outboard. The shock is located at 41.6 percent of the chord at 603.0K for the measured results. Qualitatively, the RANS results show remarkably similar topology in the low-shear region aft of the shock. At angles of attack of 0o and 2o, the effects of the wing suction-side shock on the surface flow topology is relatively minor. No signs of shock-induced separation are observed in the oil-flow patterns which show chord-wise streaks that are relatively straight and continuous.
Dow
nloa
ded
by N
ASA
Lan
gley
Res
earc
h C
tr o
n Fe
brua
ry 7
, 201
4 | h
ttp://
arc.
aiaa
.org
| D
OI:
10.
2514
/6.2
011-
1129
American Institute of Aeronautics and Astronautics 11
Figure 5. Surface oil flow interferograms showing shock-induced separation on left-wing suction side at o4D , 85.0M and 6105Re uc .
The pressure-side surface flow topology (see Fig. 6) is rather interesting in that the oil flow turns outboard in the supercritical airfoil cusp and near the trailing edge. At higher angles of attack, the flow in this region significantly straighter.
Dow
nloa
ded
by N
ASA
Lan
gley
Res
earc
h C
tr o
n Fe
brua
ry 7
, 201
4 | h
ttp://
arc.
aiaa
.org
| D
OI:
10.
2514
/6.2
011-
1129

American Institute of Aeronautics and Astronautics 12
Figure 6. Pressure-side surface oil flow interferograms near the Yehudi break on the right-wing at o0D , 85.0M and 6105Re uc .
In Ref. 8, a small separation zone was found in the RANS results on the wing suction side outboard of the Yehudi break over the last 1.5% of the chord near the trailing edge at o354.2D , 85.0M and
6105Re uc . The measured shear stress levels in this region were found to be small but no separation was observed as seen in Fig. 7. The surface flow lines turn outboard and the shear level is low but it is above zero and no pooling of oil (a characteristic of a separated flow) is seen.
Figure 7. Suction-side surface oil flow interferograms outboard of the Yehudi break on the left-wing at o0.2D , 85.0M and 6105Re uc .
In the vicinity of the wing-body juncture near the trailing edge of the wing on the pressure side, the measured and computed skin friction levels are quite low. This is also true aft of the horizontal tail. Some computational approaches (see Ref. 8) have predicted flow separation in these regions. In the 11 ft test, the shear levels were so low
Dow
nloa
ded
by N
ASA
Lan
gley
Res
earc
h C
tr o
n Fe
brua
ry 7
, 201
4 | h
ttp://
arc.
aiaa
.org
| D
OI:
10.
2514
/6.2
011-
1129

American Institute of Aeronautics and Astronautics 13
in these regions that it was not possible to measure the skin friction magnitude using the 10,000 cs oil (i.e. no fringes were seen) and using a lower viscosity oil was not practical. This means that the shear stress levels were smaller than the minimum resolution of the technique ( 0001.0�fc ). The traditional titanium dioxide and motor oil visualization technique was used to visualize the surface topology in these regions (see Figs. 8 and 9). As can be seen, the flow is attached on the fuselage near the wing-fuselage juncture. A small region of spiral separation is observed in the vicinity of the horizontal tail fuselage juncture.
Figure 8. Oil flow of the wing-fuselage juncture near the wing trailing edge at o0.2D , 85.0M and 6105Re uc .
Figure 9. Oil flow of the horizontal tail-fuselage juncture near the horizontal tail trailing edge at o0.2D , 85.0M and 6105Re uc .
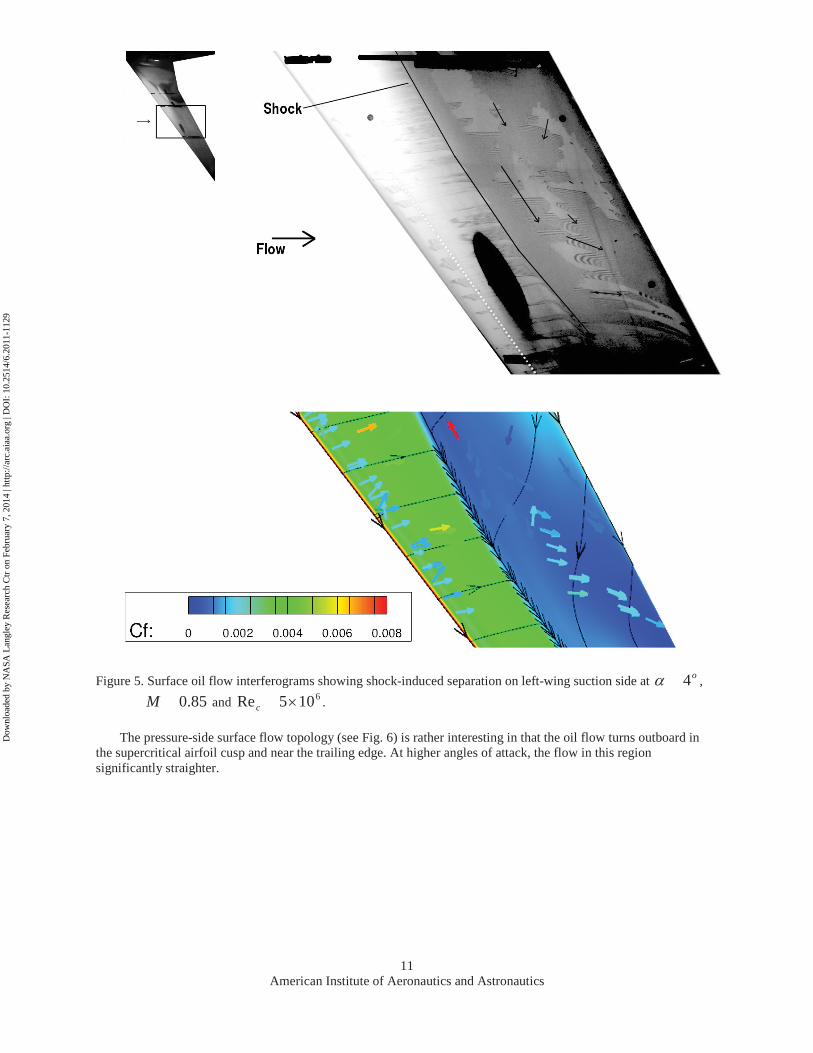
Presented in Figs. 10 through 13 are comparisons of the measured and computed skin friction distributions on the complete configuration. The magnitude of the fuselage skin friction is greatest near the cockpit and it generally decreases from fore to aft.
Dow
nloa
ded
by N
ASA
Lan
gley
Res
earc
h C
tr o
n Fe
brua
ry 7
, 201
4 | h
ttp://
arc.
aiaa
.org
| D
OI:
10.
2514
/6.2
011-
1129

American Institute of Aeronautics and Astronautics 14
Figure 10. Comparison of computed and measured pressure-skin friction at o364.2D for computed results and o0.2D for the measured results, 85.0M and 6105Re uc .
Figure 11. Comparison of computed and measured suction-side skin friction at o364.2D for computed results and o0.2D for the measured results, 85.0M and 6105Re uc .
Dow
nloa
ded
by N
ASA
Lan
gley
Res
earc
h C
tr o
n Fe
brua
ry 7
, 201
4 | h
ttp://
arc.
aiaa
.org
| D
OI:
10.
2514
/6.2
011-
1129
American Institute of Aeronautics and Astronautics 15
Figure 12. Comparison of computed and measured pressure-side skin friction at o0.4D , 85.0M and 6105Re uc .
Figure 13. Comparison of computed and measured suction-side skin friction at o4D , 85.0M and 6105Re uc .
Dow
nloa
ded
by N
ASA
Lan
gley
Res
earc
h C
tr o
n Fe
brua
ry 7
, 201
4 | h
ttp://
arc.
aiaa
.org
| D
OI:
10.
2514
/6.2
011-
1129

American Institute of Aeronautics and Astronautics 16
IV. Conclusions
The skin friction on the CRM aircraft configuration has been analyzed and comparisons have been made between the FISF-measured and the RANS-computed distributions at 85.0M and 6105Re uc over a range of angles of attack. Although the uncertainty in the measurements was higher than desired and the measured data set was sparse in comparison to the computed results, several significant conclusions can still be made.
1.) The measured skin friction levels on the leading edge of the wing (i.e. forward of the trip strip) are approximately a third of those computed by RANS using the fully-turbulent assumption. This difference alone can result in a two percent change in the total drag on the aircraft. Subsequent computations should include a either a transition model or specified transition locations.
2.) The impact of the shock on the wing suction-side surface flow topology is minor at angles of attack of 0o
and 2o. At 4o, the shock induces flow separation and a substantial low-shear zone forms aft of the shock wherein the surface flow is predominately span-wise. Side-by-side comparisons between the measured and computed skin friction topology and skin friction levels aft of the shock are qualitatively similar.
3.) Under CRM cruise conditions, RANS computations indicate a small separation zone over the last two percent of the wing chord outboard of the Yehudi break. The measured results indicate that the skin friction level is very low near the wing trailing edge but flow separation was not observed.
4.) Some computational results predict small separation zones in the vicinity of the wing and horizontal tail fuselage junctures under cruise conditions. It is clear that the measured skin friction levels are very low in these regions. At the wing-fuselage junction the characteristics typical of flow separation (i.e. reverse or spiraling flow) were not observed. At the horizontal tail-fuselage junction, a very small spiral-type separation zone was observed.
Several improvements could be made in future tests that would reduce the uncertainty in the FISF measurements in transonic wind tunnel tests. The most important improvement would be to acquire surface temperature measurements simultaneously with the skin friction measurements. Improved model surface optical quality would also be helpful to increase the fringe pattern visibility.
The progress made over the last decade in the ability of computation fluid dynamics codes to predict the flow field on an aircraft is remarkable. In the big picture, the differences between the computed and measured skin friction distributions discussed in this paper are relatively minor. On the other hand, since aircraft designers are attempting to reduce drag to the greatest extent possible, every minor increase in prediction fidelity will contribute to this cause.
Acknowledgments The authors would like to acknowledge the support of the NASA Fundamental Aeronautics program for
sponsoring this research.
References 1Zilliac, G. G.: Further Developments of the Fringe-Imaging Skin Friction Technique, NASA TM-110425, Dec. 1996. 2Naughton, J.W. and Sheplak, M “Modern Developments in Shear-Stress Measurement” Progress in Aerospace Sciences 38 (2002) p. 515–570.3Driver, D. and Zilliac, G., “Oil-Film Interferometry Shear Stress Measurements in Large Wind Tunnels- Techniques and Applications”. AIAA 2004-2113, 14th Aerodynamic Measurement Technology and Ground Testing Conference. 4Smits, A.J. and Lim T.T. ed., “Flow Visualization Techniques and Examples” Chapt. 8, Imperial College Press, 2000. 5McCallen, R., Flowers, D., Dunn, T., Owens, J., Browand, F., Hammache, M., Leonard, A., Brady, M., Salari, K., Rutledge, W., Ross, J., Storms, B., Heineck, J. T., Driver, D., Bell, J., Walker S.and Zilliac, G. “Aerodynamic Drag of Heavy Vehicles (Class 7-8): Simulation and Benchmarking, ”SAE TECHNICAL PAPER SERIES 2000-01-2209.6Zilliac, G.G., “The Fringe Imaging Skin Friction Technique PC Application V5.0 User’s Manual,” NASA TM 2010-216391, July 2010.7Zilliac, G.G, "Skin Friction Distribution on a Wingtip," AIAA 98-0584, Reno NV, Jan 12-15 1998.
Dow
nloa
ded
by N
ASA
Lan
gley
Res
earc
h C
tr o
n Fe
brua
ry 7
, 201
4 | h
ttp://
arc.
aiaa
.org
| D
OI:
10.
2514
/6.2
011-
1129

American Institute of Aeronautics and Astronautics 17
8 Sclafani, A.J., DeHaan, M.A., Vassberg, J.C., Rumsey, C.L. and Pulliam, T.H., “Drag Prediction for the NASA CRM Wing-Body-Tail using CFL3D and OVERFLOW on an Overset Mesh,” AIAA Paper 2010-4219, Chicago, IL, June 28-July1, 2010. 9 Rivers, M.B., Dittberner, A., “Experimental Investigations of the NASA Common Research Model in the NTF and Ames 11-ft Transonic Wind Tunnel” AIAA Paper, Jan. 4-7, Orlando, FL.
Dow
nloa
ded
by N
ASA
Lan
gley
Res
earc
h C
tr o
n Fe
brua
ry 7
, 201
4 | h
ttp://
arc.
aiaa
.org
| D
OI:
10.
2514
/6.2
011-
1129