a comparison of the results of many-facet rasch … · extended the use of the simple rasch model...
TRANSCRIPT

Received: December 2, 2015Revision received: February 6, 2016Accepted: February 19, 2016OnlineFirst: March 30, 2016
Copyright © 2016 EDAMwww.estp.com.tr
DOI 10.12738/estp.2016.2.0390 April 2016 16(2) 579-601
Research Article
KURAM VE UYGULAMADA EĞİTİM BİLİMLERİ EDUCATIONAL SCIENCES: THEORY & PRACTICE
Citation: İlhan, M. (2016). A comparison of the results of many-facet Rasch analyses based on crossed and judge pair designs. Educational Sciences: Theory & Practice, 16, 579-601.
1 Correspondence to: Mustafa İlhan (PhD), Department of Primary Education, Ziya Gökalp Faculty of Education, Dicle University, Diyarbakır Turkey. Email: [email protected]
Abstract
The aim of this study was to compare the results of many-facet Rasch analyses based on crossed and judge pair
designs. The study was conducted with 168 eighth grade students and five judges. The study data were collected
using an achievement test with open-ended questions and a holistic rubric that was used to rate the responses. In
the data collection process, the achievement test was initially administered to students. The students’ responses
were rated by five judges; the ratings provided the data set for the crossed design. In the judge pair design, the
students’ responses to the test items were rated by any two of the five judges. Then the researcher conducted
the many-facet Rasch analysis and compared the analysis outputs of the two designs. It was determined that
the difference between the elements of the facets included in the analysis was demonstrated more effectively
in the crossed design than the judge pair design. In the judge pair design, however, the study made significant
distinctions between the elements of the facets. Moreover, the study found that the relative agreement between
the ability estimations calculated based on crossed and judge pair designs was very high, and there was no
significant difference between the ability estimations reported by the two designs. Therefore, it is preferable to
choose judge pair design for examinations with a large number of participants as it will be less costly.
Keywords
Many-facet Rasch model • Crossed design • Judge Pair design • Open-ended items • Ability estimation
Mustafa İlhan1
Dicle University
A Comparison of the Results of Many-Facet Rasch Analyses Based on Crossed and Judge Pair Designs

580
EDUCATIONAL SCIENCES: THEORY & PRACTICE
The many-facet Rasch model (MFRM) is an extension of the item response theory, a one-parameter model. The one-parameter model, also known as the simple Rasch model, was created by George Rasch (1960). It includes two facets: ability level and item difficulty (Stahl, Bergstrom, Shumway, & Fisher, 1997). The probabilistic relationship between the two facets is formulated using the following equation:
log(Pni1 / Pni0) = Bn - Di
In this equation, Bn shows the ability level of the examinee with the number n, Di shows the difficulty level of the item with the number i, Pni1 shows the possibility of the examinee number n scoring 1 point on item number i, and Pni0 shows the possibility of the examinee number n scoring 0 points on item number i (Schumacker, 1996). This mathematical model makes it possible to estimate the ability level and item difficulty simultaneously (Brown, O’Gorman, & Du, 1996). As the equation shows, the simple Rasch model was created for dichotomous items that can be rated as either correct or incorrect (Sebok, Luu, & Klinger, 2013). Andrich (1978) extended the use of the simple Rasch model to Likert-type data, which produced the rating scale model, and Masters (1982) created the partial credit model, which was an extension of the research by Andrich (1978). The partial credit model was developed to analyze open-ended items. In this model, researchers can conduct a partial rating considering the steps followed in the solution process instead of scoring the items as either correct or incorrect (Cagnone & Ricci, 2005). However, both the rating scale model by Andrich (1978) and the partial credit model by Masters (1982) consist of two facets—ability level and item difficulty—like the simple Rasch model. Following the studies conducted by Masters (1982), Linacre (1989) furthered the partial credit model by including variability sources such as judge effect in the model (Farrokhi & Esfandiari, 2011). By adding variability sources, which could affect the assessment results, to the partial credit model, he developed a new model called the many-facet Rasch model (MFRM) (Mulqueen, Baker, & Dismukes, 2000). Table 1 presents a
Table 1Different Rasch Models*Data type Response format/scoring procedure Possible Rasch model Researcher
Dichotomous items
Multiple choice itemsTrue/false itemsShort-answer items (with correct or incorrect scoring)
Simple Rasch Model George Rasch
Polytomous items Likert ScaleSemantic Differential Scale Rating Scale Model David Andrich
Polytomous items(without or ignoring judge mediation)
Short-answer items (with partial credit scoring)Open-ended items
Partial Credit Model Geoff N. Masters
Polytomous items(taking judges into account)
Likert ScaleSemantic Differential ScaleOpen-ended items
MFRM John Michael Linacre
*Knoch and McNamara (2015).

581
İlhan / A Comparison of the Results of Many-Facet Rasch Analyses Based on Crossed and Judge Pair Designs
summary of the different types of Rasch models along with their characteristics and the researchers who created them.
The Many-Facet Rasch Model (MFRM)In general, the MFRM includes three variability sources: examinees, items, and
judges. These sources are shown in the equations below. In this equation explaining the MFRM, Bn shows the ability level of examinee n, Di shows the difficulty level of item i, Cj shows the severity or leniency of the judge j, and Fk shows the difficulty of observing category k relative to category (k-1) (note that F is not a separate facet but a part of the item facet). The expression on the left side of the equation shows the possibility for examinee n whose response to item number i was rated by judge j to obtain a point corresponding to the category k and the possibility of this examinee to obtain a score corresponding to the category (k-1) (Linacre, 1991).
log(Pnijk / Pnij(k-1)) = Bn - Di - Cj - Fk
Though the general form of the MFRM consists of three facets (examinee, item, and judge), this does not mean the number of facets in the model cannot be increased. In other words, if there are any other sources of variability (other than examinee, item and judge) that can affect the assessment results, these sources with the potential to affect the assessment results can be added to the model. For instance, the scale used for rating is also included in the model as a source of variability that can affect the assessment results if there are different rating scales used for different items of the test (Hung, Chen, & Chen, 2012). This is the equation for a model of the rating scale affecting the assessment results:
log(Pnijk / P(nij(k-1)) = Bn - Di- Cj - Fik
In this equation, Fik represents the difficulty of observing category (k-1) relative to category k for item number i. With MFRM, it is both possible to conduct analyses that differ by the number of facets and analyses that differ by the design of the study. In other words, MFRM can perform crossed design analyses where all items answered by all students are rated by all judges as well as nested, mixed, and judge pair analyses where it is not necessary for all judges to rate all items or all students (Linacre, 2014).
MFRM DesignsThe fundamental model of MFRM is the crossed design where all judges rate
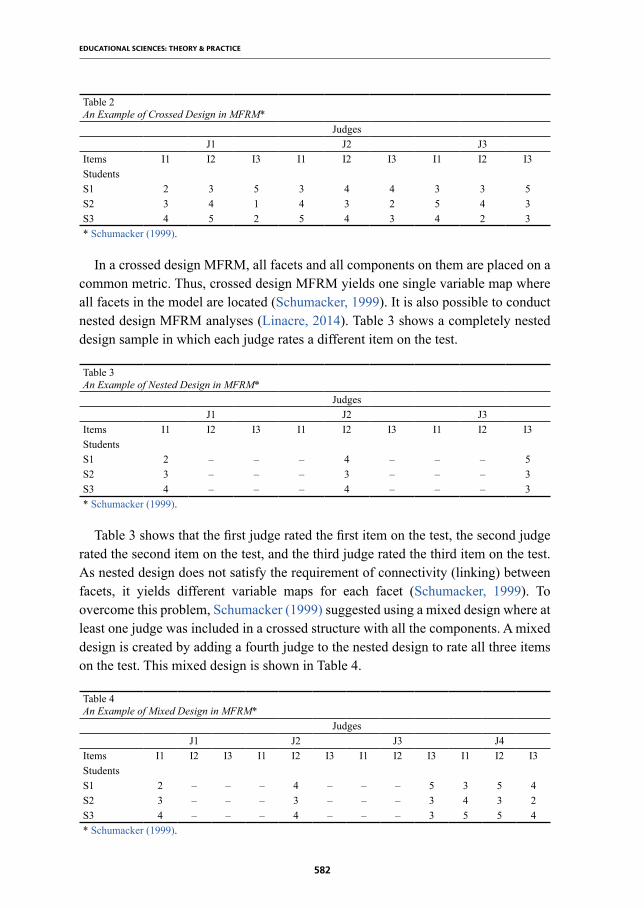
all the items answered by all students (Schumacker, 1999). Table 2 shows a sample crossed design that includes three judges (J1, J2, and J3), three students (S1, S2, and S3), and three items (I1, I2, and I3).
582
EDUCATIONAL SCIENCES: THEORY & PRACTICE
Table 2An Example of Crossed Design in MFRM*
JudgesJ1 J2 J3
Items I1 I2 I3 I1 I2 I3 I1 I2 I3StudentsS1 2 3 5 3 4 4 3 3 5S2 3 4 1 4 3 2 5 4 3S3 4 5 2 5 4 3 4 2 3* Schumacker (1999).
In a crossed design MFRM, all facets and all components on them are placed on a common metric. Thus, crossed design MFRM yields one single variable map where all facets in the model are located (Schumacker, 1999). It is also possible to conduct nested design MFRM analyses (Linacre, 2014). Table 3 shows a completely nested design sample in which each judge rates a different item on the test.
Table 3An Example of Nested Design in MFRM*
JudgesJ1 J2 J3
Items I1 I2 I3 I1 I2 I3 I1 I2 I3StudentsS1 2 – – – 4 – – – 5S2 3 – – – 3 – – – 3S3 4 – – – 4 – – – 3* Schumacker (1999).
Table 3 shows that the first judge rated the first item on the test, the second judge rated the second item on the test, and the third judge rated the third item on the test. As nested design does not satisfy the requirement of connectivity (linking) between facets, it yields different variable maps for each facet (Schumacker, 1999). To overcome this problem, Schumacker (1999) suggested using a mixed design where at least one judge was included in a crossed structure with all the components. A mixed design is created by adding a fourth judge to the nested design to rate all three items on the test. This mixed design is shown in Table 4.
Table 4An Example of Mixed Design in MFRM*
JudgesJ1 J2 J3 J4
Items I1 I2 I3 I1 I2 I3 I1 I2 I3 I1 I2 I3StudentsS1 2 – – – 4 – – – 5 3 5 4S2 3 – – – 3 – – – 3 4 3 2S3 4 – – – 4 – – – 3 5 5 4* Schumacker (1999).

583
İlhan / A Comparison of the Results of Many-Facet Rasch Analyses Based on Crossed and Judge Pair Designs
Although mixed design makes it possible to show the components of the facets on one variable map and compare them, it is not practical for implementations with a large number of participants such as national examinations, as one judge has to rate all the items answered by all students. This means there is a need for a design that will make it possible to compare all the components in the facets included in the model as well as being less expensive in terms of time, cost, and labor. Judge pair design can meet this need by having each answer to the test items be rated by two judges (Linacre, 2014). Table 5 shows a data set for three students, three items, and three judges, which is an example of the judge pair design.
Table 5An Example of Judge Pair Design in MFRM
JudgesJ1 J2 J3
Items I1 I2 I3 I1 I2 I3 I1 I2 I3StudentsS1 2 3 – 3 – 4 – 3 5S2 4 – 2 – 4 3 3 4 –S3 – 2 3 5 – 3 4 5 –
As Table 5 shows, each answer is rated by two judges in the judge pair design. In the first item of the test, for instance, the first student’s response was rated by judges 1 and 2, the second student’s response was rated by judges 1 and 3, and the third student’s response was rated by judges 2 and 3. It is not necessary in the judge pair design for the judges to rate all the answers by all the students; this makes the design less expensive to build correlations between the facets in the MFRM and to show all the components in the facets on one single variable map than crossed and mixed designs. In this respect, the judge pair design is accepted to be more practical than the other designs. However, this design’s reliability for measurement must be compared to that of the crossed design, and it should be determined if it leads to a differentiation in ability estimations before deciding to use it.
The Objective and Importance of the StudyThis study aims to compare the results of many-facet Rasch analyses based on the
crossed and judge pair designs. Thus, its objectives are as follows: i) to compare the analysis outputs of the two designs, ii) to determine the relative agreement between their ability estimations, and iii) to determine whether there is an absolute agreement between their ability estimations.
It is expected that the study findings will make a great contribution to the literature on assessment. Initially, a review of the literature about the MFRM indicated that there is only one study that compares different designs for this model. This study,

584
EDUCATIONAL SCIENCES: THEORY & PRACTICE
which was conducted by Schumacker (1999), performed a theoretical analysis of the crossed, nested, and mixed MFRM designs for a very small data set. However, there are no studies in the relevant literature that compare the crossed and judge pair designs. This study will, unlike that of Schumacker (1999), be conducted on a real data set, compare the analysis outputs of the crossed and judge pair designs, and statistically test for differences between their ability estimations. As this study is also unique in these ways, it will have an important place in the relevant literature. It is important for the improvement of science that theories with the same purpose be compared, their functioning and non-functioning aspects determined, and that theories that provide more accurate information under real conditions be proposed (Doğan, 2002). Thus, comparing different measurement theories or different designs for a single measurement theory, determining their ability to provide information, and identifying the most practical and accurate theories and designs is important for further development of the science of measurement and evaluation (Atılgan, 2004). Hence, this study will contribute to the MFRM literature in particular and support the improvement of the science of measurement and evaluation in general.
In addition to its scientific purpose, this study will also contribute to practice. The Republic of Turkey, Ministry of National Education (Milli Eğitim Bakanlığı [MEB]) and the Student Selection and Placement Center (Öğrenci Seçme ve Yerleştirme Merkezi [ÖSYM]) are planning for open-ended questions to be included in large-scale examinations in the upcoming years (MEB, 2013; ÖSYM, 2015). Two fundamental issues related to the implementation of large-scale tests consisting of open-ended questions are the rating of items and the analysis of the ratings. The statements regarding this subject reveal that the rating will be given by two judges using a rubric ignoring the identity of the candidate answering the item (ÖSYM, 2015). Conversely, there have been no statements about how the data provided by these examinations will be analyzed if the large-scale examinations with open-ended questions begin to be administered. Methods based on classical test theory (CTT) will not be sufficient to analyze such large-scale tests because they can deal only with one source of error within a given analysis. Furthermore, they cannot determine the interactions between different sources of error, provide information about the examinees at the individual level, or distinguish systematic and random measurement errors (Haiyang, 2010). Nor can they determine judge errors, including rater severity and leniency, central tendency effect, halo effect, rater bias, inconsistency, and range restriction (İlhan, 2015). Generalizability theory (GT), another measurement theory, does consider different error sources simultaneously, unlike CCT, and can determine their interactions (Lynch & McNamara, 1998). However, GT, like the CTT, can only provide group level information about the judges and examinees. This theory is also incapable of determining the judge errors just mentioned (Barkaoui, 2008). However, the MFRM considers different error sources simultaneously, is capable of determining

585
İlhan / A Comparison of the Results of Many-Facet Rasch Analyses Based on Crossed and Judge Pair Designs
their interactions, identifies judge errors effectively (halo effect, central tendency effect, rater bias, inconsistency, rater severity and leniency, and range restriction) (Barkaoui, 2008), and provides individual level information about all the variability sources (judges, examinees, and items) that influence assessment results in contrast with the CCT and GT giving group level information. Thus, the most suitable option for examinations consisting of open-ended questions is the MFRM.
In summary, studies about CTT, GT, and MFRM in the literature (Barkaoui, 2008; Güler & Gelbal, 2010; Haiyang, 2010; Smith & Kulikowich, 2004) provide guidance on which one of these models is most suitable for the analysis of large-scale examinations consisting of open-ended questions. However, there are no studies in the relevant literature that suggest which MFRM design (crossed, nested, mixed, and judge pair) will yield estimations for large-scale examinations most cost effectively. As stated above, the MFRM consists of four designs: crossed, nested, mixed, and judge pair. According to statements by the MEB (2015) and the ÖSYM (2015), each item in the examinations consisting of open-ended questions will be rated by two judges, meaning the data to be derived from them will correspond to the judge pair MFRM design. It is still necessary to clarify the extent to which the ability estimations based on the judge pair design will match those of the crossed design as the characteristic design of the MFRM is the crossed design where all judges rate the answers given by all students to all items on the test (Schumacker, 1999). Hopefully, the study findings will also make a practical contribution as a response to this question.
Methodology
Study DesignThis is basic research; its main aim is to improve science in theoretical terms and
add to theoretical knowledge. Basic research is not concerned about practice though this does not mean that its results have no practical application (Hall, 2008). Basic research makes indirect contributions to practice because most practical studies are built on findings derived from basic research (Jackson, 2008).
Study SampleThe study was conducted with 168 eighth-grade students and five judges who
rated the students’ responses to open-ended questions. Of the students, 81 (48.21%) were female and 87 (51.79%) were male. Of the judges, two were female and three were male. Four of the judges were mathematics teachers. The fifth judge was a research assistant with an undergraduate degree in primary mathematics teaching.
The study was conducted with eighth-grade students because the MEB had conducted the pilot test for the inclusion of open-ended items in national evaluation

586
EDUCATIONAL SCIENCES: THEORY & PRACTICE
and assessment studies with eighth-grade students (MEB, 2015). To select the judges for the study sample, the researcher ensured that they were easy to contact. The other criteria used for the selection of the study sample were related to the number of participants to be included in the research. The reference for the number of students in the study was suggested by Demars (2010): a sample of 100–200 participants should be sufficient for the Rasch analysis. The researcher anticipated that including too many students in the study would increase the judges’ work load motivating them to rate negatively. Thus, the sample was limited to 168 students. To decide on the number of judges, the researcher adopted a suggestion by Turgut and Baykul (2012) that it is necessary to have at least two judges and no more than five judges in the rating process to minimize judge errors in the rating of open-ended questions. Based on these criteria, it was determined that the number of participants in the study was sufficient.
Data Collection ToolsThe study data were collected using an achievement test consisting of open-ended
questions and a holistic rubric that was used to rate these questions.
Achievement test consisting of open-ended questions. This study was not concerned about determining students’ achievement for a specific course. Thus, this variable could not influence the research results. The researcher decided to develop the achievement test for mathematics considering the accessibility of the experts who would be consulted for the test items as well as that of the judges who would rate the students’ responses to them. In this respect, the researcher prepared a draft form including 12 items. To determine the suitability and understandability of the test items for eighth grade students, the researcher consulted a measurement and assessment expert, a mathematics teaching expert, and two mathematics teachers. The experts were informed that the test would not be used for determining student achievement in a specific subject, so they did not need to make an evaluation regarding content validity. They found no items on the test with understandability problems. However, they deemed that one question was unsuitable for the eighth grade level and that another violated the principle of conformity with nature; these two items were excluded. Moreover, the experts stated that the blank space given for solving the problems was not sufficient for some items and should be expanded and they were. Based on the expert opinions, the researcher conducted a pilot test with seven eighth grade students (three females and four males). It aimed to obtain the students’ opinions about the test items and the instructions given at the beginning of the test. The students said that the instructions provided sufficient information about the study’s objectives and that they had no difficulty understanding the test items or the instructions. Thus, the achievement test was determined to be ready for implementation.

587
İlhan / A Comparison of the Results of Many-Facet Rasch Analyses Based on Crossed and Judge Pair Designs
The Rubric. Rubrics can be designed for a specific purpose, or a common rubric can be used to evaluate similar performances (Moskal & Leydens, 2000). When one rubric is used to evaluate similar performances, it is called a general rubric (Kutlu, Doğan, & Karakaya, 2010). Conversely, when different rubrics are created for each task, and a rubric created for one task cannot be used for another task, they are called task-specific rubrics (Arter & McTighe, 2001). The rating strategies of rubrics are either analytic or holistic (Gronlund, 1998). Holistic rubrics award a single point based on a general impression about the product or process (Popham, 1997). Analytic rubrics score the components of the performance individually (Klein et al., 1998). General and holistic rubrics are recommended for use when there are many performances to be evaluated (Jonsson & Svingby, 2007; Riddle & Smith, 2008). As each judge would rate ten items in this study, it was determined that general and holistic rubrics were suitable for the rating. Thus, the students’ responses to the open-ended questions in the achievement test were rated using such a rubric created by Güler (2008). This rubric included a six-level rating scale, from 0 to 5. No answer or completely incorrect answers received 0 points. Answers that only provided the correct answer but no operations or explanation of how the solution was found were awarded 1 point. Answers that used the correct method to solve the problem but did not obtain the correct result due to mistakes in basic operations were awarded 2 points. Answers that began with the correct method and proceeded correctly but obtained an incorrect result due to minor operational mistakes were awarded 3 points. Answers with the correct result and correct operations but lacking sufficient explanation about how to find the result were awarded 4 points. Complete, consistent, and exemplary answers were awarded 5 points.
ProcedureThe study data were collected in October 2015. A number of stages were included
in the data collection process. In the first stage, the researcher administered a mathematics achievement test consisting of open-ended questions to the students. Before the test, they were informed about the study objective and told that the results of the achievement test would not be used for grading but only for scientific purposes. The students were reminded that it was important for them to answer the questions seriously as if they were taking a real examination. The researcher gave students one class session (40 minutes) to take the test and asked them to write out their operations clearly. Afterwards, the researcher prepared five photocopies of the students’ papers for rating. The judges were introduced to the rubric to be used for evaluation and explained the points to be considered in rating. They were informed that they should rate all responses to an item in one sitting and should score one item at a time (Hogan & Murphy, 2007). Then the test papers were given to the judges. The judges completed the rating in 3–11 days. Each paper was rated by five judges. This generated a crossed design where every answer from every student was rated by five judges.
588
EDUCATIONAL SCIENCES: THEORY & PRACTICE
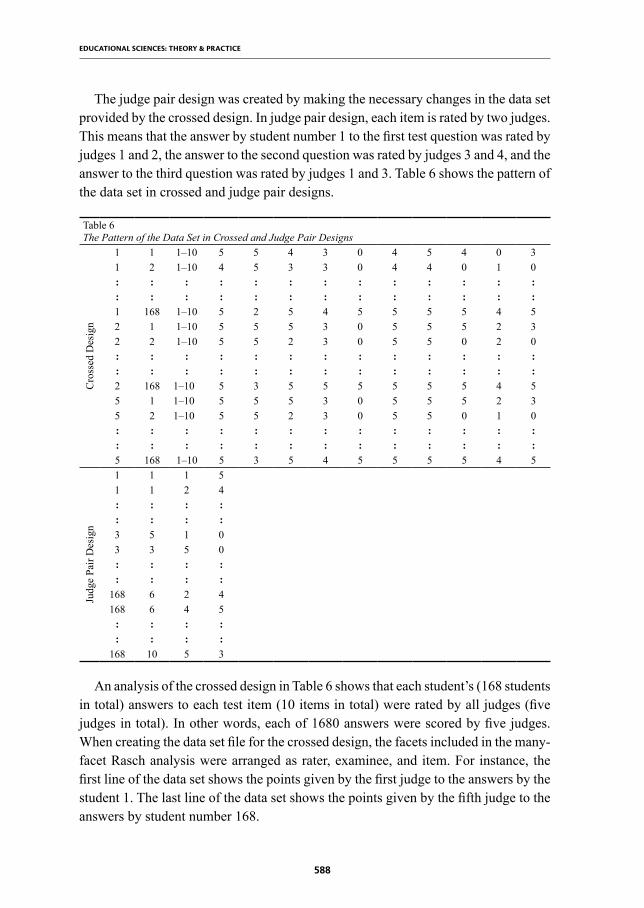
The judge pair design was created by making the necessary changes in the data set provided by the crossed design. In judge pair design, each item is rated by two judges. This means that the answer by student number 1 to the first test question was rated by judges 1 and 2, the answer to the second question was rated by judges 3 and 4, and the answer to the third question was rated by judges 1 and 3. Table 6 shows the pattern of the data set in crossed and judge pair designs.
Table 6The Pattern of the Data Set in Crossed and Judge Pair Designs
Cro
ssed
Des
ign
1 1 1–10 5 5 4 3 0 4 5 4 0 31 2 1–10 4 5 3 3 0 4 4 0 1 0: : : : : : : : : : : : :: : : : : : : : : : : : :1 168 1–10 5 2 5 4 5 5 5 5 4 52 1 1–10 5 5 5 3 0 5 5 5 2 32 2 1–10 5 5 2 3 0 5 5 0 2 0: : : : : : : : : : : : :: : : : : : : : : : : : :2 168 1–10 5 3 5 5 5 5 5 5 4 55 1 1–10 5 5 5 3 0 5 5 5 2 35 2 1–10 5 5 2 3 0 5 5 0 1 0: : : : : : : : : : : : :: : : : : : : : : : : : :5 168 1–10 5 3 5 4 5 5 5 5 4 5
Judg
e Pa
ir D
esig
n
1 1 1 51 1 2 4: : : :: : : :3 5 1 03 3 5 0: : : :: : : :
168 6 2 4168 6 4 5
: : : :: : : :
168 10 5 3
An analysis of the crossed design in Table 6 shows that each student’s (168 students in total) answers to each test item (10 items in total) were rated by all judges (five judges in total). In other words, each of 1680 answers were scored by five judges. When creating the data set file for the crossed design, the facets included in the many-facet Rasch analysis were arranged as rater, examinee, and item. For instance, the first line of the data set shows the points given by the first judge to the answers by the student 1. The last line of the data set shows the points given by the fifth judge to the answers by student number 168.

589
İlhan / A Comparison of the Results of Many-Facet Rasch Analyses Based on Crossed and Judge Pair Designs
In the judge pair design, an answer to an item was rated by any two of the five judges. Thus, each of the 1680 answers were rated by two judges. In this design, the facets included in the many-facet Rasch analyses were arranged as examinee, item, and judge. For instance, the first line of the data set shows that judge 1 gave 5 points to the answer by student 1 to item 1. The last line of the data set indicates that judge 5 gave 3 points to the answer by student 168 to item 10.
After the data were assembled and the data files were arranged according to crossed and judge pair designs, the researcher tested the assumptions of the many-facet Rasch analysis. The assumptions that had to be tested before conducting the many-facet Rasch analysis include unidimensionality, local independence, and the fit between the model and the data. Initially, the unidimensionality assumption was tested. The researcher conducted a confirmatory factor analysis (CFA) for the average points given by the five judges. According to the CFA, the unidimensional model was confirmed by the data (χ2/sd = 1.46, RMSEA = .052, SRMR = .046, NFI = .96, NNFI = .98, CFI = .99, RFI = .95, IFI = .99, GFI = .94, and AGFI = .91), and the factor loads of the items ranged between .38 and .85. Accordingly, the unidimensionality assumption was justified. Figure 1 presents the measurement model created by the CFA.
Local independence was the second assumption that needed to be justified for the many-facet Rasch analysis. Local independence means that the responses to one item will be independent of the responses to another item when the abilities influencing the test variable are held constant (Demars, 2010). Local independence is a result of the unidimensionality of the implicit trait that is being analyzed. For this reason, it is accepted that the local independence assumption is justified along with the unidimensionality assumption (Hambleton, Swaminathan, & Rogers, 1991). Thus, the local independence assumption was justified in this study.
Another assumption that required justification to conduct the many-facet Rasch analysis is the fit between the model and the data. The fit between the model and the
Figure 1. Measurement model for mathematics achievement test.
590
EDUCATIONAL SCIENCES: THEORY & PRACTICE
data is determined by analyzing the standardized residuals reported by the outputs of the many-facet Rasch analysis. For the fit between the model and the data to be sufficient, the standardized residuals out of the ±2 interval should not be more than approximately 5% of the total number of data, and the number of the standardized residuals out of the ±3 interval should not be more than approximately 1% of the total number of data (Linacre, 2014). In the many-facet Rasch analysis based on the crossed design, five judges rated the answers of 168 students to ten items, and the total number of data was calculated as 8400 (168 × 10 × 5). In this design, the number of the standardized residuals out of the ±2 and ±3 intervals was calculated as 432 (5.14%) and 144 (1.71%), respectively. In the many-facet Rasch analysis based on the judge pair design, the total number of data was 3360 (168 × 10 × 2) as 168 students’ answers to each of the ten items were rated by two judges. In the judge pair design, the number of the standardized residuals out of ±2 and ±3 intervals were 178 (5.30%) and 53 (1.57%), respectively. The standardized residuals calculated in the study were out of the criterion limits both in crossed and judge pair designs. However, McNamara (1996) reported that the MFRM should still be used for analysis even though the fit between the model and the data is not strong. According to McNamara (1996), there are three models (one-, two-, and three-parameter models) in the basic item response theory, and the analyses are conducted with the model that has the best fit with the data. In many-facet Rasch analysis, though, there is no alternative model when the fit between the model and the data is not strong. For this reason, McNamara (1996) said it not incorrect to use the MFRM as long as the fit between the data and the model is not extremely different from the criterion to be met. These statements by McNamara (1996) imply that the standardized residuals reported as a result of the analysis for both crossed and judge pair designs had a size that was suitable for the use of the MFRM. Linacre (2014) recommended these criteria to be considered as approximate values rather than strict limitations when evaluating the fit between the model and the data, which also supports the notion that the fit between the model and the data is acceptable. Based on this determination, the third assumption related to the MFRM was also justified.
After it was determined that the required assumptions were justified, the researcher conducted the many-facet Rasch analysis according to the crossed and judge pair designs and compared the analysis outputs of the two designs. The study used the Pearson product-moment correlation coefficient to test the relative agreement between the ability estimations based on crossed and judge pair designs. The study also conducted the paired sample t-test to determine whether there was an absolute agreement between the ability estimations for the two designs. In the study, the many-facet Rasch analysis was conducted using FACETS software. The unidimensionality assumption was tested by CFA with LISREL software. The relative and absolute agreements between the ability estimations of the two designs were examined using SPSS software.

591
İlhan / A Comparison of the Results of Many-Facet Rasch Analyses Based on Crossed and Judge Pair Designs
FindingsThis section will present the findings reached in this study. Figure 2 shows the
variable map created for the crossed design, and Figure 3 shows the variable map created for the judge pair design.
In the second column of Figure 2, the examinees were ranked by ability level. The ability level increases from the negative edge of the column to its positive edge. Thus, student 79 had the highest ability level, while student 20 had the lowest ability level. The students were distributed at different points of the ability scale, which shows that the participants with different levels of ability were successfully distinguished. In the third column of Figure 2, the items were ranked by their difficulty levels. The item difficulty increases from the bottom to the top of this column. Accordingly, the most difficult question was item 5, and the easiest question was item 2. The items are not clustered on a single point of the logit scale, which shows that the questions on the test had a range of difficulty levels. The judges are shown in the third column of
Figure 2. The variable map created by the many-facet Rasch analysis based on crossed design.

592
EDUCATIONAL SCIENCES: THEORY & PRACTICE
Figure 2. The judge severity increased from the bottom to the top of the judge column. Therefore, it was determined that the most severe rating was done by judge 1. Judges 2, 3, and 4 were similar regarding their severity and leniency in rating. These three judges were more lenient than judges 1 and 5. After the variable map for the crossed design, the researcher examined the variable map for the judge pair design (Figure 3).
Figure 3 shows that the ranking of the examinees by their ability levels and the ranking of the items by their difficulty levels were highly similar to the ranking in the crossed design yet not completely overlapping. However, there was complete consistency between the two designs regarding the ranking of judges by their severity and leniency. These results imply that the relative agreement was high between the analysis outputs for the crossed and judge pair designs.
After examining the variable maps for the crossed and judge pair designs, the researcher evaluated the measurement reports for each facet. Table 7 shows the measurement reports for the rater facet. The measurements of the judges’ severity and leniency ranged between .22 logit and −.10 logit in the crossed design, while they ranged between .22 and −.11 logit in the judge pair design. Moreover, the means
Figure 3. The variable map created by the many-facet Rasch analysis based on judge pair design.

593
İlhan / A Comparison of the Results of Many-Facet Rasch Analyses Based on Crossed and Judge Pair Designs
of the logit measures for the judges (.00 logit) were the same in both designs. This shows that the logit measures reported for the raters in crossed and judge pair designs were consistent with each other. An analysis of the fit statistics for the crossed design indicated that the infit mean square was ranked between .94 and 1.07, and the outfit mean square was ranked between .95 and 1.26. Considering that the values between .6 and 1.4 are acceptable for the fit statistics (Wright & Linacre, 1994), it was found that no raters affected the fit between the model and the data negatively in crossed design. Similarly, the infit and outfit mean square were in the acceptable range (.6–1.4) in the judge pair design. This means that there were also no raters who diminished the fit between the model and the data in the judge pair design.
Table 7The Measurement Reports for the Rater Facet in the Many-Facet Rasch Analysis based on Crossed and Judge Pair Designs
Crossed Design Judge Pair DesignLogit Infit MnSq Outfit MnSq Logit Infit MnSq Outfit MnSq
J1 .22 .94 1.26 .22 1.00 1.39J2 −.01 .96 .96 .01 .86 .78J3 −.05 .99 .98 −.05 1.10 .99J4 −.06 1.07 .95 −.06 1.09 .93J5 −.10 .97 .96 −.11 .86 .93Mean .00 .99 1.02 .00 .98 1.00Standard deviation .13 .05 .13 .13 .12 .23Separation ratio 7.04 4.52Reliability .98 .95
Chi-square (X2df = 4) 216.4 87.4
Table 7 shows the separation ratio, reliability, and chi-square values calculated in the Rasch analysis. The separation ratio was 7.04, and the reliability index was .98 for the judge facet in the crossed design. The separation ratio and reliability index calculated for the rater facet shows the reliably difference between the judges rather than the reliably similarity (Haiyang, 2010). Thus, the separation ratio and reliability index calculated for the rater facet being high shows that the judges differed in their severity and leniency. This is also the same for the judge pair design. The separation ratio and reliability index values in the judge pair design were lower than the coefficients calculated in the crossed design. However, they were not small enough to say that the judges rated with similar severity and leniency. In other words, the researcher calculated high values in the judge pair design as well as in the crossed design, indicating a difference between judges regarding separation ratio and reliability index. The chi-square test results, which indicate the significance of the difference between judges’ severity and leniency, were statistically significant in both designs [crossed design: X(4)
2 = 216.4 and judge pair design: X(4)2 = 87.4; p < .01].

594
EDUCATIONAL SCIENCES: THEORY & PRACTICE
The researcher examined the measurement reports for the item facet after the rater facet and presented the findings in Table 8. According to Table 8, the difficulty level of the items ranged between −.06 logit and −1.07 logit in the crossed design and between .00 logit and −1.07 logit in the judge pair design. Although there were differences between the difficulty levels reported in the crossed and judge pair designs for some of the test items, the values calculated in both designs for the mean item difficulty level are almost equal. For this reason, it was determined that the item difficulty levels calculated in the two designs were consistent with each other. The fit statistics reported for crossed and judge pair designs were consistent with each other as in the item difficulty levels. The infit mean square was in the acceptable range (.6–1.4) (Wright & Linacre, 1994) in both crossed and judge pair designs. An analysis of the outfit mean square showed that item 1 in the crossed design and items 1 and 2 in the nested design were above the 1.4 limit. As the outfit mean square is more sensitive towards the extreme values, it is well known that the decisions based on the infit mean square are more accurate than those made considering the outfit mean square (Bond & Fox, 2001). Thus, none of the items in the data set included a difference between observed and expected values large enough to diminish the fit between the model and the data.
Table 8The Measurement Reports for the Item Facet in the Many-Facet Rasch Analysis based on Crossed and Judge Pair Designs
Crossed Design Judge Pair DesignLogit Infit MnSq Outfit MnSq Logit Infit MnSq Outfit MnSq
I5 −.06 .97 .97 .00 .96 .96I9 −.20 .71 .61 −.25 .67 .58I6 −.34 1.09 1.10 −.39 1.08 .98I10 −.47 .97 1.03 −.47 .98 .96I4 −.53 .86 .80 −.53 .80 .77I8 −.56 .93 .87 −.53 .92 .80I1 −.66 1.25 1.55 −.64 1.16 1.56I3 −.70 1.12 1.07 −.65 1.20 1.17I7 −.86 .98 .84 −.89 1.10 .77I2 −1.07 1.07 1.40 −1.07 1.09 1.50Mean −.55 1.00 1.02 −.54 1.00 1.00Standard deviation .30 .15 .28 .30 .17 .32Separation ratio 11.68 7.52Reliability .99 .98
Chi-square (X2df = 9) 1146.8 477.4
Table 8 shows that the separation ratio for the item facet was 11.68 in the crossed design and 7.52 in the judge pair design. The item reliability calculated for crossed and judge pair designs were .99 and .98, respectively. The separation ratio and reliability values were high, which indicates that the items with different difficulty levels in both crossed and judge pair designs were reliably distinguishable. The separation ratio values,

595
İlhan / A Comparison of the Results of Many-Facet Rasch Analyses Based on Crossed and Judge Pair Designs
similarly, show that the difference between the difficulty levels of the items can be more effectively determined by the crossed design than the judge pair design. The chi-square results are another finding that shows that the difference between the difficulty levels of the items can be determined more successfully by the crossed design. As Table 8 shows, the chi-square value of the crossed design is higher than that of the judge pair design [in the crossed design: X(9)
2 = 1146.8 and in the judge pair design: X(9)2 = 477.4; p < .01].
After the measurement of the judge and item facets, the researcher examined the measurement reports for the examinee facet. These findings are shown in Table 9. As there were 168 components included in the examinee facet, it was not possible to show the measurement of this facet for every examinee, and Table 9 is limited to the mean measures for this facet. Table 9 also includes the separation ratio and reliability index, as well as the chi-square results showing whether there was any difference between the examinees’ ability levels.
Table 9The Measurement Reports for the Examinee Facet in the Many-Facet Rasch Analysis based on Crossed and Judge Pair Designs
Crossed Design Judge Pair DesignLogit Infit MnSq Outfit MnSq Logit Infit MnSq Outfit MnSq
Mean .00 .95 1.02 .00 .94 1.00Standard deviation .65 .35 .57 .64 .36 .55Separation ratio 3.64 2.09Reliability .93 .81
Chi-square (X 2df = 167) 2814.8 1077.4
Table 9 shows that the means of the examinees’ ability levels were the same (.00 logit) in both designs. The infit and outfit mean squares in Table 9 are in the acceptable interval for these statistics (.6–1.4) (Wright & Linacre, 1994). Thus, it was determined that the fit between the model and the data was provided in both crossed and judge pair designs. Although the separation ratio and reliability index for the examinee facet are lower in the judge pair design compared to the crossed design, they are sufficient to say that the students with different ability levels can be distinguished from each other by high reliability. The results in Table 9 show that the chi-square test results were higher in the crossed design than in the judge pair design [for the crossed design: X(167)
2 = 2814.8 and for the judge pair design: X(167)2 = 1077.4; p
< .01]. The separation ratio, reliability index and chi-square values were higher in the crossed design than in the judge pair design, which indicates that the examinees were distinguished from each other with higher reliability in the crossed design.
After conducting the many-facet Rasch analysis based on the crossed and judge pair designs, the researcher examined the relative and absolute agreements between the ability estimations provided by these two analyses. The relative agreement between the

596
EDUCATIONAL SCIENCES: THEORY & PRACTICE
ability estimations based on the two designs was tested using correlation analysis, while the absolute agreement between them was tested using paired sample t-test. Table 10 presents the results of correlation analysis and paired sample t-test tests together.
Table 10The Results of the Correlation Analysis and Paired Sample t-test Conducted to Determine the Agreement between the Ability Estimations Provided by Crossed and Judge Pair DesignsDesign Mean (Logit) Standard deviation (Logit) N r t
Crossed .000298 .65168 .981** .066
Judge pair −.000357 .64**p < .001
An analysis of Table 10 reveals that there is a high relative agreement between the ability estimations based on crossed and judge pair designs [r = .98, p < .001]. Table 10 also shows that there was no significant difference between the means of their ability estimations [t(167 ) = .066, p > .05]. This result of the paired sample t-test demonstrated that there was an absolute agreement between the ability estimations based on crossed and judge pair designs.
Discussion and ConclusionScientific studies have both theoretical and empirical aspects. Science is
developed by proving theories experimentally (Doğan, 2003). This is also true for the science of measurement and evaluation. As a branch of science, the development of measurement depends on proving the theories in this field in empirical studies. This study was based on this notion and compared many-facet Rasch analyses based on crossed and judge pair designs.
According to the study findings, the measurement reported by the crossed and judge pair designs regarding judge severity and leniency were consistent with each other. Both designs determined that there was a significant difference between the judges regarding severity and leniency. However, the difference between the judges was more reliable in crossed design than in the judge pair design. In the crossed design, it was possible to compare all judges with each other directly, while the judges were ranked by their severity and leniency based on dual comparisons in the judge pair design. For instance, the measurements for four judges (A, B, C, and D) are directly compared to each other in the crossed design. In the judge pair design, the four judges were compared to each other based on the ranking by the severity and leniency between judges A-B, A-C, A-D, B-C, B-D, and C-D. This makes determining the differences between the judges more highly reliable in crossed design than in judge pair design. However, there was no difference between the judge reliability in the crossed design and in the judge pair design large enough to differentiate the interpretation of the study results, as the judge pair design included all the double combinations of the judges.

597
İlhan / A Comparison of the Results of Many-Facet Rasch Analyses Based on Crossed and Judge Pair Designs
The study found that the item difficulty levels calculated based on crossed and judge pair designs were mainly consistent with each other. It was also found that there was a significant difference between items in both designs regarding difficulty levels. This result reflects that the test items could be rated individually in both crossed and judge pair designs, and that the halo effect was not included in the rating. A comparison of the separation ratio and chi-square values in the two designs showed that the coefficients of the crossed design were higher than those of the judge pair design. Considering that the items were significantly distinguishable from each other in both designs despite this difference, the judge pair design seems to be more suitable for reducing the expenses of large-scale examinations.
An evaluation of the measurement reports for the examinee facet indicated that the reliability was high in both the crossed and judge pair designs. Although there are significant differences between judges’ severity and leniency in both designs, the reliability in the examinee facet is high. This is because the MFRM is not limited to the determination of the differences between judges and includes statistical arrangements to keep these differences under control (Abu Kassim, 2007). The examinee facet’s separation ratio, reliability, and chi-square values were higher in the crossed design than in the judge pair design. This means that crossed design distinguishes the examinees with different ability levels from each other more effectively than the judge pair design. However, this difference between the two designs is not large enough to upstage the cost-effectiveness of the judge pair design as the study found that the relative agreement between the ability estimations calculated in the crossed and judge pair designs was very high, and there was no significant difference between the ability estimations reported by the two designs. This justifies this study’s claims that there will be no differentiation in the ranking of students or the decisions to be made if the data set is arranged based on crossed or judge pair designs in examinations consisting of open-ended questions.
In the end, the difference between the components of the facets included in the analysis was demonstrated more effectively by the crossed design than the judge pair design. However, the components of the facets were significantly distinguished from each other in the judge pair, which was implemented more cheaply than the crossed design. This suggests that crossed design may be more suitable for classroom activities and the exams with a small number of participants, but judge pair design will be a better option for large-scale examinations. For this reason, this study recommends using judge pair design to analyze the data derived from the examinations when the large-scale test administrations consisting of open-ended questions begin to be done by the ÖSYM and MEB.

598
EDUCATIONAL SCIENCES: THEORY & PRACTICE
Future DirectionsThis study compared the outputs of many-facet Rasch analyses based on crossed
and judge pair designs, and it makes important theoretical contributions to the literature on measurement and evaluation. The study findings will be a scientific resource about which MFRM design is a better choice for classroom evaluation and large-scale test administrations. The theoretical and practical contributions of this study to measurement and evaluation have some limitations, and further studies should be conducted to eliminate them.
First of all, the comparisons of the crossed and judge pair designs in this study were made using a MFRM with three facets: judge, examinee, and item. In this context, it is suggested that further studies are conducted to compare the crossed and judge pair designs with additional variability sources that can affect the measurement results. Second, researchers should conduct studies including other MFRM designs (nested and mixed) as this study is limited to the comparison of the crossed and judge pair designs. Another limitation of the study is that only 168 students and five judges were included in the sample. Analyses based on item response theory produce more accurate estimations with larger samples (DeMars, 2010). Thus, a similar study should be conducted with a larger sample. To conclude, the rubric used in this study has a general and holistic structure. An important factor in the ratings performed by judges is whether the rubric is general or task-specific, analytic or holistic (Nitko, 2004). Accordingly, the rubric used in this study may have affected the Rasch analysis results. Thus, task-specific rubrics, which have an analytic structure, should be used in further studies of this subject.
ReferencesAbu Kassim, N. L. (2007, June). Exploring rater judging behavior using the many-facet Rasch
model. Paper Presented in the Second Biennial International Conference on Teaching and Learning of English in Asia: Exploring New Frontiers (TELiA2), Holiday Villa Beach & Spa Resort, Langkawi. Faculty of Communication and Modern Languages, University Utara Malaysia. Retrieved from http://repo.uum.edu.my/3212/1/Noor1.pdf
Andrich, D. (1978). A rating formulation for ordered response categories. Psychometrika, 43(9), 561–573. http://dx.doi.org/10.1007/BF02293814
Arter, J., & McTighe, J. (2001). Scoring rubrics in the classroom: Using performance criteria for assessing and improving student performance. Thousand Oaks, CA: Corwin Press, Inc.
Atılgan, H. (2004). Genellenebilirlik kuramı ve çok değişkenlik kaynaklı Rasch modelinin karşılaştırılmasına ilişkin bir araştırma [A research on the comparison of the generalizability theory and the many facet Rasch model]. (Doctoral dissertation, Hacettepe University, Ankara, Turkey). Retrieved from https://tez.yok.gov.tr/UlusalTezMerkezi/
Barkaoui, K. (2008). Effects of scoring method and rater experience on ESL essay rating processes and outcomes. (Doctoral Dissertation). Available from ProOuest Dissertations and Theses database. (UMI No: 304360302).

599
İlhan / A Comparison of the Results of Many-Facet Rasch Analyses Based on Crossed and Judge Pair Designs
Bond, T. G., & Fox, C. M. (2001). Applying the Rasch model: Fundamental measurement in the human sciences. London: Lawrence Erlbaum Associates.
Brown, W. L., O’Gorman, K., & Du, Y. (1996, April). The reliability and validity of mathematics performance assessment. Paper presented at the Annual Meeting of the American Educational Research Association, New York. Retrieved from http://files.eric.ed.gov/fulltext/ED400292.pdf
Cagnone, S., & Ricci, R. (2005). Student ability assessment based on two IRT models. Metodoloˇski Zvezki, 2(2), 209–218.
DeMars, C. (2010). Item response theory. Oxford, UK: Oxford University Press.
Doğan, N. (2002). Klasik test teorisi ve örtük özellikler kuramının örneklemeler bağlamında karşılaştırılması [Comparison of classical test theory and latent traits theory by samples]. (Doctoral dissertation, Hacettepe University, Ankara, Turkey). Retrieved from https://tez.yok.gov.tr/UlusalTezMerkezi/
Doğan, N. (2003). Klasik test teorisi ve örtük özellikler kuramının örneklemeler bağlamında karşılaştırılması [Comparison of classical test theory and latent traits theory by samples]. Hacettepe University Journal of Education, 25, 58–67.
Farrokhi, F., & Esfandiari, R. (2011). A many-facet Rasch model to detect halo effect in three types of raters. Theory and Practice in Language Studies, 1(11), 1531–1540. http://dx.doi.org/10.4304/tpls.1.11.1531-1540
Gronlund, N. E. (1998). Assessment of student achievement. Boston, MA: Allyn and Bacon.
Güler, N. (2008). Klasik test kuramı, genellenebilirlik kuramı ve Rasch modeli üzerine bir araştırma [A research on classical test theory, generalizability theory and Rasch model]. (Doctoral dissertation, Hacettepe University, Ankara, Turkey). Retrieved from https://tez.yok.gov.tr/UlusalTezMerkezi/
Güler, N., & Gelbal, S. (2010). A study based on classic test theory and many facet Rasch model. Eurasian Journal of Educational Research, 38, 108–125.
Haiyang, S. (2010). An application of classical test theory and many facet Rasch measurement in analyzing the reliability of an English test for non-English major graduates. Chinese Journal of Applied Linguistics, 33(2), 87–102.
Hall, R. (2008). Applied social research: Planning, designing and conducting real-world research. South Yarra, Australia: Palgrave Macmillan.
Hambleton, R. K., Swaminathan, H., & Rogers, H. J. (1991). Fundamentals of item response theory. Newbury Park, CA: Sage.
Hogan, T. P., & Murphy, G. (2007). Recommendations for preparing and scoring constructed-response items: What the experts say. Applied Measurement in Education, 20(4), 427–441. http://dx.doi.org/10.1080/08957340701580736
Hung, S. P., Chen, P. H., & Chen, H. C. (2012). Improving creativity performance assessment: A rater effect examination with many facet Rasch model. Creativity Research Journal, 24(4), 345–357. http://dx.doi.org/10.1080/10400419.2012.730331
İlhan, M. (2015). Standart ve SOLO taksonomisine dayalı rubrikler ile puanlanan açık uçlu matematik sorularında puanlayıcı etkilerinin çok yüzeyli Rasch modeli ile incelenmesi [The identification of rater effects on open-ended math questions rated through standard rubrics and rubrics based on the SOLO taxonomy in reference to the many facet Rasch model]. (Doctoral dissertation, Gaziantep University, Gaziantep, Turkey). Retrieved from https://tez.yok.gov.tr/UlusalTezMerkezi/

600
EDUCATIONAL SCIENCES: THEORY & PRACTICE
Jackson, S. (2008). Research methods: A modular approach. Belmont, CA: Thompson Wadsworth.
Jonsson, A., & Svingby, G. (2007). The use of scoring rubrics: Reliability, validity and educational consequences. Educational Research Review, 2(2), 130–144. http://dx.doi.org/10.1016/j.edurev.2007.05.002
Klein, S. P., Stecher, B. M., Shavelson, R. J., McCaffrey, D., Ormseth, T., Bell, R. M., … & Othman, A. R. (1998). Analytic versus holistic scoring of science performance tasks. Applied Measurement in Education, 11(2), 121–137. http://dx.doi.org/10.1207/s15324818ame1102_1
Knoch, U., &, McNamara, T. (2015). Rasch analysis. In L. Plonsky, (Ed.), Advancing quantitative methods in second language research (pp. 275–304). New York, NY: Routledge.
Kutlu, Ö., Doğan, C. H., & Karakaya, İ. (2010). Öğrenci başarısının belirlenmesi performansa ve portfolyoya dayalı durum belirleme [Determination of student achievement based on the portfolio and performance assessment]. Ankara, Turkey: Pegem Academy Publishing.
Linacre, J. M. (1991, April). Constructing measurement with a many-facet Rasch model. Paper presented at the annual meeting of the American Educational Research Association, Chicago, IL. Retrieved from http://eric.ed.gov/?id=ED333047
Linacre, J. M. (2014). A user’s guide to FACETS Rasch-model computer programs. Retrieved from http://www.winsteps.com/a/facets-manual.pdf
Lynch, B. K., & McNamara, T. F. (1998). Using G-theory and many-facet Rasch measurement in the development of performance assessments of the ESL speaking skills of immigrants. Language Testing, 15(2), 158–180. http://dx.doi.org/10.1177/026553229801500202
Masters, G. N. (1982). A Rasch model for partial credit scoring. Psychometrika, 47(2), 149–174. http://dx.doi.org/10.1007/BF02296272
McNamara, T. F. (1996). Measuring second language performance. London and New York: Longman.
Milli Eğitim Bakanlığı. (2013). Temel eğitimden ortaöğretime geçişle ilgili sıkça sorulan sorular [Frequently asked questions about the transition from primary education to secondary education]. Retrieved from http://www.meb.gov.tr/duyurular/duyurular2013/bigb/tegitimdenoogretimegecis/MEB_SSS_20_09_2013.pdf
Milli Eğitim Bakanlığı. (2015). Akademik becerilerin izlenmesi ve değerlendirilmesi (ABİDE) projesi [The project of monitoring and evaluation of academic skills]. Retrieved from http://abide.meb.gov.tr/proje-hakkinda.asp
Moskal, B. M., & Leydens, J. A. (2000). Scoring rubric development: Validity and reliability. Practical Assessment, Research & Evaluation, 7(10). Retrieved from http://pareonline.net/getvn.asp?v=7&n=10
Mulqueen, C., Baker D., & Dismukes, R. K. (2000, April). Using multifacet Rasch analysis to examine the effectiveness of rater training. Presented at the 15th Annual Conference for the Society for Industrial and Organizational Psychology (SIOP), New Orleans. Retrieved from http://www.air.org/files/multifacet_Rasch.pdf
Nitko, A. J. (2004). Educational assessment of students. Upper Saddle River, NJ: Pearson.
Öğrenci Seçme ve Yerleştirme Merkezi. (2015). Yazılı sınav (Açık uçlu sorularla sınav) [Written examination (Exam with open-ended questions)]. Retrieved from http://www.osym.gov.tr/belge/1-23308/yazili-sinav-acik-uclu-sorularla-sinav-04022015
Popham, W. J. (1997). What’s wrong-and what’s right-with rubrics. Educational Leadership, 55(2), 72–75.

601
İlhan / A Comparison of the Results of Many-Facet Rasch Analyses Based on Crossed and Judge Pair Designs
Rasch, G. (1960). Probabilistic models for some intelligence and attainment tests. Copenhagen, Denmark: Danish Institute for Educational Research.
Riddle, E. J., & Smith, M. (2008). Developing and using rubrics in quantitative business courses. The Coastal Business Journal, 7(1), 82–95.
Schumacker, R. E. (1996, April). Many-facet Rasch model selection criteria: Examining residuals and more. Paper presented at the Annual Conference of the American Educational Research Association, New York. Retrieved from http://files.eric.ed.gov/fulltext/ED397117.pdf
Schumacker, R. E. (1999). Many-facet Rasch analysis with crossed, nested, and mixed designs. Journal of Outcome Measurement, 3(4), 323–338.
Sebok, S. S., Luu, K., & Klinger, D. A. (2013). Psychometric properties of the multiple mini-interview used for medical admissions: Findings from generalizability and Rasch analyses. Advances in Health Sciences Education, Theory and Practice, 19(1), 71–84. http://dx.doi.org/10.1007/s10459-013-9463-7
Smith, E. V., & Kulikowich, J. M. (2004). An application of generalizability theory and many-facet Rasch measurement using a complex problem-solving skills assessment. Educational and Psychological Measurement, 64(4), 617–639. http://dx.doi.org/10.1177/0013164404263876
Stahl, J., Bergstrom, B., Shumway, R., & Fisher, A. (1996, April). On-line performance assessment using rating scales. Paper presented at the Annual Meeting of the American Educational Research Association, New York. Retrieved from http://files.eric.ed.gov/fulltext/ED400288.pdf
Turgut, M. F., & Baykul, Y. (2012). Eğitimde ölçme ve değerlendirme [Measurement and evaluation in education]. Ankara, Turkey: Pegem Academy Publishing.
Wright, B. D., & Linacre, J. M. (1994). Reasonable mean-square fit values. Rasch Measurement Transactions, 8, 370–371.