a comparison of web-based and conventional-based training
TRANSCRIPT

University of Northern Iowa University of Northern Iowa
UNI ScholarWorks UNI ScholarWorks
Dissertations and Theses @ UNI Student Work
2000
A comparison of Web-based and conventional-based training A comparison of Web-based and conventional-based training
methods in a leading Midwestern company methods in a leading Midwestern company
Hani Aljadaani University of Northern Iowa
Let us know how access to this document benefits you
Copyright ©2000 Hani Aljadaani
Follow this and additional works at: https://scholarworks.uni.edu/etd
Part of the Training and Development Commons
Recommended Citation Recommended Citation Aljadaani, Hani, "A comparison of Web-based and conventional-based training methods in a leading Midwestern company" (2000). Dissertations and Theses @ UNI. 742. https://scholarworks.uni.edu/etd/742
This Open Access Dissertation is brought to you for free and open access by the Student Work at UNI ScholarWorks. It has been accepted for inclusion in Dissertations and Theses @ UNI by an authorized administrator of UNI ScholarWorks. For more information, please contact [email protected].

INFORMATION TO USERS
This manuscript has been reproduced from the microfilm master. UMI films
the text directly from the original or copy submitted. Thus, some thesis and
dissertation copies are in typewriter face, while others may be from any type of
computer printer.
The quality of this reproduction is dependent upon the quality of the
copy submitted. Broken or indistinct print, colored or poor quality illustrations
and photographs, print bleedthrough, substandard margins, and improper
alignment can adversely affect reproduction.
In the unlikely event that the author did not send UMI a complete manuscript
and there are missing pages, these will be noted. Also, if unauthorized
copyright material had to be removed, a note will indicate the deletion.
Oversize materials (e.g., maps, drawings, charts) are reproduced by
sectioning the original, beginning at the upper left-hand comer and continuing
from left to right in equal sections with small overlaps.
Photographs included in the original manuscript have been reproduced
xerographically in this copy. Higher quality 6" x 9” black and white
photographic prints are available for any photographs or illustrations appearing
in this copy for an additional charge. Contact UMI directly to order.
Bell & Howell Information and Learning 300 North Zeeb Road, Ann Arbor, MI 48106-1346 USA
800-521-0600
Reproduced with permission of the copyright owner. Further reproduction prohibited without permission.

Reproduced with permission of the copyright owner. Further reproduction prohibited without permission.

A COMPARISON OF WEB-BASED AND CONVENTIONAL-BASED
TRAINING METHODS IN A LEADING M IDW ESTERN COMPANY
A Dissertation
Submitted
in Partial Fulfi l lment
of the Requirements for the Degree
Doctor of Industrial Technology
Approved:
CDr. M oha m m e d Fahmy, Committee Chair
D7. Charles Johnson/ Committee C o-C ha ir
Dr. Sharon Smaldino, Committee Mem ber
Dr. Sue Jdslyn, Committee Member
5L J lDr. Ali Kashef, Corp'friittee Member
Hani Aljadaani
University of Northern Iowa
D ec e m b e r 2000
Reproduced with permission of the copyright owner. Further reproduction prohibited without permission.

UMI Number: 9992041
UMIUMI Microform 9992041
Copyright 2001 by Bell & Howell Information and Learning Company. All rights reserved. This microform edition is protected against
unauthorized copying under Title 17, United States Code.
Bell & Howell Information and Learning Company 300 North Zeeb Road
P.O. Box 1346 Ann Arbor, Ml 48106-1346
Reproduced with permission of the copyright owner. Further reproduction prohibited without permission.

Copyright by
Hani Aljadaani
D ec e m b e r 2000
All Rights Reserved
Reproduced with permission of the copyright owner. Further reproduction prohibited without permission.

A COMPARISON OF WEB-BASED AND CONVENTIONAL-BASED
TRAINING METHODS IN A LEADING M ID W ESTERN COMPANY
An Abstract of A Dissertation
Submitted
in Partial Fulfil lment
of the Requirements for the Degree
Doctor of Industrial Technology
Approved:
L i .Dr. Mphammed Fahmy, Committee Chair
rohn W. Somervil l fan of the Graduate College
Hani Aljadaani
University of Northern Iowa
Decem ber 2000
Reproduced with permission of the copyright owner. Further reproduction prohibited without permission.

A B S T R A C T
The primary purpose of this study was to compare trainees’
perceptions of learning in a w eb-based delivery and conventional-
based delivery in a leading Midwestern Electronics Company. This
study exam ined tra inees ’ perceptions of learning environment
differences and related demographic and attitudinal perception
variables. Due to the nature of human beings, interactivity is a key
element in the learning process.
Two training programs were selected, one of which was W e b -
Based Training (W B T) and the other one was classroom based. The
two have been chosen with the respect to the ach ievement of
concepts and skills. The training programs were beginning Microsoft
Word 97 and project management. T h e two training groups studied
are referred to as: Project M a n a g e m en t (Group 1), and Microsoft
Word 97 (Group 2). A total of 100 surveys were sent to the subjects
of each of the training programs. A total of 38 valid responses
were made from the Project M a n a g e m en t subjects and 35 valid
responses were received from the Microsoft Word 9 7 subjects.
D ata analyses included the use of independent t test, cross
tables, f requency, and mean dif ferences. The result indicated that
there were no significant di f ferences between w eb-b ased and
conventional-based methods of delivery in the two training
programs. Based on the data collected from this study, the
Reproduced with permission of the copyright owner. Further reproduction prohibited without permission.

conventional-based group and the web-based group achieved similar
learning acquisition outcomes as measured in an independent t test
at the p.<.05 significance level. Although, the results show that
there are no statically significant differences between the two
groups by using the independent t test, the web-based group
reported a higher mean in almost every question in the survey.
Reproduced with permission of the copyright owner. Further reproduction prohibited without permission.

A C K N O W L E D G E M E N T S
Without the help and support from many people , this dissertation
would never have been completed. The author would like to express
his sincere appreciat ion to his advisor, Dr. M. Fahmy, co-advisor,
Dr. Charles D. Johnson, and to all the advisory committee members,
Dr. Sue Joslyn, Dr. Ali Kashef, and Dr. Sharon Smaldino.
The author especially thanks his parents for their prayer and
support. Also the author thanks his wife for her love, patience, and
support during the entire six years that the author spent to pursue
his academic achievement.
Reproduced with permission of the copyright owner. Further reproduction prohibited without permission.

TABLE OF C O N T E N T S
PAGE
LIST O F TABLE ............................................................................................................... vii
LIST O F F IG U R E S .......................................................................................................... viii
C H A P TE R I: IN T R O D U C T IO N
Need for the S tu d y ................................................................................................. 6
S ig n i f i c a n c e ...............................................................................................................7
Problem S t a t e m e n t ................................................................................................8
M e thodo log y ...............................................................................................................8
Assum ptions...............................................................................................................9
D e l im i ta t io n s ............................................................................................................. 9
Research Q u e s t io n s .............................................................................................. 9
L im i ta t io n s ...............................................................................................................10
Definitions of T e r m s ............................................................................................10
C H A P TE R II: R E V IE W O F L IT E R A T U R E
In troduct ion ............................................................................................................. 15
Change, Knowledge and L e a r n in g ..............................................................17
The Need to Study the Effects of InformationElectronic Technology on Knowledge D e l iv e ry .....................................19
Instructional Theory: Past to P r e s e n t ....................................................... 21
Interaction in the Learning P r o c e s s .......................................................... 23
Reproduced with permission of the copyright owner. Further reproduction prohibited without permission.

iv
PAGE
Internet and Learning: Internet D ef ined ...................................................26
Internet Descr ip t ions ......................................................................................... 28
Internet U s a g e .......................................................................................................30
L i c u t i u m o iviciit..................................................................................................................................*................................................. •
File T r a n s f e r ....................................................................................................31
Discussion G r o u p s ....................................................................................... 31
Remote C o n t r o l .............................................................................................32
Internet Advantages and D is a d v a n ta g e s ............................................... 33
W eb-B a se d Tra in ing ..........................................................................................36
The Advantages of W eb-B ased T r a i n i n g ...............................................37
S u m m a ry ................................................................................................................. 39
C H A PTER III: M E T H O D O L O G Y
Introduct ion ........................................................................................................... 41
Popula t ion .............................................................................................................. 41
Data C o l le c t io n ....................................................................................................42
Survey Instrum ent ..............................................................................................42
Validation of the Instrum ent .........................................................................44
Research H ypotheses ...................................................................................... 45
C H A PTER IV: DATA A NALYSIS
Survey A n a ly s is ..................................................................................................47
Description of R e s p o n s e s ............................................................................. 47
Reproduced with permission of the copyright owner. Further reproduction prohibited without permission.

V
PAGE
Demographic In form at ion ................................................................................. 47
Age Distr ibut ion.............................................................................................. 48
G ender Dis tr ibut ion....................................................................................... 49
Years of E x p e r ie n c e ......................................................................................50
E du cat io n ............................................................................................................51
Descriptive Statistics of Questionnaire R es u l ts ................................... 52
Dif ferences in Perceived Learning E nv iron m en t ..................................52
Dif ferences in Level of Interactivitybetween Students Within the Two G r o u p s ............................................. 57
Dif ferences in Level of Interactivity BetweenStudents and Instructor Within the Two G r o u p s ..................................60
Dif ferences in Self -Reported K n o w le d g e .................................................63
Project M a n a g e m e n t .................................................................................... 63
Microsoft Word 9 7 .........................................................................................66
Independent t test Analys is .............................................................................69
Learning Environment Independent t test R e s u l ts ....................... 69
Level of Interactivity between Students ............................................ 71
Level of Interactivity between Student and in s t ruc tor ............... 73
Reproduced with permission of the copyright owner. Further reproduction prohibited without permission.

PAGE
C H A P T E R V: S U M M A R Y , D IS C U S S IO N ,C O N C L U S IO N S , AND R E C O N M M E D A T IO N S
Summary of Findings..................................................................................... 75
Summary of D e m o g r a p h ic s ........................................................................76
Summary of Quest ionnaire F ind ings......................................................77
Discussion ..........................................................................................................78
Conclusions........................................................................................................ 81
Recom m endat ions ........................................................................................... 83
R E F E R E N C E S .................................................................................................. 85
Appendix A: The Q u e s t io n n a i re ...............................................................92
Appendix B: The Statistics Raw D a t a ...............................................101
Reproduced with permission of the copyright owner. Further reproduction prohibited without permission.

LIST OF TABLES
TABLES PAGE
1 Disadvantages of the In t e r n e t ........................................................................ 35
2 Advantages of the In ternet ............................................................................... 36
3 The Advantages of Web-Based Tra in ing ................................................... 38
4 The Disadvantages of W eb-B ased T r a in i n g ............................................38
5 Indications that W B T is Appropr iate ............................................................ 39
6 Age Distribution in Both G r o u p s ................................................................... 48
7 Gender D is tr ibut ion ..............................................................................................49
8 Years of E x p e r ie n c e ............................................................................................ 50
9 Education Level of Part ic ipants ......................................................................51
10 Sum m ary of Count Number and Percentage of Section I I ...................56
11 Sum m ary of Count Number andPercentage Response of Section I I I ............................................................. 59
12 Sum m ary of Count Number andPercentage Response of Section I V ............................................................. 62
13 Sum m ary of Count Number and Percentage Response ofSection V (Project Management) ................................................................... 65
14 Sum m ary of Count number and Percentage Response ofSection V (M S W 9 7 ) ............................................................................................. 68
15 Demographic D a t a .................................................................................................69
16 Learning Environment Independent t T e s t ............................................... 71
17 Level of Interactivity Between S tud en ts .....................................................73
18 Level of Interactivity Between Student and Instructor ....................... 74
Reproduced with permission of the copyright owner. Further reproduction prohibited without permission.

LIST O F F IG U R E S
F IG U R E S PAGE
1 Age Distribution in Both Groups ..................................................................... 48
2 Comparison of Gender P a r t ic ip a n ts ..............................................................49
3 Years of Exp e r ie n c e ...............................................................................................50
4 A Comparison of Level of Education Between the Two G r o u p s . . . .52
5 Summary of the Learning Environment M e a n s ........................................55
6 Summary of the Means: Student-to-StudentInteractivity for Both G r o u p s ............................................................................ 60
7 Summary of the Means: Instructor-to-StudentInteractivity for Both G r o u p s ............................................................................ 62
8 Summary of Means for Group 1(Self -Reported K n o w le d g e ) ............................................................................... 66
9 Summary of Means for Group 2 (Self -Reported K n o w le d g e ) 68
Reproduced with permission of the copyright owner. Further reproduction prohibited without permission.
1
C H A P T E R I
IN T R O D U C T IO N
As information technology becomes more popular, avai lable,
and cost-effective, it is increasingly used as a medium for the
delivery of knowledge. In recent years, the growth of the World
Wide W eb ( W W W ) and its associated technologies has triggered an
interest in using it to deliver training.
W e b -B a se d Training (W B T ) is the kind of training that refers to
the Internet delivery of structured information, which is intended to
improve job-related knowledge and skill (Hall , 1997). This kind of
training makes W B T unique simply because it is posted on the web
(e.g., online classroom). In this form of computer assisted learning,
computers and/or the web are used to supplement classroom
activities rather than to convey instructions.
Due to the globalization of today’s economy, companies and
organizations are now establishing their manufacturing plants and
offices all over the world. In so doing, they need to train their
employees to learn new technologies to m ake these organizat ions
more competit ive. Hence, for those organizat ions to meet global
challenges, be more competit ive, and overcome distances and time
constraints, the need to undergo training through the web becomes
a vital issue.
Reproduced with permission of the copyright owner. Further reproduction prohibited without permission.

2
There are many potential benef its of conducting training
through the web. A key feature of W B T is that the learner controls
many aspects of the learning experience, such as which information
to review, which exercises to complete , and how long to stay in this
learning environment. In other words, it becomes a self-paced
learning environment (Hall , 1997) .
Traditional delivery of information has existed for centuries
where students were taught the broad areas of language, reading,
and arithmetic. C lassroom-based delivery is generally assumed to
be the best for student and/or tra inee- learn ing style. However, there
is little evidence to support this assumption (Hiltz, 1994) .
Furthermore, the current classroom and school structure was
founded in order to support the industrial society’s need for adults
who had gone through an educational system that would accl imate
workers to the structure of jobs, roles and institutions in society.
Today the level of development of computer-based learning
material has risen dramatically as a consequence of the new and
exciting opportunities provided by the World W ide W eb (W W W ).
Therefore, this industrial approach to education is now in the
process of changing to meet the dif ferent needs of our society. Our
current society has increased the flexibil ity of work hours, global
competition, the rate of change in the job skills workers need to stay
Reproduced with permission of the copyright owner. Further reproduction prohibited without permission.

3
competit ive, and the shift towards the age of information technology
education.
Consider ing the aforementioned items makes the use of
distance training delivery methods, such as the World Wide W eb
(W W W ) , a possible solution to meet the educational and training
needs of w eb-based learning. Collins (1 9 9 5 ) states that the effects
of technology and work/family requirements make l ife-long learning
for most adults a necessity.
W e b -b a s e d delivery has many di fferent names, such as web-
based instruction (WBI) and web-based learning (WBL). Khan calls
it “hyperm edia -based instructional system, which utilizes the
attributes and resources of the W W W to create a meaningful
learning environment where learning is fostered and supported”
(1997, p. 6). Some of the key benefits of web-based training are
affordabil ity, increased productivity, fun, continuous tracked
learning, asynchronous and synchronous communication options,
and global information access. According to Wilson (1999) , 45% of
training cost in traditional training is spent on traveling. This cost is
eliminated when classes are conducted over the Internet. Hence,
W e b -b a s e d training offers significant cost savings to most
businesses.
From past experience in schools, asking questions was the
biggest chal lenge for most students. By the use of web-based
Reproduced with permission of the copyright owner. Further reproduction prohibited without permission.

4
training, these fears d isappear because it provides a safe and
private environment. According to Wilson (1999) , in most traditional
training settings, many questions go unasked because of the
student/ trainer internal pressure and also because of the fear of
looking foolish. Now by using the Internet, students can write their
questions without worrying about what other students might think.
According to Wilson (1999) , many employees like to learn
using the Internet because it captures their attent ion by making
learning interactive and fun. Employees can study at their own
pace, go forward and backward in their work, and have the ability to
test their level of learning at any time. He also states that online
training can ensure that all employees are trained in the best way
possible and receive continuous learning no matter what position
they hold in the company. He adds that companies today are
looking for mission critical training applicants that will increase
profitability by using the Internet to meet their key needs. In other
words, to stay competit ive in the business world, organizat ions need
to be famil iar with this new technology. After reviewing the
l i terature, Berge and Coll ins (1998) , Brooks (19 97 ) , Harasim (1994) ,
Khan (1997 ) , Nixon (1992 ) , and Eastmond (1995) , all consider the
effect of distance education and hypermedia on ach ievem ent of
learners and its implications for future research. Professionals have
both strong positive and negative feelings about how distance
Reproduced with permission of the copyright owner. Further reproduction prohibited without permission.

5
learning will be used in education. Brooks indicates that the use of
distance learning delivery methods would continue to increase and
is “going to be used for instruction regardless of what teachers
think, feel, or do” (1 9 9 7 , p. 29) . He further states that the use of
distance methods of learning-delivery will continue even in the
absence of demonstrable research findings as to its effectiveness.
One reason for an increase in use of distance learning by both
public and private sectors is due to the ease of access. The
Internet provides a comprehensive access mechanism, which is
avai lable in all homes, dormitory rooms, and offices through various
dial-up services such as analog POTS (Plain Old Te lephone
Service) , as well as high bandwidth digital connection methods such
as ISDN (Integrated Services Digital Network), LAN (Local Area
Network), CATV (Cable Televis ion) , and others (Brooks, 1997) .
Factors like the increasing difficulty for a growing population of non-
traditional students to attend a traditional c lassroom, lower delivery
costs, more consistent del ivery of instructions, as well as better
quality of instruction demonstrated by learning assessments and
student perceptions will be some of the factors that will encourage
the growth of this instructional delivery method.
Although c lassroom-based instruction is general ly assumed to
be the best for student learning, there is little ev idence to support
this assumption (Hiltz, 1994; Wells, 1990) . A number of researchers
Reproduced with permission of the copyright owner. Further reproduction prohibited without permission.

6
have noted that the on-line environment, such as the W W W ,
facil itates learning outcomes that are equal or superior to those
generated in a classroom situation (Brooks, 1997; Hiltz, 1994;
Wells, 1990) . Considering the rapid growth of the W W W and its use
in education, it is important to assure that the students in the
distance-learning course, will achieve similar outcomes as compared
to students taking the same course in a traditional classroom.
Som e other issues concerning classroom-based instruction are
related to the students’ motivation and abil ity to attend the class.
Students who take courses via the web must be more disciplined
and motivated since the formal way of receiving information by a
traditional classroom is not avai lable. In short, the differences
between web-based and traditional-based courses center on the
following: the design of the course or training program, the use of
multimedia, the student character , the motivation, and class
attendance (Hall, 1997).
Need for the Study
The purpose of this study is to compare t rainees’ perceptions
of learning acquisition using web-based and conventional-based
delivery in a leading Midwestern Electronics Company. It is
important to understand how the role of w eb-b ased training will
affect our society and whether it is a viable delivery method when
compared to the traditional delivery in a training program. Training
Reproduced with permission of the copyright owner. Further reproduction prohibited without permission.

7
delivery methods are changing every day to support the needs of the
workforce of the new millennium, an age where acquisition, change,
and flexible access to learning are fundamental. It is important for
both businesses and educational institutions to find out if trainees or
students are able to reach similar levels of mastery with web-based
training as with traditional classroom training. Due to the increasing
use of the W W W as a delivery tool for both training and education,
studying the dif ference between traditional and web-based training
is very important
Significance
This research is significant for both private and public sectors
because both are looking for better training methods. In addition, it
is important to those who are designing courses, especially in higher
education, where both concepts and skil ls/performance components
will be either partially or totally del ivered via the W W W . Distance
learning via the W W W is increasingly being used for instructional
delivery, yet there is conflicting and insufficient evidence as to its
effectiveness. Comparing learning acquisition di fferences and
learner interaction between similar groups with web-based
instruction and traditional training will help provide guidance to
people who are researching the W W W as a course delivery method.
The results of this study will help researchers decide whether web-
Reproduced with permission of the copyright owner. Further reproduction prohibited without permission.

8
based training would be a viable delivery option for other courses
with similar characteristics.
Problem Statement
The problem of this study was to compare t ra inees ’
perceptions of learning in a web-based delivery program with
convent ional-based delivery training program in a leading
Midwestern Electronics Company. This study will examine t ra ine e s ’
perceptions of learning environment di f ferences and related
demographic and attitudinal perception variables. Due to the nature
of human beings, interactivity is a key e lement in the learning
process. The Internet can do much more than deliver information
from a central ized source. It can also provide a means for learners
to collaborate with one another and get support from experts.
Delivering training is the main activity for human resource
development departments in industrial organizations. These
departments are always interested in new delivery methods that are
less expensive and more efficient in producing higher levels of
learning outcome.
Methodology
Two groups of trainees were compared with respect to
perceptions of knowledge and interactivity between students and
instructor, one of which was trained in a conventional c lass-based
group and the other received training via a web-based method. Both
Reproduced with permission of the copyright owner. Further reproduction prohibited without permission.

9
groups were eva luated by a questionnaire. Data were collected and
analyzed for di f ferences in achievement and perceptions of
knowledge. The variables that were ana lyzed were the perceptions
of knowledge acquisit ion of concepts and skills, insights of trainees
on tra inee-to-tra inee interaction, and insights of trainees on trainer-
to-trainee interaction.
Assumptions
This study assum ed that trainees answered truthfully on the
demographic survey and questionnaire.
Delimitations
The following delimitations were made with respect to this
study:
1. This study delimited to only Midwestern Electronics
Company em ployees .
2. This study is delimited to part icipants that took these
training programs.
Research Questions
The following research questions will be used to guide this
study:
1. Are perceptions of learning acquisition better, worse, or
the same when using a web-based del ivery versus using traditional
based delivery as perceived by trainees?
Reproduced with permission of the copyright owner. Further reproduction prohibited without permission.

10
2. Do self-reported knowledge levels differ by method of
training delivery?
3. W hat are the perceptions of trainees on level of trainee-
to-tra inee interaction as it re lates to method of delivery?
4. W hat are the perceptions of trainees on the level of
t ra iner- to-tra inee interaction as method of delivery?
Limitations
The following were l imitations to this study:
1. This study was l imited to trainees' wi l l ingness to answer
truthfully.
2. This study was l imited to training programs, which were
conducted in a leading Midwestern Electronics Com pany, which
l imited generalizations of results.
Definitions of Terms
A sse s s m e nt : “ essentially a m easurem ent process of the learning
that has either taken place or can take place. Usually measured
against stated learning ou tcom es” (Kirkpatrick, 1998 , p. vx).
Asynchronous: “transmission by individual or packets of bytes not
related to specific timing on the transmitting end” (Schreiber &
Berge, 1998, p. 410).
Com puter Assisted Instruction (CAP: Refers to using computers to
instruct human users (Schre iber & Berge, 1998, p. 4 1 3 ) .
Reproduced with permission of the copyright owner. Further reproduction prohibited without permission.

11
Computer M anaged Instruction (CMI):
The use of computers and software to m anage the instructional process. Functions of C M I can include a m anagem ent administration system designed to track student performance over a period of t ime, provide information concerning performance trends, record individual and group performance data, schedule training, and provide support for other training management functions. (Schre iber & Berge,1998, p. 413)
Cooperat ive Training: “An educational process in which a learner
replaces formal studies with On-The-Job training" (Schreiber &
Berge, 1998, p. 351) .
D ependent Variables: In this study, the depend en t Var iable is the
learning acquisition of concepts and skills, insights of students on
instructor-to- students’ interaction, insights of students on student-
to-student interaction.
Distance Education: “A formal process of distance learning, with
information being broad in scope, for exam ple , college courses"
(Schreiber & Berge, 1998, p. 414) .
Distance learning: “It is educational or training information,
including the instruction and experience that learners gain, although
they are physically distance from the source of that information and
instruction” (L. Porter, 1997, p. 1).
Educational Technology: “A complex, in tegrated process involving
people, procedures, ideas, devices, and organizat ion, for analyzing
Reproduced with permission of the copyright owner. Further reproduction prohibited without permission.

12
problems, and devising, implementing, evaluating and managing
solutions to those problems, involved in all aspects of human
learning" (Markert , 1997, p. 411 ) .
Independent V a r ia b le s : Independent variables in this study are the
Web-based group and tradit ional-based group.
Interactive Training: “ An umbrella term that includes both computer-
based and mult imedia training" (Steed, 1999, p. 233).
Internet: “An electronic data network that enables infinite numbers
of computers to send text and graphics to one another over phone
l ines” (Schreiber & Berge, 1998 , p. 414) .
Internet Protocol ( IP): “The international standard for addressing
and sending data via the In ternet” (Schreiber & Berge, 1998, p.
414).
Intranet: “A private network inside a company or organization that
uses the same kinds of software that you would find on the public
Internet, but that is only for internal use” (Schreiber & Berge, 1998 ,
p. 416) .
Learning: “A relatively perm anent change in behavioral potentiality,
that can be m easured, that occurs as a result of reinforced practice:
gaining knowledge, skills, or developing a behavior through study,
Reproduced with permission of the copyright owner. Further reproduction prohibited without permission.

13
instruction, or e x p e r ie n c e ” (French, Hale, Johnson, & Farr, 1999 , p.
27).
Self -Paced Learning:
Learning init iated and directed by the learner. This is e ither for leisure learning or as a result of being informed that they might need addit ional knowledge for a job or for school. More and more training departments are developing courses that employees go through at their own pace. This term is used by some organizat ions now to include computer-based, web- based and m ult imedia training. (French et a l ., 1999, p . 10)
Synchronous: “ D a ta communications in which transmissions are
sent at a fixed rate, with the sending and receiving devices
synchronized" (S c hre ibe r & Berge, 1998, p. 417) .
Telecommunication: The science of information transport using wire,
radio, optical, or e lectromagnetic channels to transmit and receive
signals for voice or data communications using electrical means.
Training: “ Learning that is provided in order to improve performance
on the present jo b” (Ful ler & Farrington, 1999 , p. 4).
Web-Based Instruction (WBI) :
W eb-based Instruction is delivered over public or private computer networks and displayed by a W e b browser. W B I is avai lable in m any formats and several terms are linked to it, on-line coursew are , distance education on-line, etc. W B I is not downloaded CBT, but rather on-dem and training stored in a server and accessed across a network. W BI can be updated very rapidly, and access to the training controlled by the training provider . (Khan, 1997, p. 5)
Reproduced with permission of the copyright owner. Further reproduction prohibited without permission.

14
World W ide W eb ( W W W ): “A graphical hypertext-based Internet tool
that provides access to homepages created by individuals,
businesses, and other organizations" (Schreiber & Berge, 1998, p.
418) .
Reproduced with permission of the copyright owner. Further reproduction prohibited without permission.

15
C H A P T E R II
R E V IE W OF L IT E R A T U R E
Introduction
The purpose of this study was to compare the perceptions of
learning acquisition of a web-based and conventional-based delivery
method in a leading Midwestern Electronic Company (MEC). This
study examined the dif ferences of trainee achievement with
consideration gives to concepts, skills acquisition, related
demographic, and attitudinal perception variables.
This chapter will discuss a brief overview of W eb-based
training, change, knowledge and learning. It will also discuss the
need to study the effects of information electronic technology on
knowledge delivery, instructional theory: past to present: interaction
in the learning process: Internet and learning; and web-based
training
In recent years, the growth of the W W W and its associated
technologies has trigged an interest in using the web to deliver
training. Web-Based Training (W BT) is training that is delivered via
the Internet to corporate Intranet. For the purpose of clarity, W B T
refers to structured information intended to improve job-relevant
knowledge skills. This di fferent iates W B T from information simply
deposited or posted on the web (e.g., bulletin boards) , from
education via the web targeted to a student (e .g., on-line
Reproduced with permission of the copyright owner. Further reproduction prohibited without permission.

16
classroom), and from computer-assis ted learning (CAL) where
computers and/or the web are used to supplement classroom activity
rather than the instrument of convey instruction. A key feature of
W B T is the learner ’s control of many aspects of the learning
experience, such as which information to review, which exercises to
complete, and how long to stay in the learning environment.
T h ere are many potential benefits of implementing training on
the web. Information on the web is generally stored in one location
and transmitted when requested to remote sites. At a remote site a
trainee can access this information using widely available computer
programs like web browsers (e .g . , Internet Explorer, N etscape) .
Compared to traditional training methods, W B T features lower
training development cost, simple updating or materials revision,
and increased accessibility (Hal l , 1997; Khan, 1997) . In addition,
training that is available via the web does not have to be taken at a
central location; it can be taken in any place and at any time. “Just-
in-time” training delivery has the potential to lower the chances for
trainees to forget learned materia l before it can be used on the job.
The potential benefits of W B T have been recognized and its
use is growing (Hall, 1997; Owston, 1998) . In fact, the American
Society of Training and D evelopm ent suggests that while the
percentage of computer-based training and self -paced training in
other formats has remained constant at 3% and 7% respectively, the
Reproduced with permission of the copyright owner. Further reproduction prohibited without permission.

17
percentage of in ternet/network distance education has increased
from .4% to 2% from 1994 to 1996. This percentage is likely to
increase even more in the coming years (Hall , 1997 ) . Despite the
growth in W B T, there is little empirical research to demonstrate its
effectiveness (Hall, 1997).
This study compared the perceptions of learning acquisition
using both the web-based and the conventional-based method of
delivery in a leading Midwestern Electronic Com pany (MEC). This
study examined trainee ach ievem ent di fferences with consideration
to the acquisition of concepts, skills and the related demographic
and attitudinal perception variables.
Change. Knowledge, and Learning
Organizations are witnessing radical changes, which include
shrinking product life span, a demand for higher quality products
and services resulting from keen competit ion, and rapidly increasing
amounts of information and knowledge avai lable from thousands of
sources (Stewart, 1996).
Fueling change is the American economy's evolution from a
manufacturing base to a knowledge base, from a national to a global
marketplace, and from a producer environment to one where
consumers rule (Stewart, 1996 ) . The last t ime the world faced
changes of this magnitude was when technology made possible what
is known as the industrial revolution. People relocated from the
Reproduced with permission of the copyright owner. Further reproduction prohibited without permission.

18
country to the cities, transportation improved remarkably, and
consumer goods became widely available. Peop les ’ main activity
changed from tilling a small piece of soil to working at a more
specialized job for an enterpr ise. The citizens of those countries
who were able to industrialize the fastest reaped the greatest
rewards from this change. However, people who could not learn the
appropriate skills were unable to cope. The people were similar to
those described by Charles Dickens (Stewart, 1996).
Rapid shifts in the U .S . economy reflect changes in the global
economy and lead to the em ergence of new jobs as well as the
disappearance of jobs requiring obsolete skills. Forecasters say
that the average work life in the future will include six or seven
different careers each requiring new skills, attitudes, and values
(Sarna & Febish, 1997) . Th e half-life of technical skills is now down
to perhaps 18 months, compared to 5 years or more some years ago
(Sarna & Febish, 1997) . Th e American Society for Training and
Development estimates that by the year 20 00 , 75% of the workforce
will need retraining. For most of the U.S. population, lifelong
learning is becoming a necessity. There are many organizations
have considered the implications of a society in which continuous
learning is the norm.
The skills needed for the 2 1 st century are those associated
with the acquisition of information and knowledge rather than the
Reproduced with permission of the copyright owner. Further reproduction prohibited without permission.

19
industrial skills used in the 1 9 th and 2 0 th centur ies. The dramatic
change in technology will affect almost every aspect of our lives.
This includes how we do our jobs, how we educate our children, how
we communicate with each other, and how we are enterta ined.
Belardo and Belardo (1997 ) state that while any organization
can change, change without the benefit of learning is risky. M.
Porter, (1980) contends changes that result from learning foster the
kinds of innovation that result in competit ive advantage and ensure
survival.
Knowledge is the organization and application of information.
Knowledge, according to Davis and Botkin (1994 ) , "is doubling about
every seven years, and in technical fields, half of what students
learn in their first year of col lege is obsolete by the time they
graduate" (p. 45) .
The Need to Study the Effects of Information Electronic Technology
on Knowledge Del ivery
The delivery of knowledge through the use of rapidly evolving
information technologies has been identif ied by government,
academia, and industry as a critical success factor in the areas of
the formal education of students and the training of workers
(Hamalainers, Whinston, & Vishik, 1996) . Technologies such as
computer-based training, computer-based instruction, video
teleconferencing, video teletraining, and the mult imedia-supported
Reproduced with permission of the copyright owner. Further reproduction prohibited without permission.

20
classroom are proposed to support the augmentation of both the
traditional-based and computer-based del ivery (Liedner &
Jarvenpaa, 1995). Recent advances in the information technology
infrastructure are providing us the capabil ity to move concepts such
as the virtual classroom from the research laboratory into routine
use for course delivery (Hughes & Hewson, 1998). These
technologies can enhance a classroom lecture with mult imedia
presentations, facil itate the delivery of simple lecture at a distance,
and even provide a surrogate instructor through a computer-based
training system.
How technologies are appl ied, however, will vary as a function
of the model of learning embedded in the design of the instruction.
While the use of information technology to deliver knowledge
successfully has been confirmed in a large number of studies
(Howard, 1997), questions also remain unanswered about how much
variation in learning outcome is accounted for by the many possible
configuration of learners, instructors, learning models, and
information systems (Liedner & Jarvenpaa , 1995).
The need to focus research on the impact the web-based
method has on training and on education systems is important for
businesses and educational institutions.
Reproduced with permission of the copyright owner. Further reproduction prohibited without permission.
21
Instructional Theory: Past to Present
Classrooms were designed to teach people how to deal with
problems as represented in abstraction by language, reading,
writing and arithmetic. In the 1 9 th century and the early part of this
century, there were few job opportunities in the professions open to
those who were not the children of the wealthy (Drucker, 1989) .
Social mobility was poor at best for the common person, who
learned a trade from parents or during a long apprenticeship on the
work site. The skills that young people learned from their parents,
they would use it in their work and throughout their life (Papert,
1993).
“Classroom structure was modeled after industrial society s
need for adults who had passed through an educational machine
that would accl imate workers to the, ‘Structure of jobs, roles, and
institutions also as in society” (Toffler , 1970, p. 401) . Villani
described how the turn-of-the-century education was, "Organized
and run in a business-l ike m anner [with an emphasis on] practical
and immediately useful education" (1998, p. 7). While this model
may have solved short-term workforce needs, it was far from
adequate in serving a t ra inee ’s need to be adaptab le and prepared
for change.
Considering these l imitations, the traditional classroom has
some inherent l imitations due to physical layout, number of teachers
Reproduced with permission of the copyright owner. Further reproduction prohibited without permission.

22
and learners who can participate, flexibility in t ime and delivery of
courses, and limitations due to the geographical distribution of
participants (Heckman & Owens, 1996). The current model of the
classroom as an instructional delivery system will need to change
and include distance-learning components to meet the needs of
people in future. Lewis and Romiszowski stated similar thoughts
when they noted that we currently have a situation where every
generation of working adults has to retrain and adapt to changing
work environments and social contexts on a continual basis (1996) .
This has had the effect of increasing the need for the continuation of
learning and the updating of worker skills updating which in turn has
caused some of the more conventional models of education and
training to become outdated. Bell, Bowden, and Trott indicated that,
"The attraction and the value of new online learning technologies
are expl icable mainly in the ways they seem to be addressing the
current needs of higher education and the perceived needs of
learners in the next century" (1997, p. 26) . As far back as 1983
prominent adult learning expert Malcolm Knowles predicted that by
the end of this century the majority of educational resources and
programs would be delivered electronically. H iemstra (1994) noted
that the medium "facil itates participation around a learner 's
schedule, rapid responses from instructors and colleagues, and
access to various resources through a home computer , a campus
Reproduced with permission of the copyright owner. Further reproduction prohibited without permission.

23
computer or computers anywhere that are electronically accessible"
(p .14). Corrigan (1996) described the changing learning
environment by estimating that in 1990 approximate ly 5% of
academic courses were conducted online and that by the year 2 0 20
this will expand to an estimated 50%.
Rela ted to its cost effect iveness and corporate downsizing,
W agner (1 9 9 2 ) stated that other researchers have described how
distance learning can stretch the availabil ity of existing personnel,
connect groups who were separa ted by distance, and improve
access to instructional resources. Becker et al. (1996 ) supported
this when they indicated that the W W W provided a potentially cost
effective platform independent opportunity for conveying of
instructional materials that were not dependent on conventional
publishing processes.
Interaction in the Learning Process
The interaction process is generally presum ed to be an
important part of learning in theoretical circles. It also is a popular
issue in educat ion reform as shown by the desire for smaller class
sizes by educators and polit icians. Here, one major presumption is
that lowering student-teacher ratios will increase the student-
teacher interaction. The desirabi l i ty of lowering student-teacher
ratio is predicated not only for primary and secondary education
(Main & Ruse, 1995) , but also is reflected in the rankings of United
Reproduced with permission of the copyright owner. Further reproduction prohibited without permission.

24
State universities published annual ly in US News and World Report.
An analysis done by Redding and Fletcher (1 9 9 4 ) of the value of
interaction among participants in interactive videodisc instruction
included a review of over one hundred studies. This review
produced results that clearly supported the va lue of interaction in to
learning outcomes.
Most distance learning courses are designed to specifically
address the degree of interaction between student and instructor
and to compensate for the possible reduction in interaction caused
by the physical separation of student and teach er (Klinger & Connet,
1992; Wetze l , Radke, & Stern, 1994) . This perceived need by
distance educators to enhance opportunities for interaction has led
to concurrent changes in both instructional design and in the media
used to deliver instruction. W hi le interaction among participants is
generally assumed to influence learning ach ievem ent in a positive
direction, some studies show that it does not guarantee achievement
in all cases (Kettanurak, 1996; W agner , 1992 , 1993) .
Main and Ruse (1995) call for a better definit ion of learning
interaction and its effects on distance learning. Learning interaction
is described as a multidimensional construct by several authors.
Boak and Kirby (1989 ) , in their deve lopment of the System for Audio
Teleconferencing Analysis Instrument, describe three dimensions for
interaction. T h es e dimensions are identified as the characteristics
Reproduced with permission of the copyright owner. Further reproduction prohibited without permission.

25
of the initiator (who initiates the interaction), the direction of the
interaction (directed at one student, at the instructor, or to the class
as a whole), and the context of the interaction (procedural, content
specific, or social) . Kettanurak (1996) proposes three dimensions in
considering the degree of interaction. T h e y are frequency, which
refers to how often the user interacts with the instructor/system;
range, which refers to the number of choices available to the user;
and modality, which refers to the type of sensory systems used by
the instructor/system and the user.
Other potentially important dimensions or aspects of learning
interaction have also been introduced into the research l iterature.
For example, Main and Ruse (1995) propose six major dimensions
of interaction of which quantity of interaction is one dimension. The
notion of low quality is appl ied in describing the rote interaction
observed in some computer-based training packages in which most
of the interaction occurring between a user and the computer merely
advances the system to the next screen. High quality interaction, on
the other hand, would engage the student creat ively (Dale , 1978) .
Quality has been further defined along the dimensions of intensity,
relevance, formality, and opportunity (Main & Ruse, 1995,). Hughes
and Hewson (1998) state that the required level of interaction varies
by activity. They propose that each teaching activity is a micro
genre, or communicative activity, which should be analyzed to
Reproduced with permission of the copyright owner. Further reproduction prohibited without permission.

26
determine the appropriate teaching method and associated level of
interaction.
Internet and Learning
Internet Defined
What is the Internet exactly? The Internet is “An electronic
data network that enables infinite numbers of computers to send text
and graphics to one another over phone lines. A World wide
network of networks that all use the T C P / IP communications
protocol and share a common address space" (Scheriber & Berge,
1998, p. 416) . Som e people like to call it the information super
highway. No one is ultimately responsible for it as a single
enterprise. No one is earning money from the service as a whole.
Nobody is establishing rules for the type of material that it contains.
No one centrally manages the system and no one will be able to
control it in the future.
Anyone with a computer, modem, and Internet software can
establish a site or homepage containing information for other
Internet users to examine, download, or print. A few sites require
some fee for usage or require a password, but the vast majority are
free. This fluidity leads to greater variation in the quality of
information on the Internet. It ranges from totally useless to the
indispensable. Leiner et al. (2 0 00 ) noted that in the present t ime,
Reproduced with permission of the copyright owner. Further reproduction prohibited without permission.
27
style has won over substance. The Internet now contains many
glossy magazines and slick brochures, but only a few meaty tomes.
The minimum hardware recommended to explore the In ternet
is a 4 8 6 D X -3 3 M H z possessor with 8 MB of memory, sound blaster
sound card, mouse, super VGA card and monitor, speakers, and a
14A baud modem. The minimum operating system level
recommended is Microsoft Windows 3 .1 /W indows 95 and a web
browser such as Netscape Navigator (Mayfield & AM, 1996). This is
generally avai lable at a reasonable cost.
The Internet is an extraordinarily resource that literally is
changing by the minute. New sites appear at a breathtaking rate.
One major on-line Internet catalog receives over 2 2 ,0 0 0 proposed
listings every day (Stanley, 1994 ) . In fact, many sites that are here
one day, are gone the next. Sites change regularly because it only
takes a few minutes at a computer to change them. This means that
the information and knowledge bound to the Internet extremely
perishable. There can be a massive amount of new information at a
given site after only a few short t imes. In addition, information that
was once there is often removed. This is where the Internet and the
library are very different because the holdings in the library remain
relatively constant; while sites and information found on the In ternet
often seem to have a very brief life span.
Reproduced with permission of the copyright owner. Further reproduction prohibited without permission.

28
The Internet was initially built by the American government
and universities as a research tool to allow for the rapid exchange
of data among scientists. Today, commercia l firms selling on-line
access fuel most of the phenomenal expansion of marketing goods
and services.
Internet Descriptions
Conceptual schem es or descriptions abound for the Internet.
Conceptual schem es enable us to make sense of our world by
providing a fram ework or perspective to organ ize reality (Lakoff &
Johnson, 1980) . T h e right conceptual schem e enables us not only
to understand and interpret current exper ience, but also to extend
that experience to develop new perspect ives. The ability to develop
new perspectives is a necessary component of the learning
organization. Randal l (1997 ) identifies the following schemes or
metaphors for the Internet:
1. Internet as a superhighway.
2. Internet as cyberspace.
3. Internet as a socially constructed space such as a city.
4. Internet as a data mine.
5. Internet as an ecosystem.
The superhighway metaphor or h igh-speed network backbone
with feeder routes into smaller networks focuses on how to drive
( i.e. , how to use the access methods, e lectronic mail, telnet, ftp)
Reproduced with permission of the copyright owner. Further reproduction prohibited without permission.

29
and then how to find where to go (e.g., Yahoo as a resource
discovery tool). Conceptual information is partit ioned under each
topic with addressing schemes.
In closer relation to the superhighway metaphor are the
cyberspace or geographic space metaphors. As with the
superhighway metaphor, resources are located at various points and
the role of the Internet user is to navigate between them. The
superhighway and cyberspace metaphors are limited within the
f ramework of the learning organization since they do not adequately
consider the user, driver, or navigator in terms of his or her needs
and goals. Randall (1997) has stated that the metaphors do not
consider that needs and goals may be multidimensional (e.g., a user
needs to go to several places).
The Internet as a socially constructed space, data mine, and
ecosystem are metaphors that focus on the user. They focus on the
user by actively creating the structure of the Internet ( i.e. , socially
constructed space), locating services and resources of value (i.e. ,
data mine), or existing as one e lement in a rich and changing
environment (i.e., the ecosystem).
The Internet as a socially constructed space allows people to
interact much more easily with others and to access knowledge
systems anywhere in the world. As a result, the world has begun to
be more like a city or a vil lage. In the past, geographic boundaries
Reproduced with permission of the copyright owner. Further reproduction prohibited without permission.

30
l imited communication and interaction. Now information flows freely
across borders and all around the world (Randall , 1997).
The Internet as a data mine metaphor leads to an
organizational approach that begins with how to determine what
resources and services are available and rich in content. W hereas,
the Internet as an ecosystem, suggests an environment in which
resources and services are constantly adapting to fill niches that
become available. It also suggests that users look for those
resources and services that are the most useful for the least amount
of effort.
Ideally, a conceptual scheme enables the organization to
develop the type of understanding of the Internet that allows them to
partic ipate actively in strategic learning.
Unfortunately, we currently lack an understanding of
experiences users have as they move through the Internet (Randall ,
1997) . For example, it would be interesting to understand what
metaphors or conceptual schemes are built for users to best make
sense of the Internet experience, as well as being able to
understand specific quest ions they ask themselves as they move
through the process.
Internet Usage
A basic understanding of the delivery methods is crucial to
understanding how the Internet supports organizational learning.
Reproduced with permission of the copyright owner. Further reproduction prohibited without permission.

31
Floridi (1996) has stated that there are four distinguishable
categories of communicat ion on the Internet: (a) e-mail, (b) file
transfer, (c) discussion groups and remote control (e.g., W W W ,
catalogs, search engines). E-mail and the World Wide W e b are the
two most commonly used In ternet capabil ities as measured by
percentages of Internet usage in a 24 horse period: (a) web access,
72% , (b) e-mail, 65% , (c) discussions listserve, 36% , (d)
downloading software, 3 1 % , and (e) use another computer, 31% .
Electronic Mail
Electronic mail ( i .e. , e-mai l) is simply a means of interpersonal
communications. W e can exchange letters, memos, and private
messages with friends and col leagues, and even publish an
electronic journal.
File Transfer
File transfer enables users to send and receive files such as
text, graphical bit maps, v ideo clips, and sound bytes.
Discussion Groups
Discussion groups or newsgroups are collections of individuals
interested in a part icular topic. They post messages, questions,
problems or issues on the Internet, and reply to those left by others.
They are able to have electronic discussions or debates. The
messages can be stored on an Internet site that participants access
Reproduced with permission of the copyright owner. Further reproduction prohibited without permission.

32
by using web browser software such as Netscape or they can be
distributed by e-mail .
Remote Control
The World W ide W eb (W W W ), also known as "the web," was
released in 1992. The W W W is based on “home p a g e s ” combining
text, graphical images, musical sounds, video using HTTP, and
HTML to hyperlink related sites on thousands of subjects. The
W W W has become one of the most popular and rapidly expanding
elements of the Internet. In a sense, the W W W is the Internet's
library and can be a powerful source of t imely information and
knowledge. Nevertheless, there are no l ibrarians monitoring either
the categories or the quality of information and knowledge avai lable
on the W W W .
The following are examples of Internet tools that support the
four distinguishable categories of communication on the Internet:
1. Lotus Notes is GroupWare, which provides intranet
communication within an organization.
2. Electronic mail (e-mai l) and chat lines ( IR C ) keep people in
touch with colleagues and friends around the world.
3. Data transfer through file transfer protocol (ftp) allows
information to be exchanged with fellow team members.
4. Newsgroups facil itate technical discussions over the
Usenet, fallowing people to post queries and answer questions.
Reproduced with permission of the copyright owner. Further reproduction prohibited without permission.

33
One click of the mouse on the W W W , and we can read the daily
news, check the weather, and research topics of interest.
There is a lot to gain from using the Internet as an educational
tool. First, we are able to provide hands on experience. Computers
are used in nearly all professions. Providing the students with as
much opportunity as possible to enhance their talents helps to make
them a better candidate in the job market. Many people cannot
afford to travel and will never have an opportunity to visit other
places during their l i fetime. On the Internet, one can exchange
culture, customs, and ideas with others in far away places. Rather
than wade through outdated reference materials, assignments may
be given to browse the entire world information da tabases , which
contain the most up-to-date information about any subject. By
surfing the net students have the opportunity to interact with others,
while sharing and exchanging ideas of common interests. While
browsing the net in search of information necessary to complete an
assignment, the students are is using a goal-oriented experience
that will stay with them forever (Mayfield & Ali, 1996) .
Internet Advantages and D isadvantages
Th e National Information Infrastructure (Nil) is a conceptual
term used to replace the more generic designation of Internet. Nil
describes a system of resources accessible through the
interconnectivity of t iered networks. Whi le the growth of the Internet
Reproduced with permission of the copyright owner. Further reproduction prohibited without permission.

34
is explosive in terms of users and applications, it provides a high
level of connectivity and some good examples of networked
information.
The Internet offers new ways to increase learning, link
resources, and share valuable knowledge. There are a variety of
ways to access information on the Internet. Electronic mail ( i.e. , e-
mail) is the most widely used, which allows communication with
others. People can easily exchange professional concerns,
questions, and answers about pertinent topics. A listserv not only
connects multiple users around specific discussion issues, but also
greatly reduces the time needed to locate and acquire resources.
There is also down-side to the Internet. As a p ioneer of the
Internet, Stoll (1995) observes not only a lack of organizat ion, but
also a lack of scholarly content and a difficulty in locating such
content: Stoll remarks
However, for all this communication little of this information is genuinely useful. The computer gets my attention, yet either because of content or format, the network doesn't s eem to satisfy lots of exci tement and plenty of glitz, but little substance and even less reflection, (p. 45)
The Internet lacks a central index to guide the user to
collections that are unique. The user must rely on personal
knowledge, on-line guides, or just plain luck to find truly valuable
sources because so much of the useful information is obscured. In
order to bring forth more valuable resources, more sophist icated
Reproduced with permission of the copyright owner. Further reproduction prohibited without permission.

35
search tools are needed (Rowland, 1994) . There are many
inhibitors to learning on the Internet. During business hours, the
Internet is often painfully slow. It sometimes takes a minute for
each keystroke to travel from your keyboard to the target system.
During this t ime, it is much too slow for interactive sessions.
There exists little empirical research in regards to the impact
and benefits of the Internet on learning. Indeed, many people are
skeptical; arguing that the Internet is too disorganized, the
information is inaccurate and incomplete, and time spent looking for
information is laborsome. Networked resources are chaotically
scattered; some files are cataloged, others aren't and still others are
mislabeled. The following sums the major advantages and
disadvantages of the Internet (see Tables 1 and 2).
Table 1
Disadvantages of the Internet
• O v e r lo o k in g th e im p o r t a n c e of p e rs o n a l c o n t a c t . P e rs o n to p e r s o n re la t io n sh ip s a re f u n d a m e n t a l to s u c c e s s in to d a y 's te c h n o lo g ic a l ly a d v a n c e d world
• Inabi l i ty to d is c e rn with so m uch in form at io n
• I n a d e q u a t e s e c u r i ty h in d e rs trust
• W a s t e d t i m e to f ind in fo rm a t io n st i f les I n t e r n e t use
• In a c c u r a t e , i n c o m p le t e in fo rm at io n e f fe c ts d e c is io n m ak in g____________
Reproduced with permission of the copyright owner. Further reproduction prohibited without permission.

36
Table 2
Advantages of the Internet
• J u s t - i n - t im e learn ing (d is ta n c e lea r n in g ) .
• L e a r n e r - c e n t e r e d e n v i ro n m e n t (s t im u la te s a n d m o t iv a te s lea r n in g ) .
• E le c t r o n ic co l labora t ion ( p ro fe s s io n a l d e v e l o p m e n t ) .
• I n c r e a s e d a c c e s s to in fo rm at io n (c o m m u n i t y o u t re a c h ; co l lege s c h e d u le s , c a le n d a rs , s p e e d ) .
• Im p r o v e d qua l i ty ( in d iv id u a l i zed in te ra c t iv e lea rn in g m ate r ia ls ) .
• Im p r o v e s d e c is io n - m a k in g ( e x p e r t S y s t e m s ) .
• N e w s g r o u p s b ro a d en a c c e s s to k n o w l e d g e ( fo ru m s , l is tserv) .
• C o n t a in s costs ( for e x a m p l e , the cost of b as ic bank in g t r a n s a c t io n sd r o p s f r o m $1 to o n e c e n t on t h e I n t e r n e t ) .
W eb-B ased Training
According to Marquardt and Kearsley (1999) corporations are
somewhat slower to adopt and explore the web for learning. The
reasons for their slow implementation are because of the l imited
availabil ity of computers, no tradition of Internet access, and a
concern about the confidential/propriety nature of training
materials. On the other hand, they said almost every corporation
and business has a web site used primarily for marketing and
product information. The access to computers in the workplace is
increasingly almost every year. Both authors expect that the
Reproduced with permission of the copyright owner. Further reproduction prohibited without permission.

37
explosive growth of the web seen in the educational domain will be
duplicated in the corporate world during the next few years.
Then what is w eb-based training? Hall defined W e b-ba s e d
training as:
Instruction that is del ivered over the Internet or over a company's intranet . The training is accessed using a W eb browser, such as Netscape Navigator or Internet Explorer. Other types of Internet training refer to any program that can be delivered from a remote source, even e-mail correspondence courses, or the transfer of files of course materials. Training over the World Wide W eb, and training interactive, mult imedia nature of W e b browsers and associated plug-ins. (1997 , p . 15)
W e b-ba s e d training can be delivered to any computer that can
access the Internet or a company intranet. This includes a desktop
at work, field service engineers on the road, or from home (Hall ,
1997) .
The Advantages of W e b -B a s e d Training
There are new demands driving organizat ions that have
increased the interest in W eb-based training on a daily basis. The
need for inexpensive methods to deliver training has guided
organization to think about web-based training. Some advantages
and disadvantages of W e b-ba s e d training are stated below (see
Table 3 and Table 4).
Reproduced with permission of the copyright owner. Further reproduction prohibited without permission.

38
Table 3
The Advantages of W e b -B a s e d Training
• C ross p la t fo rm . You d e v e l o p the train ing p ro g r a m a n d you can a c c e s s it by w in d o w s, M a c , or U N I X s ys tem s w i thout requ ir ing ad d i t io n a l so f tw are .
• W id e ly a v a i l a b l e In t e r n e t co n n e c t io n s and b ro w s e rs . M ost c o m p u t e r users have a c c e s s to a b r o w s e r such N e t s c a p e or In t e r n e t E x p lo re r , co n n ec t to a c o m p a n y ’s in t r a n e t or h ave a c c e s s to In t e r n e t .
• Flex ibi l i ty , a c c e s s ib i l i t y , c o n v e n i e n c e . T r a i n e e s can do th e i r t ra in ing a n y t im e , at any p la c e , a n d a t the am o u n t t h e y n e e d . In o t h e r w ords , they control the i r t r a in in g p r o g r a m s .
• C o st e f fe c t iv e and t im e s a v i n g . T rave l costs will be e l i m in a t e d b e c a u s e In t e r n e t can b e a c c e s s e d from an y p la c e .
• E as e of u p d a t e . T h e t r a i n in g p rogram n e e d s to c h a n g e ; t h e y can be m a d e by s im ply u p lo a d in g the c h a n g e s to the s e rv e r .
Table 4
The Disadvantages of W e b -B a s e d Training
• B andw id th is l im ited . T h is l imitat ion will a f f e c t the p e r f o r m a n c e of sound, v id e o , and g r a p h i c s
• W e b - b a s e d t ra in ing t a k e s m o r e t ime and m o re m o n e y to d e v e lo p than e x p e c te d
• Not all c o u r s e s shou ld b e d e l iv e re d by c o m p u t e r .
• R e q u i re s l e a r n e r s to a d a p t to new m e th o d s
• R e q u i re s a s u b s ta n t ia l in f ra s t r u c tu re ._____________________________________
Reproduced with permission of the copyright owner. Further reproduction prohibited without permission.

39
According to Driscoll, (1998) organizat ions considering W eb-
based training should have many or all of the indications shown in
Table 5.
Table 5
Indications that W B T is Appropriate
• G a p in l e a r n e r s ’ ski l ls and k n o w le d g e
• N e e d for c o g n i t i v e skil ls
• L e a r n e r s h a v e a d e q u a t e c o m p u t e r ski lls
• O r g a n i z a t i o n has c a p a c i ty to del iver
Summary
This review of the literature clearly indicates that training
needs to be fundamentally restructured to support living in the
information age, an age where knowledge, change, and flexible
access to learning are cornerstones to its ability to function. The
older concept of the passive learner and of learning a trade for life
have changed to autonomy in learning, interactivity in the learning
process, and life long learning. In the Information Age, learners
must diverge from rote memorization of facts and dates to learning
how to learn. Considering this change, it is important to insure that
t rainees receive the same content and quality with web-based
instruction as they would in a traditional [ face-to-face] classroom.
Reproduced with permission of the copyright owner. Further reproduction prohibited without permission.

40
After reviewing the l iterature there appears to be a need to consider
hat the effect of Internet technology on the learning achievement
made by trainees and its implications. Therefore, this study
compared the perceptions of learning acquisition between web-
delivered and classroom-delivered training by trainees to find out
the answers to the following research questions:
1. Are perceptions of learning acquisition better, worse, or
the same when using a web-based delivery versus using traditional
based delivery, as perceived by the trainees?
2. Do self-reported knowledge levels differ by method of
training delivery?
3. W hat are the perceptions of trainees on t rainee-to-tra inee
interaction as it relates to knowledge acquisition for both methods of
delivery?
4. W hat are the perceptions of trainees on the trainer-to-
trainee interaction as it relates to knowledge acquisition for both
methods of delivery?
Reproduced with permission of the copyright owner. Further reproduction prohibited without permission.
41
C H A P T E R III
M E T H O D O L O G Y
Introduction
This chapter describes the procedures and methodology used in
this study. Its includes four sections: (a) population, (b) data
collection, (c) survey instrument, and (d) validation of the
instrument.
The purpose of this study was to compare the perceptions of
knowledge in web-based versus c lassroom-based delivery in a
Midwestern Electronic Leading Company. Two training programs
were selected, one of which was a W B T and the other one is a
classroom based. The two were chosen with respect to the
achievement of concepts and skills. The training programs were
beginning Microsoft Word 97 and project m anagement .
The results of this study could be used to further improve the
effectiveness of the methods used in the delivering training program
by providing information that enables human resource and
development departments to decide which method is more effective
and competitive.
Population
The research population of this study consists of all company
employees who attended the two training programs. Trainees who
went through the beginning word-training program were estimated to
Reproduced with permission of the copyright owner. Further reproduction prohibited without permission.

42
be around 100 trainees. All the trainees surveyed were assumed to
be willing to partic ipate in this study and thus the expected return
rate was very high. The number of trainees who went through the
project m anagement-tra in ing program was estimated to be around
100 trainees. All the trainees surveyed were also assumed to be
willing to participate in this study and thus their expected return rate
was also high.
Data Collection
All trainees in each of the two training programs were given an
invitation form that requested their consent to take part in this study
and asked them to answer the questionnaire truthfully and honestly.
Data were collected by using a questionnaire that was developed by
the author (see Appendix A). The questionnaires were answered
online and data were stored in a database. This method is said to
generate the highest return rate.
Survey Instrument
A questionnaire survey was used to conduct this study. The
questionnaire was divided into two sections:
I. Demographic data.
II. Learning Environment Evaluation
1. Content
2. S tudent-to- Student interactivity
3. Instructor-to- Student interactivity
Reproduced with permission of the copyright owner. Further reproduction prohibited without permission.

43
4. Knowledge gained
5. Self -reported knowledge Section
A. Project m anagem ent
B. MS Word 97
The demographics section consisted of the following information:
age, gender, level of education, level of experience, job
classification and the like. Names were not be solicited by the
questionnaire to ensure the confidentiality of the information given.
The learning environment evaluation section consisted of five parts:
content, student-to-student interactivity, instructor-to- student
interactivity, knowledge gained, and self -reported knowledge. The
first part consisted of the content of both training programs such as
handouts, reading material, and assignment. Also, it consisted of
the quantity of the materia l that was covered in the training program
and the overall rating of the training program. The second part
measured the interactivity between students in both training
programs and the third part measured interactivity between the
instructor and students in both programs. The measurements of the
knowledge that students gained in both training programs were
included in the fourth part. The fifth part measured the self-reported
knowledge in both training programs.
The questionnaire was developed to compare the perceptions of
learning between web-based and c lassroom-based delivery. The
Reproduced with permission of the copyright owner. Further reproduction prohibited without permission.

44
data that were collected from the questionnaire answered the
research questions:
1. Are perceptions of learning acquisition better, worse or the
same when using a web-based del ivery versus using traditional
based delivery, as perceived by trainees?
2. Do self-reported knowledge levels differ by method of training
delivery?
3. W hat are the perceptions of trainees on level of trainee-to-
trainee interaction as it relates to the method of delivery?
4. W hat are the perceptions of trainees on the level of trainer-to-
trainee interaction as the method of delivery?
The trainees were asked to provide answers to questions by
reading the question statement and choosing: (1) Strongly Disagree,
(2) Disagree, (3) Neutral, (4) Agree, and (5) Strongly Agree.
Instructions were clearly provided to guide the respondents through
the questionnaire.
Validation of the Instrument
Before creating this questionnaire, other surveys that were used
in related studies were reviewed (Bills, 1997; Boehler , 1999;
Philson, 1999) . In addition, books describing the use and design of
surveys were reviewed (Belson, 1981; Bradburn, 1979; Dillman,
2 0 0 0 ) . The questionnaire went through several revisions before it
was presented in its final form. To validate the questionnaire, a
Reproduced with permission of the copyright owner. Further reproduction prohibited without permission.

45
copy of the original questionnaire was submitted to 4 experts for
their evaluation. The experts' suggestions were incorporated within
the questionnaire to increase its validity. In addition, 5 employees
of the 2 0 0 hundred who took the training programs were chosen
randomly to be given the questionnaire. Their suggestions,
questions, and comments were taken into consideration to make the
questionnaire c learer and more understandable.
Research Hypotheses
The problem of study was to compare the learning acquisition
between W B T and class-based methods. The research hypotheses
were:
Hi: Perceptions of learning will differ by training delivery method.
Hi: T ra inee interaction wiil differ by training delivery method.
Hi: Self -reported knowledge will differ by training del ivery method.
Reproduced with permission of the copyright owner. Further reproduction prohibited without permission.

C H A P T E R IV
D ATA ANALYSIS
The purpose of this study was to compare t ra inees ’
perceptions of learning acquisition of web-based and conventional-
based delivery in a leading Midwestern Electronics Company. It is
important to understand how the role of w eb-based training will
affect our society and whether it is a viable delivery method
compared to traditional del ivery will help industrial and educational
organization use training m ethods as effectively and efficiently as
possible.
This chapter presents the results of the statistical analyses of
data gathered during this study. The findings for this study were
derived from an analysis of the collected data. In order to facil itate
the presentation of the findings, eight sections are included: (a)
survey analysis, (b) description of responses, (c) demographic
information, (d) differences in perceived learning environment
between training programs, (e) differences in level of interactivity of
students within the group betw een training programs, (f) di f ferences
in level of interactivity of s tudent and instructor within the group
between training programs, (g) differences in self-reported
knowledge between training programs (Project M anagem en t and
Microsoft W ord 97) , and (h) independent t test analysis. The
interpretation of the findings and the conclusions are discussed in
Reproduced with permission of the copyright owner. Further reproduction prohibited without permission.

47
chapter five. Th e raw data collected from the demographics and
questionnaire are provided in Appendix B.
Survey Analysis
Demographic data were collected from the questionnaire
and summarized for the two groups. Data from the questionnaire
were summarized for each group by determining the mean student
responses to questions related to guiding research questions.
Responses were in the form of the student’s percentage rating for
each question on a Likert f ive-item Scale. Possible options for
response were: Strongly D isagree, Disagree, Neutral, Agree, and
Strongly Agree.
Description of Responses
The two training groups studied are referred to as: Project
Managem ent (Group 1) and Microsoft Word 97 (Group 2). A total of
100 surveys were sent to the subjects of each of the training
programs. A total of 38 valid responses from the project
m anagement subjects and 35 valid responses from the Microsoft
Word 97 subjects were recieved.
Demographic Information
The demographic data of participants in the two groups
were composed of (a) age, (b) gender, (c) level of experiences, and
(d) level of education.
Reproduced with permission of the copyright owner. Further reproduction prohibited without permission.

Age Distribution
The age distribution of the two groups is shown in Table 6.
Most of the part icipants were middle aged and mostly distributed
equally in both programs. The majority of participants in Group 1
were 41 and older ( 5 5 .3 3 % ) , and between 31-40 years (28 .9 5% ) .
Similarly, as shown in Figure 1 the majority of part ic ipants of Group
2 are 41 and older (5 1 .4 4 % ) , and between 31-40 years (31 .44% ).
Table 6
Age Distribution in Both Groups
AgeG roup 1 G r o u p 2
No. % No. %20 or Y o u n g e r 0 0% 0 0 %
21 To 30 6 1 5 . 8 % 5 1 4 . 3 %
31 To 40 11 2 8 . 9 % 12 3 4 . 3 %
41 or O l d e r 21 5 5 . 3 3 18 5 1 . 4 %
Total 38 1 0 0 .0 35 1 0 0 . 0
30
ORUOR 1 ORUOR 2G R O UR W
Figure 1. Age distribution in both groups.
Reproduced with permission of the copyright owner. Further reproduction prohibited without permission.

49
Gender Distribution
The gender distribution of the two groups is shown in Table 7.
The number of male and fem ale in Group 1 is 26 and 12 (6 8 .4 % , and
31 .6% ). Th e respective numbers of male and female trainee in-
Group 2 are 18 and 17 (5 1 .4 % and 4 8 .6 % ) . In Group 1 the majority
of participants are males and in Group 2 the number of male and
female were almost equal (See Figure 2).
Table 7
Gender Distribution
G e n d e r G ro u p 1 Group 2No. % No. %
Male 2 6 6 8 . 4 % 18 5 1 . 4 %
F e m a le 12 3 1 . 6 % 17 4 8 . 6 %
i-----------------------------* IIB Group 1 i M Group 2 [
Male Female
Figure 2. Comparison of gender participants.
Reproduced with permission of the copyright owner. Further reproduction prohibited without permission.

50
Years of Experience
T h e years of experience for the two groups are displayed in
Table 8. The numbers of participants who have work 11 years and
more are the majority of participants (See Figure 3).
Table 8
Years of Experience
Y e a r s of E x p e r ie n c eG r o u p 1 G ro u p 2
No. % No. %L ess th a n 1 year 2 5 .3 0 0 %
1 -5 y e a r s 8 2 1 . 1 % 11 3 1 . 4 %
6 - 1 0 y e a r s 6 1 5 .8 10 2 8 . 6 %
11 y e a r s or older 21 5 5 . 3 3 14 4 0 . 0 %
T o ta l 3 8 1 0 0 . 0 35 1 0 0 . 0
[lass than 1 yea r
GRUOP 1 G RU OP 2
GROUP#
Figure 3. Years of experience.
Reproduced with permission of the copyright owner. Further reproduction prohibited without permission.

51
Education
The level of education for the two groups is displayed in
Table 9. Th e majority of subjects in both groups Group 1 and Group
2 hold a Bachelor degree (6 0 .5 % , and 54 .3% , respectively). (See
Figure 4.)
Table 9
Education Level of Participants
Ed u c a t io n leve l G r o u p l G r o u p 2# % # %
High school 1 2 .6 2 5 . 7 %
S o m e c o l l e g e 7 1 8 .4 9 2 5 . 7 %
B ach e lo r 's d e g r e e 23 6 0 . 5 19 5 4 . 3 %
P o s t - g r a d u a t e 7 1 8 .4 5 1 4 . 3 %
Total 38 1 0 0 . 0 35 1 0 0 . 0 %
Reproduced with permission of the copyright owner. Further reproduction prohibited without permission.
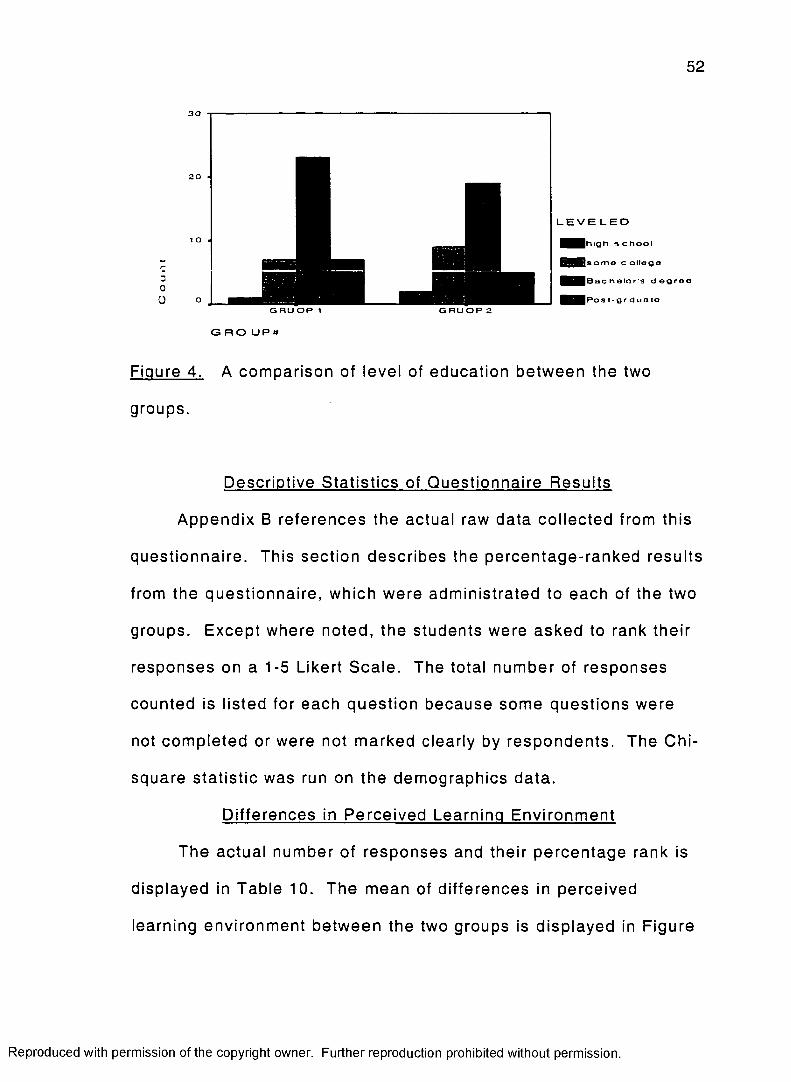
52
G R U O P 1 G R U O P 2
G RO UP#
Figure 4. A comparison of level of education between the two
groups.
Descriptive Statistics of Questionnaire Results
Appendix B references the actual raw data collected from this
questionnaire. This section describes the percentage-ranked results
from the questionnaire, which were administrated to each of the two
groups. Except where noted, the students were asked to rank their
responses on a 1-5 Likert Sca le . The total number of responses
counted is listed for each question because some questions were
not completed or were not marked clearly by respondents. The Chi-
square statistic was run on the demographics data.
Dif ferences in Perceived Learning Environment
The actual number of responses and their percentage rank is
displayed in Table 10. Th e m ean of di fferences in perceived
learning environment between the two groups is displayed in Figure
Reproduced with permission of the copyright owner. Further reproduction prohibited without permission.

53
5. This section consists of nine questions and each of these is
rated using the Likert Scale questions. By comparing the two
responses, we find that Group 2 has the highest responses. In
Question 1, 6 0 .5 % of 38 agreed and 34 .2% strongly agree that the
content of the training programs was presented in an interesting
way. The m ean of this question for Group 1 was 4 .8 . In Group 2
51 .4% of 35 responses agreed and 44 .7% strongly agreed about
question and the mean for Group 2 is 4.34. Th e responses given by
Group 1 for Quest ion 2 were 5 0 .0 % agreed and 3 6 .8 % strongly
disagreed that training course materials were delivered in an
organized way and the mean was 4 .14 . In contrast, Group 2 has
responded to agree 51 .4% and 4 5 .7 % for strongly agree and the
mean is 4 .23 . For Question 3, Group 1 responses were 57 .9% who
agreed and 2 3 .7 % strongly agreed that the env ironment was
comfortable and conducive to learning and the m ean was 4 .26. The
responses given by Group 2 were 4 0 .0 % who a g re e d and 37 .1%
strongly agreed. The calculated mean of this group was 4 .43. In
Question 4, Group 1 responses were 65 .8% who agreed and 2 1 .1 %
strongly agreed, to the question of whether training programs
objectives were communicated and clearly stated and the mean of
this group was 4 .0 3 . Sixty percent of Group 2 ag re ed to this same
question and 3 4 .3 % strongly agreed while having a mean of 4 .37 . In
Question 5, Group 1 responses were 52 .6% who agreed and 3 4 .2 %
Reproduced with permission of the copyright owner. Further reproduction prohibited without permission.

54
strongly agreed that the course content in the training program was
complete and organized. The mean for Group 1 was 4 .2 4 . But
Group 2 responses were 6 8 .6 % who agreed, 2 2 .9 % strongly agreed
and the mean was 4 .40 . In Question 6, Group 1 responses 60 .5%
who agreed and 2 3 .7 % strongly agreed that training program
included a m anageab le amount of information. The mean was 4.24.
Group 2 responses were 6 0 .0 % who agreed, 3 7 .1 % strongly agreed.
Group 2 had a mean of 4 .3 4 . In Question 7, the percentage of
Group 1 were 5 7 .6 % who agreed and 2 6 .3 % strongly agreed that
training deliver method was appropriate for the material required
during this training program. The mean was 4 .0 . But the vast
majority of Group 2 responses was agreed to Question 7 with 45 .7%
agreed and 4 0 .0 % who strongly agreed, and 4.11 was the mean for
Group 2. In Question 8, Group 1 responses were 5 5 .3 % who agreed
and 2 3 .7 % strongly agreed that the training program fits their
personal schedule. The calculated mean was 4 .0 8 . But Group 2
responses to the same question were 4 5 .7 % who agreed, 4 0 .0 %
strongly agreed, and the mean calculated to give a mean of 4 .26 . In
Question 9, Group 1 respond to Question 9 by 4 7 .4 % agreeing and
39.5% strongly agreeing that the understanding of the materia l is
enhanced by the instructional methods used in this training program
and the mean of this group was 4 .21. In Group 2 responses for the
Reproduced with permission of the copyright owner. Further reproduction prohibited without permission.

55
same question were 6 0 .0 % agreed, 3 7 .1 % strongly agreed and the
mean of this group was 4 .06 .
Representat ions of survey data of learning environment
Section II.
|OGroup1 I
■Group 2 I
0 1 0 2 0 3 Q 4 0 5 0 6 i 0 7 Q 8 0 9
QGroupt 4 C8 4 14 426 403 4 24 4 24 4 400 421
■Group 2 434 423 443 437 44 434 4 11 426 406
Figure 5 . Sum m ary of the learning environment means.
Reproduced with permission of the copyright owner. Further reproduction prohibited without permission.

56
Table 10
Summary of Count Number and Percentage Response of Section II:
Learnina Environment Evaluation
SD D N A SA# % # % # % % # %
Group 1 0 0% 1Q uest ion 1
2 . 6 % 1 2 . 6 % 23 6 0 . 5 % 13 3 4 .2 %Group 2 0 0% 0 0 . 0 % 1 2 . 9 % 18 5 1 . 4 % 16 4 5 . 7 %
Group 1 0 0% 0
Q uest io n 2
0 . 0 % 5 1 3 .2 % 19 5 0 . 0 % 14 3 6 .8 %Group 2 0 0% 1 2 . 9 % 0 0 . 0 0 % 18 5 1 . 4 % 16 4 5 . 7 %
Group 1 0 0 % 2Qu est io n 3
5 . 3 % 5 1 3 .2 % 22 5 7 . 9 % 9 2 3 . 7 %Group 2 0 0% 1 2 . 9 % 7 2 0 . 0 % 14 4 0 . 0 % 13 3 7 .1 %
Group 1 0 0 % 0Quest io n 4
0 . 0 % 5 1 3 .2 % 25 6 5 . 8 % 8 2 1 .1 %Group 2 1 2 . 9 % 0 0 . 0 % 1 2 . 9 0 % 21 6 0 . 0 % 12 3 4 .3 %
Group 1 0 0% 0Quest io n 5
0 . 0 % 5 1 3 .2 % 20 5 2 . 6 % 13 3 4 .2 %Group 2 0 0 % 3 6 . 6 % 0 0 . 0 0 % 24 6 8 . 6 % 8 2 2 .9 %
Group 1 0 0 % 2Q uest io n 6
5 . 3 % 2 5 . 3 0 % 23 6 0 . 5 % 9 2 3 . 7 %Group 2 0 0% 0 0 . 0 % 1 2 . 9 0 % 21 6 0 . 0 % 13 3 7 . 1 %
Group 1 0 0 % 0Q uest io n 7
0 . 0 % 5 1 3 .2 % 22 5 7 . 6 % 10 2 6 . 3 %Group 2 0 0% 1 2 . 9 % 4 1 1 .4 % 16 4 5 . 7 % 14 4 0 . 0 %
Group 1 0 0% 1Qu est io n 8
2 . 6 % 6 1 5 .8 % 21 5 5 . 3 % 9 2 3 . 7 %Group 2 0 0 % 2 5 . 7 % 2 5 . 7 0 % 12 3 4 . 3 % 19 5 4 .3 %
Group 1 0 0 % 1Q u est io n 9
2 . 6 % 4 1 0 .5 % 18 4 7 . 4 % 15 3 9 . 5 %Group 2 0 0 % 0 0 . 0 % 1 2 . 9 0 % 21 6 0 . 0 % 13 3 7 .1 %
Reproduced with permission of the copyright owner. Further reproduction prohibited without permission.

57
Differences in Level of Interactivity Between Students Within the Two Groups
The number of responses and the percentage rank is
displayed in Table 11. The mean for the dif ferences in level of
interactivity between students within the two groups is found in
Figure 6. This section consists of seven questions and each
question is also rated using the Likert Scale . By comparing the two
groups, Group 2 scored the highest. The response given to
Question 1 by Group 1 were 7 1 .1 % who agreed, 13 .2% strongly
agreed, that they made a considerable contribution to class
interaction with other students. The mean was 3 .94 . On the other
hand, Group 2 responses were 4 5 .7 % who agreed , 45 .7% who
strongly agreed with a mean of 4 .37 . Group 1 responded to
Question 2 by 47 .4% agreeing, 15 .8% strongly agreeing, that they
had the opportunity to interact with other students outside the
content of the class. This group had a mean of 3 .6 . Group 2
responses were very different 4 5 .7 % agreed, 4 8 .6 % strongly agreed,
and the mean was 4.4. In Question 3, 4 2 .1 % of Group 1 answered
agreed, 18 .4% answered that they strongly agreed that there was a
considerable amount of students to students interaction compared to
the other training courses that they have experienced and the
calculated mean was 4 .94 . In comparison, Group 2 responded
Reproduced with permission of the copyright owner. Further reproduction prohibited without permission.

58
4 8 .6 % agreeing, 4 5 .7 % strongly agreeing and the mean was 4.4. In
Question 4, Group 1 responses were 5 5 .3 % who agreed and 13.7%
strongly agreed that there was a considerable amount of interaction
between student and instructor and the mean was 4 .0 . In
comparison, Group 2 responses 3 7 .1 % agreeing, 6 2 .9 % strongly
agreeing and the mean was 4 .0 . The responses for Group 1 to
Question 5 were 60 .5% who agree and 26 .3% strongly disagreed
that there were a considerable amount of students’ interaction with
courses and the calculated mean was 4 .13 . Group 2 responded to
this same question with a 37 .1% agreeing and 6 0 .0 % strongly
agreeing and the mean for Question 5 was 4.57. In Question 6,
Group 1 responses were 7 .9% who agreed and 7 .9% strongly agreed
that there was a considerable amount of students to students
interaction compare to other training courses that they have
experienced and the mean was 2 .91 . In comparison, Group 2
responded with 45 .7% agreeing, 4 8 .6 % strongly agreeing and the
mean was 4 .37 . In Question 7, Group 1 responses were 52 .6%
agree, 18 .4% , and the mean 3 .86 . For Group 2 the percentage of
the trainees who agreed and who strongly agreed were 6 5 .7 % and
2 2 .9% respectively and the calculated mean was 4 .1 1 .
Reproduced with permission of the copyright owner. Further reproduction prohibited without permission.

59
Table 11
Summary of Count Number and Percentage of Section III: Student-
to-Student Interactivity
SD D N A SAQuest ion tt % tt % tt % tt % tt %
Group 1 0 0 .0%0.0%
1Q uest io n 1
2 . 6 0 % 5 1 3 . 2 % 27 7 1 . 1 % 5 1 3 .2 %
Group 2 0 0 0 . 0 0 % 3 8 . 6 0 % 16 4 5 . 7 % 16 4 5 . 7 %
Group 1 0 0 . 0 % 7Q uest io n 2
1 8 . 4 % 7 1 8 . 7 % 18 4 7 . 4 % 6 1 5 .8 %Group 2 0 0 . 0 % 1 2 . 9 0 % 1 2 . 9 0 % 16 4 5 . 7 % 17 4 8 . 6 %
Group 1 1 2 . 6 % 5Q u est io n 3
1 3 . 2 % 8 2 1 . 1 % 16 4 2 . 1 % 7 1 8 .4 %Group 2 0 0 . 0 % 0 0 . 0 0 % 2 5 . 7 0 % 17 4 8 . 6 % 16 4 5 . 7 %
Group 1 0 0 . 0 % 2Quest io n 4
5 . 3 0 % 5 1 3 . 2 % 21 5 5 . 3 % 9 2 3 . 7 %Group 2 0 0 . 0 % 0 0 . 0 0 % 0 0 . 0 0 % 13 3 7 . 1 % 22 6 2 . 9 %
Group 1 0 0 . 0 % 0Q u est io n 5
0 . 0 0 % 5 1 3 . 2 % 23 6 0 . 5 % 10 2 6 . 3 %Group 2 0 0 . 0 % 0 0 . 0 0 % 1 2 . 9 0 % 13 3 7 . 1 % 21 6 0 . 0 %
Group 1 0 0 . 0 % 12Q u est io n 6
3 1 . 6 % 19 5 0 . 0 % 3 7 . 9 0 % 3 7 . 9 0 %Group 2 0 0 . 0 % 2 5 . 7 0 % 0 0 . 0 0 % 16 4 5 . 7 % 17 4 8 . 6 %
Group 1 0 0 . 0 % 3Q u e s t io n 7
7 . 9 0 % 6 1 5 . 8 % 20 5 2 . 6 % 7 1 8 .4 %Group 2 0 0 . 0 % 0 0 . 0 0 % 4 1 1 . 4 % 23 6 5 . 7 % 8 2 2 . 9 %
Reproduced with permission of the copyright owner. Further reproduction prohibited without permission.

60
5
ESS** I
4
3 S G roup 1 jj
■ Group 2 j2
0Q1 Q2 Q3 Q 4 Q5 Q6 Q7
0 Group 1 3.94 3.6 4.94 4 4.13 2.91 3.86
■ Group 2 4.37 4.4 4.4 4.6 4.57 4.37 4 .11
Figure 6. Sum m ary of the Means: S tudent-to-Student Interactivity for
Both Groups
Differences in Level of Interactivity Between Students and Instructor
The number of responses and their percentage rank are
displayed in T ab le 12. The mean for dif ferences in the level of
interactivity between students within the two groups is showing in
Figure 7. This section of the study consists of four questions. Each
of these questions is rated by using the same Likert Scale.
By comparing the responses of the two groups, results
show that Group 2 attained the highest score. The responses given
to Question 1 by Group 1 was 5 7 .9 % who agreed , 28 .9% strongly
agreed, that they were given the opportunity to interact with their
instructor during this type of training and the mean was 4 .08 . Group
2 responses to the same question were 2 5 .7 % who agreed, 7 4 .3 %
Within the Two Groups
Reproduced with permission of the copyright owner. Further reproduction prohibited without permission.

61
strongly agreed and the mean was 4 .74 . The response to Question
2 from Group 1 were 65.8% who agreed, 2 8 .9 % strongly agreed, that
the instructor was available to help them when clarif ication was
needed and the mean was 4 .27 . Group 2 responses were 28 .6%
who agreed, 7 1 .4 % strongly agreed, and the mean was 4 .71. In
Question 3, Group 1 responses were 18 .4% who agreed and 23 .7%
strongly agreed that this type of training makes interactivity between
instructor and students easier and the calculated m ean was 4 .11 . In
comparison, Group 2 responses 3 1 .4 % who agreed, strongly agreed
6 8 .6 % and the mean was 4 .57 . In Question 4, Group 1 responses
were 5 0 .0 % who agreed and 3 1 .6 % strongly agreed that their
understanding of the courses is enhanced due to the interactivity
between the instructor and me and instructor and the mean was
4 .0 5 . Group 2 responded 4 2 .9 % agreeing, 5 7 .1 % strongly agreeing
and the mean was 4 .69.
Reproduced with permission of the copyright owner. Further reproduction prohibited without permission.

62
Table 12
Summary of Count Number and Percentage Response of Section IV:
Instructor-to-Student Interactivity
SD D N A SAQuest ion £ % £ % £ % £ % £ °A
Group 1 1 2 . 6 % 1Quest ion 1
2 . 6 % 3 7 . 9 0 % 2 2 5 7 .9 % 1 1 2 8 . 9 %Group 2 0 0 . 0 % 0 0 . 0 % 0 0 . 0 0 % 9 2 5 .7 % 26 7 4 . 3 %
Group 1 0 0 . 0 % 0Quest ion 2
0% 1 2 . 6 0 % 25 6 5 .8 % 1 1 2 8 . 9 %Group 2 0 0 . 0 % 0 0 . 0 % 0 0 . 0 0 % 10 2 8 .6 % 25 7 1 . 4 %
Group 1 0 0 . 0 % 0Quest ion 3
0 . 0 % 0 0 .0 0 % 7 18.4% 9 2 3 . 7 %Group 2 0 0 . 0 % 0 0 . 0 % 0 0 .0 0 % 1 1 31 .4 % 24 6 8 . 6 %
Group 1 0 0 . 0 % 1Quest ion 4
2 . 6 % 6 15 .8 % 19 5 0 .0 % 12 3 1 . 6 %Group 2 0 0 . 0 % 0 0 . 0 % 0 0 .0 0 % 15 4 2 .9 % 20 5 7 . 1 %
BIG roup 1 |
■ Group 2 ' |
Q1 ; Q2 Q3 j Q4
B Group 1 4.08 ! 4.27 4.05 4.11
■ Group 2 4.74 4.71 4.69 | 4.57
Figure 7 . Sum m ary of the means: Instructor-to-student interactivity
for both groups.
Reproduced with permission of the copyright owner. Further reproduction prohibited without permission.

63
Differences in Se lf -Reported Knowledge
Project M anagem en t
The number of responses and the percentage rank are
displayed in Table 13. The mean for di f ferences in self-reported
knowledge in project m anagem ent is displayed in Figure 8. This
part of the study consists of f ifteen questions. Each question was
rated by using Likert Scale .
In Question 1, 6 8 .4 % of the trainees agreed that they know
how to build an effective team. The mean of this question was 3 .81.
The responses for Question 2 were 8 4 .2 % that they know how to use
individual contributors and the mean was 3 .97 . For Question 3,
Group 1 responses were 5 7 .9 % who agreed that they famil iar with
determining the events and activities required completing a project
and the mean was 3 .94 . In Question 4, Group 1 responses were
5 5 .3 % who agreed that they feel confident that they have the
knowledge necessary for developing a network showing
in terdependencies and the calculated mean was 3 .86 . In Question 5
Group 1 responses 5 0 .0 % who agreed that they have the basic
understanding of determining the critical path through the network.
The mean for Group 1 was 4 .23 . In Question 6, Group 1 responses
5 0 .0 % who agreed that they have the basic understanding of
estimating durations and the mean was 3 .78 . In Question 7, Group 1
responses 57 .9% who agreed that they have the basic
Reproduced with permission of the copyright owner. Further reproduction prohibited without permission.

64
understanding of calculating the extra t ime avai lable to complete
and non-critical activit ies. The mean was 3.6. Group 1 answers
question eight with 5 7 .9 % who agreed that they familiar with
conversion of the project plan into a schedule and the mean was
3 .84 . In Question 9, Group 1 responses were 5 0 .0 % who agreed
that they familiar with developing integrated recovery plans using
multiple options for dealing with schedule slippage, resource
overloads and the mean was 3.8 . In Question 10, Group 1
responses were 3 9 .5 % who agree that they know how to use post
project review to conduct t ime-cost /benef i t analysis and construct
project-planning templates and the mean was 3 .47 . In Question 11,
Group 1 responses were 5 7 .9 % who agreed that they are familiar
with analyzing risks and developing multiple approaches to risk
m anagement and the mean was 3 .6 3 . In Question 12, Group 1
responses were 4 4 .7 % who answered neutral that they familiar with
analysis of variance and the mean was 3 .45 . In Quest ion 13, Group
1 responses were 5 5 .3 % who agreed that they familiar with
communicating a maximum amount of useful information and the
mean was 3 .57 . In Question 14, Group 1 responses were 57 .9%
agree that they familiar with appreciating the utility of project
m anagement software and the mean was 3 .76. In Question 15,
Group 1 responses were 6 5 .8 % who agreed that they believe they
Reproduced with permission of the copyright owner. Further reproduction prohibited without permission.

65
gained adequate knowledge on the topic of the course and the mean
was 3 .84.
Table 13
Summary of Count Number and Percentage Response of Section V:
Self -Reported Knowledqe for Project Manaqem ent
SD D N A SAQuestion # % # % # % # % # %
1 0 0 . 0 % 1 2 . 6 0 % 8 2 1 .1 % 26 6 8 . 4 % 3 7 . 9 0 %
2 0 0 . 0 % 0 0 . 0 0 % 3 7 .9 0 % 32 8 4 . 2 % 2 5 . 3 0 %
3 1 2 . 6 % 0 0 . 0 0 % 7 18 .4 % 22 5 7 .9 % 8 2 1 . 1 %
4 0 0 . 0 % 2 5 . 3 0 % 8 2 1 . 1 % 21 5 5 .3 % 7 1 8 .4 %
5 0 0 . 0 % 0 0 . 0 0 % 5 1 3.2% 19 5 0 .0 % 14 3 6 . 8 %
6 0 0 . 0 % 3 7 . 9 0 % 9 2 3 .7 % 19 5 0 .0 % 7 1 8 . 4 %
7 0 0 . 0 % 3 7 . 9 0 % 6 15.8% 22 5 7 .9 % 7 1 8 . 4 %
8 0 0 . 0 % 2 5 . 3 0 % 8 2 1 .1 % 22 5 7 .9 % 6 1 5 . 8 %
9 0 0 . 0 % 0 0 . 0 0 % 12 3 1 .6 % 19 5 0 . 0 % 5 1 3 . 2 %
10 0 0 . 0 % 5 1 3 . 2 % 14 3 6 . 8 % 15 3 9 . 5 % 4 1 0 .5 %
11 0 0 . 0 % 4 1 0 .5 % 9 2 3 . 7 % 22 5 7 .9 % 3 7 . 9 0 %
12 0 0 . 0 % 3 7 . 9 0 % 17 4 4 .7 % 14 3 6 . 8 % 3 7 . 9 0 %
13 0 0 . 0 % 5 1 3 . 2 % 9 2 3 .7 % 21 5 5 .3 % 3 7 . 9 0 %
14 0 0 . 0 % 3 7 . 9 0 % 8 2 1 . 1 % 22 5 7 .9 % 5 1 3 . 2 %
15 0 0 . 0 % 1 2 . 6 0 % 8 2 1 .1 % 25 6 5 . 8 % 4 1 0 . 5 %
Reproduced with permission of the copyright owner. Further reproduction prohibited without permission.

66
Group 1
Q Q Q Q Q Q Q Q Q Q Q Q Q Q Q
Group 1 3.8 4 3.9 3.9 4.2! 3.8 3.6 3.8 3.8 3.5; 3 .6 13.5; 3.6;3.8; 3.8
I Group 1 !|
Figure 8 . Summary of m eans for group 1 (Self -reported knowledge).
Dif ferences in Self -Reported Knowledge
Microsoft Word 97
The number of responses and the percentage rank
displayed in Table 14. Figure 9 showed the m eans. This section of
the study consists of 12 questions and each question rated by using
Likert Scale.
When answering Question 1, 4 8 .6 % strongly agreed that
they were familiar with the various parts of the beginning Word 97
interface. The responses to Question 2 were 4 8 .6 % agreed that
they can identify the enhancem ent that word 9 offers over previous
versions of word. For Question 3, responses w ere 6 2 .9 % who
agreed that they can perform basic text entry and editing tasks. In
Question 4, responses were 65 .7% how strongly agreed that they
know how to use the undo command. In Question 5, responses
Reproduced with permission of the copyright owner. Further reproduction prohibited without permission.

67
were 5 1 .4 % who strongly agreed that they are famil iar with the
various ways of moving and copying text. In Question 6, responses
were 5 1 .4 % who strongly agreed that they know how to use the Cut
and Paste commands and Spell ing and Gram m ar checkers. In
Question 7, Group 1 responses were 60% who strongly agreed that
they were famil iar with the Preview and Print Com mands. In
Question 8, responses were 60% who strongly agreed that they
famil iar with formatting features such as indent text, number lists,
bullet lists, font size of text, bold text. In Question 9, responses
were 60% who agreed that they famil iar with the advantages that
electronic publishing offers over traditional publishing.
In Question 10, responses were 60% who agree that they are
familiar with Word 9 7 ’s online and web publishing tools. In Question
11, responses were 60% who agree that they know how to save
documents as H T M L format. In Question 12 responses were 60%
who agree that they believe that they gained adequate knowledge
on the topic of the course.
Reproduced with permission of the copyright owner. Further reproduction prohibited without permission.
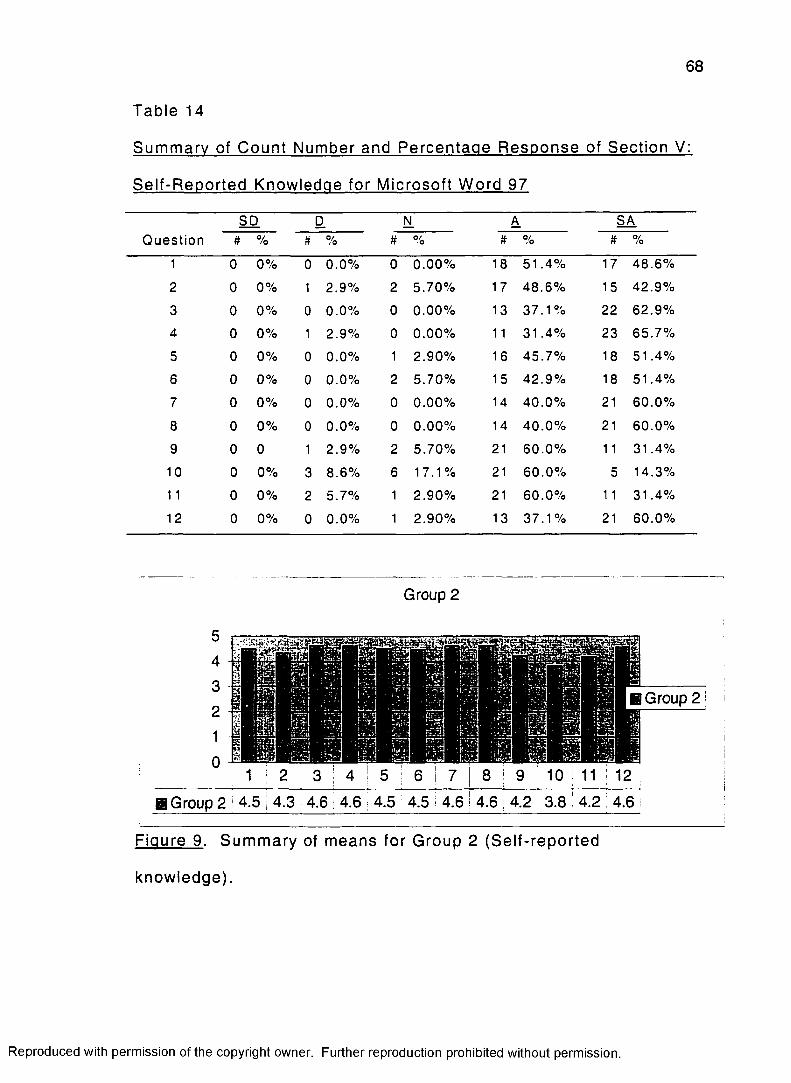
68
Table 14
Summary of Count Number and Percentage Response of Section V:
Self -Reported Knowledae for Microsoft Word 97
SD. D N A SAQuest ion # % ft % # % ft % ft %
1 0 0 % 0 0 .0 % 0 0 . 0 0 % 18 5 1 . 4 % 17 4 8 . 6 %
2 0 0 % 1 2 .9 % 2 5 . 7 0 % 17 4 8 . 6 % 15 4 2 . 9 %
3 0 0 % 0 0 .0 % 0 0 . 0 0 % 13 3 7 . 1 % 22 6 2 . 9 %
4 0 0 % 1 2 .9 % 0 0 . 0 0 % 11 3 1 . 4 % 23 6 5 . 7 %
5 0 0 % 0 0 .0 % 1 2 . 9 0 % 16 4 5 . 7 % 18 5 1 . 4 %
6 0 0 % 0 0 .0 % 2 5 . 7 0 % 15 4 2 . 9 % 18 5 1 . 4 %
7 0 0 % 0 0 .0 % 0 0 . 0 0 % 14 4 0 . 0 % 21 6 0 . 0 %
8 0 0 % 0 0 .0 % 0 0 . 0 0 % 14 4 0 . 0 % 21 6 0 . 0 %
9 0 0 1 2 . 9 % 2 5 . 7 0 % 21 6 0 . 0 % 11 3 1 .4 %
10 0 0 % 3 8 .6 % 6 1 7 .1 % 21 6 0 . 0 % 5 1 4 .3 %
1 1 0 0 % 2 5 .7 % 1 2 . 9 0 % 21 6 0 . 0 % 11 3 1 .4 %
12 0 0 % 0 0 .0 % 1 2 . 9 0 % 13 3 7 . 1 % 21 6 0 .0 %
Group 2
Group 2
1 2 3 4 5 6 7 8 9 10 11 12 !H Group 2 ! 4.5 4.3
CO■sr
CD 4.5 4.5
CD 4.6 4.2
00CO C\J 4.6
Figure 9 . Sum m ary of means for Group 2 (Self -reported
knowledge).
Reproduced with permission of the copyright owner. Further reproduction prohibited without permission.

69
Independent t test Analysis
The results of the independent t test that was used to
compare the ratings between the two groups can be found in Table
15. The independent t test on age, years of experience, and level of
education between the two groups showed no significant di fferences
between participants. But there was a significant difference in
gender by group.
Table 15
Demographic Data
Category F Q.
Age .086 .771
Gender 5 .24 .025
Years of Experience 1.51 .222
Level of education 1.58 .212
N ote , g. <. 05.
Learning Environment Independent t test Result
Table 16 contains the results of the independent t test that
was conducted on the learning environment section. There were no
significant di f ferences in the training course materials or in the
organization of material between the two groups. There were also
no significant dif ferences in the environment, which was comfortable
Reproduced with permission of the copyright owner. Further reproduction prohibited without permission.

70
and conducive to learning for both of the two groups. There were no
significant differences in the training program objectives which were
perceived to have been communicated and clearly stated between
the two groups. Also there were no significant di f ferences in the
course content in the training program, they were perceived to be
complete and organized between both programs. There were no
significant differences in the training program included a
manageable amount of information between both programs as well.
There were no significant di fferences in the training delivery method
between both programs. There were no significant differences
between the two groups that the training programs fit the
part ic ipants’ personality. There were no significant di fferences in
the understanding of the material due to the instructional methods
used in this training program between both programs. In general,
there were also no significant d i fferences between the learning
environments of the two groups.
Reproduced with permission of the copyright owner. Further reproduction prohibited without permission.

71
Table 16
Learning Environment Independent t test Results
C a t e g o r y F 2
1. T h e conten t of the t ra in in g p r o g r a m w a s p r e s e n t e d in and in terest ing
. 0 6 4 .80
2. T h e training c o u rse m a t e r i a l s w e r e d e l i v e r e d in an o r g a n iz e d way
. 0 2 8 .87
3. T h e e n v i r o n m e n t w a s c o m f o r t a b le a n d c o n d u c iv e to learn ing
2 .0 1 .16
4. T ra in in g p r o g r a m o b je c t i v e s w e r e c o m m u n i c a t e d an d c lear ly s ta ted
1.51 .22
5. T h e course c o n te n t in the t ra in ing p r o g r a m was c o m p le t e and o r g a n i z e d
.8 3 .37
6. T h e training p r o g r a m in c lu ded a m a n a g e a b l e a m o u n t of in fo rm a t io n
. 0 8 6 .77
7. T h e training d e l iv e r y m e t h o d is a p p r o p r i a t e for the m a te r ia l re q u i red for this t rain ing p r o g r a m
2 . 1 7 .15
8. T h e training p r o g r a m fits my p e r s o n a l s c h e d u l e 2 . 9 7 .09
9. M y u n d e rs tan d in g of th e m ate r ia l is e n h a n c e d d u e to the ins truct iona l m e t h o d s used in th is t ra in ing p ro g ra m
1 . 9 6 .17
Level of Interactivity Between Students
An independent t test was conduct on the level of interactivity
between students section (see Table 17). Group 2 had the score in
reporting that there were significant dif ferences were found in
contribution to class interaction with other students between the two
groups. Also there were significant di f ferences in interaction with
Reproduced with permission of the copyright owner. Further reproduction prohibited without permission.

72
other students outside the content of the class in both training
programs. There were no significant differences in the amount of
student-to-student interaction compared to other training courses
that participants had before. There were no significant di fferences
in the amount of interaction between student and instructor between
both groups. Th ere were no significant differences on the
considerable amount of students’ interaction within courses in both
groups. There were no significant differences on the amount of
student’ interaction for all students beyond class in both groups.
There were no significant dif ferences on training method in both
groups. In general, there were no significant differences on
interactivity between students in both groups.
Reproduced with permission of the copyright owner. Further reproduction prohibited without permission.

73
Table 17
Level of Interactivity Between Students
Category F P
1. I made considerable contribution to class interaction with other students
5 .45 .02
2. I had the opportunity to interact with other students outside the content of the class
.4 .82 .03
3. There was a considerable amount ofstudents-to-students interaction compare to other training courses I have experienced
2 .4 4 .12
4. There were a considerable amount of interaction between student and instructor
.04 .85
5. There was a considerable amount of students’ interaction within courses
.55 .46
6. There was a considerable amount ofstudent ’ interaction for all students beyond class
.013 .91
7. The training method promotes me to be actively engaged in training program activities and assignments with other students
2 .6 2 .11
Level of Interactivity Between Student and Instructor
An independent t test was conduct on the Level of interactivity
between student and instructor section see Table 18. There were
no significant d i f ferences in the interaction with the instructor during
this type of training in both groups. There were no significant
differences in the avai labi l i ty of instructor when clarif ication was
Reproduced with permission of the copyright owner. Further reproduction prohibited without permission.
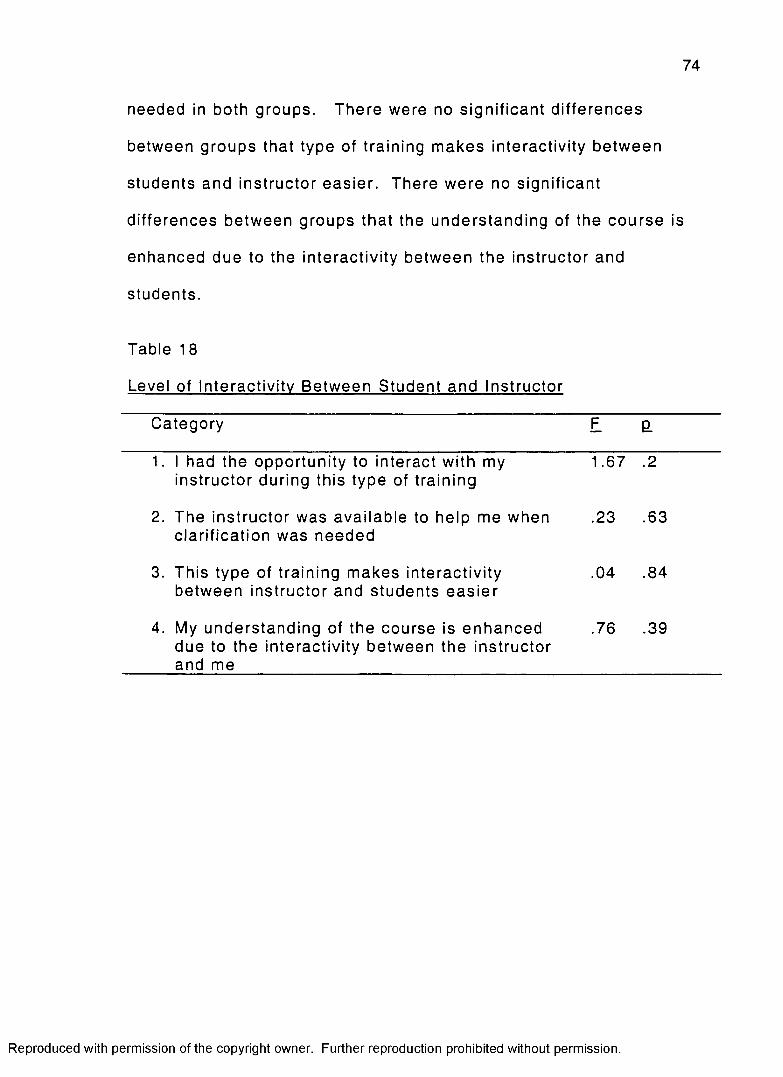
74
needed in both groups. There were no significant differences
between groups that type of training makes interactivity between
students and instructor easier. There were no significant
differences between groups that the understanding of the course is
enhanced due to the interactivity between the instructor and
students.
Table 18
Level of Interactivity Between Student and Instructor
Category F EL
1. I had the opportunity to interact with my instructor during this type of training
1.67 .2
2. The instructor was avai lable to help me when clarification was needed
.23 .63
3. This type of training makes interactivity between instructor and students eas ier
.04 .84
4. My understanding of the course is enhanced due to the interactivity between the instructor and me
.76 .39
Reproduced with permission of the copyright owner. Further reproduction prohibited without permission.

75
C H A P T E R V
S U M M A R Y , D IS C U S S IO N , C O N C L U S IO N S , AND
R E C O M E N D A T IO N S
This chapter studies the findings, their implications, and also
makes recommendations for future studies in the area of web-based
training.
Summary of Findings
As set forth in Chapter I, the purpose of this study was to
compare students’ perceptions of learning acquisition using web-
based and conventional-based delivery methods in a leading
Midwestern Electronics Company. The two training programs that
were chosen were Project M anagem en t (traditional method), and
Microsoft Word 97 (web based method). In order to accomplish this
purpose, the following research questions were developed to guide
the study:
1. Are perceptions of learning acquisition better, worse or the
same when using a web-based delivery versus using traditional
based delivery, as perceived by students?
2. Do self-reported knowledge levels differ by method of
training delivery?
3. W h a t are the perceptions of students on level of student-
to-student interaction as it relates to method of delivery?
Reproduced with permission of the copyright owner. Further reproduction prohibited without permission.

76
4. W hat are the perceptions of the students on the level of
instructor- to-student interaction as method of delivery?
Four important sections of the survey were identified and
developed after a review of the related l iterature and validate by the
advisory committee members. These sections were comprised of (a)
learning environment, (b) student to student interaction, (c) student
to instructor interaction, and (d) self-reported knowledge.
The total number of part icipants used for this study reflects an
important representation of web-based and conventional training
method in the Midwestern Electronics Company. The study was
conducted to see if there was a significant dif ference between the
two training methods.
Summary of Demographics
There were 38 (38%) responses out of a total 100 subjects
from the conventional training method (project m anagem ent) , and 35
(35%) responses out of a total 100 subjects from the web-based
training method (Microsoft Word 97) . Furthermore, a .05 level of
significance was used to identify significant di fferences between the
two groups.
The majority of the part icipants in Group 1 were males (6 8 .4% )
But the number of males and females in Group 2 were almost equal
(5 1 .4 % , 4 8 .6 % ) . Most of the participants in both groups were
middle-aged and mostly distributed equally in both programs. In
Reproduced with permission of the copyright owner. Further reproduction prohibited without permission.
77
Group 1 majority of participants were 41 and older (5 5 .3 3 % ) , and
between 3 1 -40 years (28 .95% ), and in Group 2 were 41 and older
(51 .44% ), and between 3 1 -40 years (3 1 .4 4 % ) . The majority of
subjects in Group 1 had work experiences between 11 years or more
(55 .33% ), and the majority of Group 2 similarly had work
experiences between 11 years or more (4 0 % ) . Most of participants
in Group 1 hold a Bachelor degree (60 .5% ) . Similarly, the majority
of Group 2 holds a Bachelor degree (5 4 .3 % ) .
Summary of Questionnaire Findings
The questionnaire results indicated many interesting findings
for the two groups. The conventional training group reported a
lower overall percentage than the web-group on the following
sections:
• The learning environment.
• Student- to -student interactions.
• Students-to- instructor interactions.
• Self -reported knowledge.
In the learning environment section the q. va lue showed no
significant d i f ferences in all of the nine questions. Nevertheless,
the student to student interactions section had two questions out of
seven with significant differences. The two questions are the
contribution to class interaction with other students between the two
groups and the interaction with other students outside the content of
Reproduced with permission of the copyright owner. Further reproduction prohibited without permission.

78
the class in both training programs. In the student to instructor
interaction, there were no significant d i fferences in any of the four
questions. By comparing the means of the self -reported knowledge
between the two groups, Group 2 scored higher means than Group
1 .
Discussion
The purpose of this study was to compare t ra inees ’
perceptions of learning in a web-based delivery program with
conventional-based del ivery training program with respect to the
learning environment that consisted of four categories namely,
content, interactivity between students, interactivity between
instructor and students, and self -reported knowledge.
In this study, the findings were that the majority of the
participants in Group 1 were males but the number of males and
females in Group 2 were almost equal. The reason that males are
more than females in Group 1 is attributed to the nature of this
training program. Most of the trainees who attended this training
program were m anagers .
Both groups had similar work experience, similar educational
degrees, and most of the participants in both groups were middle-
aged and mostly distributed equally in both programs
The results showed no significant dif ference between the two groups
in all four categories by using independent t test. Even though, the
Reproduced with permission of the copyright owner. Further reproduction prohibited without permission.
79
result show no significant differences between the two groups but
still web-based method scored higher means in almost all questions
in the questionnaire . I think this is a positive indication in favor of
the web-based training to score higher mean than the conventional
method because the web-based method was implemented only 18
months ago. As mentioned earl ier in the review of the l iterature,
training needs to be fundamentally restructured to support living in
the information age, an age where knowledge, change, and flexible
access to learning are cornerstones to its abil ity to function.
Kolbasuk stated that after Amoco the oil company implemented
online training, its traditional classroom training decreased by about
30%. Also the financial services company PNC Bank Corp. in
Pittsburgh, for example, recently installed Learning Space, a W eb-
based solution for creating and delivering self-paced online training
from Lotus Development Corp. The system, used to train 700
employees on a new commercia l loan system and business
processes, will save PNC as much as 4 0 % per user in training
expenses compared with classroom instruction (Kolbasuk,1999, p.
101 ).
In addition, the result of this study shows that w eb-based
method is scoring higher means than the conventional method in the
student-to-student interactivity category. T h e advantage of
flexibility that the web-based method has over convent iona l-based
Reproduced with permission of the copyright owner. Further reproduction prohibited without permission.

80
is believed to be the main reason for the higher mean scoring in this
category. W eb-based method training are becoming increasingly
popular for a variety of reasons. Perhaps the most common
application deals with geographically dispersed workforces,
frequently updated content, and on-going/high-volume training
needs. The Web-based method can be accessed any time of the
day or night from virtually anywhere. It can be updated quickly and
easily without concerns about shipping and replacing materials.
Finally, a single learner or a thousand learners can use it at the
same time. There is no need to schedule training rooms, t imes, or
trainers.
The American Society of Training and Development suggests
that while the percentage of computer-based training and self -paced
training in other formats has remained constant at 3% and 7%
respectively, the percentage of internet/network distance education
has increased from 0 .4% to 2% during the period from 1994 to 1996.
This percentage is likely to increase even more in the coming years
(Hall , 1997) . Gartner Group Inc. predicts that technology-based
training, including W eb-based solutions, will represent half of all
training by 2002, up from 2 5 % last year. Th e other half will continue
to come from instructor-led methods (Kolbasuk, 1999, p. 101).
In short, information technology learning offered through the
W W W is growing popular due to the benefits that the web offers.
Reproduced with permission of the copyright owner. Further reproduction prohibited without permission.

81
These include asynchronous communications, and teacher lead
capabi l i t ies and self -paced study. In addition, this type of training is
inexpensive compared to c lassroom-based instruction. The
international Data Corp. predicts that the market for web-based
training will grow to $ 1 .7 billion in 2 0 0 2 (Kolbasuk, 1999, p. 101).
Conclusions
Based on the statistical analysis of data in chapter four, the
conclusions of this study were formulated according to the research
questions which were used to guide this study which are restated in
the following paragraphs with the conclusions derived from this
study:
1. Are perceptions of learning acquisition better, worse, or the
same when using a web-based del ivery versus using traditional
based delivery, as perceived by students?
Based on the data collected from this study, the conventional
based group and the web-based group achieved similar learning
acquisition outcomes as measured in an independent t test at the
g.<.05 significance level.
2. Do self-reported knowledge levels differ by method of
training delivery?
Group 1 reported a lower mean and percentage than Group
Group 2 who had a better understanding of the course material and
content. Students in the web-based group also reported a mean
Reproduced with permission of the copyright owner. Further reproduction prohibited without permission.

82
between 4 .2 -4 .6 while the students in the conventional-based group
reported mean between 3 .4 5 -3 .9 4 .
3. W hat are the perceptions of students on the level of
student-to-student interaction as it relates to method of delivery?
The conventional group reported a lower p. value than the web-
based group on: making considerable contribution to class
interaction with other students and on having the opportunity to
interact with other students outside the content of the class. There
were no significant dif ferences in the other questions. Also by
comparing the means, the web-group reported a higher, percentage
and mean.
4. W hat are the perceptions of students on the level of
instructor-to-student interaction as method of delivery?
The conventional group reported lower means than the web-
based group regarding the understanding of the courses is
enhanced due to the interactivity between the instructor and
students. In addition, the type of training that makes interactivity
between instructor and students easier, the opportunity to interact
with the instructor during this type of training, and the availabil ity of
instructor was available to help when clarif ication was needed.
The demographics of this study revealed many findings that
support the l iterature and reviewed. Based on data gathered from
this study, conventional group students are mostly male , over the
Reproduced with permission of the copyright owner. Further reproduction prohibited without permission.

83
age of 41 years. Th e majority of subjects in both groups holds a
Bachelor degree, and has 11 years of work experience.
In the web-based group the students are equally divided
between male and female, over the age of 41 years, the majority of
subjects in both groups hold a Bachelor degree, and their years of
experience had 11 years or more of work experience.
None of the groups showed a significant d if ference in the
learning environment section. In addition, there was no significant
difference in the student-to-student interaction in both groups.
Nevertheless, in the self-reported knowledge Group 2 reported a
higher percentage than Group 1. In the students-to-instructor
section only two questions had reported a significant differences
between the two groups.
In conclusion, the results show that there are no differences
between the two groups by using the independent t test, but when
comparing means, the web-based group reported a higher mean in
all most every question in the survey.
Recommendations
1. A similar study to this one might examine learning
outcomes by comparing more than two training programs in the
company investigated.
Reproduced with permission of the copyright owner. Further reproduction prohibited without permission.

84
2. Future studies could build on this research and compare
other “skills" vs. “concepts" courses for similarit ies to the findings
in this study.
3. It is recommended that another study should be conducted
between group of companies and with different training programs to
find which training method is suitable for them.
4. While the response rate was low in each group, the
research results are still important. Further studies might replicate
this study and see if in fact there is a positive relationship to this
study’s findings. Either multiply the numbers of participants of the
study or study more than two training program.
5. It is recommended that similar training programs be
compared for investigating the self reported knowledge between the
participants.
6. Dif ferent training methods such as computer based training,
and virtual training, should be studied and compared with web-
based training and conventional training methods.
Reproduced with permission of the copyright owner. Further reproduction prohibited without permission.

85
R E F E R E N C E S
Becker, F., Herbert , J., Kent, T., Kinzie, M. B., Larsen, V. & M cNergney, R. F. (1996 , March). Project C ap e Town: Designing a teacher education case for the W W W . Paper presented at the meeting of The Seventh C onference of the Society for Information Technology and T e a c h e r Education (S IT E) , Phoenix , AZ.
Belardo, S., & Belardo, A. (1997) . Trust: The kev to change in the information age. Albany, NY: Sebastian Rose.
Bell, C., Bowden, M., & Trott, A. (19 97 ) . Implementing flexible learn ing. London: Kogan Page Limited.
Belson W. (1 9 81 ) . The design and understanding of survey Questions. Hants, England: Gower.
Berge, Z. L., & Coll ins, M. (1998 ) . Wired together: Th e online classroom in K -1 2. Cresskill . NJ: Hampton Press, Inc.
Bills, C. (1 9 97 ) . Effects of structure and interactivity on internet- based instruction. Doctoral dissertation, Kent State University, Canton, OH.
Boak.C ., & Kirby, D. (1989) . Teaching by te leconference: What goes on. Proceedings of the 8 th Annual Conference of the Canadian Association for the Study of Adult Education. University of Ottawa, Cornwall , Ontario, C an ada , p. 2 6 -3 2 .
Boeheler, T. (1 9 9 9 ) . Design plan for online distance learning program de l ivery . Doctoral dissertation, Pepperdine University, Culver City, CA.
Bradburn, N. ( 1 9 7 9 ) . Improving interview method and Questionnaire des ign . San Francisco: Jossey-Bass.
Reproduced with permission of the copyright owner. Further reproduction prohibited without permission.

86
Brooks, D. W. (1997 ) . Web-teaching . A guide to designinginteractive teaching for the world wide w e b . New York: Plenum Press.
Collins, M. (1 9 95 ) . Computer -mediated communication and online classroom: Overview and perspect ives. In Z. L. Berge & M. P. Collins (Eds.) , Com puter-media ted communication and the online classroom in distance education (p. 49) . C resski 11, NJ: Hampton.
Corrigan, D. (1 9 96 ) . The Internet university: College courses by com puter . Harwich, MA: C ape Software Press.
Dale, E. (1 9 78 ) . The good mind. Bloomington, IN: Phi Delta Kappa Educational Foundation.
Davis, S., & Botkin J. (1994, Septem ber-O ctober) . The coming of the knowledge-based business. Harvard Business Review. 7 2 . (170) , 45.
Dillman D. (2 0 00 ) . Mail and Internet surveys: The tailored design method. New York: J. Wiley.
Driscoll, M. (1 9 98 ) . W eb-based training: Using technology to design adult learning experiences. San Francisco: Jossey-Bass.
Drucker, P. F. (19 89 ) . The new realities: In government and politics. In economics and business. In society and world v ie w . New York: H arper & Row.
Eastmond, D. V. (1995) . Alone but together: Adult distance study through computer conferencing. Cresskill , NJ: Hampton Press.
Reproduced with permission of the copyright owner. Further reproduction prohibited without permission.

87
Floridi, L. (1 9 9 6 ) . The Internet and the future of organized knowledge TOn-linel. Avai lable: http:/ /www.intwrl.com
French, D., Hale, C., Johnson, C., & Farr, G. (1999 ) . Internet based learning: An introduction and framework for higher education and business. Sterling, VA: Stylus Publishing, LLC.
Fuller, J., & Farrington, J. (1 9 9 9 ) . From training to performance improvement. San Francisco: Jossey-Bass Pfeiffer.
Hall, B. ( 1 9 9 7 ) . W eb-based training cookbook. New York: John Willey & sons, Inc.
Hamala inen, M., Whinston, A. B., & Vishik, S. (1996) . Electronic markets for learning: Education brokerages on the Internet. Communications of the A C M . 3 9 (6). 29
Harasim, L. M. (1994) . Online education: Perspectives on new env ironm ent . New York: Praeger Publishers.
Heckman, B., & Owens, D. (1 9 9 6 ) . C O M E T Presentation:Pedagogical contributions of educational environments: The traditional classroom. Computer-based learning and the World W ide W eb . U CAR/Coopera t ive Program for Operational Meteorology, Education and Training Boulder, CO. presented to the American Meteorological Association meeting in January 1996 .
Hiemstra, R. (1994) . Computer ized distance education: The role for facil itators. MPAEA Journal. 4 9 (8). 11-21.
Hiltz, S .R . (1994 ) . The virtual classroom: Learning without limits via computer networks. Norwood, NJ: Ablex Publishing.
Reproduced with permission of the copyright owner. Further reproduction prohibited without permission.

88
Howard. F. (1997) . D istance learning annotated bibliography. (DTIC No. A D A 3 3 0 0 4 5 ) , White Sands Missile Range, NM: Department of the Army.
Hughes, C., & Hewson, L. (1998 ) . Online Interaction: Developing a Neglected Aspect of the Virtual Classroom. Educational Technology. 3 8 (4). 48 -55 .
Kettanurak, V., (1 9 96 ) . An Empirical Investigation of the Degree of Interactivity in an Interactive Multimedia Instructional Program Dissertation Abstracts Internat ional . 5 7 (04). 1730. (Dissertation Abstracts International Item: A A G 9 6 2 5 6 9 7 )
Khan, B. H. (1997) . W e b based instruction. Englewood Cliffs, NJ: Educational Technology Publications.
Kirkpatrick. D. (1998 ) . Evaluating training programs the four levels. San Francisco: Berrett -Koehler Publishers.
Klinger, T. H., & Connet , M. R. (October, 1992) . Designing distance learning courses for critical thinking. The Journal. 3 8 (15), 52- 58.
Kolbasuk, M. (Jan 25, 1999) . Train On The W e b — More Companies Are Teaching Their Employees Online- And Saving Money. In formationWeek 2 9 ( 1), 101
Lakoff, G., & Johnson, M. (1 9 80 ) . Metaphors we live bv. Chicago: University of Chicago press.
Leiner, B., Cerf, V., Clark D., Kahn R., Kleinrock L., Lynch D., J. Postel, Roberts L., & Wolff S. (2000) . A Brief History of the Internet. Internet soc ie ty . [Online]. Avai lable at http:/ /www.isoc.org/internet-historv/brief.html
Reproduced with permission of the copyright owner. Further reproduction prohibited without permission.
89
Lewis, J. H., & Romiszowski, A. (1996) . Networking and thelearning organization: Networking issues and scenarios for the 2 1 st century. E-J IST Abstracts. 1 (4) 1.
Liedner, D. E., & Jarvenpaa, S. L. (1995) . The use of information technology to enhance m anagem ent school education: A theoretical view. MIS Quarterly. 1 9 (3 ) . 2 6 5 -2 9 1 .
Main, R. G., & Ruse, E. 0. (1 9 95 ) . A study of interaction in distance learning. Chico: Cal ifornia State University.
Markert, L. (1 9 9 7 ) . Contemporary technology innovations, issues, and perspectives. Tinley Park, IL: The Goodheart -Wil lcox Company.
Marquardt M., & Kearsley, G. (19 99 ) . Technology-based learning. New York: St. Lucie Press.
Mayfield, J., & Ali, K. (1996, October) . Internet as an educational tool. C om puter & Industrial Engineering. 3 1 (1 -2 ) , 21 -24 .
Nixon, D. E. (1 9 9 2 ) . National survey on distance educationpractices, simulteaching: Access to learning by means of interactive television. Community Junior College Quarterly of Research and Practice. 1 6 (2). 167-175 .
Owston, R. (1 9 9 8 ) . Making the link: Teacher professionaldeve lopment on the In ternet . Portsmouth, VA: Heinemann.
Papert, S. (1 9 9 3 ) . The children's machine: Rethinking school in the aoe of the com puter . N ew York: Basic Books.
Philson, R. (1 9 9 9 ) . Factors affecting academic collaboration viacommunication technologies. Doctoral dissertat ion, University of Illinois: Urbana-Cham paign, Illinois.
Reproduced with permission of the copyright owner. Further reproduction prohibited without permission.

90
Porter, L. (1997). Creating the virtual classroom: Distance learning with the Internet. New York: Wiley Com puter Publishing.
Porter, M. E. (1980) . Competit ive strategy. New York: The Free Press.
Randall , N. (1997) . The soul of the Internet: Net gods, netizens and the wiring of the world . Boston: In ternational Thomson Computer Press
Redding, G. A., & Fletcher, J. D. (1994) . Technical andadministrative issue in distributed training technology. In R. J. Seidel & P. R. Chate l ier (Eds.), Learning without boundaries: Technology to support distance/distributed learning (pp. 79- 94). New York: Plenum.
Rowland, L. M. (1994) . Libraries and l ibrarians on the Internet. Communication Education, 4 3 . 1 4 3 -1 5 0 .
Sarna , D., & Febish, G. (1 9 97 , September) . Past is prolog? Datamation. 4 3 (9). 22 -24 .
Schre iber D., & Berge Z. (1998 ) . Distance training. San Francisco: Jossey-Bass Publishers.
Stanley, D. (1994). The monster under the bed: How business is mastering the opportunity of knowledge for profit. New York: Simon & Schuster
Steed C. (1999) . W e b -b a s e d training. Brookfield, VT: Gower Publishing Limited.
Stewart , R. (1996, N ovem ber 21). Leadership project fOn-linel . Available: http: / / lph.centry.com.ldrshp.html
Reproduced with permission of the copyright owner. Further reproduction prohibited without permission.

91
Stoll, C. (1995) . Sil icon snake oil: Second thoughts on the information highway. New York: Doubleday.
Toffler, A. (1970) . Future shock. New York: Bantam Books.
Villani, C. (1 9 98 ) . A synthesized curriculum for the 21st century. Lanham, MD: University Press of America.
Wagner, E. D. (1 9 9 2 ) . Separating myth and reality in distance education. Educational Technology. 3 2 (10). 42 -45 .
Wagner, E. D. (1 9 9 3 ) . Variables affecting distance education program success. Educational Technology. 3 3 (4), 28 -32 .
Wells, R. A. (1 9 90 ) . Distributed training for the reserved component: Remote delivery using asynchronous computer conferencing (No. 2 q 2 6 3 7 4 a 7 9 4 ) . Idaho National Engineering Laboratory, Idaho Falls, ID.
Wetzel, C. D., Radke, P. H., & Stern, H. W. (1994) . Instructionaleffect iveness of video m e d ia . Hillsdale, NJ: Lawrence Eribaum Associates.
Wilson, J. (March, 1999) . Internet training: The time is now. HR Focus. 7 6 (3) 6.
Reproduced with permission of the copyright owner. Further reproduction prohibited without permission.

92
A P P E N D IX A
The Quest ionnaire
Traditional Training (Project Management) :
A C o m p a r is o n of W e b -b a s e d and c o n v e n t io n a l b a s e d t ra in in g m e th o d s in a leading M id w e s t e r n E lec t ro n ic C o m p a n y
Dear participant:The attach survey has been designed to compare two training methods to
find out which method is suitable for the training chal lenges of this century. The survey consists of two sections, demographics of part icipants and a learning environment evaluat ion.
Di rect ions: For the following questions address your personal experience and how you feel about various types of interactions (e-mai l , discussion forums, face-to-face, etc. ) w ith in on ly the t ra in in g p r o g r a m s t h a t you have had. Consider " t r a in in g s e s s io n 1' to d e f in e the g ro u p of t r a in e e s enro l led wi th you in the t r a i n i n g pro gram - even if you do not m e e t or work wi th th em outside of th e t ra in in g p rogram .
All personal information will be kept strictly conf idential and will not be made available to a third party. Please answer those questions relative to T H IS t raining p r o g r a m . Your honest opinion is greatly valued and will help future trainees in this training program.
Section I: D E M O G R A P H IC S T rad i t io n a l T ra i n i n g (P ro jec t M a n a g e m e n t )
The following is a set of quest ions about you. Please answer each of them by checking the option that represents YOU the most:
1. Age:□ 20 or Younger□ 21 To 30□ 31 To 40□ 41 or Older
3. Years in Profession:□ Less than 1 year□ 1-5 Years□ 6-10 Years□ 11 Or More
5. Instructor names:□ A□ B□ C
Reproduced with permission of the copyright owner. Further reproduction prohibited without permission.
2. G endera Male □ Female
4. Level of education attained:□ High School□ Some College□ Bachelor ’s degree□ Post-Graduate□ O t h e r s : _____________

93
Section II: Learning Environment Evaluation
P le ase circle the n u m b er th a t re p r e s e n ts y o ur op in ion:
Content
Project Management
Traditional Training
SD D N A SA
1. The content of the training program was presented in an interesting way.
2. The training course mater ials were del ivered in an organized way.
3. The environment was comfortable and conducive to learning.
4. Training program object ives were communicated and clearly stated.
5. The course content in the training program was complete and organized.
6. The training program included a manageable amount of information.
7. The training delivery method is appropriate for the material required for this training program.
8. The training program fits my personal schedule.
9. My understanding of the material is enhanced due to the instructional methods used in this training program.
1 2 3 4 5
1 2 3 4 5
1 2 3 4 5
1 2 3 4 5
1 2 3 4 5
1 2 3 4 5
1 2 3 4 5
1 2 3 4 5
1 2 3 4 5
Reproduced with permission of the copyright owner. Further reproduction prohibited without permission.

94
S t u d e n t - to -S tu d e n t Interact iv i ty
Project Managem ent Tradit ional Training
SD D N A SA
1. I made considerable contribution to class interaction with other students. 1 2 3 4 5
2. I had the opportunity to interact with other students outside the content of the class. 1 2 3 4 5
3. There was a considerable amount of students-to- student interaction compare to other training courses I have experienced. 1 2 3 4 5
4. There were a considerable amount of interaction between student and instructor. 1 2 3 4 5
5. There was a considerable amount of students’interaction within courses (e.g. discussion, activities, projects, etc). 1 2 3 4 5
6. There was a considerable amount of students’ interaction for all students beyond class. 1 2 3 4 5
7. The training method promotes me to be activelyengaged in training program act ivities and assignments with other students. 1 2 3 4 5
Instructor-to-Student Interactivitv
Project Managemen t Tradit ional Training
SD D N A SA
1. I had the opportunity to interact with my instructor during this type of training.
1 2 3 4 5
2. The instructor was avai lable to help me when clarification was needed.
1 2 3 4 5
3. This type of training makes interactivity between instructor and students easier .
1 2 3 4 5
4. My understanding of the course is enhanced due to the interactivity between the instructor and me.
1 2 3 4 5
Reproduced with permission of the copyright owner. Further reproduction prohibited without permission.

95
Self Reported Knowledge
B. Project Management
Project Management Tradit ional Training
SD D N A SA
1. I know how to build an ef fect ive team. 1 2 3 4 5
2. I know how to use individual contributors 1 2 3 4 5
3. I am familiar with determining the events and activities required complet ing a project.
1 2 3 4 5
4. I feel confident that I have the knowledge necessary for developing a network showing interdependencies
1 2 3 4 5
5. I have the basic understanding of determining the critical path through the network.
1 2 3 4 5
6. I have the basic understanding of estimating durations.
1 2 3 4 5
7. I have the basic understanding of calculating the extra time (float) avai lable to complete any non- critical activities.
1 2 3 4 5
8. I am familiar with conversion of the project plan into a schedule.
1 2 3 4 5
9. I am familiar with developing integrated recovery plans using multiple options for dealing with schedule sl ippage, resource overloads, etc.
1 2 3 4 5
10.1 know how to use post-project review to conduct t ime-cost /benef it analysis and construct project planning templates
1 2 3 4 5
11 I am familiar with analyzing risks and developing multiple approaches to risk management.
1 2 3 4 5
12.1 am familiar with analysis of variance. 1 2 3 4 5
13 I am familiar with communicat ing a maximum amount of useful information.
1 2 3 4 5
14.1 am familiar with appreciat ing the utility of project management software.
1 2 3 4 5
15 I believe I gained adequate knowledge on the topic of the course.
1 2 3 4 5
Reproduced with permission of the copyright owner. Further reproduction prohibited without permission.

96
W eb-based training (Microsoft word 97):A C o m p a r is o n of W e b -b a s e d and c o n v e n t io n a l based t ra in ing m e th o d s in a l ead ing M idwestern E lec t ro n ic C o m p a n y
Dear participant:The attach survey has been designed to compare two training methods to
find out which method is suitable for the training challenges of this century. The survey consists of two sections, demographics of participants and a learning environment evaluation.
nif’Qr'flonp* Co* ♦ U o f n 11 I«fi « r* Q V QQ QLa/ I I COHWMQ. i Wl Uig IWHWVVIII LjUCJUWIlO duuibvo jfVJUl pClOUIldl CApCI ICIIUC
and how you feel about various types of interactions (e-mai l, discussion forums, face- to -face , etc.) w ith in on ly the t ra in in g p r o g r a m s that you have had. C o n s id e r "training sess io n" to d e f in e the g ro u p of t ra in ee s e n ro l led with you in the train ing p ro g ram - even if you do not meet or w o rk with them o u ts id e of the t rain ing p ro g ram .
All personal information will be kept strictly confidential and will not be made avai lable to a third party. P lease answer those questions relative to T H IS t ra in in g p r o g r a m . Your honest opinion is great ly valued and will help future t rainees in this training program.
Please feel free to contact me with any quest ions or comments that you might have by calling me at (319) 22 2 -5 9 4 5 , emai ling me at hani l 11 ©hotmai l .com. or mailing me at 221 E St., Cedar Falls, IA 50613 . Section I: D EM O G R A PH IC S
W e b - b a s e d training ( M ic r o s o f t w ord 97)
The following is a set of questions about you. Please answer each of them by checking the option that represents YOU the most:
1. Age:□ 20 or Younger□ 21 To 30□ 31 To 40□ 41 or Older
3. Years in Profession:□ Less than 1 year□ 1 -5 Years□ 6-10 Years□ 11 Or More
5. Instructor names:□ A□ B□ C
2. Gender□ Male□ Female
4. Level of education attained:□ High School□ Some Col legea Bachelor ’s degree□ Post-Graduate□ Others:
Reproduced with permission of the copyright owner. Further reproduction prohibited without permission.

97
Section II: Learning Environment Evaluat ion
Please ci rc le the n u m b e r tha t r e p re s e n t s your o p in ion:
Content
Project Management
Traditional Training
SD N A SA
1. The content of the training program was presented in an interesting way.
2. The training course materials were delivered in an organized way.
3. The environment was comfortable and conducive to learning.
4. Training program objectives were communicated and clearly stated.
5. The course content in the training program was complete and organized.
6. The training program included a manageab le amount of information.
7. The training del ivery method is appropriate for the material required for this training program.
8. The training program fits my personal schedule.
9. My understanding of the mater ial is enhanced due to the instructional methods used in this training program.
2
2
2
2
2
2
3
3
3
3
3
3
3
3
3
4 5
4 5
4 5
4 5
4 5
4 5
4 5
4
4
5
5
Reproduced with permission of the copyright owner. Further reproduction prohibited without permission.

98
Stu d en t - to -S tu d e n t Interact iv i ty
Project Management T raditional
T raining
SD D N A SA
1. I made considerable contribution to class interaction with other students.
2. I had the opportunity to interact with other students outside the content of the class.
3. There was a considerable amount of students-to- student interaction compare to other training courses I have experienced.
4. There were a considerable amount of interaction between student and instructor.
5. There was a considerable amount of students' interaction within courses (e.g. discussion, activit ies, projects, etc).
6. There was a considerable amount of students’ interaction for all students beyond class.
7. The training method promotes me to be actively engaged in training program activities and assignments with other students.
2 3 4 5
2 3 4 5
2 3 4 5
2 3 4 5
2 3 4 5
2 3 4 5
2 3 4 5
Reproduced with permission of the copyright owner. Further reproduction prohibited without permission.

99
Instruct o r - to -s tu d en t interact ivi ty
Project Managem ent
T raditional T raining
SD D N A SA
1. I had the opportunity to interact with my instructor during this type of training.
1 2 3 4 5
2. The instructor was avai lable to help me when clarif icat ion was needed.
1 2 3 4 5
3. This type of training makes interactivity between instructor and students easier.
1 2 3 4 5
4. My understanding of the course is enhanced due to the interactivity between the instructor and me.
1 2 3 4 5
Reproduced with permission of the copyright owner. Further reproduction prohibited without permission.

100
Self Reported Knowledge
Beginning Microsoft Word 97
Microsoft word 97 W eb-based training
SD D N A SA
1. I am famil iar the various parts of the Beginning Word 97 interface.
2. I can identify the enhancement that Word 97 offers over previous versions of Word.
3. I can perform basic text entry and editing tasks.
4. I know how to use the Undo command.
5. I am famil iar with the various ways of moving and copying text.
6. I know how to use the Cut and Paste commands and Spelling and Grammar Checkers.
7. I am familiar with the Preview and Print commands.
8. I am famil iar with the formatting features such as indent text, number lists, bullet lists, font size of text, bold text, etc.
9. I am famil iar with the advantages that electronic publishing offers over traditional publishing.
10.1 am famil iar with Word 9 7 ’s online and Web publishing tools.
11.1 know how to save documents as H T M L format.
12.1 believe I gained adequate knowledge on the topic of the course.
Reproduced with permission of the copyright owner. Further reproduction prohibited without permission.
2 3 4 5
2 3 4 5
2 3 4 5
2 3 4 5
2 3 4 5
2 3 4 5
2 3 4 5
2 3 4 5
2 3 4 5
2 3 4 5
2 3 4 5
2 3 4

101
A P P E N D IX B
The Raw Data
Age Distr ibut ion in Both Gro ups
AgeGroup 1 Group 2
No. % No. %20 or Younger 0 0% 0 0%
21 To 30 6 15.8% 5 14.3%
31 To 40 11 28 .9% 12 34.3%
41 or Older 21 55.33 18 51.4%
Total 38 100.0 35 100.0
Gender Distribution
Gender Group 1 Group 2No. % No. %
Male 26 68.4% 18 51.4%
Female 12 31.6% 17 48.6%
Years of Experience
Years of ExperienceGroup 1 Group 2
No. % No. %Less than 1 year 2 5.3 0 0%
1 -5 years 8 21.1% 11 31.4%
6-10 years 6 15.8 10 28.6%
11 years or older 21 55.33 14 40.0%
Total 38 100.0 35 100.0
Reproduced with permission of the copyright owner. Further reproduction prohibited without permission.

102
E d u c a tio n L e v e l o f P a r t ic ip a n ts
Education level Groupl Group 2# % if %
High school 1 2.6 2 5.7%
Some college 7 18.4 9 25 .7%
Bachelor's degree 23 60.5 19 54.3%
Post-graduate 7 18.4 5 14.3%
Total 38 100.0 35 100.0%
Reproduced with permission of the copyright owner. Further reproduction prohibited without permission.

103
Summary of Count Number and Percentage Response of Section II: Learning
Environment Evaluat ion
SD D N A SA# % # % # % # % # %
GroupGroup
12
00
0%0%
10
Question 2 .6% 1 0.0% 1
Question
12.6%2.9%
2
2318
60 .5%51.4%
1316
34 .2%45 .7%
Group 1 0 0% 0 0.0% 5 13.2% 19 50.0% 14 36 .8%Group 2 0 0% 1 2.9% 0 0 .00% 18 51.4% 16 4 5 .7 %
Group 1 0 0% 2Question
5.3% 5313.2% 22 57.9% 9 23 .7%
Group 2 0 0% 1 2.9% 7 20.0% 14 40.0% 13 37 .1 %
Group 1 0 0% 0Question
0.0% 5413.2% 25 65 .8% 8 21 .1 %
Group 2 1 2 .9% 0 0.0% 1 2 .90% 21 60 .0% 12 34 .3 %
Group 1 0 0% 0Question
0 .0% 5513.2% 20 52.6% 13 34 .2 %
Group 2 0 0% 3 6.6% 0 0 .00% 24 68.6% 8 2 2 .9 %
Group 1 0 0% 2Question
5 .3% 265 .30% 23 60 .5% 9 23 .7 %
Group 2 0 0% 0 0.0% 1 2 .90% 21 60 .0% 13 37 .1%
Group 1 0 0% 0Question
0 .0% 5713.2% 22 57.6% 10 2 6 .3 %
Group 2 0 0% 1 2.9% 4 1 1.4% 16 45.7% 14 40 .0%
Group 1 0 0% 1Question
2.6% 6815.8% 21 55 .3% 9 2 3 .7%
Group 2 0 0% 2 5.7% 2 5 .70% 12 34 .3% 19 5 4 .3%
Group 1 0 0% 1Question
2.6% 4910 .5% 18 47.4% 15 39 .5%
Group 2 0 0% 0 0.0% 1 2 .90% 21 60.0% 13 37 .1%
Reproduced with permission of the copyright owner. Further reproduction prohibited without permission.

104
S u m m a r y of Count N u m b e r and P e r c e n t a g e of Sect ion I I I : S tu d en t - to -S tu d e n t
Interactivity
SD D N A SAQuest ion # % # % # % # % # %
Group 1 0 0.0%0.0%
1Quest ion 1
2 .60% 5 13.2% 27 71.1% 5 13.2%
Group 2 0 0 0 .00% 3 8.60% 16 45.7% 16 45.7%
Group 1 0 0 .0% 7Quest ion 2
18.4% 7 18.7% 18 47 .4% 6 15.8%Group 2 0 0 .0% 1 2 .90% 1 2 .90% 16 45 .7% 17 48.6%
Group 1 1 2.6% 5Quest ion 3
13.2% 8 21.1% 16 42 .1% 7 18.4%Group 2 0 0 .0% 0 0 .00% 2 5.70% 17 48 .6% 16 45.7%
Group 1 0 0.0% 2Quest ion 4
5 .30% 5 13.2% 21 55.3% 9 23.7%Group 2 0 0 .0% 0 0 .00% 0 0 .00% 13 37.1% 22 62.9%
Group 1 0 0 .0% 0Quest ion 5
0 .0 0% 5 13.2% 23 60.5% 10 26.3%Group 2 0 0 .0% 0 0 .0 0% 1 2 .90% 13 37.1% 21 60.0%
Group 1 0 0 .0% 12Quest ion 6
3 1 .6% 19 50.0% 3 7.90% 3 7.90%Group 2 0 0 .0% 2 5 .70% 0 0 .00% 16 45 .7% 17 48.6%
Group 1 0 0 .0% 3Quest ion 7
7 .90% 6 15.8% 20 52.6% 7 18.4%Group 2 0 0 .0% 0 0 .00% 4 11.4% 23 65 .7% 8 22.9%
Reproduced with permission of the copyright owner. Further reproduction prohibited without permission.

105
Summary of Count Number and Percentage Response of Section IV: Instructor-
to-Student Interactivity
SD D N A SAQuest ion # % # % # % # % # %
Group 1 1 2.6% 1Quest ion 1
2.6% 3 7 .90% 22 57.9% 11 28.9%Group 2 0 0.0% 0 0.0% 0 0 .00% 9 25.7% 26 74.3%
Group 1 0 0.0% 0Quest ion 2
0% 1 2 .60 % 25 65.8% 11 28.9%Group 2 0 0.0% 0 0.0% 0 0 .00% 10 28.6% 25 71.4%
Group 1 0 0.0% 0Question 3
0.0% 0 0 .0 0% 7 18.4% 9 23.7%Group 2 0 0.0% 0 0.0% 0 0 .00 % 11 31.4% 24 68.6%
Group 1 0 0.0% 1Quest ion 4
2.6% 6 15.8% 19 50 .0% 12 31.6%Group 2 0 0.0% 0 0.0% 0 0 .00 % 15 42.9% 20 57.1%
Reproduced with permission of the copyright owner. Further reproduction prohibited without permission.

106
S u m m ary of Count N u m b e r and P e r c e n t a g e Res ponse of Sect io n V: Self -
Reported Knowledge for Project Man agem ent
QuestionSD D N A SA
# % # % # % # % # 0/Io
1 0 0.0% 1 2.60% 8 21.1% 26 68 .4% 3 7 .90%
2 0 0.0% 0 0.00% 3 7.90% 32 84 .2% 2 5 .30%
3 1 2.6% 0 0.00% 7 18.4% 22 57 .9% 8 21 .1%
4 0 0.0% 2 5.30% 8 21.1% 21 5 5 .3% 7 18.4%
5 0 0.0% 0 0 .00% 5 13.2% 19 50 .0% 14 36 .8%
6 0 0.0% 3 7 .90% 9 23.7% 19 50 .0% 7 18.4%
7 0 0.0% 3 7 .90% 6 15.8% 22 57 .9% 7 18.4%
8 0 0.0% 2 5 .30% 8 21.1% 22 57 .9% 6 15.8%
9 0 0.0% 0 0 .00% 12 31.6% 19 50 .0% 5 13.2%
10 0 0.0% 5 13.2% 14 36.8% 15 39 .5% 4 10.5%
11 0 0.0% 4 10.5% 9 23.7% 22 57 .9% 3 7 .90%
12 0 0.0% 3 7 .90% 17 44 .7% 14 3 6 .8% 3 7 .90%
13 0 0.0% 5 13.2% 9 23.7% 21 55 .3% 3 7 .90%
14 0 0.0% 3 7 .90% 8 21.1% 22 57 .9% 5 13.2%
15 0 0.0% 1 2 .60% 8 21.1% 25 65 .8% 4 10 .5%
Reproduced with permission of the copyright owner. Further reproduction prohibited without permission.
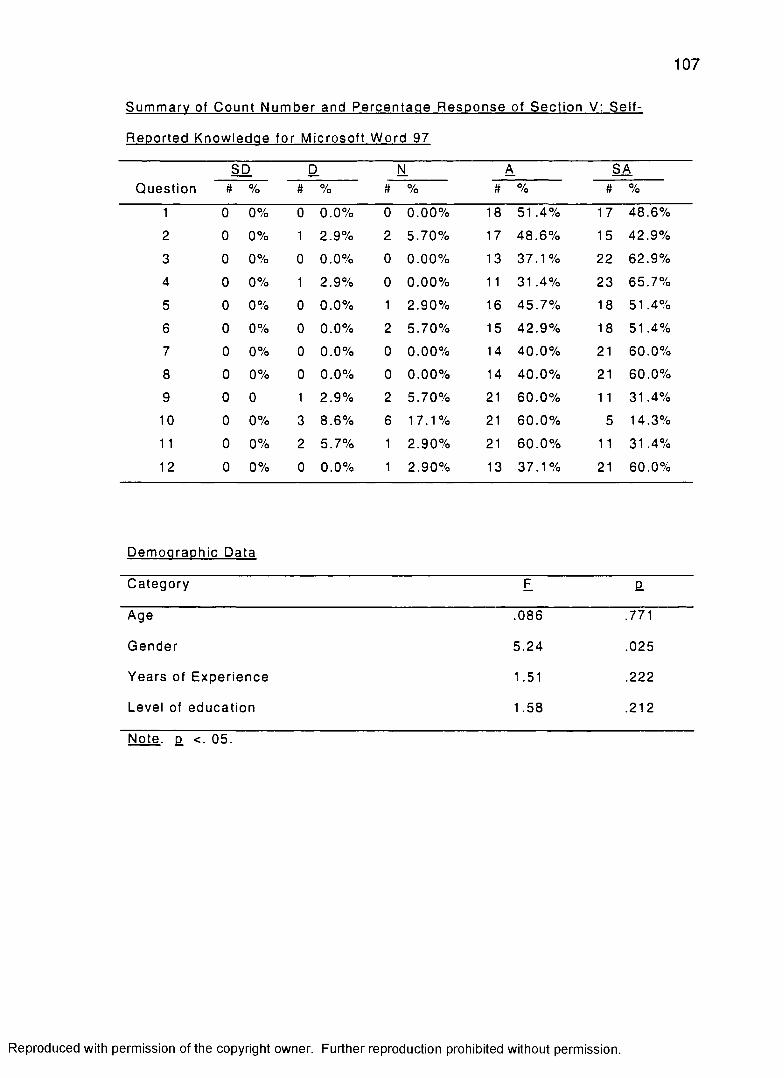
107
S u m m a r y of Count N u m b e r and P e r c e n ta g e R e s p o n s e of S ec t io n V: Sel f -
Reported Knowledge for Microsoft Word 97
QuestionSD D N A SA
# % # % # % # % # %
1 0 0% 0 0.0% 0 0 .00% 18 51 .4% 17 48.6%
2 0 0% 1 2.9% 2 5.70% 17 48 .6% 15 42.9%
3 0 0% 0 0.0% 0 0 .00% 13 37 .1% 22 62.9%
4 0 0% 1 2.9% 0 0 .00% 11 3 1 .4 % 23 65.7%
5 0 0% 0 0.0% 1 2.90% 16 45 .7% 18 51 .4%
6 0 0% 0 0.0% 2 5.70% 15 4 2 .9 % 18 51.4%
7 0 0% 0 0.0% 0 0 .00% 14 4 0 .0% 21 60.0%
8 0 0% 0 0.0% 0 0 .00% 14 4 0 .0% 21 60.0%
9 0 0 1 2.9% 2 5.70% 21 6 0 .0% 1 1 31.4%
10 0 0% 3 8.6% 6 17.1% 21 6 0 .0% 5 14.3%
11 0 0% 2 5.7% 1 2 .90% 21 6 0 .0% 1 1 31 .4%
12 0 0% 0 0.0% 1 2 .90% 13 37 .1% 21 60.0%
DemoaraDhic Data
Category F a
Age .086 .771
Gender 5.24 .025
Years of Experience 1.51 .222
Level of education 1.58 .212
Note , e. <. 05.
Reproduced with permission of the copyright owner. Further reproduction prohibited without permission.

108
Learning Environment Independent t Test Results
Category F EL
1. The content of the training program was presented in and interesting
.064 .80
2. The training course materials were delivered in an organized way
.028 .87
3. The environment was comfortable and conducive to learning
2 01 16
4. Training program objectives were communicated and clearly stated
1.51 .22
5. The course content in the training program was complete and organized
.83 .37
6. The training program included a manageable amount of information
.086 .77
7. The training delivery method is appropriate for the material required for this training program
2.17 .15
8. The training program fits my personal schedule 2.97 .09
9. My understanding of the mater ial is enhanced due to the instructional methods used in this training program
1.96 .17
Reproduced with permission of the copyright owner. Further reproduction prohibited without permission.

109
L e v e l of In te r a c t iv ity B e tw e e n S tu d e n ts
Category F P
1. I made considerable contribution to class interaction with other students
5.45 .02
2. I had the opportunity to interact with other students outside the content of the class
.4.82 .03
3. There was a considerable amount of students-to- students interaction compare to other training courses I have experienced
2.44 .12
4. There were a considerable amount of interaction between student and instructor
.04 .85
5. There was a considerable amount of students' interaction within courses
.55 .46
6. There was a considerable amount of student ’ interaction for all students beyond class
.013 .91
7. The training method promotes me to be actively engaged in training program activities and assignments with other students
2.62 .1 1
Reproduced with permission of the copyright owner. Further reproduction prohibited without permission.

110
Level of Interact iv i ty B e tw e en S tu d en t and Instructor
Category F e.
1. I had the opportunity to interact with my instructor during this type of training
1.67 .2
2. The instructor was avai lable to help me when clarification was needed
.23 .63
3. This type of t raining makes interactivity between instructor and students eas ier
.04 .84
4. My understanding of the course is enhanced due to the interactivity between the instructor and me
.76 .39
Reproduced with permission of the copyright owner. Further reproduction prohibited without permission.