a comprehensive climatology of arctic aerosol properties
TRANSCRIPT

Arctic aerosol properties on and off the North Slope of Alaska
Jessie Creamean, Gijs de Boer, Matthew Shupe, Allison McComiskey, Patricia Quinn, Anne Jefferson, John Ogren
IASOA WG meeting
1 Jun 2016

Climatology using aerosol chemical, physical, and optical property measurements at Barrow
Future RUSALCA cruises
Future HOVERCAT (balloon) measurements at Oliktok Point/Barrow
Outline
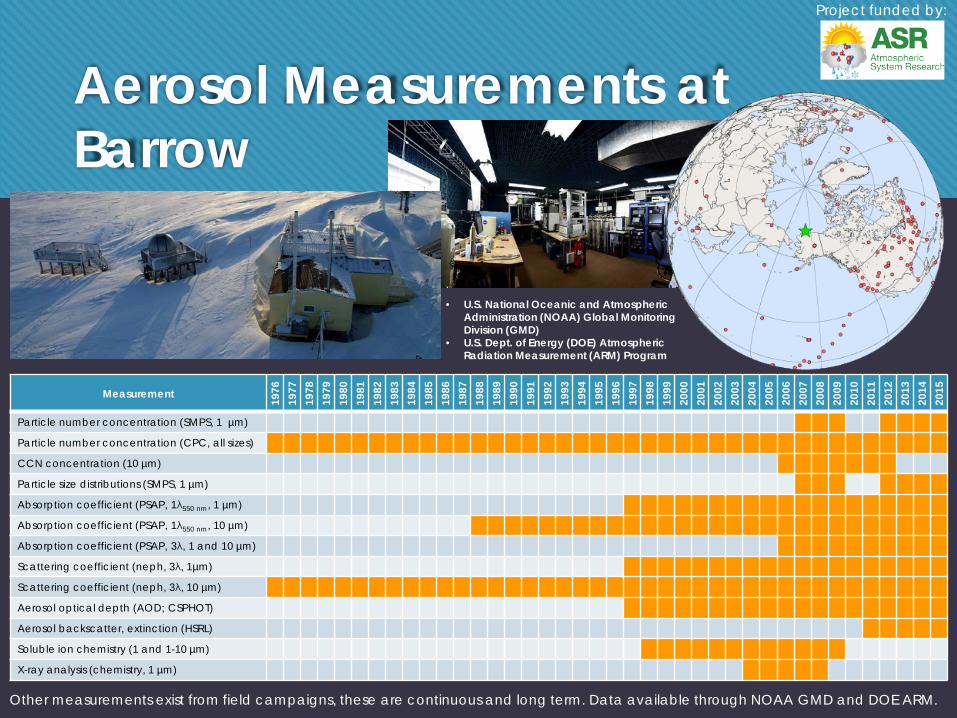
Aerosol Measurements at Barrow
Measurement
1976
1977
1978
1979
1980
1981
1982
1983
1984
1985
1986
1987
1988
1989
1990
1991
1992
1993
1994
1995
1996
1997
1998
1999
2000
2001
2002
2003
2004
2005
2006
2007
2008
2009
2010
2011
2012
2013
2014
2015
Particle number concentration (SMPS, 1 µm)
Particle number concentration (CPC, all sizes)
CCN concentration (10 µm)
Particle size distributions (SMPS, 1 µm)
Absorption coefficient (PSAP, 1λ550 nm, 1 µm)
Absorption coefficient (PSAP, 1λ550 nm, 10 µm)
Absorption coefficient (PSAP, 3λ, 1 and 10 µm)
Scattering coefficient (neph, 3λ, 1µm)
Scattering coefficient (neph, 3λ, 10 µm)
Aerosol optical depth (AOD; CSPHOT)
Aerosol backscatter, extinction (HSRL)
Soluble ion chemistry (1 and 1-10 µm)
X-ray analysis (chemistry, 1 µm)
Other measurements exist from field campaigns, these are continuous and long term. Data available through NOAA GMD and DOE ARM.
• U.S. National Oceanic and Atmospheric Administration (NOAA) Global Monitoring Division (GMD)
• U.S. Dept. of Energy (DOE) Atmospheric Radiation Measurement (ARM) Program
Project funded by:

Seasonal Trends: Mass vs. Number
Submicron mass highest during haze
Supermicron mass highest in fall, secondary peak in spring
Submicron numberhighest in spring into summer
Sub-10-µm numberhighest in late summer and during haze
Not only look at inter-monthly trends, but also relationships between observations.
• Number and mass follow very different seasonal trends.
• Mass: important for deposition on sea ice and radiation (large sizes).
• Number: important for clouds.

Seasonal Trends: “Haze” Aerosols
Pollutants highest during haze, correlate with σa andσs
Mineral dust markers highest in spring, earlier than midlatitudes
Biomass burningmarkers highest depending on size
Submicron peak in winter
Supermicron peak in late fall/winter
AbsorptionScatteringNss-sulfateNitrateAmmoniumNss-calciumNss-magnesiumNss-potassium
Submicron
Submicron Submicron

Submicron sea salt (SS) highest in winter, correlates with largest submicron mean size
Also concurrent with lowest submicronÅngström Exponent (a) = larger Dp
Supermicron sea salt (SS) highest in fall, when open water is exposed, concurrent with largest and most certain sub-10-micron single-scattering albedo
Also concurrent with lowest sub-10-micronÅngström Exponent = larger Dp
Sea saltSubmicron sizeÅngströmExponent Single scattering albedoSea ice conc.
Larger Dp
Smaller Dp
Larger Dp
Smaller Dp
Seasonal Trends: Sea Salt Aerosols

Seasonal Trends: Biogenic Aerosols
MSA highest in summer, when…
Ångström Exponent is highest (= smaller Dp)
Smallest mean sizes are observed
Sunlight is available for biological production
Chlorophyll production is highest
Sea ice is diminishing, exposing open water
Larger Dp
Smaller Dp
MethanesulfonicacidSunlight hoursÅngström ExponentChlorophyllSea ice conc.

Climatology Conclusions
Haze (winter + spring) = ↑ extinction, ↑ pollutants, dust, biomass burning, submicron sea salt, ↑ submicron number, ↑ submicron mass, ↑ submicron size
Summer = ↑ bio emissions (chlorophyll and MSA), ↓ size, ↑ submicron number, ↑ Ångström Exponent
Fall = ↑ supermicron SS, ↑ supermicron mass, ↑ sub-10-micron number (late summer/early fall), ↑ single-scattering albedo, ↓ Ångström Exponent
The different aerosol sources contribute to number and mass, which have variable seasonality.
Consistent with previous work, but linking disparate observations to each other.
= LRT influence
= local secondary emissions once sea surface and sunlight are available
= local mechanical emissions from open ocean surface

Future Directions on the NSA
Next steps: Relate seasonal trends to those in surface
meteorology, clouds, dynamics, transport sources
Look at increases or decreases over time, do we see any relationships with regulations? Do the slopes of the lines change?
Oliktok Point, AK will soon have aerosol measurements, very interesting comparison for Barrow!
Project funded by:

Pacific Arctic (over ocean)
More North Slope of AK (NSA) observations
Member of Oliktok Point site science team (through DOE ASR)
Future Arctic Aerosol Research

RUSALCA: Russian-American Long-term Census of the Arctic research cruises
Measurements where Arctic sea ice reduction = max in Pac Arctic
Monitor seawater and ecosystems
Summers of 2017 and 2018 Filter samplers for
chemistry, ice nucleating particles (INPs), bioanalysis
Research Cruises in Pacific Arctic
Project funded by:

RUSALCA Measurements
Project funded by:

Honing on VERtical Cloud and Aerosol properTies Package includes miniaturized
instruments to collect filter samples of aerosols, real time aerosol size distributions
Will be versatile to add other probes and instruments
Build and test summer 2016 –summer 2017 in Colorado (Boulder and Storm Peak Lab)
Plan for future deployments at Barrow and Oliktok
HOVERCAT: A Novel Aerial System to Evaluate Aerosol Chemistry and its Impacts on Arctic Clouds
Project funded by: