a comprehensive dataset from a smart grid testbed for
TRANSCRIPT

A Comprehensive Dataset from a Smart Grid Testbedfor Machine Learning based CPS Security Research
Abstract. Data-sets play a crucial role in advancing the research. However, get-ting access to real-world data becomes difficult when it comes to critical infras-tructures and more so if that data is being acquired for security research. In thiswork, a comprehensive dataset from a real-world smart electric grid testbed iscollected and shared with the research community. A few of the unique featuresof the dataset and testbed are highlighted.
1 Introduction
Recent progress in technology is resulting in the digitization of the physical world andthings around us. It is expected that communication and computing capabilities willsoon be part of all the physical objects [14]. The integration of cyber technologies(computing and communication) with the physical world gives rise to complex sys-tems referred to as Cyber Physical Systems (CPS). CPS has changed the methods thathumans used to interact with the physical world. Some examples of CPS are manufac-turing, transportation, smart grid, water treatment, medical devices and the IndustrialControl Systems (ICS) [17].
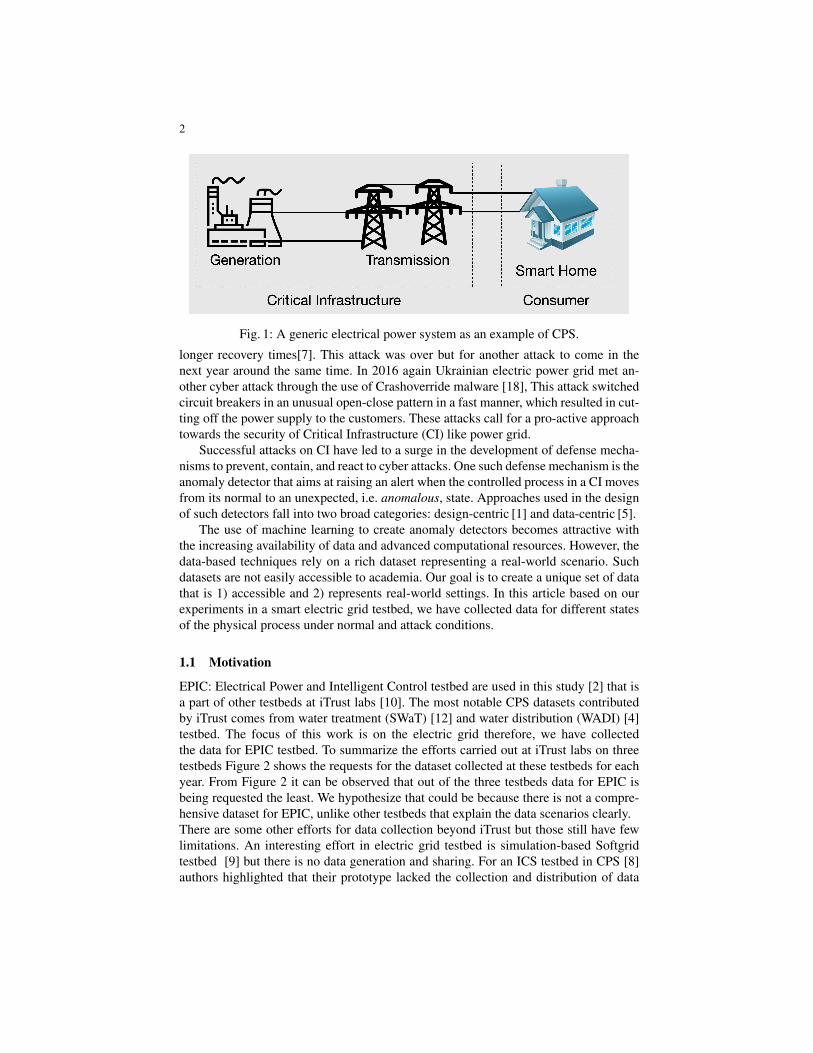
CPS is a broad term; in the following, we highlight a major sector applicable to ourdaily life, that is, the electrical power system as shown in Figure 1. It shows the high-level architecture of an electrical power system. This is composed of electricity genera-tion (power plants), transmission (electric grid system) and end-users (smart home). Asone can imagine this power system is composed of a multitude of devices and physicalprocesses. Power generation and transmission depend on the demand from the utilitiesand the users. To meet the requirements of the energy demand the critical infrastruc-ture is utilized to ensure a continuous supply of power. Each of the processes in thecritical infrastructure is a complex engineering system and needs a sophisticated con-trol to achieve its desired objectives. For example, at the generation stage, we havegenerators, Intelligent Electronic Devices (IEDs) also incorporating electric relays, allthese devices are autonomously controlled by the Programmable Logic Controllers(PLC). This means that we have a lot of sensors monitoring the physical process, actu-ators/generators and the physical infrastructure that communicate the current physicalstates with each other and with the PLC. Such communication among smart devices,on one hand, provides flexibility in controlling the complex CPS but the vulnerabilitiesin the same technologies give rise to cyber attacks. In the following, a famous recentattack on a power grid is discussed.
Ukrainian Electric Power Grid Attacks (2015,2016): In December 2015 cyberat-tacks on Ukrainian electric power grid cut off the power supply to customers at thepeak of the winter season. The attackers remotely controlled the SCADA distributionsystem and forced operators to switch to the manual mode which resulted in much
2
Fig. 1: A generic electrical power system as an example of CPS.
longer recovery times[7]. This attack was over but for another attack to come in thenext year around the same time. In 2016 again Ukrainian electric power grid met an-other cyber attack through the use of Crashoverride malware [18], This attack switchedcircuit breakers in an unusual open-close pattern in a fast manner, which resulted in cut-ting off the power supply to the customers. These attacks call for a pro-active approachtowards the security of Critical Infrastructure (CI) like power grid.
Successful attacks on CI have led to a surge in the development of defense mecha-nisms to prevent, contain, and react to cyber attacks. One such defense mechanism is theanomaly detector that aims at raising an alert when the controlled process in a CI movesfrom its normal to an unexpected, i.e. anomalous, state. Approaches used in the designof such detectors fall into two broad categories: design-centric [1] and data-centric [5].
The use of machine learning to create anomaly detectors becomes attractive withthe increasing availability of data and advanced computational resources. However, thedata-based techniques rely on a rich dataset representing a real-world scenario. Suchdatasets are not easily accessible to academia. Our goal is to create a unique set of datathat is 1) accessible and 2) represents real-world settings. In this article based on ourexperiments in a smart electric grid testbed, we have collected data for different statesof the physical process under normal and attack conditions.
1.1 Motivation
EPIC: Electrical Power and Intelligent Control testbed are used in this study [2] that isa part of other testbeds at iTrust labs [10]. The most notable CPS datasets contributedby iTrust comes from water treatment (SWaT) [12] and water distribution (WADI) [4]testbed. The focus of this work is on the electric grid therefore, we have collectedthe data for EPIC testbed. To summarize the efforts carried out at iTrust labs on threetestbeds Figure 2 shows the requests for the dataset collected at these testbeds for eachyear. From Figure 2 it can be observed that out of the three testbeds data for EPIC isbeing requested the least. We hypothesize that could be because there is not a compre-hensive dataset for EPIC, unlike other testbeds that explain the data scenarios clearly.There are some other efforts for data collection beyond iTrust but those still have fewlimitations. An interesting effort in electric grid testbed is simulation-based Softgridtestbed [9] but there is no data generation and sharing. For an ICS testbed in CPS [8]authors highlighted that their prototype lacked the collection and distribution of data

Title Suppressed Due to Excessive Length 3
Fig. 2: Overview of dataset requests by year.
as it involves a manual process requiring time and resources. [6] presented simulatedIEC61850 traffic and no information regarding the real process and dynamics.Previous research studies have tried to collect data from CPS settings but lack somedesired features. We highlight a few of those,
– Simulated Data: Most of the datasets available are generated using simulated mod-els [6]. Lack of real-world scenarios prompted us to do this work.
– Only Network Traffic Data: Previous data collection efforts only focused on thenetwork traffic and as mentioned those were too simulated most of the time. Oneof the recent studies collected the network traffic from a realistic electric tractionsubstation [13]. There is a lack of process data available from an electric grid basedon realistic devices.
There have been efforts on building CPS testbeds for security research but very fewwere able to represent real-world scenarios and collect data to share with the academiaand industry. We have focused on the process data from the sensors and actuators andtried to run the normal process for a range of different configurations. The idea is ifwe have enough real-world scenarios for the normal data, it is not hard to generate amalformed data/signal as other researchers have demonstrated in the past, e.g., usingthe mutation [16].
2 EPIC Testbed Introduction
EPIC mainly consists of four zones as described in the following. All the four zonesare equipped with IEDs to collect Current, Voltage, Power and Frequency for the threephases buses.

4
Fig. 3: Electrical layout of the testbed, electrical power lines are shown in red colorlines.
– Generation: Generation stage is driven by electric motors connected to the mainpower supply.
– MicroGrid: Photo-voltaic cells, inverters and batteries compose this stage to sup-plement the generation of power.
– Transmission: This stage is composed of buses to transport power to the smart homeunit.
– Smart Home: A programmable load bank containing RLC loads represents a homeload environment. Besides, there are two water testbeds also connected to EPIC asthe load.
2.1 Electrical Layout
The testbed consists of the following components as shown in Fig. 3. 1) Two conven-tional generators (10KVA each) run by 15kW VSD driven motors to represent theconventional combination of prime-mover and generator. 2) A 34kW PV system isavailable along with an 18kW battery system to represent power generation from theintermittent RES. 3) A 105kVA 3 phase voltage regulator for representing power sup-ply from a transmission system. 4) Two load banks capable of emulating 45kVA loadto represent critical and non-critical loads. It can supply power to the other two wa-ter testbeds. 5) A 10kW motor-generator load to represent spinning load. 6) Industrialstandard Molded Case Circuit Breakers are used for short-circuit protection and switch-ing functions.
2.2 Communication Network
Figure 4 shows the communication network architecture in EPIC testbed. Figure 4shows four major control zones, i.e., 1) Power Generation, 2) Transmission, 3) Mi-

Title Suppressed Due to Excessive Length 5
172.16.3.1 172.16.1.1
172.16.4.1 172.16.2.1
172.16.5.1
172.16.3.X 172.16.1.X
172.16.4.X 172.16.2.X
M_SW1 G_SW1
S_SW1 T_SW1
C_SW2
C_SW1
Mic
rog
rid
S
mart
Ho
me
Gen
era
tion
Tra
nsm
issio
n
Historian Server SCADA System
172.18.5.100 172.18.5.60
Fig. 4: A simplified network diagram for EPIC is shown. This is to help the associ-ated network traces. IP addresses in the network traces correspond to respected devicesshown in the figure. Each dotted box represents a subnet with the respective IP ad-dresses. A X in the IP address means that a device in that subnet would have the similarsubnet mask and then unique X as its own IP. Typical devices are PLCs and IntelligentElectronic Devices.
Fig. 5: A sample network traffic flow between different devices.

6
crogrid, and 4) Smart Home. All of these four zones have IEDs and other devices to becontrolled by dedicated PLCs. For example smart home also contains smart meters thatcan communicate with the PLCs and then can route the data through a central switch tothe historian server and a SCADA workstation. Table 2 in Appendix A shows a mapof IP addresses of the specific devices in the testbed. Network traffic is also collectedat the SCADA station in a pcap format. Using Table 2 it is possible to make sense ofthe packet capture of the network traffic. For details on the communication protocolsan interested reader is referred to the EPIC testbed papers [15, 2]. Figure 5 shows thesequence of communication between the different devices in the EPIC network. In thesequence diagram it can be seen that the SCADA workstation (IP: 172.18.5.60) holds acentral position and send data transfer requests to the rest of the PLCs.
Data Header Explanation DevicesMeasurement.Apparent IED measures the apparent power GIED, MIED, SIED, TIEDMeasurement.Frequency IED measures the signal frequency GIED, MIED, SIED, TIED
Measurement.Line Current IED measures the line current GIED, MIED, SIED, TIEDMeasurement.V1 IED measures the voltage difference at L1 GIED, MIED, SIED, TIED
Measurement.Real IED measures the Real power GIED, MIED, SIED, TIEDMeasurement.Reactive IED measures the Reactive power GIED, MIED, SIED, TIED
Measurement.Power Factor IED measures the power factor GIED, MIED, SIED, TIEDQ.mode close mode of an electric breaker (T/F) All StagesVSD.property properties can be Generation stage to show the VSD status
.Current,.Speed, .Ready, .FaultTable 1: Header Explanation in the Data set. IED:= Intelligent Electronic Device,GIED:=Generation stage IED, MIED:= Microgrid stage IED, SIED:= Smart home IED,TIED:= Transmission stage IED.
3 Data Collection and Process Scenarios
The data is collected at the different configuration and operational settings of the EPICtestbed. Most of the physical process is driven by the demand from the smart home unit,constituted of different load types. These loads are used to simulate a real-world loadrequirement. Moreover, two other water plants are also connected to EPIC as the loads.The collected data can be collected from iTrust labs [10]. Network traffics is collected inpcap format and the process data is provided a Comma Separated Values (CSV) files. Tomake sense of the process data let us explain what each column in the data files means.Table 1 shows a list of data elements found in the dataset. The first column shows thequantity being measured and the last column shows the devices that are measuring thatquantity. For example, the second row has Measurement.Apparent element meaningthat the IED is measuring apparent power in different zones of the testbed. A columnwith header GIED.Measurement.Apparent means the apparent power is measured by an

Title Suppressed Due to Excessive Length 7
0 100 200 300 400 500 600
Number of Readings
-200
-150
-100
-50
0
50
100
150
200
An
gle
Va
lue
s
Generator-1 Angle
Generator-2 Angle
(a) Generator Synchronization without load.
0 20 40 60 80 100 120 140 160 180 200
Number of Readings
-150
-100
-50
0
50
100
150
200
An
gle
Va
lue
s
Generator-1 Angle
Generator-2 Angle
(b) Generator Synchronization with 10KW resistive load.
Fig. 6: Two different smart home load scenarios.
IED at the generation stage. In the following, we highlight the data collection scenariosand settings.Scenario 1: Synchronization Process without Load This scenario shows the processof synchronization for two generators without any load. Angle difference between twogenerators G1 and G2 changes in a cyclic manner from -180 to 0 to 180 degree until thesynchronization is completed. Figure 6a shows this process twice.
Scenario 2: Synchronization Process with Load To depict the synchronization for thetwo generators with a 10kW resistive load at the smart home stage. Angle differencebetween two generators G1 and G2 vary from -180 to 0 degrees following a similarcyclic process as in Scenario 1. The additional load had little to no effect on the pro-cess. Figure 6b shows the process.
Attack on Synchronization Process Synchronization of two generators, a new incom-ing generator i.e., the generator that needs to be connected in parallel to rest of genera-tors in the grid needs to ensure the following three parameters,
– The frequency of the generator must be same as the frequency of the line/grid– The magnitude of the generator’s voltage must be same as the magnitude of line/grid
voltage– The phase angle of the generator’s voltage must be same as the phase angle of the
line/grid voltage (we will assume that the phase sequence is same)
The first two parameters do not depend on the state of the line/grid. However, the thirdparameters i.e., phase angle depends on the state of the phase angle of the line/grid.The parallel connection is enabled by circuit breaker which closes once the phase angledifference is approximately equal to zero (usually around 10o in practical cases). Welaunched the attack on the synchronisation process to delay it from the order of secondsto several minutes. The readers can refer [11] for a detailed analysis on the attack andplausible demand.Scenario 3: Steady State Behavior Here both the generators are running and synchro-nized. The resistive load is set to 10kW at the smart home stage. This scenario depicts

8
0 200 400 600 800 1000
Number of Readings
-2000
0
2000
4000
6000
8000
10000
12000
Real P
ow
er
Measu
rem
en
ts
Smart Home Real Power
G1 Real Power
G2 Real Power
PV Contribution
0 100 200 300 400 500 600 700 800
Number of Readings
0
2000
4000
6000
8000
10000
12000
Real P
ow
er
Measu
rem
en
ts
Smart Home Real Power
G1 Real Power
G2 Real Power
PV Contribution
Fig. 7: Scenario-4 with 10KW load and Scenario-5 with 7 KW resistive load.
0 500 1000 1500 2000 2500 3000 3500 4000 4500 5000
Time (s)
-200
-100
0
100
200
Angle
(0) Generators
synchronized
Start of synchronization
process
Fig. 8: Experimental results of synchronisation process of two generators after thelaunch of attack. Normal operation: Observe that φd changes from -180o to 180o at signifi-cantly slower pace, the breaker is closed when the generators are synchronized which took morethan 1.5 hours.
a steady state behavior of the process. Any power plant, substation or section of powersystem will be in this stage for most of the time.
Scenario 4: PV system with Generators This scenario depicts a situation where theuser demand is being fulfilled using the two generators G1 and G2 and also using PVsystem With 10kW resistive load. The scenario depicts the operation of modern powersystem sections with renewable energy penetration. Figure 7 shows the process behav-ior for the scenario 4 and 5 respectively.
Scenario 5: PV system with Generators This scenario depicts a situation where theuser demand is being fulfilled using the two generators G1 and G2 and also using PVsystem With a reduced load of 7kW resistive load. With decreasing load the chances ofcreating power supply interruption attacks are relatively high, such scenarios are pre-

Title Suppressed Due to Excessive Length 9
sented in [3].
Scenario 6: Three Generators Running In this case all the available three generatorsG1, G2 and G3 are running with a load of 14kW resistive load at the smart home stage.This scenario depicts a system where there are motor loads such as buildings with HeatVentilation and Air-conditioning (HVAC) systems.
Malicious Power Generation Attack- An use case In this case, we manipulated thepower generated from one generator to overload it in comparison to the other genera-tor, so that the maintenance schedule can be offset as the overloaded generator needsmore frequent maintenance due to additional wear and tear. This eventually leads to ac-cumulated damage in the long run, as the overloaded generator was not serviced at theappropriate times due to malicious operation. During normal operation, to supply powerto the critical loads, generators G1 and G2 will share the power equally. The SPLC hasthe control code that issues a subsequent command to the VSDs to run at a specificspeed (1500RPM in this case), for enabling equal power-sharing among the two gener-ators. The apparent power is equally shared between the generators. The time-domainrepresentation of power-sharing before the attack was launched is shown in Figure 9and marked as normal.
After the attack was launched on generator G1, i.e, the speed of the prime moverof G2 reduced by 0.2 RPM when generator G1 is supplying more power and hence dis-abling the power-sharing process. This attack scenario is marked in Figure 9 where itcan be observed that whenever G2 is supplying more power than G1, G1 takes over un-til equal power is shared among the two. However, when G1 is supplying more power,G2 fails to take over even after synchronization. This resulted in G1 supplying morepower under scenarios where G2 is synchronized as the second generator. The abovecondition will eventually result in tripping of G1 due to prolonged overload condition.
Scenario 7: Cascading Effects Two generators G1 and G2 running and the load is areal world application. In this case the power is being supplied to the Secure WaterTreatment (SWaT) testbed. This scenario can be interesting to see the cascading ef-fects of attack on one CPS system to another. For example, a power supply interruptionattack [3] can affect affect the treatment process or the distribution process of watersupply system.
Scenario 8: Cascading Effects Two generators G1 and G2 running and the load is twoCPS testbeds. In this case the power is being supplied to the Secure Water Treatment(SWaT) and water distribution (WADI) testbed. This scenario can be interesting to seethe cascading effects of attack on one CPS system to another.
4 Discussion
It is not possible to collect data for a large number of scenarios and exhaust all thepossibilities. We have done it for a range of representative scenarios and then we canuse tools like mutation to generate more scenarios for both the normal and abnormal

10
0 600 1200 1800 2400 3000 3600 4200 4790
Time (s)
0
1000
2000
3000
4000
5000
6000
Ap
pa
ren
t P
ow
er
(kV
A)
G1
G2
Normal : Equal
sharing
Normal : Decreasing power to
enable equal sharing
Normal : Increasing power to
enable equal sharing
Only G2 ON
G2 unable to share power
(after attack)
Attack Launched
Fig. 9: Apparent power during load sharing between generators G1 and G2. When G2 is unableto share the power, the vulnerability of G1 to trip under overload, i.e., during peak load conditions,increases dramatically. The time-domain representation of power-sharing before the attack waslaunched is shown and marked as normal. Observe that before attack launch at around 1900seconds, G1 and G2 shared power irrespective of the condition, whereas after the attack launch,G2 was unable to share the power, i.e., between 2400 and 4300 seconds.
scenarios [16]. However, we tried to present a realistic data from both the process aswell as network traffic perspective.
4.1 Normal Data for Real-World Process
We have presented the collected data for a range of normal process states from a realworld smart electric grid network. It has a very high importance since the quantitiesmeasured are across the real process and devices giving an idea of what to expect inreal world and come up with the realistic anomaly detection techniques.
4.2 Lack of Attack Scenarios on the Process
In this work we have presented the attack scenarios that could be executed withoutdamaging the plant. The attacks those cause physical damage could not be executed onthe plant as those pose dangers to the infrastructure and people around it.
5 Potential Use Cases and Future Work
Potential use cases extend from pure network attacks to attacks targeting a particularphysical process. For instance, the attacker can explore the network traffic during thecircuit breaker closing operation; which can be identified from the process data. Usingthe data the attacks with physical goal similar to [18] can be re-created. Following whichappropriate defense mechanisms could be designed. Similarly, the data on the networktraffic and the process status could be coupled for spoofing attacks that can hide theabove attack from the operators.

Title Suppressed Due to Excessive Length 11
From the defense front, the authors are working on a defense based on negative se-lection algorithm using dataset for defense against malicious power generation attacks.The dataset is also useful for developing and testing design-centric defense such asinvariants based methods and authors are currently working on one such system.
References
1. Adepu, S., Mathur, A.: Distributed attack detection in a water treatment plant: Method andcase study. IEEE Transactions on Dependable and Secure Computing pp. 1–8 (2018)
2. Adepu, S., Kandasamy, N.K., Mathur, A.: Epic: An electric power testbed for research andtraining in cyber physical systems security. In: Katsikas, S.K., Cuppens, F., Cuppens, N.,Lambrinoudakis, C., Anton, A., Gritzalis, S., Mylopoulos, J., Kalloniatis, C. (eds.) ComputerSecurity. pp. 37–52. Springer International Publishing, Cham (2019)
3. Adepu, S., Kandasamy, N.K., Zhou, J., Mathur, A.: Attacks on smart grid: power supplyinterruption and malicious power generation. International Journal of Information Securitypp. 1–23 (2019)
4. Ahmed, C.M., Palleti, V.R., Mathur, A.P.: WADI: A water distribution testbed for researchin the design of secure cyber physical systems. In: CPS Week. pp. 25–28. CySWATER ’17,ACM (2017)
5. Ahmed, C.M., Zhou, J., Mathur, A.P.: Noise matters: Using sensor and process noise fin-gerprint to detect stealthy cyber attacks and authenticate sensors in CPS. In: Proceedings ofthe 34th Annual Computer Security Applications Conference, ACSAC 2018, San Juan, PR,USA, December 03-07, 2018. pp. 566–581 (2018)
6. Biswas, P.P., Tan, H.C., Zhu, Q., Li, Y., Mashima, D., Chen, B.: A synthesized dataset forcybersecurity study of iec 61850 based substation. In: 2019 IEEE International Conferenceon Communications, Control, and Computing Technologies for Smart Grids (SmartGrid-Comm). pp. 1–7 (2019)
7. Case, D.U.: Analysis of the cyber attack on the ukrainian power grid. Report (2016)8. Green, B., Lee, A., Antrobus, R., Roedig, U., Hutchison, D., Rashid, A.: Pains,
gains and plcs: Ten lessons from building an industrial control systems testbedfor security research. In: 10th USENIX Workshop on Cyber Security Experimen-tation and Test (CSET 17). USENIX Association, Vancouver, BC (Aug 2017),https://www.usenix.org/conference/cset17/workshop-program/presentation/green
9. Gunathilaka, P., Mashima, D., Chen, B.: Softgrid: A software-based smart gridtestbed for evaluating substation cybersecurity solutions. In: Proceedings of the2nd ACM Workshop on Cyber-Physical Systems Security and Privacy. p. 113124.CPS-SPC 16, Association for Computing Machinery, New York, NY, USA (2016).https://doi.org/10.1145/2994487.2994494, https://doi.org/10.1145/2994487.2994494
10. iTrust: iTrust Datasets, https://itrust.sutd.edu.sg/itrust-labs datasets/11. Kandasamy, N.K.: An investigation on feasibility and security for cyber attacks on generator
synchronization process. IEEE Transactions on Industrial Informatics (2019)12. Mathur, A.P., Tippenhauer, N.O.: Swat: a water treatment testbed for research and training
on ics security. In: CySWater. pp. 31–36 (April 2016)13. Perales Gmez, .L., Fernndez Maim, L., Huertas Celdrn, A., Garca Clemente, F.J., Cadenas
Sarmiento, C., Del Canto Masa, C.J., Mndez Nistal, R.: On the generation of anomaly detec-tion datasets in industrial control systems. IEEE Access 7, 177460–177473 (2019)
14. Rajkumar, R., Lee, I., Sha, L., Stankovic, J.: Cyber-physical systems: The next computingrevolution. In: Design Automation Conference. pp. 731–736 (6 2010)

12
15. Siddiqi, A., Tippenhauer, N.O., Mashima, D., Chen, B.: On practical threat scenario testing inan electric power ics testbed. In: Proceedings of the 4th ACM Workshop on Cyber-PhysicalSystem Security. pp. 15–21 (2018)
16. Sugumar, G., Mathur, A.: A method for testing distributed anomaly de-tectors. International Journal of Critical Infrastructure Protection 27,100324 (2019). https://doi.org/https://doi.org/10.1016/j.ijcip.2019.100324,http://www.sciencedirect.com/science/article/pii/S1874548219301210
17. Sutton, F.: An Efficient Platform and Communication Architecture for Event-triggeredCyber-physical Systems. Ph.D. thesis, ETH Zurich (2018). https://doi.org/10.3929/ethz-b-000260384
18. US-CERT: Crashoverride malware. US-CERT Report (2017), https://www.us-cert.gov/ncas/alerts/TA17-163A
A Supporting Data
IP Address Device172.16.1.41 Generation stage PLC172.16.2.41 Transmission stage PLC172.16.3.41 Microgrid stage PLC172.16.4.41 Smart Home stage PLC172.16.5.41 Control stage PLC172.18.5.60 SACDA System172.18.5.100 Historian Server172.16.2.11 Transmission TIED1
172.16.2.12 Transmission TIED2
172.16.2.13 Transmission TIED4
172.16.3.11 Microgrid MIED1
172.16.3.12 Microgrid MIED2
172.16.4.11 Smart Home SIED1
172.16.4.12 Smart Home SIED2
172.16.4.13 Smart Home SIED3
172.16.4.14 Smart Home SIED4
172.16.1.11 Generation GIED1
172.16.1.12 Generation GIED2
Table 2: IP addresses for key devices in the network.