a comprehensive methodology for assessing biomechanical risks associated with hand tool use
TRANSCRIPT

University of ConnecticutDigitalCommons@UConn
Master's Theses University of Connecticut Graduate School
5-5-2012
A Comprehensive Methodology for AssessingBiomechanical Risks Associated with Hand ToolUse: Applied to Laparoscopic Surgical InstrumentsDREW R. [email protected]
This work is brought to you for free and open access by the University of Connecticut Graduate School at DigitalCommons@UConn. It has beenaccepted for inclusion in Master's Theses by an authorized administrator of DigitalCommons@UConn. For more information, please [email protected].
Recommended CitationSEILS, DREW R., "A Comprehensive Methodology for Assessing Biomechanical Risks Associated with Hand Tool Use: Applied toLaparoscopic Surgical Instruments" (2012). Master's Theses. 282.http://digitalcommons.uconn.edu/gs_theses/282

A Comprehensive Methodology for Assessing Biomechanical Risks Associated with
Hand Tool Use: Applied to Laparoscopic Surgical Instruments
Drew Robert Seils
B.S. University of Connecticut, 2010
A Thesis
Submitted in Partial Fulfillment of the
Requirements for the Degree of
Masters of Science
at the
University of Connecticut
2012

ii

iii
Acknowledgements
I would first of all like to thank Dr. Donald Peterson for his direction and professional
input during the completion of my thesis. I would also like to express my gratitude to my
associate advisors Dr. Angela Kueck and Dr. John Bennett for their help and guidance.
I would also like to thank the other members of the Biodynamics laboratory for their
continuous support and knowledgeable advice throughout the duration of this project. I
would like to thank Takafumi Asaki, Shane Tornifoglio, Eric Bernstein, and Robert
Knapp. I must also thank Tarek Tantawy for his work with the motion capture system
and aide in research development throughout the study.
Finally, I must also thank my family and friends for their continuous support and
understanding.

iv
Table of Contents
Approval Page…………………………………………………………… ii
Acknowledgements…………………………………………………….... iii
Abstract………………………………………………………………….. ix
Index of Figures………………………………………………………….. vi
Index of Tables…………………………………………………………... viii
1. Introduction…………………………………………………………… 1
1.1 Background of Methodology…………………………………….. 1
1.2 Background of Application………………………………………. 4
2. Methods……………………………………………………………….. 10
2.1 Instrumentation………………………………………………….. 10
2.1.1 System Triggering…………………………………………. 11
2.1.2 Surface Electromyography………………………………... 14
2.1.3 Force Sensors……………………………………………… 15
2.1.4 Force Plate………………………………........................... 16
2.1.5 Data Acquisition System………………………………….. 17
2.1.6 Motion Capture……………………………………………. 18
2.1.7 Grip Force Dynamometer…………………………………. 19
2.2 Calibration ……………………………………………………….. 20
2.2.1 Electromyography Placement and Maximum Voluntary
Contraction Procedure…………………………………………… 20
2.2.2 Force Sensor Calibration…………………………………... 22
2.2.3 Force Plate Calibration……………………………………... 24
2.2.4 Opto-electronic Motion Capture Calibration……………… 25
2.3 Subjects ………………………………………………………….. 27
2.3.1 Anthropometry……………………………………………. 28
2.3.2 Goniometry………………………………………………... 29
2.3.3 Surveys……………………………………………………. 30
2.3.4 Placement of Markers……………………………………… 32
2.3.5 Cable Management………………………………………… 35
2.4 Application ……………………………………………………… 36
2.4.1 Experimental Setup……………………………………….. 36
2.4.2 Devices…………………………………………………….. 38
2.4.3 Custom Laparoscopic Trainer…………………………….. 39
2.4.4 Endoscope…………………………………………………. 41
2.4.5 Tissue Surrogate…………….…………………………….. 41
2.4.6 Tip Markers………………………………………….......... 42
2.4.7 Force Sensor Placement…………………………………… 43

v
2.4.8 Force Plate Implementation……………………………….. 44
2.4.9 Subject Procedure………………………………………….. 45
2.4.10 Full Trial Procedure………………………………………. 45
2.5 Data Interpretation..…………………………….......................... 50
2.5.1 Surface Electromyography………………………………... 50
2.5.2 Force……………………………………………………….. 53
2.5.3 Force Plate…………………………………………………. 54
2.5.4 Motion Capture Position Data…………………………….. 57
2.5.5 Task Normalization……………………………………….. 58
2.5.6 Exposure Intensity………………………………………… 59
2.5.7 Exposure Duration………………………………………… 60
2.5.8 Statistical Analysis………………………………………… 60
3. Results…………………………………………………………………. 61
3.1 Surface Electromyography and Posture during Device Trial…… 61
3.2 Force Plate Patterns during Task Completion Sequence……….. 64
3.3 Finger Force Patterns during Task Completion Sequence……… 65
3.4 Palm Force Patterns during Task Completion Sequence……….. 69
3.5 Subject Reports………………………………………….............. 70
4. Discussion……………………………………………………………... 72
4.1 Effects of Hand Size on Risk Exposure…………………………. 72
4.2 Effects of Arm Posture on Risk Exposure………………………. 73
4.3 Force Plate Risk Exposure………………………………………. 74
4.4 Full Hand Gripping in Laparoscopy…………………………….. 75
4.5 Grip Force Extrapolation…………………………………........... 76
4.6 Exposure to Palm Forces………………………………………… 77
4.7 Hardware Limitations……………………………………………. 78
4.8 Software Limitations……………………………………….......... 79
5. Conclusions………………………………………………………........ 80
References……………………………………………………………....... 83

vi
Index of Figures
Figure 2.1: Flow chart outlining setup for experimental methods………………… 11
Figure 2.2: Trigger validation testing setup between force plate and motion
capture…............................................................................................. 12
Figure 2.3: System trigger with nine volt battery, toggle switch, and
T-junction…………………………………………………………….. 13
Figure 2.4: Surface electromyography conditioning box front view (a)
back view (b)……………………………………………………….... 15
Figure 2.5: Applied surface electromyography electrodes……………………….. 15
Figure 2.6: Tekscan flexible force sensor (a) and force sensor
conditioning box (b)…………………………………………………. 16
Figure 2.7: Kistler 9286BA force plate (a) and force plate conditioning box (b).. 17
Figure 2.8: National Instruments SCB-68 pin connector ……………………….... 18
Figure 2.9: Data acquisition LabVIEW front panel and block diagram…………... 18
Figure 2.10: OptiTrack Flex V100 R2 motion capture camera (a) and Optihub
master camera hub for OptiTrack motion capture system (b)……… 19
Figure 2.11: Takei T.K.K. 5401 Grip-D dynamometer…………………………… 20
Figure 2.12: Raw voltage signal from a maximum voluntary contraction trial…. 22
Figure 2.13: Force sensor calibration procedure………………………………….. 23
Figure 2.14: Force plate calibration confirmation……………………………….... 24
Figure 2.15: Motion capture calibration with 3-marker wand……………………. 27
Figure 2.16: Anthropometry measurements………………………………………. 29
Figure 2.17: Determination of maximal joint angles using manual goniometry… 30
Figure 2.18: Example of analog evaluation parameter and scoring………………. 32
Figure 2.19: Three markers establishing the Sacro-Lumbar plane………………. 33
Figure 2.20: Three markers establishing the plane of the chest………………….. 34
Figure 2.21: Three markers establishing the head rigid body……………………. 34
Figure 2.22: Three markers establishing upper arm rigid body………………….. 34
Figure 2.23: Four markers establishing hand rigid body…………………………. 35

vii
Figure 2.24: Cable management allowing for freedom of movement…………… 36
Figure 2.25: Subject performing laparoscopic task in full experimental setup…. 38
Figure 2.26: Overall experimental setup…………………………………………. 38
Figure 2.27: Custom laparoscopic trainer on height-adjustable column (a) and
the trainer shown with motion capture system (b)…………………. 40
Figure 2.28: Stryker endoscope (a) and monitor stand situated opposite the
trainer from the subject (b)…………………………………………. 41
Figure 2.29: Foam tissue surrogate in clip stand…………………………………. 42
Figure 2.30: Tip markers in tracking instrument motion within the trainer……... 43
Figure 2.31: Flexible force sensors attached to laparoscopic hand tool………….. 44
Figure 2.32: Live streaming data collection LabVIEW font panel……………….. 48
Figure 2.33: Maximum voluntary contraction trial with 55 ms window shown
over signal maximum………………………..……………………… 51
Figure 2.34: Summary of MATLAB codes for full electromyography analyses.. 52
Figure 2.35: Summary of MATLAB codes for peak force analyses……………… 54
Figure 2.36: Summary of MATLAB code for analyzing force plate data……….. 57
Figure 3.1: Wrist posture and forearm electromyography signals for Subject A
in a neutral posture……………………………………………………. 62
Figure 3.2: Wrist posture and forearm electromyography signals for Subject B
in a neutral posture……………………………………………………. 62
Figure 3.3: Wrist posture and forearm electromyography signals for Subject A
in an awkward posture………………………………………………… 63
Figure 3.4: Wrist posture and forearm electromyography signals for Subject B
in an awkward posture………………………………………………… 64
Figure 3.5: Force plate operating force and hand torqueing for Subject B with
the manual device in neutral posture…………………………………. 65
Figure 3.6: Manual device lever sensor pattern for non-articulated tips in neutral
posture……………………………………………………………….. 66
Figure 3.7: Manual device lever sensor pattern for articulated tips in neutral
posture…. …………………………………………………………… 67
Figure 3.8: Manual device lever sensor pattern shown with respect to wrist
posture in awkward posture for Subject C……………………………. 68

viii
Figure 3.9: Manual device lever sensor pattern shown with respect to wrist
posture in neutral posture for Subject C……………………………… 68
Figure 3.10: Manual device palm force patterns for lateral aspect of thenar
eminence as compared to 2.2 pound threshold……………………….. 69
Figure 3.11: Manual device palm force patterns for medial aspect of thenar
eminence as compared to 2.2 pound threshold……………………….. 70
Figure 3.12: Average subject scores for analog device evaluations…………….... 71
Index of Tables
Table 2.1: Triggering synchronization validation results………………………... 14
Table 2.2: Force sensor calibration data…………………………………………. 23
Table 2.3: Sample results from calibration procedure showing mean error……... 25
Table 2.4: Anthropometry measurement table (Left)……………………………. 28
Table 2.5: Layout of pin connections for data acquisition system………………. 47
Table 3.1: Hand torque and operating force statistics for manual device by
position across populations…………………………………………… 65

ix
Abstract
A Comprehensive Methodology for Assessing Biomechanical Risks Associated with
Hand Tool Use: Applied to Laparoscopic Surgical Instruments
By
Drew Robert Seils
Biomechanical risk factors are physical stressors that act on the
neuromuscular structures of the human body and are present in all occupational settings.
Repetition and intensity of tasks performed can magnify the effects of the biomechanical
risks that a worker is exposed to. The tools and devices used in any occupational setting
have a significant impact on the degree of exposure to these risk factors and, depending
on design, can either mitigate that risk or exacerbate it.
Taking a comprehensive approach to understanding the biomechanical risks
associated with hand tool use is vital to the evaluation of tool design and workplace risk.
Peterson (2001) developed a comprehensive methodology for recording hand tool
exposure and applied the methodology to studying manual hammering. While the
principles behind developing a comprehensive system for analyzing biomechanical risk
remain the same, much of the technology involved was changed and a new experimental
setup was designed to suit today’s occupational settings. The methodology that was
developed simultaneously recorded electromyography signals, point-forces, force plate
data, and 3D posture data using a 24-camera opto-electronic motion capture system for
the assessment of biomechanical risk associated with hand tool use.

x
After reviewing the current literature on ergonomics in laparoscopic surgery, it
was clear that a comprehensive approach to quantitatively reporting on the biomechanical
risk factors associated with surgical hand tools had never been performed. Utilizing an
opto-electronic motion capture system meant the exact surgeon posture was recorded
during simulated surgical tasks. Electromyography was used to evaluate muscle
recruitment and workload for small forearm muscles used in wrist stabilization. Point-
force sensors were used to evaluate grip and actuation forces that occurred while using
various laparoscopic medical devices. The force plate gathered information on subject
center of pressure location as well as moment and friction forces that resulted from push,
pull, and twisting motions of hand-held devices.
Within recent years, surgeons have been performing more and more laparoscopic
surgeries and in fact the number of minimally invasive surgeries has increased by more 1
million cases per year from 1996 to 2006, according to a report by the CDC (Cullen at al.
2009). Inadequate rest time following any significant biomechanical exposure can lead
to serious musculoskeletal disorders such as carpal tunnel syndrome, tendinitis and nerve
impingement, among others. Numerous research groups have recognized this issue and
begun to evaluate laparoscopy from an ergonomics perspective. A study by Park et al.
(2010) reported that 86.9% of a surgeon population of 317 experienced musculoskeletal
discomfort during surgery. Surface electromyography (sEMG) was the most common
and often only quantitative study method published by ergonomics literature on
laparoscopy.
Taking a comprehensive approach to ergonomics created new possibilities for
advancements in device and workplace design, directly benefitting the end user.

xi
Correlating data between different research modalities has resulted in new information
with regards to the biomechanical influences devices impose on the user, or surgeons, in
this particular application. This information can guide manufacturers and designers in
the development of the next generation of tools and equipment with the aim of reducing
the end user’s exposure to biomechanical risk. Taking steps to mitigate the risks
involved with hand tool use can potentially lower drop-out rates from work related
neuromuscular symptoms, increase career longevity and subsequently increase the size of
the experienced workforce.

1
1. Introduction
Biomechanical risk factors are the physical stressors that act on the soft
tissue and musculoskeletal structure of the human body and are present in all
occupational settings. Repetition and intensity of the task being performed can magnify
the effect of the biomechanical risks that a worker is exposed to. The tools and devices
used in any occupational setting have a significant impact on the degree of exposure to
these risk factors. Depending on the design of the tools, they can either mitigate this risk
or exacerbate it.
Taking a comprehensive approach to tool ergonomics is vital to understanding the
true biomechanical exposure that hand tool users undergo. Peterson (2001) developed a
comprehensive methodology for recording hand tool exposure and applied the
methodology to studying manual hammering. While the principles behind developing a
comprehensive system for analyzing biomechanical risk remain the same, much of the
technology involved has changed with time and a new approach must be designed to suit
today’s occupational settings. In response to this need, a methodology was developed to
simultaneously record electromyography, point-forces, and force plate data as well as
posture data using a 24-camera opto-electronic motion capture system (OEMC) for the
assessment of biomechanical risk of hand tools.
1.1 Background of Methodology
The proposed study establishes a methodology for a comprehensive ergonomic
evaluation of hand tools used in an occupational setting. In this specific case, it has been
applied to laparoscopic surgery where the metrics studied include motion and posture,
muscle activation, and forces. A precursor to this current methodology was developed in
1998 and presented in 2001 by Dr. Donald Peterson. The 2001 methodology was

2
developed as a comprehensive means of understanding the biomechanical risks
associated with manual hammering tasks. Over the years since the publication on this
work, much of the technology for evaluating biomechanical risk has improved and
required a redesign of the methodology. In this new comprehensive design, the motion
capture technology was updated along with the point-force sensors. Surface
electromyography remained vital to the determination of biomechanical risk and the
methodology for implementation remained similar. A force plate was implemented in
place of the accelerometers for the determination of moment and reaction forces as well
as center of pressure monitoring.
Force Sensing Resistors (FSR) sensors were used in the 2001 system and have
been replaced by Tekscan Flexiforce sensors with a pressure sensitive ink that changes
resistance depending on applied forces. The thin flexible poin-force sensors are able to
fit between the hand and the tool without impeding the operation of the device and allow
for the recording of grip forces and those applied to the buttons and levers actuated
during device use.
Motion and subject posture was previously studied using a seven-camera opto-
electronic motion capture system which was updated to a 24-camera opto-electronic
motion capture system to track passive reflective markers on specific anatomical
landmarks of the subject performing a task representative of typical tool use. The
updated system is able to observe a larger capture volume and detect greater detail. The
motion capture system would record the position of the markers in three-dimensional
(3D) space, allowing for a quantitative measurement of posture and joint angles during
the duration of the task. Information such as angular velocity and acceleration of the

3
joints can also be calculated.
The benefit of having exact postural measurements becomes evident when
compared with surface electromyography and grip force readings that occur during the
recorded task. Surface electromyography methods remain similar to those instituted by
Peterson in 2001. All of the data collection methods are triggered to start simultaneously
so that the data from each method can be compared, standardized by time. Surface
electromyography can be used to evaluate the muscle recruitment of any activated
muscle. Larger muscles such as the biceps, deltoid and trapezius muscles can indicate
levels of recruitment associated with supporting large loads, while muscles such as the
flexor carpi ulnaris (FCU) and extensor carpi ulnaris (ECU) are responsible for
stabilizing the wrist during gripping tasks. Since muscle activation is effected by both
posture and grip forces, force measurements also play a role in correlations between opto-
electronics and electromyography.
Force plate measurements at the feet of the subject record friction forces which
are a result of push and pull forces generated while a hand tool task is being performed.
If a subject is rotating or torqueing a tool, the reaction moments can be determined from
the force plate measurements. The force plate is also able to track the center of pressure
of the subject throughout the duration of a hand tool task, which can indicate shifting
weight and position on the force plate.
The combination of all of these metrics as well as subject anthropometry and
qualitative subject surveys can yield a more complete evaluation of the occupational
workload as a result of a specific hand tool or related task. When the study methods are
able to correlate, they can provide a better means of assessing the amount of

4
biomechanical exposure a tool user must endure than any single metric can on its own.
The methodology proposed can be further applied to incorporate other metrics such as
accelerometers for evaluating tools with a vibration component such as some pneumatic
and electric hand tools used in industry.
1.2 Background of Application
In recent years, the widespread acceptance of minimally invasive surgical
procedures has led to a rise in its popularity as a modern surgical option. Minimally
invasive surgery (MIS) is a desirable option for patients who hope to have minimal
scarring and an improved recovery time. However, with this increased popularity comes
an increase in MIS caseload for surgeons. Increasing surgeon caseload results in more
hours spent doing minimally invasive surgery per week. With a greater number of hours
per week spent in MIS surgery, surgeons are exposed to a greater number of
biomechanical risk factors. Increased working hours also implies that there is less time to
rest resulting in fatigue that may compound biomechanical exposures and lead to injury.
The Center for Disease Control and Prevention reported that 57.1 million surgical
and nonsurgical procedures occurred in 2006, 34.7 million were outpatient surgeries
(Cullen et al. 2009). The CDC also stated that endoscopies were the most common
outpatient procedure. This number is up from 20.8 million in 1996, an increase of more
than 1 million surgeries each year. The vast increase in the number of minimally
invasive cases performed in recent years has led to a noticeable increase in
neuromuscular injuries in surgical staff associated with procedures such as standard
laparoscopy.

5
Ergonomic evaluations of modern laparoscopic instruments currently exhibit a
high degree of qualitative research in the forms of surveys, questionnaire, and
video/photograph observations. While these methods are in no doubt vital to the
development of safe and comfortable instruments there lacks a significant quantitative
presence that should be required to evaluate the design and impact laparoscopic devices
have on surgeons. Current quantitative research is largely limited to surface
electromyography, which while beneficial is difficult to draw significant conclusions
from without supporting data on posture and resulting forces. Correlations that can be
made between force, motion, and surface electromyography can validate conclusions and
observations drawn from qualitative research techniques, bridging the gap that exists
between what is comfortable and what is physically safe for repeated use.
After a review of current and past published work, it becomes apparent that the
majority of ergonomic analysis pertains to laparoscopic tools involved with suturing and
tissue manipulation such as needle drivers, forceps, and graspers. While these tasks often
involve a great deal of motion and compose a large portion of the time spent in minimally
invasive surgical cases, there are other laparoscopic tools that require ergonomic
investigations. Many other surgical devices such as staplers have not been studied
beyond their end effect on target tissue. A comprehensive methodology that is easily
applied across surgical disciplines can lay the ground work for ergonomic evaluations of
all surgical hand tools.
In order to observe the current state of the situation, several research teams set out
to observe and record instances and reports of neuromuscular injury in surgical staff.
Hemal et al. (2001) distributed a questionnaire to evaluate frequency and degree of

6
discomfort experienced by practicing surgeons. The questionnaire was answered by 240
surgeons, 131 of which were laparoscopic surgeons. The laparoscopic surgeons reported
a greater number of cases of finger numbness and eye strain. In a study reported by Park
et al. (2010) 317 laparoscopic surgeons were given a similar survey and 272 (86.9%)
indicated some level of discomfort from performing surgeries. The level of discomfort
was correlated to high case volumes. Sixty-two percent of the MIS surgeons surveyed
indicated that musculoskeletal symptoms aggravated from performing surgery were
persistent even after the procedure. This indicates a potential for repetitive motion strain
as a cause of the physical wear on the surgical staff.
When considering the current status of the ergonomic situation in the surgical
occupation, it is vital to consider the rising number of female surgeons in the professional
population. Due to gender differences in anthropometry device design becomes more
important. Surgical instruments need to be made safe and manageable for a wider range
of hand sizes. Glove sizes range from 5.5 to 9 in 0.5 size increments. Park et al. (2010)
reported that in a cohort of surgeons, female glove size averaged 6.57 while male glove
sizes were 7.85 on average. In the same cohort, female surgeons were also 5.1 inches
shorter than male surgeons. In the past, operating room and surgical device design has
been geared towards a predominantly male surgeon population. With many surgical
instruments designed in one size, they fail to take into account the increasingly wide
range of hand sizes within the professional population.
In comparison with traditional open surgery, laparoscopic surgery puts a number
of new demands and restrictions on the surgeons. It requires the surgeon to now observe
the surgical plane through a monitor and with limited tactile feedback. Moving the

7
instruments through trocars and orienting them correctly within the body can result in
various sustained unnatural postures and awkward working angles. Berguer et al. (1999;
2003) conducted several studies comparing open and laparoscopic surgical techniques
and their impact on the practicing surgeon. One of Berguer’s studies (2003) compared
sEMG readings on forearm muscles for a 90 second knot tying exercise performed first in
an open scenario with two hemostats and then in a laparoscopic trainer with 2 axial
instruments. The results of the laparoscopic trials exhibited higher sEMG amplitudes for
all recorded muscle activation signals. Qualitative feedback also confirmed that
participants felt there was greater discomfort during the laparoscopic portion of the test.
In the other study put forth by Berguer et al. (1999), the team observed the perceived
stress of the surgeon. Surgeons underwent skin conductance tests and an
electrooculogram at rest, then in an open trial with hemostats, and finally in a
laparoscopic trainer with two needle drivers. After task completion, the surgeons
reported their perceived efforts and stress levels. During the laparoscopic trials the
number of eye blinks was shown to increase along with skin conductance. Fewer knots
were tied within the allotted two minute time period for laparoscopic trials as well. A
study conducted by Nguyen et al. (2001) incorporated eight, live laparoscopic and eight,
live open surgeries. A post-operative survey evaluated presence, location, and intensity
of pain, numbness, or stiffness. One hour of video footage was also recorded for each
operation and later evaluated noting surgeon posture, flexion/extension of upper
extremities. Laparoscopy exhibited better neck and trunk posture than open; however,
there was far more extensive upper extremity motion and shoulder stiffness associated
with laparoscopy.

8
Standard laparoscopy, being the most common and widely practiced form of the
minimally invasive surgery, still needed to be evaluated further. Many researchers chose
to change their focus from the overall environment to the localized human/machine
interactions of tool use. This means observing surgical staff as they use the devices
required for surgery and studying how those tools affect posture, range of motion, and
level of exertion. Many studies focused on evaluating the effects of certain design
variations and how those designs impacted surgeon performance during a number of
tasks.
Other studies targeted and compared certain instruments themselves. Trejo et al.
(2006) conducted a written survey of 38 surgeons who gave opinions on a number of
problems with conventional laparoscopic graspers. The surgeons were introduced to an
articulating grasper prototype and they felt it would alleviate some of the discomfort
caused by the conventional tools. Amaral et al. (1994) reported a study evaluating a
rotating dual position laparoscopic handle that could rotate from a pistol grip to an in-line
grip. The purpose was to evaluate if this ability to alter the grip type within a procedure
reduced fatigue and improved surgeon performance. Photo analysis and qualitative
feedback showed that switching handles could reduce wrist angles of 55 degrees to a
neutral position and that the surgeons felt increased instrument control and less fatigue
compared to static handles. Another study presented by Uchal et al. (2002) was aimed at
comparing pistol grip and in-line devices with respect to procedure effectiveness and
forearm workload. Procedure effectiveness was evaluated by observing the motions of
the surgeon and labeling them as goal oriented or non-goal oriented. Surface
electromyography was used to evaluate forearm workload. Surgeons were asked to

9
suture a perforated ulcer onto a foam stomach and their quality was judged by tissue
damage, accuracy error, and water leak. There were 46 surgeons in the study and the
pistol grip device was shown to cause more tissue damage and more non-goal directed
motions during suturing.
Several other studies focused on designing guidelines or standard methods of
evaluating tool prototypes for ergonomic potential. One such study published by van
Veelen et al. (2001) focused on identifying ergonomic criteria for designing laparoscopic
forceps. The requirements pertain to hand-arm posture, hand-arm forces, compressive
forces in hand, finger movement, left handed user, and anthropometry of user population.
When evaluating three conventional handles, they administered a questionnaire and video
analysis of subjects to observe the criteria. A review of laparoscopic mechanisms
reported by Lim et al. (2003) was developed to categorize design features and options
available to replace and benefit existing designs. The review contains five categories
(inputs, intermediate mechanisms, outputs, design, and activation). These categories
refer to such aspects as power supply, functionality, complexity, and manually activated
vs. power driven mechanisms.
After reviewing the current literature on ergonomics in laparoscopic surgery, it
was clear that a comprehensive approach to quantitatively reporting on the biomechanical
risk factors associated with surgical hand tools had not yet been performed. The exact
posture of a surgeon can be recorded during laparoscopic tasks by utilizing an opto-
electronic motion capture system. Electromyography is used to evaluate muscle
recruitment and workload for small forearm muscles used in wrist stabilization. Point-
force sensors are used to investigate hand forces used to actuate and grip various features

10
of medical devices. High palm forces during grip tasks have been shown to increase
pressure on peripheral nerves. The force plate gathers information on the surgeon’s
center of pressure on the plate as well as moment and friction forces resulting from push,
pull, and twisting motions of hand-held devices. Combining these methods allows for a
comprehensive understanding of the biomechanical risks of laparoscopic surgery.
2. Methods
The methods in this experiment stretch across numerous research
modalities. The instrumentation involved in this comprehensive study defines the
methodology and the experimental setup of said instrumentation can be applied to many
applications.
2.1 Instrumentation
As outlined in Figure 2.1, a 24-camera opto-electronic motion capture system was
used along with sEMG, point-force sensors, and a multi-component force plate to study
the biomechanical risks associated with tool use. Figure 2.1shows the direction of data
flow and trigger signal path where data collection was initiated with a single nine volt
external trigger source to ensure simultaneous data capture from all systems. Each piece
of instrumentation involved in the research required specific calibration procedures to
ensure accuracy. Subject methodology included anthropometry, goniometry, and subject
surveys that all gather information on the population to be studied. The combinations of
these methods of evaluation were crucial for making inter-subject comparisons and
drawing correlations to larger population percentiles. The integration of these methods
that resulted in a comprehensive approach to analyzing the biomechanical risks
associated with tool use.

11
Figure 2.1: Flow chart outlining setup for experimental methods
(Blue Arrows indicate Data Bulk Path and Black Arrows indicate Trigger Signal Path)
2.1.1 System Triggering
Triggering the full system requires a signal to be sent simultaneously to both the
motion capture system and analog-to-digital data acquisition (DAQ) system to initiate
data capture. A number of different triggering setups were tested in order to determine
the optimal trigger response from the entire system.
A minimum 2.7 volt signal was required for initiation of the motion capture
system, where the moment of initiation could be set to the rising or falling edge and/or
high or low gated signals. In order to test the time synchronization between the two
systems, a weighted, reflective marker was dropped from a fixed height onto a force plate
(Kistler 9286BA; see section 2.1.4 for description) as shown in Figure 2.2. The resulting
position and impact data was analyzed in Excel (Microsoft: Redmond, WA) where the
time of the lowest position recorded in the vertical axis of the motion capture system was

12
compared with the first instance of impact with the force plate. In addition, subsequent
bounces of the marker were also evaluated for time synchronization.
Figure 2.2: Trigger validation testing setup between force plate and motion capture
Since internal trigger sources were not providing a consistent trigger between the
two systems, an external signal source was implemented. A battery switch device was
developed to supply the power for the trigger signal and the on-off control (see Figure
2.3). A nine volt battery was used to power the trigger signal, which was well within the
13 volt maximum allowed by the OEMC system. The signal was provided to a T-
junction that was hard wired to the external sync inputs of the DAQ system and the
master hub of the OEMC system.

13
Figure 2.3: System trigger with nine volt battery, toggle switch, and T-junction
The results from the trials with the external trigger source are shown in Table 2.1,
where the mean offset from 10 trials was observed to be 0.00195 seconds (or 1.95
milliseconds) with a 1.1 millisecond standard error. Increasing the accuracy of this offset
is difficult for simultaneous data collection given the maximum 100 frames per second
sampling rate of the OEMC system compared with the 4 kHz sampling of the DAQ
system. The delay may be non-existent and a product of the low sampling rate of the
OEMC system. The human body does not require accuracy to the millisecond, since the
neuromuscular response can take from 30 to 150 milliseconds to enervate a muscle
(Schultz et al. 2000).

14
Table 2.1: Triggering synchronization validation results
Trial
Motion
Capture ForcePlate Discrepancy
Time (sec) Time (sec) Time (sec)
1 4.65935 4.65900 0.00035
2 3.89930 3.89700 0.00230
3 2.66856 2.67225 0.00369
4 3.87900 3.87775 0.00125
5 2.57905 2.57675 0.00230
6 3.10944 3.11275 0.00331
7 3.29861 3.29625 0.00236
8 3.12913 3.12950 0.00037
9 3.52910 3.53000 0.00090
10 4.97869 4.97600 0.00269
Mean Offset 0.00195
SEM 0.00112
Stdev 0.00118
2.1.2 Surface Electromyography
Surface electromyography (sEMG) was used to record muscle activation of the
Flexor Carpi Ulnaris (FCU) and Extensor Carpi Ulnaris (ECU) of the subject’s right
forearm. The silver-silver chloride (Ag/AgCl) sensors and sEMG conditioning box were
both custom built. The sensors were instrumented with a pre-amplification circuit with a
gain of 100 and the conditioning box, shown in Figure 2.4 contained transformer isolated
inputs as well as a bandpass filter with a 30 to 1000 Hz passband. The reference node
was attached proximal to the subject’s right wrist via a HP 40493A Foam Monitoring
Electrode. Each sensor was attached to the alcohol-cleaned skin with two E401 In Vivo
Metric electrode washers securing each sensor to its desired location over the muscle
belly. Sensors were cleaned after each use with cotton swabs and hydrogen peroxide to
ensure accuracy. Figure 2.5 shows the electrodes applied to the forearm of a subject.

15
(a) (b)
Figure 2.4: Surface electromyography conditioning box front view (a) back view (b)
Figure 2.5: Applied surface electromyography electrodes
2.1.3 Force Sensors
FlexiForce sensors (Tekscan: South Boston, MA), seen in Figure 2.6, were used
to record instrument grip and actuation forces during simulated tasks. These sensors have
been shown to have a repeatable, linear relationship between applied force and resistivity
(Ouckama and Pearsall, 2004; Ferguson-Pell et al. 2000). The sensor area contains an
ink which changes electrical resistance as forces are applied to the sensory area. The
polyester film sensor contains silver conductive strips that run along the flexible film to a
male Berg connector. The sensor output is connected to an input of a custom built force
conditioning box (see Figure 2.6), which passes the FlexiForce signal through a second

16
order low pass filter with a 20Hz cut-off frequency. The signal gain is calculated
depending on the resistivity of the sensor area as a result of applied force. The output
from the force conditioning box is then sent to the DAQ system.
(a) (b)
Figure 2.6: Tekscan flexible force sensor (a) and force sensor conditioning box (b)
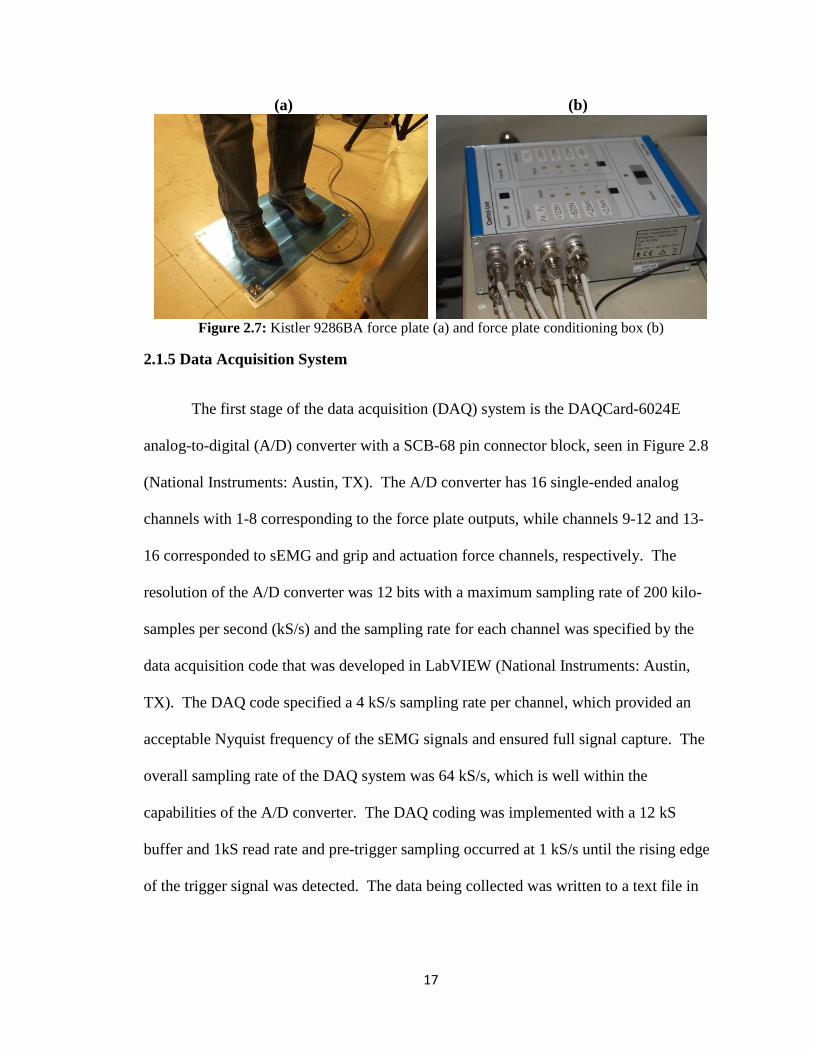
2.1.4 Force Plate
The Kistler 9286BA force plate was used to track center of pressure as well as
reaction moments and forces (see Figure 2.7). The force plate has four sensors with three
degrees of freedom and the force plate data is relayed to a conditioning box that specifies
loading ranges in the horizontal and vertical axes. The conditioning box, Figure 2.7,
outputs eight channels to the DAQ system corresponding to the outputs from all four
sensors.
17
(a) (b)
Figure 2.7: Kistler 9286BA force plate (a) and force plate conditioning box (b)
2.1.5 Data Acquisition System
The first stage of the data acquisition (DAQ) system is the DAQCard-6024E
analog-to-digital (A/D) converter with a SCB-68 pin connector block, seen in Figure 2.8
(National Instruments: Austin, TX). The A/D converter has 16 single-ended analog
channels with 1-8 corresponding to the force plate outputs, while channels 9-12 and 13-
16 corresponded to sEMG and grip and actuation force channels, respectively. The
resolution of the A/D converter was 12 bits with a maximum sampling rate of 200 kilo-
samples per second (kS/s) and the sampling rate for each channel was specified by the
data acquisition code that was developed in LabVIEW (National Instruments: Austin,
TX). The DAQ code specified a 4 kS/s sampling rate per channel, which provided an
acceptable Nyquist frequency of the sEMG signals and ensured full signal capture. The
overall sampling rate of the DAQ system was 64 kS/s, which is well within the
capabilities of the A/D converter. The DAQ coding was implemented with a 12 kS
buffer and 1kS read rate and pre-trigger sampling occurred at 1 kS/s until the rising edge
of the trigger signal was detected. The data being collected was written to a text file in

18
ascii format as 16 columns of data which corresponded to each channel. The front panel
and block diagram of the data acquisition code are shown in Figure 2.9.
Figure 2.8: National Instruments SCB-68 pin connector
Figure 2.9: Data acquisition LabVIEW front panel and block diagram
2.1.6 Motion Capture
The opto-electronic motion capture (OEMC) system used in this experiment was
an OptiTrack 24-camera system (Natural Point: Corvallis, OR) using the OptiTrack Flex
V100 R2 camera models, as shown in Figure 2.10. The OEMC system, capable of
capturing data at 100 frames per second (fps), was set to 50 fps in order to limit the
amount of data points and file size for this approach. In addition, the cameras were
organized on portable stage scaffolding to maximize capture volume.
The cameras were connected via the Optihub system in which there were four
camera hubs and each one was hard wired to six cameras. The first hub served as the

19
master hub (see Figure 2.10), which read the trigger signal and synchronized the other
three slave hubs in a daisy-chain setup. Each hub was connected to the computer via a
USB cable and each was connected to separate USB hubs on the computer to assure
maximum bandwidth was available for rapid data flow.
(a) (b)
Figure 2.10: OptiTrack Flex V100 R2 motion capture camera (a) and
Optihub master camera hub for OptiTrack motion capture system (b)
2.1.7 Grip Force Dynamometer
Maximum grip forces of the participating subjects were taken for each hand.
Subjects were asked to grasp a grip dynamometer and perform a maximal full-hand grip
while they maintained a neutral arm position. Grip span was kept constant between
subjects at 6 cm, which was within the acceptable range indicated by Chaffin and
Greenberg (1976). The dynamometer used (Takei T.K.K. 5401 Grip-D dynamometer) is
shown in Figure 2.11.

20
Figure 2.11: Takei T.K.K. 5401 Grip-D dynamometer
2.2 Calibration
Calibration was necessary to ensure accuracy of the data, since sensors were
exposed to wear that can damage or alter the way it received signals every time it was
used. Calibrating sensors before subject trials provided a means of adjusting for its
current sensitivity and of checking for sensor error and damage. Sensor calibration data
was also required to convert raw voltage signals to meaningful units, such as pounds for
force and percent maximum voluntary contraction for sEMG.
2.2.1 Electromyography Placement and Maximum Voluntary Contraction
Procedure
Before placing any surface electrodes a subject, the skin was prepared with an
alcohol swab and, if necessary, was shaven to ensure proper coupling. All of the sEMG
channels were set with a base gain of 2k to ensure proper signal amplification from small
forearm muscles. The first area prepared was the dominant arm just proximal the wrist
joint where the reference electrode was placed. Subjects were instructed to ulnar deviate
their wrist repeatedly while simultaneously extending their wrist so that the ECU could
be palpated in order to locate the muscle belly. Once this was done the electrode gel was

21
applied to the contacts of the sEMG sensor and placed over the muscle belly. Using an
oscilloscope to observe the electromyography signal, proper sensor placement was
confirmed and adhesive washers were attached to fix the sensor to the arm.
The subjects were instructed to complete a series of maximum voluntary
contractions (MVC) with the extensor carpi ulnaris. Determining a subject’s MVC level
allows for the determination of the degree of muscle recruitment during the experimental
trials as a percent of the level (i.e. %MVC). The %MVC was used to compare muscle
recruitment levels across a population of subjects, where individual voltage levels vary
widely making direct comparison difficult (Claudon, 1998; US Dept. HHS, 1992). A
LabVIEW program (Triggered System.vi) was executed that recorded all 16 channels
from the A/D converter to a specified file path, while the subject was asked to perform
five-second maximum muscle contractions by ulnar deviating and extending their wrist to
their best ability. This procedure was repeated three times with resting periods in
between trials to minimize the effects of fatigue and to ensure the proper capture of the
MVC signal each time.
The second muscle studied was the FCU of the forearm, for which the location
and MVC capture procedures were kept the same, with the exception that the muscle was
activated by simultaneously ulnar deviating and flexing their wrist. The EMG signals of
the forearm muscles were conducted on both arms of each subject for a better
understanding of the effort involved in manipulating hand tools. An example raw signal
from a maximum voluntary contraction trial is shown in Figure 16.

22
Figure 2.12: Raw voltage signal from a maximum voluntary contraction trial
2.2.2 Force Sensor Calibration
The force sensors were each individually calibrated before being used in the
experimental trials. A finger pinch force gauge (B&L Engineering: Santa Ana, CA) with
a 30 pound maximum was used to conduct the sensor calibrations. Prior to each
calibration, a randomization table was generated in Excel to generate numbers from zero
to 20 pounds in 2.5 pound increments. Each sensor was placed between two hard
surfaces and the gauge was pressed to the randomized pound value visible on the guage’s
analog scale. The peak voltage reading from the force conditioning box was read by a
multimeter shown in Figure 2.13 and recorded in Excel.

23
Figure 2.13: Force sensor calibration procedure
Once all measurements were completed, a linear best-fit line was calculated for
the force-voltage relationship. The slope and intercept of this line represented the offset
and sensitivity of the sensor tested, as seen in Table 2.2. The data collected during the
experiments was converted to pounds using these calibration values by either adding or
subtracting the offset (intercept) and multiplying by the sensitivity (slope).
Table 2.2: Sample force sensor calibration data
Force Sensor 1
Force (pounds)
Voltage (volts)
0.0 0.0140
2.5 0.0880
5.0 0.2150
7.5 0.3220
10.0 0.4030
12.5 0.4410
15.0 0.5240
17.5 0.6470
20.0 0.7530
slope 0.0358
intercept 0.0206

24
2.2.3 Force Plate Calibration
The Kistler 9286BA force plate was factory calibrated and was meant to maintain
its calibration; however, it must be regularly tested and validated. A randomization table
in Excel randomly generated weights from zero to 45 pounds in five pound increments
and weights were placed on the force plate according to the randomized table to
determine the reliability of the current calibration, as seen in Figure 2.14.
Figure 2.14: Force plate calibration confirmation
The force plate conditioning box was set to 125N for Group I (horizontal force
range) and 5kN for Group II (vertical force range) so that the force plate wouldn’t
overload during human testing. After powering on the conditioning box, the ranges were
selected and the “Operate” button was be pressed to initiate data flow. A LabVIEW code
was written (System Check.vi) to record force plate readings while weights were applied
in the order selected by the randomization table. Once the weight sequence was
completed, the data was run through a MATLAB code (MathWorks: Natick, MA)
(forceplateprocessing.m) to convert the voltage from the force plate to pounds. The
pound values were compared to the applied weights to check for inconsistencies in the

25
factory calibration (sample data is shown in Table 2.3). This data determines if the force
plate needs to be recalibrated or a correction factor must be applied to the trial data.
Table 2.3: Sample results from calibration procedure showing mean error
Force Plate Calibration Check
Weight (pounds)
Measured Weight (pounds)
Discrepancy (pounds)
10 11.1641 1.1641
0 0.2310 0.2310
35 36.0753 1.0753
15 16.1301 1.1301
30 30.5202 0.5202
40 41.6416 1.6416
20 20.5701 0.5701
25 25.6171 0.6171
45 46.5379 1.5379
5 5.0910 0.0910
Mean Error (pounds) 0.8578
Standar Deviation of Error 0.5027
2.2.4 Opto-electronic Motion Capture Calibration
The calibration for the OEMC system was performed using the Arena software
(Natural Point: Corvallis, OR) for which the cameras were set up with overlapping fields
of view and connected to the computer so that the software calibration wizard could step
through the calibration procedure. After selecting “Wizards” and then “Calibration,” the
“Full Calibration” was conducted with the three-marker wand, since using a three-marker
wand yields a more accurate calibration than a single-marker wand. The next step
involved adjusting the cameras to suit the environment in which they were operating. In
the trials of this study, exposure was set to approximately three, while intensity of the
infrared LEDs was adjusted to level 15. The supplied frame used to orient the axes of the

26
motion capture plane was placed in the center of the capture area where the focus of the
trial was taking place.
For example, during this application the frame was placed at the height and
location of the surgical trainer and, since all cameras must view the entire frame, it sets
the focus of the motion capture system on the surrounding area. Once the frame had been
set, the frame markers were covered and the option to “Block all Visible Points” was
selected to remove all extraneous markers within the capture volume, leaving only the
frame markers visible once uncovered. The next step was to “Start Wanding” by
repeatedly swirling the wand just above the frame as shown in Figure 2.15. Moving the
wand along the axes of the frame and changing its orientation assured that all cameras
accrued a high enough sample size to ensure a high quality calibration. Once the
calibration wizard indicated “High Quality,” the “Calculate” button was selected to test
the calibration and then selecting “Apply” set the final calibration. If the camera
calibrations did not read either “Excellent” or “Exceptional” for each camera, then the
procedure was repeated. The next step in calibration was to set the floor plane by
placing the frame on the floor, and confirming that the markers were clearly visible on
the monitor. After entering the size of the frame used, based on the distance between the
markers in the z-axis, “scale capture volume” was selected and the floor plane was set.
The final step of the calibration procedure was to save the calibration file so that it could
be opened with a subject’s project file.

27
Figure 2.15: Motion capture calibration with three-marker wand
2.3 Subjects
Subject methods pertain to the means of gathering information about a population
of subjects to be tested by using both direct and indirect measurements. Direct
measurement was in the form of anthropometry and goniometry, which were used for
gathering information on a subject’s physical dimensions and characteristics. Indirect
measurement included surveys, intended to gather information on work and exposure
history, as well as basic demographics and any applicable background information. The
placement of reflective markers and the management of sensor wires were also
considered to be subject specific and vital to subject performance during experimental
trials.
All subject investigations were approved by the University of Connecticut Health
Center Institutional Review Board (IRB) including the subjective and objective measures.

28
2.3.1 Anthropometry
Subjects reported their height and weight on a provided background survey and
were asked to place their hand on a clipboard with a ruler so that a high resolution
photograph could be taken with a digital camera. This approach minimized time spent
taking hand measurements during the actual trials since the photographs were analyzed at
a later time using ImageJ (National Institutes of Health; Bethesda, MD) image analysis
software in which the ruler was used to scale image length in pixels with the actual length
in inches. Once scaled, a set series of anthropometric measurements were gathered for
each subject as shown in Table 2.4 and Figure 2.16.
Table 2.4: Anthropometry measurement table
# Measurement
1 Hand Breadth
2 Hand Length
3 Digit 1 length from MCP joint
4 Digit 2 length from D1 MCP joint
5 Digit 2 length from MCP joint
6 Digit 3 length from MCP joint
7 Digit 4 length from MCP joint
8 Digit 5 length from MCP joint

29
Figure 2.16: Anthropometry measurements
2.3.2 Goniometry
Upper body and upper extremity ranges of motion for each subject were measured
using two manual goniometers and the methodology adapted from Norkin and White
(1985). The methods outlined by Norkin and White created a consistent, repeatable angle
measurements procedure that was kept constant from subject to subject. Having
observed maximum joint angles, deviations, and total ranges of motion created a means
of comparison between subjects using the OEMC data. Figure 2.17 illustrates a manual
measurement of a subject’s neck at full right tilt.

30
Figure 2.17: Determination of maximal joint angles using manual goniometry
2.3.3 Surveys
The use of surveys and subjective response evaluations played a very important
role in gathering demographic information and gauging subject psychophysical response
to biomechanical risk factors. Surveys that were completed by the subjects gathered
basic information such as years in profession, hours worked per week, type of work and
job skills required to determine exposure history.
Other types of surveys were used to evaluate the psychophysical state of subjects,
which included subjective evaluations of usability parameters that may occur in the
workplace or while operating a specific tool. After the completion of a trial period,
subjects were given analog response evaluations to evaluate the hand tools for several
key usability parameters. Each parameter had a line running from “Very Good” to “Very
Bad” and subjects placed a tick mark on the line where they felt the instrument fit within
the spectrum. Subjects evaluated each device on six different metrics and the tick mark

31
on each line indicated their opinion of the device for that parameter. The analog scales
were scanned into a computer and, using image analysis software, the tick marks were
assigned values from zero to 10 as a proportion of line length and resulted in a score for
that parameter.
The first metric was “Effort to Grip,” which evaluated how much effort was
required to hold the device. The second metric, “Comfort of Grip,” asked a subject to
mark how comfortable they felt the grip design to be. “Balance of Tool” was the third
metric and was intended to evaluate how a subject felt the device’s center of gravity
impacted their overall impression of the device. The fourth metric, “Effort to Position
Tool,” pertained to the ease or difficulty of positioning the device on the target tissue
within the trainer. In the fifth metric, “Effort to Actuate,” indicated how much a subject
had to exert in order to complete a task. The final metric, “Overall Ease of Use,”
represented overall use and intuitiveness of the device. By conducting a study comparing
hand tools with a population of subjects, it was possible to draw statistically significant
conclusions on these parameters given the size of the subject population. An example of
an analog evaluation survey answer and scoring method is shown in Figure 2.18.

32
Analog Score
Figure 2.18: Example of analog evaluation parameter and scoring
2.3.4 Placement of Markers
The placement of the retro-reflective markers for the OEMC system followed a
well-established methodology of using anatomical landmarks to guide marker placement
(Peterson, 2001). In this study, 23 reflective markers were placed on each subject to
represent upper body and upper extremity position. The markers were placed on the
subjects using double-sided hypoallergenic tape and were placed on the skin to minimize
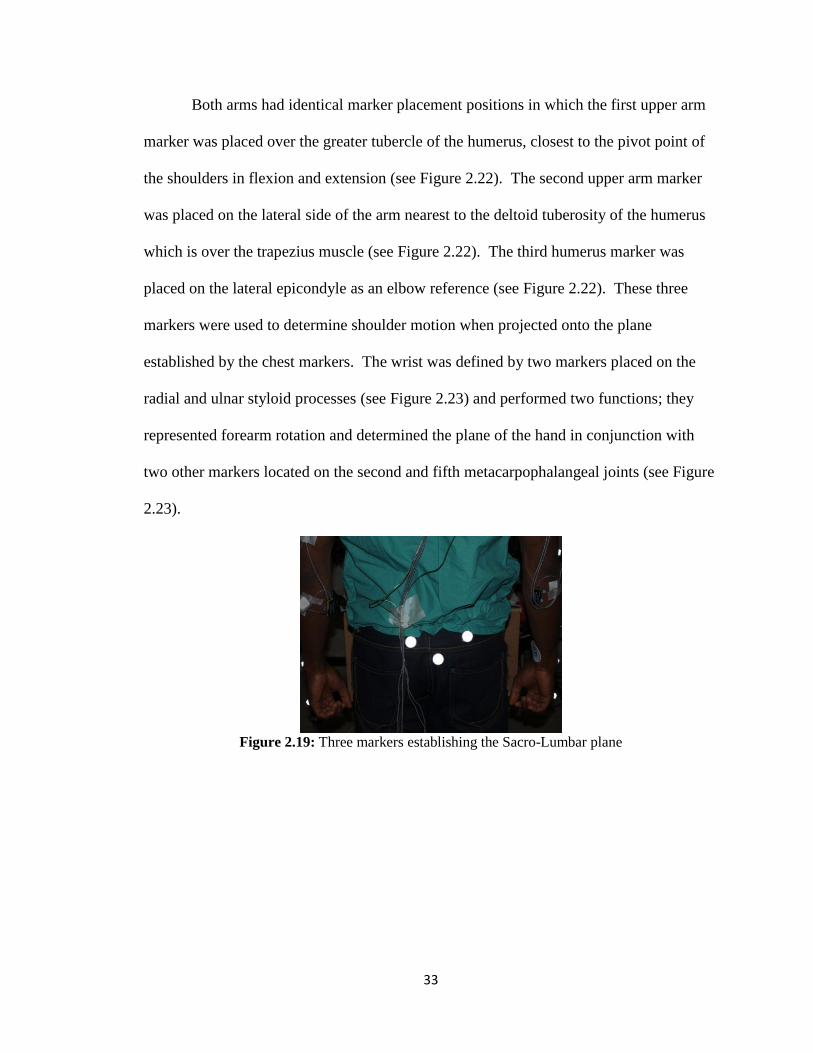
the error that would result from the movement of clothes. Three markers were placed
over the junction of the sacrum and lumbar spine (see Figure 2.19) and were used as a
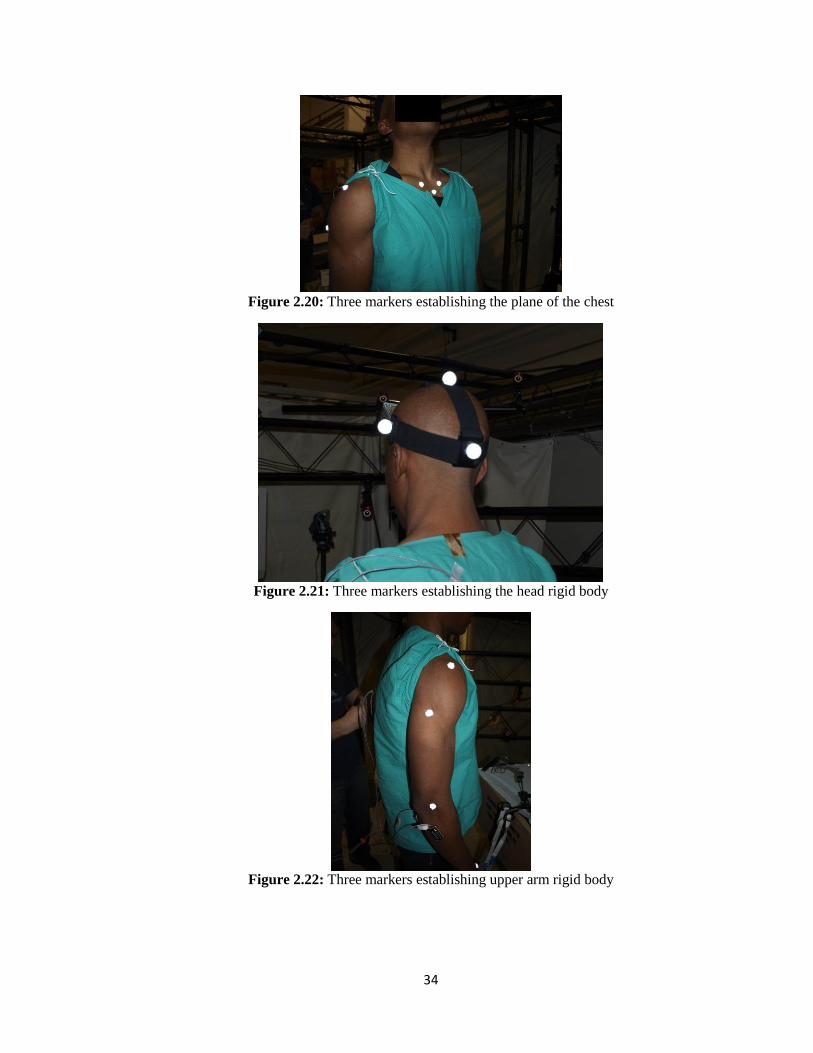
reference for trunk deviation. The three markers that were placed on the manubrium and
medial ends of the clavicles represented the chest plane of the subject and were used to
represent trunk deviation (see Figure 2.20). The chest markers also acted as a reference
for head deviation and shoulder motion and the three head markers were used to
determine head rotation and tilt (see Figure 2.21).
Subject Evaluation of a Parameter
Computer Scoring of Evaluation
33
Both arms had identical marker placement positions in which the first upper arm
marker was placed over the greater tubercle of the humerus, closest to the pivot point of
the shoulders in flexion and extension (see Figure 2.22). The second upper arm marker
was placed on the lateral side of the arm nearest to the deltoid tuberosity of the humerus
which is over the trapezius muscle (see Figure 2.22). The third humerus marker was
placed on the lateral epicondyle as an elbow reference (see Figure 2.22). These three
markers were used to determine shoulder motion when projected onto the plane
established by the chest markers. The wrist was defined by two markers placed on the
radial and ulnar styloid processes (see Figure 2.23) and performed two functions; they
represented forearm rotation and determined the plane of the hand in conjunction with
two other markers located on the second and fifth metacarpophalangeal joints (see Figure
2.23).
Figure 2.19: Three markers establishing the Sacro-Lumbar plane
34
Figure 2.20: Three markers establishing the plane of the chest
Figure 2.21: Three markers establishing the head rigid body
Figure 2.22: Three markers establishing upper arm rigid body

35
Figure 2.23: Four markers establishing hand rigid body
2.3.5 Cable Management
Managing the wires that were connected to sEMG sensors and the flexible force
sensors was imperative to the experimental design for a number of reasons. In order for a
subject to have full mobility during the simulation of unrestricted field work, they must
not be hindered by the placement of sensors. Wires along the body of the subject that are
not properly managed have the potential to reduce subject ranges of motion, damage
sensors, and cause marker drop by blocking the motion capture cameras’ line of sight.
Taping wires down and bundling them together reduced their profile and any noise that
could have occurred from electromagnetic interference between cables. Sensor wires
were taped with loops of slack over joints such as the elbow and the shoulder to allow for
freedom of movement, as shown in Figure 2.24. The wire slack also protected sensors
from any cable tension that could occur under the dynamic conditions of trial runs.
Subjects were asked to move through their full range of motion and confirm that there
was no impedance of motion before trials began. Electromyography wires were bundled
and taped down the back of each subject while the force sensor wires were run from the

36
hand tool to the floor and around the subject to avoid clutter and impedance of the
subject’s range of motion.
Figure 2.24: Cable management allowing for freedom of movement
2.4 Application
Applying these methods to the study of laparoscopic surgical tools required the
integration of each method into a single system setup and tested prior to subject arrival,
especially since the force sensors and force plate are not directly instrumented on the
subjects themselves. The entire system contained numerous data collection methods
initiated simultaneously by an external source in order to capture data on a synchronized
timescale.
2.4.1 Experimental Setup
The experimental setup was broken down into three major components with the
first part being the surgical plane, where the subject performed the specified tasks using
the laparoscopic instruments in a custom built laparoscopic trainer. The second portion
of the experimental setup involved all components of the OEMC system. This included
all 24 cameras, which were mounted to adjustable stage scaffolding and arranged to
optimize the capture of all markers in and around the surgical plane. The third major

37
component of the setup encompassed all other modes of data collection (i.e., force
sensors, EMG, and force plate) corresponding to the DAQ system.
Subjects were asked to fill out a series of background surveys and were given an
introduction to each laparoscopic device. After tool introduction, hand anthropometry,
and range of motion measurements were recorded prior to sensor placement and subject
trials. Each subject was fitted with 23 reflective markers placed on musculoskeletal
landmarks of the upper body, while another five markers were placed on the instrument
and six were placed on the trainer to identify its upper and lower horizontal surfaces.
Each arm of the subject had two sEMG sensors placed over the bellies of the FCU and
ECU muscles that were selected for their synergistic role in stabilizing the wrist during
grip tasks (Berguer et al. 2002; Trejo et al. 2006; Uchal et al. 2002; Matern et al. 2002;
Matern et al. 2004; Manukyan et al. 2007; Quick et al. 2003 ). The reference node for the
sEMG system was placed just proximal to the subject’s right wrist.
Four point-force sensors were placed on each instrument to evaluate metrics such
as palm forces and those imposed on levers and buttons. Once all of the sensors were
placed, the wires were taped down so as not to interfere with any device functions or the
subject’s freedom of movement. Subjects were asked to stand on a force plate during
each trial. Each subject was randomly assigned six tasks which randomly selected a
laparoscopic device and a position commonly associated with laparoscopic surgery. A
fully instrumented subject is shown in Figure 2.25 and the overall experimental setup is
depicted in Figure 2.26. Following the subject trials, all sensors were removed and
subjects were asked to fill out the subjective evaluations of each device.

38
Figure 2.25: Subject performing laparoscopic task in full experimental setup
Figure 2.26: Overall experimental setup
2.4.2 Devices
A number of devices were used to evaluate the applicability of the study
methodology to laparoscopic surgical tasks. Graspers and forceps were used to
manipulate a tissue medium within a trainer and needle drivers were fitted with sensors
and implemented in suturing tasks. Other devices such as dissectors and staplers were
also instrumented with sensors and observed.

39
2.4.3 Custom Laparoscopic Trainer
The custom laparoscopic trainer was designed primarily for the purpose of
achieving motion capture of moving elements within the trainer working volume. Many
traditional laparoscopic trainers are fully enclosed and/or did not shield the surgeon’s
vision of the working area well enough to represent a true simulation of laparoscopic
procedures. A semi-open design was required so that the OEMC camera fields of view
was able to enter the working volume of the trainer and still block the subject’s view of
the surgical plane. It was also vital to design the trainer with adjustable height settings, in
order to simulate typical operating room table height. As a solution to this design
parameter, the trainer was built to fit atop an adjustable support column for height
adjustability.
The initial size of the trainer was 20 inches wide, 20 inches deep, and 10 inches
tall and the frame was constructed of particle board and ¾ inch wooden dowels for ease
of use. The top of the trainer was covered with a neoprene rubber cover to act as
surrogate skin. The front of the trainer, closest to the subject was covered with a section
of particle board, creating a wall to prevent line of sight to the working volume of the
trainer. The sides and back of the trainer were left open to expose the working volume to
the OEMC camera array.
Early trials using this design were successful in capturing the 3D position data of
markers located within the trainer and on the tips of laparoscopic instruments moving
within the working volume. Marker drop-out made consistent data collection difficult,
since markers were occasionally lost behind the corner dowels of the trainer. Each
marker needed to be in the view of at least three cameras at all times in order to register
40
its 3D position, any obstruction created a challenging scenario for motion capture. This
was especially true since it was determined that only six OEMC cameras were able to
view the markers within the trainer, prompting a structural redesign to maximize
exposure to the OEMC camera array.
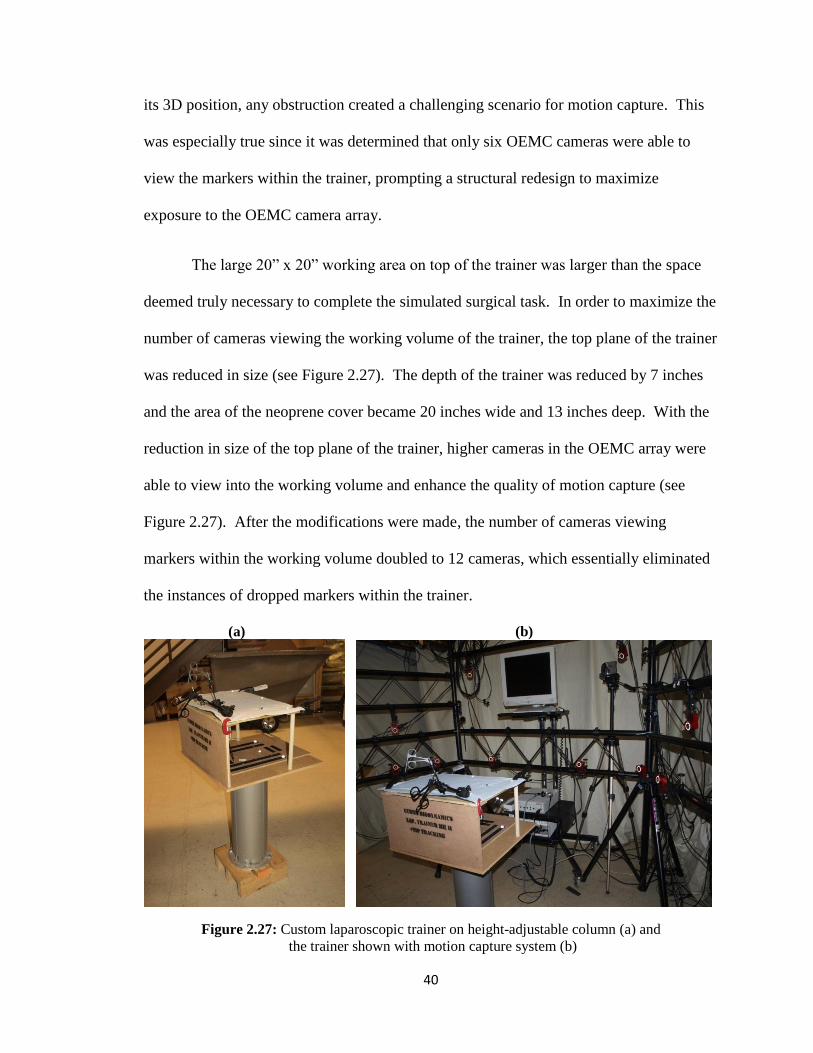
The large 20” x 20” working area on top of the trainer was larger than the space
deemed truly necessary to complete the simulated surgical task. In order to maximize the
number of cameras viewing the working volume of the trainer, the top plane of the trainer
was reduced in size (see Figure 2.27). The depth of the trainer was reduced by 7 inches
and the area of the neoprene cover became 20 inches wide and 13 inches deep. With the
reduction in size of the top plane of the trainer, higher cameras in the OEMC array were
able to view into the working volume and enhance the quality of motion capture (see
Figure 2.27). After the modifications were made, the number of cameras viewing
markers within the working volume doubled to 12 cameras, which essentially eliminated
the instances of dropped markers within the trainer.
(a) (b)
Figure 2.27: Custom laparoscopic trainer on height-adjustable column (a) and
the trainer shown with motion capture system (b)

41
2.4.4 Endoscope
A Stryker 988 endoscope and a Sony video display (see Figure 2.28) were used to
provide a visual of the working volume to the subject in a similar manner to an actual
surgical procedure. In order to mitigate a problem where the endoscope blocked hand
markers, the endoscope was set to view from an oblique angle on the side of the trainer.
Since all simulated tasks did not involve extensive manipulation of the target tissue, the
endoscope angle was not observed to negatively impact task performance.
Figure 2.28: Stryker endoscope (a) and monitor stand
situated opposite the trainer from the subject (b)
2.4.5 Tissue Surrogate
The simulated tissue used in this study was made of four layers of 2 mm thick
foam in a 3 inch by 4 inch rectangular shape. Industrial sources indicated that the chosen
tissue surrogate adequately represented stomach tissue in resistance and thickness once
compressed. The foam was held in place by a clip stand which was secured to the base of
the laparoscopic trainer with industrial Velcro to eliminate unwanted movement. The
foam in the clip stand was secured at one point allowing for some freedom of movement

42
similar to that of true tissue. An example of the mounted tissue surrogate is shown in
Figure 2.29.
Figure 2.29: Foam tissue surrogate in clip stand
2.4.6 Tip Markers
Tracking the tip motion of laparoscopic instruments was an indicator of
instrument control during the completion of laparoscopic tasks and provided a method to
monitor the subject’s manipulation of the surgical plane. While devices such as graspers
and other tools were clamped on tissue, unintentional tip motion could cause additional
tissue trauma. Tracking tip motion with two reflective markers made it possible to
measure the amount of instrument deviation as well as changes in acceleration and
velocity of the tip of the instrument.
Two markers were placed on aluminum pegs at the distal end of the device shafts
and secured using a silver alloy epoxy so as not to interfere with the action of the device.
Using a malleable, silver epoxy meant that the pegs were able to be placed on any device
shaft regardless of size or tip design. Elevating the markers on pegs increased their
visibility so that surrogate tissue never blocked the view of the OEMC camera array.

43
Figure 2.30 shows the passive reflective markers attached to the tip of a laparoscopic
instrument, with the total unit and markers weighing 14 grams.
Figure 2.30: Tip markers in tracking instrument motion within the trainer
2.4.7 Force Sensor Placement
Due to the variability of hand sizes and hand posture between subjects using
laparoscopic instruments, placement of force sensors was crucial to successful
implementation. The force sensors were attached to key features of the instruments,
which assured that they captured forces applied to elements such as triggers, levers, and
buttons as shown in Figure 2.31. This provided a means of direct correlation across
subjects who actuated these elements, whereas, if the sensors were placed directly on
subject hands, they would be more prone to slippage and lose contact with the instrument
and/or hinder subject performance.
For larger instruments, reaction forces that enter the palm through the handle were
of concern, especially since palm forces have been shown to increase carpal tunnel
pressure (Cobb et al. 1995; Lundborg et al. 1982; Szabo et al. 1983). Instruments that
require large lever actuations, such as manual laparoscopic devices, could potentially

44
result in high grip forces and, subsequently, high reaction forces in the palm. Handles of
different shapes and contour can influence how these forces are distributed across the
palm with certain areas of the palm more susceptible to these forces than others. For
pistol grip devices, palm force sensors were placed on the handle at areas that contact the
lateral and medial aspects of the thenar eminence, especially since these two positions
have elevated susceptibility to increased carpal tunnel pressure.
Figure 2.31: Flexible force sensors attached to laparoscopic hand tool
2.4.8 Force Plate Implementation
The force plate was set at a comfortable distance from the trainer for each subject,
in order to better replicate operating room conditions. To eliminate any potential drift
that could occur in the force plate readings, the force plate was initialized after each trial.
The subject was instructed to step off of the force plate and the conditioning box was
reset before they were instructed to step back on. It was imperative that the force plate
was set on level ground, or shimmed to level, since an imbalanced force plate would
skew sensor data and result in inaccurate force readings.

45
2.4.9 Subject Procedure
During trials, subject procedure was designed to replicate the occupational setting
under review and the tasks performed with certain tools in that setting. For this
application, laparoscopic instruments were used for tissue manipulation exercises. For
this application, the subject procedures were focused on controlling posture and
movement, for the purpose of isolating the biomechanical risks from the tools involved.
Another setup option, which was not studied, allowed subjects to complete surgical tasks
in any manner they saw fit, evaluating for technique and procedure risks, rather than the
effect of instrumentation.
2.4.10 Full Trial Procedure
In preparing for subject trials, system calibration was completed prior to subject
arrival. Force sensor and force plate calibrations were done within one day of the trials,
depending on the time of subject arrival. Motion capture calibration was completed
immediately prior to subject arrival to ensure maximum accuracy and it was important to
confirm hardware setup by turning the OEMC computer on with all four hubs powered
up and connected to four separate USB buses. The sync cable connections between the
three slave hubs and the master hub were confirmed before every trial session. Each hub
was checked to for six green LEDs that indicated all six cameras were successfully
connected to the computer.
The next step was to complete the calibration protocol for the OEMC system and,
after doing so, the OEMC data collection software, Tracking Tools (Natural Point:
Corvallis, OR), was configured for trial runs by loading the calibration saved during
calibration. The capture volume and camera position settings were loaded in the subject

46
project file and were confirmed by moving the wand within the capture volume. The
synchronization settings were set to “External In” and “High Gated” to begin data capture
when the trigger signal was detected.
The hardware of the DAQ system was also confirmed prior to subject arrival by
first confirming that the trigger cable was connected to the PFIO/TRIG 1 channel of the
A/D pin connector. The charge of the nine volt trigger battery was tested using a
multimeter and confirmed to be greater than 2.7 volts (the system minimum voltage for
triggering).
The input channels and grounds of the A/D pin connector were checked prior to
every trial for any loose or broken connections. Table 2.5 shows the layout of the inputs
that connected to each pin. The outputs from the force plate connected to the first eight
channels of the DAQ system. Channels 8 through 11 were connected to the
electromyography box by a custom made cable. Custom cables were also built for
channels 12 through 15 which corresponded to the point-force outputs of the force
conditioning box.
Before each trial, the electromyography box was plugged in and the four sensors
were connected along with the reference node. If the electrodes of the sensors were not
cleaned following last use, they were cleaned with a cotton swab and hydrogen peroxide
solution. The point-force sensors were connected to the force conditioning box and
confirmed that each output cable was aligned with the proper input connection and sensor
number. All force sensors were checked for visible damage or loose connections and
attached to the target instrument at the pre-determined points of interest.

47
Table 2.5: Layout of pin connections for data acquisition system
A/D Pin Connector Layout
Input Channel Pin #
X1+2 ACH0 68
X3+4 ACH1 33
Y1+4 ACH2 65
Y2+3 ACH3 30
Z1 ACH4 28
Z2 ACH5 60
Z3 ACH6 25
Z4 ACH7 57
EMG 1 ACH8 34
EMG 2 ACH9 66
EMG 3 ACH10 31
EMG 4 ACH11 63
Force 1 ACH12 61
Force 2 ACH13 26
Force 3 ACH14 58
Force 4 ACH15 23
Trigger PFI0/TRIG1 11
Once all of the hardware was setup properly, a full system check was run prior to
subject arrival. A LabVIEW program (System Check.vi) was opened, shown in Figure
2.32, that streamed the outputs of the system to the monitor of the computer. Each
element of the system was tested individually as the program wrote a test file to confirm
that data was being collected properly.
The system check program was also designed to run with the system trigger,
which also confirmed its functionality. With the system check program running, the
OEMC program (Tracking Tools) was initiated and, by selecting “Record,” prompted the
program to report that it was waiting for a trigger signal. To test synchronization, the

48
trigger switch was toggled to initiate data collection, which was evident from viewing the
front panel of both programs.
Figure 2.32: Live streaming data collection LabVIEW font panel
Each sEMG channel was tested individually to confirm that the correct output was
shown on the streaming display. For the force plate, center of pressure tracking and the
detection of axial forces were tested prior to subject arrival. Force was applied to each
point-force sensor to confirm the simultaneous increase in voltage on the streaming
output. After testing was completed, the system check program was closed and the data
collection program (Triggered System.vi) was opened. The data collection program
captured all of the data in the same manner as the system check program, except that it
only saved the data and did no processing or streaming, which allowed it to run more
efficiently.
Upon subject arrival, all IRB-approved consent and disclosure agreements were
completed prior to any trial procedures. After informing the subject about the study and
purpose, background surveys were administered to gather demographic information
followed by the completion of the anthropometric measurements. The next procedure

49
involved taking goniometry measurements of maximum ranges of motion for the upper
body and upper extremities of the subject before they were fitted with reflective markers
for the OEMC system. Once all of the markers were applied, the sEMG electrodes and
reference node were secured and the maximum voluntary contraction process was
administered. The wires were bundled and controlled so as not to impede subject
movement or hinder the visibility of reflective markers.
The subject, now ready to begin trial runs, was instructed to stand on the force
plate with arms at their sides. The OEMC system was initiated to record a brief capture
of the subject in the specified posture as a reference in OEMC calculations. Following
this capture, the subject was instructed to step off the force plate so that the force plate
could be initialized before trials began.
After the subject was instructed to return to their position on the force plate, the
OEMC and DAQ systems were started and the trigger signal was toggled to initiate data
capture. After three seconds of successful data capture, the subject was given permission
to begin performing the required task.
After completion of the task, the OEMC system and DAQ systems were stopped
and the trigger signal was toggled off. The LabVIEW program automatically saved the
trial data from the DAQ system in ASCII format, while the OEMC system saved in its
native format which needed to be converted and exported manually for manipulation in
MATLAB.
Following the completion of the trial session, the subject was cleared of all
sensors and markers before they were given the analog evaluations for each device used.

50
2.5 Data Interpretation
Each research modality required specific means of data analysis by applying
calibration results and converting raw voltage signals to units appropriate for analysis.
Data smoothing for presentation was necessary for some methods and written summaries
of MATLAB coding (see Sections 2.5.1, 2.5.2, and 2.5.3) outline several other
procedures that were used to perform data analysis.
2.5.1 Surface Electromyography
Before drawing conclusions on sEMG signals from trial data, it was converted to
a percentage of the subject’s maximum voluntary contraction (MVC), which was
calculated from the MVC trials completed prior to the trial sessions (see Section 2.2.1).
The MVC value for a muscle was the average of the maximum MVC values for all three
MVC runs for that muscle (Claudon, 1998; US Dept. HHS, 1992). The MVC value of
each run was calculated by first undergoing full wave rectification using a 55 ms root
mean square windowing (i.e., 220 samples given a sampling frequency of 4kS/s) of the
entire signal before reading the maximum voltage level from the processed trial, as seen
in Figure 2.33.
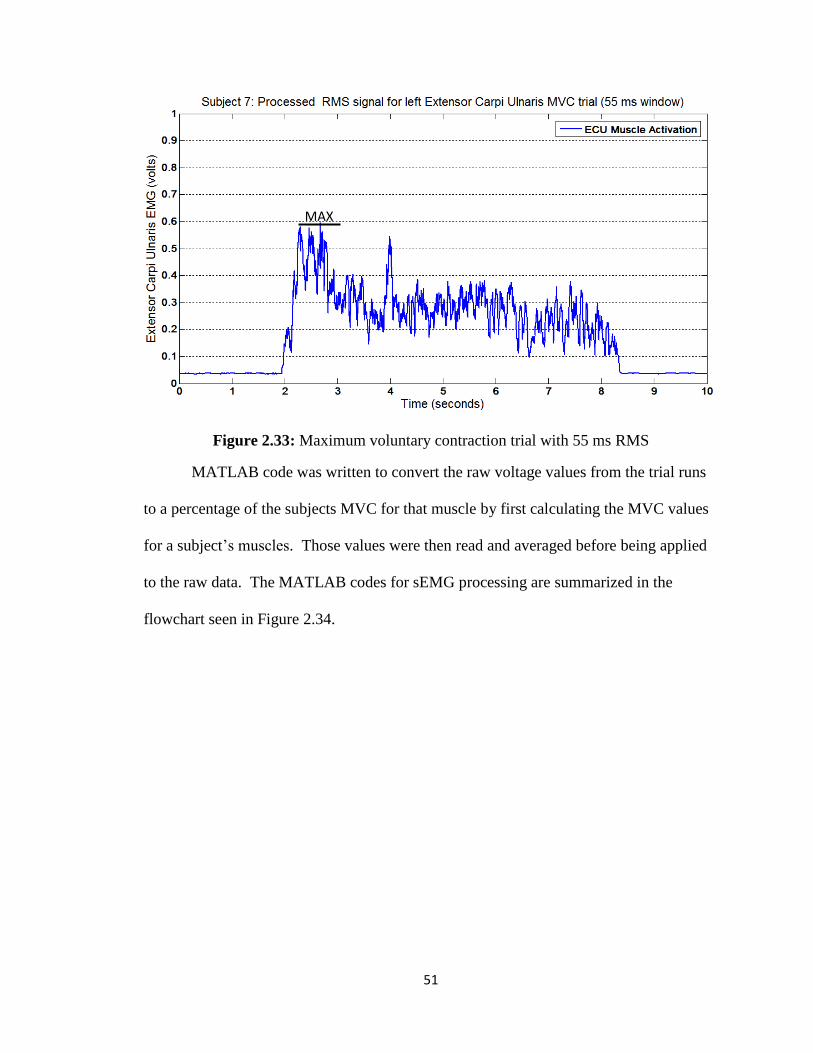
51
Figure 2.33: Maximum voluntary contraction trial with 55 ms RMS
MATLAB code was written to convert the raw voltage values from the trial runs
to a percentage of the subjects MVC for that muscle by first calculating the MVC values
for a subject’s muscles. Those values were then read and averaged before being applied
to the raw data. The MATLAB codes for sEMG processing are summarized in the
flowchart seen in Figure 2.34.
MAX

52
Figure 2.34: Summary of MATLAB codes for full electromyography analyses

53
2.5.2 Force
All force channels were read as raw voltage and were converted into pounds by
applying each sensor’s sensitivity and offset individually from the results of the
calibration testing. This portion of the data analysis was done in Aqknowledge (BIOPAC
Systems Inc.: Goleta, CA) for the benefit of its visual display and data manipulation
algorithms. Once the sensitivities of the sensors were multiplied through each force
channel, the offset was applied. If a non-zero baseline still existed prior to force
application, the mean baseline was determined and removed to achieve a zero baseline
when no forces were applied to the sensor.
Each channel needed to be smoothed for resampling and presentation purposes
with a moving average filter, which had a window of 0.06475 seconds (i.e., 259 samples),
providing adequate smoothing of the data. The data was converted to text files and
imported into MATLAB for more in-depth analysis as described by the flowchart in
Figure 2.35. For example, one method of analysis for both palm and actuation forces was
to observe the peak forces as they occurred across the trial population.
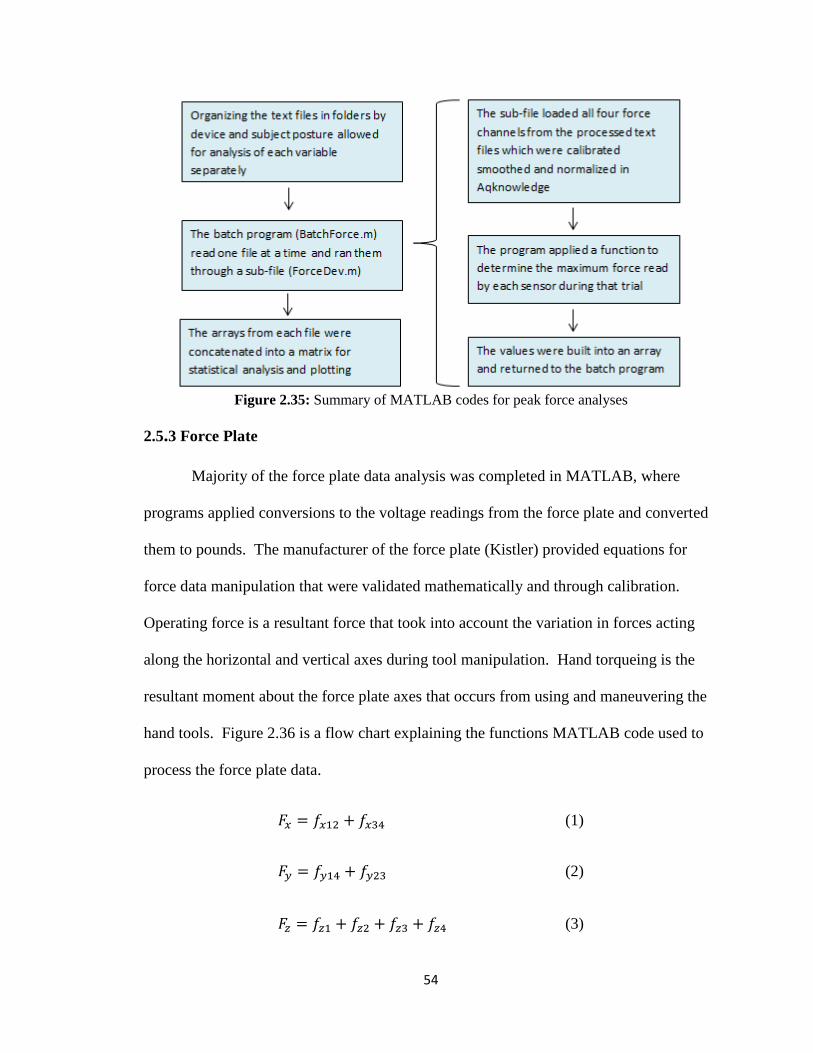
54
Figure 2.35: Summary of MATLAB codes for peak force analyses
2.5.3 Force Plate
Majority of the force plate data analysis was completed in MATLAB, where
programs applied conversions to the voltage readings from the force plate and converted
them to pounds. The manufacturer of the force plate (Kistler) provided equations for
force data manipulation that were validated mathematically and through calibration.
Operating force is a resultant force that took into account the variation in forces acting
along the horizontal and vertical axes during tool manipulation. Hand torqueing is the
resultant moment about the force plate axes that occurs from using and maneuvering the
hand tools. Figure 2.36 is a flow chart explaining the functions MATLAB code used to
process the force plate data.
(1)
(2)
(3)

55
Equations 1, 2, and 3 sum sensor data directly from the force plate conditioning
box where Fx was the sum of medio-lateral forces, Fy was the sum of anterior-posterior
forces, and Fz represented the sum of vertical forces.
(4)
A root mean squared (RMS) level was calculated for the Fz waveform of the trial
to determine the contribution of subject weight to the sum of vertical forces. By
subtracting the RMS level shown in Equation 4, it removed the subject’s weight, and left
any vertical force deviations that resulted from performing an experimental task.
(5)
Operating force was the resultant force of task associated forces that took into
consideration forces in the medio-lateral axis, anterior-posterior axis, and the RMS-
normalized vertical axis.
(6)
(7)
Equations 6 and 7 represented the moment about the x-axis of the force plate and,
since the forces that caused the moment are vertical forces, the moment value must also
be normalized to remove the baseline created by the constant weight of the subject. This
same reasoning was applied to Equations 8 and 9, which represented moments about the
y-axis of the force plate.
(8)

56
(9)
(10)
Equation 10 showed the calculation of the moment about the force plate’s vertical
axis as a result of the horizontal forces detected during the experimental task.
(11)
Hand torque in Equation 11 represented the resultant moment generated about the
force plate as a result of the forces generated from the manipulation of hand tools during
experimental tasks.
(12)
(13)
Equations 12 and 13 determined the x- and y-axis position of the subject center of
pressure on the force plate, respectively. The center of pressure on the force plate is an
estimation of the subject’s center of gravity.

57
Figure 2.36: Summary of MATLAB code for analyzing force plate data
2.5.4 Motion Capture Position Data
The software provided with the OEMC system was very limited as far as data
manipulation and new software needed to be developed to manage, sort, and display
OEMC results. The first step in converting position data to anatomical joint angles and
rotation was identifying the markers. A MATLAB program was developed to load 3D
position data and assign each marker an identification (ID) number. Each trial was then
filtered frame-by-frame to adjust any markers that swapped marker ID numbers in the
data as a result of marker drop which would cause segments of data to swap between two
or more markers.
Once the data was sorted and organized according to the markers, it needed to be
normalized along with the force and sEMG data. Normalizing on the same time scale

58
from task start to task end allowed for seamless overlapping of data, which made drawing
correlations across data collection methodologies more efficient. In order for the OEMC
data to be relevant, the normalized 3D position data was converted to represent the
anatomical position of the rigid bodies defined by the marker configuration. Determining
anatomical position was crucial to the interpretation of joint deviation and displacement.
In order to do this, angle projection software was developed in MATLAB to project the
vectors of upper extremity rigid bodies on the proper anatomical plane (i.e., projecting
the vector in-line with the hand on the plane of the forearm to determine wrist flexion).
2.5.5 Task Normalization
Normalizing the data so that it can be compared across trials was vital when
making inter-subject comparisons as well as comparisons across different devices used to
accomplish the same task. Normalization of the data in this study was accomplished by
determining the exact time of task initiation and task completion for each trial run and
these normalized trials were then scaled as a percentage of task completion from zero
percent to 100 percent. Normalizing the data in this fashion removed some of the
inconsistencies in task duration that existed from trial-to-trial and from subject-to-subject.
Task initiation was determined by observing the times where the force and sEMG
readings indicated the task was starting and the time associated with those readings was
then compared to the times of corresponding OEMC frames. Since the DAQ system
operated at a 4 kS/s sampling rate and the OEMC system ran at 50 S/s (fps), the initiation
time was adjusted to match the closest motion capture frame, and subsequently, the DAQ
system sample that aligned closest with it. The same methodology was applied for

59
determining the completion of the task and the sequence within the time frame was then
saved as a separate normalized file.
2.5.6 Exposure Intensity
Exposure intensity was quantified by evaluating the area under the curve of the
signal being examined. The sEMG or force signals can be compared with a threshold
value to evaluate the degree of exposure by calculating the amount of area between the
threshold limit and curve of the signal exceeding that limit. This was an effective method
for comparing different the intensity of exposure in trials with different devices, postures
or procedures (Qadri and Peterson, 2011; Peterson, 1999).
MATLAB was used to calculate the area of the signal that exceeded the threshold
value by finding all values in the signal that exceeded the threshold limit and copied
those values into a new array from which the threshold limit was then subtracted. The
area of the excess signal and the total area of the signal were calculated using the
trapezoidal method. The two area values were then compared by converting the area of
the signal exceeding the threshold to a percentage of the total area. Larger percentages
indicated a higher level of exposure and, if none of the signal exceeding the threshold
value, then the intensity of the biomechanical risk was considered negligible.

60
2.5.7 Exposure Duration
Exposure duration was similar to exposure intensity in that exposure duration
quantifies the times during which the signal exceeded the threshold value (Qadri and
Peterson, 2011; Peterson, 1999). The MATLAB code behind exposure duration was very
similar to that of exposure intensity (i.e., area under the curve). The number of samples
exceeding the threshold limit and the time differential between samples was used to
determine the amount of time spent in excess of that limit. Looking at the duration of
each exposure, a complete picture can be built as to how often a user was subjected to
biomechanical risk during a procedure, since exposure duration was calculated as a
percentage of total task time. For example, by observing exposures in percent of total
duration, it is possible to show that, in two trials of variable length, both signals exceeded
the threshold value for more than 30% of the trial duration.
2.5.8 Statistical Analysis
For comparison and statistical significance, a match-paired, single-tailed,
t-test was implemented and, since the sample populations were all the same size,
comparisons and conclusions of significance were straightforward. Each t-test was
calculated with an alpha of 0.05 or less for comparisons with a high degree of
significance. The t-test was effective in comparing the amount of force applied at
different sensor positions, the effect of device tip angulation on activation forces, and
task completion duration with different devices among other metrics.

61
3. Results
Method validation was performed during a device evaluation study, where the tool
used was a manual laparoscopic tool that required forces to be applied to various levers
and buttons in order to complete a simulated surgical task was used activating these
functions theoretically exposed subjects to some degree of biomechanical risk similar to
most hand tools. The upper extremity posture of the subject was controlled for in the
evaluation, since it can change the biomechanical risks imposed by the device. Subjects
were asked to perform laparoscopic tasks in two basic arm postures, the first being a
neutral working posture with elbows at their sides and forearms out, perpendicular to the
body. The second position, referenced as awkward posture, forced the subjects to
complete their tasks with an elevate arm and steep working angle of the laparoscopic
instrument.
3.1 Surface Electromyography and Posture During Device 1 Trials
All subjects exhibited wrist flexion and extension patterns during lever actuations,
which were required for task completion. Figure 3.1 shows an example of this pattern
followed by Subject A when using the manual device in a neutral upper extremity
posture. Figure 3.2 shows a comparable neutral position, trial to Figure 3.1; however, the
subject of figure 3.2 (Subject B) had a glove size of 7 while Subject A had a glove size of
8 as taken during the background survey. The difference in hand sizes between subjects
could be a factor in the numerous differences in risk exposure.

62
Figure 3.1 Wrist posture and forearm electromyography signals for Subject A in a neutral posture
Figure 3.2: Wrist posture and forearm electromyography signals for Subject B in a neutral
posture

63
The awkward upper extremity posture changed the working angle at which a
subject used the laparoscopic surgical device, where each subject had to operate the
device with an elevated and slightly extended arm in this case. Figure 3.3 shows the
wrist posture and forearm muscle activation for Subject A in an awkward posture. Figure
3.4 shows the results from a manual device trial sequence in an awkward posture for
Subject B.
Figure 3.3: Wrist posture and forearm electromyography signals for Subject A in an awkward
posture

64
Figure 3.4: Wrist posture and forearm electromyography signals for Subject B in an awkward
posture
3.2 Force Plate Patterns during Task Completion Sequence
The force plate provided a unique methodology for observing full body reaction
forces that resulted from the use of hand tools during laparoscopic procedures. Figure 3.5
shows the friction forces and moments that resulted from the use of the manual device in
a neutral posture trial. The operating force was the total resultant force that occurred in
reaction to the 3D forces during the use of the manual device. Hand torque was the
resultant of reaction moments at the force plate as a result of push, pull and rotational
forces during device use. Figure 3.5 shows a constantly elevated hand torque, exceeding
15 inch•pounds for the duration of the trial. The operating force illustrated that the
subject was constantly exerting a push force on the instrument as well as a significant
amount of torque during the trial.

65
Figure 3.5: Force plate operating force and hand torqueing for Subject B with the manual device
in a neutral posture
Table 3.1: Hand torque and operating force stats for manual device by position across
populations
Manual
Hand Torque
(inch∙pounds)
Operating Force
(pounds)
Position Mean StDev Mean StDev
Awkward Articulated 42.1868 20.7215 1.8318 0.3598
Neutral Articulated 29.9784 17.7656 1.4647 0.4613
Neutral Straight 30.1726 19.8613 1.3229 0.4090
3.3 Finger Force Patterns during Task Completion Sequences
The laparoscopic instrument had one of the flexible force sensors placed on a
lever intended for full-hand gripping at a point most associated with index finger contact.
The lever sensor was able to show the difference in force requirements to actuate the
lever when the tip was straight and when it was fully articulated. The average total force
required to actuate the lever was 9.13 pounds (SD 0.78) for a straight tip and 15.92
pounds (SD 0.98) for an articulated tip. These average values are shown in Figure 3.6
∙

66
and Figure 3.7, respectively, as solid gray lines. Figure 3.6 shows the force imposed on
the lever by the index finger during a manual trial at neutral position with the tip straight.
Figure 3.7 shows the force applied to the lever during a neutral position trial while the tip
was completely articulated to the left. It is important to note that completing the task
with the manual device required a total of four actuations of the lever.
Figure 3.6: Manual device lever sensor pattern for a non-articulated tip in a neutral posture

67
Figure 3.7: Manual device lever sensor pattern for an articulated tip in a neutral posture
The position of the wrist was crucial during full-hand gripping tasks, such as the
actuation of the lever on the manual device, since the capability for highest grip forces
exist during neutral wrist posture and cannot be achieved over a dramatic wrist angle due
to the reduced wrist leverage and additional friction. A neutral wrist angle is considered
to be within the ±15° range from the long axis of the forearm. Figure 3.8 shows the
application of forces for a neutral upper extremity posture with the highest forces applied
while the subject was in a neutral wrist posture. This can be compared to the results in
Figure 3.9 for the same subject in an awkward upper extremity posture, where the
application of peak forces occurred during wrist extension in excess of 15 degrees.

68
Figure 3.8: Manual device lever sensor pattern shown with respect to wrist posture in a neutral
posture for Subject C
Figure 3.9: Manual device lever sensor pattern shown with respect to wrist posture in an
awkward posture for Subject C

69
3.4 Palm Force Comparisons during Task Completion Sequences
The designs of many laparoscopic devices vary by intended function and
manufacturer’s design specifications. Two flexible force sensors were placed on the
handle at locations found to be in contact with the lateral and medial aspects of the thenar
eminence to detect the palmar reaction forces that resulted from lever actuations. Palmar
forces can be more easily compared across devices than individual device functions that
may vary more widely, such as lever and button designs.
For the evaluation of palm forces, a 2.2 pound force (1 kg force) threshold was
taken from literature and used to evaluate the data collected from palm force sensors
(Cobb et al., 1995). Figures 3.10 and 3.11 show the palm force results from a neutral
non-articulated trial, where the red lines indicate the threshold value of 2.2 pounds.
Figure 3.10: Manual device palm force patterns for lateral aspect of thenar eminence as
compared to the 2.2 pound threshold

70
Figure 3.11: Manual device palm force patterns for medial aspect of thenar eminence as
compared to the 2.2 pound threshold
3.5 Subject Reports
Subjects evaluated two similar laparoscopic tools against six parameters.
Statistical significance was tested for subject responses to each parameter using a match-
paired single-tailed t-test with n=10 for each sample size. “Effort to Actuate” and
“Overall Ease of Use” showed significant statistical evidence to that Device 2 had a
better “Effort to Actuate” score (t=4.7285, df=18, p<0.05) and a greater “Overall Ease of
Use” score than Device 1 (t=2.0783, df=18, p<0.05). The average scores comparing the
two devices across all six parameters are shown in Figure 3.12.

71
Figure 3.12: Average subject scores for analog device evaluations
No significant correlations were made between hand anthropometry and device
evaluation parameters, which may have been due to the small sample size of 10
subjects.

72
4. Discussion
This research represented the ongoing development of a complete comprehensive
methodology for analyzing hand tools and the occupation environment they were used in.
The methodology was designed for further implementation beyond the laparoscopic
surgical setting and future research can expand its applications. Data analysis from the
study can be expanded upon and researched in greater detail in order to generate
publications on the subject matter. Future studies can expand upon the methodology by
expanding the capabilities of the system beyond its current hardware and software
limitations.
4.1 Implications of Hand Size on Risk Exposure
Subject 8 had a size 8 glove and, when in a neutral posture (see Figure 3.1), went
through a majority of the trial with an extended wrist. It was observed that an extended
wrist allowed for the subject to leverage the distal portions of their fingers for smaller
diameter grasping. Maintaining proper contact with the distal portions of the fingers
allows for better leverage over the lever mechanism during an actuation that would
otherwise lead to a clenched fist scenario in subjects with larger hands. It was also
notable that the sEMG signals for both the FCU and ECU were showing similar
activation and remain dominantly below 60% MVC.
Subject A’s hand anthropometry indicated that his or her dominant hand was
around the 95th
percentile for hand sizes in a population consisting of 50% male and 50%
female individuals (Chengalur, 2004). The anthropometry for Subject B, with a glove
size of 7, indicated that his or her dominant hand was around the 50th
percentile for hand

73
size. The smaller hand size may be a factor in reducing the amount of wrist extension to
a more neutral level; however, the muscle activation of the ECU showed maximal
recruitment during the transition from flexion to extension in each lever pull (see Figure
3.2). Subject B may have been using the extension of their wrist to help actuate the lever
of the manual device rather than purely applying grip forces which can put immense
strain on the musculoskeletal structures of the wrist. The reason for doing so may been a
compensation method for poor leverage over the lever or for low grip strength. Full-hand
grip strength for Subject A was shown to be 116.4 pounds in dynamometer tests, versus
79.79 pounds for Subject B, indicating that differences in grip strength may have been a
factor in the recruitment of wrist stabilizer muscles to actuate the lever.
4.2 Effects of Arm Posture on Risk Exposure
Subjects performed the same simulated laparoscopic task in two arm positions.
One represented a neutral working posture (see Figures 3.1 and 3.2) and the second was
considered an awkward posture with the right arm elevated and extended at near shoulder
height with a steep working angle (see Figures 3.3 and 3.4).
In the awkward posture, Subject A showed their wrist flexing and extending,
within the 15° threshold during lever actuation but exceeding 15° during tip closure and
tip opening operations. The change in arm posture influenced how the subject oriented
the device in their hand, which may have resulted in more neutral wrist angles for the
larger handed subject when compared to the neutral arm posture trial.
The magnitudes of flexion and extension are the biggest change when observing
the differences that resulted from a change in posture. The wrist was in greater flexion

74
for both subjects during awkward posture and the extension was reduced compared to the
neutral posture angles. Subject A still showed moderate to low muscle recruitment and
wrist posture remained within the neutral range for majority of the trial. Subject B spent
the majority of the task sequence in flexion during the awkward posture trial but the FCU
muscle activation was observed to not peak beyond 60% MVC (see Figure 3.4). The
ECU still showed excessive recruitment during the lever pulls throughout the sequence,
coinciding with a reduction in flexion (increase in extension) which suggests the
possibility that the subject was using their wrist as an additional means of applying force
to actuate the levers of the manual device. The drastic increase in wrist flexion for
Subject B in awkward posture may be attributed to a reduced ability to reach the lever
from the altered tool orientation, forcing the subject to flex their wrist in order to achieve
proper leverage.
4.3 Force Plate Risk Exposure
Moment, or torqueing, represents a rotational factor that the body must endure as
a result of the forces imposed on the body. A review of published literature indicated that
force plates were not used in the study of surgical ergonomics therefore all methods of
analysis herein were truly novel and experimental. Moments are a significant factor in
the risk of internal musculoskeletal trauma, since they can be magnified and carried
throughout the body from a single point-force applied to an appendage. Lower back
injuries that result from heavy or repeated lifting occur from torsion of the lumbar
vertebrae as back muscles compensate for sustaining the loads acting on the upper
extremities and for maintaining balance. The same forces that were studied in the
application of laparoscopic instruments can have a profound effect on all joints from the

75
wrist, elbows, and shoulders down to the back, hips, knees and ankles. Smaller sustained
forces such as those shown in Figure 3.5 can potentially introduce a constant fatiguing
factor that may influence the way the human body copes with moments acting on its
joints. Muscles and ligaments that aren’t commonly stressed by laparoscopy may
become employed to compensate for others that fatigue quickly or were not allowed
enough time to recover after exposures. This may present a risk of injury to a surgeon
performing multiple surgeries daily and/or sustaining a high case load over an elongated
period of time without proper rest.
4.4 Full Hand Gripping in Laparoscopy
Results showed that, when the tip of the device was articulated, the mean
force imposed by the index finger on the lever was 8.359 pounds (SD 3.69) as opposed to
6.575 pounds (SD 3.246) when the tip was straight. This showed that when the tip of this
particular laparoscopic device was articulated to one side, the amount of force required to
squeeze the lever increased. A match-paired, single-tailed, t-test indicated that lever
forces showed a significant difference for articulated tips versus non-articulated tips in a
controlled neutral firing posture (t=1.9199, df=56, n=29, p<0.05). It is important to note
that, one matched trial was removed from each population due to sensor error.
The data in Figures 3.6 and 3.7 both showed dual force peaks during each
actuation and implied that the force required for actuating the instrument decreased prior
to full actuation of the lever. The second peak during each lever actuation indicated that,
upon reaching the physical limit of the actuation, users would apply additional grip

76
forces, possibly as a means of assurance, confirming that the lever was been fully
actuated.
EMG and force sensors both showed that subjects applied a majority of the forces
required for actuation while they simultaneously extended their wrist. This trend was
visible in both Figures 3.8 and 3.9, which showed wrist posture and applied forces for
awkward and neutral postures, respectively for Subject C. The prevalence of this pattern
may have been due to the amount of force required to actuate the lever, as well as the
reduction in grip diameter throughout lever actuation.
4.5 Grip Force Extrapolation
Methods for data analysis could also be altered to expand the results of the study.
The use of point-force sensors allowed the detection of forces used to activate triggers
and levers but, due to their size, could only pick up those applied by a single finger over a
small area. Levers that were actuated by multiple fingers will have had higher actuation
forces than was read by a single point-force sensor under one of the fingers. Published
literature had shown that, for cylindrical gripping tasks, finger contribution can be
reliably broken down into percentages of total grip force (Amis, 1987; Hazelton et al.
1975; Lee and Rim, 1991; Radhakrishnan and Nagaravindra, 1993; Talsania and Kozin,
1998). As an example, the index finger was shown to represent between 25% and 30% of
the subject’s full-hand grip force in cylindrical gripping.
If this methodology can be validated, then it would be possible to apply this data
analysis technique to the study of hand tools with the potential to reduce the amount of
sensors needed to determine full-hand grip force. With fewer sensors, the subject is less

77
inhibited, thereby improving the quality of the trial. Maximizing data collected while
minimizing the number of sensors and transducers used is vital to experimental design.
The finger contribution for full-hand grip of non-cylindrical features, such as gripping
levers and linear grip dynamometers, must be evaluated before any conclusions can be
drawn about full-hand grip forces when using hand-held devices.
4.6 Exposure to Palm Forces
Evaluating the medial and lateral aspects of the thenar eminence provides a means
of direct comparison between different devices that exhibited palm contact during use.
The translation of grip forces to the palm is an important aspect of device design due to
the location of underlying digital nerves. Studies have shown that compression of the
thenar eminence can result in a significant increase of pressure within the carpal tunnel
where the applied pressure compresses the nerves and can affect signal conduction (Cobb
et al. 1995; Lundborg et al. 1982; Szabo et al. 1983). Cobb et al. (1995) tested the
application of 1 kg forces to various palm positions and the simultaneous change in
carpal tunnel pressure where it was determined that significantly higher carpal tunnel
pressure was recorded when 2.2 pound forces (1kg force) were applied to the thenar and
hypothenar eminences as well as over the flexor retinaculum at the centerline of the
proximal end of the palm. When the 2.2 pound force was applied to the medial aspect of
the thenar eminence, it resulted in a mean carpal tunnel pressure of 98 mm Hg
(1.895 pounds per square inch (psi)). The lateral aspect of the thenar eminence showed a
lower mean pressure at 25 mm Hg (0.483 psi) with 2.2 pounds of applied pressure. A
range of carpal tunnel pressure from 30 mm Hg (0.58 psi) to 90 mm Hg (1.74 psi) was
shown to cause dysfunction of the median nerve, such as numbness and tingling, within

78
15 minutes of sustained pressure, according to Lundborg et al. (1982) and Szabo et al.
(1983). Although pressures associated with laparoscopy are rarely sustained, the duration
of the procedures call for a high degree of repetition over long period of time and may
not allow the nerve to recover adequately between compressions and possibly lead to
injurious conditions.
It was noticeable from the results of the manual device trials that the medial
aspect of the thenar eminence (see Figure 3.11) was reading higher force values than the
lateral aspect (see Figure 3.10). Over the entire trial population, the medial aspect
showed a higher mean peak force at 9.78 pounds (SD 2.95) compared to 6.08 pounds (SD
3.59) for the lateral aspect of the thenar eminence. The highest forces in this case were
being applied to the more susceptible area of the palm for increased carpal tunnel
pressure. When the 2.2 pound (1 kg) force threshold was applied across the entire
population of subjects, taking into consideration 174 trial firings, the amount of exposure
to above threshold forces can be quantified. Throughout the duration of an average trial,
27.82 percent (SD 8.91) of the time was spent in excess of 2.2 pounds at the medial
aspect of the thenar eminence. Similarly, the lateral aspect exceeded the threshold value
21.61 percent (SD 18.2) of the time. However, when the area under the curve was
calculated, it showed that 49.20 percent (SD 13.58) of the total graph area was above
threshold for the medial aspect, which indicates a much higher intensity of exposure than
the 29.95 percent (SD 23.83) for the lateral aspect of the thenar eminence.
4.7 Hardware Limitations
Several hardware restrictions limited the scope of this research. The A/D
converter used in this study had 16 analog channels and the implementation of the force

79
plate, point-force sensors, and sEMG sensors limited the number of available inputs,
which needed to be prioritized. The force plate itself required eight analog channels,
consuming half of the input capacity of the A/D converter and the point-force and sEMG
systems were subsequently reduced to four inputs each. If a larger A/D converter, such
as a 32 channel unit, was implemented, the scope of the project would have room for
dramatic growth. Other modalities could then be employed, given a greater number of
analog inputs. Accelerometers, for example, could be integrated into the methodology of
this study making it more applicable to industrial manufacturing, where factory floor
workers are using pneumatic and electric tools such as grinders, drills, and rivet guns.
EMG could also expand to incorporate some of the larger muscles of the upper
extremities with additional input capacity, which will provide a more comprehensive
understanding of arm muscle activation levels. Placing sensors on muscles such as the
biceps and deltoids could provide information on large muscle recruitment during
laparoscopic tasks. In ergonomics, it is better to transfer loads from smaller muscles to
larger muscles which are stronger and fatigue at a slower rate. Further expansion of
sEMG coverage could also be extended to the muscles of the neck and back, which are
common sources of discomfort in numerous occupational settings including laparoscopic
surgery (Park et al., 2010; Nguyen et al., 2001)
4.8 Software Limitations
The software that drives the OEMC system was developed for the purpose of
motion capture for the entertainment industry and the programs have resulted in some
limitations that must be resolved. The Tracking Tools program was developed for rigid
body tracking; however, the program became unstable and was prone to crashing when

80
the file size approached one Gigabyte in size. This eliminated the ability to capture trials
over extended periods of time while configured for high performance captures. Lower
resolution settings and fewer markers would allow for longer data collection by reducing
file size but the issue would not be resolved and the quality of the research would suffer.
Results from the data capture were exported as comma-separated values (CSV)
file that contained 3D position data for each marker. The markers, however, were not
organized by the motion capture program itself and when exported, many of the marker
ID’s were swapped and subsequently showed inconsistent marker positions and gaps
where markers were lost during trial captures. Several MATLAB programs had to be
developed in order to organize the markers by number and clean the data set, which
yielded more congruent position data. Another program was developed to generate
virtual marker paths to fill in gaps in the data where marker drop had occurred. With the
development of these programs, the research team was able to mitigate some of the
limitations and shortcomings of the motion capture software.
5. Conclusion
The benefit of applying a comprehensive approach to surgical ergonomics was a
demonstration of the adaptability of the methods. The overall procedure of this study can
be directly applied to any aspect of surgical ergonomics or other industrial settings and
disciplines from dental hygienists to factory floor workers who can benefit from
investigations into the biomechanical risks that are present in their occupational settings.
The actual setup of the equipment was designed to be easily portable so that the
system can be disassembled and reassembled in any occupational setting. The stage

81
scaffolding for the OEMC system can be disassembled and reassembled in any industrial
setting which means the OEMC system can be run from any location with electrical
access. Similarly, the computers and DAQ system would only require one additional cart
to act as a mobile workstation.
The procedure can be adapted so that the instruments being used are evaluated in
much greater detail. The devices can be directly instrumented with sensors and
transducers to evaluate actuation forces, torqueing, grip forces and generate time stamps
that correspond with different actions of the device such as a button press. This can be
accomplished by inserting load cells, strain gauges, and digital triggers into the device
body. Correlating this data with the subject data recorded from force measurements,
sEMG, and motion capture, can further increase our understanding of the human-device
interface.
Research that combines classic ergonomics modalities can result in new means of
analyzing data and open doors to observing any environment or tool in greater detail than
before. Drawing correlations between these different research methods set a new
standard for research quality, where many studies that used a single quantitative method
such as sEMG or motion analysis resulted in incomplete data sets with unknown
variables. Establishing a comprehensive methodology dramatically reduces number of
unknown variables present in a study.
By applying this methodology to any occupational setting it is hoped that the
results can attribute to advancements in equipment and hand tool design. Advancements
in ergonomics can lead to a reduction in musculoskeletal symptoms commonly reported

82
by the working population which means increased career longevity, reduced work force
drop-out and an increase in the size of the experienced workforce.
Applying this methodology to the study of biomechanical risks present while
using hand tools and other devices in a surgical environment can lead to advancements in
equipment design and safety. Surgical ergonomics is an all-encompassing title derived to
address the issues of physical and mental stresses that surgeons, nurses, and other
attendees endure within the operating room. Ergonomics, in particular, refers to the
human interaction with their work environment. Within the environment of the operating
room, there exist an infinite number of local interactions between surgeons, nurses,
devices, monitors, and other equipment. Surgical ergonomics is a growing field that has
a far reaching impact on the health of the professional population and ergonomic groups
worldwide have implemented numerous methods of analyzing the surgical environment
to study the interactions between surgeons and the devices they use on a daily basis. The
implementation and correlation of new and well established research techniques will
improve the means by which the scientific community understands the biomechanical
exposures that surgeons must endure in their occupation.

83
References
Adams D., Fenton S., Schirmer B., Mahvi D., Horvath K., Nichol P., “One size does not
fit all: current disposable laparoscopic devices do not fit the needs of female
laparoscopic surgeons.” Surgical Endoscopy 2008; 22: 2310-2313
Ahmed S., Hanna G., Cuschieri A., “Optimal Angle Between Instrument Shaft and
Handle for Laparoscopic Bowel Suturing.” Arch Surg. 2005; 139: 89-92
Amaral J., Levine A., “Ergonomic Evaluation of a New Rotating, Dual Position
Laparoscopic Instrument Handle.” IEEE 1994; 315-316
Amis A., “Variation of finger forces in maximal isometric grasp tests on a range of
cyinder diameters.” Journal of Biomedical Engineering 1987; 9: 313-320
Andersson G., Chaffin D., Martin B., Occupational Biomechanics. 4th Edition. Wiley-
Interscience Inc., Hoboken, NJ: 2006
Berguer R., Chen J., Smith W., “A Comparison of the Physical Effort Required for
Laparoscopic and Open Surgical Techniques.” Arch. Surg. 2003; 138: 967-970
Berguer R., Forkey D., Smith W., “The effect of laparoscopic instrument working angle
on the surgeons’ upper extremity workload.” Surgical Endoscopy 2001; 15: 1027-
1029
Berguer R., Forkey D., Smith W., “Ergonomic problems associated with laparoscopic
surgery.” Surg. Edosc. 1999; 13: 466-468
Berguer R., Hreljac A., “The relationship between hand size and difficulty using surgical
instruments: A survey of 726 laparoscopic surgeons.” Surgical Endoscopy 2004;
18: 508-512
Berguer R., Smith W., Davis S., “An ergonomic study of the optimum operating table
height for laparoscopic surgery.” Surgical Endoscopy 2002; 16: 416-421
Chaffin D., Greenberg A., Workers and Their Tools. Pendall Publ. Co., Midland, MI:
1976
Chengalur S., Kodak’s Ergonomic Design for People at Work, The Eastman Kodak
Company, 2nd
Edition, John Wiley & Sons, Inc. 2004

84
Claudon L., “Evaluation of grip force using electromyograms in isometric isotonic
contractions.” International Journal of Occupational Safety and Ergonomics 1998;
4(2): 169-184
Cobb T., An K., Cooney W., “Externally Applied Forces to the Palm Increase Carpal
Tunnel Pressure” Journal of Hand Surgery 1995; 20A: 181-185
Cullen K., Hall M., Golosinskiy A., “Ambulatory Surgery in the United States, 2006.”
Centers for Disease Control and Prevention, National Health Statistics Reports
No. 11, 1/28/2009 Revised: 9/4/2009
Done K., Morse J., Verner L., Hallbeck S., Oleynikov D., “The Ergonomic Redesign of
Laparoscopic Surgical Forceps.” University of Nebraska, Lincoln, Nebraska.
Ferguson-Pell M., Hagisawa S., Bain D.. “Evaluation of a sensor for low interface
pressure applications.” Medical Engineering & Physics 2000; 22: 657-663
Hallbeck M., Oleynikov D., “Evaluation of a surgeon-centered laparoscopic surgical tool
design.” University of Nebraska, Lincoln, Nebraska. Hallbeck@@unl.edu
Hazelton F., Smidt G., Flatt A., Stephens R., “The influence of wrist position on the
force produced by the finger flexors.” Journal of Biomechanics 1975; 8: 301-306
Hemal A., Srinivas M., Charles A., “Ergonomic Problems Associated with
Laparoscopy.” J of Endourology 2001; 15(5): 499-503
Johnston III W., Hollenbeck B., Wolf Jr. J., “Comparison of Neuromuscular Injuries to
the Surgeon during Hand-Assisted and Standard Laparoscopic Urologic Surgery.”
J of Endourology 2005; 19(3): 377-381
Lee J., Rim K., “Measurement of finger forces during cylindrical grip activity.” Journal
of Biomedical Engineering 1991; 13: 152-162
Lim J., Erdman A., “A review of mechanism used in laparoscopic surgical instruments.”
Mechanism and Machine Theory 2003; 38: 1133-1147
Lundborg G., Gelberman R., Minteer-Convery M., Lee Y., Hargens A., “Median nerve
compression in the carpal tunnel-functional response to experimentally induced
controlled pressure.” Journal of Hand Surgery 1982; 7A: 252-259
Manukyan G., Waseda M., Inaki N., Torres Bermudez J., Gacek I., Rudinski A., Buess
G., “Ergonomics with the use of curved versus straight laparoscopic graspers

85
during rectosigmoid resection: results of a multiprofile comparative study.”
Surgical Endoscopy 2007; 21: 1079-1089
Matern U., Giebmeyer C., Bergmann R., Waller P., Faist M., “Ergonomic aspects of four
different types of laparoscopic instrument handles with respect to elbow angle.”
Surgical Endoscopy 2002; 16: 1528-1532
Matern U., Kuttler G., Giebmeyer C., Waller P., Faist M., “Ergonomic aspects of five
different types of laparoscopic handles under dynamic conditions with respect to
specific laparoscopic tasks: An electromyographic-based study.” Surgical
Endoscopy 2004; 18: 1231-1241
Norkin C., White D., Meausrment of Joint Motion: A Guide to Goniometry. F.A. Davis
Company, Philadelphia, PA: 1985
Nguyen N., Ho H., Smith W., Philipps C., Lewis C., De Vera R., Bergeur R., “An
ergonomic evaluation of surgeons’ axial skeletal and upper extremity movements
during laparoscopic and open surgery.” Am. J. of Surgery 2001; 182: 720-724
Ouckama R., Pearsall D., “Evaluation of a flexible force sensor for measurement of
helmet foam impact performance.” Journal of Biomechanics 2004; 44: 904-909
Park A., Lee G., Seagull F., Meenaghan N., Dexter D., “Patients Benefit While Surgeons
Suffer: An Impending Epidemic.” J of American College of Surgeons 2010;
210(3): 306-313
Peterson D., Cherniack M., “Repetitive impacts from manual hammering: Physiological
effects on the hand-arm system.” Canadian Acoustics. 2001; 12
Peterson D., Cherniack M., “Vibration, grip force, muscle activity, and upper extremity
movement of a manual hammering task.” Proc. Intl Conf. Hand-Arm Vibration.
Nancy, France, 2001
Qadri M, Peterson D., “Translating long duration human movement into musculoskeletal
injury prevention strategies”, Proc Biomed Eng Soc 2011 Annual Meeting,
Hartford, CT, 2011
Qadri M, Peterson D, “A method for modeling long-duration joint motion”, Proc 37th
NE
Bioeng Conf, Troy, NY, 2011
Quick N., Gillette J., Shapiro R., Adrales G., Gerlach D., Park A., “The effect of using
laparoscopic instruments on muscle activation patterns during minimally invasive
surgical training procedures.” Surgical Endoscopy 2003; 17: 462-465

86
Radhakrishnan S., Nagaravindra M., “Analysis of hand forces in health and disease
during maximum isometric grasping of cylinders.” Medical & Biomedical
Engineering & Computing 1993; 31: 372-376
Roquelaure Y., Mechali S., Dano C., Fanello S., Benetti F., Bureau D., Mariel J., Martin
Y-H., Derriennic F., Ponneau-Fontbonne D., “Occupational and personal risk
factors for carpal tunnel syndrome in industrial workers.” Scand J Work Environ
Health 1997; 23(5): 364-369
Schultz S., Perrin D., Adams J., Arnold B., Gansneder B., Granata K., “Assessment of
neuromuscular response characteristics at the knee following a functional
perturbation” Journal of Electromyography and Kinesiology 2000; 10: 159-170
Shergill A., Asundi K., Barr A., Shah J., Ryan J., McQuaid K., Rempel D., “Pinch force
and forearm muscle load during routine colonoscopy: a pilot study.”
Gastrointestinal Endoscopy 2009; 69(1): 142-146
Shergill A., McQuaid K., Rempel D., “Ergonomics and GI endoscopy.” Gastrointestinal
Endoscopy 2009; 70(1): 145-153
Silverstein B., Fine L., Armstrong T., “Hand wrist cumulative trauma disorders in
industry.” British Journal of Medicine, 1986; 43: 779-784
Snook S., Ciriello V., Webster B., “Maximum acceptable forces for repetitive wrist
extension with a pinch grip.” Int. J of Ind. Erg, 1999; 24: 570-590
Szabo R., Gelberman R., Williamson R., Hargens A., “Effects of increased systemic
blood pressure on the tissue fluid pressure threshold of peripheral nerve.” Journal
of Orthopedic Research 1983; 1: 172-178
Talsania J., Kozin S., “Normal digital contribution to grip strength assessed by a
computerized digital dynamometer.” Journal of Hand Surgery 1998; 23B: 2: 162-
166
Trejo A., Done K., DiMartino A., Oleynikov D., Hallbeck M., “Articulating vs.
conventional laparoscopic grasping tools – surgeons’ opinions.” Int. J of Ind. Erg.
2006; 36: 25-35
Uchal M., Brogger J., Rukas R., Karlsen B., Bergamaschi R., “In-line vs pistol-grip
handles in a laparoscopic simulator.” Surgical Endoscopy 2002; 16: 1771-1773

87
U.S. Department of Health and Human Services. “Selected topics in Surface
Electromyography for use in the Occupational Setting: Expert Perspectives.”
Centers for Disease Control and NIOSH. March, 1992
van Det M., Meijerink W., Hoff C., Totte E., Pierie J., “Optimal ergonomics for
laparoscopic surgery in minimally invasive surgery suites: a review and
guidelines.” Surgical Endoscopy 2009; 23: 1279-1285
van Veelen M., Meijer D., Goossens R., Snijders C., “New Ergonomic Design Criteria
for Handles of Laparoscopic Dissection Forceps.” J of Laparoendoscopic &
Advanced Surgical Techniques 2001; 11(1): 17-26
Wichert A., Marcos-Suarez P., Vereczkei A., Seitz T., Bubb H., Feussner H.,
“Improvement of the ergonomic situation in the integrated operating room for
laparoscopic operations.” Elsevier International Congress Series 2004; 1268: 842-
846