a comprehensive study of proto-planetary disks around herbig
TRANSCRIPT
A Comprehensive Study of Proto-Planetary Disks aroundHerbig Ae stars using Long-Baseline Infrared Interferometry
by
Ajay-Kumar M. Tannirkulam
A dissertation submitted in partial fulfillmentof the requirements for the degree of
Doctor of Philosophy(Astronomy and Astrophysics)in The University of Michigan
2008
Doctoral Committee:
Associate Professor John D. Monnier, ChairProfessor Fred C. AdamsProfessor Sushil K. AtreyaProfessor Nuria P. CalvetAssociate Professor Edwin A. Bergin

“Where the mind is without fear and the head is held high
Where knowledge is free
Where the world has not been broken up into fragments by narrow domestic walls
Where words come out from the depth of truth
Where tireless striving stretches its arms towards perfection
Where the clear stream of reason has not lost its way into the dreary desert sand ofdead habit
Where the mind is led forward by thee into ever-widening thought and action
Into that heaven of freedom, my Father, let my country awake.”
Rabindranath Tagore (1861-1941)
Copyright c©Ajay-Kumar M. Tannirkulam
All Rights Reserved2008

To Amma, Appa and my sister, Bhargavi.
ii
Acknowledgments
The fruition of this thesis has depended on the support and assistance of many peo-
ple. First, and foremost, a big “thank you” to my thesis advisor Prof. John Monnier
for being a great mentor. It has been a privilege and a pleasure being his graduate
student. He has always motivated me to perform to the best of my abilities and
his enthusiasm and work ethics have been very inspirational. I am very grateful
to him for providing me the guidance and the resources to work on very interest-
ing astrophysical problems. I have been fortunate to have had valuable discussions
with Dr. Tim Harries (University of Exeter) on young-stellar-object science. The
majority of the disk-structure calculations in my thesis were performed with the
TORUS Monte-Carlo radiation-transfer code developed by Dr. Harries’s group. He
has always been readily available for consultation and technical advice. I owe much
of my interferometric observing skills to Dr. Rafael Millan-Gabet (Michelson Sci-
ence Center) and am thankful for his friendly advice and encouragement. I very
much appreciate the time and effort of my thesis committee: Prof. Fred Adams,
Prof. Sushil Atreya, Prof. Nuria Calvet and Prof. Edwin Bergin. Their advice and
constructive criticism has been very helpful. I am lucky to have been able to interact
frequently with Prof. Calvet and Prof. Bergin and am thankful for their valuable
suggestions and support. Prof. Timothy Mckay, my Master’s project advisor in-
iii

troduced me to hands-on astronomy research and made me realize the importance
of time management. The entire Astronomy faculty at University of Michigan has
been very friendly and supportive and I am grateful to them for making my graduate
education very enjoyable.
Next, I would like to acknowledge the assistance of Jeremy Hallum, Dr. Michael
Busha, Marlin Whitaker, Dr. Phillip Hughes, Dr. Augustus Evrard, Rebecca Stanek
and Roy Bonser for helping me execute code on the Wiglaf and Opus Beowulf clus-
ters. I am especially thankful to Dr. Hughes for clarifying many of my elementary
questions on parallel code compilation. I want to thank Tom Brink, Ming Zhao,
Zhaohuan Zhu, John Tobin, Dr. Jesus Hernandez, Dr. David Berger, Dr. Ettore Pe-
dretti (University of St. Andrews), Dr. Rishi Sharma (Los Alamos National Labs),
Dr. Theo ten Brummelaar (CHARA, GSU), Prof. Lynne Hillenbrand (California In-
stitute of Technology), Prof. Michael Meyer (University of Arizona), Prof. Charles
Cowley and Prof. Lee Hartmann for technical discussions that have helped me crystal-
lize my thoughts at various occasions. The staff at MDM Observatories and CHARA
(Georgia State University) helped make my observing runs successful and very enjoy-
able. Carin Scott, Stephanie Ford and Sarah Lloyd have helped me a great deal with
administrative chores and have been extremely patient with me on the numerous
occasions where I did not turn in papers on time.
The graduate students and the research scholars at the Astronomy Department
have made 6 years of my stay in Ann Arbor a lot of fun. The congenial atmosphere
and the cooperative spirit that they provide makes the Department a great place
to be in. Tom Brink has been a very good office mate and friend. We have had
iv
deep, insightful discussions on a wide variety of topics ranging from cricket, arranged
marriages in India, the scientific validity of agnosticism, the superiority of Waltz vs
Salsa and veganism. These discussions have sometimes been big suckers of time which
often drew in unsuspecting prey in the form of Ming Zhao, Jess Werk, Sarah Ragan,
Rebecca Stanek and Laura Ingleby. I wish to thank Shannon Schmoll for her excellent
ginger cake which made me realize that vegan desserts need not always have to be
bad. Tom Brink, Sarah Ragan, Rebecca Stanek, Jess Werk and Jefferey Fogel have
been excellent organizers for a number of social events which often helped me kick
off my weekends on a fun note. Thanks to all my friends at Michigan. Fortunately, I
have too many to list everyone, but I am especially thankful to my apartment mates,
Ajay Raghavan, Shidhartha Das, Siddharth D’Silva, Harsh Singhal, Vishal Shah and
Panos for tolerating my bathroom singing and making my stay enjoyable. Lastly,
but definitely not the least, the encouragement of parents, sister Bhargavi and my
extended family played an important role in the realization of my dissertation.
This thesis was supported in part by NASA Grant 050283. The support is greatly
appreciated. Chapters 2, 3, 4 and 5 in the thesis are partly based on publications in
the Astrophysical Journal (Tannirkulam et al. [2007, 2008b]) and the Astrophysical
Journal Letters (Monnier et al. [2008a]; Tannirkulam et al. [2008]).
v

Contents
Dedication . . . . . . . . . . . . . . . . . . . . . . . . . . . . . . . . . . . . . . . . . . . . . . . . ii
Acknowledgments . . . . . . . . . . . . . . . . . . . . . . . . . . . . . . . . . . . . . . . . . . . iii
List of Figures . . . . . . . . . . . . . . . . . . . . . . . . . . . . . . . . . . . . . . . . . . . . . x
List of Tables . . . . . . . . . . . . . . . . . . . . . . . . . . . . . . . . . . . . . . . . . . . . . . xiv
List of Appendices . . . . . . . . . . . . . . . . . . . . . . . . . . . . . . . . . . . . . . . . . . xv
List of Abbreviations . . . . . . . . . . . . . . . . . . . . . . . . . . . . . . . . . . . . . . . . xvi
Abstract . . . . . . . . . . . . . . . . . . . . . . . . . . . . . . . . . . . . . . . . . . . . . . . . . xvii
Chapter
1 Introduction . . . . . . . . . . . . . . . . . . . . . . . . . . . . . . . . . . . . . . . . 1
1.1 Star Formation . . . . . . . . . . . . . . . . . . . . . . . . . . . . . . . . . . . 2
1.2 Herbig Ae/Be stars . . . . . . . . . . . . . . . . . . . . . . . . . . . . . . . . 3
1.3 Circumstellar Disks in Herbig Ae Stars . . . . . . . . . . . . . . . . . . 9
1.3.1 Dullemond Model . . . . . . . . . . . . . . . . . . . . . . . . . . 10
1.4 The power of Interferometry in exploring HAe/Be disk structure 14
1.5 Overview of the Thesis . . . . . . . . . . . . . . . . . . . . . . . . . . . . . 21
2 Self-consistent Models for the Gas-Dust Transition Region . . . 24
2.1 Introduction . . . . . . . . . . . . . . . . . . . . . . . . . . . . . . . . . . . . . 24
2.2 The Monte Carlo Radiative Transfer Code - TORUS . . . . . . . . 27
vi

2.2.1 Description of grid and disk structure calculations . . . 27
2.2.2 Implementation of Dust Sublimation. . . . . . . . . . . . . . 30
2.3 Code testing against IN05 results . . . . . . . . . . . . . . . . . . . . . . 32
2.4 Rim curvature due to grain growth/settling . . . . . . . . . . . . . . . 34
2.4.1 Model Description . . . . . . . . . . . . . . . . . . . . . . . . . . 34
2.4.2 Geometry of the Dust Segregation Rim . . . . . . . . . . . 36
2.4.3 Observables . . . . . . . . . . . . . . . . . . . . . . . . . . . . . . . 39
2.5 Discussion . . . . . . . . . . . . . . . . . . . . . . . . . . . . . . . . . . . . . . 40
2.6 Chapter Summary and Conclusions . . . . . . . . . . . . . . . . . . . . 43
3 Confronting Long-Baseline Near-Infrared Interferometry . . . . . 47
3.1 Introduction . . . . . . . . . . . . . . . . . . . . . . . . . . . . . . . . . . . . . 47
3.2 The CHARA Array . . . . . . . . . . . . . . . . . . . . . . . . . . . . . . . . 48
3.3 Observations . . . . . . . . . . . . . . . . . . . . . . . . . . . . . . . . . . . . 52
3.3.1 The Interferometric Observable: Visibility . . . . . . . . . 52
3.3.2 CHARA observations of MWC275 and AB Aur . . . . . 55
3.4 Data Reduction and Analysis . . . . . . . . . . . . . . . . . . . . . . . . . 58
3.5 Modeling . . . . . . . . . . . . . . . . . . . . . . . . . . . . . . . . . . . . . . . 62
3.6 Physical Interpretation . . . . . . . . . . . . . . . . . . . . . . . . . . . . . 65
3.7 Discussion . . . . . . . . . . . . . . . . . . . . . . . . . . . . . . . . . . . . . . 67
4 Circumstellar Disks in Mid-Infrared Emission . . . . . . . . . . . . . 72
4.1 MIR emission morphology . . . . . . . . . . . . . . . . . . . . . . . . . . . 72
4.2 The Keck Segment Tilting Experiment . . . . . . . . . . . . . . . . . . 77
4.2.1 Geometric Models for MIR Emission in HAe/Be stars . 80
vii

4.3 The Circumbinary Disk in V892 Tau . . . . . . . . . . . . . . . . . . . 87
4.3.1 Analysis . . . . . . . . . . . . . . . . . . . . . . . . . . . . . . . . . 89
4.3.2 Discussion and Conclusion . . . . . . . . . . . . . . . . . . . . 91
5 Comprehensive Models for SED and Interferometry . . . . . . . . 94
5.1 Introduction . . . . . . . . . . . . . . . . . . . . . . . . . . . . . . . . . . . . . 95
5.2 New Observations and Literature Data . . . . . . . . . . . . . . . . . . 98
5.3 Circumstellar Disk Modeling . . . . . . . . . . . . . . . . . . . . . . . . . 100
5.3.1 The Monte Carlo Transfer Code - TORUS . . . . . . . . . 103
5.3.2 Comprehensive models for SED and Interferometry . . . 105
5.4 MWC275: Analysis . . . . . . . . . . . . . . . . . . . . . . . . . . . . . . . . 106
5.4.1 The Thermal NIR Disk . . . . . . . . . . . . . . . . . . . . . . 107
5.4.2 MIR SED and Emission Morphology . . . . . . . . . . . . . 114
5.5 AB Aur: Analysis . . . . . . . . . . . . . . . . . . . . . . . . . . . . . . . . . 116
5.5.1 The Thermal NIR Disk . . . . . . . . . . . . . . . . . . . . . . 116
5.5.2 MIR SED and Emission Morphology . . . . . . . . . . . . . 117
5.6 Discussion . . . . . . . . . . . . . . . . . . . . . . . . . . . . . . . . . . . . . . 119
5.6.1 The Thermal NIR Disk . . . . . . . . . . . . . . . . . . . . . . 119
5.6.2 The Outer Disk . . . . . . . . . . . . . . . . . . . . . . . . . . . . 121
5.7 Conclusions . . . . . . . . . . . . . . . . . . . . . . . . . . . . . . . . . . . . . 122
6 Summary and Future Work . . . . . . . . . . . . . . . . . . . . . . . . . . . . 136
6.1 Key Contributions . . . . . . . . . . . . . . . . . . . . . . . . . . . . . . . . . 136
6.1.1 Relevance of work to planet formation studies . . . . . . 138
6.2 Way Forward . . . . . . . . . . . . . . . . . . . . . . . . . . . . . . . . . . . . 140
viii

6.2.1 Observations . . . . . . . . . . . . . . . . . . . . . . . . . . . . . . 144
6.2.2 Near-Infrared Long-baseline Interferometry . . . . . . . . 144
6.2.3 Modeling . . . . . . . . . . . . . . . . . . . . . . . . . . . . . . . . 147
6.3 Concluding Remarks . . . . . . . . . . . . . . . . . . . . . . . . . . . . . . . 149
Appendices . . . . . . . . . . . . . . . . . . . . . . . . . . . . . . . . . . . . . . . . . . . . . . . 150
References . . . . . . . . . . . . . . . . . . . . . . . . . . . . . . . . . . . . . . . . . . . . . . . . 173
ix
List of Figures
Figure
1.1 Star formation paradigm for low and intermediate mass stars. . . . . . 5
1.2 Hubble image of the M16 (Eagle Nebula) courtesy NASA/ESA/STScI. 6
1.3 Hubble images of the edge on Herbig Haro object HH30. . . . . . . . . . 7
1.4 AB Aurigae in scattered light (Grady et al. [1999]). . . . . . . . . . . . . 7
1.5 MWC275 in scattered light (Grady et al. [2000]). . . . . . . . . . . . . . . 8
1.6 Reflected light from the debris disk around AU Mic (Krist et al. [2005]). 8
1.7 The SED of AB Aur (Hillenbrand et al. [1992]). . . . . . . . . . . . . . . . 10
1.8 Schematic for passive (top) and active (bottom) disk models. . . . . . . 11
1.9 K-Band visibilty data on AB Aur (Millan-Gabet et al. [1999]). . . . . . 12
1.10 The Dullemond (Dullemond et al. [2001]) passive disk model. . . . . . 12
1.11 The NIR size luminosity diagram (Millan-Gabet et al. [2007]). . . . . 13
1.12 SED for Meeus Group II and Group I sources (Meeus et al. [2001]). . 15
1.13 Flared Disk (Dullemond et al. [2003b]). . . . . . . . . . . . . . . . . . . . . . 16
1.14 Self-shadowed Disk (Dullemond et al. [2003b]). . . . . . . . . . . . . . . . . 17
1.15 VVSer imaged in PAH emission (Pontoppidan et al. [2007]). . . . . . . 18
1.16 Spatially-resolved MIR spectra of HAe stars (van Boekel et al. [2004]). 19
1.17 Brγ emission in Herbig Ae star HD104237 (Tatulli et al. [2007]). . . . 20
x
1.18 Schematic of disk models. . . . . . . . . . . . . . . . . . . . . . . . . . . . . . . . 23
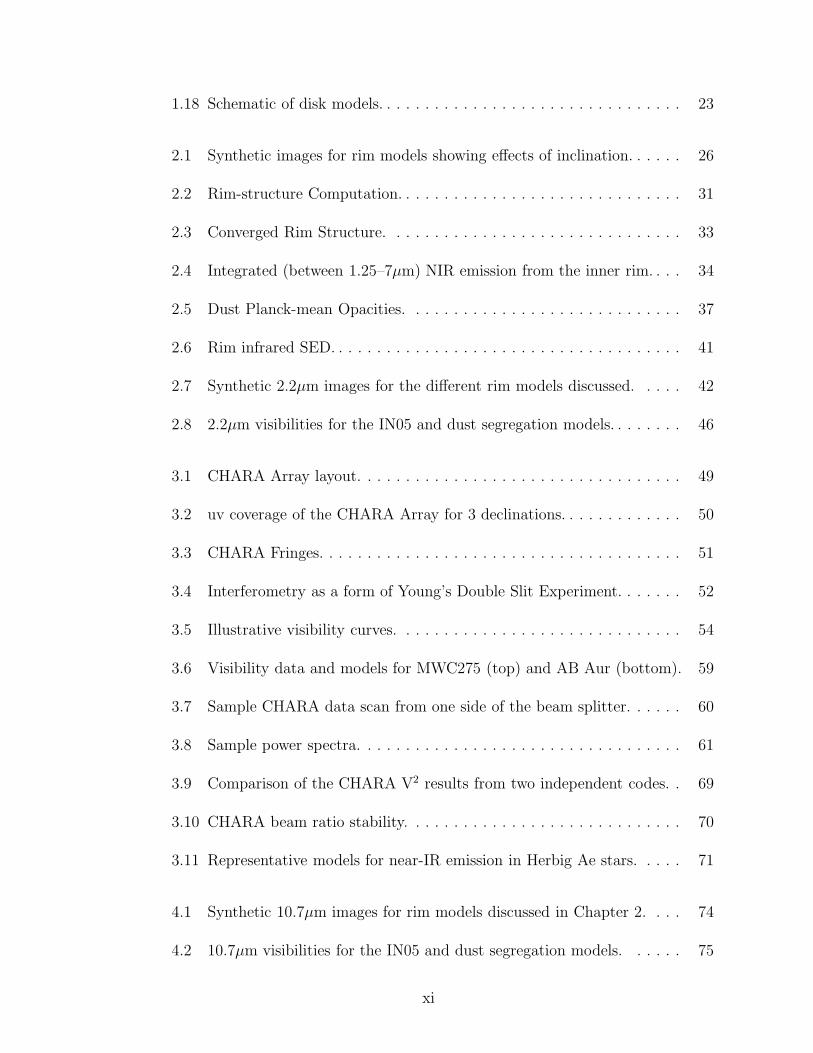
2.1 Synthetic images for rim models showing effects of inclination. . . . . . 26
2.2 Rim-structure Computation. . . . . . . . . . . . . . . . . . . . . . . . . . . . . . 31
2.3 Converged Rim Structure. . . . . . . . . . . . . . . . . . . . . . . . . . . . . . . 33
2.4 Integrated (between 1.25–7µm) NIR emission from the inner rim. . . . 34
2.5 Dust Planck-mean Opacities. . . . . . . . . . . . . . . . . . . . . . . . . . . . . 37
2.6 Rim infrared SED. . . . . . . . . . . . . . . . . . . . . . . . . . . . . . . . . . . . . 41
2.7 Synthetic 2.2µm images for the different rim models discussed. . . . . 42
2.8 2.2µm visibilities for the IN05 and dust segregation models. . . . . . . . 46
3.1 CHARA Array layout. . . . . . . . . . . . . . . . . . . . . . . . . . . . . . . . . . 49
3.2 uv coverage of the CHARA Array for 3 declinations. . . . . . . . . . . . . 50
3.3 CHARA Fringes. . . . . . . . . . . . . . . . . . . . . . . . . . . . . . . . . . . . . . 51
3.4 Interferometry as a form of Young’s Double Slit Experiment. . . . . . . 52
3.5 Illustrative visibility curves. . . . . . . . . . . . . . . . . . . . . . . . . . . . . . 54
3.6 Visibility data and models for MWC275 (top) and AB Aur (bottom). 59
3.7 Sample CHARA data scan from one side of the beam splitter. . . . . . 60
3.8 Sample power spectra. . . . . . . . . . . . . . . . . . . . . . . . . . . . . . . . . . 61
3.9 Comparison of the CHARA V2 results from two independent codes. . 69
3.10 CHARA beam ratio stability. . . . . . . . . . . . . . . . . . . . . . . . . . . . . 70
3.11 Representative models for near-IR emission in Herbig Ae stars. . . . . 71
4.1 Synthetic 10.7µm images for rim models discussed in Chapter 2. . . . 74
4.2 10.7µm visibilities for the IN05 and dust segregation models. . . . . . 75
xi
4.3 Midplane temperature profiles for disk models. . . . . . . . . . . . . . . . . 76
4.4 Keck Segment map. . . . . . . . . . . . . . . . . . . . . . . . . . . . . . . . . . . . 79
4.5 Disk size vs color. . . . . . . . . . . . . . . . . . . . . . . . . . . . . . . . . . . . . 80
4.6 Surface brightness vs color. . . . . . . . . . . . . . . . . . . . . . . . . . . . . . . 83
4.7 Chiang & Goldreich [1997] 2-layer passive-disk model. . . . . . . . . . . . 84
4.8 Disk geometries used to construct theoretical color-brightness track. . 86
4.9 Image reconstructions of v892 Tau using the BSMEM software. . . . . 89
4.10 SED for v892 Tau. . . . . . . . . . . . . . . . . . . . . . . . . . . . . . . . . . . . . 93
5.1 uv coverage for MWC275. . . . . . . . . . . . . . . . . . . . . . . . . . . . . . . 110
5.2 MWC 275 visibility data and model curves. . . . . . . . . . . . . . . . . . . 111
5.3 MWC275 visibility vs ‘Effective Baseline’. . . . . . . . . . . . . . . . . . . . 112
5.4 Inclined-disk models for NIR emission in MWC275. . . . . . . . . . . . . 124
5.5 Constraining the size of the smooth emission component in MWC275. 125
5.6 The NIR SED for MWC275. . . . . . . . . . . . . . . . . . . . . . . . . . . . . . 125
5.7 Gas opacity. . . . . . . . . . . . . . . . . . . . . . . . . . . . . . . . . . . . . . . . . 126
5.8 MWC275 SED from UV to mm. . . . . . . . . . . . . . . . . . . . . . . . . . . 127
5.9 MIR image and visibilities for MWC275. . . . . . . . . . . . . . . . . . . . . 128
5.10 Mass fractions of dust components relative to gas. . . . . . . . . . . . . . 129
5.11 Temperature profile and disk-surface shapes for MWC275 and AB Aur.130
5.12 uv coverage for AB Aur. . . . . . . . . . . . . . . . . . . . . . . . . . . . . . . . 131
5.13 AB Aur visibility curve vs baseline. . . . . . . . . . . . . . . . . . . . . . . . . 132
5.14 Face-on models for NIR emission in AB Aur. . . . . . . . . . . . . . . . . . 133
xii
5.15 The NIR SED for AB Aur. . . . . . . . . . . . . . . . . . . . . . . . . . . . . . . 134
5.16 AB Aur SED from UV to mm. . . . . . . . . . . . . . . . . . . . . . . . . . . . 134
5.17 10.7µm image and visibilities for AB Aur. . . . . . . . . . . . . . . . . . . . 135
6.1 Empirically derived gas opacities. . . . . . . . . . . . . . . . . . . . . . . . . . 142
6.2 Hα and Hβ line profiles. . . . . . . . . . . . . . . . . . . . . . . . . . . . . . . . . 145
6.3 MIRC and CHAMP. . . . . . . . . . . . . . . . . . . . . . . . . . . . . . . . . . . 146
B.1 YSO time variability. . . . . . . . . . . . . . . . . . . . . . . . . . . . . . . . . . . 155
B.2 Defocussed H band image of AB Aur. . . . . . . . . . . . . . . . . . . . . . . 157
B.3 TIFKAM linearity test. . . . . . . . . . . . . . . . . . . . . . . . . . . . . . . . . 158
B.4 Aperture photometry on a star. . . . . . . . . . . . . . . . . . . . . . . . . . . 159
B.5 Radial count profile on a star. . . . . . . . . . . . . . . . . . . . . . . . . . . . . 160
B.6 V-band calibration plot. . . . . . . . . . . . . . . . . . . . . . . . . . . . . . . . . 161
C.1 Reduced χ2 surface for linear fits to visibilities of MWC275. . . . . . . 172
C.2 Linear fits to the observed visibilities vs effective baseline. . . . . . . . . 172
xiii

List of Tables
Table
2.1 Basic properties of central star and the circumstellar disk. . . . . . . . . 33
3.1 Basic properties of stars. . . . . . . . . . . . . . . . . . . . . . . . . . . . . . . . 56
3.2 CHARA uv coverage and visibility data for MWC275. . . . . . . . . . . 57
3.3 CHARA uv coverage and visibility data for AB Aur. . . . . . . . . . . . 57
3.4 MWC275 and AB Aur model parameters for K-band emission. . . . . 65
5.1 Keck Segment Tilting uv-averaged data for MWC275 and AB Aur. . 99
5.2 Basic stellar properties and photometry for MWC275. . . . . . . . . . . . 100
5.3 Basic stellar properties and photometry for AB Aur. . . . . . . . . . . . . 101
5.4 MWC275 disk properties from the literature. . . . . . . . . . . . . . . . . . 101
5.5 AB Aur disk properties from the literature. . . . . . . . . . . . . . . . . . . 102
5.6 MWC275 model-disk properties constrained by this work. . . . . . . . . 115
5.7 AB Aur model-disk properties constrained by this work. . . . . . . . . . . 117
B.1 Photometry filter properties. . . . . . . . . . . . . . . . . . . . . . . . . . . . . . 157
B.2 UBVRI Photometry. Majority of the MDM targets are YSOs. . . . . . . 162
B.3 JHK Photometry. Majority of the MDM targets are YSOs. . . . . . . . . 167
xiv

List of Appendices
Appendix
1 Analytic Estimate for Rim Shape . . . . . . . . . . . . . . . . . . . . . . . . . . 151
2 Optical and Near-Infrared Photometry of Young Stellar Objects. . . . . 154
3 “Effective Baselines” as a tool in characterizing visibility information. 170
xv

List of Abbreviations
BCL Beam Combination Laboratory
BSF Beam Synthesis Facility
CHARA Center for High Angular Resolution Astronomy
CSM circumstellar material
IR infrared
HAe Herbig Ae
HAe/Be Herbig Ae/Be
IOTA Infrared Optical Telescope Array
GSU Georgia State University
MIR mid infrared
NIR near infrared
OPLE Optical Path Length Equalization
POP Pipes of Pan
PTI Palomar Testbed Interferometer
SED Spectral Energy Distribution
UD Uniform Disk
VLTI Very Large Telescope Interferometer
YSO Young Stellar Object
xvi

Abstract
A Comprehensive Study of Proto-Planetary Disks around Herbig Ae stars using
Long-Baseline Infrared Interferometry
by
Ajay-Kumar M. Tannirkulam
Chair: John D. Monnier
Planetary systems are born in circumstellar disks around young stellar objects (YSOs)
and the disk is thought to play a major role in the evolution of planetary systems.
A good understanding of disk structure and its time evolution is therefore essential
in comprehending planet formation, planet migration and the diversity of planetary
systems. In this thesis, I use high angular resolution observations and state-of-the-art
radiative transfer modeling to probe circumstellar disk structure and validate current
disk models.
First, I discuss models and observations of the gas-dust transition region in YSOs.
The dust component in circumstellar disks gets truncated at a finite radius from the
central star, inside of which it is too hot for dust to survive. The truncated disk forms
an “evaporation front” whose shape depends sensitively on dust properties. The pos-
sibility of using the front as a probe of the dust physics operating in circumstellar
disks is explored. The Center for High Angular Resolution Astronomy (CHARA)
xvii

near-infrared (near-IR) array is used to resolve out the evaporation front in the
Herbig Ae stars MWC275 and AB Aur, and the presence of an additional near-IR
opacity source within the “conventional” dust destruction radius is reported. Sec-
ond, I describe comprehensive disk models that simultaneously explain the spectral
energy distribution (from UV to milli-meter ) and long-baseline interferometry (from
near-IR to mm) of Herbig Ae stars. The models are constrained with a wide range
of data drawn from the literature as well as new interferometric observations in the
K-band with the CHARA array and in the mid-IR with the novel Keck Segment
Tilting Experiment. I show that the mid-IR size of MWC275 relative to AB Aur
is small, suggesting that dust grains in the outer disk of MWC275 are significantly
more evolved/settled than the grains in the AB Aur disk. Using the Segment Tilting
data, I also demonstrate that Herbig Ae/Be systems having a higher mid-IR sur-
face brightness tend to have bluer mid-IR colors. I interpret this trend with simple
geometric models for circumstellar disks.
I conclude with a discussion on exciting prospects for measuring the gas-disk
morphology on scales of fractions of an AU with the CHARA array, introducing a
new powerful tool to understand the “star-disk connection”.
xviii

Chapter 1
Introduction
In this thesis, I focus on the structure of disks surrounding intermediate mass
(1.5⊙ - 4 M⊙) young stellar objects (YSOs). These disks are formed as a natural
consequence of angular momentum conservation during the star formation process.
Circumstellar-disk material composed of dust and gas provides the physical setting
in which planetary systems are born and evolve. Circumstellar disks have therefore
become core subjects of study in modern astronomy.
One class of intermediate mass YSOs, the Herbig Ae/Be stars, are key to detailed
understanding of proto-planetary disk strucure. Due to the higher luminosity and
effective temperature of the central star, the region of the disk emitting at a given
wavelength is much larger in Herbig Ae/Be (HAe/Be) stars than in solar type T Tauri
stars. Therefore, when at similar distances from the earth, HAe/Be stars are more
amenable to spatially resolved studies. Fortunately, quite a few HAe/Be stars exist
within 150pc from us making them ideal test subjects for YSO disk studies accessing
current high resolution instrumentation. The star and disk properties from T Tauri
to HAe stars, form a continuum (see for e.g. Mottram et al. [2007]) and the results
that I obtain on HAe stars will act as a bridge towards theories of T Tauri disks and
lay a strong foundation for future studies of T Tauri systems with the next generation
1
of higher sensitivity, higher spatial resolution instruments.
1.1 Star Formation
Stars are formed from the collapse (gravitational/external compression) of molecu-
lar clouds. Molecular cloud material (mostly hydrogen and helium) having typical
number densities of 105-106 cm−3, gets compressed by over 17 orders of magnitude
en-route to forming stars. The size scale of the cloud also decreases several orders
of magnitude (from parsecs to hundreds of AU). Thus any rotation present in the
cloud initially gets enormously magnified due to angular momentum conservation.
The bulk of the in-falling material falls onto a disk from which material is then ac-
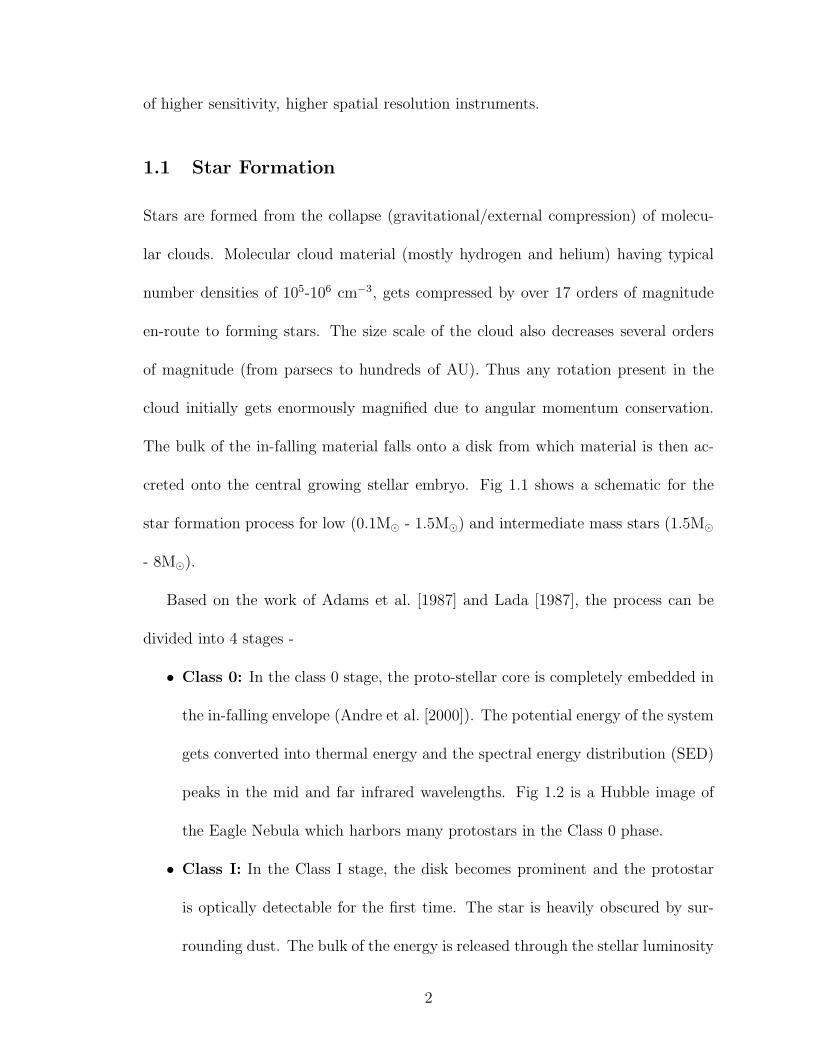
creted onto the central growing stellar embryo. Fig 1.1 shows a schematic for the
star formation process for low (0.1M⊙ - 1.5M⊙) and intermediate mass stars (1.5M⊙
- 8M⊙).
Based on the work of Adams et al. [1987] and Lada [1987], the process can be
divided into 4 stages -
• Class 0: In the class 0 stage, the proto-stellar core is completely embedded in
the in-falling envelope (Andre et al. [2000]). The potential energy of the system
gets converted into thermal energy and the spectral energy distribution (SED)
peaks in the mid and far infrared wavelengths. Fig 1.2 is a Hubble image of
the Eagle Nebula which harbors many protostars in the Class 0 phase.
• Class I: In the Class I stage, the disk becomes prominent and the protostar
is optically detectable for the first time. The star is heavily obscured by sur-
rounding dust. The bulk of the energy is released through the stellar luminosity
2
and from viscous dissipation in the active accretion disk.
• Class II: Mass accretion rates drop down significantly and the disk becomes
relatively quiescent. The central star is optically visible and the infrared ex-
cess is dominated by the reprocessing of stellar light by circumstellar material.
Planetary systems are born and actively evolve in this stage. Figs 1.4 and 1.5
show scattered light images of famous Class II sources AB Aur and MWC275.
These objects are the central subjects of this thesis.
• Class III: In the Class III stage, much of the circumstellar material has been
accreted/dissipated. Class III objects sometimes exhibit a weak mid-IR excess
due to the presence of an optically thin remnant disk (debris disk). AU Micro-
scopii (see Fig 1.6) is a famous Class III debris disk object.
In the next section, we describe observational properties of intermediate mass
YSOs, objects of detailed study in later chapters.
1.2 Herbig Ae/Be stars
Herbig Ae/Be (HAe/Be) stars are pre-main-sequence stars in the mass range of 1.5M⊙
- 8M⊙. They were first classified by Herbig [1960] in an attempt to observationally
identify more massive analogues of T Tauri stars. We follow Waters & Waelkens
[1998] in listing a working definition of HAe/Be stars: Herbig Ae/Be stars have
spectral types F6 to B, luminosity class III to V and display emission lines. Their
SED shows an infrared excess over stellar photospheric values due to the presence
of hot/cool circumstellar dust. Some of the general properties of HAe/Be stars as
reviewed in Waters & Waelkens [1998] are -
3

• SED The infrared SED is characterized by the emission due to large amounts
of circumstellar material (CSM). For HAe/Be stars in the Class II phase, the
bulk of IR emission arises from warm dust heated by stellar photons. Some
HAeBe stars also exhibit excess UV continuum emission from accretion of gas.
In subsequent chapters, we will use SED and interferometry as powerful probes
of CSM geometry.
• Photometric Variability The optical continuum of HAe/Be stars show vari-
ability on several time scales. Some of the more extreme variable sources (≥ 1
mag in the visual band) are termed UX Orionis objects. These variations are
believed to arise from the changing geometry of the CSM.
• Line Spectra Frequently observed emission lines in HAe/Be stars are from
hydrogen, oxygen, silicon, calcium, sulphur and magnesium. The lines show
time variability and complex line profiles. The photospheric absorption features
are fairly straightforward and the line strengths are consistent with F, A and
B main sequence stars.
• Polarization The optical continuum of HAe/Be stars shows intrinsic and vari-
able polarization due to the presence of aligned dust grains or grains in a non-
spherical geometry. The polarization in some sources is high (several percent)
and can also exhibit strong variability coinciding with photometric minima.
These observations have been interpreted in terms of dust blocking the un-
polarized light from the central source.
4
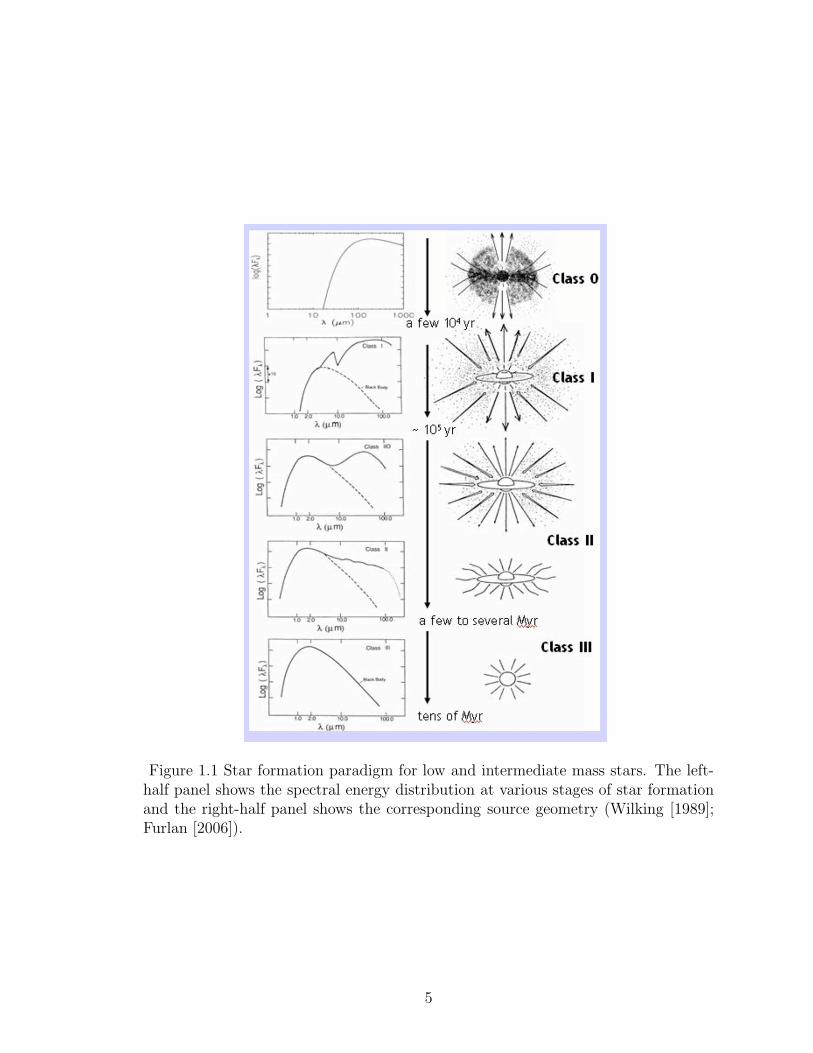
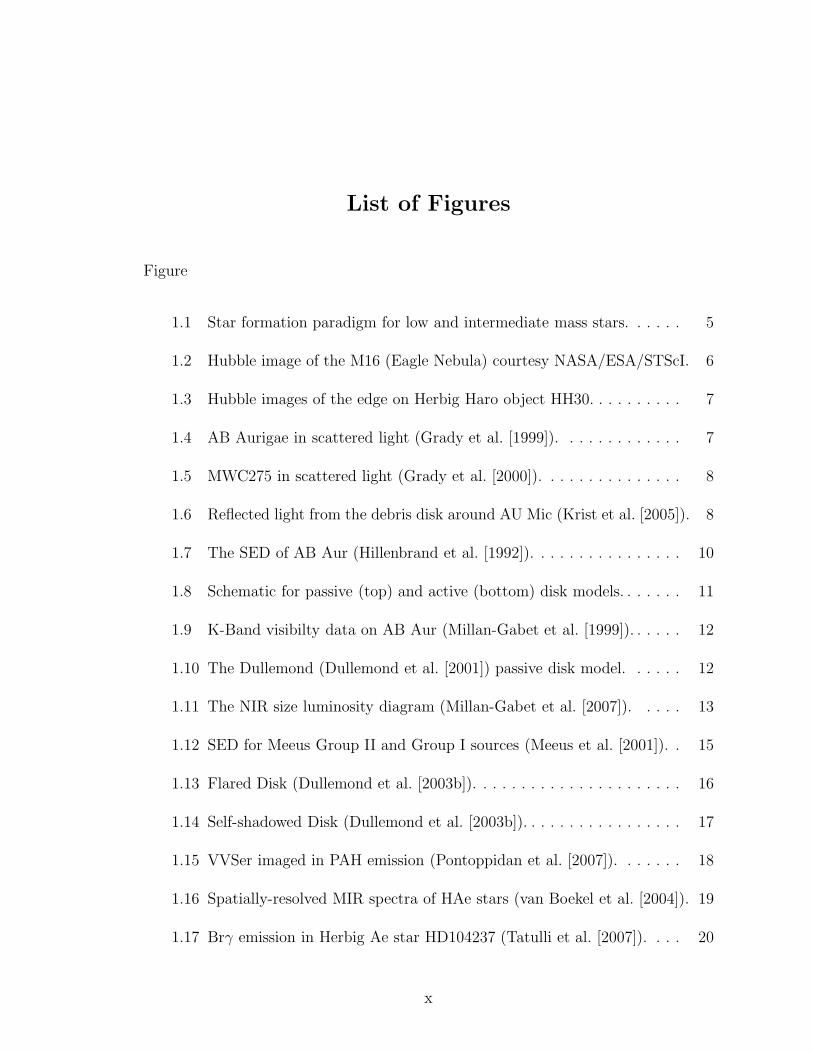
Figure 1.1 Star formation paradigm for low and intermediate mass stars. The left-half panel shows the spectral energy distribution at various stages of star formationand the right-half panel shows the corresponding source geometry (Wilking [1989];Furlan [2006]).
5

Figure 1.2 Hubble image of the M16 (Eagle Nebula) courtesy NASA/ESA/STScI.
6
Figure 1.3 Hubble images of the edge on Herbig Haro object HH30. The imagesshow variations in the jet structure over a 5 year period (credits NASA/ESA/STScI,Burrows et al. [1996]).
Figure 1.4 AB Aurigae in scattered light (Grady et al. [1999]). The disk shows spiralarms.
7
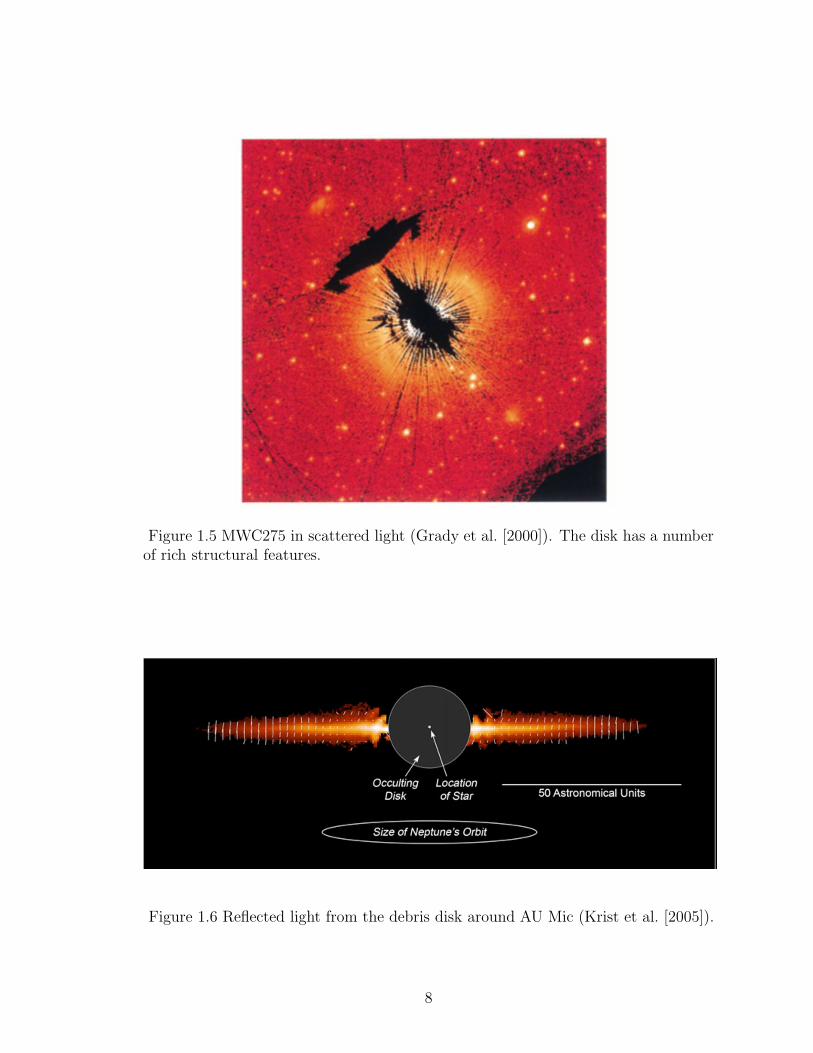
Figure 1.5 MWC275 in scattered light (Grady et al. [2000]). The disk has a numberof rich structural features.
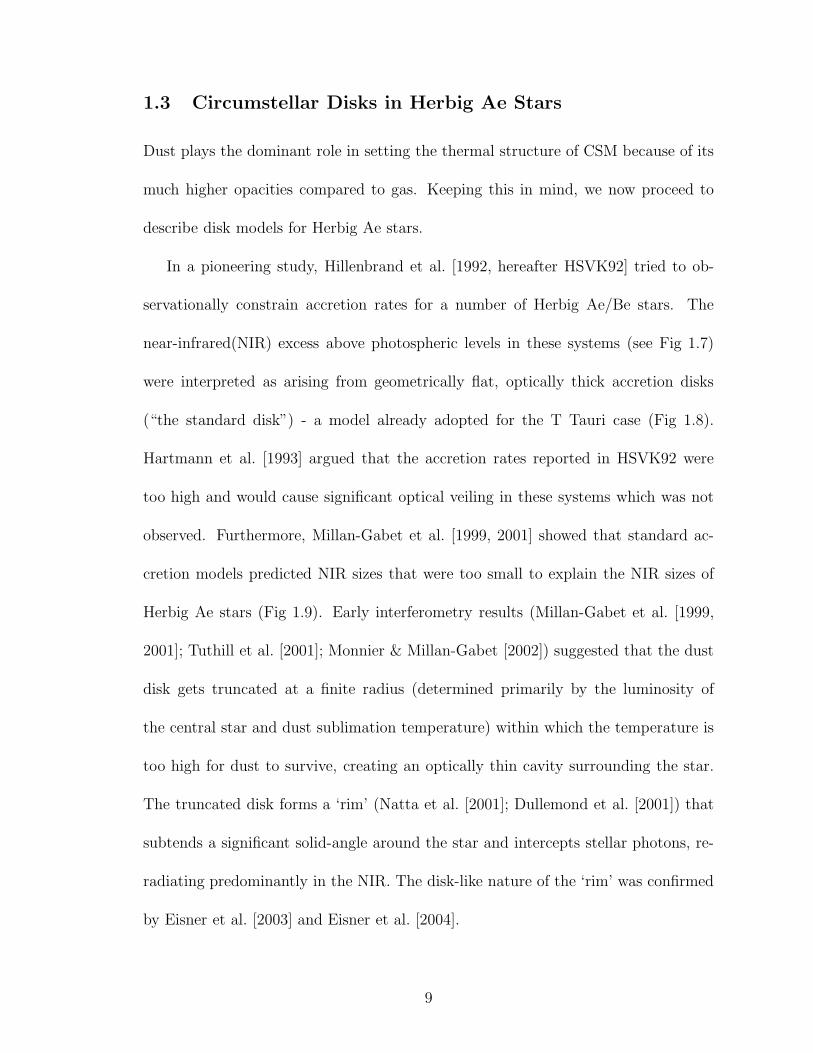
Figure 1.6 Reflected light from the debris disk around AU Mic (Krist et al. [2005]).
8
1.3 Circumstellar Disks in Herbig Ae Stars
Dust plays the dominant role in setting the thermal structure of CSM because of its
much higher opacities compared to gas. Keeping this in mind, we now proceed to
describe disk models for Herbig Ae stars.
In a pioneering study, Hillenbrand et al. [1992, hereafter HSVK92] tried to ob-
servationally constrain accretion rates for a number of Herbig Ae/Be stars. The
near-infrared(NIR) excess above photospheric levels in these systems (see Fig 1.7)
were interpreted as arising from geometrically flat, optically thick accretion disks
(“the standard disk”) - a model already adopted for the T Tauri case (Fig 1.8).
Hartmann et al. [1993] argued that the accretion rates reported in HSVK92 were
too high and would cause significant optical veiling in these systems which was not
observed. Furthermore, Millan-Gabet et al. [1999, 2001] showed that standard ac-
cretion models predicted NIR sizes that were too small to explain the NIR sizes of
Herbig Ae stars (Fig 1.9). Early interferometry results (Millan-Gabet et al. [1999,
2001]; Tuthill et al. [2001]; Monnier & Millan-Gabet [2002]) suggested that the dust
disk gets truncated at a finite radius (determined primarily by the luminosity of
the central star and dust sublimation temperature) within which the temperature is
too high for dust to survive, creating an optically thin cavity surrounding the star.
The truncated disk forms a ‘rim’ (Natta et al. [2001]; Dullemond et al. [2001]) that
subtends a significant solid-angle around the star and intercepts stellar photons, re-
radiating predominantly in the NIR. The disk-like nature of the ‘rim’ was confirmed
by Eisner et al. [2003] and Eisner et al. [2004].
9
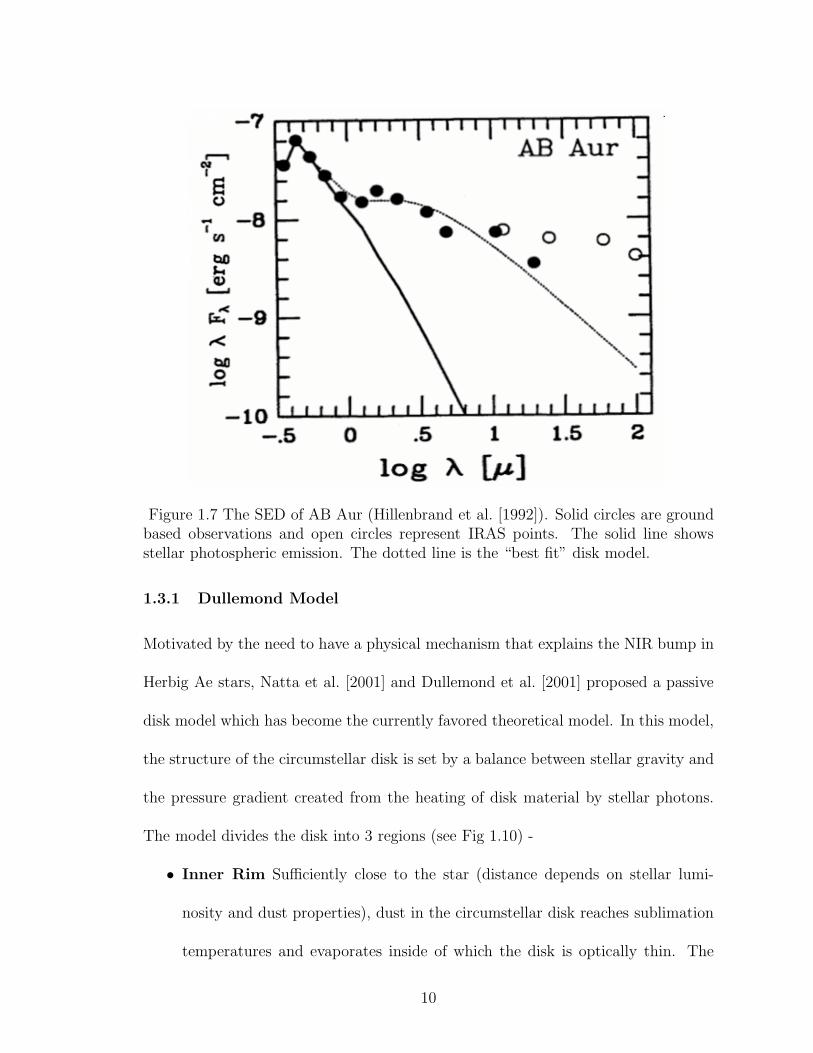
Figure 1.7 The SED of AB Aur (Hillenbrand et al. [1992]). Solid circles are groundbased observations and open circles represent IRAS points. The solid line showsstellar photospheric emission. The dotted line is the “best fit” disk model.
1.3.1 Dullemond Model
Motivated by the need to have a physical mechanism that explains the NIR bump in
Herbig Ae stars, Natta et al. [2001] and Dullemond et al. [2001] proposed a passive
disk model which has become the currently favored theoretical model. In this model,
the structure of the circumstellar disk is set by a balance between stellar gravity and
the pressure gradient created from the heating of disk material by stellar photons.
The model divides the disk into 3 regions (see Fig 1.10) -
• Inner Rim Sufficiently close to the star (distance depends on stellar lumi-
nosity and dust properties), dust in the circumstellar disk reaches sublimation
temperatures and evaporates inside of which the disk is optically thin. The
10

Figure 1.8 Schematic for passive (top) and active (bottom) disk models. (Figurefrom Monnier et al. [2005])
truncated dust disk is frontally illuminated by the star and forms a ‘rim’. The
rim puffs up, traps a significant fraction of stellar photons and re-radiates pre-
dominantly in the NIR. For an A0 star and a dust sublimation temperature of
∼ 1500K, the radius of the inner rim is ∼ 0.35 AU.
The major success of this model has been the correct prediction of the NIR size-
luminosity diagram for YSOs (Monnier & Millan-Gabet 2002, Millan-Gabet
et al. 2007). According to the model, NIR size ∝ L0.5. Fig 1.11 shows a
comparison between theoretical predication and observations.
• Shadow Region The inner rim casts a geometric shadow on the region be-
hind it, preventing it from receiving direct star light. The disk in the shadow
is heated by scattered photons from the rim edge and through radial heat
diffusion. The size of the shadow can be several AU depending on the rim
11

Figure 1.9 K-Band visibilty data on AB Aur (Millan-Gabet et al. [1999]). Thedashed-dotted line shows the predicted visibility for a “classical” accretion diskmodel. The long-dashed line is the visibility for a dust “rim” model. The dashedline represents a binary model and the solid line is a Gaussian disk.
geometry, the mass of dust in the outer disk and dust grain properties in the
outer disk. The shadow corresponds to the terrestrial planet forming region in
circumstellar disks.
• Flared Disk If sufficient dust is present in the outer disk, the disk eventually
emerges from the shadow and “flares”. The flared disk can be a few hundred
AU in size and emits radiation in the MIR and longer wavelengths.
Figure 1.10 The Dullemond (Dullemond et al. [2001]) passive disk model.
12
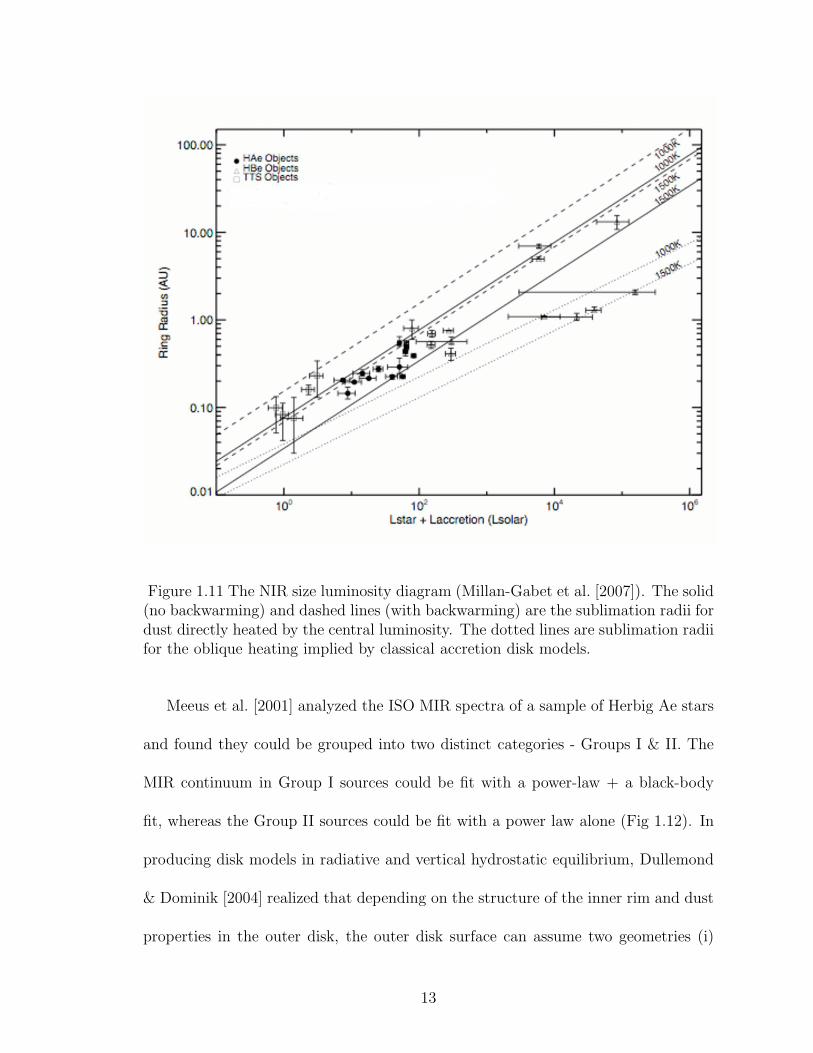
Figure 1.11 The NIR size luminosity diagram (Millan-Gabet et al. [2007]). The solid(no backwarming) and dashed lines (with backwarming) are the sublimation radii fordust directly heated by the central luminosity. The dotted lines are sublimation radiifor the oblique heating implied by classical accretion disk models.
Meeus et al. [2001] analyzed the ISO MIR spectra of a sample of Herbig Ae stars
and found they could be grouped into two distinct categories - Groups I & II. The
MIR continuum in Group I sources could be fit with a power-law + a black-body
fit, whereas the Group II sources could be fit with a power law alone (Fig 1.12). In
producing disk models in radiative and vertical hydrostatic equilibrium, Dullemond
& Dominik [2004] realized that depending on the structure of the inner rim and dust
properties in the outer disk, the outer disk surface can assume two geometries (i)
13
Flared disk, where the disk emerges from the shadow of the inner rim (Fig 1.13) (ii)
Self-shadowed disk, where the disk fails to emerge out of the rim shadow (Fig 1.14).
The flared disk SED matches the SED of Group I sources and the self-shadowed disk
SED matches the SED of Group II sources. This physical connection has gotten
support from recent modeling work on VV Ser by Pontoppidan et al. [2007]. The
size and shape of the dark wedge in VV Ser PAH emission (Fig 1.15) was used to
infer the existence of a shadowed disk in VV Ser.
In summary, the DDN01 model has been partly successful in explaining the SED
of Herbig Ae stars (from UV to millimeter wavelenghts) and their NIR interfero-
metric sizes. The model has sufficient structure and complexity to provide physical
interpretation to the Meeus Groups I and II classification of YSOs. UX Orionis phe-
nomena (Dullemond et al. [2003b]) have also been interpreted in terms of the DDN01
model.
1.4 The power of Interferometry in exploring HAe/Be disk
structure
Circumstellar disks around YSOs emit from the NIR to mm wavelengths (Fig 1.7).
To first order, the emission traces the disk temperature structure, with NIR emission
arising in the hot inner region at fractions of an AU from the star and mm emission
arising from the cold outer disk at length scales of several hundred AU. At a distance
of 100 parsecs (typical of the nearest star forming regions) the emission scales cor-
respond to angular resolutions between ∼2 milli-arcseconds (for NIR emission) and
∼2 arcseconds (for mm emission). Long-baseline interferometry is the ideal tool for
14
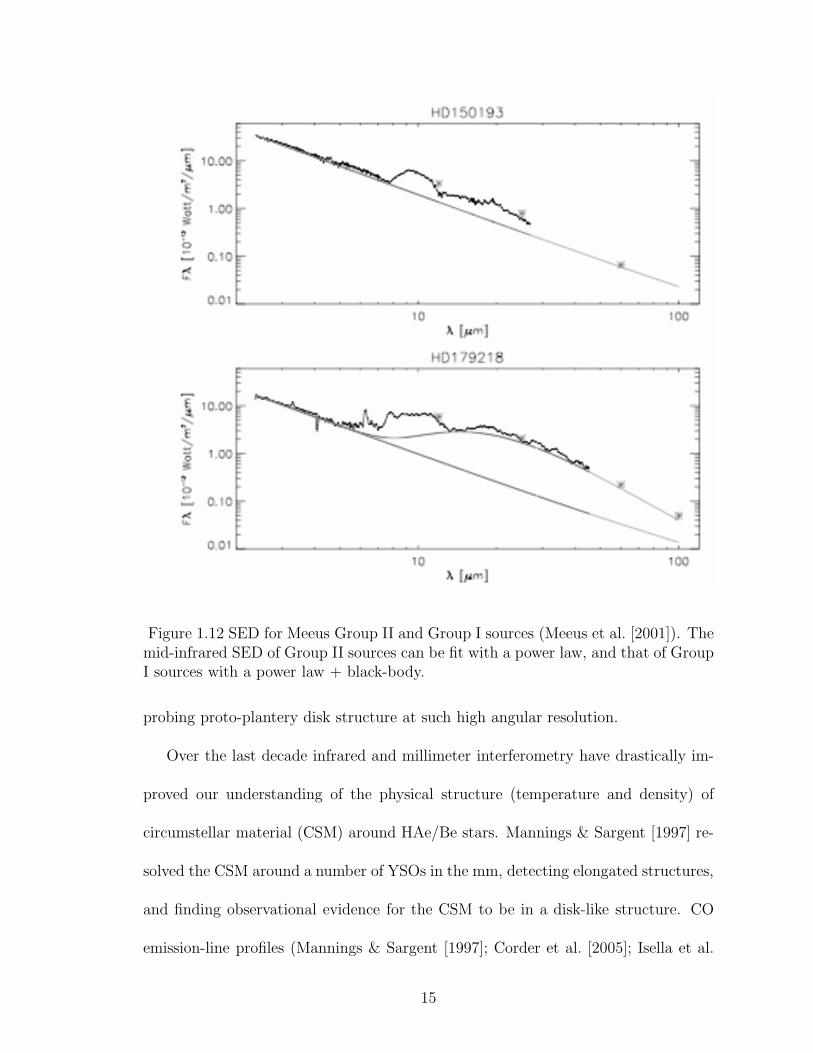
Figure 1.12 SED for Meeus Group II and Group I sources (Meeus et al. [2001]). Themid-infrared SED of Group II sources can be fit with a power law, and that of GroupI sources with a power law + black-body.
probing proto-plantery disk structure at such high angular resolution.
Over the last decade infrared and millimeter interferometry have drastically im-
proved our understanding of the physical structure (temperature and density) of
circumstellar material (CSM) around HAe/Be stars. Mannings & Sargent [1997] re-
solved the CSM around a number of YSOs in the mm, detecting elongated structures,
and finding observational evidence for the CSM to be in a disk-like structure. CO
emission-line profiles (Mannings & Sargent [1997]; Corder et al. [2005]; Isella et al.
15

Figure 1.13 Flared Disk (Dullemond et al. [2003b]). The Group I mid-infrared SEDhas been interpreted in terms of the flared disk model.
[2007]) display signatures of Keplerian rotation around the central star, further evi-
dence for CSM disk morphology. Arcs and spiral arms (e.g. Corder et al. [2005]; Lin
et al. [2006]) have been observed in a number of disks providing evidence for strong
dynamical effects in YSO systems. Millimeter-wave interferometry also provided the
first measurements on the extent of the CSM constraining it to be several hundred
AU.
MIR emission probes the planet formation region in circumstellar disks (Chiang
& Goldreich [1997]; Dullemond et al. [2001]) with the emission arising from warm
dust (T >150K). The MIR sizes of YSO disks were first obtained with VLTI/MIDI
for a sample of seven HAe/Be stars by Leinert et al. [2004]. The sizes were found to
correlate with the source IRAS colors, and this correlation was interpreted in terms
of Group I and Group II sources, with flared disks being larger and redder than
16

Figure 1.14 Self-shadowed Disk (Dullemond et al. [2003b]). The Group II mid-infrared SED has been interpreted in terms in terms of the shadowed disk model.
shadowed disks (see Figs 1.13 and 1.14). van Boekel et al. [2004] used spectrally
resolved MIR interferometry to show radial gradients in dust crystallinity, particle
size and chemical composition in circumstellar disks (Fig 1.16). The MIDI observa-
tions revealed that that the inner 1-2 AU is much more crystalline than the outer
2-20AU, which in turn is significantly more crystalline than the inter-stellar medium
(see Millan-Gabet et al. [2007] for details).
Thermal NIR emission probes hot regions (typically inner AU) of the disk with
temperatures greater than 700K. Early NIR interferometry results (Millan-Gabet
et al. [1999, 2001]; Tuthill et al. [2001]; Monnier & Millan-Gabet [2002]) changed
our picture of the gas dust transition region (Figs 1.8 and 1.9) and highlighted the
importance of passive stellar heating in establishing disk structure. Furthermore,
17

Figure 1.15 VVSer imaged in PAH emission (Pontoppidan et al. [2007]). The shapeand size of the dark wedge has been used to infer the existence of a disk shadow inVV Ser.
Monnier et al. [2006] showed that the first generation vertical rim model (Fig 1.10)
lacked the necessary physics to explain closure phase observations of YSOs with the
IOTA interferometer. More recently, Tatulli et al. [2007] and Kraus et al. [2008b]
(using VLTI/Amber) demonstrated that Brγ emission lines attributed to the magne-
tospheric in-fall of gas onto the central star (Muzerolle et al. [1998]), can sometimes
arise in the disk or in a wind (Fig 1.17). This result is motivation for further devel-
oping spatially resolved probes of stellar accretion.
18
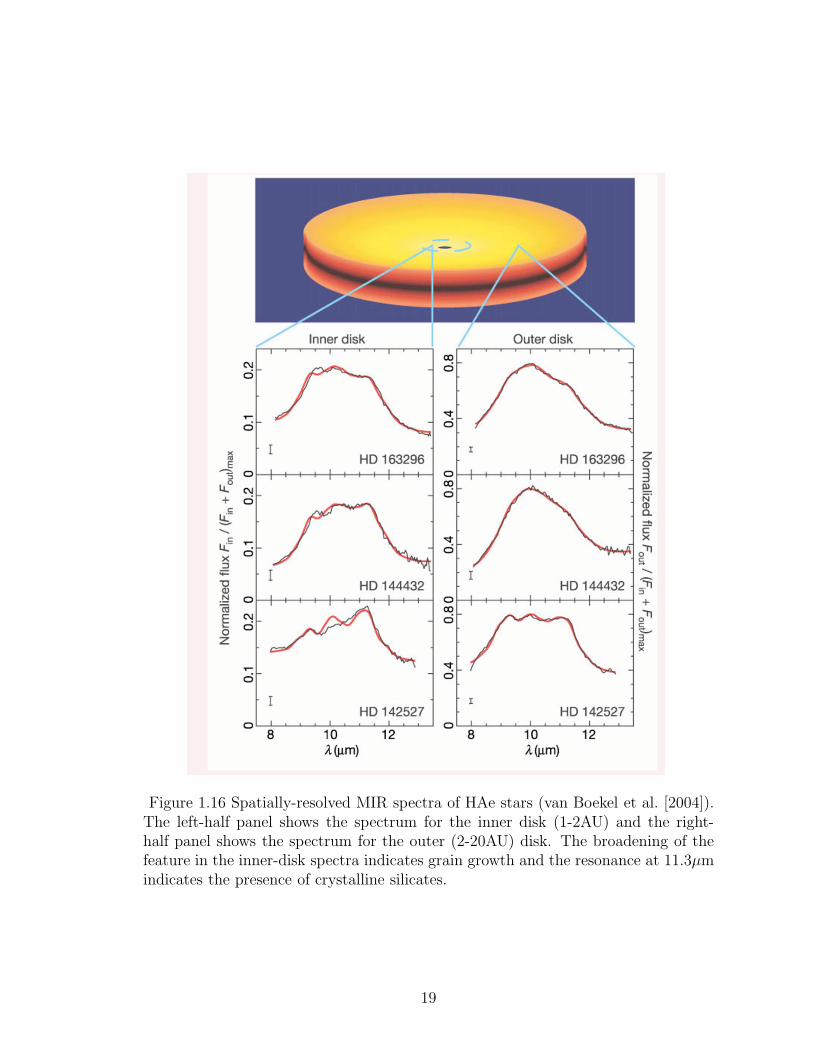
Figure 1.16 Spatially-resolved MIR spectra of HAe stars (van Boekel et al. [2004]).The left-half panel shows the spectrum for the inner disk (1-2AU) and the right-half panel shows the spectrum for the outer (2-20AU) disk. The broadening of thefeature in the inner-disk spectra indicates grain growth and the resonance at 11.3µmindicates the presence of crystalline silicates.
19

Figure 1.17 Brγ emission in Herbig Ae star HD104237 (Tatulli et al. [2007]). Theempty squares are observed visibility points and solid curves are predictions for simplegeometric models. The continuum emission arises from the central star and the dustrim shown as a grey scale ring. The Brγ emission regions are shown as a grid surface.In the upper panel, Brγ emission arises in a magnetospheric accretion column closeto the star inside the co-rotation radius. The Brγ emission arises between the co-rotation radius and the dust rim in the middle panel. In the bottom panel, theemission arises close to the dust rim.
20

1.5 Overview of the Thesis
My thesis focuses on obtaining a detailed understanding of the structure of the inner
tens of AU in circumstellar disks around HAe stars using a combination of NIR inter-
ferometry from CHARA, mid-infrared (MIR) interferometry from the Keck Segment
Tilting Experiment, and state-of-the-art radiative transfer models. Figure 1.18 is an
illustration of the models used in interpreting the data.
In Chapter 2, we describe self-consistent Monte Carlo radiative transfer models of
the gas-dust transition (the evaporation front) in circumstellar disks. Observational
and theoretical developments over the last couple of years have shown the the evap-
oration front is significantly more complicated than the vertical wall (Figs 1.10 and
1.18) assumed in Dullemond et al. [2001]. The front shape depends sensitively on
dust properties and can be used as a probe of dust physics operating in circumstellar
disks.
Chapter 3 gives a brief description of the CHARA instrument and presents a
comparison between theoretical inner rim models and CHARA NIR interferometry
on MWC275 and AB Aur. We report the presence of additional NIR opacity inside
the “conventional” dust destruction radius (see Fig 1.18, bottom panel).
Chapter 4 deals with the thermal MIR region of circumstellar disks. The effects of
inner-rim structure on the MIR disk in YSOs are investigated. We describe the Keck
Segment Tilting Experiment and attempt at generating models that explain trends
between stellar properties, disk flaring parameters, and the observed disk properties
in the MIR. In this chapter, we also study the structure of the circumbinary disk
around V892Tau.
21
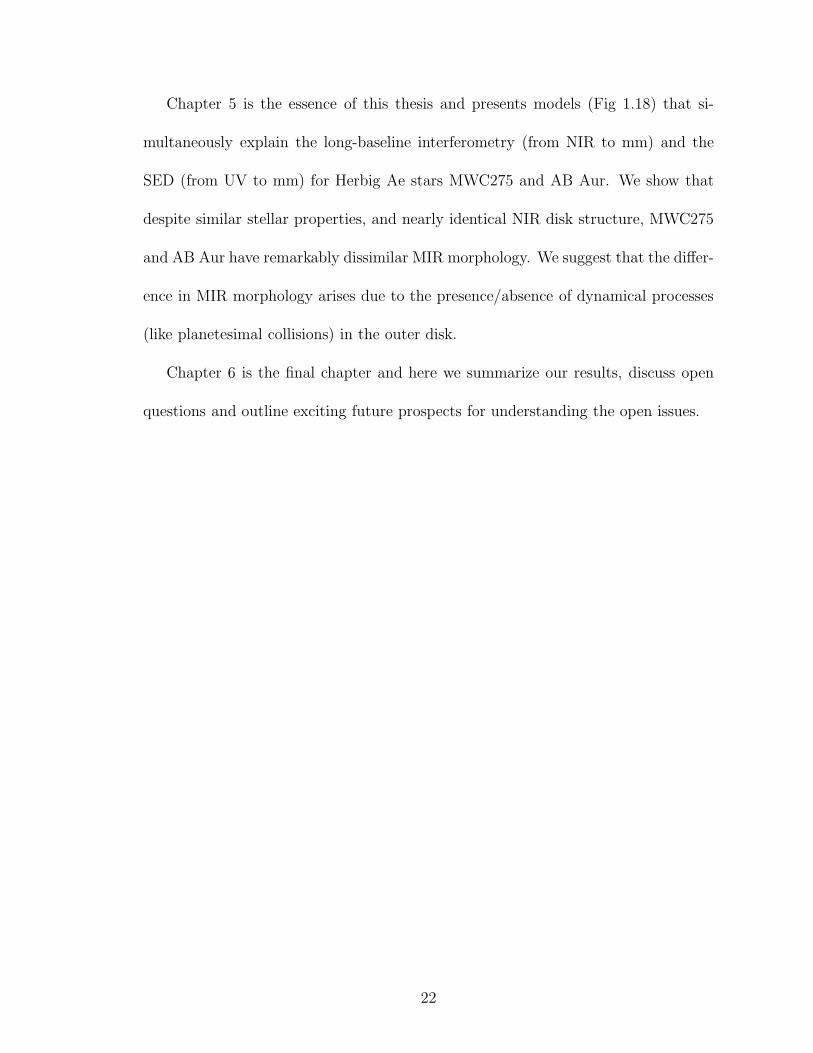
Chapter 5 is the essence of this thesis and presents models (Fig 1.18) that si-
multaneously explain the long-baseline interferometry (from NIR to mm) and the
SED (from UV to mm) for Herbig Ae stars MWC275 and AB Aur. We show that
despite similar stellar properties, and nearly identical NIR disk structure, MWC275
and AB Aur have remarkably dissimilar MIR morphology. We suggest that the differ-
ence in MIR morphology arises due to the presence/absence of dynamical processes
(like planetesimal collisions) in the outer disk.
Chapter 6 is the final chapter and here we summarize our results, discuss open
questions and outline exciting future prospects for understanding the open issues.
22
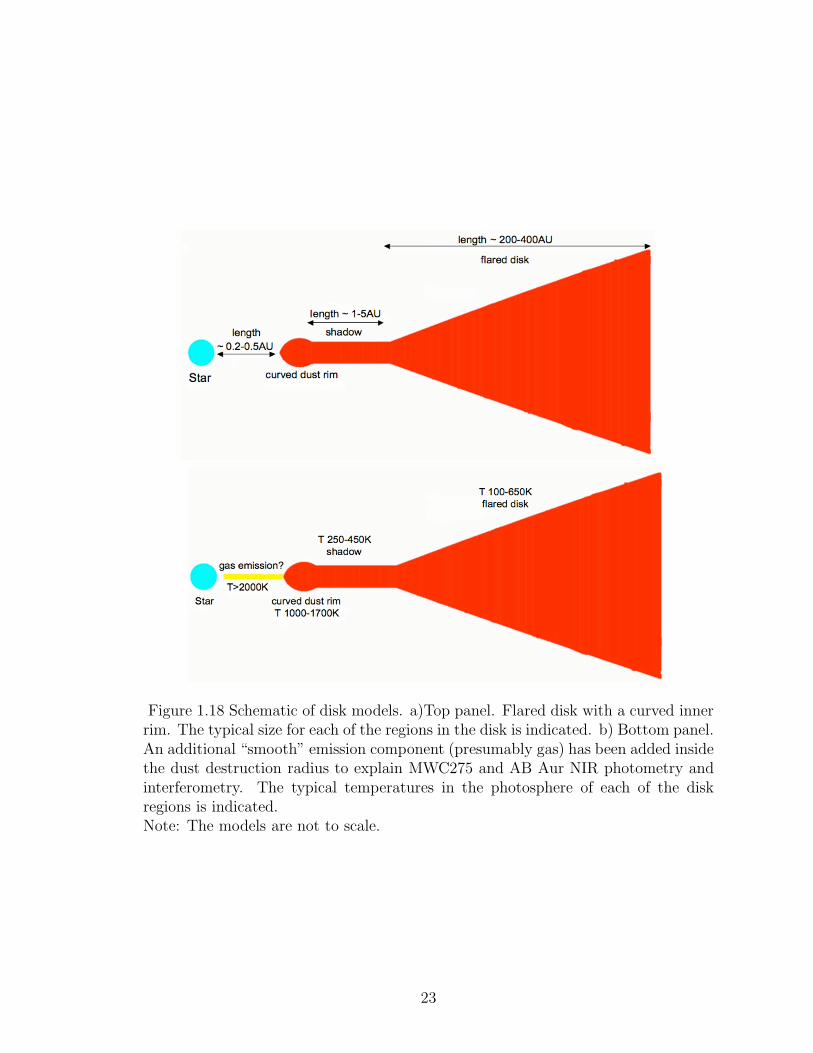
Figure 1.18 Schematic of disk models. a)Top panel. Flared disk with a curved innerrim. The typical size for each of the regions in the disk is indicated. b) Bottom panel.An additional “smooth” emission component (presumably gas) has been added insidethe dust destruction radius to explain MWC275 and AB Aur NIR photometry andinterferometry. The typical temperatures in the photosphere of each of the diskregions is indicated.Note: The models are not to scale.
23

Chapter 2
Self-consistent Models for the Gas-Dust
Transition Region
Abstract: Dust-grain growth and settling are the first steps towards planet forma-
tion. An understanding of dust physics is therefore integral to a complete theory of
the planet formation process. In this chapter, we explore the possibility of using the
dust evaporation front in YSO disks (‘the inner rim’) as a probe of the dust physics
operating in circumstellar disks. The geometry of the rim depends sensitively on the
composition and spatial distribution of dust. Using radiative transfer and hydrostatic
equilibrium calculations we demonstrate that dust growth and settling can curve the
evaporation front dramatically (from a cylindrical radius of about 0.5 AU in the disk
mid-plane to 1.2 AU in the disk upper layers for an A0 star). We compute synthetic
images and interferometric visibilities for our representative rim models.
2.1 Introduction
Advances in long-baseline near-infrared (NIR) interferometry have made it possible
to study the inner regions of circumstellar disks at sub-AU scales. Early results
(Millan-Gabet et al. [1999, 2001]; Tuthill et al. [2001]; Monnier & Millan-Gabet
[2002]) have shown that the dust disk gets truncated at a finite radius (determined
by the luminosity of the central star and dust sublimation temperature) within which
24

the temperature is too high for dust to survive. The truncated disk forms a ‘rim’
(Natta et al. [2001]; Dullemond et al. [2001, hereafter DDN01]) that subtends a
significant solid-angle around the star and intercepts stellar photons, re-radiating
predominantly in the NIR. This rim naturally explains the NIR excess observed in
Herbig Ae systems.
Despite its success in accounting for the near-IR excess, the vertical rim model
introduced in DDN01 has had a few weaknesses from the very outset. The flux re-
ceived from a vertical rim is highly viewing-angle dependent (see Fig 2.1), since the
projected line-of-sight area of the rim changes rapidly with inclination angle. This
implies that the near-IR spectral energy distributions (SEDs) of Herbig Ae/Be stars
should be a strong function of inclination angle, but observations show that most
Herbig Ae stars have similar near-IR excesses, independent of their inferred incli-
nation angles (Natta et al. [2001]; Dominik et al. [2003]). Furthermore, the surface
brightness distribution of a vertical rim will become highly asymmetric at inclina-
tion angles different from face-on (Fig 2.1). This asymmetry should be detectable
by interferometers in the form of a closure-phase signal (Monnier [2000, and refer-
ences therein]), but recent studies (Monnier et al. [2006]) do not detect significant
closure-phase signals indicating that the geometry of the inner rim is not a vertical
wall.
It appears that a mechanism that curves the inner rim is needed. Isella & Natta
[2005] (hereafter IN05) studied the impact of density-dependent dust sublimation
temperatures on the structure of the rim. Close to the mid-plane, where the densities
are high, the dust sublimation temperatures are also high (Pollack et al. [1994]),
25

Figure 2.1 Synthetic images for rim models showing effects of inclination. The leftand the center panel are curved rim models from Isella & Natta [2005]. The rightpanel shows the vertical rim model from Dullemond et al. [2001]. (Diagram fromIsella & Natta [2005])
while as the densities begin to fall rapidly in the vertical direction the sublimation
temperatures drop. The IN05 calculations show that this causes the inner rim to
curve away (Fig 2.1) from the surface of the star. Isella et al. [2006] found that a
curved-rim model provides a substantially better fit to the visibilities and near-IR
SEDs of a few Herbig Ae systems.
In this chapter we look at another mechanism that could curve the rim on larger
scales than the ones produced by a density-dependent dust sublimation model—
namely, dust growth and settling. In the absence of strong turbulence, dust grains
26

will settle towards the disk mid-plane with large grains settling lower and having a
smaller scale height than small grains. Dust grains will also grow rapidly in the mid-
plane due to the much higher densities (Dubrulle et al. [1995]; Dullemond & Dominik
[2004]; Tanaka et al. [2005]). The opacity in the mid-plane is thus dominated by large
grains whereas small grains dominate the opacity higher in the disk photosphere. This
transition in the nature of the opacity source along with dust sublimation curves
the inner rim as described in Section 4. Near-IR interferometers with baselines
several hundred meters long (e.g. CHARA, VLTI) can distinguish between the model
presented in this chapter and the IN05 model based on their visibility curves (see
§2.4.3), shedding light on dust physics operating at sub-AU scales.
We have computed the structure of the dust evaporation front in a self-consistent
manner for the first time in a 2-D geometry (photon scattering has not been included;
for effects of scattering on disk structure and SED see Dullemond & Natta [2003])
using the radiative transfer code torus (Harries [2000]). In the following section we
describe the radiative transfer code, while in section 3 we perform a consistency check
by comparing the results for a torus generated density-dependent dust sublimation
model with IN05 results. In Section 4 we present results for the dust segregation
model, followed by a summary of the results and conclusions in Section 5.
2.2 The Monte Carlo Radiative Transfer Code - TORUS
2.2.1 Description of grid and disk structure calculations
The calculations in this chapter were performed using the torus Monte-Carlo radiative-
transfer code (Harries [2000]; Harries et al. [2004]; Kurosawa et al. [2004]). Radiative
27

equilibrium is computed using Lucy’s (Lucy [1999]) algorithm on a two-dimensional,
cylindrical-cartesian adaptive-mesh grid. Storing the opacity and temperature infor-
mation on an adaptive mesh has particular advantages for the problem considered
here, since the accurate determination of temperatures and subsequent SEDs re-
quires an adequate resolution of the effective disk photosphere, whose position is
changing spatially both as the dust is sublimated and as the vertical structure of the
disk changes as it is iterated towards hydrostatic equilibrium. Using adaptive-mesh
refinement (AMR) we are able to subdivide cells near the disk photosphere as the
calculation proceeds, ensuring the resolution is maintained at each step.
The initial density structure for the disk calculations is based on the canonical
description of the α-disk developed by Shakura & Sunyaev [1973], viz
ρ(r, z) = ρ0
(
r
r0
)−α
exp
[
−1
2
z2
h(r)2
]
(2.1)
where r is the radial distance in the mid-plane, r0 is some characteristic radius, z is
the distance perpendicular to the mid-plane, and h(r) is the scale height, given by
h(r) = h0
(
r
r0
)β
(2.2)
with parameters of α = 2.625 and β = 1.125, giving a radial density dependence
of the surface density of Σ(r) ∝ r−1.5. The AMR mesh is divided such that the
cells are logarithmically spaced in the radial direction and that there are at least
7 cells in the vertical direction per disk scale height h(r). A sweep of the grid is
then made to split cells further around the τ5500 = 1 (τ5500 is the optical depth
calculated at 5500 A) surface using the following algorithm: for each pair of adjacent
AMR cells the individual optical depths across the cells are calculated (τ1 and τ2
28

say, with τ1 referring to the more optically thick of the two). The more optically
thick cell is subdivided providing that τ2 < τmin and τ1 > τmax, where τmin and τmax
are parameters (typically 0.1 and 0.5 respectively). Should any cell in the grid be
subdivided, the sweep is repeated until no new cells are added to the mesh.
Once the temperature (we assume that the disk is in local thermodynamic equilib-
rium and gas and dust are thermally coupled, Kamp & Dullemond [2004]) and dust
sublimation (see next section) structures have converged using the Lucy algorithm,
the vertical disk structure is modified via the equation of hydrostatic equilibrium
following a similar algorithm to that detailed by Walker et al. [2004]. Briefly, and
assuming that the disk mass is negligible compared to the central star, the equation
of hydrostatic equilibrium is
dP
dz= −ρgz (2.3)
where P is the pressure, ρ is the density and gz is the vertical component of the
stellar gravity. Adopting an ideal gas equation of state P = ρkT/µmH (with µ = 2.3
for a standard molecular hydrogen-helium mixture) we get
dρ
dz
1
ρ= −
1
T
(
gzµmH
k+
dT
dz
)
. (2.4)
The above equation can be solved for ρ(z) numerically on the AMR mesh since the
vertical temperature structure is known from the radiative-equilibrium calculation.
The vertical density structure is then renormalized to conserve the radial surface
density profile detailed above. A self-consistent calculation for dust sublimation
(see 2.2.2) and disk temperature followed by a hydrostatic equilibrium calculation
is repeated until the disk density structure has converged. Convergence is typically
29

achieved in four iterations. Images and SEDs are subsequently calculated using a
separate Monte Carlo algorithm based on the dust emissivities and opacities (Harries
[2000]).
2.2.2 Implementation of Dust Sublimation.
In the models discussed here the shape of the inner rim is controlled by dust subli-
mation. Typical mid-plane densities in the dust sublimation region are of the order
of 10−8 − 10−10 g cm−3 in Herbig disks. In the mid-plane, an optical depth of unity
for visible light photons (measured radially inward into the disk from the rim edge)
corresponds to a length scale of ∼ 10−5 − 10−7 AU. Therefore if we started sublima-
tion runs with a grid that had the full dust opacity present, convergence towards an
equilibrium rim shape would be extremely slow. This is very similar to the prob-
lem encountered in photoionization codes, where neutral hydrogen opacity to ionizing
photons is so large that starting from a neutral grid would take an impractical amount
of CPU time for the Stromgren sphere to propagate outwards (Wood et al. [2004]).
The solution that we adopt is also analogous to the one used in photoionization
codes (Wood et al. [2004]). The dust content is first reduced to a very low value
in the computational grid for the circumstellar disk, to make each of the grid cells
optically thin. Stellar photons then propagate through the disk and the temperature
of grid cells is determined. Dust is added to cells that are cooler than the sublimation
temperature in small steps of τ . The step size is a τ of 10−3 (computed at 5500A) for
the first five dust growth steps. The step size is then increased logarithmically, first to
10−2, then to 10−1 and so on until the appropriate gas to dust ratio is reached in each
30

grid cell. The grid cell temperatures are recomputed after every dust growth step
and the process is repeated until the shape of the dust sublimation region converges.
1.0 1.2 1.4 1.6 1.8 2.0
-0.3-0.2
-0.1
-0.0
0.1
0.2
(Optical depth to stellar photons)0.05
3.98E-01 4.39E-01 4.80E-01 5.21E-01 5.62E-01
Hei
ght f
rom
mid
-pla
ne[A
.U.]
(a)
1.0 1.2 1.4 1.6 1.8 2.0
-0.3-0.2
-0.1
-0.0
0.1
0.2
(Optical depth to stellar photons)0.05
6.31E-01 6.88E-01 7.46E-01 8.03E-01 8.61E-01
(b)
0.01
0.03
1.0 1.2 1.4 1.6 1.8 2.0
-0.3-0.2
-0.1
-0.0
0.1
0.2
6.31E-01 7.44E-01 8.57E-01 9.71E-01 1.08E+00
(c)
0.1 1.0
3.0
1.0 1.2 1.4 1.6 1.8 2.0
-0.3-0.2
-0.1
-0.0
0.1
0.2
6.31E-01 8.14E-01 9.98E-01 1.18E+00 1.36E+00
Distance (along mid-plane) from star[A.U.]
(d)
1.0100.0
Figure 2.2 Rim-structure Computation. a) Cross section of an inner rim from whichdust has been stripped. Photons are propagated through this rim to determinethe ‘optically thin’ grid-cell temperatures. The color scheme shows integrated τ ,measured along lines perpendicular to the disk mid-plane. b) Inner rim after thefirst dust growth step. Dust is grown in cells that are cooler than the sublimationtemperature. The contours connect points with equal integrated tau. c) and d)depict stages further along in the dust growth scheme. The geometry of the rim is“sublimation converged” in (d) (see 2.2.2). A hydrostatic equilibrium calculation (see2.2.1) is then performed. The dust growth and hydrostatic equilibrium calculationsare repeated until convergence is reached for the structure. The rim shapes depictedabove are not the final converged solution. See Figure 2.3 for the final rim shapes.
Figure 2.2 illustrates the dust-growth process in our computational scheme. The
color scheme shows integrated optical depth, measured along lines perpendicular to
the disk mid-plane. Panel-(a) is a grid for which the optical depth across each cell is
10−8. Panel-(b) is a cross section of the grid after the first dust growth step where
τ across each cell is now 10−3. The cells have a τ of 10−1 across them in panel-(c).
31

The optical depth across each of the cells that lie away from the rim surface is 10
in panel-(d), whereas cells at the outer surface of the rim have been smoothed to
resolve the τ = 1 surface. The geometry of the rim can considered to be ‘sublimation
converged’ in panel-(d). Any further addition of dust does not significantly change
the distance of the τ = 1 rim surface from the star. An appropriate amount of dust is
put into each of the cells to reach a predetermined gas to dust ratio in the final dust
growth steps. A hydrostatic equilibrium calculation as described in §2.2.1 is then
performed. The dust growth and hydrostatic equilibrium calculations are repeated
until convergence for the entire disk structure is reached (typically 4 iterations).
In the next section we describe checks that ensure that this process gives accurate
results.
2.3 Code testing against IN05 results
IN05 calculated inner rim models with astronomical silicate dust (Weingartner &
Draine [2001]), where the shape of the rim is set by the fact that the evaporation
temperature of dust depends on gas density (Pollack et al. [1994]). In this model,
silicate grains sublimate at a higher temperature compared to other grains and hence
fix the rim location. For silicate dust, the evaporation temperature Tevp can be
parameterized as
Tevp = G
[
ρgas(r, z)
1g cm−3
]γ
(2.5)
where G = 2000K, γ = 1.95×10⁻² and ρgas is the density of gas in g cm−3 (see IN05
eq. [16]). IN05 showed that this dependence of Tevp on gas density curves the inner
rim.
32
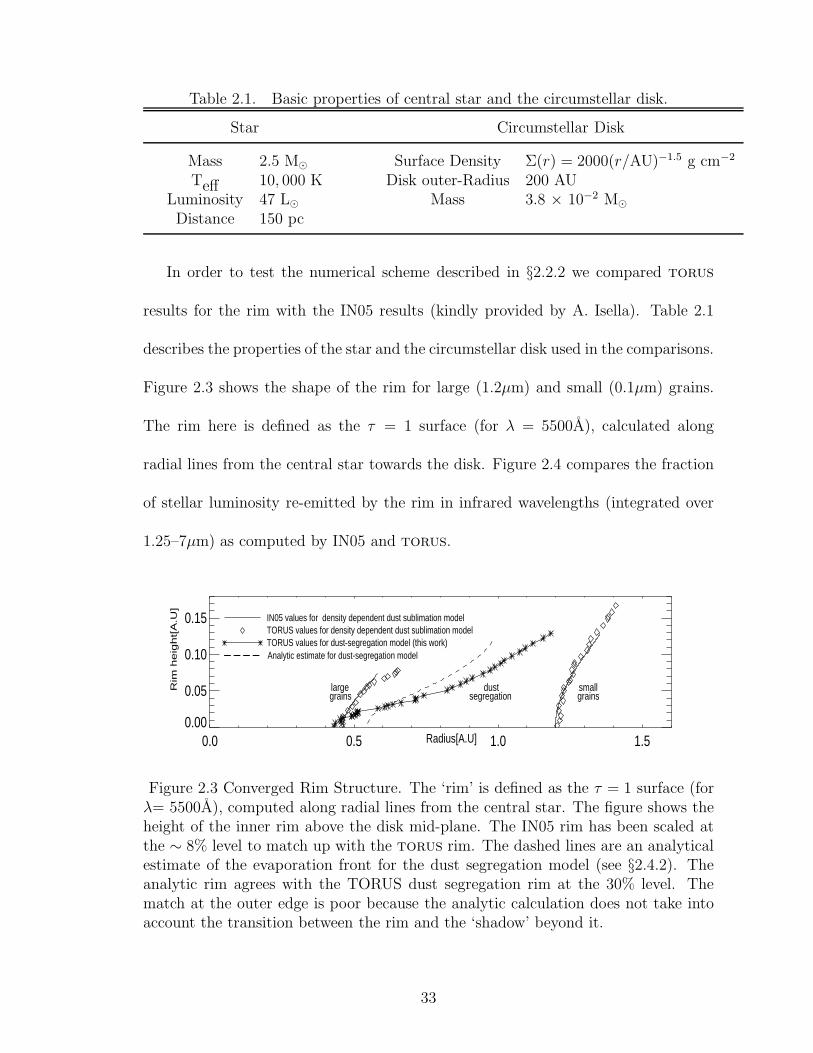
Table 2.1. Basic properties of central star and the circumstellar disk.
Star Circumstellar Disk
Mass 2.5 M⊙ Surface Density Σ(r) = 2000(r/AU)−1.5 g cm−2
Teff 10, 000 K Disk outer-Radius 200 AULuminosity 47 L⊙ Mass 3.8 × 10⁻² M⊙
Distance 150 pc
In order to test the numerical scheme described in §2.2.2 we compared torus
results for the rim with the IN05 results (kindly provided by A. Isella). Table 2.1
describes the properties of the star and the circumstellar disk used in the comparisons.
Figure 2.3 shows the shape of the rim for large (1.2µm) and small (0.1µm) grains.
The rim here is defined as the τ = 1 surface (for λ = 5500A), calculated along
radial lines from the central star towards the disk. Figure 2.4 compares the fraction
of stellar luminosity re-emitted by the rim in infrared wavelengths (integrated over
1.25–7µm) as computed by IN05 and torus.
0.0 0.5 1.0 1.50.00
0.05
0.10
0.15
Radius[A.U]
Rim
heig
ht[A
.U]
largegrains
smallgrains
dustsegregation
IN05 values for density dependent dust sublimation modelTORUS values for density dependent dust sublimation modelTORUS values for dust-segregation model (this work)_ _ _ _Analytic estimate for dust-segregation model
Figure 2.3 Converged Rim Structure. The ‘rim’ is defined as the τ = 1 surface (forλ= 5500A), computed along radial lines from the central star. The figure shows theheight of the inner rim above the disk mid-plane. The IN05 rim has been scaled atthe ∼ 8% level to match up with the torus rim. The dashed lines are an analyticalestimate of the evaporation front for the dust segregation model (see §2.4.2). Theanalytic rim agrees with the TORUS dust segregation rim at the 30% level. Thematch at the outer edge is poor because the analytic calculation does not take intoaccount the transition between the rim and the ‘shadow’ beyond it.
33

Figures 2.3 and 2.4 show that that the torus results are consistent with the
IN05 calculations at better than 15% level, giving us confidence in our Monte Carlo
(MC) computations. We note that benchmark comparisons for MC codes, studying
radiative transfer in optically thick disks (Pascucci et al. [2004]), show a similar level
of agreement among the various MC codes.
0 20 40 60Inclination (deg)
0.00
0.05
0.10
0.15
0.20
L_N
ir/L*
1.2 micron grains
0.1 micron grains
IN05 valuesTORUS values
Figure 2.4 Integrated (between 1.25–7µm) NIR emission from the inner rim. Theemission is plotted as a function of inclination angle for small and large grains. Theemission has been normalized to the stellar luminosity.
2.4 Rim curvature due to grain growth/settling
2.4.1 Model Description
The rim in the IN05 model is curved because of a density-dependent dust-evaporation
temperature. In this section we describe an alternative model in which the dust
34

sublimation temperature is kept fixed at 1400K and rim curvature arises entirely
because of dust growth and settling.
Small grains are much less efficient at cooling than large grains. If only single-
sized grains are present, then at a given distance from the star, small grains will have
a higher temperature than large grains. Under the assumption of a good temperature
coupling between gas and dust (at densities characteristic of the rim region, this is
a good approximation even in the disk photosphere - Kamp & Dullemond [2004]),
a mixture of small and large grains will be hotter than the case where only large
grains are present. Combined with dust sublimation, this means that the location
and shape of the inner rim will change depending on the relative fraction of small
and large grains.
Observational (e.g. Rettig et al. [2006]) and theoretical work (Weidenschilling
& Cuzzi [1993]; Dullemond & Dominik [2004]; Tanaka et al. [2005]), and model fits
to data (D’Alessio et al. [2001, 2006]; Chiang et al. [2001]) have shown that dust
properties in circumstellar disks evolve with time. Small grains tend to coagulate
into larger grains and settle towards the disk mid-plane, with the evolution of dust
grain sizes occurring most rapidly in the disk mid-plane where the densities are
high. In the absence of strong turbulence (the nature and strength of turbulence
in circumstellar disks is not well understood), large grains will have a smaller scale-
height than small grains. Thus grain growth and settling provide a natural means
for changing the fraction of large and small grains as a function of height (‘dust
segregation’) from the disk mid-plane. This will curve the rim as described in the
previous paragraph.
35
As an illustration, we look at a model (henceforth ‘dust segregation model’) with
silicate dust (Weingartner & Draine [2001]). In order to simulate dust settling we fix
the large (1.2µm) grain scale height to be 60% of the gas scale height. We do not
settle the small grains (0.1µm) and their scale height is fixed to be the same as the
gas scale height. As grains grow, the net mass of small grains decreases, while the
net mass of large grains increases: we fix the mass of large grains to be ∼ 9 times
the mass of small grains. All the the dust mass resides in the 1.2 & 0.1 µm grain
components and total mass of dust in the disk is chosen to be 1/100th of the total gas
mass. The rim gets curved over a wide range of parameter choices. The curvature
can be made stronger by increasing the relative fraction of small grains.
The above description leads to the following expressions for dust density:
ρ1.2 = 1.5 × 10⁻²ρo gas exp
[
−1
2
z2
(0.6h)2
]
(2.6)
ρ0.1 = 10−3ρo gas exp
[
−1
2
z2
h2
]
(2.7)
where ρ1.2 is the density of 1.2µm grains, ρ0.1 is the density of 0.1µm grains, ρo gas is
the gas density in the mid-plane, z is distance perpendicular to the disk mid-plane
and h is the gas scale height. The star and disk parameters are chosen as in Table 2.1
(the parameters are the same as in the IN05 models of section 3).
2.4.2 Geometry of the Dust Segregation Rim
Rim Shape
Figure 2.3 shows the shape of the inner rim for the dust segregation model. The
curvature of the rim depends on the relative density fractions of large and small
36

grains and the width depends on the sizes of the two dust components. A major
finding here is that the dust segregation model can curve the rim on much larger
scales than a density-dependent dust sublimation temperature (IN05) model. The
τ = 1 surface is nearly vertical at the inner edge of the dust segregation model
because of the fixed, density-independent dust sublimation temperature.
0 1 2 3 4 5Number of gas scale heights
0.0
0.1
0.2
0.3
0.4
0.5
0.6ep
silo
n
0 1 2 3 4 5Number of gas scale heights
0.0
0.2
0.4
0.6
0.8
1.0
1.2
Effe
ctiv
e du
st s
ize
(mic
rons
)
Figure 2.5 Dust Planck-mean Opacities. a) The ratio of Planck mean opacities fordust at the sublimation temperature and at the stellar photospheric temperature forthe dust segregation model. b) Effective dust size plotted against the number of gasscale heights (see 2.4.1).
Analytic Estimate for Rim Shape
The most important dust parameter that determines the rim shape is ǫ(z), defined as
the ratio of Planck mean opacities at the dust sublimation temperature and the stellar
37
effective temperature (IN05). Using equations (6) and (7) and values of Planck mean
opacities for 0.1µm and 1.2µm grains, ǫ (see Appendix for a more general expression)
for the dust segregation model is given by
ǫ (z) =
0.42 + 0.015 exp(
0.89z2
h2
)
0.76 + 0.181 exp(
0.89z2
h2
)
(2.8)
Figure 2.5a shows ǫ as a function of mid-plane height. Corresponding to this ǫ, an
effective dust size which has the same ǫ as the dust mixture, is plotted in Figure 2.5b.
A crude estimate for the rim shape in the dust segregation model can be obtained
analytically. The dust destruction radius Revp (see Calvet et al. [1991]; Isella et al.
[2006]) is
Revp [AU] = 0.034 [AU]
(
1500K
Tevp
)2 [(L∗
L⊙
)(
B +1
ǫ(z)
)]1/2
, (2.9)
Tevp is the dust evaporation temperature, L∗ is luminosity of the star in solar units,
and B is a dimensionless diffuse heating term. B characterizes the optical thickness
of the rim to its own thermal emission.
The gas scale height h at Revp is estimated to be (see eqs. (7) and (8) from Chiang
& Goldreich [1997])
h [AU] = Revp [AU][(
Tgas
4 × 10⁷K
)(
M⊙
M∗
)(
Revp
4.64 × 10⁻³ AU
)]1/2
(2.10)
where Tgas is the temperature of the bulk of the gas (assumed to be isothermal) and
M∗ is mass of the star in solar masses.
Combining equations (8), (9), and (10), substituting for stellar parameters from
Table 2.1 and setting Tevp = 1400K, the height of the evaporation front (see appendix
38

for a general result) as a function of distance from the star along the disk mid-plane
becomes
z [AU] = 1.06Revp [AU]
[
ln
(
5.87AU−2R2evp − 0.42B − 0.76
0.181 + 0.015B − 0.21AU−2R2evp
)]1/2
×
[(
Tgas
1 × 10⁸K
)(
Revp
4.64 × 10⁻³ AU
)]1/2
(2.11)
Figure 2.3 shows an analytic estimate for the rim shape (we assume a gas tem-
perature of 1000K and have set B = 2, Calvet et al. [1991]). The analytic rim agrees
with the torus dust segregation rim at the 30% level. The match at the inner edge
of the rim can be improved by tuning the diffuse heating parameter B, but the match
at the outer edge remains poor because the analytic estimate is not self-consistent
and does not take into account the transition between the rim and the ‘shadow’ (see
§2.4.3) region beyond it.
2.4.3 Observables
SED
Figure 2.6 shows the infrared emission from the inner rim and the outer flared-
disk component. There is significant emission over the stellar blackbody (denoted
by the continuous line) from 1.5µm onwards. The strength of the rim emission is
approximately determined by the temperatures along the rim at optical depths of
2/3 (calculated at the wavelength of emission). Figure 3 in the IN05 paper shows
that at a given optical depth, the small grain rim has a lower temperature than the
large grain rim. Because of this temperature difference, near-IR emission in the small
grain model gains strength at longer wavelengths compared to the large-grain and
dust-segregation models.
39

Images and Visibilities
In order to illustrate the differences between the IN05 and dust segregation models we
have computed synthetic images and visibilities for the different models. At 2.2µm,
all the emission comes from the rim and the central star. The panels in Figure 2.7
show 2.2µm rim surface brightness for two inclination angles. As discussed previously,
and is evident in Figure 2.7, the dust segregation rim is thicker than the IN05 rims.
The dust segregation models also distinguish themselves observationally from the
IN05 rims by their visibility curves. Figure 2.8 shows plots of 2.2µm visibilities
calculated along the disk major and minor axes. The visibilities at long baselines are
more oscillatory in the IN05 models. The IN05 rims are also more skewed at large
inclination angles which would give them a stronger closure phase signal (Monnier
et al. [2006]).
2.5 Discussion
In this chapter we introduced a new mechanism based on dust growth and settling
to curve the inner rim. As a consequence of growth and settling, opacity in the
rim mid-plane will be dominated by large grains whereas small grains dominate the
opacity higher up in the disk photosphere (grain settling in the inner rim with large
grains dominating the mid-plane opacity may be needed to explain near-IR SED and
interferometry data on VVSer, Pontoppidan et al. [2007]). Large grains can exist
much closer to the star than small grains since they cool more efficiently. A variation
in grain size with disk scale height in the inner rim causes the rim to curve as shown
in Figure 2.3. This curvature is on a much larger scale than the curvature produced
40

1 10lambda (microns)
0
5.0•10-12
1.0•10-11
1.5•10-11
2.0•10-11
lam
bda
F_l
ambd
a[W
m^-
2]
(a)
inclination = 0o IN05 small grain modelIN05 large grain model
dust segregation modelstellar black body
1 10lambda (microns)
0
5.0•10-12
1.0•10-11
1.5•10-11
2.0•10-11
lam
bda
F_l
ambd
a[W
m^-
2]
(b)
inclination = 60o IN05 small grain modelIN05 large grain model
dust segregation modelstellar black body
1 10lambda (microns)
0
5.0•10-12
1.0•10-11
1.5•10-11
2.0•10-11
lam
bda
F_l
ambd
a[W
m^-
2]
(c)
inclination = 0o IN05 small grain modelIN05 large grain model
dust segregation modelstellar black body
1 10lambda (microns)
0
5.0•10-12
1.0•10-11
1.5•10-11
2.0•10-11
lam
bda
F_l
ambd
a[W
m^-
2]
(d)
inclination = 60o IN05 small grain modelIN05 large grain model
dust segregation modelstellar black body
Figure 2.6 Rim infrared SED. a & b show near and mid-IR SEDs of the star + rimsystem for the IN05 and dust segregation models. c & d show SEDs of the star +rim + the disk. The star is placed at 150pc with stellar parameters described inTable 2.1. (a, c) system is face-on, (b, d) system is inclined 60o from face-on.
in the IN05 models. Figure 2.8 shows that the two models can be distinguished based
on their visibility curves.
In the dust segregation model that we studied in §2.4.1, the effects of dust growth
and sedimentation on rim structure were calculated assuming that the dust sublima-
tion temperature is independent of density. But in reality, both dust evolution and
the density dependence of dust evaporation temperatures (INO5 model) probably
simultaneously play a role in determining rim structure. We have shown that in the
absence of strong turbulence the rim shape is predominantly determined by grain
growth and settling. Adding a density dependence to dust sublimation temperatures
will lower the rim height (see Fig 2.3) and extend it further into the disk by just a
41

milliarcsec
-10
-5
0
5
10
-10
-5
0
5
10
IN05 Large Grain Model
i = 0o
mill
iarc
sec
-10 -5 0 5 10
-10
-5
0
5
10
i = 60o
0.08
0.11
0.15
0.18
0.21
0.24
(Sur
face
Brig
htne
ss (
erg/
s/cm
^2)
)0.1
Dust Segregation Model
i = 0o
-10 -5 0 5 10milliarcsec
i = 60o
IN05 Small Grain Model
i = 0o
0
-0.75
-1.5
0.75
1.5
-10 -5 0 5 10
i = 60o
0
-0.75
-1.5
0.75
1.5
A.U
.
Figure 2.7 Synthetic 2.2µm images for the different rim models discussed. The panelson the left and right are IN05 rims computed for 1.2µm (large grain) and 0.1µm (smallgrain) silicate dust. The center panels are images for the dust segregation model.The star is placed at 150pc with the stellar parameters described in Table 2.1. Thestar is unresolved at the image scale and is just one bright pixel at the center of theimages.
few tenths of an AU: a small perturbation compared to the effect of dust segregation
on rim shape.
Calculations in this chapter do not take into account effects of gas on dust rim
geometry. Gas can affect the structure and location of the rim through accretion
heating and by providing a source of opacity to stellar photons within the dust
destruction radius. Akeson et al. [2005b] have shown that gas accretion heating
might contribute significantly to the near-IR excess observed in some T Tauri stars
and play an important role in fixing the location of the dust destruction radius in
these systems. Eisner et al. [2006] argue that emission from gas within the inner rim is
42

needed to explain spectrally dispersed near-IR interferometry data on Herbig Ae/Be
systems. The effects of gas on dust rim structure and observed near-IR excesses in
YSOs is not well understood. Some theoretical efforts (see for e.g. Muzerolle et al.
[2004]) have been made in this direction, but further progress would require detailed
modeling of the relevant gas physics.
The dust rim in YSOs is a unique test-bed for theories of grain evolution. A
number of observational and modeling results (D’Alessio et al. [2001, 2006]; Chiang
et al. [2001]; Rettig et al. [2006]) have found evidence for dust growth and settling
in the outer regions (tens of AU scale) of YSO disks. In this work we show that
long baseline NIR interferometry provides an opportunity for similar studies on the
inner rim at sub-AU scale. Furthermore, if the gas within the inner rim were to
emit significantly in the near-IR (gas emission is not well constrained and results
from CHARA on AB Aur suggest that this is important), then the baselines of
CHARA(∼ 300m) are capable of partially resolving the hot gas emission, at-least
for a few Herbig systems. Combined with accretion line diagnostics (Muzerolle et al.
[2004]), near-IR interferometry could help pin down the structure of the inner gas
disk. In Chapter 3, we will compare SED and interferometry data with our model
predictions for the inner rim.
2.6 Chapter Summary and Conclusions
We have described a Monte Carlo approach to calculating the structure of the inner
rim in protoplanetary disks. The obvious advantage of this method over an ana-
lytic approach is that it allows for a self-consistent determination of the entire disk
43
structure. Any effects of spatially varying dust properties on disk structure (and the
resulting effects on SEDs and visibilities) can also be easily studied.
We have shown that dust growth and sedimentation may play a dominant role
in determining the structure of the inner rim. The difference in cooling properties
between grains of different sizes, combined with sublimation and a vertical gradient
in dust sizes in the disk, leads to inner rims that are extremely curved (over scales
> 0.7 AU in cylindrical radius for an A0 star, see Figure 2.3). Synthetic images
(Figures 2.7 & 4.1) and visibilities (Figures 2.8 & 4.2) for the rim models have been
computed, highlighting differences between various theoretical models.
The inner rim dominates near-IR emission from circumstellar disks. Studies in the
near-IR thus isolate the rim from the rest of the disk and are therefore a powerful tool
for characterizing rim properties. In the last decade or so, near-IR interferometers
(Millan-Gabet et al. [1999, 2001]; Eisner et al. [2003, 2004]; Akeson et al. [2005b,a])
have been used to determine the sizes of inner rims in a number of Herbig Ae/Be and
T Tauri stars. This has helped in establishing a tight correlation between the radii
of the rims and the luminosities of the central stars (Monnier & Millan-Gabet [2002];
Monnier et al. [2005]). The current generation of near-IR interferometers (CHARA,
VLTI) are capable of taking the next natural step—determining the geometry of the
inner rims. As shown in this chapter and IN05, the geometry of the inner rim is
tied to multiple dust properties such as grain evolution, grain sedimentation (which
depends on the strength of turbulence), and dust sublimation temperatures (IN05).
Once the inner rim shape is constrained, mid-IR interferometry (as seen in Figure 4.1,
both the rim and the flared disk region emit in the mid IR) can be used to assess
44

the geometry of the outer, flared-disk component.
To test the validity of inner-rim models and constrain dust properties in YSO
evaporation fronts, we compare theoretical models with sub-milli-arcsecond resolu-
tion NIR interferometry observations in Chapter 3.
45

0 50 100 150 200 250 300 350Baseline (m)
0.0
0.2
0.4
0.6
0.8
1.0V
isib
ility
inclination = 0o IN05 large grain modelIN05 small grain modeldust segregation model
0.0
0.2
0.4
0.6
0.8
1.0
Vis
ibili
ty a
long
min
or a
xis inclination = 60o IN05 large grain model
IN05 small grain modeldust segregation model
0 50 100 150 200 250 300 350Baseline(m)
0.0
0.2
0.4
0.6
0.8
1.0
Vis
ibili
ty a
long
maj
or a
xis inclination = 60o IN05 large grain model
IN05 small grain modeldust segregation model
Figure 2.8 2.2µm visibilities for the IN05 and dust segregation models. The panelon top shows the visibilities for a face-on disk and the bottom panel shows visibilitiescomputed along the major and minor axis for an inclined disk.
46

Chapter 3
Confronting Long-Baseline Near-Infrared
Interferometry
Abstract: Using the longest optical-interferometeric baselines currently available,
we have detected strong near-infrared (NIR) emission from inside the dust-destruction
radius of Herbig Ae stars MWC275 and AB Aur. Our sub-milli-arcsecond resolution
observations unambiguously place the emission between the dust-destruction radius
and the magnetospheric co-rotation radius. We argue that this new component corre-
sponds to hot gas inside the dust-sublimation radius, confirming recent claims based
on spectrally-resolved interferometry and dust evaporation front modeling.
3.1 Introduction
In the previous chapter, we presented state-of-the-art models for the dust evap-
oration front in circumstellar disks. The models show that the front structure is
extremely sensitive to dust properties. The sublimation front can thus be used to
study dust physics operating in the inner regions of circumstellar disks, provided that
we have a means to spatially resolve the geometry of this region. Spatially resolved
studies are also crucial to validating current models.
To be able to completely resolve the inner-rims of even the nearest Herbig Ae
systems (distances of ∼ 150pc), one needs milli-arcsecond resolution. The only two
47

instruments currently capable of this resolution in the NIR wavelengths (where the
sublimation front produces bulk of its emission) are the CHARA interferometer array
on Mt. Wilson (California,USA) and the VLTI interferometer in Paranal (Chile).
To test rim models and constrain dust physics in the gas-dust transition region, we
began a YSO observing program with the CHARA array (Prof. Monnier’s optical
interferometer group is member of the CHARA collaboration). In the next few
sections, I describe the CHARA interferometer, our observations on two Herbig Ae
stars MWC275 and AB Aur, the data reduction procedure and model comparisons
with the data.
3.2 The CHARA Array
The CHARA array was constructed and is currently operated by Georgia State Uni-
versity’s Center for High Angular Resolution Astronomy (CHARA). The Array works
in the optical and NIR and is located on the on the grounds of the historic Mt. Wilson
Observatory. A complete description of the instrument is provided in ten Brumme-
laar et al. [2005].
The array consists of six 1-meter telescopes arranged in a Y configuration (Fig
3.1). This arrangement provides C62 = 15 non-redundant baselines between 34m and
331m. Fig 3.2 (ten Brummelaar et al. [2005]) shows the on-sky Fourier coverage
provided by the telescope pairs. Light from each of the telescopes is transported
through dedicated vacuum tubes to a central beam synthesis facility (BSF). The
vacuum tubes help maintain the quality of the star-light wavefront, preventing further
degradation of beam quality due to atmospheric turbulence.
48
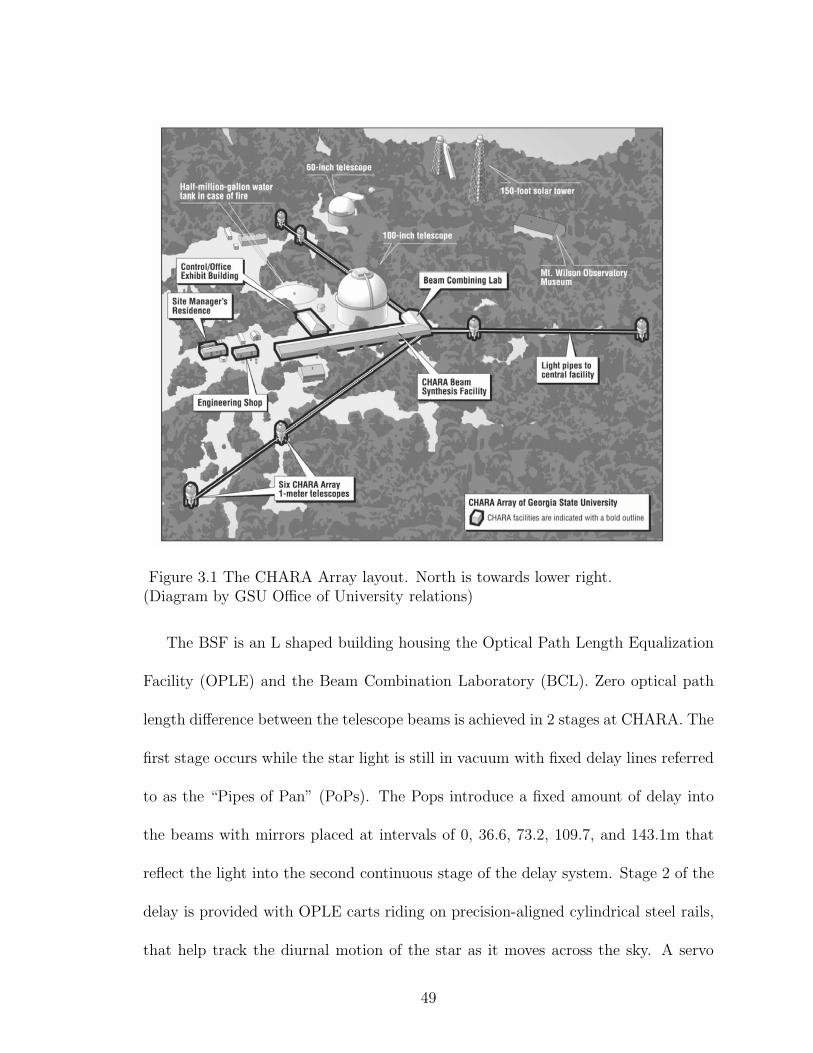
Figure 3.1 The CHARA Array layout. North is towards lower right.(Diagram by GSU Office of University relations)
The BSF is an L shaped building housing the Optical Path Length Equalization
Facility (OPLE) and the Beam Combination Laboratory (BCL). Zero optical path
length difference between the telescope beams is achieved in 2 stages at CHARA. The
first stage occurs while the star light is still in vacuum with fixed delay lines referred
to as the “Pipes of Pan” (PoPs). The Pops introduce a fixed amount of delay into
the beams with mirrors placed at intervals of 0, 36.6, 73.2, 109.7, and 143.1m that
reflect the light into the second continuous stage of the delay system. Stage 2 of the
delay is provided with OPLE carts riding on precision-aligned cylindrical steel rails,
that help track the diurnal motion of the star as it moves across the sky. A servo
49

system with a laser metrology unit, helps provide 92m of path length compensation
with typical rms errors of 10nm.
Figure 3.2 uv coverage of the CHARA Array for 3 declinations. -15o (top left), +30o
(top right) and +75o (bottom). The plots show the coverage resulting from all sixtelescopes within 3hrs from transit (Diagram from ten Brummelaar et al. [2005])
All observations for this thesis were performed in the K-band with the “CHARA
Classic” combiner. CHARA Classic is a 2-telescope pupil-plane combiner. The
interfering beams are imaged on two spots in a beam combining camera after passing
through a beam splitter. Fringes are detected in scanning mode (Fig 3.3) provided
by a dither mirror mounted on a piezoelectric translation stage.
CHARA provides a resolution of slightly better than 1 milli-arcsecond at K band,
50

Figure 3.3 CHARA Fringes. The raw signal from the fringe scan (top) with a low-pass filtered version superimposed on it. The bottom panel shows the same scan,with an offset of 0.2, after normalization, and finally after implementation of theband pass filter (Diagram from ten Brummelaar et al. [2005])
where resolution is defined as λ2B
(λ is wavelength of observation and B is the inter-
ferometer baseline length). The limiting magnitudes for CHARA Classic are K≤ 6.5,
H≤7 and V≤ 9. The V band limit is set by the tip/tilt system, which helps lock the
star light onto specified pixels of the beam combining camera. Besides the K band,
CHARA also operates at H band (1.67µm) and at optical wavelengths.
51

3.3 Observations
3.3.1 The Interferometric Observable: Visibility
Figure 3.4 Interferometry as a form of Young’s Double Slit Experiment. The leftpanel is for a single point source and the right panel is for two point sources separatedat half the fringe spacing. (Diagram from Dr. J. D. Monnier’s PhD thesis)
2-telescope interferometry is essentially the Young’s Double Slit experiment per-
formed on the sky. Figure 3.4 shows a schematic of such a setup. Light from a distant
source (like a star) arrives at the telescopes (represented by slits). The electric field at
each of the telescope is then propagated to a beam combiner camera (represented by
the screen behind the slits) where the light constructively or destructively interferes
52

(light has a wave nature), because of relative path differences between the telescopes
(slits). The angular spacing of the fringe maxima is given by -
θ =λ
B(3.1)
where B is projected separation between the telescopes (slits). The presence of an-
other star (incoherent with the first and of equal brightness) at an angular separation
of λ2B
, will produce a fringe pattern out of phase from the first star (see right panel
in Fig. 3.4). The two interference patterns cancel each other out and uniformly illu-
minate the detector (screen). The fringing in the illumination pattern is quantified
by the visibility
V =Imax − Imin
Imax + Imin=
Fringe Amplitude
Average Intensity(3.2)
Imax and Imin denote the maximum and minimum intensity of the fringes. Hence,
the fringe patterns in the left and right panels of Figure 3.4 have visibilities of 1 and
0 respectively. The visibility is a very important measurable as it is relates to the
Fourier Transform of the illumination-source surface-brightness distribution via the
van Cittert-Zernike theorem -
V ( ~B) =
∫
I(~s)e−i ~B.~sd~s∫
I(~s)d~s, (3.3)
where ~B is the baseline vector, ~s is the sky coordinate and I(~s) is the intensity
distribution of the source. In 2-telescope beam combination, the phase component of
V is lost to atmospheric turbulence and the only good measurable is the magnitude of
V , i.e.V (eqn 3.2). As an illustration, Fig 3.5 shows the K-band visibility-amplitude
curves as a function of projected baseline length for a Gaussian and a Uniform Disk
53

(constant surface brightness profile). At short baselines the sources look like points
and the visibility is high. As the baseline increases and the sources begin to get
resolved, the visibilities drop. At long baselines the Uniform Disk visibility shows
ringing because of the presence of a sharp outer edge.
-2 -1 0 1 2arcsec
-2
-1
0
1
2
arcs
ec Uniform Disk
-2 -1 0 1 2arcsec
-2
-1
0
1
2
arcs
ec
Gaussian Disk
0 50 100 150 200 250 300 350Meters
0.0
0.2
0.4
0.6
0.8
1.0
Vis
ibili
ty
0 50 100 150 200 250 300 350Meters
0.0
0.2
0.4
0.6
0.8
1.0
Vis
ibili
ty
Figure 3.5 Illustrative visibility curves. a) The left panels show the image andcorresponding Visibility curve for a Uniform Disk of diameter 5 mas. b) The rightpanels show the same for a Gaussian Disk with Full Width Half Maximum of 2.5mas.
A measurement of fringe visibilities can thus be used to constrain surface bright-
ness properties of light sources in the sky and differentiate between various physical
models. Interferometers have been successful in measuring stellar diameters (Michel-
son & Pease [1921]), determining binary orbits, probing the circumstellar environ-
ments of young as well as evolved stars (McCarthy & Low [1975]; Millan-Gabet et al.
[1999]), and imaging of stars outside the solar system (Monnieret al. [2007]).
54
3.3.2 CHARA observations of MWC275 and AB Aur
As discussed in Chapter 2, current models assume that the entire NIR excess ob-
served in Herbig Ae stars arises solely from dust rims. However, recent observational
results have begun to indicate that these models are inadequate in explaining some
of the observed YSO properties. Akeson et al. [2005b] noted that NIR emission from
the the dust rim alone was not sufficient to explain the spectral energy distribution
(SED) of some T Tauri stars. Isella et al. [2006] pointed out that the dust evaporation
temperatures of well studied astronomical dust types (Pollack et al. [1994]) were too
low (producing dust rims with large inner radii) to explain the anomalously small
NIR size of AB Aur. Eisner [2007] had to invoke gas emission to account for the
apparent decrease in NIR sizes of Herbig Ae/Be stars with decreasing wavelength.
Most recently, Kraus et al. [2008a] showed that the NIR visibilities of Herbig Be star
MWC147 could not be explained without including emission from inside the dust
evaporation radius. Due to the lack of sufficient spatial resolution, some of these
conclusions are tentative and based on indirect arguments with multiple interpreta-
tions.
To unambiguously constrain the NIR disk structure in YSOs, we began an obser-
vation campaign with the CHARA Array using the CHARA Classic beam combiner.
Our targets were MWC275 (V=6.86, K=4.59) and AB Aur (V=7.01, K=4.37). The
targets (properties listed in Table 3.1) were observed at K band (central wavelength
of 2.13 microns) with the long baselines of CHARA at a variety of orientations in 8
runs between June 2004 and June 2007 (see Tables 3.2 and 3.3 for detailed observing
55

Table 3.1. Basic properties of stars.
Name Spectral Type Teff L∗ D M∗
(K) L⊙ pcp M⊙
MWC275 (HD163296) A1e 9500 36 122 2.3AB Aur (HD31293) A0pe 9772 47 144 2.4
logs). The longest baseline observation for MWC275 was 325m (resolution 1 of 0.67
milli-arcseconds) and 320m (resolution of 0.68 milli-arcseconds) for AB Aur.
Even though our targets are 2 magnitudes brighter than the sensitivity limit
of CHARA, we realized early on that the low expected visibilities (see Fig 3.6) at
baselines > 100m (based on fits to short baseline data) would make our experiment
challenging. In order to maximize the chances of observing fringes, we adopted the
following strategy -
1. Most of the science observations were done at a dither rate of 250Hz. For a
star with K magnitude of 4.5 (with calibrated visibility < 0.3), the 250Hz dither rate
seems to optimize the trade off between maximizing photon counts and maintaining
photon phase.
2. To locate weak fringes on targets, we first obtained fringes on nearby calibrator
stars (within 15o from the target) and noted the OPLE offset at which the fringes
were located. We then moved to the target and scanned a 2cm region around the
calibrator offset for fringes. The OPLE carts were re-positioned in small steps and
at each cart location we waited for several dithers to be completed before moving
the cart again.
1Resolution is defined as λ2B
-lambda is wavelength of observation and B is theinterferometer baseline length.
56

Table 3.2. CHARA uv coverage and visibility data for MWC275.
UT-Date u(m) v(m) Telescope Calibrated Calibratorof Observation pair Visibility Names
2004July09 -210.61 138.79 S1W1 0.150±0.008 HD164031-200.38 127.78 0.143±0.009
2005July22 106.91 -11.88 W1W2 0.218±0.011 HD164031103.22 -18.38 0.227±0.009
2005July26 102.45 5.03 W1W2 0.260±0.014 HD164031106.45 -1.61 0.241±0.011107.18 -10.26 0.201±0.011105.94 -13.95 0.232±0.011
2006June22 -11.99 84.94 S2W2 0.345±0.016 HD164031-24.60 85.73 0.301±0.017-42.30 87.77 0.203±0.013
2006June23 -301.23 -85.20 E1W1 0.0715±0.0043 HD164031-302.93 -78.34 0.0730±0.0044
2006June23 -84.05 98.77 S2W2 0.0925±0.0041 HD1640312006Aug23 60.15 125.48 E2S2 0.181±0.010 HD164031,
28.16 121.90 0.189±0.011 HD1662952007June17 -94.21 66.98 S2W1 0.232±0.013 HD164031,
-166.86 90.88 0.080±0.005 HD156365-184.56 102.73 0.096±0.006-195.84 114.04 0.110±0.007
Table 3.3. CHARA uv coverage and visibility data for AB Aur.
UT-Date u(m) v(m) Telescope Calibrated Calibratorof Observation pair Visibility Names
2006Aug23 212.04 237.05 E1S1 0.095±0.005 HD29645, HD31233203.79 251.87 0.120±0.006197.53 259.95 0.123±0.007
2006Dec14 -5.77 -325.14 E1S1 0.115±0.007 HD29645, HD312332006Dec15 -93.57 8.26 E2W2 0.188±0.011 HD29645, HD31233
57

3. The OPLE carts try to equalize path lengths for star light based on an astro-
metric model. The models however are not perfect and cart positions for zero OPD
(optical path difference) tend to drift relative to the model. To keep track of the
OPLE offsets, we moved to a calibrator again after a 2cm scan on the target.
Steps 2 and 3 were repeated to identify and collect data on our target fringes.
Figure 3.6 shows a number of low visibility data points obtained with the manual
‘fringe search’ procedure.These would have been skipped over by an automated scan
looking for high S/N fringes.
3.4 Data Reduction and Analysis
Figure 3.7 show a typical CHARA data scan. The fringe data were reduced based on
power spectrum analysis detailed in ten Brummelaar et al. [2005]. Briefly, the total
power in the fringe is related to the visibility by the following functional form -
Power = T 2V 2V 2sys
∆σvg
(3.4)
where T is the intensity transmission function, ∆σ is the band pass, vg is the fringe
group velocity due to dither motion, V is source visibility and Vsys is the instrument
visibility. The source visibility can thus be estimated from measurements of total
fringe power. The top panel in Fig 3.8 shows the total raw power in the data. This
includes noise from the detector, scintillation and photon noise in the signal. The
noise is power is estimated using the shutter data (see Fig 3.7) in the scan which
includes counts from each telescope separately as well the background counts from the
detector. The bottom panel in Fig 3.8 shows the fringe power in the astronomical
target after subtraction of noise from the raw power spectrum. The instrument
58

Visibility curve for MWC275
50 100 150 200 250 300 350Baseline (m)
0.0
0.2
0.4
0.6
0.8
1.0
Vis
ibili
ty
Dust-rim modelDust-rim + gas model
iota dataKI datachara data S2W2 " " E1W1 " " S1W1 " " E2S2 " " W1W2 " " S2W1
Visibility curve for AB Aur
50 100 150 200 250 300 350Baseline (m)
0.0
0.2
0.4
0.6
0.8
1.0
Vis
ibili
ty
IOTA dataPTI dataCHARA data S2W2 " " E1W1
Dust RimDust Rim + Gas emission
Figure 3.6 Visibility data and models for MWC275 (top) and AB Aur (bottom).MWC275 visibilities are plotted as a function of “effective baseline” (see §3.4 ), whichaccounts for the change in resolution due to disk inclination and PA.The dotted lines correspond to “Standard” rim models tuned to fit visibility datafor each source for baselines shorter than 100m. The solid lines correspond to dustrim+gas models. The model parameters are listed in Table 3.4.
visibility Vsys can be calibrated out from equation 3.4 to get the source visibility V
by comparing the fringe power of the target with the fringe power in a calibrator
having a known intrinsic visibility.
The data were reduced using standard CHARA reduction software (ten Brum-
melaar et al. [2005]) and these results were cross checked with an independent code
developed at University of Michigan by Prof. John Monnier. Fig 3.9 shows the differ-
ence in squared visibilities for the calibrators and science targets computed with the
59

0 1•105 2•105 3•105 4•105
Time
200
400
600
800
1000
1200
1400
Cou
nts
Figure 3.7 Sample CHARA data scan from one side of the beam splitter. The x-axis shows time and the y-axis represents signal strength. The lines in purple showthe superposed signal from both telescopes, the dark blue lines are the signal fromtelescope 1 and light blue lines are signal from telescope 2. The background flux ispresented in yellow.
2 codes. V2 for the calibrators agree at the 2% level and V2 for the objects (having
a factor of 4 lower intrinsic visibility than the calibrators at CHARA baselines) agree
to within 5%. These results give us high confidence in the robustness of our data
analysis tools.
HD164031 , HD166295 (Merand et al. [2005]) and HD156365 with uniform-disk
(UD) diameters of 0.83± 0.08 mas, 1.274±0.018 mas and 0.44±0.06 mas were used
as calibrators for MWC275. AB Aur visibilities were calibrated with HD29645 (UD
diameter=0.54±0.07 mas) and HD31233 (UD diameter=0.76±0.13 mas). During
the data reduction procedure the flux ratios between the two interferometer tele-
scopes were carefully monitored for the source and the calibrators (Fig 3.10). Data
60

Figure 3.8 Sample power spectra. The top panel shows the raw spectrum with thefringe signal, photon noise, scintillation noise and camera noise. The bottom panelshows fringe with some of the noise sources measured and removed. (Diagram fromten Brummelaar et al. [2005])
points having a sudden flux ratio variation of greater than 10% from the mean were
eliminated, as these seemed to coincide with large and uncertain calibration errors.
Based on this criterion, we eliminated 3 data points on MWC275. The procedure
was adopted to minimize calibration errors caused by differences in beam overlap in
the source and calibrator. The final visibility errors (which include calibration errors,
statistics and errors due to finite calibrator size) are at the ∼6% level (Tables 3.2 and
3.3) , typical for CHARA Classic. The new fringe-visibility data from CHARA were
combined with past measurements from IOTA (Monnier et al. [2006]), PTI (Eisner
et al. [2004]) and the Keck Interferometer (Monnier et al. [2005]) providing a baseline
61

coverage from 15m-320m on the targets, placing strong constraints on the geometry
of the inner-most disk regions.
The baseline orientations used have allowed us to clearly detect the asymme-
try of the MWC275 disk (details in Appendix C), as having inclination=48o±2o,
PA=136o±2o, consistent with the inclination of 51+11−9 degrees, and PA of 139o±15o
determined in Wassell et al. [2006]. Thus, in Fig 3.6 the visibility of MWC275 is
shown as a function of “effective baseline” -
Beff = Bprojected
√
cos2(θ) + cos2(φ)sin2(θ)
where θ is the angle between the uv vector for the observation and the major axis
of the disk and φ is the inclination of the disk. Under the flat disk assumption, the
effective baseline correctly accounts for the change in resolution due to the disk in-
clination and PA (geometry of finitely thick disks is represented only approximately
with optical depth effects and 3-D geometry of thick disks not being taken into
account), allowing us to plot the visibility measurements as a function of one coor-
dinate, simplifying presentation and analysis. As the AB Aur disk is near face on
(Eisner et al. [2004]), we have plotted its visibility as a function of true projected
baseline (Fig 3.6).
3.5 Modeling
To elucidate the structure of the inner disk and the dust rim, we constructed dust-
only rim models for MWC275 and AB Aur and fit the models to the visibility data. In
these models, all of the K-band emission is assumed to come from the inner dust rim
62

and the central star (“standard” model). The rim is in hydrostatic equilibrium and its
shape is set by the pressure dependence of the dust grain evaporation temperatures
(Isella & Natta [2005]; Tannirkulam et al. [2007]). The normalization of the pressure
dependence of the evaporation temperatures (discussed in more detail in Chapter 5)
is adjusted so that the model rims fit the short baseline (< 100m) visibility data. As
can be seen in Fig 5.4, a realistic treatment of dust physics produces a curved inner
rim with a sharp inner edge, set by dust destruction, and a sharp outer edge, set by
the fact that the rim shadows (Dullemond et al. [2001]) a portion of the disk behind
it preventing direct star-light from reaching the region.
We are able to fit the standard model to the visibility data for MWC275 and
AB Aur at baselines shorter than 100m (Fig 3.6) fairly well 2 (a result already
established in multiple previous studies; Monnier & Millan-Gabet [2002]; Eisner et al.
[2004]; Isella et al. [2006] ). Rim radii from the model fit are 0.19 AU (thickness 0.04
AU) for MWC275 and 0.21AU (thickness 0.05 AU) for AB Aur (see Table 3.4 for
details). However, the standard model fails glaringly at fitting the long-baseline
data. For baselines longer than 110m the standard rim predicts strong bounces in
the visibility response which are not observed in the data.
The lack of bounce in visibility cannot be explained in the framework of the
standard rim model. Models for NIR excess in Herbig Ae stars in which all of the
2The near-IR disk size obtained from the Keck Interferometer data is ∼20% largerthan the size obtained with the CHARA data (June2004-Aug2006 epochs). The sizedetermined from the S2W1 June2007 data also differs at the ∼25% level from thesize obtained from earlier CHARA epochs. The size fluctuations could be related tothe observed variability in the infrared photometry of MWC275 (Sitko et al. [2008]).Variability does not affect any of our conclusions.
63

excess arises in rims will display bounces in visibility at long baselines because of the
presence of sharp ring-like features with high spatial frequency components in the
corresponding images, even for the smoothest rims physically plausible.
The only explanation for the absence of long-baseline visibility bounce in the data
is the presence of an additional smooth emission component within the dust destruc-
tion radius that suppresses the large visibility bounces seen in a rim-only model.
The bottom panel in Fig 3.11 shows a standard model to which NIR emission has
been added within the dust evaporation radius. Our data cannot uniquely constrain
this emission profile and we assume a constant surface brightness disk (a uniform
disk), which is a simple model. A rim + uniform disk model in which the uniform
disk emission (refer Table 3.4 for details) accounts for 40-60% of the total K-band
emission provides a good fit to the visibility (Fig 3.6) over the whole baseline range.
Besides the interferometry, emission inside the dust evaporation radius can also
help explain the NIR flux budget of MWC275 and AB Aur. MWC275 and AB Aur
have total K-band emission a factor of 10 larger than the stellar photospheric K-
band emission, whereas the total emission produced by standard rim models (Isella
& Natta [2005]) is only a factor of 3.5 larger (SED analysis will be presented in
Chapter 5) than the photospheric emission. The emission component inside the dust
rim can supply the “missing” K-band flux in MWC275 and AB Aur. In the next
section we discuss candidates for the physical origin of this emission.
64
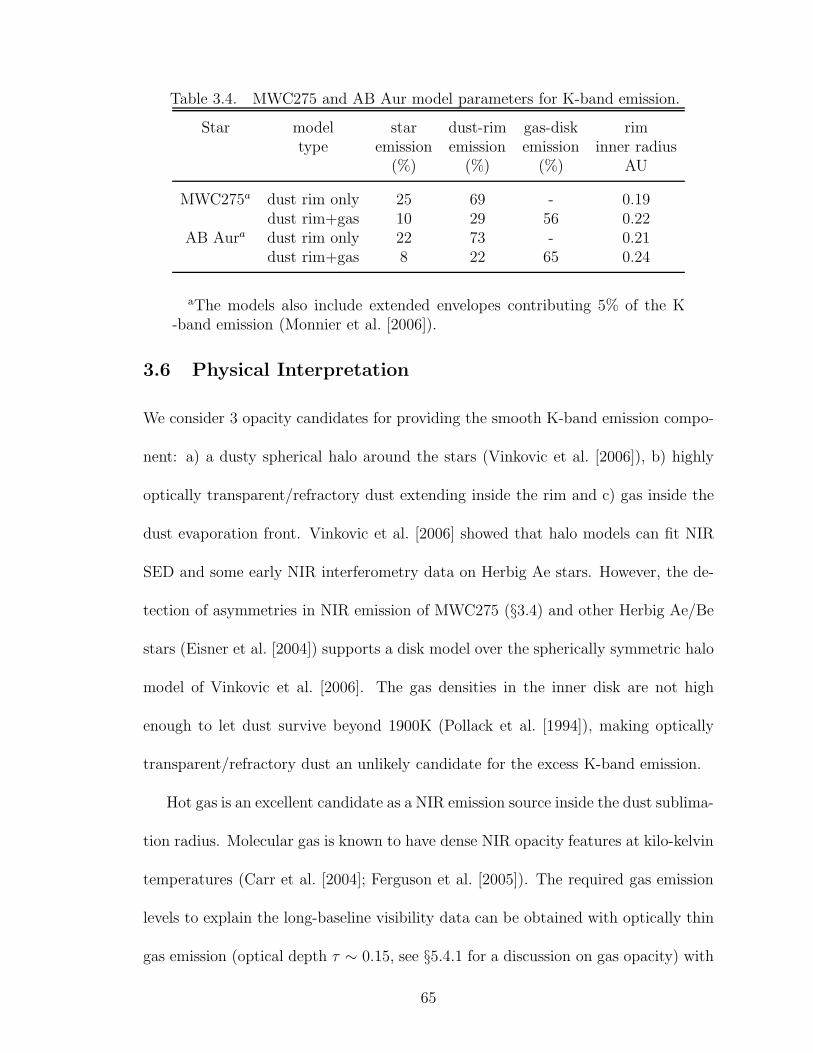
Table 3.4. MWC275 and AB Aur model parameters for K-band emission.
Star model star dust-rim gas-disk rimtype emission emission emission inner radius
(%) (%) (%) AU
MWC275a dust rim only 25 69 - 0.19dust rim+gas 10 29 56 0.22
AB Aura dust rim only 22 73 - 0.21dust rim+gas 8 22 65 0.24
aThe models also include extended envelopes contributing 5% of the K-band emission (Monnier et al. [2006]).
3.6 Physical Interpretation
We consider 3 opacity candidates for providing the smooth K-band emission compo-
nent: a) a dusty spherical halo around the stars (Vinkovic et al. [2006]), b) highly
optically transparent/refractory dust extending inside the rim and c) gas inside the
dust evaporation front. Vinkovic et al. [2006] showed that halo models can fit NIR
SED and some early NIR interferometry data on Herbig Ae stars. However, the de-
tection of asymmetries in NIR emission of MWC275 (§3.4) and other Herbig Ae/Be
stars (Eisner et al. [2004]) supports a disk model over the spherically symmetric halo
model of Vinkovic et al. [2006]. The gas densities in the inner disk are not high
enough to let dust survive beyond 1900K (Pollack et al. [1994]), making optically
transparent/refractory dust an unlikely candidate for the excess K-band emission.
Hot gas is an excellent candidate as a NIR emission source inside the dust sublima-
tion radius. Molecular gas is known to have dense NIR opacity features at kilo-kelvin
temperatures (Carr et al. [2004]; Ferguson et al. [2005]). The required gas emission
levels to explain the long-baseline visibility data can be obtained with optically thin
gas emission (optical depth τ ∼ 0.15, see §5.4.1 for a discussion on gas opacity) with
65

a temperature range of 2000K-3000K (Muzerolle et al. [2004]; Eisner [2007]). Our
claim regarding the presence of gas emission inside the dust rim is further supported
by the detection of the Brγ line in young star HD104327 (Tatulli et al. [2007]) on
size scales similar to the dust destruction radius.
At first thought, presence of binary companions or source variability would also
seem good explanations for the excess K-band emission and the lack of visibility
bounce at long baselines. However, the presence of a binary companion within 0.5
AU of MWC275 that contributes ∼50% of the total near-IR emission will cause
changes of ∼0.5 in the absolute visibility of the system at any given baseline over
the multiple CHARA observation epochs. This variation is not seen in the data (see
Fig. 3.6). Furthermore, Monnier et al. [2006] obtained NIR visibility and closure-
phase data on MWC275 and found no evidence for a binary companion ruling out
binarity as an explanation for the observations. A comparison between the Keck
Interferometer and CHARA data (taken in different observation epochs) in Fig. 3.6
shows that MWC275 visibilities are time variable at the ∼20% level, suggesting that
variability could complicate our analysis. However, the data from the S2W1 CHARA
telescope pair (Fig. 3.6) were obtained on a single night and show a similar visibility-
baseline trend as the rest of the data, disfavoring variability as an explanation for
the observed trends. Thus, our conclusion on the presence of smooth gas emission
inside the dust destruction radius is robust.
66
3.7 Discussion
In this work, we have conclusively shown the presence of strong NIR emission between
the magnetospheric co-rotation radius and the dust sublimation radius in Herbig Ae
stars MWC275 and AB Aur. The underlying mechanism for this emission is not
known, requiring high resolution NIR spectroscopy and self-consistent modeling of
the gas-dust transition region to identify the gas species and the physical processes
responsible for the emission.
The detection of gas emission within the dust destruction radius through long-
baseline interferometry is of special importance to understanding the star-disk con-
nection. Accretion models for YSOs have tended to focus on two separate physical
scales (i) the process of mass and angular momentum transport in the outer disk and
(ii) gas accretion from a few stellar radii on to the stellar photosphere. Milli-meter
interferometry and direct imaging in the mid-IR have allowed observational access to
the outer disk while high-resolution optical-spectroscopy can probe the circumstellar
environment around YSOs on scales of a few stellar radii. Our near-IR interferometry
results on MWC275 and AB Aur provides exciting prospects for connecting the two
scales and determining the structure of the gas flow from a few tenths of an AU down
to the stellar surface. In the following paragraph, we describe NIR interferometry as
a tool in probing accretion physics inside the dust rim.
In the regime where in the inner gas disk is optically thin, the Shakura-Sunyaev
viscosity parameter for the gas disk can be constrained using a combination of NIR
interferometry and optical spectroscopy. NIR interferometry in J, H and K bands can
constrain the inner gas-disk surface density and temperature profiles. The surface
67
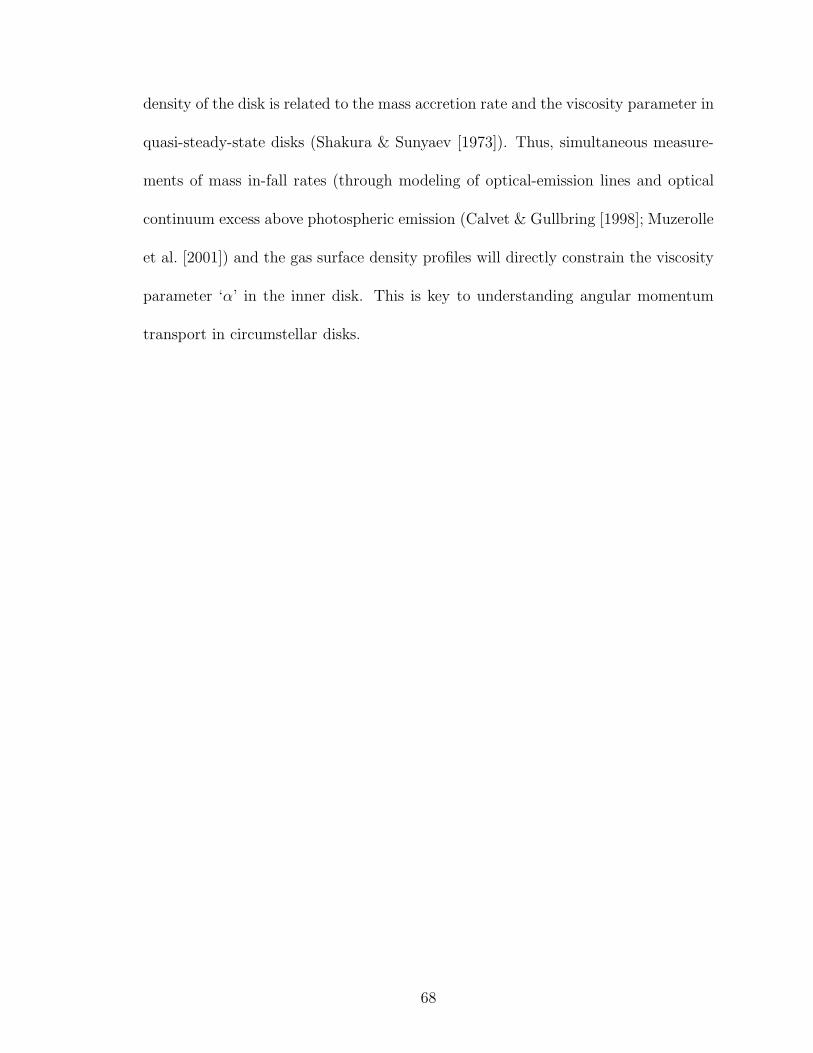
density of the disk is related to the mass accretion rate and the viscosity parameter in
quasi-steady-state disks (Shakura & Sunyaev [1973]). Thus, simultaneous measure-
ments of mass in-fall rates (through modeling of optical-emission lines and optical
continuum excess above photospheric emission (Calvet & Gullbring [1998]; Muzerolle
et al. [2001]) and the gas surface density profiles will directly constrain the viscosity
parameter ‘α’ in the inner disk. This is key to understanding angular momentum
transport in circumstellar disks.
68
Calibrator vs Calibrator
0.1 0.2 0.3 0.4 0.5 0.6Vis2_CHARA
-0.04
-0.02
0.00
0.02
0.04
Vis
2 _Mic
higa
n-V
is2 _C
HA
RA
S2W2-1E1W1-1S2W2-2E2S2-1E1S1-1W1E2-1E1S1-2S1W1-1S1W1-2W1W2-1W1W2-2W1W2-3E1S1-3E2W2-1
Target vs Target
0.02 0.04 0.06 0.08 0.10Vis2_CHARA
-0.010
-0.005
0.000
0.005
0.010
Vis
2 _Mic
higa
n-V
is2 _C
HA
RA
S2W2-1E1W1-1S2W2-2E2S2-1E1S1-1W1E2-1E1S1-2S1W1-1S1W1-2W1W2-1W1W2-2W1W2-3E1S1-3E2W2-1
Figure 3.9 Comparison of CHARA V2 results from two independent codes. Thetop panel shows differences in V2 for the calibrators computed with the standardCHARA reduction package(V2CHARA) and the code developed by Dr. John Mon-nier (V2Michigan). The bottom panel shows differences for the science targets.The uncertainty in V2, caused by photon noise, read noise and scintillation noise,is estimated by measuring the distribution of V2 determined from individual datascans.
69

W1W2_1 Flux stability check
2.4•107 2.6•107 2.8•107 3.0•107 3.2•107
Time
0.5
0.6
0.7
0.8
0.9
1.0
1.1
Bea
m R
atio
HD164031HD163296HD163955
Figure 3.10 CHARA beam ratio stability. The near-infrared flux ratio of telescopesW1 and W2 as a function of time on MWC275 data set (July 22nd, 2006).
70
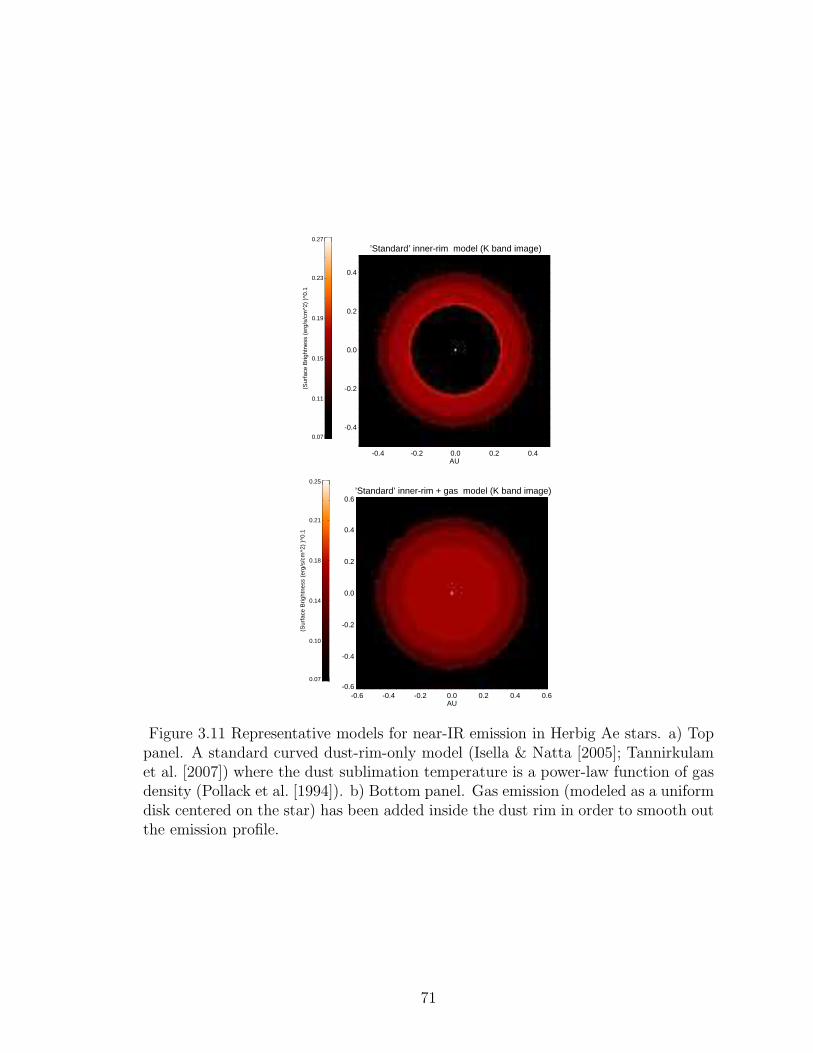
-0.4 -0.2 0.0 0.2 0.4AU
-0.4
-0.2
0.0
0.2
0.4
’Standard’ inner-rim model (K band image)
0.07
0.11
0.15
0.19
0.23
0.27
(Sur
face
Brig
htne
ss (
erg/
s/cm
^2)
)^0.
1
-0.6 -0.4 -0.2 0.0 0.2 0.4 0.6AU
-0.6
-0.4
-0.2
0.0
0.2
0.4
0.6
’Standard’ inner-rim + gas model (K band image)
0.07
0.10
0.14
0.18
0.21
0.25
(Sur
face
Brig
htne
ss (
erg/
s/cm
^2)
)^0.
1
Figure 3.11 Representative models for near-IR emission in Herbig Ae stars. a) Toppanel. A standard curved dust-rim-only model (Isella & Natta [2005]; Tannirkulamet al. [2007]) where the dust sublimation temperature is a power-law function of gasdensity (Pollack et al. [1994]). b) Bottom panel. Gas emission (modeled as a uniformdisk centered on the star) has been added inside the dust rim in order to smooth outthe emission profile.
71

Chapter 4
Circumstellar Disks in Mid-Infrared Emission
Abstract: The inner 30AU in circumstellar disks is the birth site for planets and
understanding the temperature and density structure of this region has become an
important goal of modern astrophysics. This portion of the disk emits strongly in
mid-infrared (MIR) wavelengths making MIR spectroscopy and interferometry good
tools for probing structure. In this chapter, we describe modeling results for MIR
disk emission and make predictions for future observations with long-baseline MIR
interferometry. We present preliminary work on characterizing the geometry of cir-
cumstellar disks based on observations from a novel Keck Segment Tilting Experi-
ment. We also discuss the discovery of a circumbinary disk with Keck Experiment
around the Herbig Be star v892 Tau first reported in Monnier et al. [2008a].
4.1 MIR emission morphology
Chapters 2 and 3 discussed the NIR emitting region in Herbig Ae disks. In the NIR,
bulk of the emission arises from the dust evaporation front and hot gas inside the
gas-dust transition region. However, at MIR wavelengths, emission comes from the
rim as well as the flared disk beyond it. Figure 4.1 shows synthetic 10.7µm TORUS
images of three rim+disk models introduced in Chapter 2. The rim has a high
72
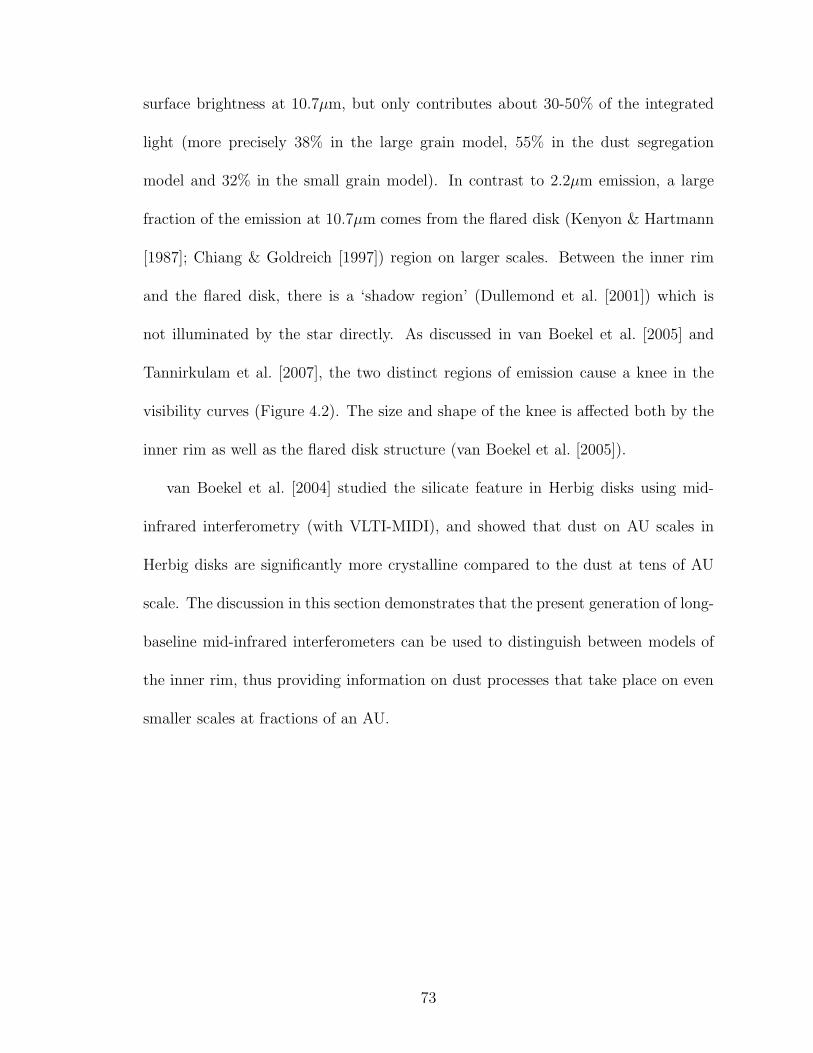
surface brightness at 10.7µm, but only contributes about 30-50% of the integrated
light (more precisely 38% in the large grain model, 55% in the dust segregation
model and 32% in the small grain model). In contrast to 2.2µm emission, a large
fraction of the emission at 10.7µm comes from the flared disk (Kenyon & Hartmann
[1987]; Chiang & Goldreich [1997]) region on larger scales. Between the inner rim
and the flared disk, there is a ‘shadow region’ (Dullemond et al. [2001]) which is
not illuminated by the star directly. As discussed in van Boekel et al. [2005] and
Tannirkulam et al. [2007], the two distinct regions of emission cause a knee in the
visibility curves (Figure 4.2). The size and shape of the knee is affected both by the
inner rim as well as the flared disk structure (van Boekel et al. [2005]).
van Boekel et al. [2004] studied the silicate feature in Herbig disks using mid-
infrared interferometry (with VLTI-MIDI), and showed that dust on AU scales in
Herbig disks are significantly more crystalline compared to the dust at tens of AU
scale. The discussion in this section demonstrates that the present generation of long-
baseline mid-infrared interferometers can be used to distinguish between models of
the inner rim, thus providing information on dust processes that take place on even
smaller scales at fractions of an AU.
73
milliarcsec
-100
-50
0
50
100
-100
-50
0
50
100
IN05 Large Grain Model
i = 0o
mill
iarc
sec
-100 -50 0 50 100
-100
-50
0
50
100
i = 60o
0.05
0.08
0.11
0.14
0.16
0.19
(Sur
face
Brig
htne
ss (
erg/
s/cm
^2)
)0.1
Dust Segregation Model
i = 0o
-100 -50 0 50 100milliarcsec
i = 60o
IN05 Small Grain Model
i = 0o
0
-7.5
-15
7.5
15
-100 -50 0 50 100
i = 60o
0
-7.5
-15
7.5
15
A.U
.
Figure 4.1 Synthetic 10.7µm images for rim models discussed in Chapter 2. Thepanels on the left and right are IN05 rims computed for 1.2µm (large grain) and 0.1µm(small grain) silicate dust. The center panels are images for the dust segregationmodel. The star is placed at 150pc with the stellar parameters described in Table 2.1.The star is unresolved at the image scale and is just one bright pixel at the center.
74

0 20 40 60 80 100 120 140Baseline (m)
0.0
0.2
0.4
0.6
0.8
1.0V
isib
ility
inclination = 0o IN05 large grain modelIN05 small grain modeldust segregation model
0.0
0.2
0.4
0.6
0.8
1.0
Vis
ibili
ty a
long
min
or a
xis inclination = 60o IN05 large grain model
IN05 small grain modeldust segregation model
0 20 40 60 80 100 120 140Baseline(m)
0.0
0.2
0.4
0.6
0.8
1.0
Vis
ibili
ty a
long
maj
or a
xis inclination = 60o IN05 large grain model
IN05 small grain modeldust segregation model
Figure 4.2 10.7µm visibilities for the IN05 and dust segregation models. The panelon top shows the visibilities for a face-on disk and the bottom panel shows visibilitiescomputed along the major and minor axis for an inclined disk.
75

Midplane Temperature Profile
1radius [AU]
100
1000
Tem
pera
ture
(K
)
IN05 large grain modelIN05 small large grain model
dust segregation model
Figure 4.3 Midplane temperature profiles for disk models. The models differ in theirinner-rim structure. The solid-red line is the viscous temperature for an accretionrate of 4×10⁻⁸M⊙yr−1.
Fig 4.3 shows the midplane temperature profiles for the passive-disk models in Fig
4.1. The MIR shadow seen in Fig 4.1 is also reflected in the temperature structure.
Moving away from the star in the radial direction, temperatures begin to fall. As
the disk emerges out of the shadow of the inner rim, there is a small increase in
temperature after which temperatures continue to fall again. In the models presented,
the mass enclosed in the shadow is ∼ 0.002M⊙. Depending on the rim model, ∼ 1-15
Neptune masses of material in the shadow is below 150K which is the sublimation
temperature of water ice. The presence of this cold reservoir of material close to the
star (closer than expected in a disk model with no inner rim) could have important
implications for chemistry and the abundance of volatile elements in planets.
The above discussion however assumes that the disk is passively heated and ne-
glects the contribution of accretion energy. In the presence of disk accretion, the
76

viscous temperature in the midplane is given by (Hillenbrand et al. [1992]; Shakura
& Sunyaev [1973])
Tvisc = 26890
(
M∗
M⊙
)0.25 (M
10−5M⊙yr−1
)0.25 (R
R⊙
)−0.75 [
1 −
(
R∗
R
)0.5]0.25
, (4.1)
where M∗ is the mass of the star, R∗ is the stellar radius and M is accretion rate. A
modest accretion rate of 4×10⁻⁸M⊙yr−1 will increase the temperature in the shadow
of the IN05 large grain model (Fig 4.3) by ∼ 30K, pushing the temperature above
the sublimation point of water ice.
Having discussed the effects of the inner rim on disk structure and corresponding
observable consequences, we now move on to study the disk at a larger scale of ∼
10-30AU. In the following section, we describe the Keck Segment Tilting Experiment
in the mid-infrared wavelengths and attempt at establishing trends between stellar
spectral type, disk surface brightness and MIR colors, and the shape of the MIR
SED. We also report the detection of a circumbinary disk around the Herbig Be star
v892 Tau.
4.2 The Keck Segment Tilting Experiment
I was fortunate to be part of an exciting experiment designed and executed at the
Keck Telescope by Prof. John Monnier and his collaborators -Dr. Peter Tuthill,
Dr. Michael Ireland and Dr. R. Cohen. Precise measurements of partially resolved
objects with 10-m class telescopes are delicate due to changes in atmospheric seeing
between the science target and a Point Spread Function Calibrator. In order to
avoid this problem, a novel experiment was conducted where four subsets of Keck
77
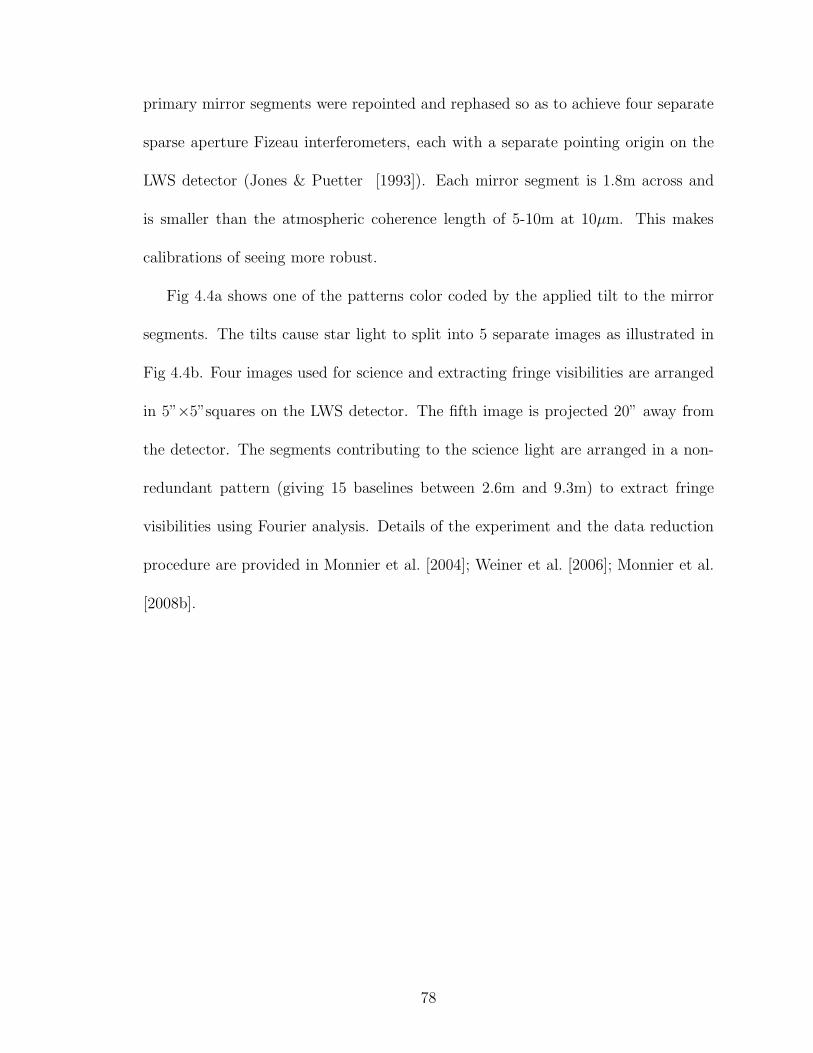
primary mirror segments were repointed and rephased so as to achieve four separate
sparse aperture Fizeau interferometers, each with a separate pointing origin on the
LWS detector (Jones & Puetter [1993]). Each mirror segment is 1.8m across and
is smaller than the atmospheric coherence length of 5-10m at 10µm. This makes
calibrations of seeing more robust.
Fig 4.4a shows one of the patterns color coded by the applied tilt to the mirror
segments. The tilts cause star light to split into 5 separate images as illustrated in
Fig 4.4b. Four images used for science and extracting fringe visibilities are arranged
in 5”×5”squares on the LWS detector. The fifth image is projected 20” away from
the detector. The segments contributing to the science light are arranged in a non-
redundant pattern (giving 15 baselines between 2.6m and 9.3m) to extract fringe
visibilities using Fourier analysis. Details of the experiment and the data reduction
procedure are provided in Monnier et al. [2004]; Weiner et al. [2006]; Monnier et al.
[2008b].
78

Figure 4.4 Keck Segment map. a) Top Panel. One of the Keck mirror tilt patternsknown as “pattern 6”. b) Bottom Panel. Corresponding image positions.
79

4.2.1 Geometric Models for MIR Emission in HAe/Be stars
Leinert et al. [2004] resolved 6 Herbig Ae/Be stars with the MIDI instrument on the
VLT interferometer. A plot of the 12.5µm physical sizes vs their IRAS colors (Fig
4.5) hinted that Group I sources are larger and redder than the Group II sources
(see section 1.3.1 for definition of Group I and Group II). This gave some evidence to
the interpretation that Group I sources have disks that are more flared than Group
II sources. To further investigate the relation between MIR observables and disk
geometry, we surveyed 12 Herbig Ae and 13 Herbig Be stars (Monnier et al. [2008b])
with the Segment Tilting Experiment. While angular resolution of this experiment
(30 mas) is much lower than that of VLTI-MIDI, we were able to observe a larger
sample in a short time. The snapshot 2-dimensional uv coverage on the sky allowed
us to detect disk asymmetries and we discuss the very interesting asymmetric disk
of v892 Tau in section 4.3.
Figure 4.5 Disk size vs color. VLTI-MIDI 12.5µm size vs IRAS 12µm - 25µmcolor (Leinert et al. [2004]). The largest sources are red and belong to the Group Iclassification.
80

Fig 4.6 shows a summary plot of our results. In the HAe case, the Group II
sources are clearly and bluer than Group I sources. There also appears to be a
smooth trend between disk color and surface brightness. The HBe disks have a much
higher surface brightness than predicted by passive flared disk models. We also note
that the fraction of Group II sources in HBe systems is much smaller than in HAe
systems. This seems to hold true even for the larger sample of HAe/Be stars whose
ISO SEDs were analyzed in B. Acke’s Thesis.
To motivate the choice of observables plotted in Fig 4.6 and to understand scaling
relations between disk size, MIR flux and stellar luminosity, we follow the radiative
transfer scheme and corresponding equations and notations presented in Chiang &
Goldreich [1997]. The calculations are simple and conserve energy only approxi-
mately. More sophisticated, semi-analytic radiative transfer calculations are pre-
sented in Calvet et al. [1991] and Chiang et al. [2001]. The circumstellar disk is
assumed to be a passive re-processor of stellar radiation. The model disk (Fig 4.7)
consists of 2 layers - (i) an optically thin surface layer that absorbs stellar radiation.
The super-heated dust in this layer radiates half of the IR radiation inward into the
disk and the other half is radiated outwards. (ii) the inner disk which is optically
thick to stellar radiation. The inner disk absorbs radiation from the surface layer
and re-radaites at longer wavelengths. The inner disk is assumed to be isothermal
perpendicular to the midplane.
The temperature of the surface layer is (Chiang & Goldreich [1997])
Tds ≈
(
1
ǫ0.25s
)
(
R∗
2R
)0.5
T∗ (4.2)
81
where ǫ is the ratio of planck-mean opacities of dust at the disk surface temper-
ature and the stellar effective temperature, R is the cylindrical radius, R∗ is stellar
radius and T∗ is the stellar effective temperature.
The inner disk can be divided into three regions. In region 1, the disk is opaque
to surface radiation and to its own radiation. The temperature in region 1 is
Ti ≈
(
α
4
)0.25 (R∗
R
)0.5
T∗. (4.3)
α is the grazing angle at which starlight strikes the disk. In the flaring region of the
disk, α can be approximated as
α ≈0.4R∗
R+ R
d
dR
(
H
R
)
, (4.4)
H is the height of the visible photosphere above the disk midplane. For a power-law
disk with H = CRγ (γ > 1),
α ≈0.4R∗
R+ CRγ−1, (4.5)
The temperature in region 2 of the inner disk, where the disk is optically thin to
its own radiation but opaque to radiation from the surface is
Ti ≈
(
α
4ǫiκV Σ
)0.25 (R∗
R
)0.5
T∗, (4.6)
κV is the dust opacity at visual wavelengths and Σ is the disk surface density.
82

HAe Color Brightness plot
-1.0 -0.5 0.0 0.5 1.0 1.5 2.0Color [-2.5log(Flux_12/Flux_25)]
0.001
0.010
0.100
Sur
face
brig
htne
ss [f
lux/
(mas
)^2]
II
IIIIB
II II
I
IIB II?
II
IB
II
lower limit
HBe Color Brightness plot
-1.0 -0.5 0.0 0.5 1.0 1.5 2.0Color [-2.5log(Flux_12/Flux_25)]
0.001
0.010
0.100
Sur
face
brig
htne
ss [f
lux/
(mas
)^2]
IB
IB
IB
III
IIB
IB
IB
III
IIIB
I
I
IB
IB
γ = 1.1
γ = 1.38
γ = 1.15
lower limit
Figure 4.6 Surface brightness vs color. a) Top Panel. Surface brightness vs color plotfor Herbig Ae stars. b) Botttom Panel. Surface brightness vs color plot for HerbigBe stars. The 10µm sizes and fluxes were measured with the Keck Segment TiltingExperiment. The x axis plots IRAS colors. Binaries are labeled B, and the Groupsare indicated as I, II or III. Group III sources have large accretion rates/envelopesand cannot be treated in the framework of passive disk systems.The solid-red line is a theoretical brightness vs color curve obtained for the diskmodels described in Fig 4.8. The disk-flaring parameter ‘γ’ is marked in the lowerpanel.
83

Figure 4.7 Chiang & Goldreich [1997] 2-layer passive-disk model. An inner rim hasbeen added. Stellar radiation reaches the flared surface at an angle α. Starlight isabsorbed in the surface layer, half of which is emitted to infinity and the other halfheats the disk interior.
At large radii, the inner disk is transparent to the surface radiation as well and
the temperature in this region is given by
Ti ≈
(
αǫs
4ǫi
)0.25 (R∗
R
)0.5
T∗ (4.7)
In addition to the flared disk, the inner rim also contributes to MIR emission.
The radius of the inner rim is given by Revp (see Isella et al. [2006]; Calvet et al.
[1991]) is
Revp [AU] = 0.034 [AU]
(
1500K
Tevp
)2 [(L∗
L⊙
)
(
B +1
ǫ
)
]1/2
, (4.8)
L∗ is luminosity of the star in solar units and Tevp is dust sublimation temperature.
B is a dimensionless diffuse heating term, characterizing the rim optical depth to its
own thermal emission. The thickness of the rim depends on dust composition and
spatial distribution (Chapter 2).
Equations (4.2), (4.3), (4.6), (4.7) and (4.8) show that for a fixed temperature, the
size of the emitting region depends on dust composition, the disk flaring parameter
84

γ (γ controls α) and L0.5∗
. The SED for a face-on disk can be computed from
Lν = 8π2ν∫ Ro
Ri
RdR∫ +∞
−∞
dzdτν
dze−τνBν(T). (4.9)
(4.9) can be approximated as
Lν ∼ 8π2R2νBν(T)τν ∼ αL∗/2 (4.10)
for the surface layer and as
Lν ∼ 8π2R2σT 4i ∼ αL∗/2 (4.11)
for the opaque interior.
Equations (4.10) and (4.11) show that the disk color, which is the ratio of fluxes at
two wavelengths is independent of stellar luminosity and depends on disk geometry
and dust distribution. The surface brightness of the disk which is given by
Lν/(size)2 ∼ αL∗/L∗ (4.12)
is also independent of stellar luminosity. Both surface brightness and color are in-
dependent of distance (many YSO distances are not well known). Thus, we argue
that plotting MIR surface brightness vs color (Fig 4.6) is a good way to probe disk
geometry.
To study the dependence of surface brightness and color on disk geometry, we
constructed a series of disk models with flaring parameter γ varying between 1.1
and 1.38 (Fig 4.8). The disks are composed of 1.2µm grains, have a total mass
of 0.01M⊙ with a gas to dust mass ratio of 100:1. The surface density varies as
(radius)−1. The central star is blackbody with Teff = 10,000K and luminosity 45L⊙.
85

Disk Surface Shape
0.1 1.0 10.0 100.0Radius [A.U]
0.0
0.1
0.2
0.3
z/R
γ=1.38
γ=1.34
γ=1.3
γ=1.25
γ=1.2
γ=1.15
γ=1.10
Figure 4.8 Disk geometries used to construct theoretical color-brightness track. Thefigure shows the τ=1 surface at 5500A. The y axis is the polar angle (0 is the mid-plane) in radians.
The radiative transfer was computed using TORUS (Chapter 2). The solid green
line in Fig 4.6 shows the model surface brightness-color relationship. For γ=1.1, the
MIR emission entirely arises in the inner rim. The surface brightness is high and the
disk appears blue at MIR wavelengths. As γ is increased, the flared disk becomes the
dominant MIR flux contributor. The disk becomes redder and the surface brightness
falls sharply. The theoretical track traces the observed trend for Herbig Ae stars.
However, Herbig Be stars typically have a much higher surface brightness for the same
color. This agrees well with NIR interferometry results (Eisner et al. [2004]; Monnier
et al. [2005]) showing that early Herbig Be stars are too small to be consistent with
the size-lumionosity relations found for lower luminosity stars. The smaller size and
the larger surface brightness might be caused by high accretion rates in these systems,
in which case passive disk models are not appropriate.
86

For Herbig Ae sytems, our results lend support to previous work (Dullemond &
Dominik [2004]; Leinert et al. [2004]; Acke & van den Ancker [2004b]) arguing that
Group I sources are more flared than Group II sources. Acke & van den Ancker
[2004b] demonstrated that Group I sources have a smaller amount of cold grains
than Group II sources based on sub-mm SED slopes. Under the assumption that
grains grow as disks evolve in time, Acke & van den Ancker [2004b] favor an evolution
scenario where Group I sources transition to Group II sources.
The work presented here is preliminary and we will be refining our calculations
and arguments for a journal publication in the near future. We will also be investi-
gating the influence of companions on our interpretation of the data.
4.3 The Circumbinary Disk in V892 Tau
Here, we present the discovery of a circumbinary disk around the Herbig Be system
v892 Tau first reported in Monnier et al. [2008a]. v892 Tau (Elias-1, Elias 3-1) is a
young stellar object in the Taurus-Aurigae star forming region (d = 140 pc, Kenyon
et al. [1994]). Its visible spectrum is classified as spectral type B8V (Hernandez et al.
[2004]). The spectral energy distribution (SED) of v892 Tau is dominated by bright
thermal emission in the mid-infrared (Hillenbrand et al. [1992]), with relatively large
line-of-sight extinction in the visible. Despite being one of the closest Herbig stars
and after decades of multi-wavelength observations, the nature of v892 Tau is still
uncertain.
The SED suggests v892 Tau is either a young embedded Class I source (Lada
[1987]) still surrounded by its nascent envelope or a more evolved, Class II object (i.e,
87

Herbig Ae/Be star) seen through its edge-on disk. Indeed, recent studies (Robitaille
et al. [2006]) suggest between 7-20% of disk objects would appear embedded due to
geometrical projection when based solely on SED analysis. Spatially-resolved imaging
can easily distinguish between these two scenarios, and early speckle interferometry
(Kataza & Maihara [1991]; Haas et al. [1997]; Leinert et al. [2001]) suggested the
presence of an extended and elongated nebula in the near-infrared that could be due
to scattering in bipolar lobes.
The high-resolution speckle imaging of Smith et al. [2005] clearly resolved the
K band (λ = 2.2µm) emission to be coming from two unresolved stars in v892 Tau
with little or no sign of a nebula or extended emission. The two stars of roughly
equal brightness had an apparent separation of 55 milliarcseconds (7.7 AU) and
some evidence of orbital motion was seen between epochs separated by 7 years.
Although this binary should have a dramatic effect on the infrared emission,
carving out a large hole in the circumbinary disk, recent analysis of the SED of
v892 Tau including ISO data (Acke & van den Ancker [2004a]) uncovered no distinct
signature of the underlying binary1. Other workers (Liu et al. [2005, 2007]) made
use of the technique of nulling interferometry in the mid-infrared (λ = 10.3µm) to
marginally resolve v892 Tau (FWHM ∼20 AU) along PA 164 consistent with normal
(single-star) disk emission.
To resolve these some of these mysteries, we observed v892 Tau with the Keck
Segment Tilting Experiment (λ0 = 10.7µm, ∆λ =1.55µm) on UT2004Aug31, UT
1Acke & van den Ancker [2004a] did note strong PAH emission and anomalousinfrared colors.
88
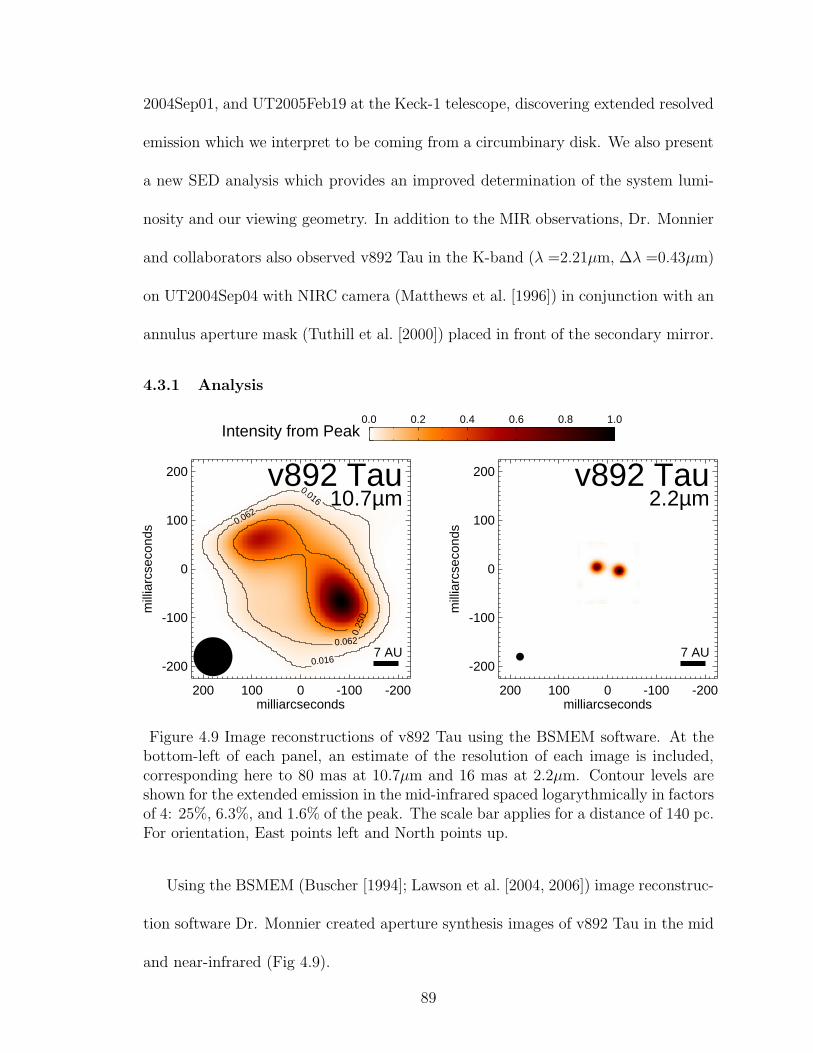
2004Sep01, and UT2005Feb19 at the Keck-1 telescope, discovering extended resolved
emission which we interpret to be coming from a circumbinary disk. We also present
a new SED analysis which provides an improved determination of the system lumi-
nosity and our viewing geometry. In addition to the MIR observations, Dr. Monnier
and collaborators also observed v892 Tau in the K-band (λ =2.21µm, ∆λ =0.43µm)
on UT2004Sep04 with NIRC camera (Matthews et al. [1996]) in conjunction with an
annulus aperture mask (Tuthill et al. [2000]) placed in front of the secondary mirror.
4.3.1 Analysis
200 100 0 -100 -200milliarcseconds
-200
-100
0
100
200
mill
iarc
seco
nds
v892 Tau10.7µm
7 AU
0.25
0
0.062
0.062
0.016
0.016
200 100 0 -100 -200milliarcseconds
-200
-100
0
100
200m
illia
rcse
cond
s
v892 Tau2.2µm
7 AU
0.0 0.2 0.4 0.6 0.8 1.0 Intensity from Peak
Figure 4.9 Image reconstructions of v892 Tau using the BSMEM software. At thebottom-left of each panel, an estimate of the resolution of each image is included,corresponding here to 80 mas at 10.7µm and 16 mas at 2.2µm. Contour levels areshown for the extended emission in the mid-infrared spaced logarythmically in factorsof 4: 25%, 6.3%, and 1.6% of the peak. The scale bar applies for a distance of 140 pc.For orientation, East points left and North points up.
Using the BSMEM (Buscher [1994]; Lawson et al. [2004, 2006]) image reconstruc-
tion software Dr. Monnier created aperture synthesis images of v892 Tau in the mid
and near-infrared (Fig 4.9).
89

The mid-infrared image shows elongated emission, approximately 320 mas by
180 mas in full extent, elongated along PA 50. The two bright lobes in the image are
separated by 210 mas (30 AU) with the south-west side being significantly brighter.
A two-dimensional Gaussian fit to the visibility data gives a FWHM 244±6 mas ×
123±9 mas along PA 49±1. A more suitable model for a circumbinary or transitional
disk would be a tilted and asymmetric ring of emission that is nearly unresolved along
the minor axis. Following the parameterization of Monnier et al. [2006], Dr. Monnier
fitted a “skewed asymmetric ring model” to the interferometry data here to better
estimate the inner hole diameter. The best fitting model had an inner-hole diameter
of 247×121 mas (35×17 AU) along PA 53, with a 40% skew along PA 284 (the
thickness of the ring followed a gaussian profile with a FWHM of 25% ring radius).
For purposes of §4.3.2, we will assume the central hole in the circumbinary disk has
a radius of 17.5 AU. The scale of the MIR emission is more than 4× larger than the
separation of the binary at the heart of this system, and the elongation is along a
distinctly-different position angle.
Figure 4.9 shows the BSMEM image of v892 Tau at 2.2µm. The binary nature of
this target as first reported by Smith et al. [2005] is confirmed here. Combining the
new binary measurement (at 2004.67) with the 1996.75 and 2003.76 measurements
from Smith et al. [2005], Dr. Monnier obtained rough estimates for the binary pa-
rameters. The best fit parameters are e =0.1, P = 13.6 yrs, a = 73.5 mas (10 AU),
i = 64.4, ω = 224.4, Ω = 33.6 and TO = 55355.8 MJD.
90
4.3.2 Discussion and Conclusion
We interpret the mid-infrared emission of v892 Tau as a circumbinary disk based
on several arguments. The MIR emitting region is much larger than the separation
between the binary components, ruling out models which have all the MIR emis-
sion coming from disks around the individual stars. In theoretical models of tidal
truncation (Artymowicz & Lubow [1994]), the circumbinary disk has an inner hole
approximately 1.8-2.6× larger than the semi-major axis of the binary system (for
eccentricity between 0 and 0.25). For comparison, our best estimates of the hole
radius and orbital semi-major axis are 17.5 AU and 10 AU respectively – giving a
ratio of 1.75 which is close to the theoretical expectation. Additionally, the position
angle and derived inclination angle of the mid-infrared emission (PA∼50, i ∼60) is
similar to those derived from the orbit (PA∼34, i ∼64) and the mild asymmetry
in the mid-IR emission suggests dynamical interactions between an eccentric binary
and the surrounding disk (via resonances or disk warping).
We further test the circumbinary disk hypothesis by analyzing the spectral en-
ergy distribution (SED). The SED shows a large mid-IR bump similar to that seen
in “transitional” disks (Calvet et al. [2002]; Espaillat et al. [2007]). By reddening
template Kurucz spectra for B8V stars, we can fit the near-IR emission with mostly
photospheric light (some NIR emission from hot dust is allowed but not well con-
strained) assuming AV = 10.95 yielding a combined stellar luminosity of 400 L⊙,
reasonable for two B8V stars. Our new proposed SED decomposition for v892 Tau
can be found in Figure 4.10, showing that the rising MIR flux can be roughly char-
acterized as a T∼ 450 K blackbody, consistent with emission from the warm inner
91
wall of the circumbinary disk.
Using equation (2.9), the predicted radius for the warm inner wall for the above
stellar luminosity (assuming 0.25 µm dust grains) is 18 AU – consistent with our
derived inner hole radius of 17.5 AU based on imaging. Furthermore, we find that
the scale height of this wall at 18 AU is ∼ 1.8 AU (Dullemond et al. [2001]) which
can produce the observed line-of-sight AV ∼ 11 for the disk inclination of ∼65o. This
latter phenomena may not be widely appreciated – circumbinary (or transitional)
disks have warm puffed-up inner walls (the rim scale height is a stronger function of
radius than temperature) at large radii that effectively increases the possibility that
central stars will be obscured or at least reddened as seen by distant observers.
In the following chapter, we generate models that explain the SED (Appendix
B), NIR interferometry from CHARA (Chapter 3) and MIR interferometry from the
Keck Segment Tilting Experiment for Herbig Ae stars MWC275 and AB Aur.
92
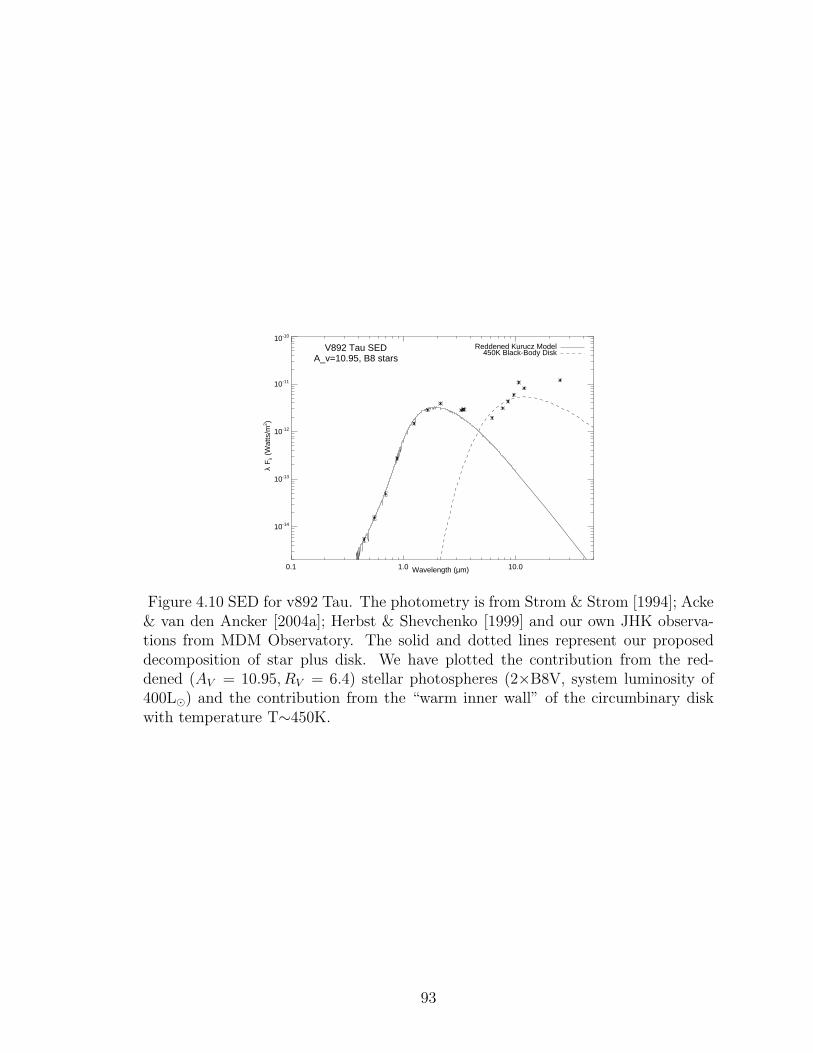
0.1 1.0 10.0
10-14
10-13
10-12
10-11
10-10
λ F
λ (W
atts
/m2 )
Wavelength (µm)
V892 Tau SEDA_v=10.95, B8 stars
Reddened Kurucz Model450K Black-Body Disk
Figure 4.10 SED for v892 Tau. The photometry is from Strom & Strom [1994]; Acke& van den Ancker [2004a]; Herbst & Shevchenko [1999] and our own JHK observa-tions from MDM Observatory. The solid and dotted lines represent our proposeddecomposition of star plus disk. We have plotted the contribution from the red-dened (AV = 10.95, RV = 6.4) stellar photospheres (2×B8V, system luminosity of400L⊙) and the contribution from the “warm inner wall” of the circumbinary diskwith temperature T∼450K.
93

Chapter 5
Comprehensive Models for SED and
Interferometry
Abstract: We present comprehensive models for the Herbig Ae stars MWC275
and AB Aur that aim to explain their spectral energy distribution (from UV to
millimeter) and long baseline interferometry (from near-infrared to millimeter) si-
multaneously. Data from the literature, combined with new mid-infrared (MIR)
interferometry from the Keck Segment Tilting Experiment, are modeled using an
axisymmetric Monte Carlo radiative transfer code. Models in which most of the
near-infrared (NIR) emission arises from a dust rim fail to fit the NIR spectral energy
distribution (SED) and sub-milli-arcsecond NIR CHARA interferometry. Following
Chapter 3, we include an additional gas emission component with similar size scale
to the dust rim, inside the sublimation radius, to fit the NIR SED and long-baseline
NIR interferometry on MWC275 and AB Aur. In the absence of shielding of star
light by gas, we show that the gas-dust transition region in these YSOs will have to
contain highly refractory dust, sublimating at ∼1850K. Despite having nearly iden-
tical structure in the thermal NIR, the outer disks of MWC275 and AB Aur differ
substantially. In contrast to the AB Aur disk, MWC275 lacks small grains in the
disk atmosphere capable of producing significant 10-20 µm emission beyond ∼7AU,
94
forcing the outer regions into the “shadow” of the inner disk.
5.1 Introduction
Most interferometric studies of Herbig Ae (HAe) stars have relied on simple geo-
metric models (Mannings & Sargent [1997]; Millan-Gabet et al. [1999, 2001]; Eisner
et al. [2003, 2004]; Monnier et al. [2005]) that explain the emission geometry of the
system in only narrow wavelength ranges. This method, albeit extremely useful in
elucidating some of the morphology details, is not adequate for exploring the interde-
pendency in structure of the inner and outer parts of the disk. A number of studies
(Dullemond et al. [2001]; Dullemond & Dominik [2004]; van Boekel et al. [2005]) have
shown that the structure of the inner disk at fractions of an AU scale clearly affects
the structure of the outer disk. A complete understanding of the circumstellar disk
structure in HAe stars therefore requires models that simultaneously explain the SED
and interferometry over a large wavelength range. Such models have begun to appear
in the literature only recently (Pontoppidan et al. [2007]; Kraus et al. [2008a]).
In this chapter, we develop comprehensive disk models to explain the SED and
interferometry of the HAe stars MWC275 and AB Aur. MWC275 and AB Aur are
prototype pre-main-sequence stars of similar ages and spectral type with extensive
circumstellar disks. Due to the availability of photometric and interferometric data
over a large wavelength range, MWC275 and AB Aur are ideal candidates for testing
disk models for YSOs. The extent of their circumstellar-dust disks was first measured
by Mannings & Sargent [1997] to be several 100AU using the Owens Valley Radio
Observatory (OWRO). Natta et al. [2004] resolved the MWC275 disk in the mm and
95
reported a de-convolved dust-disk size of 300AU×180AU. More recently, Isella et al.
[2007] analyzed IRAM, SMA and VLA continuum and 12CO, 13CO and 18CO line
data constraining the gas-disk radius to be 540AU with the gas in Keplerian rotation
around the central star. Scattered light studies of MWC275 (Grady et al. [2000])
and AB Aur (Grady et al. [1999]; Oppenheimer et al. [2008]) show the presence of
arcs and rings in the circumstellar disk. Corder et al. [2005] resolved the AB Aur
CO disk radius to be ∼600AU, finding strong evidence for Keplerian rotation for the
bulk of the disk. Corder et al. [2005] and Lin et al. [2006] detected spiral arms in
CO emission with radii of ∼150AU, while Fukagawa et al. [2004] detected similar
structure in Subaru H-band scattered light images. AB Aur also has substantial
envelope material on scales larger then 600 AU (Grady et al. [1999]; Semenov et al.
[2005]; Corder et al. [2005]; Lin et al. [2006]).
As discussed in Chapter 4, MIR emission probes the giant planet formation region
in circumstellar disks (Calvet et al. [1991]; Chiang & Goldreich [1997]; Dullemond
et al. [2001]) with the emission arising from warm dust (T > 150K). Meeus et al.
[2001] and van Boekel et al. [2005] used the 10µm MIR silicate emission feature from
MWC275 and AB Aur to show that dust grains in these systems had grown larger
than the typical interstellar medium grain sizes. Marinas et al. [2006] imaged AB Aur
at 11.7µm and found the emission FWHM size to be 17±4 AU consistent with the
flared disk models of Dullemond & Dominik [2004]. In this chapter, we present
new 10µm measurements of AB Aur and MWC275 with the Keck Segment Tilting
Experiment (described in §5.2, Monnier et al. [2004]). In contrast to AB Aur, the
MWC275 disk is unresolved by the Segment Tilting Experiment (maximum baseline
96

of 10m), requiring the VLT Interferometer (100m baseline) to probe to its MIR
structure (Leinert et al. [2004]). These observations suggest that MWC275 disk
differs considerably from AB Aur and we present a detailed comparison of the two
disk structures in the discussion (§5.6).
Thermal NIR emission probes hot regions (typically the inner AU) of the disk
with temperatures greater than 700K. The NIR disks of MWC275 and AB Aur
were first resolved with IOTA by Millan-Gabet et al. [1999, 2001] and subsequently
observed at higher resolution with PTI (Eisner et al. [2004], Keck Interferometer
(Monnier et al. [2005]), and the CHARA interferometer array (Tannirkulam et al.
[2008]). In Chapter 3, we showed that inner-disk models in which the majority of the
K-band emission arises in a dust rim (Dullemond et al. [2001]; Isella & Natta [2005];
Tannirkulam et al. [2007]) fail to fit the CHARA data at milli-arcsecond resolution.
We also demonstrated that the presence of additional NIR emission (presumably from
hot gas) inside the dust destruction radius can help explain the CHARA data and
the NIR SED. First calculations for the effects of gas on rim structure (Muzerolle
et al. [2004]) showed that for plausible disk parameters, presence of gas does not
modify dust-rim geometry significantly. Besides a poorly understood interferometric
visibility profile, MWC275 also displays as yet ill-understood NIR and MIR SED
time variability (Sitko et al. [2008]) which has been interpreted as variations of the
inner disk structure. In §5.4 and §5.5 we present a detailed analysis of the NIR
visibility and SED for MWC275 and AB Aur, placing constraints on the wavelength
dependence of the opacity source inside the dust destruction radius.
In this study, we focus on (i) explaining the inner-disk structure and discuss
97
important open problems and (ii) modeling the MIR emission morphology of the
disks and the shape of the MIR spectrum. The chapter is organized into 7 sections
with §5.2 detailing the observations. §5.3 explains the disk model and the modeling
strategy. §5.4 and §5.5 analyze MWC275 and AB Aur SED and visibilities in relation
to the disk models. We present a discussion on our results and our conclusions in
§5.6 and §5.7 respectively.
5.2 New Observations and Literature Data
The properties of the circumstellar disks in MWC275 and AB Aur have been con-
strained using IR and mm interferometry and the SED. We include NIR interferom-
etry from the CHARA array presented in Chapter 3, MIR interferometry from the
Keck Segment Tilting Experiment and mm interferometry from the literature in our
analysis. Optical and NIR photometry obtained at the MDM Observatories, and
mid and far-infrared data from ISO are also included to constrain model SED. We
describe the data in detail in the following paragraphs.
MW275 and AB Aur were observed with the Keck Segment Tilting Experiment
(Chapter 4) to study their MIR emission morphology. The calibrated data are listed
in Table 5.1. In addition to the Keck Segment Tilting data, we also include MWC275
MIR intereferometry from VLTI-MIDI (Leinert et al. [2004]) in our analysis.
Millimeter interferometry from Mannings & Sargent [1997], Natta et al. [2004],
Semenov et al. [2005], Lin et al. [2006] and Isella et al. [2007] are used to constrain the
circumstellar disk masses and disk sizes and surface density profile. In conjunction
with the interferometry, the shape of the mm SED provides information on sizes of
98

Table 5.1 Keck Segment Tilting uv-averaged data for MWC275 and AB Aur.UT-Date Baseline(m) Calibrated Calibrator
of Observation Visibility NamesMWC275
2004Sep01 3.03 0.969±0.049 v3879 Sgr” 4.72 0.944±0.040 ”” 5.49 0.946±0.036 ”” 7.21 0.942±0.033 ”” 8.43 0.963±0.033 ”
AB Aur2004Aug30, 31 & 3.03 0.870±0.039 iota Aur
Sep01” 4.72 0.823±0.027 ”” 5.49 0.807±0.033 ”” 7.21 0.753±0.047 ”” 8.43 0.708±0.039 ”
the dust grains in the bulk of the circumstellar disks.
To constrain the SED computed from radiative transfer models we obtained op-
tical and NIR photometry on MWC275 and AB Aur with the MDM 2.4m telescope
at Kitt Peak (refer §B.2). Due to the high brightness of our targets, we defocussed
the telescope during observations to avoid camera saturation. After bias correction,
flat fielding, and background subtraction, the reduced images were used to obtain
source counts using ATV - an aperture photometry code (Barth [2001]). Targets
were calibrated using Landoldt standards (Landolt [1983]). The calibrated UBVRI-
JHK photometry are listed in Tables B.2 and B.3 in the Appendix. We also include
photometry for a number of other YSOs that we observed. NIR photometry from
Sitko et al. [2008] , mid and far-IR SED from Meeus et al. [2001] and mm fluxes
(Mannings & Sargent [1997]; Natta et al. [2004]; Semenov et al. [2005]; Lin et al.
[2006]) were also used in the model analysis. van Boekel et al. [2005] modeled the
10µm spectra of a large sample of Herbig Ae stars and derived the mineralogy and
99

Table 5.2. Basic stellar properties and photometry for MWC275.
Property Value
RA 17h 56m 21.29s
Dec −21o 57′
21.8′′
Spectral Type A1ea
Teff 9500Ka
Luminosity 36 L⊙a
Distance 122pca
Mass 2.3M⊙a
U -B 6.98±.08bmagV 6.84±.06bmagR 6.86±.05bmagI 6.71±.07bmagJ 6.20±.08bmagH 5.48±.07bmagK 4.59±.08bmag
aStellar parameters from Mon-nier et al. [2006], Natta et al.[2004] and references therein.
bPhotometry obtained atMDM Observatories (longitude:−111.67o, latitude:31.95o) in 2006June.
typical grain sizes responsible for the emission. We use results from van Boekel et al.
[2005] for fixing the composition of dust grains in the atmosphere of the MWC275
and AB Aur disks.
A compilation of stellar properties and circumstellar disk properties extracted
from the literature is listed in Tables 5.2, 5.3, 5.4 and 5.5.
5.3 Circumstellar Disk Modeling
The circumstellar material around MWC275 and AB Aur is modeled as a passive
dust disk reprocessing stellar radiation (Dullemond et al. [2001]). The disk is in
100

Table 5.3. Basic stellar properties and photometry for AB Aur.
Property Value
RA 04h 55m 45.84s
Dec +30o 33′
04.29′′
Spectral Type A0pea
Teff 9772Ka
Luminosity 47 L⊙a
Distance 144pca
Mass 2.4M⊙a
U 7.18±.08bmagB 7.14±.04bmagV 7.01±.04bmagR 6.96±.05bmagI 6.70±.09 bmagJ 5.99±.05bmagH 5.28±.05bmagK 4.37±.05bmag
aStellar parameters from Mon-nier et al. [2006], Isella et al. [2006]and references therein.
bPhotometry obtained at MDMObservatories in 2005 December.
Table 5.4. MWC275 disk properties from the literature.
Dust Disk
Mass 0.0007M⊙a
Dust to Gas Ratio 0.01Surface Density Profile r−1 a,b
Outer Radius 200 AU b
Inclination 48o±2o (this work, c)Position Angle 136o±2o (this work, c)
Relative Mass Fractions of µm and sub-µm grains in the disk atmosphered
0.1µm silicates 1.5µm silicates PAH0.19+0.009
−0.018 0.8+0.05−0.04 0.01+0.001
−0.001
aNatta et al. [2004]
bIsella et al. [2007]
cWassell et al. [2006]
dvan Boekel et al. [2005]
101
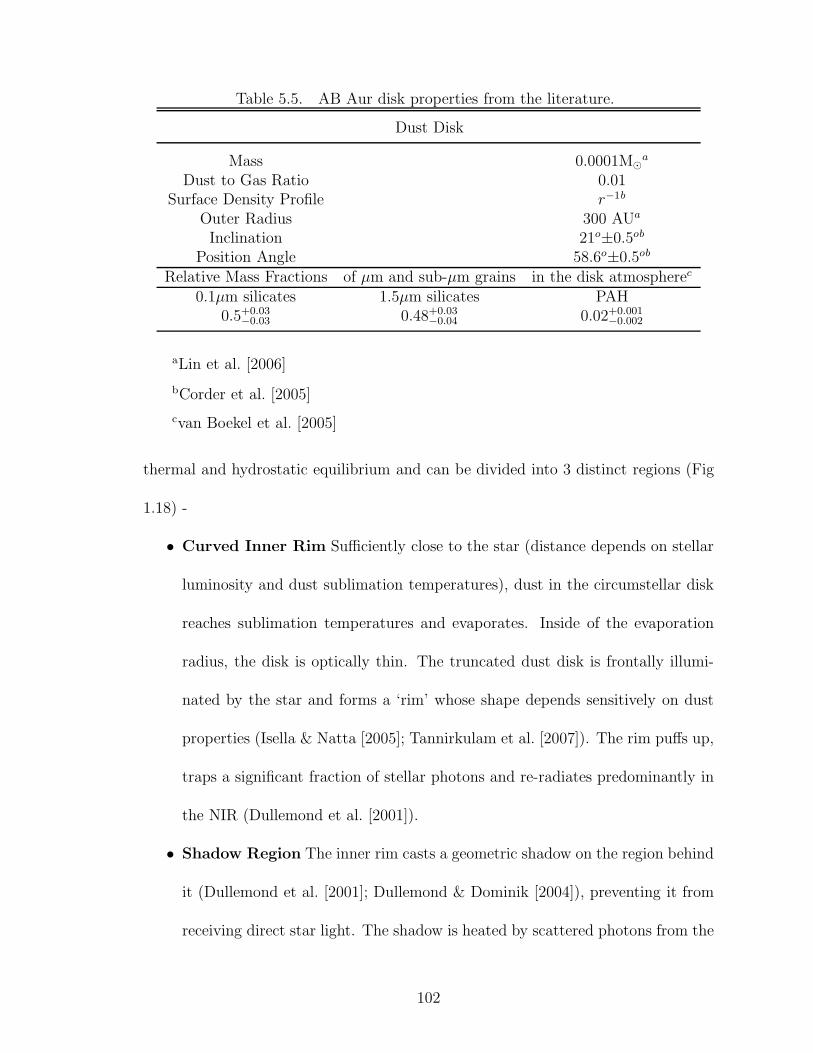
Table 5.5. AB Aur disk properties from the literature.
Dust Disk
Mass 0.0001M⊙a
Dust to Gas Ratio 0.01Surface Density Profile r−1b
Outer Radius 300 AUa
Inclination 21o±0.5ob
Position Angle 58.6o±0.5ob
Relative Mass Fractions of µm and sub-µm grains in the disk atmospherec
0.1µm silicates 1.5µm silicates PAH0.5+0.03
−0.03 0.48+0.03−0.04 0.02+0.001
−0.002
aLin et al. [2006]
bCorder et al. [2005]
cvan Boekel et al. [2005]
thermal and hydrostatic equilibrium and can be divided into 3 distinct regions (Fig
1.18) -
• Curved Inner Rim Sufficiently close to the star (distance depends on stellar
luminosity and dust sublimation temperatures), dust in the circumstellar disk
reaches sublimation temperatures and evaporates. Inside of the evaporation
radius, the disk is optically thin. The truncated dust disk is frontally illumi-
nated by the star and forms a ‘rim’ whose shape depends sensitively on dust
properties (Isella & Natta [2005]; Tannirkulam et al. [2007]). The rim puffs up,
traps a significant fraction of stellar photons and re-radiates predominantly in
the NIR (Dullemond et al. [2001]).
• Shadow Region The inner rim casts a geometric shadow on the region behind
it (Dullemond et al. [2001]; Dullemond & Dominik [2004]), preventing it from
receiving direct star light. The shadow is heated by scattered photons from the
102

rim edge and through diffusion. The size of the shadow depends on the rim
geometry, mass of dust in the outer disk and dust grain properties in the outer
disk.
• Flared Disk If sufficient dust is present in the outer disk, the disk eventually
emerges from the shadow and “flares”. The flared disk emits radiation in the
MIR and longer wavelengths.
Details of the modeling procedure and comparison to data are described below.
5.3.1 The Monte Carlo Transfer Code - TORUS
The calculations in this chapter were performed using the torus Monte-Carlo radiative-
transfer code (Harries [2000]; Harries et al. [2004]; Kurosawa et al. [2004], Chapter
2). Radiative equilibrium is computed using Lucy’s (Lucy [1999]) algorithm on a
two-dimensional, cylindrical adaptive-mesh grid. The initial density structure for
the disk calculations is based on the canonical description of the α-disk developed
by Shakura & Sunyaev [1973], viz
ρ(r, z) = ρ0
(
r
r0
)−α
exp
[
−1
2
z2
h(r)2
]
(5.1)
where r is the radial distance in the mid-plane, r0 is some characteristic radius, z is
the distance perpendicular to the mid-plane, and h(r) is the scaleheight, given by
h(r) = h0
(
r
r0
)β
(5.2)
with parameters of α = 2.125 and β = 1.125, giving a radial dependence of the
surface density of Σ(r) ∝ r−1.0. Once the temperature (we assume that the disk
is in local thermodynamic equilibrium passively heated by the star, and gas and
103
dust are thermally coupled) and dust sublimation (see next paragraph) structures
have converged using the Lucy algorithm, the vertical disk structure is modified
via the equation of hydrostatic equilibrium following a similar algorithm to that
detailed by Walker et al. [2004]. A self-consistent calculation for dust sublimation
and disk temperature followed by a hydrostatic equilibrium calculation is repeated
until the disk density structure has converged. Convergence is typically achieved in
four iterations. Images and SEDs are subsequently calculated using a separate Monte
Carlo algorithm based on the dust emissivities and opacities (Harries [2000]). The
shape of the dust evaporation front is computed following Chapter 2.
We use Kurucz (Kurucz [1970]) stellar atmosphere models as input spectra for
the stars. We consider a mixture of 0.1, 1.3 and 50 micron warm silicates (Ossenkopf
et al. [1992]) and power-law opacity mm grains (Mannings & Sargent [1997]; Natta
et al. [2004]) to model the opacity in the disk. The micron and sub-micron grain
mixture is based on work by Meeus et al. [2001] and van Boekel et al. [2005]. To keep
the analysis simple, the grain species are assumed to be well mixed with gas (Kamp
& Dullemond [2004]) following a delta function size distribution. Dust scattering is
not included in the models. Scattering does not seem to have significant impact on
disk structure and interpretation of infrared interferometry for HAe stars (Dullemond
& Natta [2003]; Pinte et al. [2008]).
During the course of our modeling and as outlined in Chapter 3, we realized that
an additional emission component (Fig 1.18) which we argue to be gas (§5.4.1), is
needed inside the dust destruction radius to explain the NIR SED and interferometry
of MWC275 and AB Aur. This additional component is not treated self consistently
104

in our modeling and is added after the dust-opacity-dominated circumstellar-disk
model converges in structure. Calculations by Muzerolle et al. [2004] have shown
that for parameters suitable to MWC275 and AB Aur, gas does not significantly
alter the structure of the dust rim, justifying our simple treatment for the NIR
emission geometry.
5.3.2 Comprehensive models for SED and Interferometry
To fit the SED and visibilities of MWC275 and AB Aur we adopted the following
algorithm: First, we computed models for the dust evaporation front as described
in §5.3.1. The inner edge of the dust disk is assumed to be dominated by grains
larger than 1 micron (Tuthill et al. [2001]; Isella et al. [2006]) and the evaporation
front shape is set by the density dependence of dust sublimation temperatures (Isella
& Natta [2005]; Tannirkulam et al. [2007]). The K-band visibilities are computed
for the model and compared with data. The normalization of the dust evaporation
law is then adjusted so that the model visibilities fit the visibility data before the
first visibility minimum. These models fail to fit the visibility beyond the minimum
and do not have sufficient emission to explain the observed NIR SED. Therefore an
additional emission component has been added inside the dust sublimation radius to
reconcile the model with the visibility data and NIR SED.
With the inner-rim parameters fixed, we next focus on MIR and the mm disk.
Millimeter interferometry results from the literature are used to fix disk masses and
sizes. The majority of the dust mass is placed in mm sized grains with a power-law
opacity function (Natta et al. [2004]). A small fraction (∼10%) of the dust mass is
105
in micron and sub-micron (small) grains with their relative mass fractions based on
literature results (Meeus et al. [2001]; van Boekel et al. [2005]). The physical extent
of small grains is constrained with MIR imaging and interferometry. The model is
then allowed to run to convergence. The model SED is compared with MIR and
far-infrared data, the mass of the small grain population is then adjusted and models
are recomputed until a good fit to the MIR and far-infrared SED is obtained.
The MIR visibilities are computed for the SED-converged model and compared
with the data and the spatial distribution of the small grain component is adjusted
until model visibilities match with data. The only free parameters in our models are
the absolute masses of the small grains, the mass of the 50µm silicate grain and their
spatial distribution. Each of the models is computationally expensive. To achieve
fast convergence, the parameter space was varied by hand, until a good fit was found
for the observable quantities.
5.4 MWC275: Analysis
MWC275 is a Herbig Ae star (refer to Table 5.2 for basic properties and photometry)
with a total luminosity of 36L⊙. The large stellar luminosity, coupled with the fact
that the mass accretion rate is ≤ 10−7M⊙/year (Garcia Lopez et al. [2006]) allows us
to ignore accretion heating and model the MWC275 circumstellar disk as a passive
disk, reprocessing stellar radiation (Chiang & Goldreich [1997]; Dullemond et al.
[2001]). For our models, we choose the MWC275 disk mass to be between 0.05-0.1
M⊙ (Natta et al. [2004]) and a surface density profile that varies radially as r−1 (Isella
et al. [2007]). The disk outer edge is truncated at 200AU and bulk (∼80%) of the
106

dust mass is assumed to reside in mm grains having an opacity with a wavelength
dependence of λ−1 at long wavelengths. Here, we describe in detail our modeling
results for the NIR and MIR morphology of MWC275.
5.4.1 The Thermal NIR Disk
Visibilities
Like many other Herbig Ae stars, MWC275 shows a strong NIR excess over stellar
photospheric values (Hillenbrand et al. [1992]). This excess has been traditionally
interpreted in terms of the dust disk being truncated by sublimation and forming
a ‘rim’. The rim intercepts stellar photons, re-radiatiing predominantly in the NIR
(Dullemond et al. [2001]; Isella & Natta [2005]; Tannirkulam et al. [2007]). How-
ever, in Chapter 3 we had conclusively shown that models in which all of the NIR
excess arises from dust rims alone cannot explain the CHARA interferometry data
on MWC275. Our arguments in Chapter 3 were brief. We present a more elaborate
analysis in this section.
MWC275 observations allow us to clearly detect the asymmetry of the MWC275
disk (see Appendix C), as having inclination=48o±2o, PA=136o±2o, consistent with
the inclination of 51+11−9 degrees, PA of 139o±15o determined in Wassell et al. [2006]
and inclination of 46o± 4o, PA of 128o±4o determined in Isella et al. [2007]. The
complete visibility data along each of the baselines are presented in Fig 5.2. Following
Chapter 3, we show the data in a concise manner in Fig 5.3 using the notion of an
“effective baseline” -
Beff = Bprojected
√
cos2(θ) + cos2(φ)sin2(θ)
107

where θ is the angle between the uv vector for the observation and the major axis of
the disk and φ is the inclination of the disk. Under the flat disk assumption, the effec-
tive baseline correctly accounts for the change in resolution due to the disk inclination
and PA (the geometry of thick disks is represented only approximately with optical
depth effects and 3-D geometry of thick disks not being taken into account), allowing
us to plot the visibility measurements as a function of one coordinate, simplifying
presentation and analysis.
We attempt at fitting the visibilities with a curved inner-rim model (the “stan-
dard” model) where the rim curvature (variation in cylindrical radius between rim
midplane and the atmosphere) is set by the density dependence of dust sublima-
tion temperatures, taken from Pollack et al. [1994]. In this model, silicate grains
sublimate at a higher temperature compared to other grains and hence fix the rim
location. The rim is assumed to be composed of 1.3µm grains, as larger grains do
not affect the rim shape and location significantly (Isella & Natta [2005]), at the
same time making numerical convergence slower due to strong back-warming effects
(Isella & Natta [2005]; Tannirkulam et al. [2007]). For silicate dust, the evaporation
temperature Tevp can be parameterized as
Tevp = G
[
ρgas(r, z)
1g cm−3
]γ
(5.3)
where G = 2000K, γ = 1.95× 10⁻² and ρgas is the density of gas in gcm−3 (see IN05
eq. [16]). This parameterization, derived from a fit to sublimation temperatures
recorded in the laboratory (Pollack et al. [1994]), produces a dust rim with an inner
edge at 0.36 AU (Fig 5.4a). The rim radius is too large to fit even the relatively
108
short baseline visibility data from IOTA (Figs 5.2 and 5.3). In order to fit the data
before the first visibility minimum, we had to increase the Tevp normalization-G by
∼30% from 2000K to 2600K. This increases the sublimation temperature at the base
of the rim from ∼1350K to ∼1800K (for physical implications refer §5.6). Fig 5.4b
shows the synthetic K-band image for the rim with the increased normalization. The
dashed line in Fig 5.2 traces the visibility for this model and provides a good fit to
the short baseline (< 100m) data.
However, as already demonstrated in Chapter 3, rim models which are sharply
truncated due to dust sublimation and produce all of the NIR excess, fail to fit
observations beyond the first visibility minimum. These models display bounces in
visibility at long baselines (not seen in the data) because of the presence of sharp ring-
like features with high spatial frequency components in the corresponding images,
even for the smoothest rims physically plausible. In Chapter 3, we showed that the
presence of a smooth emission component inside the dust destruction radius (Fig 5.4c)
providing 56% of the total K band emission helps fit the data well (solid line in Figs
5.2 and 5.3). The NIR visibility data cannot constrain the surface brightness profile
of the smooth emission component (we have adopted a constant surface brightness
profile - a Uniform Disk for simplicity), but can constrain the size scale of the emission
fairly robustly. Fig 5.5 shows a series of visibility curves where the smooth emission
component is fixed to be 56% of the total emission and the radius of the Uniform Disk
component is decreased by 15% successively from the initial radius of 0.23AU radius.
The model image is then rescaled to maintain a good visibility fit at baselines shorter
than 100m. It can be seen in Fig 5.5 that for Uniform Disk (UD) radii smaller than
109

0.19AU, the model visibilities begin to deviate significantly from the observations.
Thus, the CHARA data constrains the smooth emission component to be on the
same length scale as the dust sublimation rim filling the region between the disk and
the central star.
uv coverage for MWC275
400 200 0 -200 -400 u coordinate (m)
-400
-200
0
200
400
v c
oord
inat
e (m
)
iota dataKI datachara data S2W2 " " E1W1 " " S1W1 " " E2S2 " " W1W2 " " S2W1
PA of MWC 275 on sky
Figure 5.1 uv coverage for MWC275. We include data from KI (Monnier et al.[2005]), IOTA (Monnier et al. [2006]) and CHARA (Tannirkulam et al. [2008]) inour analysis. A position angle (measured East of North) of 136o for MWC275 ismarked in the left panel.
SED
Fig 5.6 shows the NIR SED for MWC275. Besides failing to explain the NIR in-
terferometry, the standard model also fails at producing sufficient NIR emission to
explain the MWC275 SED even in its ‘low’ state. In Chapter 3, we had shown that
110
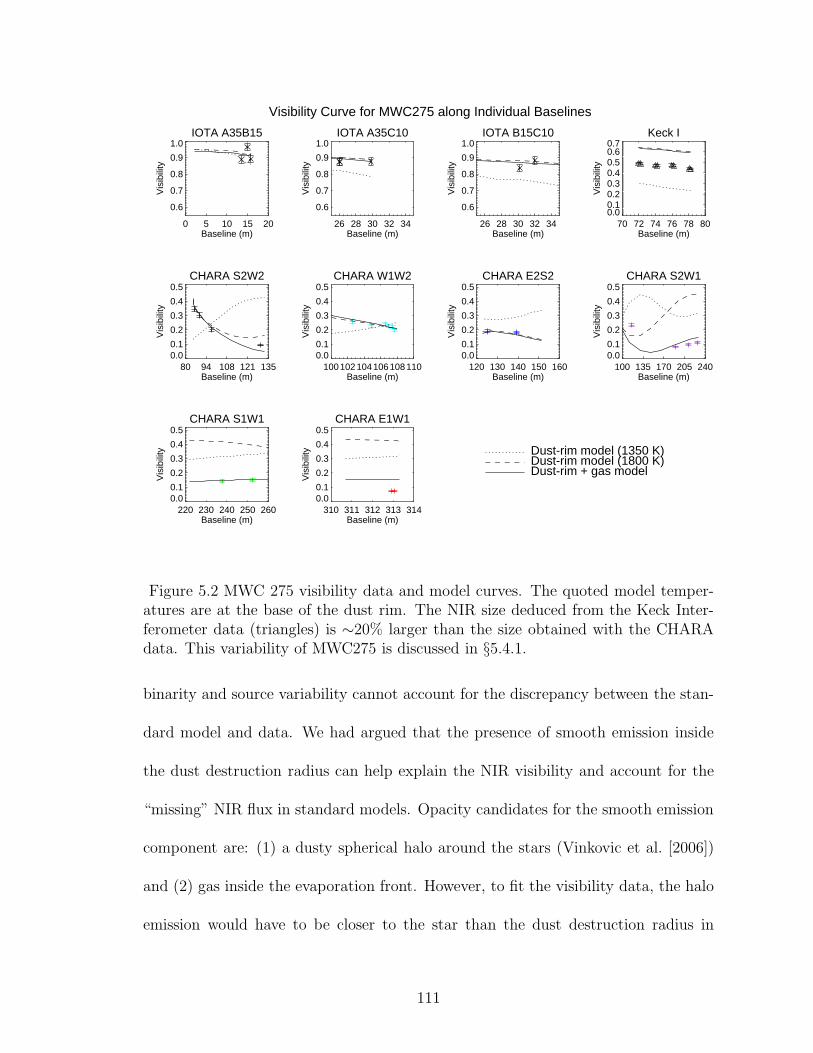
IOTA A35B15
0 5 10 15 20Baseline (m)
0.6
0.7
0.8
0.9
1.0
Vis
ibili
ty
IOTA A35C10
26 28 30 32 34Baseline (m)
0.6
0.7
0.8
0.9
1.0
Vis
ibili
ty
IOTA B15C10
26 28 30 32 34Baseline (m)
0.6
0.7
0.8
0.9
1.0
Vis
ibili
ty
Keck I
70 72 74 76 78 80Baseline (m)
0.00.10.20.30.40.50.60.7
Vis
ibili
ty
CHARA S2W2
80 94 108 121 135Baseline (m)
0.00.1
0.2
0.3
0.4
0.5
Vis
ibili
ty
CHARA W1W2
100102104106108110Baseline (m)
0.00.1
0.2
0.3
0.4
0.5
Vis
ibili
ty
CHARA E2S2
120 130 140 150 160Baseline (m)
0.00.1
0.2
0.3
0.4
0.5
Vis
ibili
ty
CHARA S2W1
100 135 170 205 240Baseline (m)
0.00.1
0.2
0.3
0.4
0.5
Vis
ibili
ty
CHARA S1W1
220 230 240 250 260Baseline (m)
0.00.1
0.2
0.3
0.4
0.5
Vis
ibili
ty
CHARA E1W1
310 311 312 313 314Baseline (m)
0.00.1
0.2
0.3
0.4
0.5
Vis
ibili
ty
Visibility Curve for MWC275 along Individual Baselines
Dust-rim model (1350 K)Dust-rim model (1800 K)Dust-rim + gas model
Figure 5.2 MWC 275 visibility data and model curves. The quoted model temper-atures are at the base of the dust rim. The NIR size deduced from the Keck Inter-ferometer data (triangles) is ∼20% larger than the size obtained with the CHARAdata. This variability of MWC275 is discussed in §5.4.1.
binarity and source variability cannot account for the discrepancy between the stan-
dard model and data. We had argued that the presence of smooth emission inside
the dust destruction radius can help explain the NIR visibility and account for the
“missing” NIR flux in standard models. Opacity candidates for the smooth emission
component are: (1) a dusty spherical halo around the stars (Vinkovic et al. [2006])
and (2) gas inside the evaporation front. However, to fit the visibility data, the halo
emission would have to be closer to the star than the dust destruction radius in
111

Visibility curve for MWC275
50 100 150 200 250 300 350Effective Baseline (m)
0.0
0.2
0.4
0.6
0.8
1.0
Vis
ibili
ty
Dust-rim model (1350K)Dust-rim model (1800K)
Dust-rim + gas model
iota dataKI datachara data S2W2 " " E1W1 " " S1W1 " " E2S2 " " W1W2 " " S2W1
Figure 5.3 MWC275 visibility vs ‘Effective Baseline’. Effective Baselines are usefulin presenting data along multiple uv vectors in a concise manner (under the as-sumption of axial symmetry). The NIR size deduced from the Keck Interferometerdata (triangles) is ∼20% larger than the size obtained with the CHARA data. Thisvariability of MWC275 is discussed in §5.4.1
the disk. This would require even higher dust-sublimation temperatures than the ∼
1850K we are adopting.
The most plausible physical mechanism for the smooth emission is hot gas. The
required emission levels to explain the long-baseline K-band visibility data can be
obtained with optically thin gas (τ ∼ 0.15) with a temperature range of 2000K-
3000K (Muzerolle et al. [2004]; Eisner [2007]). Assuming that the gas has sufficient
opacity to produce the difference in flux between the standard model and the observed
photometry, we can place limits on the wavelength dependence of gas opacity. Fig
5.7 plots limits on the gas opacity (normalized at K band) such that flux from the gas
component + the standard model falls within 10% of the observed photometry (we
112
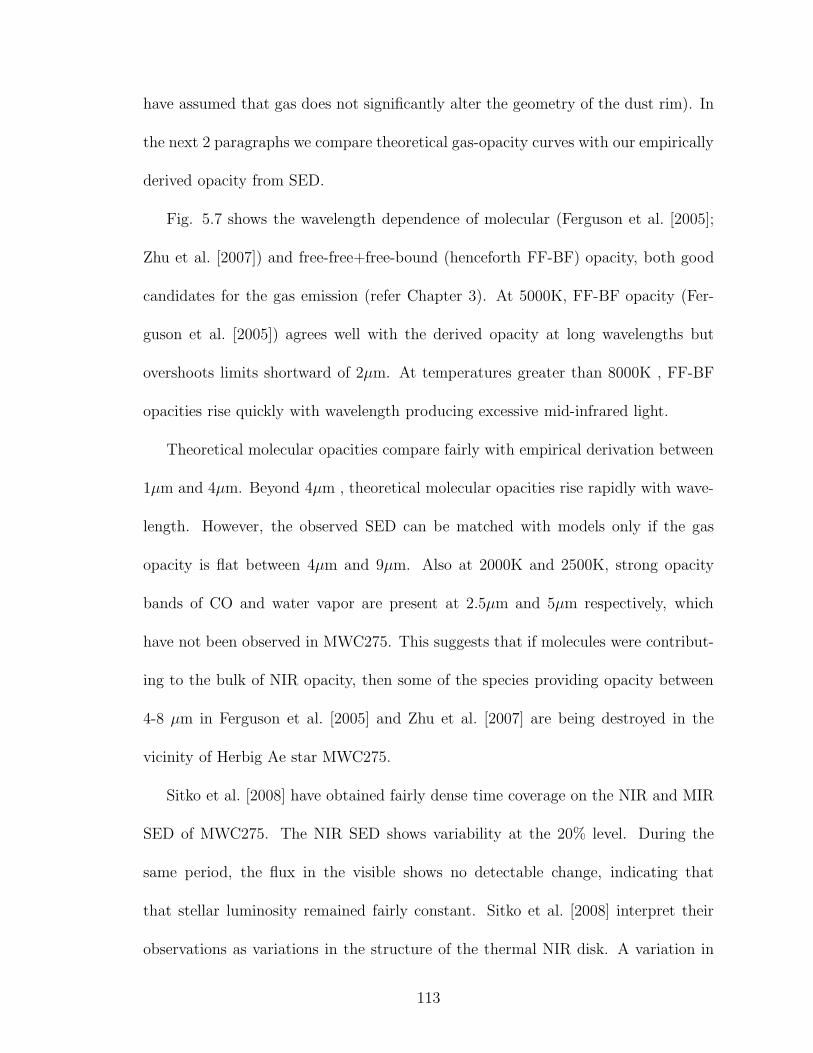
have assumed that gas does not significantly alter the geometry of the dust rim). In
the next 2 paragraphs we compare theoretical gas-opacity curves with our empirically
derived opacity from SED.
Fig. 5.7 shows the wavelength dependence of molecular (Ferguson et al. [2005];
Zhu et al. [2007]) and free-free+free-bound (henceforth FF-BF) opacity, both good
candidates for the gas emission (refer Chapter 3). At 5000K, FF-BF opacity (Fer-
guson et al. [2005]) agrees well with the derived opacity at long wavelengths but
overshoots limits shortward of 2µm. At temperatures greater than 8000K , FF-BF
opacities rise quickly with wavelength producing excessive mid-infrared light.
Theoretical molecular opacities compare fairly with empirical derivation between
1µm and 4µm. Beyond 4µm , theoretical molecular opacities rise rapidly with wave-
length. However, the observed SED can be matched with models only if the gas
opacity is flat between 4µm and 9µm. Also at 2000K and 2500K, strong opacity
bands of CO and water vapor are present at 2.5µm and 5µm respectively, which
have not been observed in MWC275. This suggests that if molecules were contribut-
ing to the bulk of NIR opacity, then some of the species providing opacity between
4-8 µm in Ferguson et al. [2005] and Zhu et al. [2007] are being destroyed in the
vicinity of Herbig Ae star MWC275.
Sitko et al. [2008] have obtained fairly dense time coverage on the NIR and MIR
SED of MWC275. The NIR SED shows variability at the 20% level. During the
same period, the flux in the visible shows no detectable change, indicating that
that stellar luminosity remained fairly constant. Sitko et al. [2008] interpret their
observations as variations in the structure of the thermal NIR disk. A variation in
113

the NIR morphology of MWC275 was also detected in the interferometry. The NIR
disk size deduced from the Keck Interferometer data (April 2003 epoch, Figs 5.2 and
5.3) is ∼20% larger than the size obtained with the CHARA data (June 2004-Aug
2006 epochs). The size determined from the S2W1 June2007 data also differs at the
∼25% level from the size obtained from earlier CHARA epochs. These variations are
poorly understood and could be caused by changes in size/geometry, mass accretion
rate and gas content in the inner disk.
5.4.2 MIR SED and Emission Morphology
van Boekel et al. [2005] analyzed the MIR SED (Fig 5.8) of MWC275 in detail and
showed that the SED could be reproduced well with a grain mixture of 1.5µm and
0.1µm silicates with mass ratio of 4:1. We use results from van Boekel et al. [2005]
in fixing the small grain composition in our disk models.
As seen in Fig 5.8, the MWC275 SED falls sharply between 20µm and 30µm.
This drop and the 10µm silicate feature can be simultaneously reproduced only if
the mass fraction of the small grain dust component relative to gas beyond 7AU is
less than 20% of the mass fraction inside of 7AU (physical implication discussed in
§5.6). If the small grain component is allowed to exist beyond 7AU, then the model
far-infrared spectrum becomes much stronger than observed the SED. Fig 5.8 shows
a TORUS model SED that fits the MIR and longer wavelength spectrum of MWC275
well. In this model, 40% of the 8µm emission arises from the dust rim, with the rim
contribution declining to ∼20% at 13µm. This model also fits the MIDI-VLTI MIR
visibilities (Leinert et al. [2004]) and reproduces the 0.8±0.1AU 11µm FWHM minor-
114
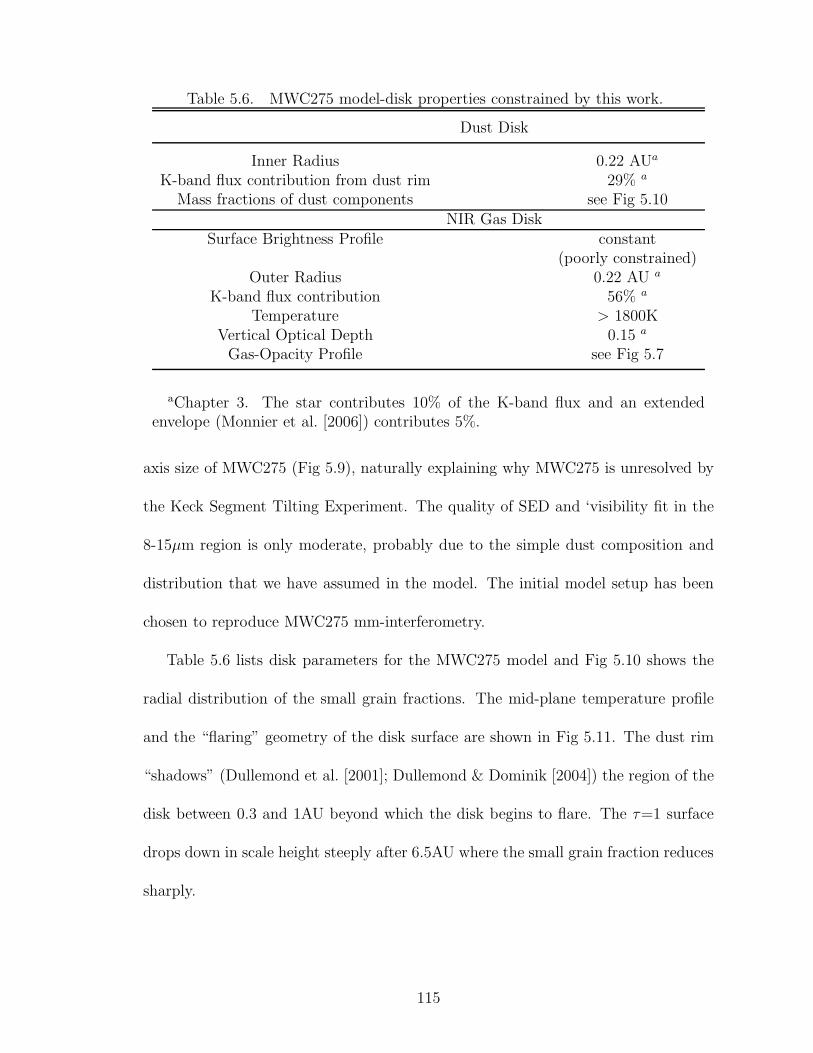
Table 5.6. MWC275 model-disk properties constrained by this work.
Dust Disk
Inner Radius 0.22 AUa
K-band flux contribution from dust rim 29% a
Mass fractions of dust components see Fig 5.10NIR Gas Disk
Surface Brightness Profile constant(poorly constrained)
Outer Radius 0.22 AU a
K-band flux contribution 56% a
Temperature > 1800KVertical Optical Depth 0.15 a
Gas-Opacity Profile see Fig 5.7
aChapter 3. The star contributes 10% of the K-band flux and an extendedenvelope (Monnier et al. [2006]) contributes 5%.
axis size of MWC275 (Fig 5.9), naturally explaining why MWC275 is unresolved by
the Keck Segment Tilting Experiment. The quality of SED and ‘visibility fit in the
8-15µm region is only moderate, probably due to the simple dust composition and
distribution that we have assumed in the model. The initial model setup has been
chosen to reproduce MWC275 mm-interferometry.
Table 5.6 lists disk parameters for the MWC275 model and Fig 5.10 shows the
radial distribution of the small grain fractions. The mid-plane temperature profile
and the “flaring” geometry of the disk surface are shown in Fig 5.11. The dust rim
“shadows” (Dullemond et al. [2001]; Dullemond & Dominik [2004]) the region of the
disk between 0.3 and 1AU beyond which the disk begins to flare. The τ=1 surface
drops down in scale height steeply after 6.5AU where the small grain fraction reduces
sharply.
115

5.5 AB Aur: Analysis
AB Aur is a Herbig Ae star (refer to Table 5.3 for basic properties and photometry)
with a total luminosity of 47L⊙ (Isella et al. [2006]). As in the case of MWC275,
AB Aur’s large stellar luminosity dominates the circumstellar disk’s energy budget
Garcia Lopez et al. [2006, accretion rates ≤ 10−7M⊙/year]. This allows us to ignore
accretion heating and model the AB Aur circumstellar disk as a passive disk, repro-
cessing stellar radiation (Chiang & Goldreich [1997]; Dullemond et al. [2001]). For
our models, we choose the AB Aur disk mass to be between 0.007-0.013 M⊙ (Lin
et al. [2006]) and a surface density profile that falls radially as r−1 (Corder et al.
[2005]). The disk outer edge is truncated at 300AU and the bulk (∼80%) of the dust
mass is assumed to reside in mm grains with an opacity that depends on wavelength
as λ−1 for long wavelenghts. Here, we describe in detail our modeling results for the
NIR and MIR morphology, and SED of AB Aur.
5.5.1 The Thermal NIR Disk
We follow the procedure outlined in §5.4.1 to model the SED and visibilities of
AB Aur. We first attempt at fitting a standard curved dust rim model (Fig 5.14) to
the NIR visibilities. The rim is assumed to be composed of 1.3µm silicate grains and
the dust evaporation temperature law is described by equation (5.3). This produces
rim radii too large to fit baselines shorter than 100m and we had to increase the Tevp
normalization to 2800K from 2000K. This increases the sublimation temperature at
the base of the rim from ∼1350K to ∼1950K. The dashed line in Fig 5.13 traces the
visibility for this model and provides a good fit to the data at baselines shorter than
116
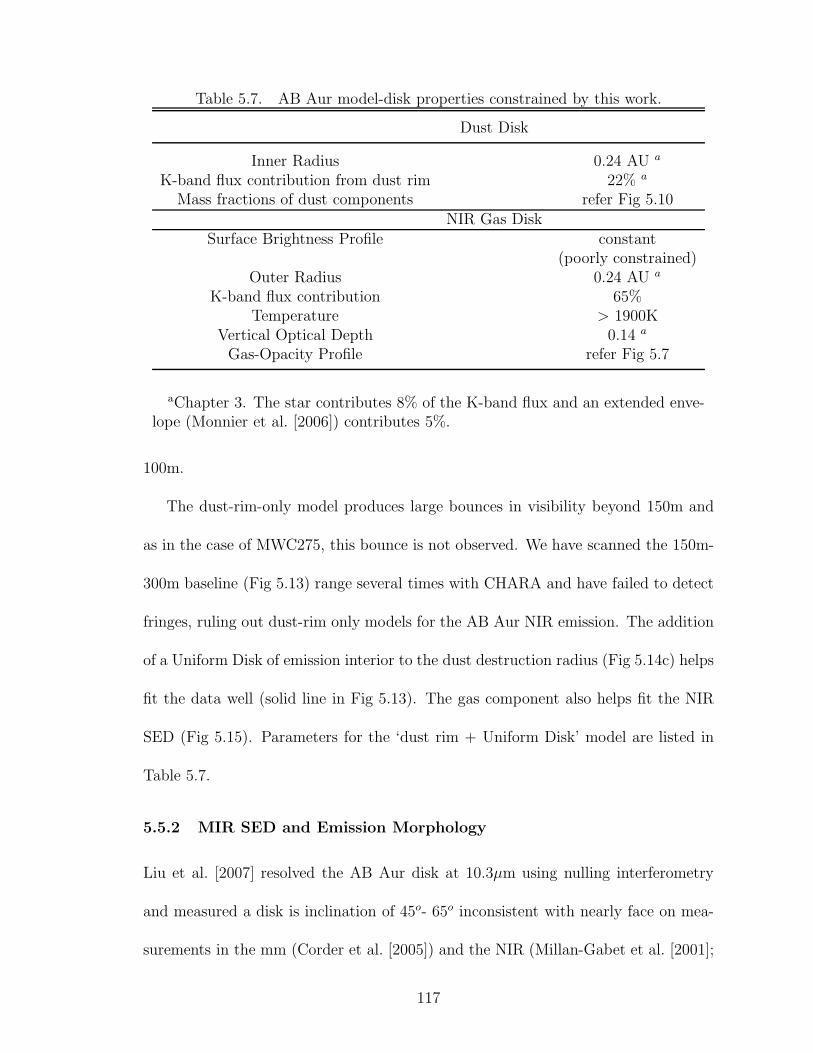
Table 5.7. AB Aur model-disk properties constrained by this work.
Dust Disk
Inner Radius 0.24 AU a
K-band flux contribution from dust rim 22% a
Mass fractions of dust components refer Fig 5.10NIR Gas Disk
Surface Brightness Profile constant(poorly constrained)
Outer Radius 0.24 AU a
K-band flux contribution 65%Temperature > 1900K
Vertical Optical Depth 0.14 a
Gas-Opacity Profile refer Fig 5.7
aChapter 3. The star contributes 8% of the K-band flux and an extended enve-lope (Monnier et al. [2006]) contributes 5%.
100m.
The dust-rim-only model produces large bounces in visibility beyond 150m and
as in the case of MWC275, this bounce is not observed. We have scanned the 150m-
300m baseline (Fig 5.13) range several times with CHARA and have failed to detect
fringes, ruling out dust-rim only models for the AB Aur NIR emission. The addition
of a Uniform Disk of emission interior to the dust destruction radius (Fig 5.14c) helps
fit the data well (solid line in Fig 5.13). The gas component also helps fit the NIR
SED (Fig 5.15). Parameters for the ‘dust rim + Uniform Disk’ model are listed in
Table 5.7.
5.5.2 MIR SED and Emission Morphology
Liu et al. [2007] resolved the AB Aur disk at 10.3µm using nulling interferometry
and measured a disk is inclination of 45o- 65o inconsistent with nearly face on mea-
surements in the mm (Corder et al. [2005]) and the NIR (Millan-Gabet et al. [2001];
117
Eisner et al. [2004]). Liu et al. [2007] interpreted their result in terms of the AB Aur
circumstellar environment being more complicated than a disk. Since AB Aur is
well resolved by the Keck Segment Tilting Experiment (Fig 5.17), a disk inclination
of 45o- 65o would have produced observable size difference between the major and
minor axis of the disk. We do not find evidence for this size variation in our Segment
Tilting data, and hence support a face on model for the mid-infrared disk around
AB Aur consistent with the NIR and mm results.
The MIR spectrum of AB Aur in the 10.7µm to 20µm range can be modeled well
with a dust grain mixture of 1.3µm and 0.1µm silicates with equal mass fractions
(van Boekel et al. [2005]). In addition to the micron and sub-micron silicates, we
include a 50µm silicate component to model the relatively flat spectrum of AB Aur
between 35µm and 80µm .
Fig 5.16 shows a TORUS model SED that fits the MIR and longer wavelength
spectrum of AB Aur well. In this model, ∼40% of the 8µm emission arises from the
dust rim, with the rim contribution declining to ∼10% at 13µm. This model also
fits the Keck Segment Tilting data visibilities reproducing the 10.5±0.7AU 10µm
FWHM size of AB Aur (Fig 5.17). By initial design, the model fits AB Aur mm-
interferometry and SED.
Table 5.7 lists disk parameters for the AB Aur model and Fig 5.10 shows the
radial distribution of the small grain fractions. The mid-plane temperature profile
and the τ=1 surface at 5500A are shown in Fig 5.11. The inner rim shadows the
disk between 0.3AU and 1AU, beyond which the disk surface takes a flared geometry.
118
5.6 Discussion
The simultaneous modeling of the infrared and millimeter SED and interferometry
of MWC275 and AB Aur allows us to address several important issues regarding the
structure of their circumstellar disks. To maintain clarity in our discussion we divide
the disk into two regions (i) thermal NIR region (< 0.3 AU) (ii) outer disk (between
0.3AU and the disk outer edge).
5.6.1 The Thermal NIR Disk
Detailed modeling (§5.4.1 and §5.5.1) of the inner disk shows that models where the
bulk of the NIR emission arises in a dust rim truncated by sublimation fail to fit the
long-baseline interferometry data and under-estimate the NIR emission by a factor
of 2 relative to observations. As mentioned in Chapter 3 and demonstrated in detail
here, the presence of a gas emission component inside the dust destruction radius
can solve the interferometry and SED problem simultaneously.
This however opens up a number of new questions, namely (i) What is the ge-
ometry of the gas-dust transition region? To date there has been no calculation of
transition region structure that treats both gas and dust simultaneously in a self
consistent manner. (ii) What are the relative contributions of accretion and stellar
radiation to heating the gas? We have shown that an ad-hoc addition of an NIR
emission component inside the dust destruction radius helps explain the data, but
the current modeling does not shed any light on the energy budget question. (iii)
What are the gas species that provide the NIR opacity? Is the opacity molecular
in nature or is it from free-free and free-bound processes? If a significant portion of
119
the NIR emission were indeed arising from molecular gas, then Fig 5.7 shows that
theoretical gas opacities depend much more sensitively on wavelength between 4 and
10µm than what is observed. This suggests that some of the molecules providing the
model opacities might be getting destroyed by the stellar UV radiation field.
In the course of modeling the MWC275 and AB Aur disks, we realized (§5.4.1)
that the observed K-band sizes could be reproduced only if the dust sublimation
temperature at the base of the dust rims were increased to ∼1850K from the ex-
perimentally measured silicate evaporation temperatures of ∼1400K (Pollack et al.
[1994]). A simple treatment of the gas-dust transition region by Muzerolle et al.
[2004] suggests that gas is not effective in modifying rim geometry. In the absence
of shielding by gas, the large dust sublimation temperatures indicate that the grains
in the inner disks of young stars are significantly more refractory and/or optically
transparent than has been assumed in the literature. There is also the possibility
that the gas gets optically thick along the mid-plane, shielding the dust from direct
stellar radiation and allowing the dust rim to exist closer to the star (Monnier et al.
[2005]; Vinkovic [2006]; Isella et al. [2006]). Future, high resolution NIR spectroscopic
studies of MWC275 and AB Aur, combined with self consistent models of the gas
density and temperature structure, will help address many of the questions raised
here.
MWC275 and AB Aur require gas emission to explain the their SED interferome-
try. In contrast, past modeling work by Isella et al. [2006] seems to suggest that dust
rims alone are probably sufficient to explain the NIR data on the young stars V1295
Aql (A2 IVe) and CQ Tau (F2 IVe). A larger sample of young stars will therefore
120
have to be observed with milli-arcsecond interferometry to establish and understand
trends between spectral type, stellar mass, accretion rates and the contribution of
gas emission to NIR SED.
A new and exciting observational domain will be opened with the commissioning
of the fringe tracker (Berger et al. [2006]) for CHARA-MIRC (Monnieret al. [2007])
in the summer of 2008. This will sufficiently improve CHARA-MIRC sensitivities
to combine light from 3 or more telescopes, allowing the first milli-arcsecond non-
parametric imaging of MWC275 and AB Aur in the NIR. The snapshot multiple-
baseline coverage will provide us a powerful tool in understanding the infrared time
variability of YSO disks.
5.6.2 The Outer Disk
Our models for the MWC275 and AB Aur MIR interferometry and SED suggest that
the outer disks of these systems are at different evolutionary stages. MWC275 10
micron size and MIR SED can only be reproduced if the disk is depleted in micron
and sub-micron sized grains beyond ∼7AU (§5.4.2). This meshes well with the fact
that the observed 10.7µm size of MWC275 is ∼3 times smaller than AB Aur. The
depletion of small grains beyond 7AU in the disk atmosphere indicates that the dust
particles in MWC275 have undergone significant settling. However, the presence
of the 10µm silicate feature in MWC275 implies that there is some process (like
planetesimal collisions) that maintains the supply of micron sized grains in the inner
regions of the disk.
Our models predict that the inner dust rim shadows (Dullemond & Dominik
121
[2004]) the region of the disk between 0.3AU and 1AU. The structure and size of
the shadow depends sensitively on the composition of grains in the circumstellar
disk (Tannirkulam et al. [2007]) and hence is an important probe of dust physics.
The presence of the shadow has not been observationally confirmed yet in any YSO
system, although some indirect evidence has been found in VV Ser (Pontoppidan
et al. [2007]).
5.7 Conclusions
We have presented the first set of comprehensive disk models for the SED and inter-
ferometry of Herbig Ae stars MWC275 and AB Aur. We have shown that ‘standard’
models for the dust evaporation front where the bulk of the near-infrared emission
arises from a dust wall, fail to explain the near-infrared spectral energy distribution
and interferometry. Standard models produce large bounces in visibility at high spa-
tial frequency, which is not observed in the data. We have conclusively demonstrated
that the presence of an additional smooth emission component (presumably hot gas)
inside the dust destruction radius and on a similar size scale to the dust rim can
ameliorate the situation. In the absence of shielding of star light by gas, we have
established that dust grains in the gas-dust transition region will have to be highly
refractory, sublimating at 1850K. The small mid-infrared size of MWC275 relative
to AB Aur, shows that the dust grains in the outer disk MWC275 are significantly
more evolved/settled than the grains in the AB Aur disk. We suggest that dynamical
processes (like planetesimal collisions) that maintain the population of micron-sized
grains producing the 10µm feature in the spectrum, are operational only in the inner
122

∼7AU of MWC275. However, in AB-Aur the small-dust producing mechanisms exist
at least out to ∼20 AU and maybe even beyond.
123

-0.6 -0.4 -0.2 0.0 0.2 0.4 0.6AU
-0.6
-0.4
-0.2
0.0
0.2
0.4
0.6
Standard (1350K) inner rim (K-band image)
0.05
0.07
0.10
0.12
0.15
0.17
Sur
face
Brig
htne
ss
-0.6 -0.4 -0.2 0.0 0.2 0.4 0.6AU
-0.6
-0.4
-0.2
0.0
0.2
0.4
0.6
Standard (1800K) inner rim (K-band image)
0.05
0.07
0.10
0.12
0.14
0.17
Sur
face
Brig
htne
ss
-0.6 -0.4 -0.2 0.0 0.2 0.4 0.6AU
-0.6
-0.4
-0.2
0.0
0.2
0.4
0.6
Standard inner rim + gas (K-band image)
0.05
0.07
0.10
0.12
0.15
0.17
Sur
face
Brig
htne
ss
Figure 5.4 Inclined-disk models for NIR emission in MWC275. The disk has aninclination of 48o and a PA of 136o (North is towards the top and East is on the left).The sense of the inclination is from Grady et al. [1999] a) Top left panel. A standardcurved dust-rim-only model with rim-base temperature ∼1350K. b) Top right panel.Standard curved dust-rim-only model with rim-base temperature ∼1800K. c) Bottompanel. Curved dust-rim model with gas emission (modeled as a uniform disk centeredon the star) inside the dust rim to smooth out the emission profile.
124
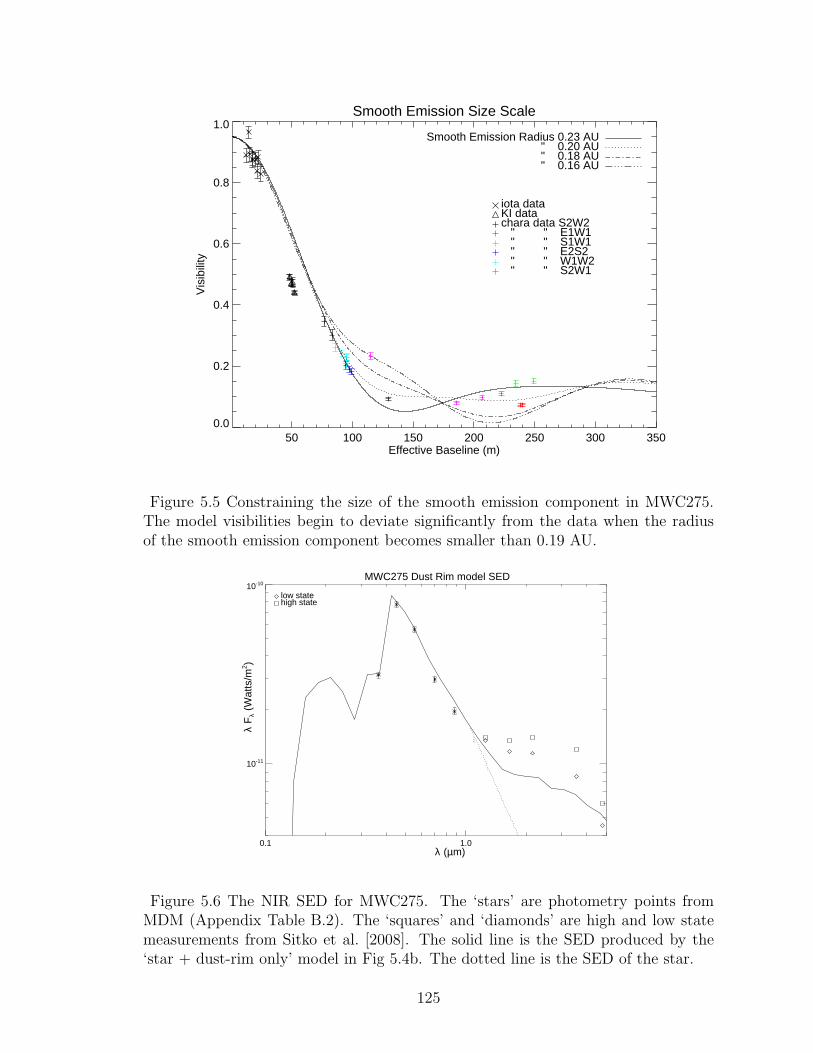
Smooth Emission Size Scale
50 100 150 200 250 300 350Effective Baseline (m)
0.0
0.2
0.4
0.6
0.8
1.0
Vis
ibili
ty
Smooth Emission Radius 0.23 AU " 0.20 AU " 0.18 AU " 0.16 AU
iota dataKI datachara data S2W2 " " E1W1 " " S1W1 " " E2S2 " " W1W2 " " S2W1
Figure 5.5 Constraining the size of the smooth emission component in MWC275.The model visibilities begin to deviate significantly from the data when the radiusof the smooth emission component becomes smaller than 0.19 AU.
MWC275 Dust Rim model SED
0.1 1.0
10-11
10-10
λ F
λ (W
atts
/m2 )
λ (µm)
low statehigh state
Figure 5.6 The NIR SED for MWC275. The ‘stars’ are photometry points fromMDM (Appendix Table B.2). The ‘squares’ and ‘diamonds’ are high and low statemeasurements from Sitko et al. [2008]. The solid line is the SED produced by the‘star + dust-rim only’ model in Fig 5.4b. The dotted line is the SED of the star.
125

Wavelength dependence of gas opacity
0.01
0.10
1.00
10.00
100.00
1000.00Derived Opacity
Theoretical Molecular Opacity CurveTgas = 2000K
1 100.01
0.10
1.00
10.00
100.00
1000.00Tgas = 2500K
Wavelength (µm)
opac
ity/ta
u re
lativ
e to
2µm
Wavelength dependence of gas opacity
0.01
0.10
1.00
10.00
100.00
1000.00Tgas = 5000K
1 100.01
0.10
1.00
10.00
100.00
1000.00Tgas = 8000K Derived Opacity
free-free + free-bound opacity
Wavelength (µm)
opac
ity/ta
u re
lativ
e to
2µm
Figure 5.7 Gas opacity. The plusses (+) represent empirically derived gas opacitiesfrom observed photometry and NIR disk models for MWC275 (see Fig 5.4 ). a)Top panel. The stars represent fiducial theoretical molecular absorption opacitiessmoothed over the photometry band for 2000K and 2500K gas respectively (Zhuet al. [2007]). The opacity jump at 5µm is due to water vapor. b) Bottom Panel.The gas absorption opacity at infrared wavelengths is dominated by free-free andfree-bound transitions of H− at 5000K and by hydrogen at 8000K (Ferguson et al.[2005]; Zhu et al. [2007]).
126
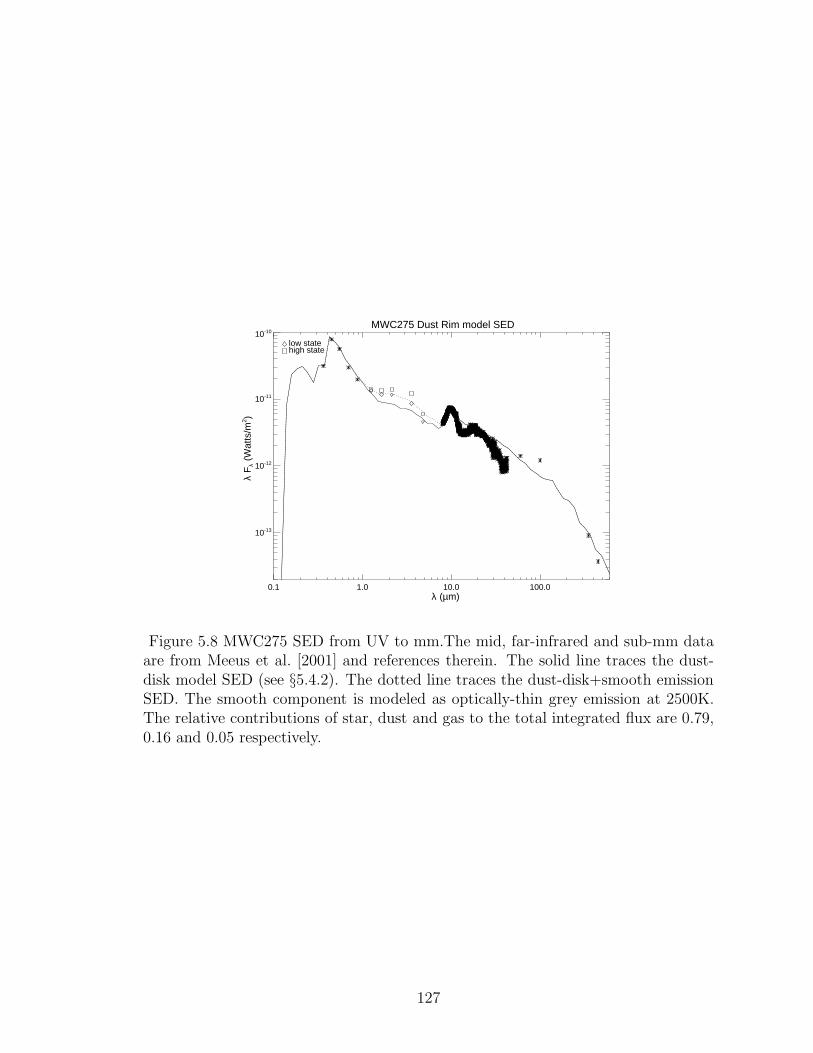
MWC275 Dust Rim model SED
0.1 1.0 10.0 100.0
10-13
10-12
10-11
10-10
λ F
λ (W
atts
/m2 )
λ (µm)
low statehigh state
Figure 5.8 MWC275 SED from UV to mm.The mid, far-infrared and sub-mm dataare from Meeus et al. [2001] and references therein. The solid line traces the dust-disk model SED (see §5.4.2). The dotted line traces the dust-disk+smooth emissionSED. The smooth component is modeled as optically-thin grey emission at 2500K.The relative contributions of star, dust and gas to the total integrated flux are 0.79,0.16 and 0.05 respectively.
127

-5 0 5AU
-5
0
5
MWC275 10.7 micron model image
0.05
0.08
0.10
0.13
0.16
0.18
(Sur
face
Brig
htne
ss (
erg/
s/cm
^2)
)^0.
1
milliarcsec
AU 0
40
-40
MWC275 visibility from Keck Segment Tilting
0 2 4 6 8 100.5
0.6
0.7
0.8
0.9
1.0
Vis
ibili
tyBaseline(m)
Visibility for MWC275 (Comparison with MIDI data)
8 9 10 11 12 13 140.0
0.1
0.2
0.3
0.4
0.5
Wavelength (µm)
Vis
ibili
ty
Figure 5.9 MIR image and visibilities for MWC275. The disk has an inclination of48o and a PA of 136o (North is towards the top and East is on the left) a) Top panel.Synthetic 11µm TORUS image. b) Middle panel. Azimuthally averaged 10.7µmvisibilities from the Keck Segment Tilting Experiment (Monnier et al. [2008b]). The‘stars’ are measured values and the solid line is the model visibility. MWC275 is notresolved by Keck. c) Bottom panel. Model visibilities compared with MIDI (Leinertet al. [2004]) data. The MIDI data was obtained at a projected baseline of ∼ 99mand a PA of 16o, nearly aligned with disk minor axis.
128
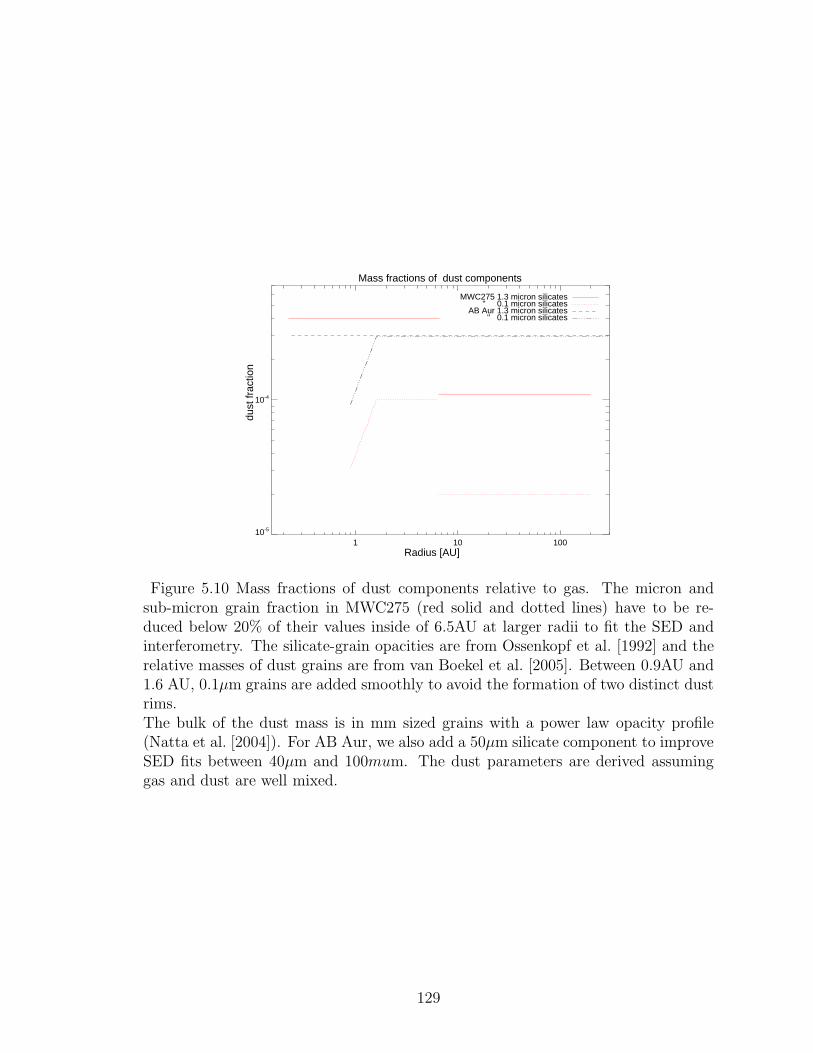
Mass fractions of dust components
1 10 10010-5
10-4
Radius [AU]
dust
frac
tion
MWC275 1.3 micron silicates " 0.1 micron silicates
AB Aur 1.3 micron silicates " 0.1 micron silicates
Figure 5.10 Mass fractions of dust components relative to gas. The micron andsub-micron grain fraction in MWC275 (red solid and dotted lines) have to be re-duced below 20% of their values inside of 6.5AU at larger radii to fit the SED andinterferometry. The silicate-grain opacities are from Ossenkopf et al. [1992] and therelative masses of dust grains are from van Boekel et al. [2005]. Between 0.9AU and1.6 AU, 0.1µm grains are added smoothly to avoid the formation of two distinct dustrims.The bulk of the dust mass is in mm sized grains with a power law opacity profile(Natta et al. [2004]). For AB Aur, we also add a 50µm silicate component to improveSED fits between 40µm and 100mum. The dust parameters are derived assuminggas and dust are well mixed.
129

Midplane Temperature Profile
1 10 10010
100
1000
Radius [AU]
Tem
pera
ture
(K
)
MWC275AB Aur
Flaring Geometry of the Dust Disk
0.1 1.0 10.0 100.00.00
0.05
0.10
0.15
0.20
0.25
0.30
Radius [AU]
z/R
MWC275AB Aur
Figure 5.11 Temperature profile and disk-surface shapes for MWC275 and AB Aur.a) Top panel. Midplane temperature profile for MWC275 (dotted line) and AB Aur(dashed line). b) Bottom panel. The figure shows τ=1 at 5500A surface of the diskmeasured along radial lines from the central star. The y axis is the polar angle (0 isthe equatorial plane) in radians.
130

uv coverage for ABAur
600 400 200 0 -200 -400 -600 u coordinate (m)
-600
-400
-200
0
200
400
600
v c
oord
inat
e (m
)
IOTA dataPTI data
chara data E1S1 " " E2W2
" upper limits
Figure 5.12 uv coverage for AB Aur. We include data from PTI (Eisner et al. [2004]),IOTA and CHARA (Tannirkulam et al. [2008]) in our analysis.
131
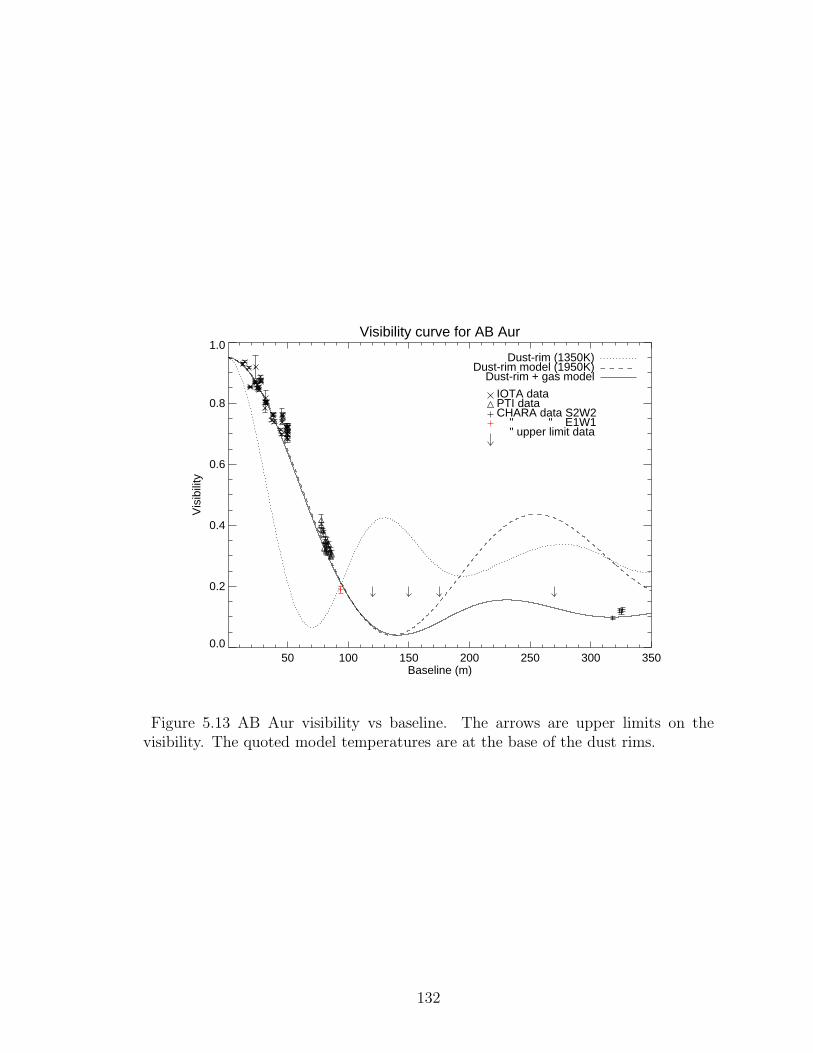
Visibility curve for AB Aur
50 100 150 200 250 300 350Baseline (m)
0.0
0.2
0.4
0.6
0.8
1.0
Vis
ibili
ty
IOTA dataPTI dataCHARA data S2W2 " " E1W1 " upper limit data
Dust-rim (1350K)Dust-rim model (1950K)
Dust-rim + gas model
Figure 5.13 AB Aur visibility vs baseline. The arrows are upper limits on thevisibility. The quoted model temperatures are at the base of the dust rims.
132
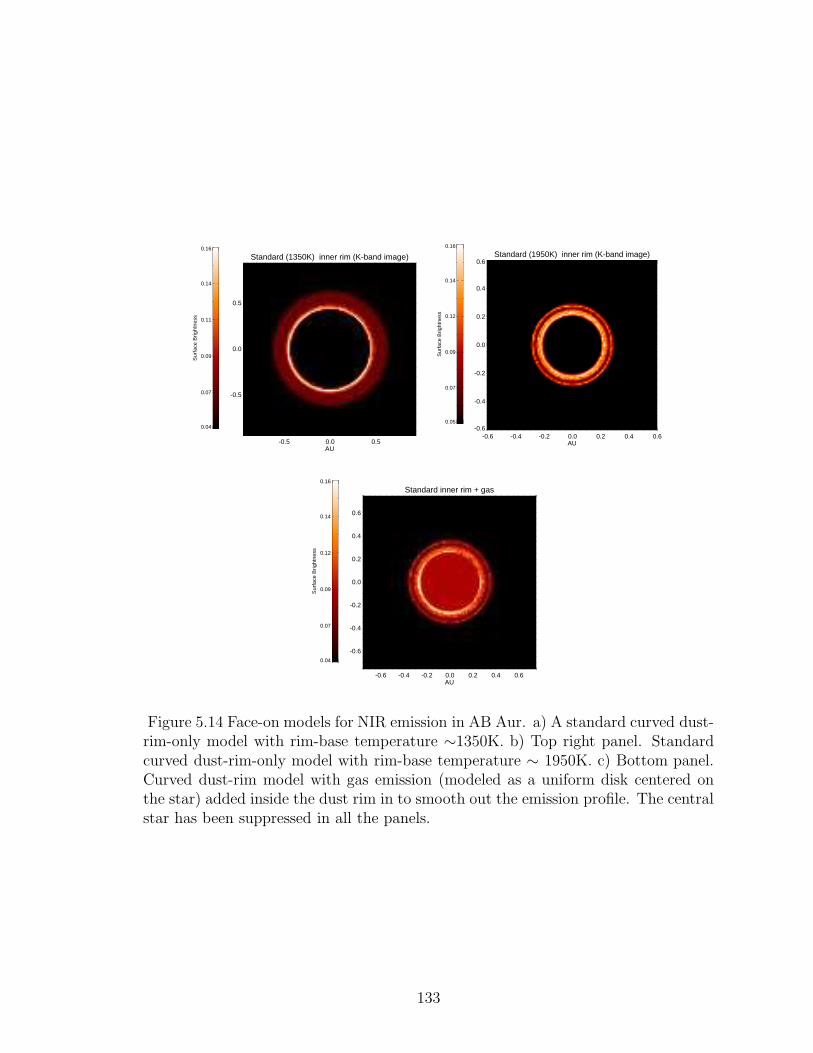
-0.5 0.0 0.5AU
-0.5
0.0
0.5
Standard (1350K) inner rim (K-band image)
0.04
0.07
0.09
0.11
0.14
0.16
Sur
face
Brig
htne
ss
-0.6 -0.4 -0.2 0.0 0.2 0.4 0.6AU
-0.6
-0.4
-0.2
0.0
0.2
0.4
0.6
Standard (1950K) inner rim (K-band image)
0.05
0.07
0.09
0.12
0.14
0.16
Sur
face
Brig
htne
ss
-0.6 -0.4 -0.2 0.0 0.2 0.4 0.6AU
-0.6
-0.4
-0.2
0.0
0.2
0.4
0.6
Standard inner rim + gas
0.04
0.07
0.09
0.12
0.14
0.16
Sur
face
Brig
htne
ss
Figure 5.14 Face-on models for NIR emission in AB Aur. a) A standard curved dust-rim-only model with rim-base temperature ∼1350K. b) Top right panel. Standardcurved dust-rim-only model with rim-base temperature ∼ 1950K. c) Bottom panel.Curved dust-rim model with gas emission (modeled as a uniform disk centered onthe star) added inside the dust rim in to smooth out the emission profile. The centralstar has been suppressed in all the panels.
133

AB Aur NIR SED
0.1 1.0
10-11
10-10
λ F
λ (W
atts
/m2 )
Wavelength (µm)
Dust RimDust Rim + gas
Figure 5.15 The NIR SED for AB Aur. The ‘stars’ are photometry points fromMDM (Table 5.3). The solid line is the SED produced by the ‘star + dust-rimonly’ model in Fig 5.14b. The dashed line traces the stellar SED. The dotted lineincludes emission from gas at 2500K, assuming that the gas opacity curve derivedfor MWC275 (see Fig. 5.7) is valid for AB Aur as well.
AB Aur SED
0.1 1.0 10.0 100.010-14
10-13
10-12
10-11
10-10
λ F
λ (W
atts
/m2 )
Wavelength (µm)
Dust RimDust Rim + gas
Figure 5.16 AB Aur SED from UV to mm. The mid, far-infrared and sub-millimeterdata are from Meeus et al. [2001] and references therein. The solid line traces thedust-disk model SED (see §5.5.2). The dotted line traces the dust-disk + gas model.The relative contributions of star, dust and gas to the total integrated flux are 0.67,0.27 and 0.06 respectively.
134

-10 -5 0 5 10AU
-10
-5
0
5
10
AB Aur 10.7 micron model image
0.06
0.09
0.12
0.15
0.18
0.21
(Sur
face
Brig
htne
ss (
erg/
s/cm
^2)
)^0.
1
AU
milliarcsec
100
50
0
-50
-100
AB Aur visibility from Keck Segment Tilting
0 2 4 6 8 100.5
0.6
0.7
0.8
0.9
1.0
Baseline (m)
Vis
ibili
ty
Figure 5.17 10.7µm image and visibilities for AB Aur. a) Top panel. Synthetic10.7µm TORUS image b)Bottom panel. Model visibilities (solid line) comparedwith azimuthally averaged Keck Segment Tilting data (Monnier et al. [2004]). Themodel also includes 5% emission arising from an extended envelope.
135
Chapter 6
Summary and Future Work
This thesis studies several topics related to the structure of circumstellar disks in
Herbig Ae stars. The first chapter introduces key results from long-baseline infrared
interferometry in the last decade. Long-baseline interferometry has allowed us to
make spatially resolved investigations of circumstellar disks and has helped revise
long-held notions on disk morphology and evolution. Chapters 2 and 3 are focussed
on theoretical models and observations of the gas-dust transition region (dust evap-
oration front) in proto-planetary systems. In Chapter 4, we presented preliminary
results on the geometry of the planet formation region in disks from the novel Keck
Segment Tilting Experiment. Chapter 5 discusses comprehensive models for the SED
and interferometry on prototype Herbig Ae stars MWC275 and AB Aur. In this con-
cluding chapter, we summarize the main contributions of this thesis and outline some
future directions for research.
6.1 Key Contributions
(i) We developed a Monte-Carlo approach to calculate the structure of the dust
evaporation front in a in a 2-D geometry. The advantage of this method over an
analytic approach is that it allows for a self-consistent determination of the entire
136

disk structure. We showed that the geometry of the rim depends sensitively on dust
properties. Dust growth and sedimentation may play a dominant role in determining
the structure of the inner rim.
(ii) Current theories that explain the NIR excess (over stellar photospheric values)
in Herbig Ae stars solely on the basis of a “puffed up inner rim” are too simplistic.
Using long-baseline interferometry, we detected strong NIR emission inside to and
on similar size scales to the dust destruction radius of Herbig Ae stars MWC275
and AB Aur. We argued that this new component corresponds to hot gas inside the
dust sublimation radius. In the absence of shielding of star light by gas, we have
also established that dust grains in the inner rim will have to be highly refractory
sublimating at 1850K.
(iii) We presented the first set of comprehensive disk models for the SED and in-
terferometry of Herbig Ae stars MWC275 and AB Aur. The small MIR size of
MWC275 relative to AB Aur, shows that the dust grains in the outer disk are sig-
nificantly more evolved/settled than the grains in the AB Aur disk. We suggest
that dynamical processes (like planetesimal collisions) that maintain the population
of micron-sized grains producing the 10µm feature in the spectrum, are operational
only in the inner ∼7AU of MWC275. However, in AB-Aur the small-dust producing
mechanisms exist at least out to ∼20 AU and maybe even beyond.
(iv) Using the Keck Segment Tilting Experiment designed by Prof. John Monnier
and his collaborators, we resolved MIR emission in a number of Herbig Ae/Be sys-
tems. Preliminary analysis suggests that the colors and surface brightnesses of disks
in Herbig Ae stars vary smoothly between Group I and Group II sources. As noted by
137
previous authors, Group I sources tend to be systematically redder and of lower sur-
face brightness than Group II sources. This trend is reproduced by simple geometric
models for circumstellar disks. The bulk of MIR emission arises from the inner rim
in Group II sources, whereas emission in Group I sources is dominated by the outer
flared disk. Disks in Herbig Be stars have larger surface brightness than predicted by
passive flared-disk models, probably due to the presence of strong accretion heating.
(v) With imaging from the Keck Segment Tilting Experiment, we presented the dis-
covery of a circumbinary disk around the Herbig Be system v892 Tau, first reported
in Monnier et al. [2008a]. We proposed a new SED decomposition for the system
in terms of two B8V stars reddened by an AV =10.95. The MIR flux in v892 Tau
is characterized as a T ∼ 450K blackbody, consistent with emission from the warm
inner wall of the circumbinary disk.
6.1.1 Relevance of work to planet formation studies
• Determination of physical conditions in the inner regions of circum-
stellar disks. We determined the geometry and the temperature structure
of the MWC275 and AB Aur disks in Chapter 5. We also showed in Chapter
4 that for certain evaporation front models, the midplane temperature in the
shadow region can fall below the sublimation temperature of water ice. The
presence of a cold reservoir of material close to the star can have implications
on the chemistry and abundance of volatile elements in planets. The concentra-
tion of ices (sensitive to pressure and temperature) can also significantly affect
the ability of gas-giant planets to accrete (Lissauer & Stevenson [2007]).
138

We showed in Chapter 5 that the dust in the sublimation front could be signif-
icantly more refractory than assumed in the literature. Refractory dust grains
may play a major role in fixing the abundance of elements in terrestrial planets.
• Detection of early stages of planet formation. The initial step in both
giant (Pollack et al. [1996]) and terrestrial (Wetherill [1990]) planet formation
is the coagulation of dust to form planetesimals. We suggest in Chapter 5 that
planetesimal collisions are active in the inner 20AU of the AB Aur disk, making
it an excellent laboratory for studying the first stages of planet formation. The
dynamic nature of the AB Aur disk is further supported by the detection of
arcs and rings (Grady et al. [1999]; Fukagawa et al. [2004]; Oppenheimer et al.
[2008]) and a possible hot spot (Millan-Gabet et al. [2006]).
• Determination of boundary conditions for planet migration. The
structure of the inner-gas disk plays an important role in determining the or-
bital properties of terrestrial planets (Najita et al. [2007]). Understanding
inner-disk structure and measurements of the gas content will also shed light
on how the inward radial migration of gas-giant planets is halted (Lin et al.
[1996]). Thus, the spatially-resolved detection of gas inside the dust destruction
radius (Chapters 3 and 5) provides exciting future possibilities for directly con-
straining boundary conditions in models of planet dynamics (Nagasawa et al.
[2007]).
139

6.2 Way Forward
This thesis highlights a number of outstanding issues in our understanding of cir-
cumstellar disk structure, namely a) What is the geometry of the gas dust transition
region? To date there has been no calculation of the transition region structure that
treats both gas and dust simultaneously in a self consistent manner. b) What are the
relative contributions of accretion and stellar radiation to heating gas inside the dust
rim? c) What are the gas species that provide NIR opacity? d) Does the presence of
a shadow affect chemistry in the planet formation region? and e) Do Groups I and
II represent distinct stages in the evolution of circumstellar disks? Why are most
Herbig Be disks Group I?
To address some of the questions regarding the structure of the inner disk,we
recently submitted a NASA Origins of Solar Systems proposal (PI: Prof. John Mon-
nier, Science PI: Ajay Tannirkulam, Co-Is: Prof. Nuria Calvet and Dr. Tim Har-
ries, Collaborators: Dr. James Muzerolle, Dr. Theo ten Brummelaar, Dr. Rafael
Millan-Gabet, Dr. Silvia Alencar, Dr. Jesus Hernandez and Zhaohuan Zhu) with
the following scientific goals -
• Determine the structure of the gas flow from a few tenths of an AU
down to the stellar surface and clarify the “star-disk connection”.
By measuring Balmer line profiles and modeling them with a hybrid magneto-
spheric accretion and wind model (Muzerolle et al. [2004]; Alencar et al. [2005];
Kurosawa et al. [2006]), we will obtain mass accretion rates for a well-selected
sample of Herbig Ae/Be stars with known IR-disk properties. In addition, we
will determine the structure of the inner gas-disk with resolved interferometry
140
of the gas-surface-brightness profile (Chapters 3 and 5). Conversion of sur-
face brightness profiles into measurements of surface density and temperature
structure will require accurate estimates of the wavelength dependence of gas
opacity. First steps in this direction have been taken in Chapter 5 by deriv-
ing empirical estimates of gas opacity (Fig 6.1) from observed photometry and
self-consistent models for the dust evaporation front. The surface density of
the disk is directly related to the mass accretion rates, temperature and the
viscosity parameter in quasi-steady-state disks (Shakura & Sunyaev [1973]). Si-
multaneous measurements of mass infall rates (through spectroscopy) and the
gas surface density profiles (through interferometry) opens up the fascinating
possibility of directly constraining the viscosity parameter-α in the inner disk.
The viscosity parameter is key to understanding angular momentum transport
in circumstellar disks.
HAe/Be stars power strong winds (Mottram et al. [2007]). The wind geom-
etry and launch mechanism are poorly understood. Using NIR interferometry,
Tatulli et al. [2007] and Kraus et al. [2008b] demonstrated that winds in some
HAe/Be stars get launched on similar length scales to the dust sublimation ra-
dius. Combining continuum NIR interferometry measurements with the mag-
netospheric/wind models for accretion/ejection sensitive lines, new constraints
on the geometry of the wind-launching region will be obtained. These will
be crucial in informing and validating (e.g. Kurosawa et al. [2008]) detailed
magneto-hydro-dynamic (MHD) simulations of the star-disk connection that
are now available in the literature (e.g. Romanova et al. [2008]).
141

Wavelength dependence of gas opacity
0.01
0.10
1.00
10.00
100.00
1000.00Derived Opacity
Theoretical Molecular Opacity CurveTgas = 2000K
1 100.01
0.10
1.00
10.00
100.00
1000.00Tgas = 2500K
Wavelength (µm)
opac
ity/ta
u re
lativ
e to
2µm
Figure 6.1 Empirically derived gas opacities. The plusses (+) represent empiricallyderived gas opacities from observed photometry and near-infrared disk models forMWC275. The stars represent fiducial theoretical molecular absorption opacitiessmoothed over the photometry band for 2000K and 2500K gas respectively (Zhuet al. [2007]). The opacity jump at 5µm is due to water vapor.
A complementary approach to optical-emission-line and NIR interferomet-
ric studies of the inner disk has been through high-resolution spectroscopy work
on molecular lines of CO, HCN, H2C2 and H2O (Najita et al. [2003]; Brittain
et al. [2005]; Najita et al. [2007]; Gibb et al. [2007]). Some of these molecules
have been shown to be good tracers of the total gas content in the inner disks
of YSOs. Furthermore, column density measurements of these gas species have
been compared with dust extinction to constrain dust evolution processes in
disks. We have only begun to tap the full potential of gas diagnostics, which
at the moment suffers from lack of knowledge of the gas composition and good
physical models for the inner disk.
• Determine the geometry of the dust evaporation front. Models of the
evaporation front in the literature (Dullemond et al. [2001]; Isella & Natta
142

[2005] and Chapter 2) ignore the effect of gas accretion heating and gas opacity
on the structure of the inner rim. NIR interferometry studies (Akeson et al.
[2005b]; Eisner [2007]; Kraus et al. [2008a] and Chapter 3) seem to directly
challenge this assumption by detecting significant gas emission within the dust
destruction radius. We plan to perform a self-consistent calculation of the front
structure, including gas opacity and accretion heating.
In Chapter 5 we demonstrated that the temperature of the evaporation
front could be as high as 1850K, much higher than ∼1400K value typically as-
sumed in the literature. The high temperatures of the front make it an ideal site
for thermal reprocessing of dust grains and gas-phase chemistry. Using MIR in-
terferometry, van Boekel et al. [2004] showed that dust in the evaporation front
is highly crystalline. The origins of the crystallinity are poorly understood.
Some suggested mechanisms are gas-phase condensation and thermal anneal-
ing of grains (Gail [2004]). Our calculations of density and temperature in the
evaporation front will provide critical input to models of dust phase-chemistry
at the inner rim and contribute to our understanding of the evolution of dust
from which Earth-like planets are built.
A major point to note here is that the evaporation front and the inner disk
will not be resolvable even by Atacama Large Millimeter/submillimeter Array
(ALMA), and near and mid-infrared interferometry are the most powerful tools
currently available to study the inner disk structure.
We next outline the observations and modeling needed to achieve the scientific goals.
143
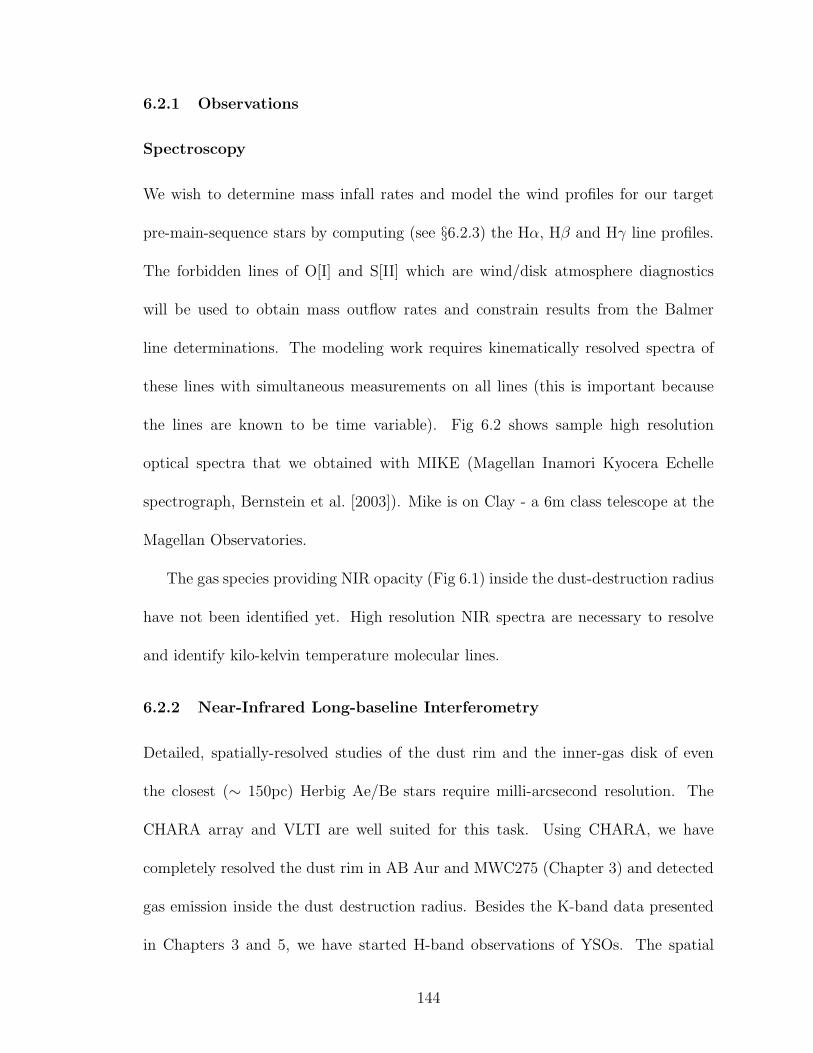
6.2.1 Observations
Spectroscopy
We wish to determine mass infall rates and model the wind profiles for our target
pre-main-sequence stars by computing (see §6.2.3) the Hα, Hβ and Hγ line profiles.
The forbidden lines of O[I] and S[II] which are wind/disk atmosphere diagnostics
will be used to obtain mass outflow rates and constrain results from the Balmer
line determinations. The modeling work requires kinematically resolved spectra of
these lines with simultaneous measurements on all lines (this is important because
the lines are known to be time variable). Fig 6.2 shows sample high resolution
optical spectra that we obtained with MIKE (Magellan Inamori Kyocera Echelle
spectrograph, Bernstein et al. [2003]). Mike is on Clay - a 6m class telescope at the
Magellan Observatories.
The gas species providing NIR opacity (Fig 6.1) inside the dust-destruction radius
have not been identified yet. High resolution NIR spectra are necessary to resolve
and identify kilo-kelvin temperature molecular lines.
6.2.2 Near-Infrared Long-baseline Interferometry
Detailed, spatially-resolved studies of the dust rim and the inner-gas disk of even
the closest (∼ 150pc) Herbig Ae/Be stars require milli-arcsecond resolution. The
CHARA array and VLTI are well suited for this task. Using CHARA, we have
completely resolved the dust rim in AB Aur and MWC275 (Chapter 3) and detected
gas emission inside the dust destruction radius. Besides the K-band data presented
in Chapters 3 and 5, we have started H-band observations of YSOs. The spatial
144
Figure 6.2 Hα and Hβ line profiles. (a) Left panel. Hα and Hβ line profiles forMWC275 obtained with MIKE . The blue shifted wind absorption feature seen inMWC275 is reproduced in our model on the right panel. (b) Right panel. Hα lineprofile (Lima et al. [2008], in prep) for a model characterized by parameters typicalof a Classical T Tauri star: mass 0.5 M⊙, radius 2R⊙, stellar effective temperature4000K, mass accretion rate 10−8M⊙yr−1. The magnetospheric radius is ∼ 3 stellarradii, and the wind region extends from 3 to 20 stellar radii; the mass loss rate is10−9 M⊙ yr−1. The T Tauri models will be extended into the HAe/Be regime toself-consistently determine mass accretion and mass loss rates.
resolution at H-band is significantly higher than K-band and H-band also probes
hotter gas. Combined with the α-disk model, the surface brightness profile of the gas
provides a new diagnostic for M , and a direct connection between the disk properties
and properties of the magnetospheric accretion flow.
The commissioning of the fringe tracker (Fig 6.3, Berger et al. [2006]) for CHARA-
MIRC (Fig 6.3, Monnieret al. [2007]) in the summer of 2008 will open a new obser-
vational frontier. The fringe tracker will sufficiently improve CHARA-MIRC sensi-
tivities to combine light from 3 or more telescopes, allowing the first milli-arcsecond
non-parameteric imaging of MWC275 and AB Aur in the NIR. The snapshot multi-
ple baseline coverage will provide us a powerful tool in understanding infrared time
variability of YSO disks.
145

Figure 6.3 MIRC and CHAMP. (a) Top Panel. The MIRC combiner (Monnieret al.[2007]). (b) Bottom Panel. The fringe tracker CHAMP (Berger et al. [2006, 2008]).
146

6.2.3 Modeling
Accretion models have tended to focus on two separate physical scales (i) the pro-
cesses of mass and angular momentum in the outer disk (extending from several 100
AU down to tens of stellar radii) (ii) gas accretion from a few stellar radii on to
the stellar photosphere. There have been few studies directly connecting proper-
ties of gas falling onto the stellar photosphere with physical properties (density and
temperature) of the inner disk.
We propose to bridge this gap by adopting a two-stage approach to modeling the
accretion process. Balmer line profiles that are sensitive to accretion/ejection will be
self-consistently modeled using a hybrid, magnetospheric accretion and wind model
(Muzerolle et al. [2004]; Alencar et al. [2005]; Lima et al. 2008, in prep). The accre-
tion rate determined from this model will be converted into a gas-disk surface density
profile following the Sunyaev-Shakura prescription (Shakura & Sunyaev [1973]). The
gas surface density profiles will then be fed into a Monte-Carlo radiative transfer code
-TORUS and predictions will be made for SED and interferometric measurables of
the inner disk. This two-stage modeling procedure links properties of the magneto-
spheric accretion flow to the properties of the disk providing new constraints on the
physics of gas accretion, and its affects on the structure of the inner disk.
The hybrid, magnetospheric accretion and disc-wind model
The modeling strategy for magnetospheric accretion would follow the work of Hart-
mann et al. [1994]; Muzerolle et al. [1998, 2001]. The stellar magnetosphere is as-
sumed to be a dipole, symmetric about the star’s rotation axis and perpendicular to
147
the circumstellar disk. Material from the disk gets channeled along the magnetic field
lines, and matter falls onto the star ballistically. The gas gets shocked and heated
as it hits the stellar surface. Figure 6.2 shows the theoretical Hα line profile for a
T Tauri star with typical parameters.
A significant difference between the T Tauri case and Herbig Ae/Be stars is the
strong wind contribution to the Balmer lines (Mottram et al. [2007]). Our group
has been successful (Kurosawa et al. [2006]; Lima et al. 2008, in prep) in com-
bining a wind component with the magnetospheric model (Fig 6.2). The hybrid
magnetospheric-accretion/disc-wind codes will be used to study the wind and disk-
atmosphere components to the line strengths and line profiles of Herbig Ae/Be stars
and constrain their mass accretion/ejection rates.
Continuum radiative transfer modeling
New modules will be incorporated into the TORUS code to explore the effects of gas
on inner rim structure. The modeling of gas structure within the inner rim will help
translate gas surface brightness profiles obtained from interferometry into a measure
of mass accretion rates, complementing and constraining infall measurements made
with the magnetospheric model.
The above outlined analysis of the inner-AU circumstellar-material properties for
MWC275, AB Aur and V1295Aql, will strongly constrain models of accretion, winds
and proto-planetary-disk structure and thereby inform planet-formation theories.
We also wish to emphasize that the VLT Interferometer along with the MIR
combiner MIDI (Leinert et al. [2004]) will soon be observing several Herbig Ae/Be
at multiple baseline orientations to validate the existence of the geometric “shadow”
148

behind the inner rim. These observations will also constrain the spatial distribution
and composition of dust in the inner AU of circumstellar disks. As highlighted in
Fig 4.2 MIDI observations will strongly inform our understanding of dust processes
in the evaporation front and the terrestrial planet formation region.
6.3 Concluding Remarks
In this thesis, we have presented results on circumstellar disk structure combining
state-of-the-art modeling techniques and cutting edge infrared interferometry. Our
understanding of disk structure and evolution is rapidly progressing. The commis-
sioning of new instruments at CHARA and VLTI allowing milli-arcsecond interfero-
metric “imaging” of young stellar objects, and the Atacama Large Millimeter Array
(ALMA) will soon revolutionize our notions of gas and dust physics in proto-planetary
disks. Personally, graduate work in this fast changing field has been an exciting and
rewarding journey.
149

Appendices
150

Appendix A
Analytic Estimate for Rim Shape
Here, we derive a general analytic formula for the rim shape of a dust segregation
model (a case with specific numerical values for parameters, was discussed in §2.4.2).
Let the densities of the two dust components in the circumstellar disk be given
by
ρlarge = Alargeρo gas exp
[
−1
2
z2
(ζlargeh)2
]
(A.1)
ρsmall = Asmallρo gas exp
[
−1
2
z2
(ζsmallh)2
]
(A.2)
where ρlarge and ρsmall are the densities of large and small grains respectively and
ρo gas is the gas density in the mid-plane. Alarge and Asmall are normalization factors
for the dust densities, z is the height from the disk mid-plane, h is the gas scale
height and ζlarge and ζsmall are the scale heights for large and small grains as fractions
of the gas scale height.
The ratio of Planck mean opacities at the dust evaporation temperature and the
stellar effective temperature - ǫ(z), then becomes
ǫ (z) =
AlargeKPlarge(Tevp) + AsmallKPsmall
(Tevp) exp(
12
z2(ζ2small
−ζ2large
)
h2ζ2large
ζ2small
)
AlargeKPlarge(T∗) + AsmallKPsmall
(T∗) exp(
12
z2(ζ2small
−ζ2large
)
h2ζ2large
ζ2small
)
(A.3)
151

where KPlargeand KPsmall
are Planck mean opacities for large and small grains at the
specified temperatures, Tevp is the dust evaporation temperature and T∗ is the stellar
effective temperature.
Neglecting local accretion heating, the dust destruction radius Revp (see Isella
et al. [2006]; Calvet et al. [1991]) is
Revp [AU] = 0.034 [AU]
(
1500K
Tevp
)2 [(L∗
L⊙
)(
B +1
ǫ(z)
)]1/2
, (A.4)
L∗ is luminosity of the star in solar units. B is a dimensionless diffuse heating term,
characterizing the rim optical depth to its own thermal emission.
The gas scale height h at Revp is estimated to be (see eqs. (7) & (8) from Chiang
& Goldreich [1997])
h [AU ] = Revp [AU][(
Tgas
4 × 10⁷K
)(
M⊙
M∗
)(
Revp
4.64 × 10⁻³ AU
)]1/2
(A.5)
where Tgas is the temperature of the bulk of the gas (assumed to be isothermal) and
M∗ is mass of the star in solar masses.
Combining equations (A3), (A4), and (A5), the height of the evaporation front
as a function of distance along the disk mid-plane from the star becomes
z[AU] = Revp[AU]
[
2ζ2diff ln
(
AlargeKPlarge(T∗) − Y AlargeKPlarge
(Tevp)
Y AsmallKPsmall(Tevp) − AsmallKPsmall
(T∗)
)]1/2
×
[(
Tgas
4 × 10⁷K
)(
M⊙
M∗
)(
Revp
4.64 × 10⁻³ AU
)]1/2
(A.6)
where Y and ζdiff are dimensionless terms given by
Y =
(
1.71 × 10⁻¹⁰AU−2K−4R2evpT
4evp
L∗/L⊙
− B
)
(A.7)
152

ζ2diff =
ζ2smallζ
2large
ζ2small − ζ2
large
(A.8)
153

Appendix B
Optical and Near-Infrared Photometry of Young
Stellar Objects.
The principal scientific goal of my thesis was to do a detailed case by case mod-
eling of Herbig Ae disks and confront current disk models with interferometry and
spectral energy distribution data (SED). Multi-wavelength photometry is required
to constrain model parameters. Besides this, due to the limitations of two-telescope
long baseline interferometry, broadband SEDs are needed to inform interpretations
of the fringe data. It is now well known that that the visible and infrared fluxes
from YSOs are time variable (e.g. Carpenter et al. [2002], Fig §B.1) complicating
interferometry interpretation. To avoid problems with using decade old photome-
try from the literature, we obtained new flux measurements nearly coeval with the
interferometry data on a number of YSOs.
The high brightness of the targets allowed us to observe a dozen or so objects on
clear nights with meter sized telescopes. All the data were observed at the MDM
observatory (of which University of Michigan is a partner) with the 1.3m McGraw-
Hill and 2.4m Hiltner telescopes.
154
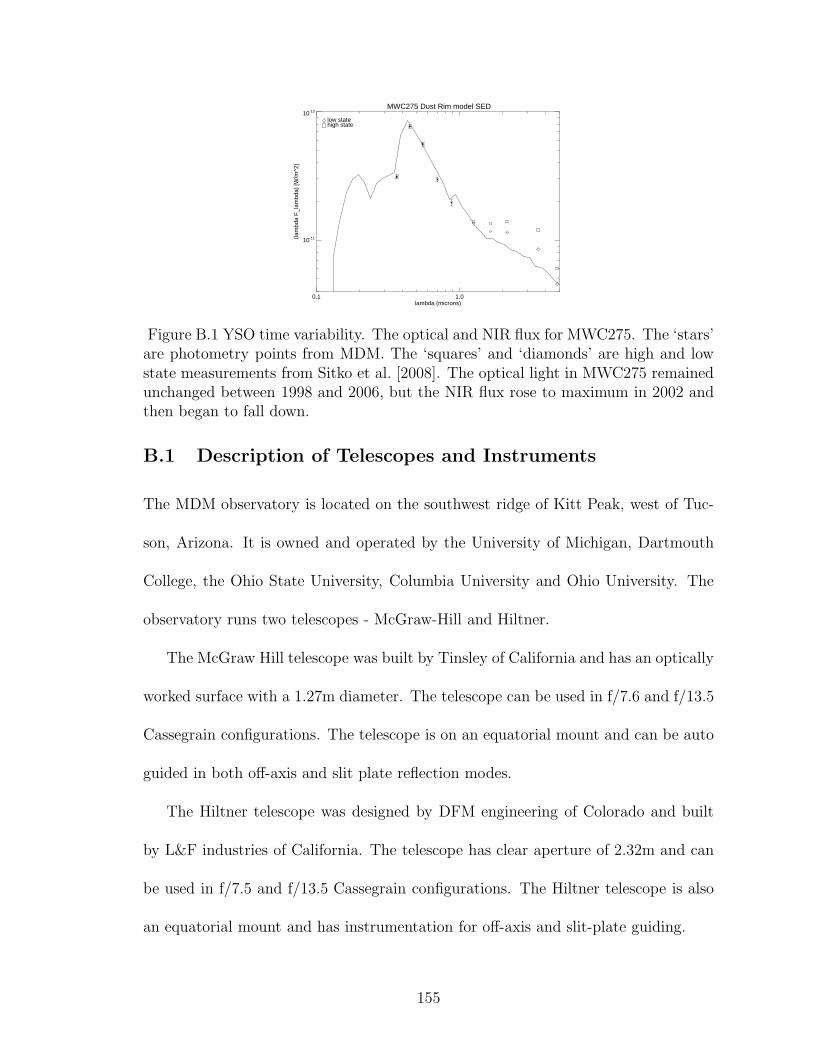
MWC275 Dust Rim model SED
0.1 1.0lambda (microns)
10-11
10-10
(lam
bda
F_l
ambd
a) [W
/m^2
]
low statehigh state
Figure B.1 YSO time variability. The optical and NIR flux for MWC275. The ‘stars’are photometry points from MDM. The ‘squares’ and ‘diamonds’ are high and lowstate measurements from Sitko et al. [2008]. The optical light in MWC275 remainedunchanged between 1998 and 2006, but the NIR flux rose to maximum in 2002 andthen began to fall down.
B.1 Description of Telescopes and Instruments
The MDM observatory is located on the southwest ridge of Kitt Peak, west of Tuc-
son, Arizona. It is owned and operated by the University of Michigan, Dartmouth
College, the Ohio State University, Columbia University and Ohio University. The
observatory runs two telescopes - McGraw-Hill and Hiltner.
The McGraw Hill telescope was built by Tinsley of California and has an optically
worked surface with a 1.27m diameter. The telescope can be used in f/7.6 and f/13.5
Cassegrain configurations. The telescope is on an equatorial mount and can be auto
guided in both off-axis and slit plate reflection modes.
The Hiltner telescope was designed by DFM engineering of Colorado and built
by L&F industries of California. The telescope has clear aperture of 2.32m and can
be used in f/7.5 and f/13.5 Cassegrain configurations. The Hiltner telescope is also
an equatorial mount and has instrumentation for off-axis and slit-plate guiding.
155

The instruments that we used for photometry at the MDM observatory are-
• 8K Imaging Camera: The 8K Camera was built by Columbia University
and operates between 3300Aand 8500A. The detector plane is a 4×2 mosaic of
2048×4096 CCDs. The field of view is 25 arcmin at the 2.4m and 46 arcmin on
the 1.3m telescope. Bessel U, Harris B, Harris V, Harris R, Arizona I, Gunn
Z, a broad R and Hα are the currently available filters.
• Templeton: Templeton is a 1024×1024 CCD detector for use between 3300Aand
9500A. The detector gets mounted on the back-end of the Multiple Instrument
System (MIS), which comprises of the finder, guider and filter-wheel modules,
and spectral calibration and flat field lamps.
• OSU IR Camera: The OSU IR Camera (also known as TIFKAM) is an
infrared imager and spectrometer that operates in the 1-2.5µm range built
by Ohio State University and the MDM consortium. The instrument has a
512×1024 InSb detector array and is equipped with a standard set of JHK
filters and moderate resolution grisms.
Details on the telescopes and instruments can be found in -
http://www.astro.lsa.umich.edu/obs/mdm/index.html. The photometry filter char-
acteristics are listed in Table B.1.
B.2 Observations
The photometry on various targets were collected in 4 runs (lasting roughly a week
each) in November 2004, December 2005, June 2006 and August 2006. Typically,
2.5 nights on each run were good for absolute photometry. The first photometry
156

Table B.1 Photometry filter properties.Name Central Wavelength (µm) FWHM (µm)
Bessel U 0.364 0.032Harris B 0.435 0.098Harris V 0.538 0.098Harris R 0.630 0.118Arizona I 0.805 0.150
J 1.25 0.16H 1.63 0.15K 2.20 0.19
campaign in November 2004 was conducted on the 1.3m McGraw-Hill telescope.
The 8K and TIFKAM were used to collect photometry in the U, B, V, R, I, J, H
and K bands. To calibrate the data, the targets were interspersed with observations
of Landolt standards (in the optical, Landolt [1983, 1992]) and CTIO standards (for
NIR, Elias et al. [1982]) at air masses similar to that of the targets. Most of our
targets are bright by astronomical standards and the telescope had to be defocussed
to avoid saturation of detector pixels. The typical donut shape for the defocussed
stellar images is shown in Fig B.2.
Figure B.2 Defocussed H band image of AB Aur.
157

Within the CCD/array, each pixel element has different quantum efficiency com-
pared to neighboring pixels. To flatten the detector response, we obtained twilight
flats. Zero light exposures (darks) were taken at different exposure times to constrain
the dark current and subtract the detector background from the data. Besides this,
we also took a number dome-light exposures close to midnight, to verify linearity of
the detectors. Fig B.3 shows the H-band counts on an ‘average’ TIFKAM InSb array
element as function of time. The element is linear to better than 3% till 8000 counts,
beyond which it begins to go non-linear. We were careful in adjusting the telescope
defocus and exposure time to keep the detector counts in the linear regime.
TIFKAM Linearity Test
0 20 40 60 80 100 120Time(s)
0
5.0•103
1.0•104
1.5•104
Cou
nts
Figure B.3 TIFKAM linearity test. The solid line is a linear fit to the data.
The McGraw-Hill telescope proved to be extremely inefficient for an observing
program like ours where the telescope needs to be moved many times between target
stars and calibrators. Under such situations the ‘pointing’ for had to be reset fairly
frequently for the telescope. For subsequent observing runs, we switched to the
Hiltner 2.4m telescope. The optical data at the 2.4m were taken with the Templeton
detector and the infrared observations were done with TIFKAM. Tables B.2 and B.3
158

present the complete observing logs from the MDM observatory.
B.3 Data Reduction
The following steps constituted the data reduction (these are standard) procedure -
• Flat Fielding: The multiple sky flats from each night were combined to pro-
duce mean flats in the observation bands. The mean flats were used to produce
flat fielded stellar images defines as
Imageclean =Imageraw − mean(Dark)
mean(Flat) − mean(Dark)(B.1)
where, Imageraw is the raw stellar image and Darks are exposures with the
camera shutters closed. Flat fielding corrects gradients in pixel gain across the
detector. Special care was taken to identify and correct for bad detector pixels
during this reduction step.
Figure B.4 Aperture photometry on a star.
159
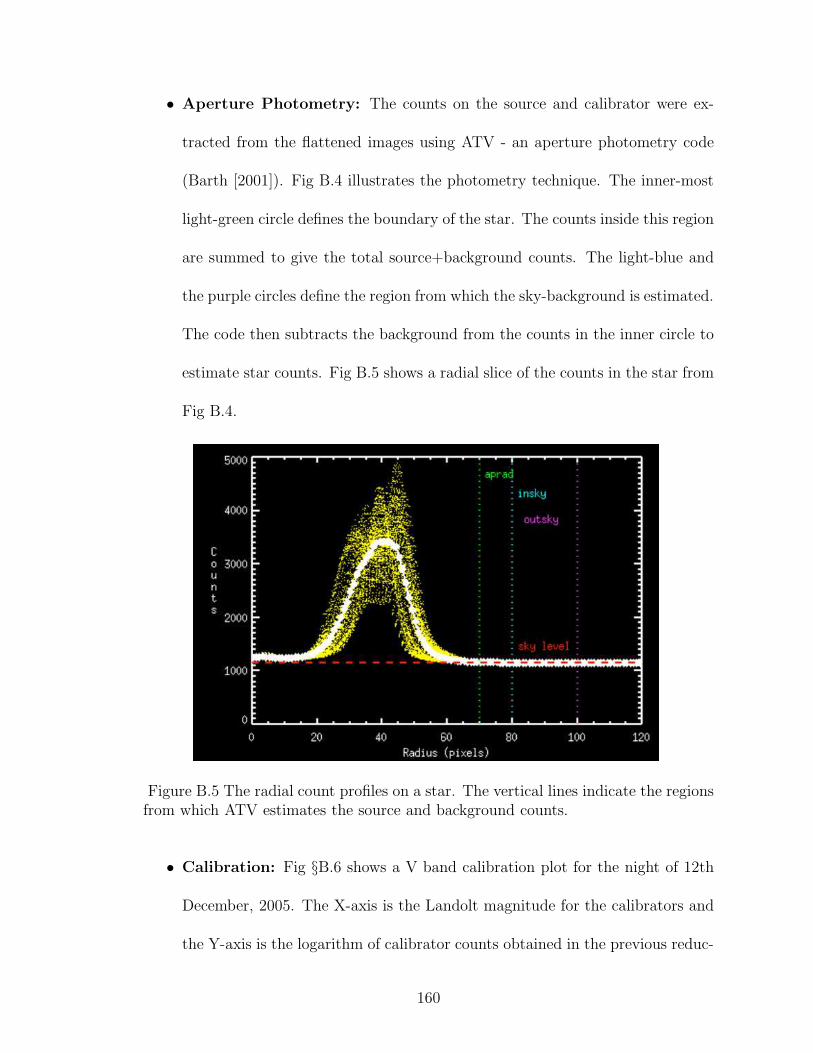
• Aperture Photometry: The counts on the source and calibrator were ex-
tracted from the flattened images using ATV - an aperture photometry code
(Barth [2001]). Fig B.4 illustrates the photometry technique. The inner-most
light-green circle defines the boundary of the star. The counts inside this region
are summed to give the total source+background counts. The light-blue and
the purple circles define the region from which the sky-background is estimated.
The code then subtracts the background from the counts in the inner circle to
estimate star counts. Fig B.5 shows a radial slice of the counts in the star from
Fig B.4.
Figure B.5 The radial count profiles on a star. The vertical lines indicate the regionsfrom which ATV estimates the source and background counts.
• Calibration: Fig §B.6 shows a V band calibration plot for the night of 12th
December, 2005. The X-axis is the Landolt magnitude for the calibrators and
the Y-axis is the logarithm of calibrator counts obtained in the previous reduc-
160

tion step. The solid line is the best linear fit with the following form -
magnitude = −2.5log(counts) + C − (1.086 × airmass × α) ± error (B.2)
The offset C and the airmass correction α are optimized with a χ2 minimization
code. The dispersion from the linear relation is a measure of the robustness of
the calibration.
This procedure is carried out in each of the bands to determine the offset and
the airmass correction. The best linear-fit formula is then used to convert the
source counts into astronomical magnitudes. Tables §B.2 and §B.3 list the
calibrated magnitudes and the error estimates for all of out targets.
The chara
V_band
8 9 10 11 12Landolt magnitude
8
9
10
11
12
Air
mas
s co
rrec
ted
expe
rimen
tal m
agni
tude
Figure B.6 V band calibration plot. The squares are MDM data points, and thesolid line is the calibration fit.
161

Table B.2: UBVRI Photometry. Majority of the MDM
targets are YSOs.
Target RA (J2000) Dec U B V R I UT Date
h m s ′ ′′
mag mag mag mag mag
HIP2080 00 26 16.5 + 03 49 33 - 6.72±0.05 6.81±0.04 6.94±0.06 6.93±0.04 08/27/2006
HIP2370 00 30 16.4 − 29 14 38 - 12.65±0.05 12.28±0.04 12.13±0.06 11.75±0.04 ”
HIP3013 00 38 20.3 −14 59 54 - 10.67±0.05 10.86±0.04 6.95± 0.06 11.07±0.04 ”
BP Tau 04 19 15.8 + 29 06 27 13.20±0.15 13.36±0.03 12.32±0.04 11.45±0.04 10.60±0.04 11/29/2004
CI Cam 04 19 42.1 +55 59 57 12.13±0.07 12.41±0.06 11.77±0.05 10.79±0.05 9.99±0.04 11/27/2004
12.32±0.08 12.70±0.04 11.75±0.05 10.64±0.05 9.82±0.09 12/10/2005
- 12.59±0.05 11.71±0.03 10.72±0.04 9.94±0.05 08/28/2006
DG Tau 04 27 04.7 +26 06 16 13.93±0.04 13.97±0.03 12.79±0.04 11.70±0.04 10.67±0.04 11/29/2004
DI Tau 04 29 42.5 +26 32 49 16.06±0.25 14.45±0.03 12.96±0.04 11.87±0.04 10.70±0.04 ”
V830 Tau 04 33 10.0 +24 33 43 14.66±0.15 13.52±0.03 12.21±0.04 11.26±0.04 10.44±0.04 ”
LkCa 15 04 39 17.8 +22 21 03 13.98±0.07 13.30±0.03 12.09±0.04 11.26±0.04 10.52±0.04 ”
GM Aur 04 55 11.0 +30 21 59 13.90±0.04 13.38±0.03 12.19±0.04 11.34±0.04 10.61±0.04 ”
AB Aur 04 55 45.8 +30 33 04 7.18±0.08 7.14 ±0.04 7.01 ± 0.04 6.96 ± 0.05 6.70±0.09 12/10/2005
- 7.19±0.05 7.05± 0.05 7.01± 0.06 6.80±0.04 08/27/2006
MWC480 04 58 46.3 +29 50 37 - 7.91±0.05 7.68± 0.03 7.62± 0.05 7.45±0.05 08/28/2006
162

Target RA (J2000) Dec U B V R I UT Date
h m s ′ ′′
UX Ori 05 04 30.0 −03 47 14 10.93±0.07 10.70±0.06 10.33±0.05 10.07±0.05 9.75±0.04 11/29/2004
10.43±0.08 10.22±0.04 9.97± 0.04 9.87± 0.05 9.56±0.09 12/10/2005
RW Aur 05 07 49.5 +30 24 05 10.86±0.04 11.07±0.03 10.32±0.04 9.78± 0.04 9.17±0.04 11/29/2004
GW Ori 05 29 08.4 +11 52 13 11.60±0.04 11.29±0.03 10.16±0.04 9.38± 0.04 8.75±0.04 11/29/2004
MWC 758 05 30 27.5 +25 19 57 8.59±0.07 8.56 ±0.06 8.28± 0.05 8.11± 0.05 7.95±0.04 11/29/2004
- 8.58 ± 0.05 8.28± 0.03 8.15± 0.04 7.92±0.05 08/28/2006
V380 Ori* 05 36 25.4 −06 42 58 10.29±0.07 10.43±0.06 10.06±0.05 9.67± 0.05 8.99±0.04 11/29/2004
10.07±0.08 10.15±0.04 9.74± 0.04 9.38 ± 0.05 8.80±0.09 08/27/2008
FU Ori 05 45 22.4 +09 04 12 - 10.80±0.08 9.52± 0.15 8.63± 0.05 8.11±0.15 11/29/2004
11.57±0.08 10.81±0.04 9.47± 0.04 8.60± 0.05 7.89±0.09 12/10/2005
- 10.87±0.05 9.65± 0.03 8.87± 0.05 8.13±0.05 08/28/2006
HD 45677 06 28 17.4 −13 03 11 7.03±0.07 7.56±0.06 7.51± 0.05 7.33± 0.05 7.24±0.04 11/27/2004
6.99±0.08 - 7.52± 0.04 7.35± 0.05 7.06±0.09 12/10/2005
MWC 147 06 33 05.2 +10 19 20 8.45±0.07 8.87±0.06 8.65± 0.05 8.30± 0.05 8.02±0.04 11/27/2004
Z CMa 07 03 43.2 -11 33 06 9.78±0.07 9.86±0.06 9.17± 0.05 8.50± 0.05 7.75±0.04 ”
MWC 166 07 04 25.5 -10 27 16 7.08±0.07 7.55±0.06 7.16± 0.05 6.97± 0.05 6.65±0.04 ”
HD 58647 07 25 56.1 −14 10 44 6.66±0.07 6.874±0.06 6.73± 0.05 6.76± 0.05 6.67±0.04 ”
IRC+10216 09 47 59.4 +13 16 44 - - >15.9 15.60±0.10 12.52±0.04 ”
163

Target RA (J2000) Dec U B V R I UT Date
h m s ′ ′′
Beta Leo 11 49 03.6 +14 34 19 - 2.36±0.09 2.18±0.08 2.17±0.09 2.22±0.07 06/09/2006
HD141569 15 49 57.8 −03 55 16 - 7.32±0.09 7.16±0.08 7.14 ±0.09 7.15±0.07 ”
- 7.32±0.05 7.14±0.04 7.23± 0.06 7.03±0.04 08/27/2006
HD142666 15 56 40.0 −22 01 40 - 9.70±0.05 9.05±0.04 8.77±0.06 8.32±0.04 08/28/2006
HD143006 15 58 36.9 −22 57 15 - 10.94±0.09 10.12±0.08 9.63±0.09 9.38±0.07 06/09/2006
- 10.95±0.05 10.14±0.04 9.75 ±0.06 9.22±0.04 08/28/2006
HD144432 16 06 58.0 −27 43 10 - 8.57 ±0.09 8.21 ±0.08 7.98±0.09 7.96±0.07 06/09/2006
- 8.62 ±0.05 8.20 ±0.03 7.97±0.04 7.83±0.04 08/28/2006
HD150193 16 40 17.9 −23 53 45 - 9.43 ±0.09 8.87±0.08 8.48±0.09 8.20±0.07 06/09/2006
(MWC863)
- 9.42 ±0.05 8.87±0.04 8.58±0.06 8.04±0.04 08/27/2006
KKOph 17 10 08.0 −27 15 18 - 12.77±0.09 12.11±0.08 11.61±0.09 11.16±0.07 06/09/2006
HD158352 17 28 49.7 +00 19 50 - 5.67 ±0.05 5.38 ±0.04 5.33±0.06 5.18±0.04 08/27/2006
HD158643 17 31 25.0 −23 57 45 - 4.81 ± 0.09 4.78 ±0.08 4.80±0.09 4.73±0.07 06/09/2006
4.87 ±0.05 4.78 ±0.03 4.81 ±0.04 4.62±0.04 08/28/2006
RSOph 17 50 13.2 −06 42 28 - 12.65±0.08 11.43±0.06 10.21±0.05 9.51±0.07 06/08/2006
MWC275 17 56 21.3 −21 57 22 - 6.98 ±0.08 6.84 ±0.06 6.86 ±0.05 6.71±0.07 ”
164
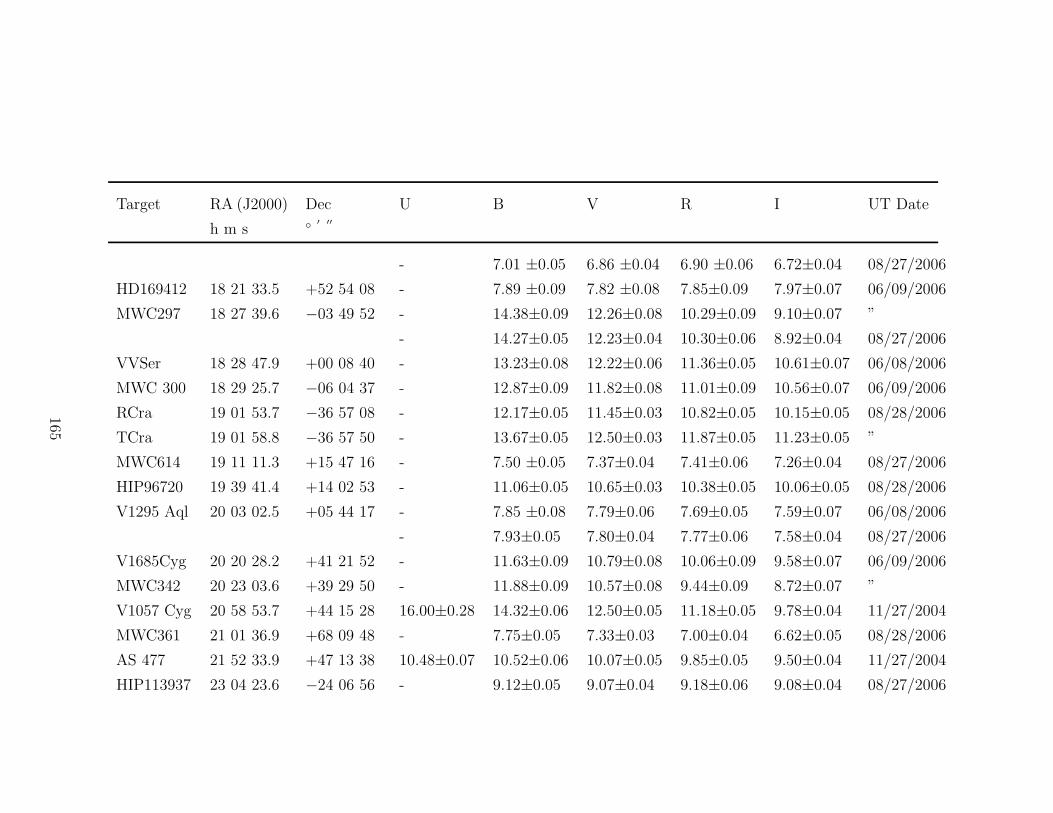
Target RA (J2000) Dec U B V R I UT Date
h m s ′ ′′
- 7.01 ±0.05 6.86 ±0.04 6.90 ±0.06 6.72±0.04 08/27/2006
HD169412 18 21 33.5 +52 54 08 - 7.89 ±0.09 7.82 ±0.08 7.85±0.09 7.97±0.07 06/09/2006
MWC297 18 27 39.6 −03 49 52 - 14.38±0.09 12.26±0.08 10.29±0.09 9.10±0.07 ”
- 14.27±0.05 12.23±0.04 10.30±0.06 8.92±0.04 08/27/2006
VVSer 18 28 47.9 +00 08 40 - 13.23±0.08 12.22±0.06 11.36±0.05 10.61±0.07 06/08/2006
MWC 300 18 29 25.7 −06 04 37 - 12.87±0.09 11.82±0.08 11.01±0.09 10.56±0.07 06/09/2006
RCra 19 01 53.7 −36 57 08 - 12.17±0.05 11.45±0.03 10.82±0.05 10.15±0.05 08/28/2006
TCra 19 01 58.8 −36 57 50 - 13.67±0.05 12.50±0.03 11.87±0.05 11.23±0.05 ”
MWC614 19 11 11.3 +15 47 16 - 7.50 ±0.05 7.37±0.04 7.41±0.06 7.26±0.04 08/27/2006
HIP96720 19 39 41.4 +14 02 53 - 11.06±0.05 10.65±0.03 10.38±0.05 10.06±0.05 08/28/2006
V1295 Aql 20 03 02.5 +05 44 17 - 7.85 ±0.08 7.79±0.06 7.69±0.05 7.59±0.07 06/08/2006
- 7.93±0.05 7.80±0.04 7.77±0.06 7.58±0.04 08/27/2006
V1685Cyg 20 20 28.2 +41 21 52 - 11.63±0.09 10.79±0.08 10.06±0.09 9.58±0.07 06/09/2006
MWC342 20 23 03.6 +39 29 50 - 11.88±0.09 10.57±0.08 9.44±0.09 8.72±0.07 ”
V1057 Cyg 20 58 53.7 +44 15 28 16.00±0.28 14.32±0.06 12.50±0.05 11.18±0.05 9.78±0.04 11/27/2004
MWC361 21 01 36.9 +68 09 48 - 7.75±0.05 7.33±0.03 7.00±0.04 6.62±0.05 08/28/2006
AS 477 21 52 33.9 +47 13 38 10.48±0.07 10.52±0.06 10.07±0.05 9.85±0.05 9.50±0.04 11/27/2004
HIP113937 23 04 23.6 −24 06 56 - 9.12±0.05 9.07±0.04 9.18±0.06 9.08±0.04 08/27/2006
165

Target RA (J2000) Dec U B V R I UT Date
h m s ′ ′′
HIP114547 23 12 09.4 −25 24 14 - 9.51±0.05 9.12 ±0.04 8.98± 0.06 8.67±0.04 ”
HIP115858 23 28 25.2 −25 25 14 - 7.09±0.05 6.88 ±0.04 6.92± 0.06 6.72±0.04 ”
166

Table B.3: JHK Photometry. Majority of the MDM tar-
gets are YSOs.
Target RA (J2000) Dec J H K UT Date
h m s ′ ′′
mag mag mag
V892Tau 04 18 40.6 +28 19 16 8.61±0.05 7.08±0.05 5.86±0.05 12/17/2005
BP Tau 04 19 15.8 +29 06 27 9.10±0.10 8.37±0.10 7.90±0.10 12/01/2004
9.05±0.05 8.32±0.05 7.85±0.05 12/17/2005
CI Cam 04 19 42.1 +55 59 58 7.20±0.10 5.68±0.10 4.44±0.10 12/01/2004
7.01±0.05 5.63±0.05 4.35±0.05 12/17/2005
DG Tau 04 27 04.7 +26 06 16 8.92±0.05 7.95±0.05 7.15±0.05 12/17/2005
V830 Tau 04 33 10.0 +24 33 43 9.36±0.05 8.73±0.05 8.52±0.05 12/17/2005
LkCa 15 04 39 17.8 +22 21 04 9.33±0.05 8.72±0.05 8.23±0.05 12/17/2005
GM Aur 04 55 11.0 +30 22 00 9.40±0.05 8.80±0.05 8.52±0.05 12/17/2005
AB Aur 04 55 45.8 +30 33 04 5.99±0.05 5.28±0.05 4.37±0.05 12/17/2005
MWC480 04 58 46.3 +29 50 37.0 6.90±0.05 6.38±0.05 5.57±0.05 12/17/2005
RW Aur 05 07 49.5 +30 24 05 8.22±0.05 7.67±0.05 7.16±0.05 12/01/2004
8.34±0.10 7.66±0.10 7.18±0.10 12/17/2005
GW Ori 05 29 08.4 +11 52 13 7.42±0.05 6.67±0.05 5.83±0.05 12/17/2005
MWC 758 05 30 27.5 +25 19 57 7.20±0.10 6.55±0.10 5.80±0.10 12/01/2004
7.26± 0.05 6.70±0.05 5.92±0.05 12/17/2005
167

Target RA (J2000) Dec J H K UT Date
h m s ′ ′′
MWC120 05 41 02.3 −02 43 00 7.24±0.05 6.66±0.05 5.77±0.05 12/17/2005
FU Ori 05 45 22.4 +09 04 12 6.55±0.05 5.89±0.05 5.32±0.05 12/17/2005
HD 45677 06 28 17.4 −13 03 11 6.85±0.05 6.22±0.05 4.61±0.05 12/17/2005
MWC 147 06 33 05.2 +10 19 20 7.34±0.05 6.70±0.05 5.73±0.05 12/17/2005
Z CMa 07 03 43.2 −11 33 06 6.66±0.05 5.45±0.05 3.94±0.05 12/17/2005
MWC 166 07 04 25.5 −10 27 16 6.32±0.05 6.32±0.05 6.27±0.05 12/17/2005
Beta Leo 11 49 03.6 +14 34 19 1.92±0.08 1.96±0.07 1.90±0.08 06/02/2006
LambdaVir 14 19 06.6 −13 22 16 4.26±0.08 4.25±0.07 4.20±0.08 ”
HD141569 15 49 57.8 −03 55 16 6.67±0.08 6.54±0.07 6.48±0.08 06/02/2006
HD143006 15 58 36.9 −22 57 15 8.18±0.08 7.57±0.07 5.94±0.08 06/02/2006
HD144432 16 06 58.0 −27 43 10 7.23±0.08 6.69±0.07 6.14±0.08 06/02/2006
HD150193 16 40 17.9 −23 53 45 6.84±0.08 6.02±0.07 5.13±0.08 06/02/2006
(MWC863)
KKOph 17 10 08.1 −27 15 18 8.46±0.08 7.09±0.07 5.71±0.08 06/02/2006
HD158643 17 31 25.0 −23 57 46 4.76±0.08 4.63±0.07 4.34±0.08 06/02/2006
RSOph 17 50 13.2 −06 42 29 7.94±0.08 7.17±0.07 6.77±0.08 06/04/2006
MWC275 17 56 21.3 −21 57 22 6.20±0.08 5.48±0.07 4.59±0.08 06/02/2006
HD169412 18 21 33.5 +52 54 08 7.77±0.08 7.78±0.07 7.79±0.08 06/02/2006
MWC297 18 27 39.6 −03 49 52 6.06±0.08 4.54±0.07 3.12±0.08 06/04/2006
168

Target RA (J2000) Dec J H K UT Date
h m s ′ ′′
VVSer 18 28 47.9 +00 08 40 8.60±0.08 7.37±0.07 6.20±0.08 06/02/2006
MWC614 19 11 11.3 +15 47 16 6.91±0.08 6.58± 0.07 5.88±0.08 06/03/2006
V1295Aql 20 03 02.5 +05 44 17 7.15±0.08 6.61±0.07 5.75±0.08 06/02/2006
V1685Cyg 20 20 28.3 +41 21 52 7.97±0.05 7.01±0.05 5.86±0.05 12/17/2005
7.93±0.10 6.96±0.04 5.81±0.07 06/03/2006
MWC342 20 23 03.6 +39 29 50 7.01±0.05 5.98±0.05 4.78±0.05 12/17/2005
6.94±0.08 5.92±0.08 4.65±0.08 06/03/2006
MWC361 21 01 36.9 +68 09 48 6.12±0.05 5.58±0.05 4.77±0.05 12/17/2005
MWC1080 23 17 25.6 +60 50 43 7.38±0.05 6.04±0.05 4.68±0.05 12/17/2005
169
Appendix C
“Effective Baselines” as a tool in characterizing
visibility information.
Let Bprojected be the projected interferometric baseline and let V(Bprojected) be the
visibility for a circularly symmetric brightness distribution. For a flat disk inclined
at angle φ and oriented at some PA, we plotted V(Beff) in Fig §3.6. The effective
baseline Beff is defined as -
Beff = Bprojected
√
cos2(θ) + cos2(φ)sin2(θ)
where θ is the angle between the uv vector for the observation and the major axis
of the inclined disk and φ is the inclination of the disk (0o inclination is face on).
Effective baselines account for the decrease in interferometric resolution due to the
inclination of the disk in the sky. They capture the geometry of flat disks correctly,
but the geometry of finitely thick disks is represented only approximately (optical
depth effects and 3-D geometry of thick disks are not taken into account). Here,
we argue that effective baselines are good (albeit approximate) tools for capturing
details of the MWC275 disk geometry.
In order to determine the inclination angle and sky orientation of the disk, we
adopted the following procedure. MC275 visibility values measured with W1W2,
S2W2 and E2S2 CHARA-telescope-pairs are close to and just prior to the first mini-
170
mum in the visibility curve (see Fig 3.6). In this region the visibility-baseline relation
for the emission models in Fig 5.42 can be approximated with a linear function. We
calculated reduced χ2 values for the best-fit line to the W1W2, S2W2 and E2S2
visibilities as a function of effective baseline, varying the assumed inclination and
position angle of the observed disk. Fig C.1 shows the reduced χ2 surface for the fits,
plotted against the assumed disk-inclination and position angle. To further illustrate
the change in quality of fits as inclination and position angles are varied , Fig C.2
shows the linear fits to the visibility vs effective baseline data set.
As seen in Figs C.1 and C.2, the quality of the fits show dramatic improvement at
MWC275 disk PA of 136o±2o and inclination of 48o±2o. These values are very close
to a disk PA of 139o±15o and inclination of 51+11−9 degrees determined in Wassell et al.
[2006]. The excellent agreement in inclination and PA values for MWC275 from two
independent methods strongly supports a disk model for MWC275, validating the
use of “effective baselines” to plot MWC275 visibilities.
171

0 20 40 60inclination (degrees)
100
150
200
250
PA
(de
gree
s)
χ2r Surface
1.53.55.0
Figure C.1 Reduced χ2 surface for linear fits to visibilities of MWC275. The visibil-ities were obtained with the W1W2, S2W2 and E2S2 CHARA-telescope-pairs andfits were made as a function of effective interferometric baseline. The solid curvesare reduced χ2 contours of 5, 3.5 and 1.5 respectively.
inclination 0o
60 80 100 120 Effective Baseline (m)
0.10
0.15
0.20
0.25
0.30
0.35
0.40
Vis
ibili
ty
χ2r = 5.91
inclination 48o, PA = 136o
60 80 100 120Effective Baseline (m)
0.10
0.15
0.20
0.25
0.30
0.35
0.40
Vis
ibili
ty
χ2r = 1.11
Figure C.2 Linear fits to the observed visibilities vs effective baseline. The datawere obtained with the W1W2, S2W2 and E2S2 CHARA-telescope-pairs. The datasymbols are explained in Fig. 3.6.
172

References
173
Acke, B. & van den Ancker, M. E. 2004a, A&A, 426, 151
Acke, B. & van den Ancker, M. E. 2004b, A&A, 422, 621
Adams, F. C., Lada & Shu, F. H. 1987, ApJ, 312, 788
Akeson, R. L., Ciardi, D. R., van Belle, G. T., Creech-Eakman, M. J. & Lada, E. A.2000, ApJ, 543, 313
Akeson, R. L., Walker, C. H., Wood, K., Eisner, J. A., Scire, E., Penprase, B.,Ciardi, D. R., van Belle, G. T., Whitney, B. & Bjorkman, J. E. 2005a, ApJ, 622,440
Akeson, R. L., Boden, A. F., Monnier, J. D., Millan-Gabet, R., Beichman, C.,Beletic, J., Calvet, N., Hartmann, L., Hillenbrand, L., Koresko, C., Sargent, A. &Tannirkulam, A. 2005b ApJ, 635, 117
Alencar, S. H. P, Basri, G., Hartmann, L. & Calvet, N. 2005, ApJ, 440, 595
Andre, P., Ward-Thompson, D. & Barsony, M. 2000, Protostars and Planets IV, 59
Artymowicz, P. & Lubow, S. H. 1994, ApJ, 421, 651
Barth, A. J. 2001, ASP Conf. Ser., 238, 385
Berger, D. H., Monnier, J. D., Millan-Gabet, R., ten Brummelaar, T. A., Muir-head, P., Pedretti, E. & Thureau, N. 2006, SPIE, 6268, 62683K
Berger, D. H., Monnier, J. D., Millan-Gabet, R. & 6 coauthors 2008, SPIE, 701319
Bernstein, R., Schectman, S. A., Gunnels, S. M., Mochnacki, S., & Athey, A. E.2003, SPIE, 4841, 1694B
Blandford, R. D & Payne, D. G. 1982, MNRAS, 199, 883
Brittain, S. D., Rettig, T. W., Simon, T. & Kulesa, C. 2005, ApJ, 626, 283
Burrows, C. J., Stapelfeldt, K. R., Watson, A. M., Krist, J. E., Ballester, G. E & 12coauthors , ApJ, 473, 437
Buscher, D. F. 1994, in IAU Symposium, Vol. 158, Very High Angular ResolutionImaging, ed. J. G. Robertson & W. J. Tango, 91–+
Calvet, N., Patino, A., Magris, C. G. & D’Alessio, P. 1991, ApJ, 380, 617
174

Calvet, N. & Gullbring, E. 1998, ApJ, 509, 802
Calvet, N., D’Alessio, P., Hartmann, L., Wilner, D., Walsh, A., & Sitko, M. 2002,ApJ, 568, 1008
Carpenter, J. M., Hillenbrand, L. A., Skrutskie, M. F. & Meyer, M. R. 2002, ApJ,124, 1001
Carr, J. S., Tokunaga, A. T. & Najita, J. 2004, ApJ, 603, 213
Chiang, E., I. & Goldreich, P. 1997, ApJ, 490, 368
Chiang, E. I., Joung, M. K., Creech-Eakman, M. J., Qi, C., Kessler, J. E.,Blake, G. A. & van Dishoeck, E. F. 2001, ApJ, 547, 1077
Corder, S., Eisner, J. & Sargent, A. 2005, ApJ, 622, L133
D’Alessio, P., Calvet, N. & Hartmann, L. 2001, ApJ, 553, 321
D’Alessio, P., Calvet, N., Hartmann, L., Franco-Hernandez, R. & Servin, H. 2006,ApJ, 638, 314
Dominik, C., Dullemond, C. P., Waters, L. B. F. M. & Walch, S. 2003, A&A, 398,607
Dubrulle, B., Morfill, G., & Sterzik, M. 1995, Icarus, 114, 237
Dullemond, C. P., Dominik, C. & Natta, A. 2001, ApJ, 560, 957
Dullemond, C. P. & Natta, A. 2003, A&A, 408, 161
Dullemond, C. P., van den Ancker, M. E, Acke, B. & van Boekel, R. 2003b, ApJ,594, L47
Dullemond, C. P. & Dominik, C. 2004, A&A, 421, 1075
Eisner, J. A., Lane, B. F., Akeson, R. L., Hillenbrand, L. A. & Sargent, A. I. 2003,ApJ, 588, 360
Eisner, J. A., Lane, B. F., Hillenbrand, L. A., Akeson, R. L. & Sargent, A. I. 2004,ApJ, 613, 1049
Eisner, J. A., Chiang, E. I., Lane, B. F. & Akeson, R. L. 2007, ApJ, 657, 347
Eisner, J. A. 2007, Nature, 447, 562
175

Elias, J. H., Frogel, J. A., Matthews, K. & Neugebauer, G. 1982, A&A, 87, 1029
Espaillat, C., et al. 2007, ApJ, 670, L135
Ferguson, J. W., Alexander, D. R., Allard, F., Barman, T., Bodnarik, J. G.,Hauschildt, P. H., Heffener-Wong, A. & Tamanai, A. 2005, ApJ, 623, 585
Fromang, S. & Papaloizou, J. 2006, A&A, 452, 751
Fukagawa, M., Hayashi, M., Tamura, M., Itoh, Y., Hayashi, S. S., Oasa, Y. & 17co-authors 2004, ApJ, 605, L53
Furlan, E. “Properties and evolution of circumstellar disks and envelopes aroundyoung, low-mass stars in the Taurus star-forming region”, 2006, Ph.D. dissertation,A&I database, Publication No. AAT 3205198
Gail H. P. 2004, A&A, 413, 571
Garcia Lopez, R., Natta, A., Testi, L. & Habart, E. 2006, A&A, 459, 847
Gibb, E. L., Van Brunt, K. A., Brittain, S. D. & Rettig, T. W. 2007, ApJ, 660, 1572
Grady, C. A., Woodgate, B., Bruhweiler, F. C., Boggess, A., Plait, P., Lindler, D. J.,Clampin, M. & Kalas, P. 1999, ApJ, 523, L151
Grady, C. A., Devine, D., Woodgate, B., Kimble, R., Bruhweiler, F. C., Boggess, A.,Linsky, J. L , Plait, P., Clampin, M. & Kalas, P. 2000, ApJ, 544, 895
Haas, M., Leinert, C., & Richichi, A. 1997, A&A, 326, 1076
Hanner, M. 1988, Grain optical properties, Technical report
Herbst, W. & Shevchenko, V. S. 1999, AJ, 118, 1043
Harries, T. J. 2000, MNRAS, 315, 722
Harries, T. J., Monnier, J. D., Symington, N. H. & Kurosawa, R. 2004, MNRAS,350, 565
Hartmann, L., Kenyon, S. J. & Calvet, N. 1993, ApJ, 407, 219
Hartmann, L., Hewett, R. & Calvet, N. 1994, ApJ, 426, 669
Herbig, G. H., 1960, ApJS , 4, 337
176

Hernandez, J., Calvet, N., Briceno, C., Hartmann, L., & Berlind, P. 2004, AJ, 127,1682
Hillenbrand, L. A., Strom, S. E., Vrba, F. J. & Keene, J. 1992, ApJ, 397, 613
Isella, A. & Natta, A. 2005, A&A, 438, 899
Isella, A., Testi, L. & Natta, A. 2006, A&A, 451, 951
Isella, A., Natta, A. & Testi, L. 2007, A&A, 469, 213
Jones, B. & Puetter, R. C. 1993, SPIE, 1946, 610
Johansen, A.& Klahr, H. 2005, ApJ, 634, 1353
Kamp, I. & Dullemond, C. P. 2004, ApJ, 615, 991
Kataza, H. & Maihara, T. 1991, A&A, 248, L1
Kenyon, S. & Hartmann, L. 1987, ApJ, 323, 714
Kenyon, S. J., Dobrzycka, D., & Hartmann, L. 1994, AJ, 108, 1872
Kenyon, S. J. & Hartmann, L. 1995, ApJS, 101, 117
Kraus, A., Hoffmann, K. H., Benisty, M., Berger, J. P. & 13 co-authors 2008b, A&A,in press
Kraus, A., Preibisch, T. & Ohnaka, K. 2008a, ApJ, 676, 490
Krist, J. E., Ardila, D. R., Golimowski, D. A., Clampin, M., Ford, H. C & 36coauthors , ApJ, 129, 1008
Kurosawa, R., Harries, T. J., Bate, M. R. & Symington, N. H. 2004, MNRAS, 351,1134
Kurosawa, R., Harries, T. J. & Symington, N. H. 2006, MNRAS, 370, 580
Kurosawa, R., Romanova, M. M. & Harries, T. J. 2008, MNRAS, 385, 1931
Kurucz, R. L. 1970, SAO Special Report 308 (Cambridge: SAO)
Lada, C. J., 1987, IAU Symp ,115, 1
Landolt, A. U. 1983, ApJ, 88, 439
177

Landolt, A. U. 1992,A&A, 104, 340
Lamers, H. J. G. L. M. & Waters, L. B. F. M. 1984, A&A, 136, 37
Lawson, P. R., et al. 2004, Proceedings of SPIE, Vol. 5491. p.886
Lawson, P. R., et al. 2006, Proceedings of SPIE, Vol. 6268, pp. 62681U
Leinert, C., Haas, M., Abraham, P., & Richichi, A. 2001, A&A, 375, 927
Leinert, Ch., van Boekel, R., Waters, L. B. F. M., Chesneau, O.,Malbet, F. &Kohler, R. 2004, A&A, 423, 537
Lissauer, J. J & Stevenson, D. J. 2007, Protostars and Planets V, 591
Lin, D. N. C., Bodenheimer, P. & Richardson, D. C. 1996, Nature, 380, 606
Lin, S., Ohashi, N., Lim, J., Ho, P., Fukagawa, M. & Tamura ,M. 2006, ApJ, 645,1297
Liu, W. M., et al. 2005, ApJ, 618, L133
Liu, W. M., Hinz, P. M., Meyer, M. R., Mamajek, E. E., Hoffmann, W. F., Brusa, G.,Miller, D.& Kenworthy, M. A. 2007, ApJ, 658, 1164
Lucy, L. B. 1999, A&A, 344, 282
Mannings, V. & Sargent, A. I. 1997 ApJ, 490, 792
Marinas, N., Telesco, C. M., Fisher, R. S., Packham, C.& Radomski, J. T. 2006, 653,1353.
Matthews, K., Ghez, A. M., Weinberger, A. J., & Neugebauer, G. 1996, PASP, 108,615
McCarthy, D. W. & Low, F. J. 1975 ApJ, 202, 37
Meeus2001, G., Waters, L. B. F. M., Bouwman, J., van den Ancker, M. E.,Waelkens, C. & Malfait, K. 2001, A&A, 365, 476
Merand, A., Borde, P. & Coude Du Foresto, V. 2004, A&A, 433, 1155
Michelson, A. A. & Pease, F. G. 1921, ApJ, 53, 249
Millan-Gabet, R., Schloerb, F. P., Traub, W. A., Malbet, F., Berger, J. P. & Breg-
178

man, J. D. 1999, ApJ, 513, L131
Millan-Gabet, R., Schloerb, F. P. & Traub, W. A. 2001, ApJ, 546, 358
Millan-Gabet, R., Monnier, J. D. & Berger, J. P., Traub, W. A. & 12 coauthors 2006,ApJ, 645, L77
Millan-Gabet, R., Malbet, F., Akeson, R., Leinert, C., Monnier, J. D. & Waters, R.2007, Protostars and Planets V, 539
Miroshnichenko, A., Ivezic, Z. & Elitzur, E. 1997, ApJ, 475, 41
Monnier, J. D., Principles of LongBaseline Stellar Interferometry, Course notes fromthe 1999 Michelson Summer School, Edited by P. R. Lawson (JPL Publication)2000, 9, 203
Monnier, J. D. & Millan-Gabet, R. 2002, ApJ, 579, 694
Monnier, J. D., Tuthill, P. G., Ireland, M. J., Cohen, R. & Tannirkulam, A. 2004,AAS 205, 36, 1367
Monnier, J. D., Millan-Gabet, R., Billmeier, R., Akeson, R. L., Wallace, D., Berger,J. P., Calvet, N., D’Alessio, P., Danchi, W. C., Hartmann, L. & 24 coauthors,2005, ApJ, 624, 832
Monnier, J. D., Berger, J. P., Millan-Gabet, R., Traub, W. A., Schloerb, F. P.,Pedretti, E., Benisty, M., Carleton, N. P., Haguenauer, P., Kern, P., Labeye, P.,Lacasse, M. G., Malbet, F., Perraut, K., Pearlman, M. & Zhao, M. 2006, ApJ,647, 444
Monnier, J. D., Zhao, M., Pedretti, E., Thureau, N., Ireland, M., Muirhead, P.,Berger, J. P., Millan-Gabet, R., Van Belle, G., ten Brummelaar, T., McAlister, H.,Ridgway, S., Turner, N., Sturmann, L., Sturmann, J. & Berger, D. 2007, Science,317, 342
Monnier, J. D., Tannirkulam, A., Tuthill, P. G., Ireland, M., Cohen, R.,Danchi, W. C. & Baron, F. 2008, ApJ, 681, L97
Monnier, J. D. et al. 2008, in preparation.
Mottram, J. C., Vink, J. S., Oudmaijer, R. D. & Patel, M. 2007, MNRAS, 377, 1363
Muzerolle, J., Calvet, N. & Hartmann, L. 1998, ApJ, 492, 743
Muzerolle, J., Calvet, N. & Hartmann, L. 2001, ApJ, 550, 944
179
Muzerolle, J., D’Alessio, P., Calvet, N., & Hartmann, L. 2004, ApJ, 617, 406
Nagasawa, M., Thommes, E. W., Kenyon, S. J., Bromley, B. C. & Lin, D. N. C.2007, Protostars and Planets V, 639
Najita, J., Carr, J. & mathieu, R. D. 2003, ApJ, 589, 931
Najita, J., Carr, J., Glassgold, A. E. & Valenti, J. A. 2007, Protostars and PlanetsV, 507
Natta, A., Prusti, T., Neri, R., Wooden, D., Grinin, V. P. & Mannings, V. 2001,A&A, 371, 186
Natta, A., Testi, L., Neri, R., Sheperd, D. S. Wilner, D. J. 2004, A&A, 416, 179
Oppenheimer, B. R., Brenner, D., Hinkley, S., Zimmerman, N., Sivaramakrishnan, A.& 7 coauthors 2008, ApJ, 680
Ossenkopf, V., Henning, Th., Mathis, J. S. 1992, A&A, 261, 567
Pascucci, I., Wolf, S., Steinacker, J., Dullemond, C. P., Henning, Th., Niccolini, G.,Woitke, P. & Lopez, B., A&A, 2004, 417, 793.
Pinte, C., Menard, F., Berger, J. P., Benisty, M. & Malbet, F. 2008 A&A, in press
Pollack, J. B., Hollenbach, D., Beckwith, S., Simonelli, P. D., Roush, T. & Fong, W.1994, ApJ, 421, 615
Pollack, J. B., Hubickyj, O., Bodenheimer, P., Lissauer, J. J., Podolak, M. & Green-zweig, Y. 1996, Icarus, 124, 1, 62
Pontoppidan, K. M., Dullemond, C. P., Blake, G. A., Adwin Boogert, A. C.,van Dishoeck, E. F., Evans, N. J., Kessler-Silacci, J. & Lahuis, F. 2007, ApJ,656, 980.
Rettig, T., Brittain, S., Simon, T., Gibb, E., Balsara, D. S., Tilley, D. A. & Kulesa,C. 2006, ApJ, 646, 342
Robitaille, T. P., et al. 2006, ApJS, 167, 256
Romanova, M. M., Kulkarni, A. K. & Lovelace, R. V. E. 2008, ApJ, 673, L171
Semenov, D., Pavlyuchenkov, Ya., Schreyer, K., Henning, Th., Dullemond, C. &Bacmann, A. 2005, ApJ, 621, 853
180
Shakura, N. I. & Sunyaev, R. A. 1973, A&A, 24, 337
Strom, K. M. & Strom, S. E. 1994, ApJ, 424, 237
Shu, F. H., Adams, F. C. & Lizano, S. 1987, Annual Review of Astronomy andAstrophysics, 25, 23
Sitko, S. L., Carpenter, W. J., Kimes, R. L., Wilde, J. L., & 11 coauthors, J. P. 2008,ApJ, 678, 1070
Smith, K. W., et al. 2005, A&A, 431, 307
Tanaka, H., Himeno Y., & Ida, S. 2005, ApJ, 625, 414
Tannirkulam, A., Harries, T. J., & Monnier, J. D. 2007, ApJ, 661, 374
Tannirkulam, A., Monnier, J. D., Millan-Gabet, R., Harries, T. J., Pedretti, E. & 4coauthors 2008, ApJ, 677, L51
Tannirkulam, A., Monnier, J. D., Harries, T. J.,Millan-Gabet, R., Zhao, Z., Pe-dretti, E. & 6 coauthors 2008, ApJ, accepted
Tatulli, E., Isella, A., Testi, L., Marconi, A. & 94 coauthors 2007, A&A, 464, 29
ten Brummelaar, T. A., McAlister, H. A., Ridgway, Bagnuolo, W. G. Jr.,Turner, N. H. & 8 coauthors 2005, ApJ, 628, 453
Turner, N. J, Willacy, K., Bryden, G. & Yorke. H. W. 2006, ApJ, 639, 1218
Tuthill, P. G., et al. 2000, PASP, 112, 555
Tuthill, P. G., Monnier, J. D. & Danchi, W. C. 2001, Nature, 409, 1012
van Boekel, R., Min, M., Leinert, Ch., Waters, L. B. F. M., Richichi, A., Ches-neau, O., Dominik, C., Jaffe, W., Dutrey, A., Graser, U., Henning, Th., de Jong, J.,Kohler, R., de Koter, A., Lopez, B., Malbet, F., Morel, S., Paresce, F., Perrin, G.,Preibisch, Th., Pryzgodda, F., Scholler, M. & Wittkowski, M. 2004, Nature, 432,479
van Boekel, R., Min, M., Waters, L. B. F. M., de Koter, A., Dominik, C., van den An-cker, M. E. & Bouwman, J. 2005, A&A, 437, 189
van Boekel, R., Dullemond, C. P. & Dominik, C. 2005, A&A, 441, 563
Vinkovic, D., Ivezic, Z., Jurkic, T. & Elitzur, M. 2006, ApJ, 636, 348
181

Vinkovic, D. 2006b, ApJ, 651, 906
Wassell, E. J., Grady, C. A., Woodgate, B., Kimble, R. A. & Bruhweiler, F. C. 2006,ApJ, 650, 985
Walker, C., Wood, K., Lada, C. J., Robitaille, T., Bjorkman, J. E. & Whitney, B.2004, MNRAS, 351, 607
Waters, L. B. F. M, & Waelkens, C. 1998, Annual Review of Astronomy and Astro-physics, 36, 233
Weidenschilling, S. J. & Cuzzi, J. N. 1993, Protostars and Planets III, 1031
Weiner, J., Tatebe, K.,Hale, D. D. S., Townes, C. H., Monnier, J. D., Ireland, M.,Tuthill, P. G., Cohen, R., Barry, R. K., Rajagopal, J. & Danchi, W. C. 2006 ApJ,636, 1067
Weingartner, J. C. & Draine, B. T. 2001, ApJ, 548, 296
Wetherill, G. W. 1990, Icarus, 88, 336
Wilking, B. A., 1989, PASP ,101, 229
Wood, K., Mathis, J., S. & Ercolano, B. 2004, MNRAS, 348, 1337
Zhu, Z., Hartmann, L., Calvet, N., Hernandez, J., Muzerolle, J., & Tannirkulam, A.2007, ApJ, 669, 483
182