a computational framework for sound segregation in music signals using marsyas
DESCRIPTION
Slides of my talk @ Google - Auditory Modeling workshop, Nov. 19. 2010TRANSCRIPT

A Computational Framework for Sound Segregation in Music
Signals
Luís Gustavo Martins CITAR / Escola das Artes da UCP
Porto, Portugal
Auditory Modeling Workshop Google, Mountain View, CA, USA
19.11.2010
Acknowledgments
A Computational Framework for Sound Segregation in Music Signals 2
} This work is the result of the collaboration with: } University of Victoria, BC, Canada
} George Tzanetakis, Mathieu Lagrange, Jennifer Murdock
} All the Marsyas team
} INESC Porto
} Luis Filipe Teixeira
} Jaime Cardoso
} Fabien Gouyon
} Technical University of Berlin, Germany
} Juan José Burred
} FEUP PhD Advisor Professor } Aníbal Ferreira
} Supporting entities } Fundação para a Ciência e a Tecnologia - FCT } Fundação Calouste Gulbenkian
} VISNET II, NoE European Project

Research Project
A Computational Framework for Sound Segregation in Music Signals 3
} FCT R&D Project (APPROVED FOR FUNDING) } A Computational Auditory Scene Analysis Framework for Sound Segregation in Music Signals
} 3-year project (starting Jan. 2011) } Partners:
} CITAR (Porto, Portugal) Luís Gustavo Martins (PI), Álvaro Barbosa, Daniela Coimbra
} INESC Porto (Porto, Portugal) Fabien Gouyon
} UVic (Victoria, BC, Canada) George Tzanetakis
} IRCAM (Paris, France) Mathieu Lagrange
} Consultants } FEUP (Porto, Portugal)
Prof. Aníbal Ferreira, Prof. Jaime Cardoso } McGill University / CIRMMT (Montreal, QC, Canada)
Prof. Stephan McAdams

Summary
A Computational Framework for Sound Segregation in Music Signals 4
} Problem Statement } The Main Challenges } Current State } Related Research Areas } Main Contributions } Proposed Approach } Results } Software Implementation } Conclusions and Future Work

Problem Statement
A Computational Framework for Sound Segregation in Music Signals 5
} Propose a computational sound segregation framework } Focused on music signals
} But not necessarily limited to music signals } Perceptually inspired
} So it can build upon the current knowledge of how listeners perceive sound events in music signals
} Causal } So it mimics the human auditory system and allows online processing of sounds
} Flexible } So it can accommodate different perceptually inspired grouping cues
} Generic } So it can be used in different audio and MIR application scenarios
} Effective } So it can improve the extraction of perceptually relevant information from musical
mixtures } Efficient
} So it can find practical use in audio processing and MIR tasks

MUSIC LISTENING
ABSTRACT
KNOWLEDGE
STRUCTURES
EVENT
STRUCTURE
PROCESSING
EXTRACTION
OF
ATTRIBUTES
AUDITORY
GROUPING
PROCESSES
MENTAL
REPRESENTATION OF
SOUND
ENVIRONMENT
TR
AN
SD
UC
TIO
N
TR
AN
SD
UC
TIO
N
ATTENTIONAL
PROCESSES
Figure 2: The main types of auditory processing and their interactions (adaptedfrom [McAdams and Bigand, 1993]).
possible to extract perceptual attributes which provide a representation of each element in
the auditory system.
These attributes can now be interpreted with respect to evoked abstracted knowledge
structures that allow the recognition and identification of events and sequences of events,
as well as the assignment of meaning and significance. All this is performed at the light
of the local stimulus context and the past experience of the listener (see the discussion of
schema-based grouping in section 2.3.1).
These perceived relations among sound events can influence the perception of sub-
sequent events (and even revise past interpretations – e.g. the McAdams-Reynolds
oboe example [McAdams, 1984] or the “old-plus-new” organization principle described
in [Bregman, 1990, pp.261]). This event structure processing influences the establishment
of larger-scale structural relations.
The resulting elements from the event structure processing give rise to the progressive
creation of a mental representation of the sound environment involving the listener. Given
the transitory nature of the acoustic stimulus, information about acoustic events must
be somehow accumulated through time. This accumulated mental representation takes
a crucial part on the ability to dynamically focus attention to new incoming acoustic
16
} Human listeners are able to perceive individual sound events in complex mixtures } Even if listening to:
} Monaural music recordings } Unknown sounds, timbres or instruments
} Perception is influenced by several complex factors } Listener’s prior knowledge, context, attention, … } Based on both low-level and high-level cues
} Difficult to replicate computationally…
The Main Challenges
A Computational Framework for Sound Segregation in Music Signals 8

The Main Challenges
A Computational Framework for Sound Segregation in Music Signals 9
} Why Music Signals? } Music sound is, in some senses, more challenging to analyse
than non-musical sounds } High time-frequency overlap of sources and sound events
Music composition and orchestration Sources that often play simultaneously polyphony Favor consonant pitch intervals Sound sources are highly correlated
} High variety of spectral and temporal characteristics Musical instruments present a wide range of sound production
mechanisms } Techniques traditionally used for monophonic, non-musical
or speech signals perform poorly
} Yet, music signals are usually well organized and structured

Current State
A Computational Framework for Sound Segregation in Music Signals 10
} Typical systems in MIR } Represent statistically the entire sound mixture
} Analysis and retrieval performance reached a “glass ceiling” [Aucouturier and Pachet, 2004]
} New Paradigm } Attempt to individually characterize the different sound
events in a sound mixture } Performance still quite limited when compared to human auditory
system } But already provides alternative and improved approaches to common
sound analysis and MIR tasks

Applications
A Computational Framework for Sound Segregation in Music Signals 11
} “Holy grail” applications } “The Listening Machine” } “The Robotic Ear”
} “Down to earth” applications } Sound and Music Description } Sound Manipulation } Robust Speech and Speaker Recognition } Object-based Audio Coding } Automatic Music Transcription } Audio and Music Information Retrieval } Auditory Scene Reconstruction } Hearing Prostheses } Up-mixing } …

Related Research Areas
A Computational Framework for Sound Segregation in Music Signals 12
} Sound and Music Computing (SMC) [Serra et al., 2007]
} Computational Auditory Scene Analysis (CASA) [Wang and Brown, 2006]
} Perception Research } Psychoacoustics [Stevens, 1957]
} Auditory Scene Analysis (ASA) [Bregman, 1990]
} Digital Signal Processing [Oppenheim and Schafer, 1975]
} Music Information Retrieval (MIR) [Downie, 2003]
} Machine Learning [Duda et al., 2000]
} Computer Vision [Marr, 1982]

Related Areas
A Computational Framework for Sound Segregation in Music Signals 13
} Auditory Scene Analysis (ASA) [Bregman, 1990] } How do humans “understand” sound mixtures? } Find packages of acoustic evidence such that each package has
arisen from a single sound source
} Grouping Cues } Integration
Simultaneous vs. Sequential Primitive vs. schema-based
} Cues Common amplitude, frequency, fate Harmonicity Time continuity …
Time

Related Areas
A Computational Framework for Sound Segregation in Music Signals 14
} Computational Auditory Scene Analysis (CASA) [Wang and Brown, 2006]
} “Field of computational study that aims to achieve human performance in ASA by using one or two microphone recordings of the acoustic scene.” [Wang and Brown, 2006]
MUSIC LISTENING
SOURCE
MODELS
ANALYSIS
FRONT-END
MID-LEVEL
REPRESENTATION
SCENE
ORGANIZATION
GROUPING
CUES
STREAM
RESYNTHESIS
ACOUSTIC
MIXTURE
SEGREGATED
SIGNALS
Figure 3: System Architecture of a typical CASA system.
reference in the development of sound source separation systems, since it is the only ex-
isting system which can robustly separate sound sources in various circumstances. As
a result, the resynthesis of the separated signals allows to assess the performance of a
CASA system by means of listening tests or by using objective measurements (see Sec-
tion 2.4.5 for a more thorough discussion on the evaluation approaches traditionally used
in CASA). The resynthesis of the segregated components in an acoustic mixture is also of
great interest to most CASA applications (see Section 1.4).
2.4.3 Mid-level Representations for Music Signals
One of the most common digital representations of an acoustical signal is the sampled
waveform, also known as the time-domain representation (see top panel of Figure 4).
Each sample describes the sound pressure level of the acoustic signal at a specific time,
allowing an adequate visualization of the variation of the energy of the signal along time.
Although this representation allows the efficient visual inspection of some signal fea-
tures (e.g. it is easy to identify silence regions, the onsets of sound events, fade ins and
outs) and is the input of many basic audio signal analysis and processing operations, it is
not directly suitable for some more challenging tasks, such as the segregation of complex
music mixtures.
As a result, some other type of representation is necessary to bring out more clearly
the important characteristics of the signal for the application in hand, usually leading to
a so-called mid-level representation. Mid-level representation is a concept mainly coming
30

Main Contributions
A Computational Framework for Sound Segregation in Music Signals 15
} Proposal and experimental validation of a flexible and efficient framework for sound segregation } Focused on “real-world” polyphonic music } Inspired by ideas from CASA } Causal and data-driven
} Definition of a novel harmonicity cue
} Termed Harmonically Wrapped Peak Similarity (HWPS) } Experimentally shown as a good grouping criteria
} Software implementation of the proposed sound segregation framework } Modular, extensible and efficient } Made available as free and open source software (FOSS)
} Based on the MARSYAS framework

Proposed Approach
A Computational Framework for Sound Segregation in Music Signals 16
} Assumptions } Perception primarily depends on the use of low-level sensory
information } Does not necessarily require prior knowledge (i.e. training) } Still able to perform primitive identification and segregation of sound
events in a sound mixture
} Prior knowledge and high-level information can still be used } To award additional meaning to the primitive observations } To consolidate primitive observations as relevant sound events } To modify the listener’s focus of attention

Proposed Approach
A Computational Framework for Sound Segregation in Music Signals 19
} System overview
Sinusoidal
Synthesis
Texture Window
Spectral Peaks
(over Texture Window)
150ms
Spectral
Peaks
46ms
Sinusoidal
Analysis
Spectral
Peaks
46ms
Cluster Selection
Similarity Computation
Normalized Cut

Analysis Front-end
A Computational Framework for Sound Segregation in Music Signals 22
} Sinusoidal Modeling } Sum of highest amplitude sinusoids at each frame peaks
} Maximum of 20 peaks/frame } Window = 46ms ; hop = 11ms } Parametric model: Estimate Amplitude, Frequency, Phase of each peak
freq
uenc
y
Spectral Peaks
Sinusoidal Analysis
Spectral Peaks
46ms
Time Segmentation
A Computational Framework for Sound Segregation in Music Signals 23
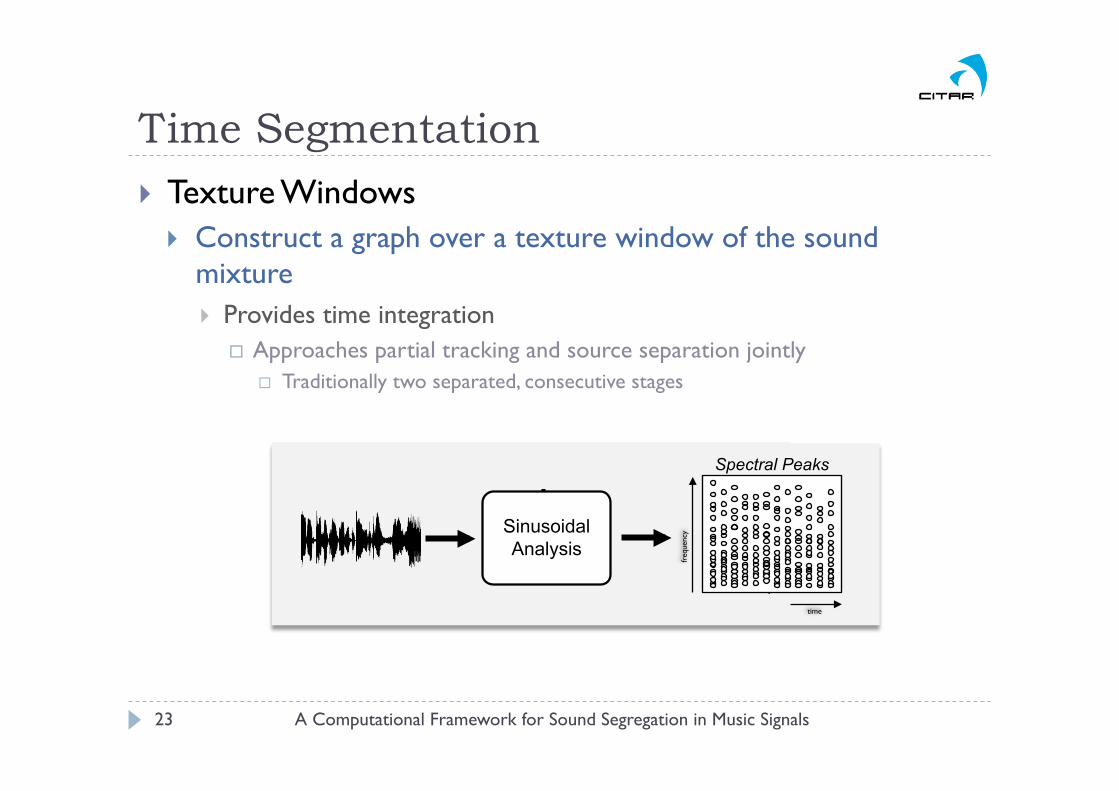
} Texture Windows } Construct a graph over a texture window of the sound
mixture } Provides time integration
Approaches partial tracking and source separation jointly Traditionally two separated, consecutive stages
Spectral Peaks
Sinusoidal Analysis
time
freq
uenc
y
Spectral Peaks
Sinusoidal Analysis
Texture Window
Time Segmentation
A Computational Framework for Sound Segregation in Music Signals 24
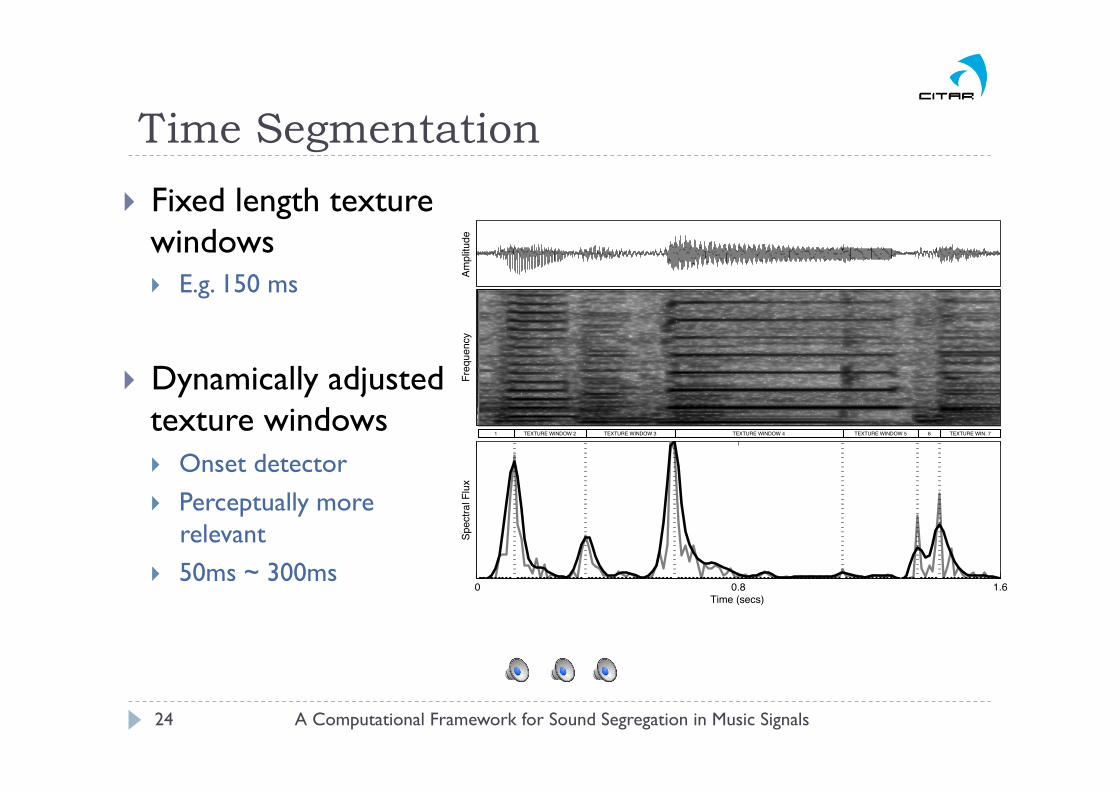
} Fixed length texture windows } E.g. 150 ms
} Dynamically adjusted texture windows } Onset detector } Perceptually more
relevant } 50ms ~ 300ms
Am
plit
ude
Fre
quency
0 0.8 1.6
Time (secs)
Spectr
al F
lux
1 TEXTURE WINDOW 2 TEXTURE WINDOW 3 TEXTURE WINDOW 4 TEXTURE WINDOW 5 6 TEXTURE WIN. 7

Perceptual Cues as Similarity Functions
A Computational Framework for Sound Segregation in Music Signals 25
Similarity Computation
AMPLITUDE SIMILARITY
FREQUENCY SIMILARITY
HARMONIC SIMILARITY
(HWPS)
AZIMUTH PROXIMITY
COMMONONSETOFFSET
SOURCEMODELS
COMBINER
Spectral Peaks(over Texture Window)
150ms
OVERALLSIMILARITY MATRIX
Normalized Cut
...

Perceptual Cues as Similarity Functions
A Computational Framework for Sound Segregation in Music Signals 26
} Grouping Cues (inspired from ASA) } Similarity between time-frequency components in a texture window
} Frequency proximity } Amplitude proximity } Harmonicity proximity (HWPS) } …
} Encode topological knowledge into a similarity graph/matrix } Simultaneous integration (peaks within the same frame) } Sequential integration over the texture window
Similarity Matrix
A0 A1 A2 A3 B3, A4 B0 B1 B2 B4
A0
A1
A2
A3
B3, A4
B0
B1
B2
B4
xixj
xk
wij = wji
xq
xp
xl

Perceptual Cues as Similarity Functions
A Computational Framework for Sound Segregation in Music Signals 27
} Defining a Generic Similarity Function } Fully connected graphs
} Gaussian similarity function How to define neighborhood width (σ)?
Local statistics from data in a Texture Window Use prior knowledge (e.g. JNDs) Use σ as weights (after normalizing the Sim. Fun. to [0,1])
0 0.25 0.5 0.75 1 1.25 1.5 1.75 2 2.25 2.5
0.25
0.5
0.75
1
d(xi, xj)
wij
σ=
0.4 σ =1.0
σ = 1.2
wij = e−
“d(xi,xj)
σ
”2
xi
xj
wij = wji

Perceptual Cues as Similarity Functions
A Computational Framework for Sound Segregation in Music Signals 28
} Amplitude and Frequency Similarity } Amplitude
} Gaussian function of the Euclidean distances In dB more perceptually relevant
} Frequency } Gaussian function of the Euclidean distances
In Bark more perceptually relevant
} Not sufficient to segregate harmonic events } Nevertheless are important to group peaks from:
Inharmonic or noisy frequency components in harmonic sounds Non-harmonic sounds (unpitched sounds)
PERCEPTUAL CUES AS GROUPING CRITERIA
3.7 Perceptual Cues as Grouping Criteria
Following the more generic considerations about the definition of a similarity function for
spectral clustering presented in Section 3.6.2, this section will focus on the specification
of grouping criteria that attempt to capture the perceptual proximity between sound
components (i.e. peaks) in accordance to some of the perceptual grouping principles
discussed in Section 2.3.1. These include frequency and amplitude proximity and a novel
harmonicity criterion, termed Harmonically Wrapped Peak Similarity (HWPS). Such a
harmonicity criterion is of upmost importance since amplitude and frequency cues are not
enough for segregating multiple overlapping harmonic sound sources.
Still, the proposed framework is able to easily accommodate future similarity functions
such as frequency or time masking [Lagrange et al., 2006], common fate, stereo location,
or other grouping principles, allowing to model an increasing number of perceptual mech-
anisms involved in human hearing (discussed in Section 2.3.1).
3.7.1 Amplitude and Frequency Similarity
Two of the most basic similarities explored by the auditory system are related to the
frequency and amplitude features of the sound components in a sound mixture (see Sec-
tion 2.3.1).
Accordingly, the edge weight connecting two peaks pkl and pk+n
m will depend on their
frequency and amplitude proximities. Following the generic considerations discussed for
the definition of a similarity function for spectral clustering in Section 3.6.2, amplitude
and frequency similarities, Wa and Wf respectively, are defined as follows:
Wa(pkl , p
k+nm ) = e
−„
akl −ak+n
mσa
«2
(18)
Wf (pkl , p
k+nm ) = e
−„
fkl −fk+n
mσf
«2
(19)
where the Euclidean distances are modeled as two Gaussian functions, as previously de-
fined in Equation 8. The amplitudes are measured in Decibels (dB) and the frequencies
are measured in Barks (a frequency scale approximately linear below 500 Hz and logarith-
mic above), since these scales have shown to better model the the sensibility response of
the human ear [Hartmann, 1998].
79

Perceptual Cues as Similarity Functions
A Computational Framework for Sound Segregation in Music Signals 29
} Harmonically Wrapped Peak Similarity (HWPS) } Harmonicity is one of the most powerful ASA cues [Wang and Brown, 2006]
} Proposal of a novel harmonicity similarity function } Does not rely on the prior knowledge of f0 in the signal } Takes into account spectral information in a global manner (spectral patterns)
For peaks in a same frame or in different frames in a Texture Window Takes into consideration the amplitudes of the spectral peaks
} 3 step algorithm Shifted Spectral Pattern Wrapped Frequency Space Histogram computation Discrete Cosine Similarity [0,1]
PERCEPTUAL CUES AS GROUPING CRITERIA
STEP 3 – Discrete Cosine Similarity
The last step is now to correlate the two shifted and harmonically wrapped spec-
tral patterns (F kl and F
k+nm ) to obtain the HWPS measure between the two correspond-
ing peaks. This correlation can be done using an algorithmic approach as proposed in
[Lagrange and Marchand, 2006], but this was found not to be reliable or robust in prac-
tice. Alternatively, the proposal is to discretize each shifted and harmonically wrapped
spectral pattern into an amplitude weighted histogram, Hkl , corresponding to each spec-
tral pattern Fkl . The contribution of each peak to the histogram is equal to its amplitude
and the range between 0 and 1 of the Harmonically-Wrapped Frequency is divided into
20 equal-size bins (a 12 or a 24 bin histogram would provide a more musically meaning-
ful chroma-based representation, but preliminary and empirical tests have shown better
results when using 20 bin histograms).
In addition, the harmonically wrapped spectral patterns are also folded into an octave
to form a pitch-invariant “chroma” profile. For example, in Figure 19, the energy of the
spectral pattern in wrapped frequency 1 (all integer multiples of the wrapping frequency)
is mapped to histogram bin 0.
The HWPS similarity between the peaks pkl and p
k+nm is then defined based on the
cosine distance between the two corresponding discretized histograms as follows:
Wh(pkl , p
k+nm ) = HWPS(pk
l , pk+nm ) = e
0
@ c(Hk
l,H
k+nm )
rc(Hk
l,H
k
l)·c(Hk+n
m ,Hk+nm )
1
A2
(28)
where
c(Hba, H
dc ) =
�
i
Hba(i)×H
dc (i)�
. (29)
One may notice that due to the wrapping operation of Equation 25, the size of the
histograms can be relatively small (e.g. 20 bins), thus being computationally efficient. A
Gaussian function is also used for controlling the neighborhood width of the harmonicity
cue, where σh = 1 is implicitly used in the current system implementation.
An Intuitive View on HWPS
The three steps that compose the HWPS algorithm presented in the previous section can
be more intuitively understood if looking at the following example scenarios.
As a first example, imagine that in a frame k there are six peaks from two harmonic
95
Wh(pkl , p
k+nm ) = HWPS(pkl , p
k+nm ) = e
−�1− c(Hk
l,H
k+nm
)√c(Hk
l,H
k
l)×c(Hk+n
m ,Hk+nm )
�2

Perceptual Cues as Similarity Functions
A Computational Framework for Sound Segregation in Music Signals 30
} HWPS } Between peaks of a same
harmonic “source” } In a same frame
High similarity (~1.0)
A0 B0
A1 B1
B2A2
f0A f0B 2f0A 3f0A 3f0B2f0B0
frame k
01
3f0
0
−f0A
f0A
2f0A
3f0A
4f0A
01
3f0
0
−f0A
f0A
2f0A
3f0A
4f0A
01
3f0
0
−f0A
f0A
2f0A
3f0A
4f0A
01
3f0
0
−f0A
f0A
2f0A
3f0A
4f0A
fkA1
= 2f0A
SHIFTING
SHIFTING
fkA0
= f0A
A1
A0
HWPS(A1, A0)|h=f0A
F kA1
F kA1 F k
A0F k
A0
F kA0
F kA1
dB
High HWPS(A1, A0)|h=f0A
= =
0 1
A1 A0
F kA1
= = F kA0
A1A0

Perceptual Cues as Similarity Functions
A Computational Framework for Sound Segregation in Music Signals 31
} HWPS } Between peaks of
different harmonic “sources”
} In a same frame
Low similarity (~0.0)
A0 B0
A1 B1
B2A2
f0A f0B 2f0A 3f0A 3f0B2f0B0
frame k
01
3f0
0
−f0A
f0A
2f0A
3f0A
4f0A
01
3f0
0
−f0A
f0A
2f0A
3f0A
4f0A
01
3f0
0
−f0A
f0A
2f0A
3f0A
4f0A
01
3f0
0
−f0A
f0A
2f0A
3f0A
4f0A
F kA1
= = F kB0
fkA1
= 2f0A
SHIFTING
SHIFTING
fkB0
= f0B
A1
HWPS(A1, B0)|h=f0A
F kA1
F kA1 F k
B0F k
B0
F kB0
F kA1
dB
B0
!
A1 B0
A1B0
Low HWPS(A1, B0)|h=f0A
=
0 1

Perceptual Cues as Similarity Functions
A Computational Framework for Sound Segregation in Music Signals 32
} HWPS } Between peaks of a same
harmonic “source” } In different frames
Mid-High similarity
Interfering spectral content may be different Degrades HWPS… Only consider bin 0?
A0 B0
A1 B1
B2A2
f0A f0B 2f0A 3f0A 3f0B2f0B0
frame k
F kA1
= = F k+nA0
dBA0
A1A2
f0A 2f0A 3f0A0
dB
frame k + n
C0
C1
C2
f0C 2f0C 3f0C
01
3f0
0
−f0A
f0A
2f0A
3f0A
4f0A
01
3f0
0
−f0A
f0A
2f0A
3f0A
4f0A
01
3f0
0
−f0A
f0A
2f0A
3f0A
4f0A
01
3f0
0
−f0A
f0A
2f0A
3f0A
4f0A
fkA1
= 2f0A
SHIFTING
SHIFTING
Ak1
HWPS(Ak1 , Ak+n
0 )|h=f0A
F kA1
F kA1
F k+nA0
F k+nA0
F k+nA0
F kA1
Ak+n0
Ak1 Ak+n
0
fk+nA0
= f0A
Ak1
Ak+n0
Mid-High HWPS(Ak1 , Ak+n
0 )|h=f0A
=
0 1
=

Perceptual Cues as Similarity Functions
A Computational Framework for Sound Segregation in Music Signals 33
} HWPS } Impact of f0 estimates (h’)
} Ideal } Min peak frequency } Highest amplitude peak } Histogram-based f0 estimates pitch estimates == nr. Sources?
A FRAMEWORK FOR SOUND SEGREGATION IN MUSIC SIGNALS
wrapping operation would be perfect with the prior knowledge of the fundamental fre-
quency. With this knowledge it would be possible to parametrize the wrapping operation
h as:
h = min(f0kl , f0
k+nm ) (26)
where f0kl is the fundamental frequency of the source of the peak pk
l . Without such prior,
a conservative approach h� is considered instead, although it will tend to over estimate
the fundamental frequency:
h� = min(fkl , fk+n
m ) (27)
Notice that the value of the wrapping frequency function h is the same for both pat-
terns corresponding to the peaks under consideration. Therefore the resulting shifted and
wrapped frequency pattern will be more similar if the peaks belong to the same harmonic
“source”. The resulting shifted and wrapped patterns are pitch invariant and can be seen
in the middle plot of Figures 19 and 20.
Different approaches could have been taken for the definition of the fundamental fre-
quency estimation function h�. One possibility would be to select the highest amplitude
peak in the union of the two spectral patterns under consideration as the f0 estimate
(i.e. h� = {fi|i = argmaxi(Ai),∀i ∈ [1,#A], where A = Akl ∪ Ak+n
m , #A is its number
of elements and Akl is the set of amplitudes corresponding to the spectral pattern F k
l ).
The motivation for this approach is the fact that the highest amplitude partial in musical
signals often corresponds to the fundamental frequency of the most prominent harmonic
‘source” active in that frame, although this assumption will not always hold.
A more robust approach, though more computationally expensive, would be to calcu-
late all the frequency differences between all peaks in each spectral pattern and compute a
histogram. The peaks in these histograms would be good candidates for the fundamental
frequencies in each frame (in order to avoid octave ambiguities, a second histogram with
the differences between all the candidate f0 values could be again computed, where the
highest peaks would be selected as the final f0 candidates). The HWPS could then be
iteratively calculated using each f0 candidate in this short list, and select the one with
the best value as the final choice. In fact, this technique could prove an interesting way to
robustly estimate the number of harmonic “sources” in each frame, including their pitches,
but experimental evaluations are still required to validate these approaches.
—————
94
0 500 1000 1500 2000 2500 30000
0.2
0.4
0.6
0.8
1A
0
A1
A2
A3
A4, B
3
B0
B1
B2
B4
Frequency (Hz)
Am
plit
ud
e
Similarity Combination
A Computational Framework for Sound Segregation in Music Signals 36
Similarity Computation
AMPLITUDE SIMILARITY
FREQUENCY SIMILARITY
HARMONIC SIMILARITY
(HWPS)
AZIMUTH PROXIMITY
COMMONONSETOFFSET
SOURCEMODELS
COMBINER
Spectral Peaks(over Texture Window)
150ms
OVERALLSIMILARITY MATRIX
Normalized Cut
...

Similarity Combination
A Computational Framework for Sound Segregation in Music Signals 38
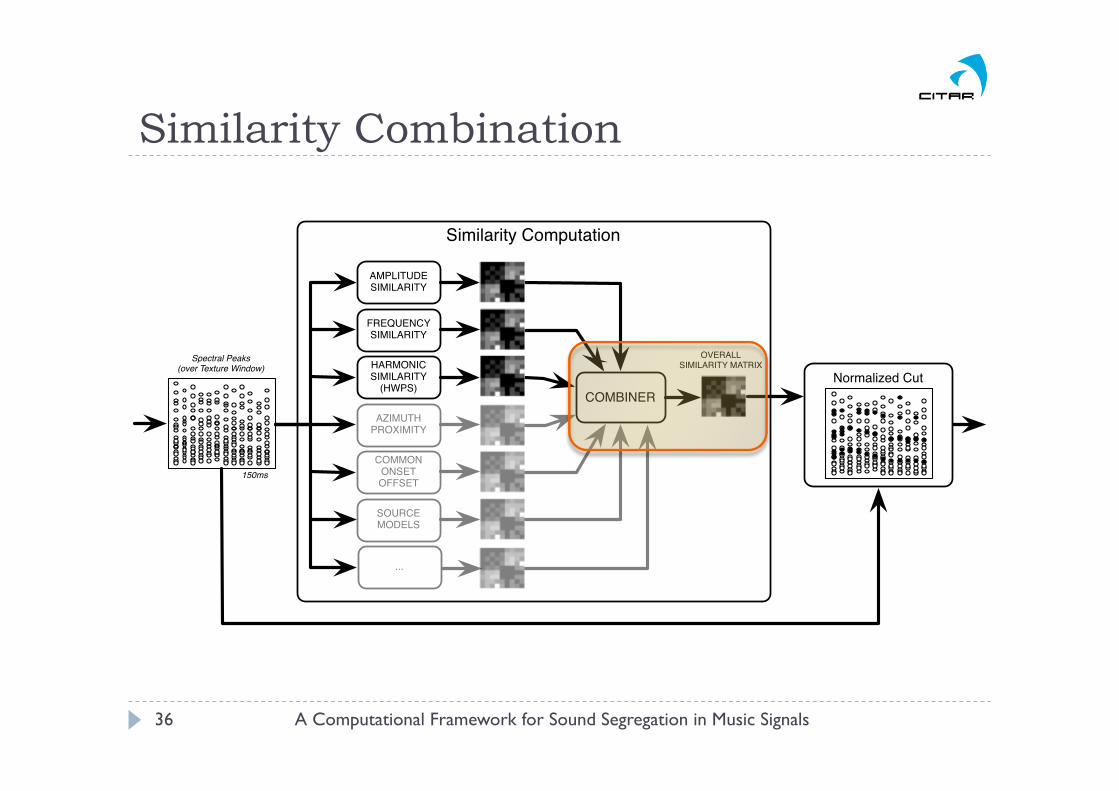
} Combining cues } Product operator [Shi&Malik2000]
High overall similarity only if all cues are high…
} More expressive operators?
PERCEPTUAL CUES AS GROUPING CRITERIA
would be necessary to be conducted in order to validate their adequacy.
Plots f,g in Figures 17 and 18 show the segregation results when only using the HWPS
similarity function Wh. In the case of the Tones A+B example, it is clear that the HWPS
enabled the segregation algorithm to correctly separate the two harmonic sets, A and B
(note that the shared harmonic {A4, B3} was grouped with the components from harmonic
set B).
For the real-world example Jazz1, it is also clear that the HWPS allowed the grouping
algorithm to successfully group the most predominant harmonic content in the mixture
into a single cluster (see plot f ), separating it from the harmonic background and more
noisy components in the sound mixture (see panel g)5.
Section 4.2.1 will present additional experimental evaluations as well as a comparative
study with some of the most well known approaches for the computation of harmonicity
similarity. Additionally, Appendix D describes the use of the HWPS as the basis of a
computationally efficient scheme for the dominant harmonic source separation, further
demonstrating the ability of this novel similarity cue to correctly identify the harmonic
content in complex sound mixtures.
3.7.3 Combining Similarity Functions
The use of a single similarity cue for sound segregation has been presented in Sections 3.7.1
and 3.7.2, and the results showed that each cue allows to obtain a different representation
of the complex audio mixture. As a result, each cue by itself only provides a limited ability
to represent the different sound events in a complex mixture. Therefore, the combination
of different similarity cues could allow to make the best use of their isolated grouping
abilities towards a more meaningful segregation of a sound mixture.
Following the work of Shi and Malik [Shi and Malik, 2000], who proposed to compute
the overall similarity function as the product of the individual similarity cues used for
image segmentation, the current system combines the amplitude, frequency and HWPS
grouping cues presented in the previous sections into a combined similarity function W as
follows:
W (pl, pm) = Wafh(pl, pm) = Wa(pl, pm)×Wf (pl, pm)×Wh(pl, pm) (30)
Plots g in Figures 15 and 16 show the histogram of the values resulting from the com-
bined similarity functions for the two sound examples, Tones A+B and Jazz1, respectively.
5Audio clips of the signals plotted in Figures 17 and 18 are available at http://www.inescporto.
pt/˜lmartins/Research/Phd/Phd.htmXXX
105Wafh = [(Wf ∧Wa) ∨Wh] ∧Ws

Segregating Sound Events
A Computational Framework for Sound Segregation in Music Signals 39
} Segregation task } Carried out by clustering components that are close in the similarity space } Novel method based on Spectral Clustering
} Normalized Cut (Ncut) criterion Originally proposed for Computer Vision Takes cues as pair-wise similarities Cluster the peaks into groups taking into account simultaneously all cues
Similarity Computation
AMPLITUDE SIMILARITY
FREQUENCY SIMILARITY
HARMONIC SIMILARITY
(HWPS)
AZIMUTH PROXIMITY
COMMONONSETOFFSET
SOURCEMODELS
COMBINER
Spectral Peaks(over Texture Window)
150ms
OVERALLSIMILARITY MATRIX
Normalized Cut
...

Segregating Sound Events
A Computational Framework for Sound Segregation in Music Signals 40
} Segregation Task } Normalized Cut criterion
} Achieves a balanced clustering of elements } Relies on the eigenstructure of a similarity matrix to partition points
into disjoint clusters Points in the same cluster high similarity Points in different clusters low similarity
xixj
xk
wij = wji
better cut mincut
xq
xp
xl

Segregating Sound Events
A Computational Framework for Sound Segregation in Music Signals 41
} Spectral Clustering } Alternative to the EM and k-means traditional algorithms:
} Does not assume a convex shaped data representation } Does not assume Gaussian distribution of data } Does not present multiple minima in log-likelihood
Avoids multiple restarts of the iterative process
} Correctly handles complex and unknown shapes } Usual in audio signals [Bach and Jordan 2004]

Segregating Sound Events
A Computational Framework for Sound Segregation in Music Signals 42
} Divisive clustering approach } Recursive two-way cut
} Hierarchical partition of the data Recursively partitions the data into two sets
Until pre-defined number of clusters is reached (requires prior knowledge!) Until a stopping criteria is met
} Current implementation Requires definition of number of clusters [Martins et al., 2007]
Or alternatively partitions data into 5 clusters and selects the 2 “denser” ones Segregation of the dominant clusters in the mixture [Lagrange et al., 2008a]

Segregation Results
A Computational Framework for Sound Segregation in Music Signals 43
a) Jazz1
b) AMPLITUDE SIMILARITYCLUSTER 1
c) AMPLITUDE SIMILARITYCLUSTER 2
d) FREQUENCY SIMILARITYCLUSTER 1
e) FREQUENCY SIMILARITYCLUSTER 2
f) HWPS SIMILARITYCLUSTER 1
g) HWPS SIMILARITYCLUSTER 2
h) COMBINED SIMILARITIESCLUSTER 1
i) COMBINED SIMILARITIESCLUSTER 2
FR
EQ
UE
NC
Y (
Hz)
TIME (secs)
TIME (secs) TIME (secs)
FR
EQ
UE
NC
Y (
Hz)
FR
EQ
UE
NC
Y (
Hz)
FR
EQ
UE
NC
Y (
Hz)
FR
EQ
UE
NC
Y (
Hz)
a) Tones A+B
b) AMPLITUDE SIMILARITYCLUSTER 1
c) AMPLITUDE SIMILARITYCLUSTER 2
d) FREQUENCY SIMILARITYCLUSTER 1
e) FREQUENCY SIMILARITYCLUSTER 2
f) HWPS SIMILARITYCLUSTER 1
g) HWPS SIMILARITYCLUSTER 2
h) COMBINED SIMILARITIESCLUSTER 1
i) COMBINED SIMILARITIESCLUSTER 2
FR
EQ
UE
NC
Y (
Hz)
TIME (secs)
TIME (secs) TIME (secs)
FR
EQ
UE
NC
Y (
Hz)
FR
EQ
UE
NC
Y (
Hz)
FR
EQ
UE
NC
Y (
Hz)
FR
EQ
UE
NC
Y (
Hz)
B0
B1
B2
A4 + B3
A3
A2
A1
A0
0 500 1000 1500 2000 2500 30000
0.2
0.4
0.6
0.8
1A
0
A1
A2
A3
A4, B
3
B0
B1
B2
B4
Frequency (Hz)
Am
plit
ude

Results
A Computational Framework for Sound Segregation in Music Signals 45
} Predominant Melodic Source Segregation } Dataset of real-world polyphonic music recordings
} Availability of the original isolated tracks (ground truth) } Results (the higher the better)
HWPS improves results When combined with other similarity features When compared with other state-of-the-art harmonicity features [Srinivasan and Kankanhalli, 2003]
[Virtanen and Klapuri, 2000]
0 1 2 3 4 5 6 7
Mean SDR (dB) for a 10 song dataset
A+F+HWPS
A+F+rHWPS
A+F+HV
A+F+HS
A+F

Results
A Computational Framework for Sound Segregation in Music Signals 47
} Predominant Melodic Source Segregation } On the use of Dynamic Texture Windows
} Results (the higher the better)
Smaller improvement (0.15 dB) than expected Probably due to the cluster selection approach being used…
More computationally intensive (for longer texture windows)

Results
A Computational Framework for Sound Segregation in Music Signals 51
} Main Melody Pitch Estimation } Resynthesize the segregated main voice clusters } Perform pitch estimation using well known monophonic pitch estimation technique
(Praat)
} Comparison with two techniques: } Monophonic pitch estimation applied to mixture audio (from Praat) } State-of-the-Art multi-pitch and main melody estimation algorithm applied to mixture
audio [Klapuri, 2006]
} Results (the lower the better)

Results
A Computational Framework for Sound Segregation in Music Signals 56
} Voicing Detection } Identifying portions of a music file containing vocals
} Evaluated three feature sets: MFCC features extracted from the polyphonic signal MFCC features extracted from the segregated main voice Cluster Peak Ratio (CPR) feature
extracted from the segregated main voice clusters

Results
A Computational Framework for Sound Segregation in Music Signals 57
} Timbre Identification in polyphonic music signals [Martins et al., 2007]
} Polyphonic, multi-instrumental audio signals } Artificial mixtures of 2-, 3- and 4-notes from real instruments
} Automatic separation of the sound sources } Sound sources and events are reasonably captured, corresponding in
most cases to played notes
} Matching of the separated events to a collection of 6 timbre models
note 1
note n
...
Sound Source
Formation
note 1 / inst 1
note n / inst i
...
TimbreModels
Matching
Matching
Pea
kP
icki
ng
Sin
usoi
dal
Ana
lysi
s
...... ...

Results
A Computational Framework for Sound Segregation in Music Signals 58
} Timbre Identification in polyphonic music signals [Martins et al., 2007] } Sound sources and events are reasonably captured,
corresponding in most cases to played notes

Results
A Computational Framework for Sound Segregation in Music Signals 59
} Timbre Identification in polyphonic music signals [Martins et al., 2007] } 6 instruments modeled [Burred et al., 2006]:
} Piano, violin, oboe, clarinet, trumpet and alto sax } Modeled as a set of time-frequency templates
Describe the typical evolution in time of the spectral envelope of a note Matches the salient peaks of the spectrum
00.2
0.40.6
0.81 2000 4000 6000 8000 10000
-80
-60
-40
-20
0
Frequency (Hz)
Time (norm
alized)
Am
plit
ude (
dB) PIANO
0.2
0.4
0.6
0.8
12000 4000 6000 8000 10000
-80
-60
-40
-20
0
Frequency (Hz)
Time (n
ormalized)
Am
plit
ude (
dB) OBOE

Results
A Computational Framework for Sound Segregation in Music Signals 60
} Timbre Identification in polyphonic music signals [Martins et al., 2007]
} Instrument presence detection in mixtures of notes } 56% of instruments occurrences correctly detected, with a precision of
64% [Martins et al., 2007]
Weak Matching
Alto sax cluster piano prototype
Strong Matching
Piano cluster piano prototype

Software Implementation
A Computational Framework for Sound Segregation in Music Signals 62
} Modular, flexible and efficient software implementation } Based on Marsyas
} Free and Open Source framework for audio analysis and processing http://marsyas.sourceforge.net
> peakClustering myAudio.wav

Software Implementation
A Computational Framework for Sound Segregation in Music Signals 63
} Marsyas } peakClustering Overview
Series/mainNet
frameMaxNumPeaks
totalNumPeaks
PeakViewSink/peSink
PeakLabeler/labeler
PeakConvert/conv
Accumulator/textWinNet
... ... ...
1FlowThru/clustNet
... ... ...
Shredder/synthNet
... ... ...
2 3
nTimes
A B
peakLabels
nTimestotalNumPeaks
frameMaxNumPeaks
innerOut
B

Software Implementation
A Computational Framework for Sound Segregation in Music Signals 64
} Marsyas } Sinusoidal analysis front-end
Accumulator/textWinNet
Series/analysisNet
Series/peakExtract
ShiftInput/si
Fanout/stereoFo
Series/stereoSpkNet
Parallel/LRnet
Series/spkL
Windowing/win
Spectrum/spk
Series/spkR
Windowing/win
Spectrum/spk
EnhADRessStereoSpectrum/stereoSpk
EnhADRess/ADRess
Series/spectrumNet
Stereo2Mono/s2m
Shifter/sh
Windowing/wi
Parallel/par
Spectrum/spk1
Spectrum/spk2
FlowThru/onsetdetector
... ... ...
1a
FanOutIn/mixer
+
Series/mixSeries
Delay/noiseDelay
SoundFileSource/src
Gain/noiseGain
Series/oriNet
SoundFileSource/src
Gain/oriGain
A
1
onsetDetected
flush
FlowThru/onsetdetector
Windowing/wi
Spectrum/spk
PowerSpectrum/pspk
Flux/flux
ShiftInput/sif
Filter/filt1
Filter/filt2
Reverse/rev1
Reverse/rev2
PeakerOnset/peaker
1a
onsetDetected
I
S

Software Implementation
A Computational Framework for Sound Segregation in Music Signals 65
} Marsyas } Onset detection
Accumulator/textWinNet
Series/analysisNet
Series/peakExtract
ShiftInput/si
Fanout/stereoFo
Series/stereoSpkNet
Parallel/LRnet
Series/spkL
Windowing/win
Spectrum/spk
Series/spkR
Windowing/win
Spectrum/spk
EnhADRessStereoSpectrum/stereoSpk
EnhADRess/ADRess
Series/spectrumNet
Stereo2Mono/s2m
Shifter/sh
Windowing/wi
Parallel/par
Spectrum/spk1
Spectrum/spk2
FlowThru/onsetdetector
... ... ...
1a
FanOutIn/mixer
+
Series/mixSeries
Delay/noiseDelay
SoundFileSource/src
Gain/noiseGain
Series/oriNet
SoundFileSource/src
Gain/oriGain
A
1
onsetDetected
flush
FlowThru/onsetdetector
Windowing/wi
Spectrum/spk
PowerSpectrum/pspk
Flux/flux
ShiftInput/sif
Filter/filt1
Filter/filt2
Reverse/rev1
Reverse/rev2
PeakerOnset/peaker
1a
onsetDetected
I
S

Software Implementation
A Computational Framework for Sound Segregation in Music Signals 66
} Marsyas } Similarity matrix computation and Clustering
PeakConvert/conv
FlowThru/clustNet
frameMaxNumPeaks
totalNumPeaks
FanOutIn/simNet
x
Series/freqSimSimilarityMatrix/FREQsimMat
Metric/FreqL2Norm
RBF/FREQrbf
Series/ampSimSimilarityMatrix/AMPsimMat
Metric/AmpL2Norm
RBF/AMPrbf
Series/HWPSimSimilarityMatrix/HWPSsimMat
HWPS/hwps
RBF/HWPSrbf
Series/panSimSimilarityMatrix/PANsimMat
Metric/PanL2Norm
RBF/PANrbf
PeakFeatureSelect/FREQfeatSelect
2
B
D
D
Series/NCutNet
Fanout/stack
NormCut/NCut
Gain/ID
PeakClusterSelect/clusterSelect
E
innerOut
PeakLabeler/labeler
B
labels
D
D
D
PeakFeatureSelect/AMPfeatSelect
PeakFeatureSelect/PANfeatSelect
PeakFeatureSelect/HWPSfeatSelect
F
C1
C2
C3

Software Implementation
A Computational Framework for Sound Segregation in Music Signals 67
} Marsyas } More flexible Similarity expression
FanOutIn/simNet
Series/panSimSimilarityMatrix/PANsimMat
Metric/PanL2Norm
RBF/PANrbf
PeakFeatureSelect/PANfeatSelect
.*
FanOutIn/ORnet
FanOutIn/ANDnet
.*
Series/freqSimSimilarityMatrix/FREQsimMat
Metric/FreqL2Norm
RBF/FREQrbf
PeakFeatureSelect/FREQfeatSelect
Series/ampSimSimilarityMatrix/AMPsimMat
Metric/AmpL2Norm
RBF/AMPrbf
PeakFeatureSelect/AMPfeatSelect max
Series/HWPSimSimilarityMatrix/HWPSsimMat
HWPS/hwps
RBF/HWPSrbf
PeakFeatureSelect/HWPSfeatSelect

Software Implementation
A Computational Framework for Sound Segregation in Music Signals 68
} Marsyas } Cluster Resynthesis
Shredder/synthNet
Series/postNet
Gain/outGain
PeakSynthOsc/pso
Windowing/wiSyn
OverlapAdd/ov
SoundFileSink/dest
3
B

Software Implementation
A Computational Framework for Sound Segregation in Music Signals 69
} Marsyas } Data structures
D
total number of peaksin texture window
tota
l num
ber o
f peaks
in te
xtu
re w
indow
SIMILARITYMATRIX
E
total number of peaksin texture window
tota
l num
ber o
f peaks
in te
xtu
re w
indow
3 221 1 3 NCUT indicator
SIMILARITYMATRIX
F
3 -1-11 1 3cluster selection
indicator
C1
f2 f5f4f1 f3 f6peaks'
frequency
total number of peaksin texture window
C2
a2 a5a4a1 a3 a6peaks'
amplitude
total number of peaksin texture window
C3
3 21 2 1 3
f2 f4f1 f3 f5 f6peaks' frequency
XX aa XX
a aX XX X
X aa aa X
aX Xf a f
f fa f a f
f ff f f f
NumPeaks in frame
peak
spectra
l patte
rn
total number of peaksin texture window
A
Re(0)
Re(N/2)
Re(1)
Im(1)
Im(N/2-1)
Re(N/2-1)
...
...
...
...
...
...
...
Re(0)
Re(N/2)
Re(1)
Im(1)
Im(N/2-1)
Re(N/2-1)
...
...
...
...
...
...
...
com
ple
x s
pectru
m 1
(N p
oin
ts)
Pan(0)
Pan(1)
Pan(N/2)...
...
...
...
...
...
...
ste
reo
spectru
m(N
/2+
1 p
oin
ts)
texturewindow frames
com
ple
x s
pectru
m 2
(N p
oin
ts)
B
peaksFREQUENCY
peaksAMPLITUDE
peaksPHASE
peaksGROUP
...
...
...
...
...
...
...
...
...
...
...
...
...
...
...
...
...
...
...
...
...
...
...
...
...
...
...
...
...
...
...
fram
eM
axN
um
Peaks
texturewindow frames
peaksTRACK
...
...
...
...
...
...
...
...
...
...
...
...
...
audio frame(N+1 samples)
I
31 42 50
1 430 2 5 Ch1 samples
Ch2 samples
analysis window(N samples)
S
1 30 2 5 Audio Samples
430 2 5 Shifted Audio Samples
1
4

Software Implementation
A Computational Framework for Sound Segregation in Music Signals 70
} Marsyas } Data structures
D
total number of peaksin texture window
tota
l num
ber o
f peaks
in te
xtu
re w
indow
SIMILARITYMATRIX
E
total number of peaksin texture window
tota
l num
ber o
f peaks
in te
xtu
re w
indow
3 221 1 3 NCUT indicator
SIMILARITYMATRIX
F
3 -1-11 1 3cluster selection
indicator
C1
f2 f5f4f1 f3 f6peaks'
frequency
total number of peaksin texture window
C2
a2 a5a4a1 a3 a6peaks'
amplitude
total number of peaksin texture window
C3
3 21 2 1 3
f2 f4f1 f3 f5 f6peaks' frequency
XX aa XX
a aX XX X
X aa aa X
aX Xf a f
f fa f a f
f ff f f f
NumPeaks in frame
peak
spectra
l patte
rn
total number of peaksin texture window
A
Re(0)
Re(N/2)
Re(1)
Im(1)
Im(N/2-1)
Re(N/2-1)
...
...
...
...
...
...
...
Re(0)
Re(N/2)
Re(1)
Im(1)
Im(N/2-1)
Re(N/2-1)
...
...
...
...
...
...
...
com
ple
x s
pectru
m 1
(N p
oin
ts)
Pan(0)
Pan(1)
Pan(N/2)
...
...
...
...
...
...
...
ste
reo
spectru
m(N
/2+
1 p
oin
ts)
texturewindow frames
com
ple
x s
pectru
m 2
(N p
oin
ts)
B
peaksFREQUENCY
peaksAMPLITUDE
peaksPHASE
peaksGROUP
...
...
...
...
...
...
...
...
...
...
...
...
...
...
...
...
...
...
...
...
...
...
...
...
...
...
...
...
...
...
...
fram
eM
axN
um
Peaks
texturewindow frames
peaksTRACK
...
...
...
...
...
...
...
...
...
...
...
...
...
audio frame(N+1 samples)
I
31 42 50
1 430 2 5 Ch1 samples
Ch2 samples
analysis window(N samples)
S
1 30 2 5 Audio Samples
430 2 5 Shifted Audio Samples
1
4

Conclusions
A Computational Framework for Sound Segregation in Music Signals 71
} Proposal of a framework for sound source segregation } Inspired by ideas of CASA } Focused on “real-world” music signals } Designed to be causal and efficient } Data-driven
} Does not require any training or prior knowledge about audio signals under analysis
} Approaches partial tracking and source separation jointly } Flexible enough to include new perceptually motivated auditory cues
} Based on a Spectral Clustering technique } Shows good potential for applications
} Source segregation/separation, } Monophonic or polyphonic instrument classification, } Main melody estimation } Pre-processing for polyphonic transcription, ...

Conclusions
A Computational Framework for Sound Segregation in Music Signals 72
} Definition of a novel harmonicity cue } Termed Harmonically Wrapped Peak Similarity (HWPS)
} Experimentally shown as: } Good grouping criteria for sound segregation in polyphonic music signals.
} Compares favorably to other state-of-the-art harmonicity cues
} Software development of the sound segregation framework } Used for validation and evaluation } Made available as Free and Open Source Software (FOSS)
} Based on Marsyas
} Free for everyone to try, evaluate, modify and improve

Future Work
A Computational Framework for Sound Segregation in Music Signals 73
} Analysis front-end } Evaluate alternative analysis frontends
} Perceptually-informed filterbanks } Sinusoid+transient representations } A different auditory front-end (as long as it is invertible).…
} Evaluate alternative frequency estimation methods for spectral peaks } Parabolic interpolation } Subspace methods } …
} Use of a beat-synchronous approach } Based on the use of onset detectors and beat estimators for dynamic
adjustment of texture windows } Perceptually motivated

Future Work
A Computational Framework for Sound Segregation in Music Signals 74
} Grouping Cues } Improve HWPS
} Better f0 candidate estimation } Reduce negative impact of sound events in different audio frames
} Inclusion of new perceptually motivated auditory cues } Time and frequency masking } Stereo placement of spectral components (for stereo signals) } Timbre models as a priori information } Peak tracking as a pre- and post-processing } Common fate (onsets, offsets, modulation)

Future Work
A Computational Framework for Sound Segregation in Music Signals 75
} Implement Sequential integration } between texture windows
} Cluster segregated clusters?
} Timbre similarity [Martins et al. 2007]
Cluster 1
Cluster 2

Future Work
A Computational Framework for Sound Segregation in Music Signals 76
} Clustering } Definition of the neighborhood width (σ) in similarity
functions } JNDs?
} Define and evaluate more expressive combinations of similarity functions
} Automatic estimation of the number of clusters in each texture window
} Extraction of new descriptors directly from segregated cluster parameters (e.g., CPR): } Pitch, spectral features, frequency tracks, timing information

Future Work
A Computational Framework for Sound Segregation in Music Signals 77
} Creation of a sound/music evaluation dataset } Simple and synthetic sound examples
} For preliminary testing, fine tuning, validation
} “real-world” polyphonic recordings } More complex signals, for final stress-test evaluations
} To be made publicly available
} Software Framework } Analysis an processing framework based on Marsyas
} FOSS, C++, multi-platform, real-time
} Feature rich software visualization and sonification tools

Related Publications
A Computational Framework for Sound Segregation in Music Signals 78
} PhD Thesis: } Martins, L. G. (2009). A Computational
Framework for Sound Segregation in Music Signals. PhD thesis, FEUP.
} Book: } Martins, L. G. (2009). A Computational
Framework for Sound Segregation in Music Signals – An Auditory Scene Analysis Approach for Modeling Perceptual Grouping in Music Listening. Lambert Academic Publishing.
} Book Chapter: } Martins, L. G., Lagrange, M., and Tzanetakis, G.
(2010). Modeling grouping cues for auditory scene analysis using a spectral clustering formulation. Machine Audition: Principles, Algorithms and Systems. IGI Global.

Related Publications
A Computational Framework for Sound Segregation in Music Signals 79
} Lagrange, M., Martins, L. G., Murdoch, J., and Tzanetakis, G. (2008). Normalized cuts for predominant melodic source separation. IEEE Transactions on Audio, Speech, and Language Processing, 16(2). Special Issue on MIR.
} Martins, L. G., Burred, J. J., Tzanetakis, G., and Lagrange, M. (2007). Polyphonic instrument recognition using spectral clustering. In Proc. International Conference on Music Information Retrieval (ISMIR), Vienna, Austria.
} Lagrange, M., Martins, L. G., and Tzanetakis, G. (2008). A computationally efficient scheme for dominant harmonic source separation. In Proc. IEEE International Conference on Acoustics, Speech, and Signal Processing (ICASSP), Las Vegas, Nevada, USA.
} Tzanetakis, G., Martins, L. G., Teixeira, L. F., Castillo, C., Jones, R., and Lagrange, M. (2008). Interoperability and the Marsyas 0.2 runtime. In Proc. International Computer Music Conference (ICMC), Belfast, Northern Ireland.
} Lagrange, M., Martins, L. G., and Tzanetakis, G. (2007). Semi-automatic mono to stereo up-mixing using sound source formation. In Proc. 112th Convention of the Audio Engineering Society, Vienna, Austria.

Thank you
A Computational Framework for Sound Segregation in Music Signals 80
Questions?
[email protected] http://www.artes.ucp.pt/citar/