a computationally efficient ground-motion selection...
TRANSCRIPT
A Computationally EfficientGround-Motion Selection Algorithm forMatching a Target Response SpectrumMean and Variance
Nirmal Jayaram,a) Ting Lin,a)M.EERI, and Jack W. Baker,a)
M.EERI
Dynamic structural analysis often requires the selection of input groundmotions with a target mean response spectrum. The variance of the targetresponse spectrum is usually ignored or accounted for in an ad hoc manner,which can bias the structural response estimates. This manuscript proposes acomputationally efficient and theoretically consistent algorithm to select groundmotions that match the target response spectrum mean and variance. The selec-tion algorithm probabilistically generates multiple response spectra from a targetdistribution, and then selects recorded ground motions whose response spectraindividually match the simulated response spectra. A greedy optimization tech-nique further improves the match between the target and the sample means andvariances. The proposed algorithm is used to select ground motions for the anal-ysis of sample structures in order to assess the impact of considering ground-motion variance on the structural response estimates. The implications for code-based design and performance-based earthquake engineering are discussed.[DOI: 10.1193/1.3608002]
INTRODUCTION
Dynamic structural analysis is commonly used in performance-based earthquake engi-neering to predict the response of a structure subjected to earthquake ground motions. In thepast, a wide variety of techniques have been developed for selecting input ground motionsfor the structural analysis (e.g., Haselton et al. 2009; Katsanos 2010). One commonly usedapproach is to select recorded or simulated ground motions whose response spectra match atarget mean response spectrum (e.g., Beyer and Bommer 2007; Shantz 2006; Watson-Lamprey and Abrahamson 2006). Commonly used target spectra include the uniform haz-ard spectrum and more recently, the conditional mean spectrum (Baker 2011). Irrespectiveof the procedure used to obtain a target response spectrum, there are several methods forselecting input ground motions that match a desired spectrum. One approach is to selectground motions (sometimes after scaling) that individually deviate the least from the targetresponse spectrum. The deviation can be measured using the sum of squared differencesbetween the response spectrum of the record and the target response spectrum (e.g., Youngset al. 2007). An alternate approach is to select a ground-motion set, rather than one recordat a time, by minimizing the mean spectrum of the selected records from the target responsespectrum. This is a more complicated subset selection optimization problem, and this opti-mization has been carried out in the past using genetic algorithms (Naeim et al. 2004).
a) Dept. of Civil and Environmental Engineering, Stanford University, Stanford, CA 94305-4020, USA
797
Earthquake Spectra, Volume 27, No. 3, pages 797–815, August 2011; VC 2011, Earthquake Engineering Research Institute

In some situations, matching only a target mean response spectrum is not sufficientsince the approach ignores the inherent variance that may exist in the response spectrum.For instance, the conditional mean spectrum is derived by conditioning on spectral accelera-tion at only a single period, SaðT �Þ, so the response spectra at other periods have variance.This is discussed in more detail in a subsequent section. Another approach might be tochoose ground motions associated with a scenario earthquake (having a specified magni-tude, distance, etc.), but not conditioned on any spectral values (e.g., Jayaram and Baker2010). In that case, the response spectrum will have variance at all periods. The commonlyused uniform hazard spectrum (UHS), on the other hand, is an envelope of the spectralaccelerations at all periods that are exceeded with a specified rate, as computed using proba-bilistic seismic hazard analysis (PSHA). PSHA already accounts for variability in spectralaccelerations at each period being considered, and construction of the UHS is a conservativemethod of combining these spectral values. No further variance needs to be applied to theUHS, as varying the spectral values is equivalent to varying the associated exceedance rateof the spectral accelerations from period to period (an operation which is unlikely to pro-duce meaningful results). In other words, if the UHS is used as the target mean spectrum,the ground motions should be chosen so that their spectra match the UHS and not haveadditional variance about the UHS.
In cases where a response spectrum has a non-zero variance, estimates of structuralresponse obtained using the ground motions selected only based on the target mean spec-trum will show smaller than “actual” dispersion (logarithmic standard deviation) and mayalso have a biased mean value. Selecting ground motions based only on a target responsespectrum mean is computationally inexpensive since it can be done by choosing groundmotions whose response spectra individually deviate the least from the target, and so thesearch time is proportional to the number of ground motions considered. When matching atarget response spectrum mean and variance, it does not suffice to treat ground motions indi-vidually, but rather requires comparisons of the mean and variance of sets of groundmotions to the target values. That is, the suitability of a particular ground motion can onlybe determined in the context of the complete ground-motion set in which it might beincluded. There is generally an intractably large number of possible ground-motion sets,and so identifying the best set is a computationally expensive combinatorial optimizationproblem. No automated procedures are available in the literature, however, to select groundmotions that match the response spectrum mean and variance. One notable work in thisregard is that of Kottke and Rathje (2008), who proposed a semi-automated procedure thatfirst selects ground motions based on matching the mean spectrum, and subsequentlyapplies individual scale factors on the ground motions to achieve the target variance. Thistechnique, however, does not easily scale to work with large ground-motion datasets, andalso cannot be used for the selection of unscaled ground motions.
The current work proposes a new, computationally fast and theoretically consistentground-motion selection algorithm to match the target response spectrum mean andvariance. The selection algorithm first uses Monte Carlo simulation to probabilistically gen-erate multiple response spectra from a distribution parameterized by the target means andvariances. For each simulated response spectrum, a ground motion with a similar responsespectrum is then selected. Since the Monte Carlo simulated response spectra have thedesired mean and variance, the response spectra of the selected recorded ground motions
N. JAYARAM, T. LIN, AND J. W. BAKER798

will also have the desired mean and variance. A greedy optimization technique then furtherimproves the match between the target and the sample means and variances. This step repla-ces one previously selected ground motion at a time with a record from the ground-motiondatabase that causes the best improvement in the match between the target and the samplemeans and variances.
The proposed algorithm is then used to select ground motions for estimating the seismicresponse of sample single-degree-of-freedom (SDOF) and multiple-degree-of-freedom(MDOF) structures, in order to assess the impact of considering ground-motion variance onthe structural response estimates. The implications for code-based design and performance-based earthquake engineering are discussed.
GROUND-MOTION SELECTION ALGORITHM
The objective of the proposed algorithm is to select a suite of ground motions whoseresponse spectra have a specified mean and variance. This algorithm is based on the empiri-cally verified observation that the set of logarithmic spectral accelerations (lnSa) at variousperiods is a random vector that follows a multivariate normal distribution (Jayaram andBaker 2008). The first step in this algorithm is to parameterize the multivariate normal dis-tribution of lnSa’s at multiple periods. The parameters of the multivariate normal distribu-tion are the means and the variances of the lnSa’s at all periods and the correlations betweenthe lnSa’s at all pairs of periods. Equivalently, the distribution can be parameterized usingthe means of the lnSa’s and the covariances between the lnSa’s at all pairs of periods. Inorder to achieve the desired properties in the selected ground motions, these parametersshould be set to their target values (i.e., target means and variances for the ground motionsto be selected). A subsequent section illustrates this parameterization.
Once the distribution means and covariances are set equal to the desired target values,Monte Carlo simulation is used to probabilistically generate response spectra from theabove mentioned multivariate normal distribution. This can be performed using a standardfunction in many programming languages. The number of response spectra to be simulatedequals the desired number of ground motions. For each simulated response spectrum, aground motion with a similar response spectrum is then selected. The similarity between aground-motion response spectrum and a Monte Carlo simulated response spectrum is eval-uated using the sum of squared errors (SSE) described below:
SSE ¼XP
j¼1
ln SaðTjÞ � ln SðsÞa ðTjÞ� �2
(1)
where ln SaðTjÞ is the logarithmic spectral acceleration of the (optionally scaled) groundmotion in consideration at period Tj, ln SðsÞa ðTjÞ is the target lnSa at period Tj from the simu-lated response spectrum, p is the number of periods considered and SSE is the sum ofsquared errors, which is a measure of dissimilarity. The measure of similarity defined byEquation 1 is not unique, and discussion of other measures of similarity can be found inBeyer and Bommer (2007) and Buratti et al. (2011). The selection is done by computingSSE for each ground motion in the database, and then choosing the ground motion havingthe smallest SSE. Other ground motion properties can be accounted for at this stage by, for
A COMPUTATIONALLY EFFICIENT GROUND-MOTION SELECTION ALGORITHM 799
example, considering only ground motions falling within a specified range of magnitudesand distances. Note that this is identical to comparison procedures in use today, except thathere we are comparing to simulated spectra rather than a target mean spectrum.
The mean and the variance of the simulated response spectra will approximately matchthe corresponding target values because they were sampled from the desired distribution.This match will be nearly exact if a large number of spectra are simulated and will be ap-proximate otherwise. Since the simulated response spectra have approximately the desiredmean and variance, the response spectra selected using this approach will also haveapproximately the desired mean and variance. Additionally, this ground-motion selectionapproach also ensures that the selected set has the target correlation structure (i.e., correla-tion between lnSa’s at pairs of periods) specified while parameterizing the distribution ofthe response spectrum. This implies that, in the particular case where the logarithmicresponse spectrum follows a multivariate normal distribution, the proposed algorithmactually matches the entire response spectrum distribution. Another advantage of thisapproach is that this algorithm allows the selection of unscaled ground motions (Jayaramand Baker 2010).
As mentioned above, when ground motions are selected using the approach describedabove, the sample means and variances may deviate slightly from the target values, partic-ularly when the number of ground motions selected is small. Therefore, a “greedy” opti-mization technique is used to further improve the match between the sample and the tar-get means and variances. In this approach, each ground motion selected previously isreplaced one at a time with a ground motion from the database that causes the bestimprovement in the match between the target and the sample means and variances. Ifnone of the potential replacements causes an improvement, the original ground motion isretained. The mismatch is estimated as the sum of squared differences between the targetand the sample means and variances over the period range of interest. The deviation ofthe set mean and variance from the target mean and variance (denoted SSEs) is estimatedas follows:
SSEs ¼Xp
j¼1
mln SaðTjÞ � lðtÞln SaðTjÞ
� �2þw sln SaðTjÞ � rðtÞln SaðTjÞ
� �2� �
(2)
where SSEs is the sum of squared errors of the set, which is the parameter to be minimized,mln SaðTjÞ is the set mean lnSa at period Tj, lðtÞln SaðTjÞ is the target mean lnSa at period Tj,sln SaðTjÞ is the set standard deviation of the lnSa at period Tj, rðtÞln SaðTjÞ is the target standarddeviation of the lnSa at period Tj, w is a weighting factor indicating the relative importanceof the errors in the standard deviation and the mean (A possible value for w is 1, but it canbe chosen depending on the desired accuracy in the match between the sample and the tar-get means and standard deviations), and p is the number of periods (Tj) at which the error iscomputed.
The set mean and standard deviation can be calculated as follows:
mln SaðTjÞ ¼1
n
Xn
i¼1
ln SaiðTjÞ (3)
N. JAYARAM, T. LIN, AND J. W. BAKER800

sln SaðTjÞ ¼ffiffiffiffiffiffiffiffiffiffiffiffiffiffiffiffiffiffiffiffiffiffiffiffiffiffiffiffiffiffiffiffiffiffiffiffiffiffiffiffiffiffiffiffiffiffiffiffiffiffiffiffiffiffiffiffiffiffiffiffiffiffiffiffiffiffi
1
n� 1
Xn
i¼1
ln SaiðTjÞ � mln SaðTjÞ
� �2s
(4)
where ln SaiðTjÞ denotes the lnSa of the ith record in the set at period Tj, and n denotes the
number of records in the set.
Note that the greedy optimization technique does not explicitly account for the correla-tion structure of selected sets. This correction structure is captured in the initial selectionstep, and is approximately retained after the greedy optimization as well.
The steps involved in the greedy optimization technique are summarized below.
• Step 1: Set j¼ 1.• Step 2: Set i¼ 1. Denote the SSEs of the set as SSEs;old• Step 3: If the ith database ground motion (Gi) is not already present in the set,
replace the jth ground motion in the set with Gi. Compute SSEs;i (i.e, the SSEs ofthe set after the replacement is carried out).
• Step 4: Reverse the replacement carried out in Step 3. Increment i by 1.• Step 5: If i is less than or equal to the size of the ground-motion database, go to
Step 3. Otherwise, identify the ground motion ~i that results in the minimum valueof SSEs;~i. If SSEs;~i < SSEs;old , replace the jth ground motion in the set with the ~i th
ground motion in the database.• Step 6: Increment j by 1. If j is less than the size of the set, go to Step 2. Otherwise,
terminate the algorithm.
This is called a “greedy” optimization technique because it tries to improve the matchbetween the target and the sample properties in every iteration locally without necessarilyachieving a global optimum solution. In this application, the initial simulation and selectionsteps result in a ground motion set that is already approximately optimal (for reasonablylarge sets), so it has been observed that only this greedy technique is needed to find solu-tions that are essentially globally optimal. Observational experience suggests that this algo-rithm never produces sets of ground motions with poor matches between the sample and thetarget means and variances (even for sets with as few as 10 ground motions, as illustrated ina subsequent section).
The Appendix “An Alternate Ground-Motion Selection Algorithm” describes an alter-nate selection algorithm that does not require knowledge of the response spectrum distribu-tion or the correlation structure.
ILLUSTRATIVE GROUND-MOTION SELECTION
This section describes the application of the proposed algorithm for selecting structure-specific ground motions that have a specified spectral acceleration at the structure’s funda-mental period. In this example, the target response spectrum mean and covariance matricesare obtained using the conditional mean spectrum (CMS) method (Baker 2011), which pro-vides the mean and variance (and correlations) of the response spectrum conditioned on thespecified spectral acceleration. It is to be noted that while this example uses the targets from
A COMPUTATIONALLY EFFICIENT GROUND-MOTION SELECTION ALGORITHM 801

the CMS method, the proposed algorithm can be used with any arbitrary target mean andcovariance (e.g., Jayaram and Baker 2010).
PARAMETERIZATION OF THE TARGET RESPONSE SPECTRUM DISTRIBUTION
As described in the previous section, the first step in the algorithm is to parameterize themultivariate normal distribution of the lnSa’s using the means and the variances of the spec-tral accelerations (chosen to equal the target mean and the target variance respectively) andthe correlations between the spectral accelerations at two different periods. The stepsinvolved in parameterizing the distribution using the CMS method are listed below.
• Step 1: Determine the target spectral acceleration (Sa) at a given period T* (e.g., thefundamental period of the structure), and the associated magnitude (M), distance tosource (R) and e(T*), where e(T*) is the number of standard deviations by which agiven lnSa differs from the mean predicted (by a ground-motion model) lnSa at theperiod of interest T*. In general,
eðTÞ ¼ln SaðTÞ � lln SaðTÞ
rln SaðTÞ(5)
where ln SaðTÞ is the ground motion’s logarithmic spectral acceleration at period T,and lln SaðTÞ and rln SaðTÞ are the predicted mean and standard deviation, respec-tively, of ln SaðTÞ given M, R, etc. (e.g., Campbell and Bozorgnia 2008). The val-ues of M, R and e(T*) can be obtained from deaggregation (e.g., USGS 2008).
• Step 2: For all Tj of interest, compute the unconditional mean and the unconditionalstandard deviation of the response spectrum, given M and R. In other words, com-pute lln SaðTÞ and rln SaðTÞ.
• Step 3: Compute the mean of ln SaðT1Þ; ln SaðT2Þ; :::; ln SaðTnÞð Þ conditioned one(T*). This mean matrix (denoted l) is computed as follows:
l ¼
llnSaðT1Þ þ qðT1; T�ÞeðT�ÞrlnSaðT1Þ
llnSaðT2Þ þ qðT2; T�ÞeðT�ÞrlnSaðT2Þ
::
llnSaðTnÞ þ qðTn; T�ÞeðT�ÞrlnSaðTnÞ
266664
377775 (6)
where q(Tj,T*) is the correlation between e(Tj) and e(T*) provided by, for
instance, Baker and Jayaram (2008).• Step 4: Compute the covariance of ln SaðT1Þ; ln SaðT2Þ; :::; ln SaðTnÞð Þ condi-
tioned on e(T*). This covariance matrix (denoted R) is estimated as follows:Let R0 denote the (unconditional) covariance matrix of the vector
ln SaðT1Þ; ln SaðT2Þ; :::; ln SaðTnÞð Þ.
R0¼
r2lnSaðT1Þ qðT1;T2ÞrlnSaðT1ÞrlnSaðT2Þ ��� qðT1;TnÞrlnSaðT1ÞrlnSaðTnÞ
qðT2;T1ÞrlnSaðT2ÞrlnSaðT1Þ r2lnSaðT2Þ ��� qðT2;TnÞrlnSaðT2ÞrlnSaðTnÞ
: : ��� :: : ��� :
qðTn;T1ÞrlnSaðTnÞrlnSaðT1Þ qðTn;T2ÞrlnSaðTnÞrlnSaðT2Þ ��� r2lnSaðTnÞ
2666664
3777775 (7)
N. JAYARAM, T. LIN, AND J. W. BAKER802

Let R1 denote the covariance between ln SaðT1Þ; ln SaðT2Þ; :::; ln SaðTnÞð Þ and ln SaðT�Þ,defined as follows:
R1 ¼
qðT1; T�ÞrlnSaðT1ÞrlnSaðT�Þ
qðT2; T�ÞrlnSaðT2ÞrlnSaðT�Þ
::
qðTn; T�ÞrlnSaðTnÞrlnSaðT�Þ
266664
377775 (8)
The covariance matrix of ln SaðT1Þ; ln SaðT2Þ; :::; ln SaðTnÞð Þ conditioned on ln SaðT�Þ canbe computed as follows (e.g., Johnson and Wichern 2007):
R ¼ R0 �1
r2lnSaðT�Þ
R1R01 (9)
where R01 denotes the transpose of R1. The conditional standard deviation of the lnSa’s isthe square root of the diagonals of R, also given by Equation 10.
rlnSaðTÞjlnSaðT�Þ ¼ rlnSaðTÞ
ffiffiffiffiffiffiffiffiffiffiffiffiffiffiffiffiffiffiffiffiffiffiffiffiffiffiffi1� q T ; T�ð Þ2
q(10)
Figure 1 shows the target conditional response spectrum mean and standard deviationobtained corresponding to magnitude¼ 7, distance to the rupture¼ 10km, T*¼ 2.63s ande(T*)¼ 2. These values have been chosen to be compatible with ground-motion studies car-ried out by Haselton et al. (2009). The unconditional lnSa means and standard deviationscorresponding to this scenario, llnSaðTjÞ and rlnSaðTjÞ, are obtained from the Campbell andBozorgnia (2008) ground-motion model. (Since lnSa’s at multiple periods follow a multi-variate normal distribution, the exponential of the mean lnSa equals the median spectralacceleration. This is why the axis of Figure 1 is labeled as “Median Sa.”)
RESPONSE SPECTRUM SIMULATION
Forty response spectra are simulated (using Monte Carlo simulation) by sampling froma multivariate normal distribution with the mean and covariance matrices defined by Equa-tions 6 and 9 for the target scenario described above. The response spectra are simulated at20 periods logarithmically spaced between 0.05s and 10.0s, and are shown in Figure 2a. Alarge period range is used to ensure a good match in the entire response spectrum that cov-ers regions of higher modes and nonlinearity. Because individual spectra may vary whilestill achieving a target mean and variance of the overall set, there is often little penalty inconsidering a broad period range in this step.
Figure 1a compares the mean of the Monte Carlo simulated response spectra to the tar-get mean. It can be seen that the mean values agree reasonably well. Figure 1b shows a rea-sonable agreement between the standard deviation of the simulated lnSa values and the tar-get standard deviation. The small deviation seen in these figures is because the samplemean and standard deviation for moderately small sample sizes do not necessarily matchthe target mean and standard deviation.
A COMPUTATIONALLY EFFICIENT GROUND-MOTION SELECTION ALGORITHM 803

SELECTION OF GROUND MOTIONS TO MATCH SIMULATED SPECTRA
Forty ground motions are selected from the Next Generation Attenuation (NGA) data-base (Chiou et al. 2008) that individually match the forty response spectra simulated in theprevious step. For two-dimensional structural models, a single ground motion component isrequired as an input for every time history analysis. (For three-dimensional structural mod-els, two ground motion components can be selected by considering their geometric meanresponse spectrum, as described in Jayaram and Baker 2010.) Here, each horizontal compo-nent of a recording from the same station in the NGA database is treated separately as anindividual ground motion. No constraints on, for example, the magnitudes and distances ofthe selected recordings are used, but such constraints are easily accommodated by simplyrestricting the set of ground motions considered for selection. Prior to selection, each of theavailable 7102 ground motions in the NGA database is scaled so that its SaðT�Þ matches thetarget SaðT �Þ from the target mean spectrum (seen in Figure 1a) when T* is equal to 2.63s.Figure 2b shows the response spectra of the selected ground motions. The sample and thetarget means and standard deviations are shown in Figure 1. The figure shows that the sam-ple and the target response spectrum mean and variance match reasonably well. Addition-ally, the selected ground motion spectra also match the specified target correlation structure(specified by the nondiagonal terms of the covariance matrix in Equation 9) reasonablywell, as indicated by a mean absolute error between the sample and the target correlationsof 0.12.
The computational time required for selecting the set of 40 ground motions is 10 sec-onds using a MATLAB implementation on an 8GB RAM 2.33GHz quad core processor.This computational efficiency allows for the algorithm to be optionally applied multipletimes if one wants several candidate sets to choose from. While selecting the groundmotions shown in Figure 2, we applied the algorithm multiple times (twenty times, in par-ticular) to obtain multiple candidate ground-motion sets and chose the set with the minimumvalue of SSE. This approach is also beneficial to work around situations where recordedground motion spectra that adequately match one or more of the simulated spectra are notavailable.
Figure 1. (a) Response spectrum mean and (b) response spectrum standard deviation.
N. JAYARAM, T. LIN, AND J. W. BAKER804

GREEDY OPTIMIZATION TECHNIQUE
The greedy optimization technique is used to modify the ground-motion suite selectedin the previous step. The spectra of the selected ground motions are shown in Figure 2c.The means and the standard deviations of the set are shown in Figure 1, and have a near per-fect match with the target means and standard deviations. The mean absolute error betweenthe sample and the target correlations is 0.15.
In total, the computational time required to select the set of 40 ground motions from the7102 available ground motions is about 180 seconds using a MATLAB implementation onan 8GB RAM 2.33GHz quad core processor. A MATLAB implementation of the proposedground-motion selection algorithm can be downloaded from http://www.stanford.edu/~bakerjw/gm_selection.html.
SELECTION OF A SMALLER NUMBER OF GROUND MOTIONS
To test the effectiveness of the algorithm in sampling smaller ground motion sets, it isrepeated to select a set of 10 ground motions for the scenario described earlier(magnitude¼ 7, distance to rupture¼ 10km, T*¼ 2.63s and e(T*)¼ 2). The response
Figure 2. (a) Simulated response spectra, (b) response spectra of ground motions selected beforegreedy optimization, and (c) response spectra of ground motions selected after greedy optimization.
A COMPUTATIONALLY EFFICIENT GROUND-MOTION SELECTION ALGORITHM 805

spectra of the selected records are shown in Figure 3a. The set means and standard devia-tions are compared to the target means and standard deviations in Figures 3b and 3c. It canbe seen that the matches are good, illustrating the effectiveness of the algorithm in selectingsmall sets of ground motions. The mean absolute error between the sample and the targetcorrelations is 0.17. The computational time required to select the set of 10 ground motionsis about 25 seconds using a MATLAB implementation on an 8GB RAM 2.33GHz quadcore processor. The computational time required for selecting the set of 10 ground motionswithout using the greedy optimization technique is 4 seconds.
IMPACT OF MATCHING SPECTRUM VARIANCE ONSTRUCTURAL RESPONSE
Code-based structural design and performance-based earthquake engineering applica-tions require statistics such as the mean (e.g., ASCE 2005) or the median and the dispersion(e.g., ATC 2009) of the structural response. It is of interest in this section to evaluate theimpact of ground-motion selection considering a target response spectrum mean and var-iance (as compared to considering only a target mean) on these statistics.
Figure 3. (a) Response spectra of 10 selected ground motions, (b) response spectrum mean,and (c) response spectrum standard deviation.
N. JAYARAM, T. LIN, AND J. W. BAKER806

GROUND MOTION SELECTION
The ground motions used for evaluating structural response are selected using themethod described in the previous section for a target scenario with magnitude¼ 7, distanceto rupture¼ 10km, Vs30¼ 400m=s, and a strike-slip mechanism. The Campbell andBozorgnia (2008) ground-motion model is used to estimate the mean and variance of theresponse spectrum. The values of e and period T* are varied to obtain multiple test scenar-ios. Three typical e values of 0, 1 and 2 are considered. The structures considered in thiswork have periods (T*) ranging between 0.5s and 2.63s.
In order to investigate the impact of matching response spectrum variance (Equation 9)on the structural response statistics, sets of forty ground motions are selected using two meth-ods: “Method 1” in which only the target mean is matched (a common approach in currentpractice, e.g., Baker and Cornell 2006 and Method 300 in Haselton et al. 2009) and “Method2” in which both the target mean and the target variance are matched using the approach pro-posed here. The target response spectrum mean and covariance matrices are evaluated usingEquations 6 and 9 for each combination of e and T*. Figure 4 shows example response spec-tra of ground motions selected using these two methods (for e¼ 2 and T*¼ 2.63s).
STRUCTURAL RESPONSE
This section describes the response of sample nonlinear single-degree-of-freedom(SDOF) structures and multiple-degree-of-freedom (MDOF) buildings designed accordingto modern building codes. In this work, we consider only maximum displacement for theSDOF structures and maximum interstory drift ratio (MIDR) for the MDOF structures.
Description of Structural Systems
The SDOF structures considered in this work follow a non-deteriorating, bilinear force-displacement relationship (Chopra 2007). They have T*¼ 0.5s, 5% damping and post-
Figure 4. Response spectra of 40 selected ground motions for e¼ 2 and T*¼ 2.63s. (a) UsingMethod 1: Match target response spectrum mean and (b) using Method 2: Match target responsespectrum mean and variance.
A COMPUTATIONALLY EFFICIENT GROUND-MOTION SELECTION ALGORITHM 807

yielding stiffness equal to 10% of elastic stiffness. SDOF structures with R factors (the ratioof the target spectral acceleration at the period of the structure, SaðT�Þ, to the yield spectralacceleration¼x2 * yield displacement, where x is the structure’s fundamental circular fre-quency) of 1, 4 and 8 are considered to study varying levels of non-linear behavior. The Rfactor is controlled by varying the yield displacements of the SDOF structures relative tothe SaðT�Þ value obtained from the target spectrum. The SDOF structures are non-deterio-rating systems, so structural collapse is not considered.
The MDOF structures used in this study were designed per modern building codes andmodeled utilizing the Open System for Earthquake Engineering Simulation (OpenSEES;2007) by Haselton and Deierlein (2007). The structural models consider strength and stiff-ness deterioration (Ibarra et al. 2005) unlike in the SDOF case. The designs for these build-ings have been checked by practicing engineers as part of the Applied Technology CouncilProject ATC-63 (FEMA 2009). They have also been used for previous extensive ground-motion studies (Haselton et al. 2009). The two buildings used in the current study are afour-story reinforced concrete moment frame structure with T*¼ 0.94s, and a 20-story rein-forced concrete moment frame structure with T*¼ 2.63s. The buildings show deterioration,and collapse is said to occur if dynamic instability (large increases in the drift forsmall increases in the ground-motion intensity) is reached in the model (Haselton andDeierlein 2007).
Response of SDOF Systems
Table 1 shows the mean, median and dispersion (dispersion refers to logarithmic stand-ard deviation) of ductility ratios (spectral displacement divided by the yield displacement)of the SDOF structures under the different ground-motion scenarios described earlier. Theductility statistics are estimated using the two sets of 40 ground motions selected usingMethod 1 (ground motions selected by matching only the target response spectrum mean)and Method 2 (ground motions selected by matching the target response spectrum meanand variance). It can be seen from Table 1 that the median ductilities are similar across the
Table 1. Ductility ratio of SDOF structure
R
Median Ductility Dispersion of Ductility Mean Ductility
e Method 1 Method 2 Method 1 Method 2 Method 1 Method 2
0 1 1.00 1.00 0 0 1.00 1.00
4 3.93 3.76 0.24 0.31 4.21 4.18
8 10.76 9.97 0.28 0.42 10.82 10.74
1 1 1.00 1.00 0 0 1.00 1.00
4 3.55 3.35 0.22 0.33 3.79 3.93
8 8.04 8.16 0.28 0.46 8.57 9.46
2 1 1.00 1.00 0 0 1.00 1.00
4 3.27 3.04 0.19 0.28 3.39 3.34
8 6.90 7.44 0.24 0.41 7.34 7.98
N. JAYARAM, T. LIN, AND J. W. BAKER808

two ground-motion selection methods, while the mean and the dispersion of the responseare higher in Method 2, when the ground-motion variance is considered. The higher disper-sion of the response seen while using Method 2 is a result of considering the uncertainty inthe response spectra, which is ignored in Method 1. As expected, the increase in dispersionis particularly significant at large R values when the structure behaves in a non-linear man-ner. Note that there are no differences between the methods when R¼ 1, because theresponse is dependent only on SaðT�Þ, which is identical in both cases.
Figure 5 shows the fraction of response analyses that result in a ductility less than aspecified value for the SDOF structure with R¼ 8 in the e¼ 1 scenario, estimated usingMethods 1 and 2. This type of plot is referred to as an empirical cumulative distributionfunction, or CDF. The CDFs intersect at a value of approximately 0.5 due to the similarityin the median response in both cases. The CDF obtained using Method 2 is flatter withheavier tails as a result of the larger dispersion observed in this case. As seen from Figure5a, the upper tails of the CDFs are heavier than the lower tails. Since the mean response isthe area above the CDF (the mean of a random variable is the area under the complementaryCDF, which equals 1 - CDF), it can be visually observed that the difference in the heavinessof the upper tails results in a larger mean value of the response in case of Method 2 as com-pared to Method 1. This is a graphical evidence of the larger mean values reported earlier inTable 1. Analytically, if the responses were to follow a lognormal distribution (a commonassumption in performance-based earthquake engineering), the properties of the lognormaldistribution will imply that a larger dispersion results in a larger mean for a fixed median,which also explains the larger means observed in Method 2.
Response of MDOF Systems
Table 2 summarizes the maximum interstory drift ratio (MIDR) estimates for the MDOFstructures considered in this study under various ground-motion scenarios, estimated usingMethods 1 and 2. The distributions of responses are summarized using the probability ofcollapse (i.e., counted fraction of responses indicating collapse) and the median and the dis-persion of the non-collapse responses.
Figure 5. Distribution of the structural response of the SDOF structure corresponding to R¼ 8and e(T*)¼ 1: (a) linear scale and (b) logarithmic scale.
A COMPUTATIONALLY EFFICIENT GROUND-MOTION SELECTION ALGORITHM 809
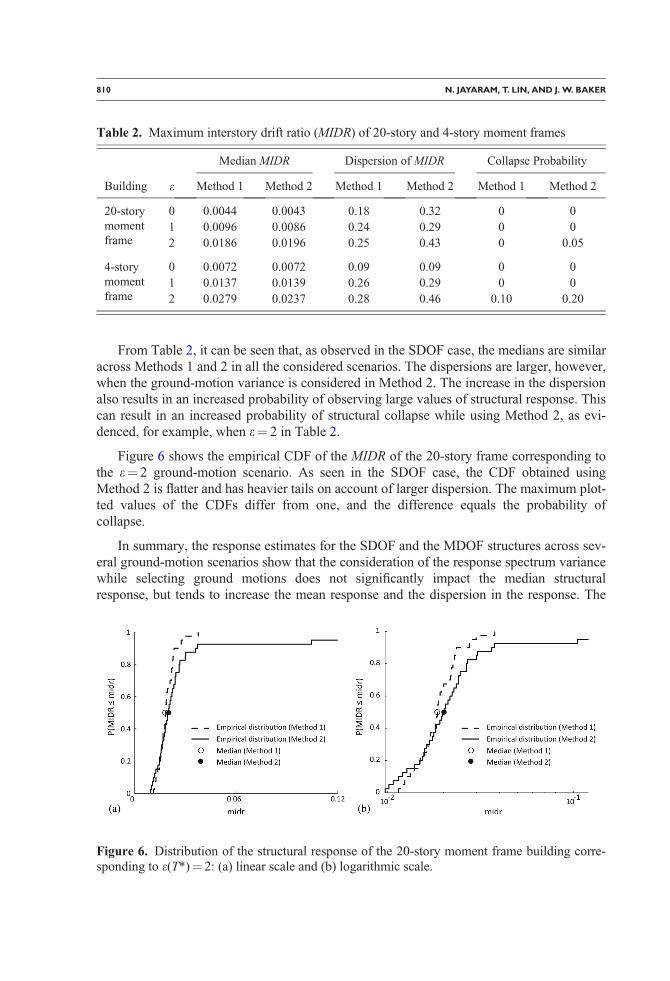
From Table 2, it can be seen that, as observed in the SDOF case, the medians are similaracross Methods 1 and 2 in all the considered scenarios. The dispersions are larger, however,when the ground-motion variance is considered in Method 2. The increase in the dispersionalso results in an increased probability of observing large values of structural response. Thiscan result in an increased probability of structural collapse while using Method 2, as evi-denced, for example, when e¼ 2 in Table 2.
Figure 6 shows the empirical CDF of the MIDR of the 20-story frame corresponding tothe e¼ 2 ground-motion scenario. As seen in the SDOF case, the CDF obtained usingMethod 2 is flatter and has heavier tails on account of larger dispersion. The maximum plot-ted values of the CDFs differ from one, and the difference equals the probability ofcollapse.
In summary, the response estimates for the SDOF and the MDOF structures across sev-eral ground-motion scenarios show that the consideration of the response spectrum variancewhile selecting ground motions does not significantly impact the median structuralresponse, but tends to increase the mean response and the dispersion in the response. The
Table 2. Maximum interstory drift ratio (MIDR) of 20-story and 4-story moment frames
e
Median MIDR Dispersion of MIDR Collapse Probability
Building Method 1 Method 2 Method 1 Method 2 Method 1 Method 2
20-storymomentframe
0 0.0044 0.0043 0.18 0.32 0 0
1 0.0096 0.0086 0.24 0.29 0 0
2 0.0186 0.0196 0.25 0.43 0 0.05
4-storymomentframe
0 0.0072 0.0072 0.09 0.09 0 0
1 0.0137 0.0139 0.26 0.29 0 0
2 0.0279 0.0237 0.28 0.46 0.10 0.20
Figure 6. Distribution of the structural response of the 20-story moment frame building corre-sponding to e(T*)¼ 2: (a) linear scale and (b) logarithmic scale.
N. JAYARAM, T. LIN, AND J. W. BAKER810

increased dispersion can result in more extreme responses, which can lead to a larger proba-bility of structural collapse.
These example analysis cases serve to illustrate the potential importance of matchingresponse spectrum variance. More detailed investigations regarding the impact are impor-tant, and will be carried out in the future.
IMPLICATIONS
Code-based design is often concerned with the average response of the structure (e.g.,ASCE 2005). The average response is typically interpreted as the mean response, althoughsometimes it is interpreted as the median. If median structural response is of interest, theconsideration of the response spectrum variance while selecting ground motions does nothave a significant impact in the limited investigation performed here. On the other hand, ifmean structural response is of interest, the consideration of the response spectrum varianceappears to increase the mean structural response and may thus impact code-based designcalculations.
Performance-based earthquake engineering (PBEE), in contrast, often requires knowl-edge about the full distribution of structural response (ATC 2009). Matching target responsespectrum variance increases the dispersion of structural response, thereby affecting the dis-tribution of structural response and consequently the damage state and loss estimation com-putations in PBEE. The increase in the dispersion leads to higher and lower extremes ofstructural response and the associated damage states and losses. The increased dispersioncan also lead to a larger probability of structural collapse. PBEE calculations will thusalmost certainly be affected by this issue.
In summary, the example analyses presented above and engineering intuition suggestthat the target response spectrum variance used when selecting ground motions has animpact on the distribution of structural responses obtained from resulting dynamic analysis.It appears that this is true for both code-based design checks and performance-based earth-quake engineering analysis. Further study is needed to quantify the magnitude of theseimpacts, and this new algorithm will facilitate such studies.
CONCLUSIONS
A computationally efficient, theoretically consistent ground-motion selection algorithmwas proposed to enable selection of a suite of ground motions whose response spectra havea target mean and a target variance. The algorithm first uses Monte Carlo simulation toprobabilistically generate multiple realizations of response spectra from a target distribution,and then selects recorded ground motions whose response spectra individually match thesimulated response spectra. A greedy optimization technique then further improves thematch between the target and the sample means and variances by replacing one previouslyselected ground motion at a time with a record from the ground-motion database that causesthe best improvement in the match. It was shown empirically that this selection algorithmselects ground motions whose response spectra have the target mean and variance.
The proposed algorithm was then used to select ground motions for estimating the seis-mic response of sample single-degree-of-freedom (SDOF) and multiple-degree-of-freedom
A COMPUTATIONALLY EFFICIENT GROUND-MOTION SELECTION ALGORITHM 811
(MDOF) structures, in order to assess the impact of considering response spectrum varianceon the structural response estimates. SDOF structures with different levels of nonlinearity(as indicated by their R factors) were analyzed using the selected ground motions. It wasseen that considering the response spectrum variance does not significantly affect the result-ing median response, but slightly increases the mean response and considerably increasesthe dispersion (logarithmic standard deviation) of the response. The increase in the meanand the dispersion is larger for more nonlinear SDOF structures. Two code-compliantMDOF structures with heights of 4 and 20 stories were also analyzed using the selectedground motions. As with the SDOF structures, it was seen that considering the responsespectrum variance does not significantly affect the median response but increases the disper-sion of the response and the probability of observing collapse. These observations haveimplications for applications where the dispersion of the response is an important considera-tion, such as in many performance-based engineering evaluations. A MATLAB implemen-tation of the proposed ground-motion selection algorithm can be downloaded from http://www.stanford.edu/~bakerjw/gm_selection.html.
ACKNOWLEDGMENTS
The authors thank Curt Haselton, Tom Shantz, Nilesh Shome, Peter Stafford, and ananonymous reviewer for their helpful reviews of the manuscript. Also, thanks to CurtHaselton for providing the structural models used for the example analyses. This work wassupported by the State of California through the Transportation Systems Research Programof the Pacific Earthquake Engineering Research Center (PEER), and by Cooperative Agree-ment Number 08HQAG0115 from the United States Geological Survey. Any opinions,findings, conclusions or recommendations expressed in this material are those of the authorsand do not necessarily reflect those of the funding agencies.
APPENDIX A: A GREEDY GROUND-MOTION SELECTION TECHNIQUE
The ground-motion selection algorithm described in the body of this manuscript selectsan initial set of ground motions whose response spectra match a set of simulated responsespectra. These simulations are obtained from a multivariate normal distribution parameter-ized by the target mean and covariance matrices. A greedy optimization technique then fur-ther improves the match between the target and the sample means and variances and obtainsthe final set of ground motions.
Sometimes, it may not be possible to completely parameterize the distribution of theresponse spectra using the mean and covariance information. This includes situations whereground motions are selected to match the UHS (where only the mean spectrum needs to beconsidered) or where the mean and the variance information, but not the correlation informa-tion, are available. There may also be situations where the response spectrum does not followa multivariate normal distribution. For such situations, the authors propose the following tech-nique for selecting the initial ground-motion set that can be subsequently improved by thegreedy optimization technique. The steps involved in the technique are summarized below.
• Step 1: Initialize the algorithm with an empty ground-motion set.• Step 2: Set i¼ 1.
N. JAYARAM, T. LIN, AND J. W. BAKER812
• Step 3: If the ith database ground motion (Gi) is not already present in the ground-motion set, include it in the set and compute SSEs;i (i.e, the SSEs of the set after Gi
is included, where SSEs is defined in Equation 2).• Step 4: Delete Gi from the set, if included in Step 3. Increment i by 1.• Step 5: If i is less than or equal to the size of the ground-motion database, go
to Step 3. Otherwise, identify the ground motion ~i that results in the minimumvalue of SSEs;~i. Add the ~i th ground motion in the database to the ground-motion set.
• Step 6: If the size of the set equals the desired number of ground motions,terminate the algorithm. Otherwise, go to Step 2.
This selection technique will provide a reasonable starting set of ground motionsthat can be subsequently improved using the greedy optimization technique described ear-lier in the manuscript. This selection technique does not take advantage of the knowledge ofthe response spectrum distribution or the correlation structure, but is therefore more generalin its application. It is also empirically seen to produce sets of ground motions withresponse spectrum mean and variance closely matching the corresponding target values.
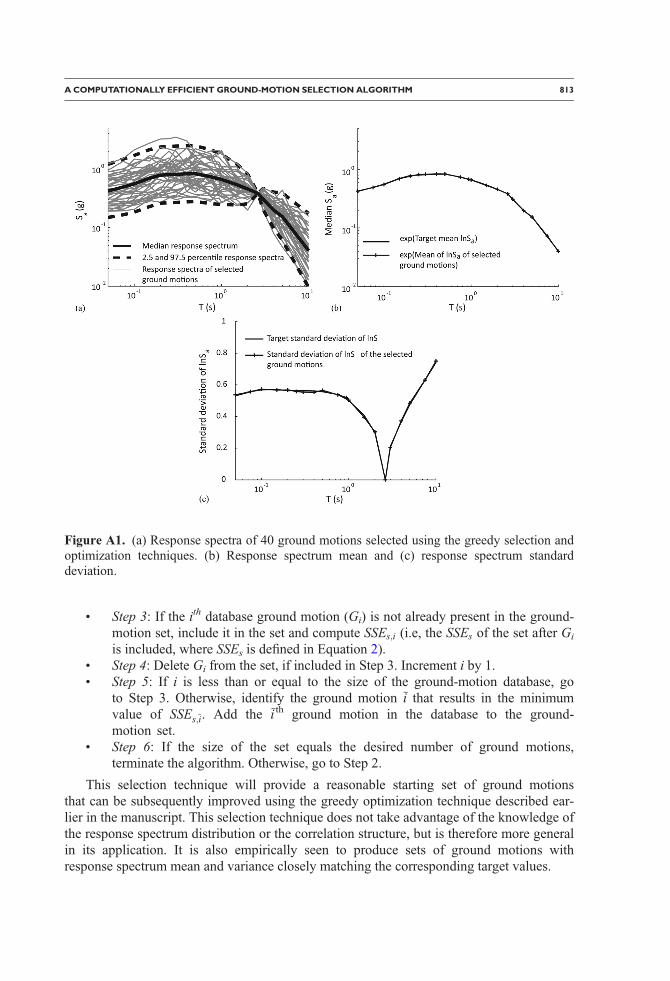
Figure A1. (a) Response spectra of 40 ground motions selected using the greedy selection andoptimization techniques. (b) Response spectrum mean and (c) response spectrum standarddeviation.
A COMPUTATIONALLY EFFICIENT GROUND-MOTION SELECTION ALGORITHM 813

To test the effectiveness of the technique, it is used to select a set of 40 ground motionsfor the scenario described earlier (magnitude¼ 7, distance to rupture¼ 10km, T*¼ 2.63sand e(T*)¼ 2). The response spectra of the selected records are shown in Figure A1a. Theground-motion set means and standard deviations are compared to the target means andstandard deviations in Figures A1b and A1c. It can be seen that the matches are good, illus-trating the effectiveness of the technique. Incidentally, despite the fact that the techniquedoes not use the correlation information, it is seen that the mean absolute error between thesample and the target correlations (Equation 7) is only 0.15.
REFERENCES
American Society of Civil Engineers (ASCE), 2005. Minimum design loads for buildings andother structures. ASCE 7-05, American Society of Civil Engineers=Structural EngineeringInstitute, Reston, VA.
Applied Technology Council (ATC), 2009. Guidelines for Seismic Performance Assessment ofBuildings ATC-58 50% Draft, The Applied Technology Council, Redwood City, CA.
Baker, J. W., and Cornell, C. A., 2006. Spectral shape, epsilon and record selection, EarthquakeEngineering & Structural Dynamics 35, 1077–1095.
Baker, J. W., 2011. The conditional mean spectrum: A tool for ground motion selection, ASCEJournal of Structural Engineering 137, 322–331.
Baker, J. W., and Jayaram, N., 2008. Correlation of spectral acceleration values from NGAground motion models, Earthquake Spectra 24, 299–317.
Beyer, K., and Bommer, J. J., 2007. Selection and scaling of real accelerograms forbi-directional loading: A review of current practice and code provisions, Journal of Earth-quake Engineering 11, 13–45.
Buratti, N., Stafford, P. J., and Bommer, J. J., 2011. Earthquake accelerogram selection andscaling procedures for estimating the distribution of drift response, ASCE Journal of Struc-tural Engineering 137, 345–357.
Campbell, K. W., and Bozorgnia, Y., 2008. NGA ground motion model for the geometric meanhorizontal component of PGA, PGV, PGD and 5% damped linear elastic response spectra forperiods ranging from 0.01 to 10s, Earthquake Spectra 24, 139–171.
Chiou, B. S. J., Darragh, R. B., Gregor, N. J., and Silva, W. J., 2008. NGA project strong-motion database, Earthquake Spectra 24, 23–44.
Chopra, A. K., 2007. Dynamics of structures, Prentice Hall, Upper Saddle River, NJ.
Federal Emergency Management Agency (FEMA), 2009. Recommended Methodology forQuantification of Building System Performance and Response Parameters, FEMA P695A,Prepared for the Federal Emergency Management Agency, The Applied Technology Coun-cil, Redwood City, CA.
Haselton, C. B., Baker, J. W., Bozorgnia, Y., Goulet, C. A., Kalkan, E., Luco, N., Shantz, T. J.,Shome, N., Stewart, J. P., Tothong, P., Watson-Lamprey, J. A., and Zareian, F., 2009. Evalu-ation of ground motion selection and modification methods: Predicting median interstorydrift response of buildings, Technical report, Report 2009=01, Pacific Earthquake Engineer-ing Research Center, University of California, Berkeley, CA.
Haselton, C. B., and Deierlein, G. G., 2007. Assessing seismic collapse safety of modernreinforced concrete frame buildings, Technical report, Report 2007=08, Pacific EarthquakeEngineering Research Center, University of California, Berkeley, CA.
N. JAYARAM, T. LIN, AND J. W. BAKER814

Ibarra, L. F., Medina, R. A., and Krawinkler, H., 2005. Hysteretic models that incorporatestrength and stiffness deterioration, Earthquake Engineering and Structural Dynamics 34,1489–1511.
Jayaram, N., and Baker, J. W., 2010. Ground-motion selection for PEER Transportation Sys-tems Research Program, in Proceedings, 7th CUEE and 5th ICEE Joint Conference, Tokyo,Japan.
Jayaram, N., and Baker, J. W., 2008. Statistical tests of the joint distribution of spectral accelera-tion values, Bulletin of the Seismological Society of America 98, 2231–2243.
Johnson, R. A., and Wichern, D. W., 2007. Applied Multivariate Statistical Analysis, PrenticeHall, Upper Saddle River, NJ.
Katsanos, E. I., 2010. Selection of earthquake ground motion records: A state-of-the-art reviewfrom a structural engineering perspective, Soil Dynamics and Earthquake Engineering 30,157–169.
Kottke, A. R., and Rathje, E. M., 2008. A semi-automated procedure for selecting and scalingrecorded earthquake motions for dynamic analysis, Earthquake Spectra 24, 911–932.
Naeim, F., Alimoradi, A., and Pezeshk, S., 2004. Selection and scaling of ground motion timehistories for structural design using genetic algorithms, Earthquake Spectra 20, 413–426.
Open System for Earthquake Engineering Simulation (OpenSEES), 2007. Pacific EarthquakeEngineering Research Center, University of California, Berkeley, http://opensees.berkeley.edu/ (last verified 03=29=2010).
Shantz, T. J., 2006. Selection and scaling of earthquake records for nonlinear dynamic analysisof first model dominated bridge structures, in Proceedings of the 8th U.S. National Confer-ence on Earthquake Engineering, San Francisco, CA.
U.S. Geological Survey (USGS), 2008. 2008 Interactive Deaggregations (Beta). http://eqint.cr.usgs.gov/deaggint/2008/ (last verified 03=29=2010).
Watson-Lamprey, J. A., and Abrahamson, N. A., 2006. Selection of ground motion time seriesand limits on scaling, Soil Dynamics and Earthquake Engineering 26, 477–482.
Youngs, R. R., Power, M. S., Wang, G., Makdisi, F. I., and Chin, C. C., 2007. Design groundmotion library (DGML) - Tool for selecting time history records for specific engineeringapplications, in SMIP Seminar on Utilization of Strong-Motion Data.
(Received 21 April 2010; accepted 16 July 2010)
A COMPUTATIONALLY EFFICIENT GROUND-MOTION SELECTION ALGORITHM 815