a concept and plan for the development of a weather · pdf filedevelopment of a weather...
TRANSCRIPT

FAA-RD-76-23
Project ReportATC-64
A Concept and Plan for the
Development of a Weather Support Subsystem for Air Traffic Control
S. I. Krich
S. M. Sussman
16 April 1976
Lincoln Laboratory MASSACHUSETTS INSTITUTE OF TECHNOLOGY
LEXINGTON, MASSACHUSETTS
Prepared for the Federal Aviation Administration, Washington, D.C. 20591
This document is available to the public through
the National Technical Information Service, Springfield, VA 22161

This document is disseminated under the sponsorship of the Department of Transportation in the interest of information exchange. The United States Government assumes no liability for its contents or use thereof.

Technical ReDo,tDo’”,,lerl tation Paqe
1.Repo,tNo. 2.Government Accession No. 3. Recipient’sCatologNo.
FAA-RD-76-23
4.Title and s. bt; tl.—
5. Rep.,, Do?.
16 April1976A ConceptandP[aItfortheDevelopmentofaWeatierSupportStisystemforMr TrafficCon=ol 6.Per form; .q C~90niza, ion Code
7, A.,hor!s) 8. Per f.rmimg Orqo”izotion Report No.
StevenL [email protected] ATC-64
9.Perfo,mi”g Orgon; za,ion Nqme and Add,ess 10. Work U.it No. (T1{AIS)
Mas %%chusetts Ins time ofTechologyLinwlnL&oratory 11,C..,,..,o,G...,N..P.O.Box73Wxtigton,Massachusetts02173
DOT-FA74WM-48513.TypeofRep.,, mnd P.,ziod Co.e,ed
12. Spo.,.,; ng Aq.ncy Name mnd Addre, s
Department.QfTransportation ProjectReportFederalAriationAdmtiistcationSystemsResearchandDevelopment%tice 1.4. Sp..,.r; ng Agency Code
Wasbi%ton,D.C. 20591
15.S.pplemen, ory Net.,
Theworkreprwd.in.tisdocumentwasperformed.atLincohL&orzto~,acenterforresearcho~ratedbytk MassachuseUStistititeofTechnologymderAirForceConwactF19628-76-C-0002.
16, Abs?roct
This reportsummariestk resultsofa stu~yto:(1)ti~estigatetheprima~needsofairtrafficconmollers.flowconmollers,.ati=nwalflowmntrollersforweatieritiormation,(2)&fineacosteffectivesystemmncepttomeet.t~seneeds,and(3)layoutaplan~>rthede-velopmentoftiepzmposedweafber.stisystemtosupportAirTraffic.Control.
Therecommendedsystemwillprotiderapidgenerationanddisseminationofreliableuserorientedobservationsandveq shortra~esevereweatherforecasts(upto30min.)tofacilitatecontrollerp-. Thisnewcaptiilifywill:1)rd.m weatherhducedconwollerworkload~aks,2)permitcontrollerstocoordinateandpreplanaircrtitreroutingforweatheravoidance,3)atieveanimprovedbalancebemeentheinefficiencyofoverreactionandtheessentialsofstiefy,4)fatilim=controllerresponsetopilotrequestsforweatherdamonaworkloadpertit-ttigbasis,ad 5)a&le theiss”mceofaccurateweatieradvisories.me systemwillalsoprotiderapidgmerationanddissemtiationofreUableshortra~eforecasts(upto4hours)topertitearlyintroductionofnecessa~flowcontrolprocedures.ThisnW capabilitywill:1)decreaseproblemsforcontrollers,2)increaseacceptmceofflowcontrol,and3)increasetrafficflowefficiencywithoutdecreasi%stiety.
7,Kay Words 18. Dis,rib. tie. Statem en?
fir TrafficControlMeteorologyDocumentisavafiabletotieptilicthrough
RadarMeteorology theNationalTechicalInformationSemite,Spri~field,Virginia22151.
9,Security Classif. (of +his rep..?) ~. Sec”,i+y Classif. (of this page) 21. No, of Pages
Unclassified Unclassified 124
FormDOT F 1700.7(8-72) Rcprod”cti.,,of comPl ,?t ed ,,,, s,: autl, ori ZC<l

TABLE OF CONTENTS*
“
.
.
Section
1.0 INTRODUCTION
1.1 Executive Smary
1,2 The Recommended System Concept
1.2.1 The Supporting Communication Network
1.2.2 The ARTCC WEather Processor (AWEP)
1.2.3 The TRACON WEather Processor (TWEP)
1.2.4 The SCC WEather Processor (SWEP)
1.2.5 Evolutionary Issues
2.0 NEEDS AND BENEFITS
2.1 Principal Limitations with Today’s System
2.2 User Needs - Long Term Goals
2.3 User Needs - Satisfiable in Near Term
2.4 Delay Costs and Accidents
2,4.1 Delays
2.4.2 Safety
3.0 USER.FFATUKPS
3.1 PVD Display of
3 .1.1 Utility
Radar Weather Data - En Route and Terminal
of Storm Cel1 Heights
3.2 En Route Controller Alphanmeric/Graphical Display
3 .2.1 Alphaweric Pages
3 .2.2 Selectable Alphanurics
3 .2.3 Graphics
Page
1
1
6
7
9
12
14
16
17
17
21
28
33
33
35
39
41
49
51
51
52
54

Section
3.3 Terminal Controller Alphanumeric Display
3.4 Flow Control/S~ervision Console
3.5 TRACON Supervisor’s Console
3.6 SCC Meteorologist
4.0 WCOMNDED SYSTEM ARCHITECTURE
4.1 Overview
4.2 ARTCC WEather Processor (AWSP)
4.2.1 AWP Processing
4,2.1.1 Radar netting
4.2.1.2 Radar performance monitoring
4.2.1.3 Very short range cel1 forecast
4.2.2 Data Storage and Wnagement
4.2.2,1
4.2.2.2
4.2.2.3
4.2.2.4
4.2.2,5
4,2,2.6
Radar weather data
Local terminal observations from the TWEPS
Selected NDC products
Service A and C
PIREPs
Alert messages
4.2.3 Display Formatting and Automated Alerting
4.2.4 Data Communication
4.2.4.1 Data collection
4.2.4.2 Data distribution
4.3 TRACON WEather Processor (TWEP)
4,3.1 ASR Radar Data
4.3.2 WRAP at Airport
Page
55
57
58
59
61
61
64
64
64
67
67
67
68
68
69
70
70
70
70
71
71
71
72
72
74
*

Section
4.3.3 Wind Shear and Wake Vortex
4.3.4 Automated Surface Observations - AV-AWOS,Automated LAWRS, N.OS, WOS, etc.
4.3.4.1 Coordination with TWEP
Semi
4.3,4.2 TWEP management
4.3.5 Other Functions
4.4 SCC WEather Processor (SWEP)
4.5 Communication Structure
of surface observations
4.5.1 Dial-Up Links - Communication Economy
5.0 THE ENGINEERING AND DEVSLOP~NT PLAN
5.1 AWEP,
5.1.1
5.1.2
5.1.3
5.1.4
TWEP, and SWEP Development
Processor Design and Interfacing
Coordination and Integration of Underway SensorDevelopments - AV-AWOS, Semi-Automated LAWRS, WindShear/Wake Vortex, AMOS, W~S
Field Demonstration Testing and Upgrading
Improved PIREP Procedures
5.2 ASR Modification for Weather
5.2.1 Validation of the SeverePrototype Development
5.2.2 NAFEC Testing and Flight
Weather Hypothesis and
Tests
5.3 Joint Use Weather Radar (FM, NWS, AWS)
5.3,1 Joint Use Feasibility Study
5,3.2 Prototype Development
5.3.3 Field Demonstration
5.3.4 Interagency Planning
v
.— - -,-...4-
74
74
74
77
77
78
81
85
87
87
87
89
89
90
91
91
91
92
92
92
92
93

Section
APPENDICES
Al. Data %tes
Al.1 WRAP to AWSP
Al.2 ~P-AWSP
AI,Z.1 ~P to A~P
A1.2.2 AWSP to TWEP
Al.3 SWEP-AWEP
A2. NWS Weather Communications
A3. Route Oriented PIMPs
A3.1 Overview
A3.2 Backgromd
A3.3 Data Collection Method
A3.4 knpower
AC~OWLEDGE~NT
REFERENCES
Page
94
94
96
97
98
98
100
104
104
104
105
106
107
108
.
.
vi

LIST OF ILLUSTRATIONS
.
Figure
1.2.1
1.2.2
1.2.3
1.2.4
1.2.5
2.1.1
2.2.1
2.2.2
3.0.1
3.1.1
3.1.2
3.1.3
3.1.4
3.1.5
3.1.6
3.1.7
3.2.1
3.3!1
4.1.1
4.2.1
Supporting communication network.
ARTCC weather processing and dissemination.
Candidate weather situation displays.
TRACON weather processing and dissemination.
Weather subsystem for ATC.
The ATC weather system today.
Chicago daily arrivals.
New York (Kennedy, LaGuardia, Newark) daily arrivals
Weather subsystem for ATC user features.
Candidate weather situation display - currentconditions.
Candidate weather situation display - 10 minutevery short range forecast.
Candidate ARTS III weather situation DISPLAY -no cell tops.
Candidate ARTS III weather situation DISPLAY -no cell tops.
Candidate low reflectivity, fixed threshOldweather contour.
Candidate high reflectivity fixed threshold weathercontour.
Narrow band weather subsystem.
CRD display from ~PS demonstration.
11lustrative terminal controller CRD display.
Weather subsystem for ATC structure.
The ARTCC weather processor (AWEP).
vii
Page
8
10
11
13
15
18
23
24
40
42
43
44
45
46
47
48
53
56
62
65

LIST OF ILLUSTRATIONS (Cent.). I
Figure
4.2.2
4.3.1
4.3.2
4.4.1
4.5.1
4.5.2
5.0.1
A2.1
A2.2
Radar netting.
TWCON WEather processor (TWEP).
Common terminal weather data base.
Recommended CFCF control room layout.
Overal1 INACS connectivity.
Weather data network.
The development p1an.
NDC and SDC.
WSFO type configuration.
.Viii
Page
66
73
76
80
83
84
88
101
102
.

ABBREVIATIONS AND ACRONYMS
.
.
.
AFOS -
A~S -
ARTCC -
ARSR -
ARTS -
ASR -
ATC -
ATCRBS -
AV-AWOS-
AWANS -
AWEP -
AWS -
BRITE -
c-
CAT -
CFCF -
CONUS -
CRD -
CRT -
DABS -
FM -
FSS -
INACS -
LAWRS -
MAPS -
~1 -
NAFAX -
NAFEC -
NAS -
NBWS -
NDC -
NMC -
NWS -
Automation of Field Operations and Services
Automatic Meteorological Observation System
Air Route Traffic Control Center
Air Route Surveillance Radar
Automatic Terminal Radar System
Airport Surveillance Radar
Air Traffic Control
Air Traffic Control Radar Beacon System
Aviation Automated Weather Observation System
Aviation Weather and NOTAM System
ARTCC WEather Processor
Air Weather Service
Bright Radar Indicator Tower Equipment
Current Conditions
Clear Air Turbulence
Central Flow Control Facility
Continental U.S.
Computer-Readout Device
Cathode Ray Tube
Discrete Address Beacon System
Federal Aviation Administration
Flight Service Station
IntegratedNational Aviation Communication System
Limited Aviation Weather Reporting Station
Meteorological and Aeronautical Presentation System
Moving Target Indicator
National Weather Facsimile Network
National Aviation Facility Experimental Center
National Airspace System
Narrowband Weather Subsystem
National
National
National
Distribution Circuit
Meteorological Center
Weather Service

Abbreviations (COnt.)
PIREP
PVD
RAMOS
R&D
RVR
s
Scc
SDC
SSF
STC
SVR
SWAP
SWEP
TCA
TIPS
TMCON -
TWEP -
WBRR -
Wsc -
WRAP -
WSA -
WSFO -
Pilot Report
Plan View Display
Remote Automatic Meteorological Observation
Research and Development
Runway Visual Range
Short Term (O-4 hr) Forecast
System Command Center
State Distribution Circuit
System Support Facility
Sensitivity Time Control
Slant Visual Range
Severe Weather Avoidance Plan
SCC WEather Processor
Terminal Control Area
Terminal Information Processing System
Terminal Radar Control
TWCON WEather Processor
Weather
Weather
Weather
Weather
Weather
Service A data:
SA
Sw -
SP
FT
FA
Ww -
WH -
NOSUMS -
Bureau Radar Remote
Message Switching Center
Radar for ATC Planning
Subsystem for ATC
Service Forecast Office
Surface Observation
Supplementary Weather
Special Weather
Terminal Forecasts
Area Forecasts
Severe Weather Forecasts
}IurricaneAdviseries
Notice to Airmen Summaries
System
x

.Abbreviations (Cent )
. FD -
Ws
WA -
SD
UA -
NOTAMS -
AS
FS -
.
Winds and Temperatures Aloft
SIGmNTS
AIRMETS
Radar Weather Reports
Pilot Reports
Notices to Airmen
Surface Analysis
Surface Forecast

1.0 INTRODUCTION.
1.1 Executive Sumary
This docment is the culmination of a study to: (1) investigate the pri-
mary needs of air traffic controllers, flow controllers, and central flow con-
trollers for weather information, (2) define a cost effective system concept to
meet these needs, and (3) lay out a plan for the development of the proposed
Weather Subsystem to support Air Traffic Control (WSA).
Today’s principal weather system limitations must be considered in the con-
text of major FM objectives for ATC to: (1) minimize controller work load
peaks, (2) increase capacity and economical airspace use, (3) increase safety,
(4) satisfy pilot needs, and (5) increase automation. A cataclysmic failure
will not result from the continued use of the present system; however improve-
ments must be made to achieve the above objectives by satisfying controller
weather needs and by developing a weather support system in harmony with other
FAA developments. To support these objectives control1ers need,more accurate
and fresher weather data presented in a user oriented fashion.
Presently, the radar depiction of weather to controllers consists of low
resolution, unreliable images of precipitation areas The regions of severe
weather hazardous to aviation are not well defined, and the controller’s view
of the weather is inferior to that provided to the pilot by airborne radar and
visual observation. This results in a dichotomy with pilots requesting course
deviations around storm cells without knowing traffic locations and controllers
trying to maintain minimum separations without knowing the severe weather sites
Weather problems at one airport or sector impact traffic control in a large
geographic region around the affected location. The dissemination of the rele-
vant surface observations and PIREPs today is largely manual, resulting in pro-
ducts too stale to permit appropriate decision making before problems develop.
The data are not generally presented to the controller in a truly user-oriented
fashion. The wealth of potential PIREP data has been largely untapped. Today’s
weather data management system is yet to truly benefit from modern computer com-
munication and data management. Moreover, it has not kept pace with the automa-
tion of the ATC system.
1
‘1 ——..-— —-c-,,...,-T ,-. .. .. . . . .. .. . ,, .imA-?s.:,:

The cost benefit of an improved weather subsystem can be based upon
traffic delays and accidents. Delay cost estimates, primarily due to
excess fuel consumption for the U.S. airlines ranges from $60 to $260 million.
Some of these delays unnecessarily result from controller overreaction to un-
known conditions caused by poor weather data. A single jumbo jet accident can
result in hundreds of deaths with a legal settlement exceeding a $100 million
plus the loss of a $25 million aircraft. Serious weather accidents, although
rare, can result from turbulence, wind shear, slippery runways, etc. The
savings from reduction of these costs by even a few percent could totally
amortize a new system.
Controllers primarily need an accurate indication of current significant
weather conditions plus a very short term forecast (0-30 rein)of those conditions
that are likely to change during the few tens of minutes an aircraft traverses a
sector. Significant data include radar depiction of turbulent thunderstorm cells;
surface observations of sky cover, ceiling, visibility, weather type, obstructions
tO ViSiOn, pressure, temperature, dew point, wind direction, wind speed, gusts,
altimeter setting; wind shear along the flight:path; and the locations and motion
of wake vortecies. These data are needed to minimize controller overreaction to
unknown weather conditions, to reduce controller work load peaks caused by un-
expected course deviation requests and unexpected actions by neighboring sectors,
and to promote the safe coordinated landing and rerouting of aircraft.
Flow controllers and central flow controllers primarily need a good indi-
cation of current conditions plus a short range forecast (O-4 hr)* of storm
fronts and conditions affecting airport capacity. Ideally flow control would
facilitate flight plan changes around affected routes before takeoff and would
provide a basis for holding aircraft on the ground if unable to land at their
selected destination. This would alleviate traffic congestion and save fuel.t
A unified connected system is essential to simultaneously support the
most significant weather needs of terminal and en route controlIers, flow con-
trollers, and central flow controllers. The effect upon ATC of a weather
.
‘More than 90% of the flights are less than 4 hours.tRecently, to avoid landing delays,the fuel advisory and departure pro-
cedure held Chicago bound flights on the ground at 150 airports. This pro-cedure saved 658,000 gallons of fuel during a one-day test.
2

disturbance is not restricted to the place where it occurs. The major system,
. data communication, and data management conclusions are:
1. Computerized weather data processors are needed in the systemcommand center, en route centers, and major TRACONS to manageand process the meteorological data base. These processors willprovide the controllers and flow controlIers with user orientedproducts on computer readout devices at each control position.Storm cell data will appear directly on the Plan View Display(PVD). Computerized data management is essential to assure rapiddata dissemination to controllers. A secondary benefit is thelimited number of people employed in the new subsystem.
2. To assure rapid data dissemination these weather processors mustbe interconnected to each other and to the many sensor data sources.‘Communicationdata rates are typically under 300 bits/see and couldeasily use standard telephone lines or be integrated into the Pro-posed Integrated National Aviation Communication System (INACS)
3. Controller needs for fresh, up-to-date surface observations andradar data are more stringent than the Flight Service Station(FSS), National Weather Service (NWS), or Air Weather Service(AWS). Service A does not in general satisfy ATC freshness needs.
4. Maximm e~loitation should be made of the meteorologist at theSystem Command Center (SCC). The NWS development of computerizedcommunication and display embodied in the Automation of Field Oper-ations and Service [AFOS) system and the National DistributionCircuit (NDC) can largely provide the automated aids needed bythe SCC meteorologist. This development has been paid for by theNWS. The SCC is the only location in the ATC system requiring ameteorologist. The NDC is also a valuable data source for theen route and TRACON weather processors.
5. The recent decision to co-locate FSS Hubs and en route centersaffords the opportunity to share resources. FSS and ATC areinterested in much of the same data base.
6. In the long term,airborne meteorological sensor data could beautomaticalIy transmitted via the DABS data link. In the nearterm, FSS and en route center CO1location permits tapping thewealth of PIWP data avaiIable from controllers for mutualbenefit. These PIREPs could be collected and interpretedespecially for selected routes in all weather (good or bad)conditions. Simple aids can facilitate this collection withoutadversely affecting controller work load.

It is important that certain sensor developments be actively pursued to sup-
port the WSA. The primary sensor concerns are:
1.
7. .
3.
4.
The existing surface observation development programs withinthe FAA and NWS (AV-AWOS, Semi-Automated LAWRS, AMOS, RAMOS)should satisfy ATC needs provided the data is rapidly dis-seminated.
A wind shear and wake vortex sensor development program is beingactively pursued and when developed should interface with theTRACON weather processor.
The ASRS, with appropriate modification, should be able to satisfyterminal control weather radar needs. The ARSRS can not satisfyen route control. This follows primarily from en route requiringstorm cel1 tops to permit overflight whereas two dimensionssuffice for terminal control where avoidance must be aroundcells. In addition both the ASR and ARSR radars can only pro-vide sufficient resolution to 75 Km range which suffices forterminal control but falls short of covering the en route air-space.
A new or significantly modified joint use weather radar net-work can si~ultaneously satisfy en route control, NWS, andAWS needs. ATC requirements for fresh data are in generalmore stringent than those of either the NWS or AWS.
The recommended development plan will achieve a prototype demonstration, a
design specification and an initial operating capability of the system concept
within five years of program initiation. During the five year development
cycle certain operational improvements can be achieved, particularly: (1) an
ASR weather modification to identify storm cells to controllers, (2) an AFOS
system to support the SCC, and (3) improved PIREP acquisition and distribution.
Development is subdivided into three program elenlents The first program
element focuses on the computerized weather data processors to manage, process,
communicate and display user-oriented data to controllers, flow controllers,
and central flow controllers. The second program element, the ASR Weather
modification, and the third element, the joint use Weather radar, are meant to
provide the needed radar data for terminal and en route control respectively.
A joint use weather radar capability must be demonstrated before the NWS, and
AWS deploy their next generation radars in the early 1980’s to assure appro-
priate features are included. Other needed sensor developments are currently
being actively pursued by the FAA and are not included in the development plan.
4

Subsection 1.2 provides an overview of the major elements and features,
in the recommended system. Those readers, without the need for details, may
skip to
for the
porting
system,
1980’s.
the development plan in Section 5. The body of the report is meant
most interested reader and is divided into four sections with sup-
appendices. Section 2 considers the principle limitations of today’s
the long-term needs and those needs that can be satisfied by the early
Section 3 describes the recommended system from a user’s viewpoint
focussing attention on the meteorological products and displays. Section 4
considers the system architecture to interconnect the data sources, process
the data t.osatisfy the needs,and supply the products described in Sections 2
and 3. Section 5 considers a plan for the development of the proposed subsystem.

1.2 The Recommended System Concept“
The proposed system concept has been ‘developedto eliminate the major prob-
lems with today’s system. The recommended system will provide rapid generation
and dissemination of reliable user oriented observations and very short range
severe weather forecasts (up to 30 rein)to facilitate controller planning. ~is
new capability will: 1) reduce weather induced controller work load peaks, 2) per-
mit controllers to coordinate and preplan aircraft rerouting for weather avoid-
ance, 3) achieve an improved balance between tbe inefficiency of overreaction
and the essentials of safety, 4) facilitate controller response to pilot requests
for weather data on a work load permitting basis and 5) enable the issuance of
accurate ATC weather advisories. The system will also provide rapid generation
and dissemination of reliable short range forecasts (up to 4 hours) to permit
early introduction of necessary flow control procedures. This new capability
will: 1) decrease problems for controllers, 2) increase acceptance of flow
control, and 3) increase traffic flow efficiency without decreasing safety.
The system will employ small computer processors at each en route center
and major terminal area for weather data management, automated alerting, weather
radar netting, and automated generation of very short range severe weather fore-
casts. The terminal ASR radars are to be modified and the en route ARSR network
is to be augmented by joint use (NWS, FM, AWS) Weather Radars to provide accu-
rate, fresh, high resolution data for storm cel1 depiction and automatic genera-
tion of very short range severe weather forecasts for controllers. Tbe colloca-
tion of automated Flight Service Station Hubs with ARTCCS will facilitate rapid
dissemination and interpretation of PIREPs. Display of weather data to control-
lers is to be provided by an upgraded version of the Meteorological and Aeronau-
tic Presentation System (WPS) at the ARTCCS and the Terminal Information
Presentation System (TIPS) at the major terminals; radar weather data is to be
available on the Plan View Display (PVD). Separate weather display consoles
are provided for central flow control, flow control and terminal supervisor
use. A telephone line computer communication network wi11 interconnect existing
and future sensors for rapid dissemination of weather information. The ful1
data base available in real time to the System Command Center meteorologist
6

. through the computer managed system wil1 facilitate analysis of impending weather
problems before they produce ATC problems. The short range forecasts of severe
. weather, generated automaticalIy, will be monitored by the SCC meteorologist and
wi11 be available for flow control applications. These data are to provide a
nationwide capability similar to that provided to the New York Center by the
resident meteorologist as a part of the Severe Weather Avoidance Plan (SWAP)
1.2.1 The Supporting Communication Wetwork
The communication network required to support the system can easily
be provided by low data rate telephone links; see Fig. 1.2.1. The three new
components comprising the ATC weather subsystem include: 1) the ~CC gather
~rocessor (SWEP), 2) the 4RTCC &ather ~rocessOr (AWEp), and 3) the XRACON
&ather ~rocessor (TWEP), A new joint use (NWS, AWS, FAA) ~eather ~adar for
&TC ~lanning (WRAP), network, provides storm cell data.
Data flow requirements demand connectivity between SWEP and each of the
20 AWEPS (within the Continental United States) and between each AWEP and its
associated TWEPS. The low required data rates permit use of standard telephone
lines or a network such as the proposed Integrated National Airspace Communica-
tions System (INACS). The particular communication structure is not critical
providing data delays are very smal1. Moreover, where geographically advantageous,
single links can service several AWEPS, although redundant routing is planned
for system reliability. The interchange of data with the FSS Hubs is facilitated
by collocation with the ARTCCS. Digitized low rate weather radar data is pro-
vided to the en route centers by the WRAPS. A single link can serve several
WRAPS where geographically advantageous. Some weather radar data wil1 be
provided through the narrow band links with the associated ATC surveillance
radars.
The system generates its Own weather data, but alsO dePends On available
standard weather products as currently distributed over Sezvices A and C from the
Weather Message Switching Center (WMSC)i preferably, in the future, these
products wil1 be provided by the National Weather Service through connection
7
,. ..

r
~ - SCC WEATHER PROCESSOR
M - ARTCC WEATHER PROCESSOR118-4-17294-21 ~ - TRACON WEATHER PROCESSOR
w - WEATHER RADAR FOR ATC PLANNING
‘Dc%6~-1200btssecdAWEP ●
I&h’~ ..-.
300 bits/see
ARSR WRAP
300 bitslsec
(~~
AS R
TWEP **~” TWEP
SATELLITE
AIRPORTSENSORS
WRAP
LOCAL
SENSORS
Fig. 1.2.1 Supporting communication network.
8
.

.
with the National Distribution Circuit (NDC).
tbe ATC facilities will be input through this
Observation data collected by
same network.
1.2.2
the weather
The ARTCC WEather Processor (AWEP)
The AWEP, to be installed in each en route center, is to handle all
data management, processing, automated forecast generation, intra-
center display, formatting, input/output and the communication control; see
Fig. 1.2.2.
Input radar data from each associated WEather Radar for ATC Planning (WWP) ,
ARSR in regions without proper WRAP coverage, and ASR are to be processed within
the AWEP to produce one composite-nettedpicture of current storm cel1 conditions
and the very short term (up to 30 rein)storm cel1 forecast. The resulting
weather situation displays, ilIustrated in Fig. 1.2.3, are selectable by con-
trollers on the PVD and are transmitted to other facilities. Hazardous sterm
cells can be indicated by C’s or graphically, along with their important para-
meters. Very short term forecasts (up to 30 rein)are selectable in 5 min.
increments.
Weather observations are obtained from the associated Terminal WEather
Processors (TWEPS), the NWS communication automation through their National Dis-
tribution Circuit (NDC), and/or Service A. Changes in termi]lalmeteorological
conditions are quickly transmitted from the TWEP to the AWEP to ensure con-
trollers have accurate data. These products are selectable on the controllers
weather Computer Readout Device (CRD),
The major collection and dissemination of interpreted PIREPS would be
performed within the FSS Hub facility; the appropriate aids are provided to
facilitate the acquisition of PIREPS from controllers. PIREPS received from
the FSS automation would be managed and formatted within the AWEP for rapid
display to the affected controller.
The controller input/output wil1 consist of an alphanmeric/graphi cal
weather CRD and a
forecast products
tant (alert) data
keyboard selection device. Weather radar storm cel1 and
can be displayed either on this display or the PVD. Impor-
will automatically be displayed.
9
.—..,..,..,,.,..,,,.......--...“. .,... ;.. M =. J .*..tl

wARTCC
WEATHERPROCESSOR(AWEP)
mTWEP
ARTCC
II
WEATHER CRD
Is ALPHANUMERIC/GRAPHICAL
ALPHANUMERIC
SRAPHIC\ I
FLOW CONTROL CONSOLE
10
Fig. 1.2.2 ARTCC weather processing and dissemination.

EN ROUTE10 MINUTE PREDICTION
mCURRENT cELLS
ARTS -~
LEGEND
c - HAZARDOUSS1ORM CELL
TAG PARAMETERS:
S - SEVEREH HEAVY~ ~ yGfTRAI
}
FIRST LE~ER
G GROWINGD- DECAYING}
SECONDLE~ER
OIAMETERIN MILES - FIRST NUMBER
HEIGHT IN m0U5ANDS OF FEET - SECOND NUMBER (en route only)
Fig. 1.2.3 Candidate weather situation displays.

The flow controller input/output wil1 consist of a graphical and textual
display with keyboard data recal1 and entry. All controller weather products
plus a short range forecast (up to 4 hours) of storm front activity, provided
by the System Command Center WEather Processor (SWEP),will be selectable by the
flow controller. Where necessary the SCC meteorologist will interpret the data
for the flow controller via a voice phone link.
1.2.3 me TRACON WEather Processor (TWEP)
The TWEP, to be installed at the TRACONS, is to handle all the
weather data management, processing, intra-terminal display, formatting, input/
output and communications control of terminal weather data; see Fig. 1.2.4.
This processor wil1 be less complex than the mini-computer system required for
the AWEP.
A consistent description of storm cells is derived from the ASR or if
available,a nearby WRAP and made available for display on the controllers PVD;
see Fig. 1.2.3. This data is also transmitted to the AWEP for further pro-
cessing to produce the very short term (0-30 min.) cell forecast which is then
transmitted back to the TWEP for display to terminal controlIers.
All observation and local sensor data, e.g., RVR, visibility, ceiling and
sky cover, wind shear/wake vortex,altimeter setting, wind speed and direction,
temperature and dew point, etc., for the airport and those satellite airports
receiving approach control from tbe TRACON are to be resident in TWEP Tbe sur-
face observation sensor developments like AV-AWOS, Semi-Automated LAWRS, AMOS
and RAMOS will facilitate the timely automatic collection of this data especially
during rapidly changing conditions. The TWEP maintains this common terminal
wide data base. There are a number of reasons for transmitting this data
directly to the TWEP: (1) controllers need the data, (2) only one interface
is needed between the TWEP and the controller displays instead of separate
interfaces with each sensor, (3) new sensors (like the wind shear/wake vortex “
sensor) can be easily interfaced with the TWEP, and (4) other data users can
access the entire terminal wide weather data base with one interface at the TWEP “
The TWEP also receives from the AWEP surface observations from nearby air-
ports, PIREPS and the short range (O-4 hr) storm front forecast.
12
-,

TRACON
,
SATELLITEAIRPORT
OBSERVATIONS
H ASRI I
II AWEP
TTRACONWEATHERPROCESSOR(TWEP)
I
Ir
~ WEATHER CRDALPHANUMERIC1
Is“PERV,SOR’SCONSOLE
Fig. 1.2.4 TMCON weather processing and dissemination
13
,........ ..........—....—.— k%%a>.mm

The controller input/output will consist of a textual CRD display, a
graphic display on the PVD, and a keyboard selection device. I~ortant (alert)
data will automatically be displayed. The user input/output wilI facilitate
rapid data retrieval. The same data will also be provided to the tower.
The supervisors input/output will consist of a single graphical/textual
display with keyboard data recall and entry. All controller products plus a
short range (up to 4 hour) storm front forecast will be selectable. Where
necessary the SCC meteorologist will interpret the data via a voice phone link.
1.2.4 The SCC WEather Processor (SWEP)
The SWEP, to be installed at the System Command Center, is to
handle al1 of the weather data management, processing, automated forecasting,
display formatting, input/output, communications control and interface with
the SCC automation system. See Fig. 1.2.5 for its relationship to the rest of
the system.
The SCC has the only full time meteorologist (an NWS employee) in the ATC
system. To effectively serve flow control, his data base must be as good or bet-
ter than that available in the en route centers and terminals; this is not always
tbe case today. An AFOS terminal (the NWS’S computerized communication,pro-
cessing and display terminal) is recommended to form the nucleus of the SWEP.
It is well matched to the meteorologists needs: (1) minimizing his clerical
tasks, (2) providing good access to the NWS data base, (3) it has been developed
for NWS meteorologists, (4) it will be a low cost solution having been developed
by the NWS, and (5) it should be upgradable for tbe special aviation weather
tasks.
Input radar data from the AWEP is to be processed within the SWEP to pro-
vide a national netting of current storm activity plus the short range (O to
4 hr) forecast. This data will be presented to the meteorologist who will re-
view and monitor system operation, and provide special interpretation to the
central flow and flow controllers. The meteorologist will have the authoriza-
tion, responsibility and support equipment to change incOrrect weather prOducts
based upon his assessment of new data. Short range forecast data and associated
meteorologist’s inputs will be formatted for transmission to the Al~TPs. Routine
14
.
.

METEOROLOGIST CONSOLE
1
600-,200 bit, f,ec
%
9020COMPUTER
4.,,,,
WEATHER,ROCESSOR
(AWEPI
wEATHERCRD_ ALPHAN”MERI;/ GRAPHIC4L
ALPHANUMERIC
a
GRAPHIC
,_,,.,. .,,
FLOW CONTROL CONSOLE II
,00 b’!s/sec
I wEATHERCRDf - ALPHANUMERIC
WRAP h“ o a~pps _S;::LM
WEATHER,:),
J::;::NSELECTOR
LOCALOBSERV&TlONS PR(~;;~
SATELLITEA(RPORT
OBSERVATIONS
- aASR
SUPERVISORS CONSOLE
Fig. 1.2.5 Weather subsystem for ATC.

weather observations
minal conditions and
mated alert features
and forecasts wil1 be obtained from the NDC; changing ter-
PIREPs wil1 be obtained from the AWEPS. Built-in auto-
will provide the meteorologist with early data on emerging
problems. Graphic and alphanumeric products prepared by the meteorologists
will be formatted for presentation to the SCC flow controller and transmission
to the AWEPS. The meteorologist’s input/output wil1 consist of several graphic/
textual displays, and operator entry devices. Communications with TWEPS will
take place through the associated AWEPS. Phone voice links will permit special
interpretationswhen necessary to flow controlIers and terminal supervisors.
1.2.5 Evolutionary Issues
In developing this concept for a weather subsystem it was recognized
that nothing should impinge upon the controller’sprimary responsibility of keeping
aircraft separated, The fresh and accurate weather data wil1 provide controllers
a capability to stay on top of the weather picture and thereby reduce the number
and impact of unexpected pilot requests for deviations The controller has com-
plete freedom to select or not select displays he deems necessary. No demand is
made upon tbe controller to act as a link between the weather information system
and the pilot; however the mechanisms are provided to enhance a common under-
standing of the weather situation for mutual benefit.
This system concept provides the air traffic controller with the same types
of weather information he receives today, i.e., radar weather data, surface
observations, and PIREPs. The major departure from the present system is that
this data wil1 be fresh and accurate. This is accomplished with modern computer
processing, data management and communication. No totally new sensors are
recommended for the FM. A modification is recommended for the ASRS and the
next generation of NWS and AWS radars should be designed for compatibility
with FAA needs in the en route centers. Full utility is taken of NWS communi-
cations, automation, and the present and planned surface observation network.
This is not a totally new subsystem, but rather one that takes full advantage
of the NWS present and planned capabilities as well as using state-of-the-
S.rttechnology to augment and upgrade today’s extensive ATC weather subsystem.
.
16

.
2.0
. 2.1
NEEDS ND BENEFITS
Principal Limitations with Today’s System
The current weather support system has evolved differently in each control
facility depending upon local conditions (Fig. 2.1.1). FOT instance, en rOute
controllers receive Service A data in a variety of ways - paper, COmputer Read-
out Device (CRD), viewgraph, or verbal. TRACON controllers receive observations
from satellite airports by phone and in some instances the flight data printer.
Some data is informally passed along from controller to controller along the
handoff lines. Between facilities verbal information is transmitted by phone
lines. Within facilities much data is hand copied or verbally transmitted.
Controllers are individuals; some make use of only essential weather data
whiIe others actively use and seek additional information for their own traffic
planning and to advise pilots. This variability exists even for controllers
occupying the same sector. It was thus concluded that any weather system must
allow for flexibility in controller use and should not be inflicted upon him
arbitrarily
The differences in methods of acquiring, displaying and using weather
information is not necessarily a limitation of the present system. The limita-
tion must be considered in the context of: (1) controller workload, (2) capacitY,
(3) safety, (4) pilot needs, and (5) the ability to support automation. A few
illustrative problems reflect upon these limitations:
Controllers become visibly uneasy during adverse weatherconditions. Primarily this results from a breakdown in thewel1 ordered traffic flow,forcing reroutings. This increaseshis work load and to compensate controllers will increase theseparation distance between aircraft thereby frequently un-necessarily decreasing capacity.
Severe weather, particularly that due to convective thunder-sterms, causes significant disruptions to the safe, orderlyflow of aircraft and an increase in controller work load.presently, the radar depictiOn Of weather tO cOntrOllers cOn-sists of low resolution, unreliable images Of precipitation

NWS Products
Service A-TTY *
NAFAX- facsimile Verbal ond hand Drepored c ‘:: ::0 ~ey
~R-57- W8RR
S,, ”’,. A—
m----------S.tellife Airport]
#/
.7_.._...
[
A$$islont ChiefF1OW Cent, alle,
o Ibroadband broad bond radar
PIREP (verbal]
d, th, nd, rstorm
e, w(”d shed,
FSS or NWS ~vRPhone PIREP +0 FSS
w,nddirection
Fi~, 2. 1, 1 The ATC weather sy. tem today.
Fig. 2.1.1 The ATC weather system today.

can
The
the
areas The regions of severe weather hazardous to aviation arenot well defined? which limits the ability of controllers toassist pilots without airborne radar. In addition thecontrollers image of the weather is inferior to that providedtO the pilot by airborne radar and visual ObservatiOns. Thisresults in a dichotomy with pilots requesting course deviationaround storm cel1s without knowing traffic locations and con-trollers trying to maintain minimum separations without knowingthe severe weather sites. One aircraft may deviate around astorm cel1 to the right and the very next aircraft may requesta deviation to the left. Even the request for a deviation fromthe first aircraft may surprise the controller. This disadvantagehampers coordinated rerouting and the efficient exercise of airtraffic control procedures today3 and may impact the computerizedautomation plans associated with conflict resolution, Intermittentpositive Control (IPC), and Metering and Spacing (M&S).
Weather problems at one airport or sector impact traffic controlin a large geographical region around the affected location. Thunder-storms, fog, rain, changing winds, etc., can reduce the acceptancerate, change the approach fixes, close a runway, or change the activerunway. Such events may force the rerouting of aircraft through anumber of sectors which aggravates the controllers peak work loadwhen he is caught by surprise. This is especially severe when itinvolves a line of closely spaced aircraft and the next sector sud-denly refuses tO accept additional aircraft. The largely ‘anualhandling of surface observations and pIREps, and the delaYs associatedwith Service A result in data frequently being too stale to permitappropriate decision making before problems develop. PIREPS, avaluable source for adverse cOnditiOnS, are frequently 10st Or delayedbecause the work required for distribution conflicts with higherpriority tasks. The slow dissemination and the fragmented uninter-preted form makes them almost valueless fOr traffic cOntrol and Ofmarginal use for preflight planning. The orderly collection of tbewealth of PIREP data from controllers and pilots,and the rapid dis-semination of interpreted reports to affected controllers and theFSSS would significantly enhance the utility of this data source.In the near term, a PIREP specialist could collect, interPret, anddisseminate the data. In the long term,to relieve the pilot, the airto ground digital data link could automatically acquire data fromairborne sensors.
The above are a few of the most illustrative limitations. mo cOnclusiOlls
be drawn; for weather information to be useful it must be accurate and fresh.
following sections consider the specific meteorological weather needs and
benefits to be derived.
19
,,...,”,.....,.—- ....-.—.L.r-,. ,.

First the specific en route, terminal and flow control needs for weather
data are considered, ignoring the ability of present technology to economically
or physically meet these needs These should be viewed as long term goals and,
where possible, the WSA architecture should permit the incorporationof these
features as the technology advances The second part discusses tbe needs which
can be met with current technology and implemented between now and the early
1980’s. They are incorporated into the system concept described in SectiOns 3
and 4. The reader is encouraged to carefully read Section 2.2, since there are
a nmber of concepts and definitions presented which are necessary for a full
understanding of the system description. Finally the costs related to delays
and accidents are considered.

2.2 User Needs - Long Term Goals
In this section, the weather information needed within the ATC system to
meet the objective of improved safety, efficiency, and economy are discussed.
Attention is restricted to only the most important needs of en route controllers,
terminal controllers, and flow controllers. For convenience, the en route and
terminal controllers will sometimes be referred to si~ly as controllers. Flow
controllers at each ARTCC and the central flow controllers at the SCC are both
referred to here as flow controllers.
Although the needs of the three types of terminal controllers73 (approach,
departure and tower) are different, it is premature to precisely specify the
individual differences. At this stage in the WSA development, it is necessary
to determine what meteorological information is needed by at least one terminal
control1er. If a meteorological product is available in the terminal the dis-
semination to all users desiring the product is easy and can be left to the
final design. This is consistent with the Terminal Information Processing
,,Meteorological and Status InfOrma-System (TIPS)studyl which concluded that,
tion were determined to be required by al1 primary and secondary control posi-
tions Its display should be adaptable to individual control positions.“ They
also observed that the personal preferences of individual controllers occupying
the same position varied. With computer generated display of weather products,
each controller could select the desired products as he occupied a position by
keying the number of a personal computer file listing the desired data.
ATC automation has reached the point whereby traffic flows in an orderly
pattern and control uncertainties have been largely removed, except under adverse
weather conditions The unpredictable or unexpected deviation request around a
thunderstorm, the unexpected refusal of an adjscent sector to accept any more
aircraft, the unexpected aborted landing, and many others, have a severe i~act
upon the controller work load peaks and severely impedes orderly traffic flow.
Alerting the controller to conditions which will affect the aircraft in his sec-
tor permits the appropriate preplanning, smooths out the work load peaks and
facilitates the flow of traffic without overreaction. In general, controllers
need good weather i]lformation:
21

to reduce work load peaks
to facilitate coordinated routing and rerouting
“ for hazard avoidance
to balance overreaction and safety
to respond to pilot needs
Controllers need a detailed description of current conditions and a forecast of
those conditions that are likely to change during the few tens of minutes an
aircraft traverses a sector.
Flow controllers, on the other hand, are more concerned with how many air-
Craft an air route or terminal can accommodate and are nOt particularly interested
in specific aircraft. A subsynoptic* description of conditions within an en
route center’s control area thus satisfies the flow controller’s needs This
should include forecasts of meteorological conditions that will exist along a
route or at a terminal when an aircraft is scheduled to arrive. Ideally, flight
plan changes would be made before an aircraft takes off, or an aircraft would
be held on the ground if unable to land at its destination, thus avoiding the
excess fuel consumption and airborne congestion in the terminal area. A reli-
able short range forecast for a period less than 4 hours would take care of the
majority of aircraft being handled by the ATC system. For pxample, the number
of arrivals at Chicago and New York vs. Aircraft Loading to Landing Gate Time
are plotted in Fig. 2.2.1 and 2.2.2. A 4 hour forecast would affect 93% of the
aircraft before takeoff for either of these destination airports.
In Table 2.2.1, the most important weather product needs of controllers
and flow controllers are tabulated. Relevant weather phenomena are listed along
the left side and various ATC activities are listed along the top. The ATC
activities are divided into the two user classes, controllers and flow controllers.
The letters C, V and S stand for the time frame needed to describe the meteoro-
logical phenomena where:
C stands for the best available description of “current conditions,”~t may be based upon the last avaiIable measurements or Pilot Reports(PIREPs),
“Subsynoptic refers to spatial scales between 100 and 1000 km.
22
.—. ”...—.-,—...

100
90
80
70
60
50
40
30
20
10
90C
80G
7oa
6oa
soa
400
300
200
100
—
f
—
01 .234 56 789
AircraftLoadingto LandingGateTime (hours)
Fig. 2.2.1 Chicago daily arrivals.

100
90
80
70
60
50
40
30
20
10
900
800
700
600
500
400
300
200
100
—
(
— ~
56789
AircraftLoadingto LandingGateTime (hours)
Fig. 2.2.2 New York (Kennedy, LaGuardia, Newark) daily arrivals.
24
-—. ...-.——-- —.- ..-.............. .. ~~:e>e;p=

.—..
-—
m“‘+
>
~.“+
>>“
—
.>
“+‘+
>—*>

~ stands for “very short range forecast.” It includes a meso-scaIe* description of current conditions plus a prediction of con-ditions in a few tens of minutes (i.e., a time frame matched tothe dwel1 time of an aircraft in a sector). It may be based uponcurrent measurements and PIREPs.
~ stands for a “short range forecast” for a period up to 4 hours.It includes a subsynoptic description of current conditions plusa series of forecasts from 1/2 to 4 hours. It may be based uponlast available measurements, PIREPs and NWS forecast products.
The subscripts “t”, “e”, or ,,f!,in the table indicate that the product is
needed by termina1, en route, or flow controllers, respectively. Generally, C
and V products are for use by controllers. Meteorological phenomena indicated
with a C do not change quickly enough, or the effect of meteorological changes
are not relevant enough to require a very short range forecast. Items indicated
with a V, as for example convective turbulence, do change significantly in the
few tens of minutes an aircraft traverses a sector. Most short range fOTecasts,
S, are to assist flow controller planning. The terminal is also interested in a
short range forecast to plan for the runway configuration which will maximize its
capacity. The absence of an entry in the table means that the impact of the
meteorological phenomena, although perhaps of interest, is nOt considered signi-
ficant enough to call for a forecast product.
The primary user of the forecast product is indicated in the table; hOwever,
there may be secondary users. For example, en route controllers also have a
use for terminal weather, but their needs are secondary to those of the terminal
controller. In other words, the en route controller’s needs for terminal weather
are not sufficient to justify developing a terminal forecast just for him; how-
ever, if one exists, then this information should be made available. Knowledge
of weather conditions outside the controlIer!s sector, primarily in adjscent
sectors and nearby terminals, enables the controller to preplan for the effect
of control actions in neighboring sectors. It also permits the controller, time
permitting, to assist the pilot.

It is i~ortant to note that a C, V, or S product for different users may
not be the same. For exa~l e, a very short range forecast of convective turbulence
intended to assist
spatial resolution
resolution must be
airspace.
a terminal contro11er in runway selection must have finer
than that needed by an en route controller, i,e., the spatial
retched to the flexibility the controller has in using tbe
27
————./.. ..... . ... ,:

2.3 User Needs - Satisfiable in Near Term
Many of the weather data entries shown in Table 2.2.1 cannot effectively
be provided with today’s state of the art. The objective between now and the
early 1980’s should be to satisfy a selected subset of the product needs. Fea-
tures which should be included in this next step are tabulated in Table 2.3.1
along with the data sources. The motivation behind this table was to extract
the weather products from Table 2.2.1 for which there are promising solutions
from both technical and economy viewpoints The most important aspect of this
next step is in the hazardous weather area with thunderstorms, low-level wind
shear and wake vortices having special attention.
With modern digital radar processing: preferably using a pencil beam radar,
thunderstorm cell locations, severity, height and diameter, plus a very short
range forecast (V) of these parameters would be available for graphical display
upon controller PVDS (this is described further in Section 3.1) The very short
range cell prediction would be based on the recent movement of current cells and
the expected growth of new cells These products are for use by controllers in
determining where the hazardous conditions are now and where they wi11 most
likely be up to a few tens of minutes from now. They are designed to help the
controller coordinate rerouting and respond to requests for help in avoiding
hazardous conditions. The time span of the prediction is designed to match the
transition time of an aircraft in his sector. The spatial resolution is designed
to span features that cannot be avoided such as runways, approach and departure
routes, and holding areas. For these forecasts, the severe weather conditions
are defined by small local reflectivity increases (cells) on radar observations
of the weather. Ground clutter and anomalous propagation (a serious problem with
the Narrowband Weather Subsystem) are largely eliminated. Objective forecast
techniques (computer forecasts) are required to process the available data in a
timely manner so the controller is aware of the hazardous conditions before they
occur, not after. This improved capability is not intended to remove the respon-
sibiIity for thunderstorm avoidance from the cockpit. However, if the controller
can preplan for, instead of react to, deviation requests his work load and job
tension are decreased and the capacity, especialIy in the terminal area should
increase.
28


I Flow Controller Functions ~I
WeatherPhenomena Airport Data Sources
Capa,city Air for Flowand Route ControllersCrossings Utilization Products
Convective Radar G NWSTurbulence s s Products
Runway SurfaceConditions:Surface Rainfall s NWS ProductsFreezing Rain and TerminalSnow, Ice Observations
Low Level Winds& Wind Shear
Wake Vortex
Cloud Height, NWS Products &Ceiling & TerminalVisibility s Observations
, I--- 1 .LA1 2
NWS Products &PIREPS
Winds Aloft s NWS Products &
**PI~.PS
Icing s NWS Products &PIREPS
BarometricPressure IS - Short Range
30
TABLE 2.3.1 (Cont.)
WSA 1980 FEATURES AND DATA SOURCES

A second, longer time span, short range forecast (up to 4 hour) is needed
to anticipate larger areas or sectors where thunderstorms will occur. This fore-
cast is based upon radar data, surface observations and NWS products The purpose
of this forecast is for use in planning air route changes to keep traffic away
from areas where deviations and resulting traffic delays will occur. The time
span of interest is governed by the time required to effectively reroute the
traffic and by the time the severe weather system will affect particular routes
The spatial resolution is governed by the size of severe weather systems such as
squall lines or rain bands responsible for closing a route or terminal. These
short range forecast techniques must detect disturbances that wil1 develOp intO
hazardous conditions before they are evident on radar and must predict the develop-
development, motion, and decay of the hazardous convective activity. COmputer
generated objective forecasts are needed to interpret the large amounts of data
available for forecast preparation in a timely manner.
The two other weather related phenomena, low-1evel wind shear and wake
vortices are particular hazards to landing aircraft. With accurate measure-
ments of wake vortex locations and prediction of their movement, landing separa
tions could be minimized with the associated increase in terminal capacity.
The development of sensors for both phenomena is being actively pursued under
FM sponsorship.
Notice that many of the data sources in Table 2.3.1 are quite similar to
those used today. The WSA will provide better acquisition, distribution and
display of these data. These data sources may not completely satisfy controller
needs as, for example, PIREPs for CAT, winds aloft, and icing. With pIREps~
the controller can only obtain data from the airspace where there are aircraft,
and the controller must rely upon pilot cooperation. The transmission of PIREPs
via radio is very cumbersome and much data is either 10st, misreported, Or
never obtained. A digital data link is needed to automatically obtain airborne
meteorological measurements for automatic processing without pilot or controller
involvement. It is unlikely that a digital data link will be sufficiently
deployed for this purpose during this next WSA development step (1980).
Thus, PIREPs wi11 have to be treated in a largely manual manner as they are
today with hopefulIy more orderly CO1lection and disseminationprocedures.
31

II
The above discussion focuses upon ATC needs; the system to implement the
results in Table 2.3.1 are described in Sections 3 and 4. This architecture
stresses a netted system which avoids duplication and integrates the many sep-
arate sensor developments into a unified system, thereby minimizing processor
and communication costs. The design is flexible to accommodate the evolutionary
changes which will certainly come about.
I32

2.4 Delay Costs and Accidents
Delays and accidents are very costly to aviation and even a few percent
decrease in their costs justify a significant expenditure in developing
the WSA. It is impossible to quantify the actual delay and accident reduction
resulting from the recommended system. Nor is it possible to quantify the cost
benefit from reducing controller tension and work load peaks. However, it is
shown below that delays, especially in flight, annually cost the airlines tens
to hundreds of millions of dollars. Similarly, each accident of a jet aircraft
can exceed a hundred million dollars.
2.4.1 Delays
ATC delay statistics for delays in excess of 30 minutes6,7
are pre-
sented by category in Table 2.4.1. It is evident from these data that weather is
is the major factor affecting delays and most delays are caused by terminal area
conditions especially those affecting runway usage. Typically, arrival delays
outnumber departure delays
route delays. An improved
of terminal conditions and
balance the relative costs
by a factor of two with only a few percent being en
aviation weather subsystem with an accurate forecast
severe en route conditions would permit users to
of cancelling before takeoff, holding, or diverting
to another terminal. Furthermore, it would permit flow controllers to anticipate
route and terminal capacity. A recent FAA test of the fuel advisory and depar-
ture procedure, designed to be used when weather or other factors cause aircraft
landing delays, indicates the magnitude of the possible saving. “The procedure
saved 658,446 gal, of fuel during a one-day test when Chicago-bound flights were
held on the groud at 150 airports until they could be accepted at Chicago’s
O’Hare InternationalAirport with a minimum of airborne delay.,,72
Many different delay cost estimates have been made; for example:
The air transport association estimates the annual costof scheduled airline delays to be around $90 million.
The cost of jet fuel to U.S. Air Carriers for domesticflights in 1974 was roughly $2.1 billion (8.2 billiongallonsg at $0.25 a gal) If even the small percentageof 3% of this fuel consumption were attributable to air-borne delays, an annual fuel delay cost of $63 millionis incurred.
33

TABLE 2.4.1
ANNUAL ATC DELAY STATISTICS
—
Percentage of ATC Delaysin Excess of 30 min
1971 1972 1973 1974 ~
Total Weather 89 89 74 64
Below Minimum 28 17 17 15
Low Ceiling/Visibility 13 13 15 9
Thunderstorms 17 17 15 21
Snow/Ice 11 21 9 10
Wind 11 13 12 7
Nonspecific 9 8 6 2
_—----
FM Equipment 2 3 5 6
Airport/Rmway Closure 4 3 14 14
Volme 3 3 5 14
Other 2 2 2 2

The cost percarriers for(8.2 billio~$0.25/gal).
airborne minute of jet fuel to the U.S.domestic flight in 1974 was roughly $5.3/reingallons consumed in 6.5 million hoursg atAssumifigan average delay of 5 minutes
per operation and 10 million operations per year resultsin an annual fuel delay cost of $260 l~iillion.
The data in Table 2.4.1 shows that a large percentage of these delays are
weather related. Since no weather modification is planned, except for possible
advances in fog modification, a high percentage of de”layswill continue to b.e
attributable to weather. However, better..weather information syst.ematicallY ‘:
used will.promote an efficient }.TC.s.ystemand.will hold delays, especially air-
borne delays, to a:minimum. An improved aviation weather subsystem reducing
these delaysby only a few percent, no matter which delay cost estimate is taken,
would reasonablyjustify an annual expenditure of several million dollars, on
purely economic greunds.
2.4.”2 Safety
Safety .pr,ovidesthe other cornerstonefo”rthe devel.oprnentof an
improved aviation weather subsystem. The””law suits resulting from the death
of a col~plehundred people on a jumbo:jet can easily exceed
dollars not including the 25 million.do.ll”arcostof a jumbo
meteorological conditions affecting safety, turbulence plus
safe landings and takeoffs are the most important.
From a review of accident reports and statistics it is
a hundred mi1lion
jet. Of.the
factors affecting
evident that severe
turbulence is the meteorological phenomenon most affecting safety throughout
all portions of flight. Brunstein2 has sumarized the damage and loss of life
attributed to turbulence involving U.S. air carriers for the period 1964 through
1969. His results are summarized in Table 2.4.2 which shows that turbulence
was involved in 22% of all accidents, with convective turbulence (turbulence
associated with severe weather, thunderstorms, squal1s, etc.) and CAT (tur-
bulence associated with clear air conditions) both being significant. In
addition there was little change in the accident incidence over the six year
period. These accidents resulted in 228 fatalities, 127 seriOus injuries, 5
*The average cost per airborne minute of jet fuel for a Boeing 727 experi-
enced by the major airlines during the third quarter of 1974 was also $5.3/rein.10
35

36

aircraft destroyed, and 4 substantially damaged. It is
of these 97 turbulence-involved air carrier accidents, 1
22% during descent, and 65% during normal cruise. Thus
mportant to note that,
% occurred during ascent
urbulence is an impOr-
tant safety factor in all phase of flight. However, the mst severe accidents
have occured during descent.
Although not separately categorized in these accident statistics, low-
level wind shear is a hazardous phenomenon that falls within the scope of the
WSA. Wind shear is at times a consequence of nearby thunderstorm activity.
Avoiding the vicinity of active storm cel1s wi11 therefore reduce the incidence
of low-level wind shear as wel1 as convective-turbulence-induced accidents.
The crash of an Eastern Airlines aircraft in New York on June 24, 1975,
apparently involved wind shear associated with thunderstorm activity. The
Ozark Airline flight that crashed in St. Louis on July 25, 1973” is another
exa~le of an accident related to thunderstorm activity near the approach path.
Brunstein points out that there were many cases whqre the flight crew was
aware of the turbulence possibility but the controller was unable to authorize
a deviation because of a traffic conflict or other control problem. With good
data the controller would be able to preplan for such deviation requests with-12,13
out ordering the pilot to take any action. As the traffic density increases
the control of aircraft becomes more sensitive to weather. This was especially
true in the New York area where separation minimms were violated by aircraft
deviating without controller permission to avoid storm cells. One of the
reasons for implementing the Severe Weather Avoidance Plan (SWAP) during the
sumer thunderstorm season was to enable planning for, instead of reacting to
thunderstorm activity.
There are even incidents2 of aircraft flying into convective turbulence
which was not detected by airborne weather radar. At the same time the con-
troller did not observe weather on the surveillance radar display and thus was
unable to respond to the pilot request for aid. Surveillance radars are opti-
mized to see aircraft, not weather. Photographs of NWS weather radar scopes
taken during such incidents have indicated severe thunderstorms and thus
weather radar data should be provided to controllers or the weather detection
capability of the surveillance radars should be improved.
37

It is evident from reviewing accident reports that poor visibility while
on final approach is a significant contributor to accidents. Contrary to flight
regulations, many pilots have descended below the minimum decision altitude
before seeing the runway and crashed.14,15,16,17
Runway surface condition is clearly critical to the safety of landing and
takeoff. For instance, freezing rain, snow and excessive rainfall can cause18,19 ~a~ ~au~ed aircraft to slidethe runway to be very slippery. Hydrop1arming
off the end of the runway. Cross wind is another important phenomenon affecting
runway safety, since each aircraft has a maximum crosswind component with which
it can safely land and taxi. Thus good measurements of final approach visibility,
runway surface conditions, and surface winds are i~ortant to improve safety.
Terminal controllers have additional interest in these conditions to enable the
selection of runways for maximum efficiency.
FinalIy, the wake vortex problem has become important with the introduction
of wide body aircraft. The crash of a DC-920 at Fort Worth in 1972 showed that
even large aircraft are affected. Measurements of the wake vOrtices prOduced
by large aircraft21
confimed the severity of the problem.

3.0 USER FEATUWS
The intent of this section is to show: (1) the weather products and dis-.
plays provided to en route and terminal controllers, the team supervisors,
the flow controlIer and the system comand center, and (2) how the users
wi11 benefit from these features. The system architecture indicating where
data come from how they are processed and the rather modest communication re-
quirement is left for Section 4.
Figure 3,0.1 illustrates the major user features. The controllers PVD and
the separate weather CRD (possibly WPS and TIPS) are primarily used to display
storm cells and textual data, respectively. The CRD could also display some non-
weather data. me supervisors or flow control console provides access to all
weather products used by control1ers and specially designed forecasts for one to
four hour planning. The SCC weather console is primarily used by the SCC meteoro-
logists to serve the central flow controllers. Data is exchanged between the SCC,
ARTCCS; and TRACONS at a very modest data rate. In the following subsections the
displays illustrated in Fig. 3.0.1 will be described in more detail. These
display depictions are helpful in describing the overal1 WSA concepts and it
should not be misconstrued as a recommendation for these precise displays.

18-4-17341-1
I
---
SCC WEATHER CONSOLE -
+ 600 – 12001 bits/see
SCC AUTOMATIONAND FLOW CONTROL .METEOROLOGICALDISPLAYS
1 FLOW CONTROL CONSOLE
4300 bits/see
TRACONWEATHER CRD
ANUMERIC
SUPERVISOR’S CONSOLE
Fig. 3.0.1 Weather subsystem for ATC user features.
40

Both terminal and en route controllers should be provided with a good reli-
able graphical depiction of the hazardous storm cells without cluttering the
PVD. Recent experimental results indicate that tbe hazardous storm cells are
relatively small physical entities (roughly 1-4 miles in diameter) which can
be identified with appropriate processing of pencil beam weather radar data.
By sacrificing the ability to measure cell tops, a similar capability is possi-
ble with appropriate processing of ASR or ARSR radar data, but only to a 45 mile5
range - quite adequate for terminal areas but not en route.
More specifically, consider the sequence of possible controller displays
in Figs. 3.1.1-3.1.7 which are selectable as needed. First consider Fig. 3.1.1
where the potentially hazardous cells are indicated on the PVD by the letter C
with tags indicating the cell parameters (these tags shOuld be selectable tO
avoid cluttering the PVD if the controller has more important data to display).
The first letter of the tag indicates the cell intensity; the secOnd letter
whether it is growing or decaying; the first nmber indicates the cell diameter
in miles; and the second nmber the cell height in thousands of feet. The
letter meanings are:
S - severe
H - heavy
M - moderate
L - light
G - growing
D - decaying
Thus the tag SG4-25 indicates a severe growing cell 4 miles in diameter and
25,000 ft high.
Controllers should also have a very short term forecast of where these
cells will be in 5 to 30 minutes. These predictions could be selected by
pressing a button which advances the cells (but not the aircraft) by 5 minutes
each time. The 10-minute prediction is illustrated in Fig.
tags are the same as in Fig. 3.1.1 except the indication Of
(G or D) is deleted.
3.1.2 where the
growth or decay
41
....- .-:-7= ,%,:.,.. .. ,.,,.,.

Fig. 3.1.1 Candidate weather situation display - current conditions.
42

10 MINUTEPREDICTION
.
43
Fig. 3.1.2 Candidate weather situation display - 10 minute very shortrange forecast.

Fig. 3.1.3 Candidate ARTS III weather situation DISPLAY - no cell tops.
44

Legend
O=Severe,..,‘\ , = Heavy
I .-.
1....,,..,::= Moderate......’
Fig. 3.1,4 Candidate ARTS III weather situation DISPLAY - no cell tops.
1.

I
18-4.17301
Fig. 3.1.5 Candidate low reflectivity, fixed threshold weather contour.

18-4-11302
.
Fig. 3.1.6 Candidate high reflectivity fixed threshold weather contour.

Fig. 3.1,7 Narrow band weather subsystem.
I
48

The following scenario indicates how this is useful. Consider the air-
craft M78 at 21,000 ft in the upper left corner of Fig. 3.1.1 which will
intersect cell HG3-20 (heavy, growing, 3 miles in diameter with a 20,000 ft tOP)
in 10 minutes. The controller, noting that this cell is still growing, can.advance the cell 10 minutes and observe as shown in Fig. 3.1.2 that this heavy
cell is predicted to be S4-30 (severe, 4 miles in diameter with a 30,000 ft
top). The controller is thus alerted to warn the pilot or expect a deviation
request from the pilot. With this type of good presentation, the COntTOller
can plan for and coordinate the rerouting around the hazardous cells.
Since most TRACONS would be served by an ASR which is unable to supply
height data, candidate ARTS-III weather situation displays are depicted in Fig
3.1.3 and 3.1.4.
It is expected that controllers will eventually only use the cell data and
forecasts. However, during the early implementation stages, contrOllers shOuld
have access to 2 threshold contours as is available with the narrowband weather
subsystem (NBwS). These could be selectable by the controller as illustrated
in Figs. 3.1.5 and 3.1.6. The fixed threshold contours indicated ,withWs and
Hs are for widespread rain (low reflectivity) and heavy rain (high reflectivity).
These low and high rain contours do not indicate aviation hazards and thus the
PVD display need only approximate the actual contours to within a few miles.
This flexibility simplifies the contour display algorithms. Note that the
potentially hazardous cells indicated in Fig. 3.1.1 must be accurately located
on the PVD. For comparison, the presentation of tbe NBWS is shown in Fig. 3.1.7.
The precise form for tbe PVD display of current cOnditiOns and verY shOrt
term forecasts will require a human factors study. The above are simply illus-
trative examples.
3.1.1 Utility of Storm Cell Heights
In the en route airspace, 5t0rm tOp infOrmatiOn is verY useful ‘ince
many aircraft can fly over the cells. In the terminal area where aircraft must
fly around or through a cell, the height information is not as important, except
as an indicator of turbulence. Although height information would also be useful
in the terminal area, it is not as valuable as in the en route airspace. Thus
49

a fan beam ASR is more suited to satisfy a terminal controller’s weather data
needs than an ARSR is for en route controllers. In addition, due to partial
beam filling, fan beam surveillance radar data can not be used to produce reli-
able weather situation displays as illustrated in Figs. 3.1.1-3.1.4 beyond 45
~iles.5 This is well suited for terminal cOntrOl but nOt en route.
50

3.2 En Route Controller Alphanumeric/GraphicalDisplay
Each control position should have a separate CRD display for presentation
of alphanumeric and possibly graphical weather data. This same CRD may also be
wed for non-weather data. The presentation of several pages of data tailored
to each control sector is well suited for this job. Data requests other than
page selection should be kept to a minimum and should rarely be needed if the
pages are designed properly for each sector. Special requests on a rare Occa-
sion can be handled as they are today by phone links or by means to be deter-
mined during system development.
3.2.1 Alphanumeric Pages
The system should be capable of presenting most of the data pre-
sently available on Service A, although in the future this same data will be
more conveniently received from the NDC, FSS Hub Automation or directly from
the airport terminal. The message types include:
. Surface observation (SA)
. Terminal forecasts (~)
. Notices to airmen (NOTmS)
. Pilot reports (UA)
“ Supplementary weather (SW)
. Area forecasts (FA)
. Severe weather forecasts (lVW)
. Hurricane advisories (WH)
“ Notice to airmen smaries (NOSUMS)
. Forecast winds and temperatures aloft (FD)
. SIGMETS (WS)
. AIR~TS (WA)
. Radar Weather reports (SD)
“ Surface fOrecast (FS)
51

In addition the same CRD display could be used for non-weather data as
for exaple:
restricted areas
communication frequencies
. preferred traffic routes
outages
approach plates
The best method of formatting these data should await the ~PS e~erimental
results at Leesburg. An appealing method is to have the data relevant to each
sector stored on some small number of data pages. Page 1 might include all the
data normally used by this sector and would be the one normally displayed. An22
example of this from the WPS demonstrations is illustrated in Fig. 3.2.1.
Page 2 might be a longer listing of SAS, page 3 PIREPS, page 4 NOTAMS, etc. It
is most important that these pages be designed for each controller. Controllers
do not have the time to read through long lists of data.
Service A data is not timely enough for surface observations when conditions
are changing quickly. Surface observations should automatically come directly
from the major hub airports during quickly changing conditions for display
on the CRD (see Sections 4.2.2.2 and 4.3.4 for the details of accomplishing this)
PIREPs, as presently available on Service A are of little value to con-
trollers; the delays are too long. However, timely PIREPs could be very valu-
able to controllers especially from higher/lower sectors or adjacent sectors.
Controllers usually have good PIREPs for their own sector and this information
needs to be collected and disseminated quickly to other sectors for display on
the CRD. FSS automation must be involved in this process. One method is dis-
cussed in Appendix A3.
3.2.2 Selectable Alphanumerics
It may be beneficial to
selecting SAS and FTs for terminals
outside the ARTCC boundaries. This
reserve the bottom line of each page for
not normally displayed, particularly those
would enable the controller to respond to
52

.?&
53
.,.,:,17>,

pilot requests for destination airport conditions. Naturally, this wOuld have
to be on a controller time permitted basis. Whether or not this extra feature
is cost effective or even desirable must be determined.
3.2.3 Graphics
There are a number of potential graphical applications for both
weather and non-weather users. Only the weather uses are discussed here. Con-
sidering that a graphics capability will significantly increase the cost Of
these CRD displays, careful consideration should be given to its effectiveness.
Potential apl)licationsfor weather graphics include:
The radar weather display of current conditions for a regionlarger than the control sector. This would enable the con-troller to anticipate storm movements into his sector and toalert pilots concerning storms in neighboring sectors. Thecontroller could also avoid cluttering the PVD with the weatherdisplay except when he is alerted to a problem on the separateCRD. This is not a substitute for selecting the weather graphicson the PVD.
i
PIREPs tagged to their geographic location; i.e., instead Ofa tabular listing, PIREPs could appear on a map indicating thereporting location.
54

.
.
3.3 Terminal Controller Alphanumeric Display
Each approach, departure, and tower control position should have an alpha-
numeric CRD display for weather data. Graphics, although potentially useful,
cannot be justified here. Surface observations for the airport or satellite
airports for which the controller is providing approach, departure Or 10cal cOn-
trol are the most important data to present. This includes sky cover, ceiling,
prevailing visibility, weather type, obstruction to vision, sea-level pressure,
temperature, dewpoint, wind direction, wind speed, gusts, altimeter setting,
runway visibility - RVV or RVR, wind shear and wake vortex. mere possible
these should be continuously updated from automatic sensors and controllers
should be alerted when a meteorological parameter has changed significantly.
This could be handled by flashing the parameter on the CRD until an acknowledge
button is pressed and possibly also flashing a light on or near the PVD to alert
the controller to look at the CRD. A nice feature of a CRD is that when new
sensors are deployed, as for example, the wind shear/wake vortex sensor, the
display can be adapted to accommodate the new information with no additional
hardware.
In addition surface observations, NOTAMS, and holding delays for a few
nearby airports should be displayed with updates at least once an hour. The
update interval should be automatically adaptable to the rate conditions are
changing.
cerning an
minimm or
Other
This would enable the terminal controller to advise the pilot,con-
alternate destination,when landing conditions are marginal, below
in an emergency.
i~Ortant data includes pI~ps! automatic alert messages, and mes-
sages generated by the terminal supervisor.
could be displayed as for example restricted
and facility outages.
A representative CRD display appears in
In addition some non-weather data
areas, communication frequencies,
Fig. 3.3.1; this is a modified
version of the MPS display illustrated in Fig. 3.2.1.
55

vLm
m
...

.
3.4 Flow Control/SupervisionConsole
The flow controller, with his weather console, should have access to:
all the weather data, graphical and alphanumeric, availableto controllers
graphical short range forecasts (O-4 hr) of squall lines andfronts (possibly 1/2, 1, 2, and 4 hour predictions updatedevery 20 minutes).
selected weather graphics from the NDC or FSS Hub Auto-mation
special
speciallogist,
graphical messages generated by the SCC meteorologist
alphanumeric messages generated by the SCC meteoro-or TRACON supervisor
A console with two CRD displays, one graphical and one alphanumeric, plus a key-
board entry and selection device should satisfy these display needs. However,
the design should be modular to allow for additional CRDS in en route centers
with particularlysevere conditions.
The keyboard entry and selection device in addition to selecting data is
to be used for:
sending alert messages to individual controllers, TRACONS,and the SCC meteorologist
entering PIREPs
The easy access of the weather data available to controllers provides the
flow controller with a good indication of current weather conditions. The short
range forecast (o-4 hrs) is automatically computer generated at the SCC and
transmitted to this CRD display. This will enable the flow controller to plan
the traffic flow for changing conditions.
An important feature is the ability to display the same graphics on both
the SCC weather console and the flow control console at the ARTCC. This would,
for example, permit the SCC meteorologist to provide real time interpretative
aid based on graphical products during telephone requests.
57
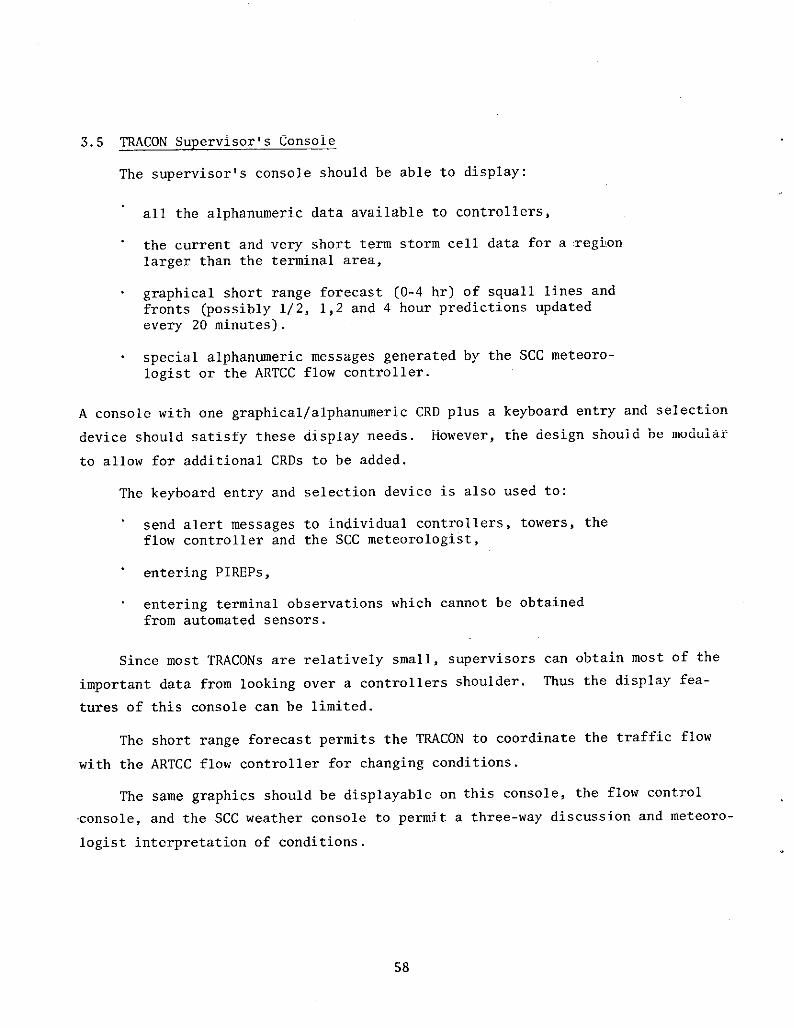
3.5 TWCON Supervisor’s Console
The supervisor’s console should be able to display:
all the alphanumeric data available to controllers,
the current and very short term storm cell data for a regionlarger than the terminal area,
. graphical shOrt range forecast (O-4 hr) of squall lines andfronts (possibly 1/2, 1,2 and 4 hour predictions updatedevery 20 minutes).
special alphanumeric messages generated by the SCC meteoro-logist or the ARTCC flow controller.
A console with one graphical/alphanumericCRD plus a
device should satisfy these display needs. However,
to allow for additional CRDS to be added.
The keyboard entry and selection device is also
keyboard entry and selection
the design should be modular
used to:
send alert messages to individual controllers, towers, theflow controller and the SCC meteorologist,
entering PIREPs,
entering terminal observations which cannot be obtainedfrom automated sensors.
Since most TRACONS are relatively small, supervisors can obtain most of the
important data from looking over a controllers shOulder. Thus the display fea-
tures of this console can be limited.
The short range forecast permits the TRACON to coordinate the traffic flow
with the ARTCC flow controller for changing conditions.
The same graphics should be displayable on this console, the flow control
console, and the SCC weather console to permit a three-way discussion and meteoro-
logist interpretation of conditions.
58

3.6 SCC Meteorologist
Once the SCC meteorologist has a timely aviation weather data base that is
at least as good as is available in the en route centers and terminals he may
well have
automated
(1)
(2)
(3)
(4)
Presently
difficulty keeping up with the requests for his service unless some
aids are provided. This data includes:
the NWS data base from the NDC. He is the only persOnin the ATC system trained to interpret their products
the storm cells and very short range forecasts (0-30 rein)transmitted from the en route centers and terminals
timely reports on changing surface observations
computer generated short-range forecasts (O-4 hr) basedupon radar data, surface observations, and NWS products
he has the data in item (1) through the high speed Service A teletype
drop and NAFAX. These are printed on paper and require extensive clerical
efforts to put in a usable form. The Service A could be computer interfaced
but NAFAX can not. He has storm data through the direct dial up of the NWS
radars; however this data is frequently stale, inaccessible aid is nOt PrO-
cessed to depict aviation hazards. The quality of the facsimile printout is
poor. He frequently does not receive reports on changing terminal conditions
until after a problem has developed. Finally the forecasts generated by the
NWS are for a lo,nger time frme than the o-4 hours most needed for ATc flOW
control.
With a good data base the meteorologist’s functions will include:
(1) interpreting available graphical and textual productsto the central flow controllers, flow controllers andterminal supervisors,
(2) anticipating aviation weather problems before theyhappen and alerting the affected facility, and
(3) monitoring and correcting if necessary the automaticcomputer generated forecasts (short range and veryshort range).
59
-........ ..,.,

Item (1) is an expansion of his present duties, item (2) he tries to do now but
is rarely able to with the available data base, and item (3) is a completely new
task To accomplish these tasks the meteorologist will find great value in a
computer driven display terminal with good user-oriented alerting and recall aids
He should be able to display, alter and add to the products available on the
terminal area supervisors console, and the en route centers flow control con-
sole. An interface is also needed with SCC automation to permit tbe meteoro-
logist to work up the appropriate graphical and textual displays which are
appropriate to the central flow controllers. The recommended architecture
to achieve this is discussed in Section 4.4.
I60

4.0
4.1
RECOmNDED SYSTEM ARCHITECTURE
Overview
The WSA satisfies most of the controller and flow controller needs for
timely, user-oriented weather products. The selected architecture connects and
unifies the many weather sensor developments and integrates the WSA into NWS
automation, FSS automation, and FAA communication plans. Careful consideration
has been given to avoid duplication of NWS services and particular attention
has been given to minimizing communication costs.
The system architecture e~loys three types of weather processors referred
to as the ARTCC WEather Processor (AWEP), the TRACON WEather Processor (TWEP),
and the System Comand Center WEather Processor (SWEP). These are small computers
which are linked together in a tree-like communication structure as illustrated
in Fig. 4.1.1. The main function of these processors is to satisfy the needs
expressed in Sections 2 and 3 of controllers for both graphical (primarilyradar)
and alphanumeric data. Each processor has four major functions which will be
described in detail in the following sections:
data storage and management,
data processing,
data communication, and
display formatting.
Each computer maintains the data base and provides the automated data handling
which is relevant to the controllers, flow controllers or supervisors it serves.
The data processing digests the weather data for suitable presentation to the
meteorologically untrained controllers. Appropriate processing also permits
use of very low data rate links between the various system nodes. For exa~le,
as illustrated in Fig. 4.1.1, 300 bits/see between the AWSP and TWEP, and be-
tween the WRAP and AWEP provides all the ATC meteorological data requirements for
radar and local observation data. The data rates on the links between the S~P
and each AWEP cannot be specified at this time, but are in the 600-1200 bit/see
peak data rate range. It makes little difference whether the particular com-
munication support system is a d&dicated link or integrated with other data flow,
61
;.—--..,.-

118-4-17294-2~
s~lEp _ Scc WEATHER PROCESSOR
= - ARTCC WEATHER PROCESSOR
~ - TRACON WEATHER PROCESSOR
w - W’EATHER RADAR FOR ATC PLANNING
Fig. 4.1.1 Weather subsystem for ATC structure.
62

1. provided sufficient capacity is provided and queing delays are small. Integra-
tion of the communication into the proposed Integrated National Aviation Commun-
ications System (INACS)231s a very sensible approach. Section 4.5 discusses
the communication structures in more detail.
63

4.2 ARTCC WEather Processor (AWP)
The AWEP, illustrated in Fig. 4.2.1, is an important element in the WSA
architecture. It provides regional collection and dissemination of timely
weather data to and from the terminal areas and simultaneously satisfies ARTCC
needs. This regional centralization enables netting of data for enhanced
utility, significantly simplifies the TWEP design, and avoids the extra com-
munication costs of TWEP processors talking with each other. The collocation
of the FSS hubs at the ARTCC centers would permit resource sharing for mutual
benefit. In the final design, the AWEP functions described here may be most
economically achieved by combining them with the FSS hub automation.
4.2.1 AWEP Processing
4.2.1.1 Radar netting. The AWEP processor combines the radar
weather data from the WRAPS, ARSRS, and ASRS within the ARTCC to produce the
best possible unified picture of current weather conditions. More specifically,
consider Fig. 4.2.2a, where two radars are providing a different weather depic-
tion of the fixed threshold contours and the individual cells in their over-
lapping coverage region. Such a presentation to a controller whose sector spans
these two radars would be confusing and clutter tbe PVD display. By combining
the data as illustrated in Fig, 4.2.2b, controllers will be provided a consistent,
easily interpreted presentation.
The combining of data in regions of overlapping coverage also results in a
higher quality depiction in this overlapping region than would be possible with
a single radar. The exact method of radar netting is left to an R&D program.
Methods to explore include:
(1) a simple weighted average with the weights dependingupon the type of radar and range,
(2) the maximm value being most conservative, and
(3) specific boundaries for each radar with no multisensoryaveraging.

i.
m
5SWEP
ARTCGWEATHER
PROCESSOR(AWEP)
ARTCC
II
— J+
WEATHERSELECTOR
9020 STORMCOMPUTER CELL
6TWEP
—
ALPHANUMERIC
SRAPHIC.
I FLOW CONTROL CONSOLE
I
Fig. 4.2.1 The ARTCC weather processor (AWEP),

/SECTOR BOUNDARY
Fig. 4,2.2 Radar netting.
66
——.-..-.

4.2.1.2 Radar performance monitoring. An important useful by-
product of radar(netting is performance and calibration monitoring of the
. radars. Consistent large differences in the cel1 parameter estimates or the
threshold contours is a good indication that the radar is out of calibration.
The AWEP will keep running statistics and send an alert to the supervisor’s
console when radar calibration maintenance is needed. This is not a substitute
for periodic on-site calibration.
4.2.1.3 Very short range cell forecast. The very short range fore-
cast of cell positions and parameters (0-30 min.) is best done within the AWEP,
instead of at the radar site or at the TWEP, for four reasons:
to do a good job, especially near the radar boundaries, thecel1 forecasts should be based upon the netted radar data,
tbe extra complexity in having the AWEP processor performthe very short term forecast is more than offest by simpli-fying the more numerous TWEP and WRAP processors,
the very short range forecast wil1 use wind field data whichis readily available in the AWEP from its connection with theNDC or Service C.
the very short range forecast wil1 be needed by the en routecontrollers anyway.
The very short range forecast wi11 be based upon cel1 tracking and wind
fields. The exact algorithm wil1 have to be determined in an R&O program. For
more details, the reader is referred to Reference 5.
4.2.2 Data Storage and Management
Data request delays cannot be tolerated by controllers and it is
thus important that all weather products for ARTCC controllers be stored in the
AWEP in a form suitable for imediate retrieval. Having to request data from
other WSA processors or the NWS on a routine basis with the immediate retrieval
requirement would complicate the communication requirements. Thus, re1evant
meteorological data should be routinely transmitted to the AWEP from the radars,
the NWS, and any TWEP equipped terminals.

The flow controllers similarly need quick data retrieval; however, occa-
sional delays of a few minutes are tolerable. For instance, special requests
from the SWEP processor or meteorologist for conditions in other centers need
not be answered immediately.
More specifics on the data to be stored in the AWEP follows.
4.2.2.1 Radar weather data. After the processing discussed above,
the netted radar of current ARTCC conditions and the very short range cel1 fore-
casts are stored in the AWEP for display to controllers, The short range fore-
cast (O-4 hr) of squal1 lines and frontal movement which is co~uter generated
at the SWEP is also stored in the AWEP for use by flow controllers.
4.2.2.2 Local terminal observations from the TWEPS. Terminal
observations, especially from any TWEP-equipped TRACONS, should be transmitted
to the AWEP periodically from all automated sensors. The update interval should
be adaptable to the rate of change of the measured parameters (see Section 4.3.4
for details) This will enable: (1) flow controllers to quickly spot deterio-
rating terminal conditions, (2) controllers to give pilots up-to-date data, and
(3) partially alleviate the uncertainty controllers have in feeding aircraft into
the terminal area. More specifically, the terminal observation data, which
should be transmitted to the AWEP if available in digital form from automated
sensors, includes: sky cover, ceiling, visibility, prevailing visibility,
weather type, obstruction to vision, sea-level pressure, temperature, deqOint,
wind direction, wind speed, gusts, altimeter setting, runway visibility - RW
or RVR, wind shear and wake vortex This data represents only 300-400 bits
from each airport (1 bit/see for updates every 20 minutes), would be available
from the TWEP data base, and can thus be readily obtained with a negligible
impact upon the AWEP-TWEP data link. In addition, these surface observations
may be useful in the short range forecasts (O-4 hr) at the SWEP.
68

4.2,2.3 Selected NDC products. The NnC24-27 ~lS a source for:
terminal
terminal
PIREPS
wind and
——-
observations from locations not connected to a TWEP,
forecasts useful to both controlIers and flow controllers,
temperatures aloft on a synoptic scale (useful in thepreparation of very short term cell forecasts).
graphical weather maps - these cannot be specified now since thecomputerized replacement of facsimile is still in developmentalstages. However, some of these products should be useful for flowcontrol planning.
Most of the above NDC data will also be needed by the FSS automation. The
graphical weather products which are presently available on NAFAX are more
applicable to FSS but possibly useful tO ATC. A partial list of these include:
200, 300, 500, 700, 850 Mb analysis
36 hr heights/isotachs forecast - 300 Mb
Radar summary
12 hr upper wind and temperature prog. - 9,000, 18,000, 30,000and 39,000 ft
Low level winds aloft - second5,000, 8,000 and 10,000 ft
Intermediate level winds aloft35,000 ft
Surface prog. - 12 and 24 hour
standard level above surface,
- 14,000, 25,000,
Significant weather prog. - 12 and 24 hour
. NMC surface analysis
. NMC weather depiction
Considering the overlap of interest in the NDC data
automation processor with the AWEP is a good approach to
69
30,000 and
base, combining
investigate, A
the FSS

communication system
instead of the NDC,
4,2,2.4
to support FSS automation may be a source for this data
Service A and C. Should the NDC not be available, the
terminal
on these
observations, forecasts, wind and temperature aloft data is available
two services.
4.2.2.5 PIREPs. Stale PIREPs, an hour or more old, are of little
utility for cOntrOlling traffic and thus the present service A ‘s not suited ‘or
ATC. With collocationof the FSSS in the ARTCCs, the pIREps relevant tO the
ARTCC would readily and quickly be available. Improved procedures tO Obtain
PIREPs on a routine and structured basis from controllers could be instituted.
For a further discussion, see Appendix A3,
4.2,2.6 Alert messages, The flow controller, assistant chief,
the FSS personnel, and the SCC meteorologist should be able to send special alert
messages to any location in the WSA. These should be in a free format. The
AWEP stores and routes the messages to the designated user.. AlthOugh it is en-
visioned that the number of alert messages will be small, this is an impOrtant
feature,
4.2.3 Display Formatting and Automated Alerting
Display formatting involves presenting the data in an appro-
priate form for display on the controller’s PVD, weather CRD and the flow con-
troller!s two CRDS. These displays and what goes on them have been discussed
in Sections 3.1, 3.2 and 3.4.
The controlIer’s weather display and the flow control console are relatively
straightfomard design tasks since it does not involve an interface with existing
ATC equipment. A human factors study is needed to determine the appropriate
formats.
The storm cell data on the PVD is complicated by the necessary interface
with the NAS 9020 computer. This interface will involve a design tradeoff be-
tween what is desirable from a hman factors vie~oint and what is possible with
the 9020. Displays like those in Figs. 3.1.1-3.1.6 are possible; hOwever,
human factor studies may end up preferring different display formats.
70

I4.2.4 Data Communication
The AWEP is the regional collection and distribution point for
weather data. This regional centralization should minimize processor and com-
munication costs.
4.2.4.1 Data collection. The AWEP receives digital weather data
from:
WRAP radars, .at300 bits/see, only when there is measurableprecipitation. The data includes cell positions, reflec-tivity, height, and diameter, plus one or two fixed thres-hold contours.
ARSRS for regions not covered by WRAP radars
TWEPS - ASR or WRAP radar data, surface observations, PIREPs
SWEP - short range forecasts, special messages
NDC, Service A and C, or FSS automation weather data.
4.2.4.z Data distribution, The AWEP transmits digital weather
data to:
SWEP - netted radar data, terminal surface observations, PIREPs,and special messages
. TWEP - netted radar data, very short range forecast, teminalobservations from other terminals, PIRSPS, the short rangeforecast originating at the SWEP, and special messages.

4.3 TRACON WEather
The WSA design
Processor (TWEP)
architecture stresses a unified system, connected elements,
minimum communication, with growth potential as technology advances. There are
a number of ongoing FM and NWS sensor developments whose outputs should be tied
together in a unified system to support aviation weather. These include digit-
ized radar, AV-AWOS~8 Semi-Automated LAWRS, wind shear and wake vortex, AMOS,
RAMOS, etc. Each of these provides digital data for use by ATC, FSSS, and the
NWS. The TWEP should serve as the centralized collection and dissemination
point for the weather data collected from airports for which the TWCON provides
apprOach and departure control. All digital weather data destined for terminal
controllers should first pass through the TWEP. It is important that these FM
and NWS sensors be computer compatible with the TWSP. This centralization has
a number of advantages:
there is only one interface with the controller’s displays,
the digital computer processing allows for easy expansionto include future sensors,
other potential data users can access the terminal weatherdata base with a single TWEP computer interface instead ofseparate interfaces with the many sensors at differentlocations,
avoids the proliferation of computers,
simplifies the communication network and most likely decreasesits cost.
The TWEP processor is considerably smaller than the AWEP; the data processing
is minimal, the amount of data stored and nlanagedis smal1, and there are OnlY
a smll number of controllers and controller displays. The TWEP role in the
WSA is illustrated in Fig. 4.3.1.
4.3.1 ASR Radar Data
It appears preferable to have an on-site ASR weather processor
preferably combined with the Moving Target Detector (~D) 29’‘“~71 aircraft surveiI-
Iance processor to produce the fixed threshold contours and identify cell loca-
tion, intensities and diameter. These data are transmitted to the TWEP for
72

TRACON
LOCALOBSERVATIONS k
~
SATELLITEAIRPORT
OBSERVATIONS
ASR
I AWEP II
WEATHER CRDF ALPHANUMERIC1
I
TRACONWEATHER
PROCESSOR(TWEP)
ano
SUPERVISOR’S CONSOLE
Fig. 4.3.1 TRACON WEather processor (TWEP)

display on the terminal controlIer!s radar scope.
data to the AWEP for radar netting and receives in
The TWEP also transmits this .
return the very short range
forecast (5-30 rein)and an updated depiction of current conditions based upon .
netted radar data. Whether the controlleris display of current conditions is
just from the ASR or the netted radar from the AWEP wil1 depend upon the distance
to the nearest radar in the net. Even if the netted radar is preferred, the ASR
data should be available for display in case of a communication failure with the
AWEP.
Since the ASR is usually on the ai~ort, communication costs between the
ASR and TWEP are not a prime consideration. It may thus be preferable for the
TWEP to assme part of this ASR weather processing. This decision wil1 have
to wait for the ASR modification program results
4.3.2 WRAP at the Airport
If there is a WRAP providing terminal area coverage then it wil1
be used instead of the ASR with the addition of storm cell top information.
4.3.3 Wind Shear and Wake Vortex
It is too early in this sensor development to detemine the precise
role Of the TWEP; however, the TWEP should be involved in alerting the controllers
of hazardous conditions Whether this is in the form of the hazard location on
the PVD, and alert message on the PVD or weather CRD, or simply a red and green
light remains to be determined,
When wind shear or wake vortex conditions exceed some threshold, periodic
updates should be sent to the AWEP to alert en route controllers and flow con-
trollers of changing terminal area acceptance rates. Once every 20 minutes
should normally be sufficient; however tbe update rate should be adaptive to
the fluctuation rate of the wind shear and wake vortex parameters.
4.3.4 Automted Surface Observations - AV-AWOS, Semi-Automated UWRS,
A~S, RAMOS, etc.
4.3.4.1 Coordination with TWEP. These automated sensor develop-
ments should be carefully coordinated with the TWEP; the digital observations
should be accessible. The parameters include as many of the following as can
be automatically measured:
74

,
cloud height
sky cover
present weather - precipitation [yes/no
pressure
te~erature
dew point
wind direction
wind speed
gusts
altimeter setting
prevailing visibility
runway visibi1ity (RVV)
RVR
, freezing precipitation
Those that cannot be automatically measured should be observed it least once an
hour and manually entered. More frequent observations should be made and entered
when conditions change significantly. The above parameters represent at most
300-400 bits, which is a very small quantity of data.
One scenario for integrating these sensors into the ~EP is illustrated
in Fig. 4.3.2. The automated sensors at the airports for which the TRACON pro-
vides approach control are accessible to the WEP with automatic dial up using
standard voice grade phone lines; dedicated lines are not needed. The time in-
terval between transmissions should be automatically adaptable and initiated by
the sensor. Once an hour should normally be sufficient; however, during quickly
changing conditions, every 5 minutes might be necessary, Forming a loop with
dedicated lines or integrating this data with other ATC communication data may
be mre advantageous in some places, The only important requirement is that
data, especially when conditions are changing, be rapidly transmitted to the
WEP .
For the larger airports usually collocated with the TWCON, the controllers
(approach,departure, and
Presently, they receive a
tower) need a frequent update of the local conditions
continuously updated meter reading of altimeter setting,
75
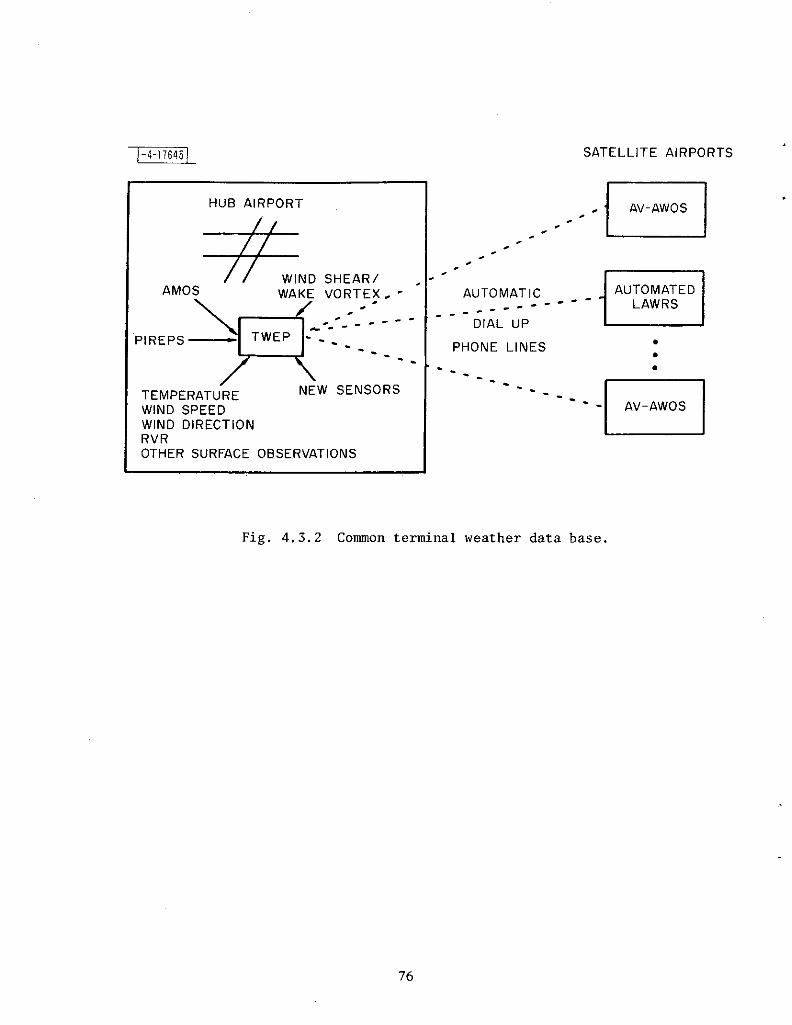
SATELLITE AIRPORTS ‘
HuB AIRPORT
//
// WIND SHEAR/AMOS
\
WAKE VORTE; . - -
/“
R
~-”----
‘I REPS — TWEP ---- - -----
---
TEMPERATuRE NEW SENSORS
WIND SPEEDWIND DIRECTIONRVROTHER SURFACE OBSERVATIONS
AV-AWOS
I
.-.-
AUTOMATIC
n
AuTOMATED----- - LAWRS
----- -DIAL UP
PHONE LINES..
---- .----
---- -uAV-AWOS
Fig. 4.3.2 Comon terminal weather data base.

.
wind direction, wind speed, and when cOnditiOns warrant, RVR. This service
should be continued except possibly the present meters at each control position
should be eliminated and the data presented on the controller’s weather CRD via
the TWEP. Some meter readout in the TRACON may be advisable for backup.
4.3.4.2 TWEP management of surface observations. The TWEp prO-
vides the approach, departure and the cOllOcated tOwer with the most ‘eCent ‘p-
alatesof local terminal observations. In addition, periodic smmaries are sent
to the AWEP. The update interval should be adaptable but will rarely be more
frequent than every 20 minutes. These summaries include the most recent reading
plus peaks and averages over the reporting interval. v~ithdigital cOmputer
processing, the nature of these peak and average reports can be specified and
changed once AWEP needs are more clearly understood.
4.3.5 Other Functions
The TWEP receives surface observations from the AWEP for nearby
airports (not controlled from this TRACON). This data should be accessible by
controllers on the weather CRD to assist pilots.
The supervisor should be able to enter PIREPs and other messages into the
TWEP for display to controllers and transmission to the AWEP.
Improved procedures should be developed for obtaining runway surface con-
ditions. This is especially important during slippery conditions such as
snow, ice, and surface water. Whether this should be from automated sensors
or from the runway crews should be looked into.

4. SCC WEather Processor (SWEP)
The NWS is undergoing an automation program24-27
of Weather Service Fore-
cast Offices (WSFO) and Weather Service Offices (WSO). This involves a mini-
computer based display terminal at each WSFO called Automation of Field Opera-
tion and Services (AFOS). This automation system stresses computers talking
with computers which are interconnected via the digital National Distribution
Circuit (NDC). Virtually all the products presently carried on the many tele-
type circuits (A,C,O, etc.) plus the facsimile products will be digitally cir-
culated nationwide on the NDC for display on the AFOS terminals.
The AFOS terminal is recommended to form the nucleus of the SWEP
following reasons:
. The NDC products and the AFOS display flexibility are wellmatched to the SCC needs for quick, timely, automated access
for the
to the NWS data base,
. The clerical tasks presently performed bylogist are minimized,
. AFOS has been developed for NWS personnelIogist provided by the NWS for SCC dutiesuse it,
the SCC meteoro-
and thus any meteoro-will be trained to
Life cycle costs are minimized since the NWS is developingAFOS and there will be maintenance economics associated withthe large number that will be in the field,
It should be upgradable to interface with the AWEPS and TWEPSfor access to the changing surface observations, storm celldata, the very short term cell forecasts and PIREPs,
It should be reprogramable to generate the special aviationweather products like the short range (O-4 hr) squall lineand frontal movement forecast. This will be based upon thestorm cell data, surface observation, and rawinsonde data,This may require additional mini-computer computation powerbut the same AFOS displays should suffice.
A means is needed for displaying to the central flow controllers the picture
worked up by the meteorologist on the AFOS terminal. A decision should be
coordinated with the SCC automation plans. Should the AFOS terminal be in-
stalled before SCC automation is realized, then there are
78
—.. ——.. ..—--- . . . . . ..- ....... ..-==.k . . . ----- ..--!---- -. .

a number of temporary options ranging from the present rear screen vie~vgraph
projections to a large screen video projection* directly interfaced to the AFOS
terminal. The latter type of equipment is rapidly evolving !~itha number of
systems on the market or being developed.
tro1
AFOS
The recommended installation of AFOS equipment25
for the Central Flo~’Con-
Facility (CFCF) room of the SCC is depicted in Fig. 4.4.1. Note that some
equipment is positioned nearby the flow controllers.
*For example, Video Beam Television produced by Advent Corp. Cambridge,
Massachusetts.
79
,,,4.

I AFOS EQUIPMENT
A = ALPHANUMERICDISPLAY MODULE
G = GRAPHICSDISPLAY MODULE
K = DATA ENTRY
KEYBOARD
w = WORK SURFACE
Fig. 4.4.1 Reco~ended CFCF control room layout

. 4.5 Communication Structure
Data communications for collection and dissemination of weather d:~taplays30,31
a significant role in today’s system and ~oil1 assome even greater impor-
tance in future, more a<~tomated systenls
An an:]lysis of the data flow on the \nrioL[slinks cor]ncctir}~Y~C f:lcilities
and NWS facilities has led to the estin]:ltcsof peak d:]t:lr:!tereqt~iremcrltsio
Table 4.S.1. Efficient coding illternlsof storm cells and contours permits the
~~catherradar graphic data to he tral]sn]itted:]tthe 10!od;lt:]r:ltcof 300 bits/
sec (see Appcndi.x A1) BetliccllSWI:I>iilldAlill’t.hereis some (Uncertaintyi]]dat:l
rate since the peak demand depends on the type of re~l-time interactive g~..aphic
communication that is carried on between the SCC met.eorolocistariden route f}O~
controllers.
The dema]ldfor communications capacity to support we:lthcrdata floi~bct~dccn
ATC facilities is small and can readily be accommod:itcdby the proposed Integrated
Natiol]alAviation Communications System (lNACS) or most any reliable data com-
munication network. The overall connect.ivi.ty of INACS23
IS shown in Fig. 4.S.1;
notice that a weather radar connection is provided.
In Addition to the FAA links, ~~catherdata will he c:lrriedby the NWS 011
the NOC and State Distribution Circuit (SDC). A brief description of these tioo
circuits and the nodal point processors is given in Appendix A2. For more
details, see References 24-27,
The role of the links in stlpportingthe aviation !~eatherneeds is illustrated
in Fig. 4.5.2, Arrowheads indicate the directiorlof oneway data flow; lines
without arro~osimply bi-direc.tional flow. The NOC loop connects WSFO’S and the
National Meteorological Center (NMC). A branch NWS - State Distribution Circuit
(SDC) to a WSO indicates one method of collecting weather data from automatic
meteorological observation stations (AMOS).
The left side of Fig. 4.S.2 represents The event~lalconfiguration of all
AWEI]linked to a WSFO, This connection can serve for both collection and dis-
semination of weather data. The observation statiorlsassociated t$iththe TWEP
equipped TRACONS could pass their data via TWE1]and AWEP to the NDC network.
81

TABLE 4.S.1
ATC WEATEiERDATA COMONICATIONS
Links Ty-peof Traffic
WSFO-AWEP
wMP-AWEP
AWEP-TWEP
SWEP-AWEP
AV-AWOS,Auto LAWRS- TWEP
Text and GraphicWeather Produlcts;Observations
Weather Graphics
Text and Weather Graphics
Weather Graphics;Short Term Forecast; Text
AlphanumericSurface Observations
Estimated Peak Channel_Data Rate (Bits/See) Type
2400 (initialNDC plan)1200 (without FSS hub)
300
300
One Way orDial Up
Half or FullDuplex
600-1200
Negligible
Half or FullDuplex
Dial Up
82

.
83

~
SERVICE
Fig. 4.5.2 Weather data network.
!84
‘

INACS can support the link between AWSP and SWEP via a routine that maY
involve several intervening ARTCC nodes.
An earlier stage in the evolution of the weather system is shown on the
right of Fig. 4.3.2. Surface observations from the stations in the ARTCC area
are acquired by the Weather Message Switching Center (WMSC) via Service A as
in the present system. Collection of observations involves manual handling of
data as indicated by the dotted lines from LAWRS to the TRACON and FSS. The
AWEP obtains weather data directly from the WMSC.
Note that the two types of ARTCC modes are entirely compatible and can CO-
exist during an indefinite transition period. The only requirement is a tie-
poi.ntbetween NDC and WMSC to permit exchange of data. such an inter~~nge
capability is planned for NDC according to the AFoS development Plan.
The broad outline of a weather data network presented here demonstrates
the need for close coordination between the FM and Nws tO assure mutual satis
faction of requirements, to avoid duplication of effort, and tO clearly define
interface specifications.
4.5.1 Dial-Up Links - Communication Economy
Eventually, as a network of WRAPS are deployed, the communicateOn
from these radars to the AWEP could be the major factor in communication costs.
However, most of the time, in most regions of the country, there is no measurable
precipitation. Automated dial-up using standard voice grade phone lines could
provide the data when needed. More specifically, the WRAP processor could auto-
matically initiate the phone link when certain thresholds are exceeded. Con-
sidering that the peak data rate is only 300 bits/see, nOrmal vOice lines ~Ould
satisfy the requirements.
The storm cell data also dominates the link between the AWEP and TWEP. A
variable capacity link using dial-up may also be preferred here with only the
surface observations being carried routinely.
85
——-. .. ... ...— .............$,=.-..=.---= ..?-----

Finally, for the AWEP-SWEP link, a dedicated 300 bits/see line could carry*
the surface observations to the SCC. When conditions warrant, a dial-up link
could transmit the storm cell data to the SWEP and the short range forecasts
plus special graphics to the AWEP.
l)ial-uplinks should be used instead of dedicated lines providing the duty
cycle is low enough. This decision must be made depending upon the weather
conditions around each facility and the availability of other data links to
multiplex data with. It is important to emphasize that the particular communica-
tion structure is not important and can vary from region to region. Rapid dis-
semination is the only requirement.
1‘The hourly and special surface observations come from the NDC. This link
provides more frequent updates when conditions are changing quickly.
86

5.0 TtlE
The
a design
ENGINEERING AND DEVELOP~NT PLAN
development plan (Fig. 5.0.1), will achieve a prototype demonstration,
specification and an initial operating capability of the system con-
cept within five years of program initiation. During the five year development
cycle certain operational improvements can be achieved, particularly: (1) an
ASR weather modification to identify storm cells to controllers, (2) an AFOS
system to support the SCC and (3) improved PIREP acquisition and distribution.
Development is subdivided into three program elements. The first program
element focuses on the AWEP, TWEP and SWEP to manage, process, communicate and
display user-oriented data to controllers, flow controllers, and central flOw
controllers. The second program element, the ASR modification to enhance weather
identification and the third element, the joint use Weather radar, are meant to
provide the needed radar data for terminal and en route control respectively.
Other needed sensor developments are currently being actively pursued by the Fti
and are not included in this development plan.
5.1 AWEP, TWEP, and SWEP Development
The goal of this development is to design a connected system to satisfy
the needs expressed in Section 2 with the features in Section 3. The system
architecture in Section 4 provides the structure on which to base the design.
This development is broken down into three efforts.
5.1.1 Processor Design and Interfacing
The goal is to develop the processor, display and communication
equipment necessary to demonstrate the concept in operational control facilities.
The major tasks are:
Design and implementation of prototype equipment.
. Computer processor sizing and software development to process,manage, communicate, and display the data.
Designing the supporting communication structure which takesmaximum advantage of FSS fluband NWS communication automationplans.

YEARS FROM START ~
0 1 2 3 4 5
I I I IL
lmpr.vedPIREP
~r.cedures
AWEP, TWEP, a SWEP TFully Depl.yed
C..rdin.ii.”o.d I.tegroti.n.f U“deway system
S.. S., Development - AV-AWOS, “Semi-Automated
LAWRS, Wind She.r/Wake Vortex, AMOS, RMOS
de$ign & interfacingfield demon, t,.tl.n
testing and upgrading
) , A , &
AFOS DesignInst.lfofi.n
~ I“ifialspecification
) Opemtlng.? Scc
MAPSgnd -Capability
zKC result,ASR M.difi.oti.” —
Weather R.dor &
- D..
ASRM.difi.atl.” f.r Weather
specification
J.i”t U,e We~the, bda, (FAA, NWS, AWS)
Joint .,. P,ototype held
fe.,ibi Iity developmentdem.n,trati.n
,t”dy
‘w
1ntewgen.yPlanning
Prel iminbrydecision
J.i”t U,. ImplementationDeci$ i.. P!.”
Fig. 5.0.1. The development plan.
88

.FSS tiubcoordination to promote shared reso[]rcesand avoidprocessor duplication especially in the en route centers.
NWS coordination to encourage the generation of weatherproducts, primarily forecast, in a form most applicable toATC
AFOS installation and assessment at the SCC
5.1.2 Coordination and Integration of Underway Sensor Developments - AV-AWOS, Semi-Automated LAWRS, Wind Shear/Wake Vortex, AMOS, RAMOS.
The goal is the common terminal wide weather data base which is
necessary to support the TRACON. These sensors, as currently being developed,
should adequately satisfy ATC in the eighties. Tbe major tasks are:
Monitoring the sensors digital output design to ensure compatibility with the TWEP design.
Establishing the timely communications necessaryterminal control.
to support
5.1.3 Field Demonstration Testing and Upgrading
operational control
manage:nentof the sur
The goal is the system concept validation in
facilities. These tests will include the processing and
face observations, forecasts, ASR radar, and weather radar data to produce the
displays discussed in Section 3. The major tasks are:
To assess the benefits/cost on the TRACON, En Route, andSCC facilities.
The implementation of weather displays and user access withthe appropriate human factor considerations.
The design and implementation of necessary upgrading basedupon the operational tests
AFOS upgrading at the SCC if necessary.
A design specification for an operational system.

5.1.4 Improved PIREP Procedures
The goals are improved procedures for acquiring and disseminating
PIREPS. The major tasks are:
To develop improved procedures for use in the near term untilthe implementation of the DABS data link.
To plan for the automatic acquisition of airborne meteoro-logical data from aircraft via the DABS data link.
90
.
One new idea to consider in the near term is described in Appendix A3.

5.2 ASR Modification for Weather
The goal is the depiction and forecast of hazardous weather to terminal
controllers with a radar weather processor integrated with the Moving Target
Detector (MTD).2g’70’71
5.2.1 Validation of the Severe Weather Hypothesis and PrototypeDevelopment
Recent MIT Lincoln Laboratory studies5..lndicatethat regions
hazardous to aviation due to convective turbulence can be identified with pre-
cision measurement and processing of radar reflectivity maps. The goal of this
subtask is to validate this hypothesis and produce a prototype weather modifi-
cation for the ASR. The major interrelated tasks are:
A prototype ASR weather processor suitable for testing inconjunction with the ~D.
Very short term forecast algorithm development
Pencil beam radar and flight test experiments to assessthe association of small cells with aircraft hazards
5.2.2 NAFEC Testing and Flight Tests
The goal of this subtask is to demonstrate to the FAA the validity
and utility of the ASR weather processor. The major tasks are:
Integration of the weatherdisplay.
Validation flight tests.
A design specification forprocessor
processor output into an ARTS III
an integrated MTD - weather
91
-.=.....,,...,,,.,-s.-.—.....—.-—. —

5.3
port
ware
Joint Use Weather Radar (FAA, NWS, AWS)
The goal of this subtask is a weather radar network to simultaneously sup-
FAA, NWS and AWS needs. The FAA should take a leadership role in this hard-
development because their needs for fresh data are the most stringent.
5.3.1 Joint Use Feasibility Study
The
tions necessary
are:
goal of this study task is to conduct the preliminary investiga-
tor development of a joint use weather radar. The major tasks
Understanding the needs of each agency
Defining an e~erimental program to demonstrate thejoint use desirability
Strawman radar designs
The cost benefits of a joint
5.3.2 Prototype Development
The goal of this subtask
suitable for joint use testing.
The hardware developmentstrawman design
The
use weather radar network
is to develop a prototype weather radar
major tasks are:
to implement tbe most promising
A test plan to demonstrate the joint use capability
5.3.3 Field Demonstration
The goal of this subtask is to demonstrate tbe joint use weather
radar in operational facilities. The major FAA tasks in this testing are:
To interface with the prototype AWEP being fielddemonstrated at this time
To determine the utility of the data for ATC.
92
.

5.3.4 Interagency Planning
The goal of this effort is to plan a comprehensive development and
implementationprogram for a new joint use weather radar national network which
would interface with user-agency systems for the 1980s and 1990s. The major
tasks include:
. Prepare cost vs. benefit analyses
. A final decision on joint use desirability and compatibility
. Develop an engineering requirement (specification)forprocuring the joint use weather radars
. Develop an implementation plan
93

Appendix A
Al Data Rates
This section provides the justification for the low data r:~tesexpressed
in the main pt~rtof this report. The coding methods discussed are illustrative
and sho~lldnot he taken as the optimum method.
All WRAP to AWE1’
The follolti]lgdiscussion considers the number of bits to describe the
cells and contours at two fixed threshold levels. The relevant radar parameters
are:
6 = azimuth accuracy or beamwidth
r = range accuracy
R = maximum range
The important cell attributes are:
N=
c=
number of cells
number of bits to specify a cell parameter:
position = [log2 R/r] + [log2 360/e]*
intensity
diameter = a bits
height
The cells are thus described with
N x C = N x ([log2 R/r] + [log2 60/6] + a) bits
The important fixed threshold contour parameters are:
M = number of fixed threshold contours
J = number of points in each contour
Each contour can be described by
(1)
*[x] = greatest integer in (x+1-c] for small &.
94

. [log2 R/r] + [log. 360/8] + 3J bits
where the first two terms specify the R-9 coordinates of the starting point.
It takes 3 bits to specify which of the 8 surrounding points is the next one
the contour. Thus for the hlcontoljrsit takes
on
M([10g2 R/Tl + [log2 360/6] + 3J) bits (2),
The total number of bits per picture is fo(,ndby adding (1) and (2).
To bound tbe data rate consider the following nmerical example. The
number of cells
practice from a
R = 200 Km
1-=1 Km
e = 1.1°
N=50
M=60
J=80
and contours was selected to be higher than should be found in
WMP radar.
~ = 17 (intensity= 6, diameter = 5, height = 6)
Using these numbers in Eqs. (1) and (2):
bits/picture = 1700 cell bits + 15420 contour bits
= 17120 bits
Taking 60 seconds to transmit the p,i.ctllre,which is faster than necessary,
this corresponds to
m
The date rate is dominated by the contour data. The radar accuracy is
greater than is necessary to report the fixed threshold contours. Should it
be necessary to further reduce the data rate or if the number of contours
should exceed the above estimate then a number of techniques can be used to
compress the data by sending approximate contours. One method is to
95

transmit eve~ Kth contour point plus additional points in regions of high
curvature. A method of sensing high curvature is to compare the distance be
tween transmitted points tO a threshOld. The equation for the contour bits
then becomes
2J [log2(2K + 1)]M([log2 R/r] + [log2 360/6] +
K ) bits
where it takes 2[log2(2K + I)]bits to specify each successive transmitted point
following the first point and there are J/K points.
Using the same example as before with K = 7,
bits/picture = 1700 cell bits + 9300 contour bits
= 10,000 bits
This corresponds to 167 bits/see in 60 seconds.
The cell and contour data should suffer virtually no queing delay even
though it takes 60 seconds to transmit a picture since the cells and contours
will be produced by tbe radar sequentially. Actually the radar refresh rate
will be somewhere between 3 and 5 minutes which allows even more time to trans-
mit the picture than was assumed in the above examples. However, it is felt
that sufficient capacity should be provided to transmit the picture in 1 minute
A1.2 TWEP - AWEP
The data rates in each direction are considered separately. The TWEP to
AWEP data includes the ASR radar data plus some surface observations for local
airports. The AWEP to TWEP data includes the netted radar data, very short
range cell forecast, surface observations from a few nearby airports and the
short range forecast. There are also special messages and PIREPs transmitted
in each direction; however, these add little to the data rates.
96
.

A1.2.1 TWEP to AWEP
The data rate equations in the last section are also applicable here
for transmitting the ASR cell and contour data to the AWEP. Due to the shorter
range there are proportionally fewer contours and cells. Consider the following
parameters where the number of cells and contours was selected to be higher than
should be found in practice,
R=75Km
r=l Km
e = 1.1°
N=20
M=25
J = 120
~ = 11 (intensity= 6, diameter = 5, height =0 )
Using Eqs. A.l.l and A.1.2 this results in
bits/ASR picture = 540 cell bits + 6,400 contour bits
= 6,940 bits
The average Service A surface observation is 400 bits. With 10 peripheral
(a high estimate) airport. this represent. only 4,000 bits. Even if both the
radar and the surface observations needed to be transmitted in 60 seconds this
results in
I 180 bits/see
! ACtuallY the radar picture updates are generated every 3 to 5 minutes and theIj. surface observations should rarely be more frequent than every 20 minutes. Thus,
a 300 bit/see channel would be idle for much of the time. However, this extra
I capacity permits the rapid transmission of the radar data and allows for growth!~
Ipotential
I 97
I

I
A1.2.2 AWEP to TWEP
The data rate equations in Section All are also applicable here
with small modification for transmitting the netted radar data and very short
term forecast. The very short”term (0-30 rein) cell forecast in S minute inter-
vals requires 6 times the data rate given by Eq.(1). The contours require the
same data rate given in Eq. (2). Using the same numbers as in the example in
Section A1.2.l this results in
bits/picture = 6 x 540 cell bit + 6400 contour bits
Sending
even if
seconds
= 9,640 bits
surface observations on 10 nearby ai~orts results in 4,000 bits. Again
both the radar and surface observation needed to be transmitted in 60
this results in
225 bits/see
Actually the netted radar data and the very short term forecast
every 3 to 5 minutes and the surface observations should rarely
than every 20 minutes. Thus a 300 bit/see channel half or full
are generated
be more frequent
duplex would be
idle much of the time. This extra capacity will be partially used for special
messages, PIREPs, the short range forecast and allows for growth potential as
new meteorological uses are developed.
A1.3 SWEP-AWEP
The AWEP to SWEP data rate should be dominated by the radar cell and con-
tour data,and surface observations. Twenty minute updates should be sufficient
for both. Using the bits/picture number derived in Section All and assuming
30 airports to report surface observations for results in:
17120 bits/picture x 7 radars = loo bit~,~ec20 min. x 60 sec/min
98

J
400 bits/surface ohs. x 30 ohs.= 10 bits/see
20 min x 60 sec/min
for a total of 110 bits/see.
The data rate from the SWEP to AWEP is difficult to estimate until the
products carried from the SCC are specified further. Peak data rates of 600-
1200 bits/see are assumed.
.
99

A2 NWS Weather Communications
In developing the WSA data flow network careful consideration has been
given to NWS communications and automation plans. Joint usage of data links
among FAA and NWS facilities exists today and will continue in the future.
Currently the bulk of textual weather traffic is carried on TTY circuits ter-
minated at the Weather Message Switching Center (WMSC) in Kansas City,
The future weather data users are expected to rely on the NWS National
bution Circulit(NDC) for a large portion of the communication needs.
The NDC is part of the program for Automation of Field Operations
vices (AFOS)24-27 being implemented by NWS. The planned geographical
is shown in Fig. A2.1. Each Weather Service Forecast Office (WSFO) is
)!0
Distri-
and Ser-
structure
a stOre-
and-forward node on the NDC. The WSFO’S link the NDC to the State Distribution
Circuits (SDC). The Weather Service Offices (WSO) act as store-and-forward
modes on the SDC and also serve as
in their areas of responsibility.
to WMSC via Service A TTY could be
nearest WSO and from there via SDC
On the dissemination side the
collection points for weather observations
Eventually the method of data acquisition
replaced by a network of local links to the
and NDC.
AFOS terminal has the capability of driving
TTY transmitters to distribute weather products to various users. The AFOS
equipment at the NDC and SDC nodes will consist of one or two mini-computers,
communications interfaces, peripherals and displays. Figure A2.2 shows a WSFO
type configuration. Each AFOS terminal performs the store-and-fomard functions
to support the network and also extracts data to maintain its own data base.
The terminals are linked by 2,400 baud lines with Line Monitor/Auto-dialer Units
(LM/AU) as backup in case of line failure.
The main purpose of AFOS is to assist NWS personnel in the performance of
their duties. Multiple displays provide ready access to a large data base of
graphic and alphanumeric weather data. The present weather facsimile equipment
at the WSFO’S and WSO’S would be superseded by the NDC and AFOS display. The
composition of forecasts is facilitated by guidance material presented in the
format of the forecasts and by the editing capability of the terminal.
100

FAIJNUANC
\
s
PHN
— NAT! ONALDISTRIBUT!ON Circuit
STATE DISTRIBUTION CIRCUll
A2.1 NDC and SDC.
I
I
I101

-4-11634 I
PRIVATE
I IllDATA cOMMUNICATIONS DATA PROCESSl N3 8 CONTROL cOMPUTER
IDISK NO. !
——— —— _—— 4—
dGRAPHIC HARCOPY OEVICE
A2.2 WSFO tfle configuration.
COMh>
——— —-
=pER,pH_-“AL’
9SYSTEMCLOCK
— ——
dSLAVEcLOCKS
DISPLAYMODULES

b The
base are
centrol.
link to
similar
features of graphic and textual data retrieval from a national data
desirable at the SCC for the benefit of the meteorologist and the
;Iow controllers. The SWEP would, therefore, be implemented with a
1 WSFO giving it access to the NDC and a data retrieval capability
:0 an AFOS terminal but without the store-and-forward task.

A3
A3.1
Route Oriented PIREPs
Overview
Visits to FAA facilities and discussions with pilots indicate that PIREP
information would be significantly more valuable if improved procedures were
established for obtaining, interpreting and distributing the data. In the
long term these could be obtained automatically from airborne sensors via an
air to ground data link like DABS. However, in the short term one improved
method would be to solicit PIREPs from a small number of en route aircraft of
OPPOrtunitY to establish a route oriented weather description. These PIREPs
should be collected for roughly 600 predetermined segments of the CONUS prefer-
red air routes. Each segment should be 50 to 100 nmi long and should include
cloud tops, bases, layers, turbulence, icing, winds, temperature, etc. in all
weather conditions. A PIREP specialist should prepare route PIREP sumaries
once an hour which should be distributed nationwide in a timely manner to tbe
FSS, NWS and ARTCC. Selected routes could also be broadcast over the TWEB.
These route oriented PIREPs are meant to supplement the present adverse weather
PIREPs The interpreted PIREPs should be quickly disseminated to the controllers
responsible for these routes and the controllers feeding aircraft into these
routes. This route oriented PIREP development would require coordinated FSS
and ATC planning.
A3.2 Background
Reports of actual en route weather conditions are presently very hard to
obtain before takeoff. PIREPs are usually only entered into Service A for
adverse or severe weather conditions. Better-than-forecastconditions are
often reported by pilots to controllers, but are very rarely entered into Ser-
vice A. Significant conditions which usually go unreported include cloud tops
and layers, and the nonexistence of forecast hazards such as thunderstorms, ice,
or turbulence.
Perversely, this information is frequently available to the pilot in the air,
by soliciting information from other pilots through the controller.-Many con-
trollers (work load permitting) run an informal briefing service, keeping track
of recent pilot cements and passing them along to other pilots upon request.
104
.
.
.
.
As a result, a comon technique for IFR
look (and ask) around, continuing on to
General A\,iationpilots is to go up to
their destination or retreating to
their departure airport, depending on what actual weather is found.
Pilots in general are not trained weather observers. However, the pilot
who has just climbed or descended through clouds is able to provide reasonably
accurate cloud height information using his altimeter. Between or above cloud
layers the accuracy of these estimates depend upon the pilots ability. Some
information on clear space, especially when correlated with PIREPS from a few
other aircraft, would enable the specialist to piece together a good
A3.3 Data Collection Method
Assme that a PIREP Specialist
PIREPS (roughly 30 per hour in each
collocation of the FSS in the ARTCC,
in each ARTCC collects tbe route
ARTCC) and severe weather PIREPS
picture.
oriented
With
this task may be given to the En Route
Flight Advisory Service (EFAS) persons.
In each control sector there would be an average of one or two routes for
which route oriented PIREPs are collected. These could be collected from each
sector, on a controller work load permitted basis, using one of the fOllOwing
scenarios. In all cases the controller would select one or more aircraft which
have completed the desired route.
Scenario I - The PIREP specialist could key in the requestedroute which would appear on the appropriate PVD, CRD scope, OrFlight Strip Printer. The controller could either collect thedata himself from one or more aircraft (he may already know it)and phone it to the PIREP specialist, or ask the pilOt tO switchto a special PIBEP specialist frequency. The last reported PIREPfor each route should also appear and the controller should havethe option of easily keying in “NO Charlge,”, “NO SignificantInformation,” ,!NoAi~craft,,,or ‘!Too Busy to Report.”
Scenario 2 - The controller, when and if time permits, could col-lect the route PIREPs and routinely phone them in to the PIREPspecialist once an hour or when conditions change. If no PIREPfor a given route bas been received for the last hour, then thecomputer could automatically remind the controller and indicatethe last reported PIREP. Special requests from the PIREP special-ists could be handled as in Scenario 1.
105
.——

Scenario 3 - EFAS has a designated fl-equencyfor pilots to ex-change weather information with the FSS. The PIREP specialistcould broadcast requests for the route oriented PIREPs over thisfrequency. PIREPs from VFR (unavailable in scenarios 1 & 2) andIFR pilots could be obtained in this way. If this frequencycarried enough information, then pilots might routinely monitorit. This method could supplement or possibly replace scenarios1 and 2.
A3.4 Manpower
The PIREP specialist would have to follow 30 route segments in each ARTCC
with updates every hour. Considering that weather conditions change very slowly,
most of these hourly updates could be made automatically when the controller
keys in “NO Change” or ,,Nosignificant Weather.” Thus this may not be a full
time job and the EFAS person may be able to handle these tasks. He would be
a Prime user Of the data and is receiving pIREps frOm VFR aircraft. There may
be more than one EFAS geographic region in each ARTCC, which would further re-
duce the work load.
106
,
1,

*
. ACKNOWLEDGEMENT
Many individuals at Lincoln Laboratory have contributed to
the development concept and plan in this docment. ” The authors
are particularly indebted to the following for valuable technical
inputs: R.K. Crane, D.L. Hogan, and I.G. Stiglitz. The authors
are also indebted for valuable consulting provided by W.B. Beckwith
of United Airlines.
I
107

MFERENCES
1.
2.
3.
4.
5a.
5b,
6.
7,
8.
‘9.
10.
11.
12.
13.
14.
G,G, B~~k~~, !!T~S#75.11: Terminal Information Processing System (TIPS)Results and Analysis of Terminal Flight Data,” MITRE WP10913, ContractNo: DOT-FA69NS-162, (Feb. 1975).
A.I. Brunstein, ,,st”dyof Lesson to be Learned from Accidents Attributed
to Turbulence,” National Transportation Safety Board (Dec. 1971) NTSB-AAS-71-1.
L.R. Hurst, ,T~e New york Severe Weather Avoidance Plan,” J. Of ATC,(July 1972).
Official Airline Guide, North American Edition, (Jan. 15, 1975).
R.K. Crane, ,,Radar Detection of Thunderstorm Hazards for Air Traffic COn-
trol, vol. I: Radar systems,,,Lincoln Laboratory, M.I.T. prOject RepOrtATC-67 (in preparation).
S.M. Sussman, “Radar Detection of Thunderstorm Hazards for Air TrafficControl, Vol. II: Storm Cell Detection,!,Lincoln Laboratory, M.I.T.
Project Report ATC-67 (in preparation).
FM Report on Airport Capacity, Vol. I - National Sumary, OSEM, FAA(.Jan.1974) FM-EM-74-5, I.
R.M. Hill and B.H. Metzger, ,,Re~u~t~of operations Rates Measurement Under
Various Weather Conditions at LaGuardia,,,sixth Conf. on Aerospace and
Aeronautical Meteorology (Nov. 1974).
Airport/ATC System Improvement prOsPeCtS &ment Priorities,(June 1974) Operations andport Association.
,,A”iatiOn Forecasts - Fiscal Years lg75-86,
Recommendations on FAA Develop-Airports Department, Air Trans-
,!11.,s.DOT–FAA Office Aviation-..Policy, Aviation Forecast Branch (Oct. 1974).
“Jet Operating Data, B-727-200, DC-9-30,” Air Transport WOrld (June 1975).
Aircraft Accident Report Ozark Air Lines, Inc. Fairchild Hiller FH227BN4215 near the Lambert-St. Louis International Airport, St. Louis,Missouri (July 23, 1973) NTSB-AAR-74-3.
N.A. Lueurance, ,,Weather SuPPorts to the Air Traffic System,” J. Of ATC
(March 1970).
National Airspace System Program Office - Program Development plan -En Route Automation 1973-82, Dept. of Trans., FAA.
Aircraft Accident Report, Delta Air Lines, Inc. McDonnell Douglas DC-9-32,
6
,

9 15.
* 16.
17.
18.
19.
20.
21.
22.
23.
24.
25.
26.
27.
.
28.,
Aircraft Accident Report, Trans World Airlines, Inc., Boeing 707-131B,N757W. Los Angeles, CA (Jan. 18, 1974) NTSB-AAR-74-10.
Aircraft Accident Report, Chicago Southern Airlines, Inc., Beech E18 S(ATECO Wentwind 11) N51CS, Peoria, Illinois (Oct. 21, 1971) NTSB.AAR.72.15.
Aircraft Accident Report, Pan American World Airways, Inc., Boeing 707-321B,N454PA, Pago Pago, American Samoa (Jan. 30, 1974) NTSB-AAR-7415.
Aircraft Accident Report - Piedmont Airlines, Boeing 727, N731N Greensboro,N.C. (Oct. 1973), NTSB-AAR-74-7.
Aircraft Accident Report, Eastern Air Lines, Inc., McDonnell-DouglasDC-9-31, N8967E Akron-Canton Regional Airport, North Canton, Ohio (Nov.27, 1973) NTSB-AAR-74-12.
Aircraft Accident Report, Delta Air Lines, Inc. McDonnell Douglas DC-9-14,N3305L, Greater Southwest InternationalAirport, Fort Worth, Texas(May 30, 1972) NTSB-MR-73-3.
L.J. Garodz, D. Lawrence, N. Miller, !!The Measurement of the McDonnell-
Douglas OC-9 Trailing Vortex System Using the Tower Fly-By Technique,”NAFEC (Nov. , 1974) Report No. FAA-RD-74-173.
Meteorological and Aeronautical Presentation Subsystem (MAPS) - ProgramReport with Recommendation, FAA/SRDS, ATC Systems Division, En RouteBranch (July 1975).
Integrated National Airspace Communication System (INACS) for the Supportof Air Traffic Control Operations in the 1980!s and 19901s - System Con-cept” (Sept. 8, 197S) FAA-INACS-061-221-SC.
“Program Development Plan, Automation of Field Operations and Service,”NOAA/NWS (Nov. 1974).
Specification for Automation for Field Operations and Services (AFOS)SY~tem~,,,Specification No. M020-SPOO1, NOAA/NWS (March lg74).
IEEE Transactions on Geoscience Electronics, Vol. GE-13, No. 3 (July :
Field
973).
National Weather Service Specification for Automation of Field Operationsand Services (AFOS) Stage IIAII MOdel system, NOM [Juan.12, lg73) Specifi-cation No. MO1O-SPOO1.
C.G, Te~chner, ,,Aviation-Automatic Weather Observing System (AV-AWOS)
Preliminary System Description,,,MITRE COTp. (Jan. 1975) FAA-~D-75-5.
I
I
I
[
109
.. ———.. .. . -.--? .. .. ,.- 1,.?.*.WW,.. .

29.
30.
31.
32.
33.
34.
35.
36.
37.
38.
39.
40.
41.
42,
43.
W.H. DTUTy, ,,ImPro”ed MT I Radar Signal PrOcessOrj!!Lin~Oln LaboratOTy,
M.I.T. Project Report ATC-39 (3 April 1975) AD-AO10478/6.
FAA Communications System Description (1973), Computer Sciences Corp.Falls Church, VA, FAA-RD-73-36.
J.C. Hansen, ‘fUpgraded Third Generation Information Flow RequirementsAnalysis,” Vols. I&II - Summary, Computer Science Corp. Falls Church, VA(Sept. 1973) FM-RD-73-65.
Preliminary System Design Comon Aviation Weather System RequirementsCompilation, Borg-Warner Controls (June 1961), FM Contract BRD-139, Task9.
Comon Aviation Weather System Preliminary Design, Borg-Warner Controls(April 1962), FAA Contract BRD-139, Task 9, VO1s. I&II.
National Airspace System Aviation Weather Subsystem Design,” E. BollayAssociates, Inc. (Oct. 1964), FAA-SRDS-RD-64-129.
ATC Weather Presentation Studies for the National Airspace System,E. Bollay Associates, Inc. (Aug. lg65), SRDS RePOrt NO ‘D-65-15
Final Report of the Aviation Weather Review Group (AWRG), Dept. Of Trans-portation, Federal Aviation Administration (June 25, 1967).
Engineering and Development Plan-Weather (Feb. 1g73), FAA-ED-15-1
Engineering and Development prOgram, GOals,Achievements and Trends, DePt.of Transportation, Federal Aviation Administration.
J.F. Ballantoni, J.R. Coonan, M.F. Medeiros, “Evaluation Of tbe FAAAdvanced Flow Control Procedures,,,Transportation Systems Center
DOT-TSC-FAA-72-8.
R.M. Hill, R.F. Robinson, !!TOS~~~_43; Eval”atiOn Of Weather RadarRemoting to the Central Flow Control Function,” MITRE Technical Report~R-6323 (January 24, 1973).
G.G. Beeker, “Tower Cab Flight Data Handling Concept, TOS #142-59,”The Mitre COW. WP-10581 (May 20, 1974).
M.F. Medeiros, J. Sussman, !,AirpOrt Information Retrieval SYstem (AIRS)system Design,,Final Report (JuIY lg73), ‘W- RD-73-77.
M.F. Medeiros, J. Sussman, !!AirpO~t Information Retrieval System (AIRs)
System Support Manual,” (Oct. 1973) FW-RD-73-122.
110

44.
45.
46.
47.
48.
49.
50.
51.
52.
53.
54.
55.
56.
57.
58.
59.
60.
J.B. McColloughtion System and
and L,K. CaTD~~t~~. ‘!Airborne Meteorological Instrumenta-DATA l<educti~n,’!FAA-RD-75-69.
National Airspace System - Configuration Management Document.Computer Program Description (Model 3) Rev. 1 (Feb. 17, 1973)
Draft Operational Test Plan for Kansas City Air Route TrafficTest.
ATC OperationalNAS-MD-309.
Control Center
Kansas City Air Route Traffic Control Center (ARTCC) Weather Unit OperationalTest and Evaluation (OT&E) Interim Report #l.
Federal Plan for Weather Radars & Remote Displays, Fiscal Years 1969-1973,” U.S. Department of Commerce (Dec. 1969).
Federal Plan for Weather Radars (Nov. 1973) FCM 73-5.
Aviation Weather and NOTAM System (AWANS) (Aug. 27, 1973) FW-ER-260-019b
The Development Plan for the Aviation Automated Weather Observationsystem,,!SYstem Development Office, National Weather SerViCe (Dec. lg73)
Meteorological & Aeronautical Presentation Subsystem (MAPS) InstallationPlan - Task II,” Price, Williams & Associates, Inc. (Feb. 1975).
Preliminary Analysis of Civil Aviation Accidents .Ianuary1964-December 1972,”(April 1975), FAA-AVP-7S-2.
Special Study of Fatal Weather-Involved General Aviation Accidents, NTSB-AAS-74-2.
Aircraft Accident Report, National Airlines, Inc., Boeing 747-135, N 77772Near Lake Charles, Lousiana (Jan. 4, 1972).
Aircraft Accident Report, Iberia Linear Aereas De Espana (Iberia Airlines)McDonnell Douglas DC-10-3O, EC CBN. Logan InternationalAirport, Boston,Mass. (Dec. 17, 1973).
Aircraft Accident Report - Texas InternationalAirlines, Inc. Convair 600,N94230, Mena, Arkansas (Sept. 27, 1973).
Aircraft Accident Report, ALII Air Hawaii, Inc. Beech D183, N5642V,Kalohi Channel, Hawaiian Island (Feb. 22, 1972).
En Route and Terminal ATC Radar for Weather Observation, National AirTraffic Training Program, MT-FAA, Aeronautical Center, ETM 7-Q-2.
En Route and Terminal Weather for Controllers,’NationalAir TrafficTraining Program, DOT-FAA, Aeronautical Center, ETM-7-O-1.
111
—

61
62,
63
64.
65.
66.
67.
68.
69.
70.
71.
72.
73.
National Air Traffic Training Program Flight Service, The Weather ObserverPosition, DOT-FAA, Aeronautical Center, FAA Acade~, F2-7 (July lg74).
National Air Traffic Training Program, Terminal Wake Turbulence, DOT-FAAAeronautical Center, FAA Academy TM 12-0-1 (Oct. 1971).
Teminal Air Traffic Control, DOT-FM Air Traffic Service, 7I1O.8C(Jan. 1, 1973).
En RouteAir Traffic Control, .DOT-FAAAir Traffic Service; 7I1O.9D(Jan. 1, 1975).
W.8. Beckwith.,‘!The Effectof WeaEher on the.Operations and Economics.of Air Transportation Today,’!American Meteorological Sot. BulletinVol. 52(Sept. 1971).
W.B..Beckwith; ‘!Operational .F.orecasting:andAnalysis of.Turbulence,”International Conf. on Atmospheric..Turbulence,London .(May,l8-2l.;1971);
R.N. Buck; WeatherFlying.,!T.The Macmillan Co., N.Y., N.Y. Collier-Mactillan Ltd., London (1970).”””
Aviation Weather for Pilots and Flight..OperationsPersonnel,FA4-Flight ~~~Standards Serviceand Dept..of C~merce - WeatherBureau [1965).
Aviation Forecasts - FiscaI.Years 1975-86, U.S. DOT/.FAA(Sept< 1974).
C.E. Mehe, L. Cartledge, W.H. Drul-y,E. Hofstetter, M. Labitt, P. McCorison,and V. Sferrino, ,,New Techniques Applied to Air Traffic cOntTOl Radars,”Proc. IEEE Vol. 62, ~ (June 1974).
R.M. O’Donnell, C.E. Muehe, M. Labitt, L. Carledge, W. Drury, “AdvancedSignal Processing for Airport Surveillance Radars,’!EASCON174 (Oct. 1974).
Aviation Week and Space Technology, Shorelines - (March 27,,1976) p. 37.
“Facility Management;’t (Oct. 1973) DOT-FM- 721 O-3B.
112