a conceptual framework for the …acumen.lib.ua.edu/content/u0015/0000001/0000528/u0015... ·...
TRANSCRIPT

A CONCEPTUAL FRAMEWORK FOR THE ASSESSMENT OF THE CRITICALITY OF
KEY FAILURE MODES IN MICRO-ELECTRO MECHANICAL SYSTEMS (MEMS)
ACCELEROMETERS
by
MIGUEL SEQUERA
A THESIS
Submitted in partial fulfillment of the requirements
for the degree of Master of Science in the
Department of Mechanical Engineering
in the Graduate School of
The University of Alabama
TUSCALOOSA, ALABAMA
2011

Copyright® Miguel Sequera 2011
ALL RIGHTS RESERVED

ii
ABSTRACT
Micro-Electro Mechanical Systems (MEMS) are a fast growing field in microelectronics.
MEMS are commonly used as actuators, and sensors with a wide variety of applications in health
care, automotives, and the military. The MEMS production cycle can be classified as three basic
steps: 1. design process, 2. manufacturing process; and 3. operating cycle. Several studies have
been developed for steps 1 and 2, however, information regarding criticality analysis of
operational failure modes in MEMS is lacking, and thus, the application of reliability
engineering methodologies is needed. MEMS are extremely diverse, and failure modes can be
unique for each device. In this study, a conceptual framework for the assessment of the
criticality of key failure modes in MEMS accelerometers is proposed.
The conceptual framework establishes seven steps to perform the criticality analysis. The
first step consists in the selection of the particular MEMS device and associated technical
specifications. The second considers the key environmental conditions for the device’s operation.
The third and fourth are the selection of the failure mechanism class, and the definition of the
failure mechanisms under the given environmental conditions. The fifth step deals with
determining the device’s common failure modes. Steps six and seven involve the development
and implementation of the Failure Mode, Effect and Criticality Analysis (FMECA).
Thirteen MEMS failure modes were analyzed under three different scenarios, and the
obtained results discussed. The conceptual framework was successfully completed, the results

iii
were validated, and the effectiveness of the applicability of FMECA to automotive MEMS
established.

iv
DEDICATION
This thesis is dedicated to God for giving me the spiritual strength and guiding through
the challenges of creating this document. To my wife Mariorly, for her patience and love during
the many difficult moments. Also, to my mom, dad, and brothers for their support and
understanding.

v
LIST OF ABBREVIATIONS
AFM Atomic force microscope
AHP Analytical Hierarquical Procedure
β Failure mode effect probability
Cm Failure Mode Criticality Number
Cr Item Criticality Number
D Detection
DLC Diamond like Carbon
ESD Electro Static Discharge
FIT Failure Rate over hours
FMEA Failure Mode and Effect Analysis
FMECA Failure Mode Effect and Criticality Analysis
H2O Water
HTOL High Temperature Operating Life
IC Integrated Circuit
MEMS Micro Electro Mechanical Systems
MTTF Mean Time to Failure
MOS Metal Oxide Semi Conductor
NASA National Aeronautics and Space Administration
O Occurrence

vi
RPN Risk Priority Number
S Severity
STM Scanning Tunneling-Tip Microscope
SAM Self Assembled Monolayer
TPMS Tire Pressure Monitoring System
α Failure mode ratio
λp The Failure Rate

vii
ACKNOWLEDGMENTS
I am pleased to have this opportunity to thank the many colleagues, friends, and faculty
members who have helped me with this research project. I am most indebted to my advisor and
friend Dr. Daniel Fonseca, the chairman of this thesis, for sharing his research expertise and
motivation through this process. I would also like to thank all of my committee members, Kevin
Chou and Gary Moynihan for their invaluable support of both the thesis and my academic
progress. I would also like to thank to Betsy Singleton for her assistance and help during this two
years at UA.
This research would not have been possible without the valuable information provided by
Sandia National Laboratories.

viii
TABLE OF CONTENTS
ABSTRACT……………………………………………………………………… ii
DEDICATION…………………………………………………………………… iv
LIST OF ABBREVIATIONS AND SYMBOLS………………………………… V
ACKNOWLEDGMENTS…………….………………………………………….. vii
LIST OF TABLES………………………………………………………………... xii
LIST OF FIGURES………………………………………………………………. xiv
1. INTRODUCTION…………………………………………………………….. 1
1.1 Micro Electro Mechanical Systems………..…………………………………. 1
1.1.1 Micro Electro Mechanical Systems Automotive Applications………. 2
1.1.2 MEMS and Nanotechnology ………………………………………… 4
1.1.3 MEMS in the Automotive Environment……………………………… 6
1.1.4 MEMS and Nanotechnology………………………………………..... 7
1.2 MEMS Reliability…………………………………………………………….. 9
1.3 Research Scope and Objectives…..…………………………………………... 10
2. LITERATURE SEARCH……………………………………………………… 12
2.1 MEMS Accelerometer Device and Applications……………………………... 12
2.2 Historical Background of MEMS Reliability………………………………… 15
2.3 Failure Mechanisms and Failure Modes in MEMS………………………….. 17

ix
2.4 Criticality Schemes…………………………………………………………… 20
2.5 Literature Search Summary…………………………………………………... 22
3. RESEARCH SCOPE AND METHODOLOGY………………………………. 24
3.1 MEMS Failure Mechanisms and Failure Modes…………………………….. 25
3.1.1 Mechanical Fracture……………………………………………………. 25
3.1.2 Stiction …………………………………………………………………. 26
3.1.3 Wear…………………………………………………………………….. 27
3.1.4 Delamination……………………………………………………………. 29
3.1.5 Vibration and Shocks…………………………………………………… 29
3.1.6 Electrostatic Discharge and Dielectric Charging……………………….. 30
3.1.7 Radiation Effects……………………………………………………….. 31
3.1.8 Temperature ……………………………………………………………. 32
3.1.9 Humidity ……………………………………………………………….. 32
3.1.10 Particulates…………………………………………………………….. 33
3.2 Failure Mode Effect and Analysis (FMEA)………………………………….. 37
3.3 Failure Mode Effect and Criticality Analysis (FMECA)……………………... 47
3.3.1 Criticality Analysis……………………………………………………... 48
3.3.2 Quantitative Failure Mode, Effects and Criticality Analysis…………… 49
3.3.3 The Criticality Matrix………………………………………………….. 53
3.4 Summary …………………………………………………………………….. 55

x
4. CONCEPTUAL FRAMEWORK IMPLEMENTATION…………………… 57
4.1 Selection of MEMS and Technical Specifications…………………………… 58
4.1.1 ADXL 180 MEMS Accelerometer Description………………………... 58
4.2 Environmental Conditions for MEMS in the Automotive Industry………….. 59
4.3 Class 1 Accelerometers……………………………………………………….. 61
4.4 Failure Mechanisms and Failure Modes in Class 1 Accelerometers…………. 62
4.4.1 Failure Mechanisms in Class 1 Accelerometers………………………... 62
4.4.2 Failure Modes Database in Class 1 Accelerometers……………………. 65
4.5 Failure Mode, Effect and Criticality Analysis (FMECA)……………………. 66
4.5.1 System Requirements…………………………………………………... 66
4.5.2 FMECA Preliminary Data……………………………………………… 67
4.5.3 FMECA Variables……………………………………………………… 68
4.6 Summary……………………………………………………………………… 74
5. FMECA RESULTS AND VALIDATION……………………………………. 75
5.1 MEMS FMECA Results……………………………………………………… 75
5.2 Analysis of the FMECA Results……………………………………………… 79
5.2.1 Analysis of the Item Criticality Number (Cr) ………………………….. 79
5.2.2 Individual Failure Modes Analysis……………………………………... 82
5.3 Face Validation of the Conceptual Framework………………………………. 86
5.4 Summary……………………………………………………………………… 87

xi
6. CONCLUSIONS AND FUTURE RESEARCH………………………………. 89
6.1 Key Benefits of the Study……………………………………………………. 89
6.2 Recommendation for Future Works………………………………………….. 90
REFERENCES…………………………………………………………………… 92
APPENDIX A…………………………………………………………………….. 99
APPENDIX B…………………………………………………………………….. 101
APPENDIX C…………………………………………………………………….. 103

xii
LIST OF TABLES
1.1 MEMS products…………………………………………..……………………. 5
1.2 Accelerometers Technical Specifications……………………………………… 6
1.3 Automotive MEMS Environment……………………………………………...
7
3.1 MEMS Failure Mechanisms……………………………………………………
35
3.2 Severity Rankings (MIL-STD-1629)…………………………………………..
40
3.3 Severity Rankings (Department of the Army)………………………….……… 41
3.4 Occurrence Rankings (Department of Defense)………………………………..
42
3.5 Occurrence Rankings (Department of the Army)……………………………...
43
3.6 Detection Rankings (Department of Defense)…………………………………
44
3.7 Detection Rankings (Department of the Army)………………………………..
45
3.8 Failure Effect Probability………………………………………………………
50
3.9 Failure Mode Ratio …………………………………………………………….
50
3.10 Criticality Matrix Data ………………………………………………………...
54
4.1 ADXL180 Technical Specifications…………………………………………… 59
4.2 Analysis Scenario 1…………………………………………………………....
60
4.3 Analysis Scenario 2…………………………………………………………….
60
4.4 Analysis Scenario 3……………………………………………………………. 61
4.5 Failure Mechanisms……………………………………………………………. 65
4.6 Failure Modes and Failure Mechanisms………………………………………..
66

xiii
4.7 FMECA Preliminary Data……………………………………………………..
68
4.8 Item Functional ID……………………………………………………………..
69
4.9 Failure Modes Severity…………………………………………………………
70
4.10 Failure Rate from ADXL180 at 90% C.L……………………………………..
71
4.11 Failure Rate for Scenarios……………………………………………………...
71
4.12 Failure Effect Probability (β) and Failure Mode Ratio (α)……………………. 72
5.1 Failure Mode Criticality Number (Cm) for the First Scenario (T=50°C)……...
76
5.2 Failure Mode Criticality Number (Cm) for the Second Scenario (T=100°C)….
77
5.3 Failure Mode Criticality Number (Cm) for the Third Scenario (T=150°C)……
78
5.4 Item Criticality Numbers (Cr)………………………………………………….. 79
5.5 Percentage of the Theoretical Maximum Criticality Number (%CMmax)……….
81
5.6 Failure Modes Increment Index (II) from 50°C to 100°C……………………...
83
5.7 Failure Modes Increment Index (II) Ranking from 50°C to 100°C…………….
84
5.8 Failure Modes Increment Index (II) from 100°C to 150°C…………………….
85
5.9 Failure Modes Increment Index (II) Ranking from 100°C to 150°C…………
86

xiv
LIST OF FIGURES
1.1 Application for MEMS in Automotive Industry………………………………. 3
2.1 Vertical Accelerometer...……………………….……………………………… 13
2.2 Lateral Accelerometer...……………………..………………………………… 14
3.1 Surface Fracture.…………….………………………………………………... 25
3.2 Stiction in MEMS Fingers…………..………………………………………… 26
3.3 Wear Debris in Microengine………………...………………………………… 27
3.4 Surface Wear in a Drive Gears…………………………………………………
29
3.5 ESD Failure in Electrostatic Actuator………………………………………… 31
3.6 Micro Engine Gears under Humidity Stress……………………………………
33
3.7 Particles on MEMS…………………………………………………………….
34
3.8 Failure Mode and Effect Analysis Example……………………………………
46
3.9 Quantitative Failure Modes, Effects and Criticality Analysis (FMECA)……...
53
3.10 Criticality Matrix……………………………………………………………….
55
4.1 Conceptual Framework………………………………………………………...
57
4.2 ADXL180 Accelerometer……………………………………………………...
62
4.3 Single Shock Survival Probability (Stiction)…………………………………..
63
4.4 FMECA Preliminary Data…………………………………………………….
68
4.5 FMECA Final Sheet…………………………………………………………… 73

1
CHAPTER 1
INTRODUCTION
Micro-Electro Mechanical Systems (MEMS) are a relatively new and fast growing field
in microelectronics. MEMS are commonly used as actuators, sensors, radio frequency and
microfluidic components, as well as biocomposites, with a wide variety of applications in health
care, automotive and military industries. Many industry experts believe that the market for
MEMS will grow to over $30B in the next 50 years (Miller et al., 1998).
The MEMS lifecycle can be divided in three basic steps: 1.) the design process, 2. the
manufacturing process; and 3. the operating cycle. Several research studies have been conducted
for the design and manufacturing of MEMS, however, information regarding failure analysis for
MEMS can still be considered in its infancy stage (Van Spengen, 2003).
There is a need to develop new tools and methodologies to understand the behavior of
MEMS devices for distinct applications and operation conditions. MEMS are extremely diverse
and their failure modes can be unique under different conditions (Walraven, 2003).
1.1. Micro Electro Mechanical Systems
MEMS represent a technology that can be defined as miniaturized mechanical and
electro-mechanical elements (i.e., devices and structures) that are made using the techniques of
micro-fabrication. Dimensions of MEMS devices can vary from well below one micron on the
lower end of the dimensional spectrum, all the way to several millimeters (Bhushan, 2007).
Likewise, the types of MEMS devices can vary from relatively simple structures having no

2
moving elements, to extremely complex electromechanical systems with multiple moving
elements under the control of integrated microelectronics. The one main criterion of MEMS is
that there are at least some elements having some sort of mechanical functionality, whether or
not these elements can move (Bhushan, 2007). MEMS are manufactured using batch fabrication
techniques similar to those used for integrated circuits. Unprecedented levels of functionality,
reliability, and sophistication can be placed on a small silicon chip at a relatively low cost (Miller
et al., 1998)
The real potential of MEMS starts to become fulfilled when these miniaturized sensors,
actuators, and structures can all be merged onto a common silicon substrate along with integrated
circuits (i.e., microelectronics). While the electronics are fabricated using integrated circuit (IC)
process sequences (e.g., CMOS, Bipolar, or BICMOS processes), the micromechanical
components are fabricated using compatible "micromachining" processes that selectively etch
away parts of the silicon wafer, or add new structural layers, to form the mechanical and
electromechanical devices. MEMS can be merged not only with microelectronics, but with other
technologies such as photonics. This is sometimes called “heterogeneous integration.” Clearly,
these technologies are filled with numerous commercial opportunities (Bhushan, 2007).
1.1.1 Micro Electro Mechanical Systems (MEMS) Automotive Applications
Figure 1 shows the main applications of MEMS in the automotive industry as pressure
sensors, gyroscopes, accelerometers and flow sensors. With new safety government regulations,
companies are forced to innovate and create new devices on a fast pace market.

3
Figure 1.1: Application for MEMS in Automotive Industry
After 25 years of research, the automotive industry in the 1990’s recognized the benefits
of MEMS as airbag accelerometers. Early airbags required several bulky accelerometers
mounted in the front of the car, with separate electronics near the airbag costing over $50.
Today, MEMS integrate all the components on a single chip at a cost of under $10. The
automotive industry was the first to introduce MEMS in high volume applications, in fact,

4
because of their relatively low cost and good reliability, car manufacturers started using them in
side impact airbags. (Eddy and Sparks, 1998)
The automotive sector currently accounts for $1.6 billion; by 2011 the market will top
$2.2 billion (Dixon, 2010). It is estimated that the total number of car MEMS will grow from
over 430 million units in 2006 to 780 million in 2011, an annual growth of 13 % (Dixon, 2010).
Leading markets are ESP gyroscopes ($272 million), airbags ($260 million), followed by
pressure with manifold air pressure (MAP) and break application pressure (BAP) (total $ 192
million), side airbags and tire pressure monitoring systems (TPMS). The market for TPMS will
grow at 50% this year (Dixon, 2010). MEMS accelerometers are now used as sensors for airbag
actuation in over 50 % of the new cars being built (Miller et al. 1998).
1.1.2 MEMS Device and Technical Specifications
An accelerometer is an electromechanical device that measures acceleration forces. These
forces may be static, like the force of gravity pulling at our feet, or dynamic, caused by moving
or vibrating the accelerometer (Andrejasic, 2008).
In 1990, MEMS revolutionized the automotive industry. Since then, MEMS have become
the prime technology used for airbag deployment in vehicles. The MEMS components currently
available on the market can be divided to six categories (Table 1.1):

5
Table 1.1
MEMS products
(Chollet et al.2008)
Product Category Examples
Pressure Sensor Manifold Pressure (MAP), tire pressure
Inertia Sensor Accelerometers, gyroscopes
Microfluidic/Bio MEMS Inkjet printer nozzle, DNA chips
Optical MEMS Micro-grating array for projection
RF MEMS High Q- Inductor, switches, antenna, filter
Others Relays, microphone, data storage, toys
MEMS accelerometers are a highly enabling technology, they provide lower power,
compact and robust sensing. Also, they can be used for several applications in the automotive
industry. MEMS design and technical specifications depend on the type of application, e.g.,
(vibration monitoring, vehicle collision sensing and shock detection). Table 1.2 shows the
technical specifications for a commonly used accelerometer in the automotive industry.

6
Table 1.2
Accelerometers Technical Specifications
ANALOG DEVICES AUTOMOTIVE ACCELEROMETER
Supply Voltage -0.3 V to +21V
Operating Temperature Range -40°C to 125°C
Storage Temperature Range -55°C to 150°C
Sensor Range +-50 g to +- 500 g
Mechanical Shock
Unpowered: +- 4000 g
Powered: +- 2000 g
Package 5 x 5 mm
Drop Test 1.2m
For this specific device, stresses above those listed in Table 1.2 may cause permanent
damage or affect device reliability. This accelerometer was also considered for this investigation,
and its capabilities are analyzed more in depth in Chapter 4.
1.1.3 MEMS in the Automotive Environment
A MEMS accelerometer requires interaction with the environment to perform their
mission. Automotive environment and surroundings are very aggressive for MEMS, and thus,
they require special attention. Standardized testing of automotive MEMS components is partially
covered in the Society of Automotive Engineers and the military via SAE J1221, SAE J575G

7
and Military Standard 750. These standards detail accelerating testing such as high and low
temperature storage, temperature cycling, and thermal shock (Eddy and Sparks, 1998).
The Automotive industry requires accelerometers lifetime from five to ten years, or
100,000 to 150,000 miles on desert, tropical, or arctic locations. Also, for commercial trucks
components, it is required ten years or 1 million miles of free problem use (Eddy and Sparks,
1998). In Table 1.3, the standard automotive environment conditions for MEMS are presented:
Table 1.3
Automotive MEMS Environment
(Eddy and Sparks, 1998)
Temperature:
-40 °C to 85 °C driver interior, 125 °C under
the hood, 150 °C on the engine,200-600°C in
the exhaust and combustion areas.
Mechanical Shock: 3000 g During assembly (Drop Test), 50-500G
on the vehicle.
Vibration: 15g, 100hz to 2khz.
Electromagnetic Impulses: 100 to 200 Volts/meter.
Exposure to:
Humidity, salt spray, in some applications fuel,
oil, brake fluid, transmission fluid, ethylene,
glycol, freon or exhaust gases.
In this investigation, the conditions depicted in Table 1.3 were considered for analysis of
the MEMS accelerometer failure mechanisms and failure modes.
1.1.4 MEMS and Nanotechnology
Nanotechnology is the ability to manipulate matter at the atomic or molecular level to
make something useful at the nano-dimensional scale (Bhushan, 2007). Basically, there are two
approaches in its implementation: the top-down and the bottom-up. In the top-down approach,

8
devices and structures are made using many of the same techniques as used in MEMS, except
that they are made smaller in size, usually, by employing more advanced photolithography and
etching methods. The bottom-up approach typically involves deposition, growing, or self-
assembly technologies. The advantages of nano-dimensional devices over MEMS involve
benefits mostly derived from the scaling laws, which can also present some challenges as well
(Bhushan, 2007).
Some experts believe that nanotechnology promises to: 1. place essentially every atom or
molecule in the place and position desired – that is, exact positional control for assembly, 2.
make almost any structure or material consistent with the laws of physics that can be specified at
the atomic or molecular level; and 3. keep manufacturing costs not greatly exceeding the cost of
the required raw materials and energy used in fabrication (i.e., massive parallelism) (Pan, 1999).
Although MEMS and nanotechnology are sometimes cited as separate and distinct
technologies, in reality the distinction between the two is not so clear. In fact, these two
technologies are highly dependent on one another. The well-known scanning tunneling-tip
microscope (STM) which is used to detect individual atoms and molecules on the nanometer
scale is a MEMS device. Similarly, the atomic force microscope (AFM) which is used to
manipulate the placement and position of individual atoms and molecules on the surface of a
substrate is also a MEMS device. In fact, a variety of MEMS technologies are needed as
interfaces in the nano-scale domain (Pan, 1999).
Likewise, many MEMS technologies are becoming dependent on nanotechnologies for
successful new products. For example, the crash airbag accelerometers that are manufactured

9
using MEMS can have their long-term reliability degraded due to dynamic in-use stiction effects
between the proof mass and the substrate. A nanotechnology called Self-Assembled Monolayers
(SAM) coatings are now routinely used to treat the surfaces of the moving MEMS elements, so
as to prevent stiction effects from occurring. (Bhushan, 2007).
Many experts have concluded that MEMS and nanotechnology are two different labels
for what is essentially a technology encompassing highly miniaturized things that cannot be seen
with the human eye. A similar broad definition exists in the integrated circuits domain which is
frequently referred to as microelectronics technology, even though state-of-the-art IC
technologies typically have devices with dimensions of tens of nanometers. Whether or not
MEMS and nanotechnology are one in the same, it is unquestioned that there are overwhelming
mutual dependencies between these two technologies that will only increase in time. Perhaps,
what is most important are the common benefits afforded by these technologies, including:
increased information capabilities; miniaturization of systems; new materials resulting from new
science at miniature dimensional scales; and increased functionality and autonomy for systems
(Bhushan, 2007).
1.2 MEMS Reliability
Reliability for MEMS devices is identified as the next manufacturers challenge for the
forthcoming years due to a growing market and stricter government safety regulations. It is
necessary to understand several variables to have an approach of their behavior and functionality.
Very high levels of reliability are required in most industrial applications, such as automotive.

10
For example, the automotive industry is now focused on failure rates lower than 10 FIT. 1FIT is
the usual unit corresponding to a proven failure over 109 hours (Van Spengen, 2003). In this
context, several steps must be developed to understand internal variables (i.e technologies
related) and external variables (i.e. environment and operation conditions).
In automotive applications, MEMS reliability analysis is extremely important to identify
and understand the different failure mechanisms that can be implicit such as mechanical, thermal
and chemical aspects related to the diversity of materials that can be used. Recent studies expect
airbag penetration to increase from 40 to 60 million vehicles over the next five years (i.e. 80% of
cars worldwide) (Eddy and Sparks, 1998).
1.3 Research Scope and Objectives
In this study, a conceptual framework for the assessment of the key failure modes in MEMS
is proposed, using a specific type of automotive accelerometers devices as application domain.
Thus, the objectives of this study are:
1. Develop a conceptual framework for MEMS based on the failure mode, effect and
criticality analysis (FMECA).
2. Identify and select a set of MEMS accelerometer devices used in the automotive industry.
3. Identify the critical variables and associated failure mechanisms for the selected devices.
4. Construct a data base with the most relevant failure modes for the chosen MEMS
accelerometers devices.

11
5. Apply the developed conceptual framework procedure to assess the criticality of the
MEMS devices.

12
CHAPTER 2
LITERATURE SEARCH
This section provides an overview of relevant available literature on failure mechanisms,
failure modes and reliability assessment for MEMS. Computer searches revealed a considerable
number of scholarly papers on different issues regarding MEMS accelerometers and their
applications. The search engines used during this literature review belong to world leading
publishers such as Elsevier, IEEE and SPIE digital libraries. Also Sandia National Laboratories
and JPL/NASA reports were assessed during this research.
2.1 MEMS Accelerometer Device and Applications
The Springer Handbook of Nanotechnology 2007 states that MEMS have played key
roles in many important areas such as transportation, communication, automated manufacturing,
environmental monitoring, health care, defense systems and a wide range of consumer products.
For this reason, MEMS offers attractive characteristics such as reduced size, weight and power
dissipation as well as improved speed and precision compared to their macroscopic counterparts.
Bhushan (2007) defined MEMS accelerometers as a proof of mass suspended by
compliant mechanical suspensions anchored to a fixed frame. In accelerometers, an external
acceleration displaces the support frame relative to the proof mass, the result is an internal stress
change in the suspension, which can be detected by piezoresistive sensors as a measure of the
external acceleration.

13
Figure 2 shows the sensor structures for vertical devices. Bhushan (2007) explained that
in vertical devices, the proof mass is suspended above the substrate electrode by a small gap
typically on the order of a micrometer, forming a parallel-plate sense capacitance. The proof
mass moves in the direction perpendicular to the substrate (z-axis) upon a vertical input
acceleration, changing the gap and hence the capacitance value.
Figure 2.1: Vertical Accelerometer
Figure 3 shows the lateral accelerometer structure with a number of movable fingers
attached to the proof mass that forms a sense capacitance with a group of fixed parallel fingers.
The proof mass moves in a plane parallel to the substrate when subjected to a lateral input
acceleration, thus changing the overlap area of these fingers and finally the capacitance value. In

14
other words, this device detects a negative acceleration to determine when a crash has occurred
and deploying airbags at the right moment. It is considered the automotive industry standard for
air-bags deployment systems.
Figure 2.2: Lateral Accelerometer
MEMS accelerometers are used in automotive industry for frontal and side impact
detection associated with the air-bag deployment. Also, accelerometers are being used in
emerging applications such as sensors for roll-over, vehicle dynamics control, navigation, and
tire pressure monitoring (Monk, 2002). MEMS accelerometers are also being incorporated in

15
personal electronic devices such as media players and gaming devices. Specifically in
smartphones for interface control and orientation in camera systems (Andrejasic, 2008).
2.2 Historical Background of MEMS Reliability
Several studies have been conducted regarding MEMS reliability due to their increasing
high volume of industrial applications and growing markets. Ohring (1998) defines reliability as
the sum of all characteristics of a device concerning its ability to achieve specified requirements
under well defined conditions over a given period of time. A similar approach was described by
Miller et al. (1998) who defined three prerequisites for a valid reliability assessment: 1. statistical
significance, 2. a technique for accelerating fundamental failure mechanisms; and 3. a valid
physical model to allow prediction of failure during actual use.
Considering the rapid evolution of MEMS technology, Delak et al. (1999) described a
detailed analysis of testing for accelerometers using different techniques such as high
temperature operating life (HTOL), high temperature storage, temperature cycle, thermal shock,
mechanical drop and random drop. This kind of testing encouraged MEMS manufacturers to
show extensive information on their websites regarding reliability product data and testing
techniques. In this context, Lee et al. (1996) studied the critical issues of MEMS in four
categories: functional interfaces, reliability, modeling, and integration. They conducted burn-ins,
and accelerated tests to ensure the production of a reliable MEMS device.
Arney (2001) described a design for reliability plan to accelerate the time to time to
market of emerging MEMS utilizing an interdependent relationship, and a tight feedback loop

16
between all contributors to device, subsystem, and system design, fabrication, manufacturing and
testing, reliability physics and packaging. A similar analysis was developed by Muller et al.
(2001) that defined reliability as a constituent of quality and describes the changing of quality
over the time. Muller (2001) also defined a methodical approach to increase reliability in early
stages of MEMS development and established that the major parameter to quantify the reliability
of a device and to give a numerical definition is the mean time to failure (MTTF).
Van Spengen (2003) examined the available literature regarding MEMS reliability. In his
work, generic MEMS elements are clearly identified as well as their failure mechanisms with
brief explanations. In a similar context, Walraven (2003) discussed the future challenges for
MEMS failure analysis; he classified the MEMS into six distinct categories: 1. sensors; 2.
actuators; 3. radio frequency MEMS; 4. optical MEMS; 5. microfluidic MEMS; and 6. bio
MEMS. The author discussed several analysis techniques to be developed to assess the failures
mechanisms.
In other empirical studies, Norman et al. (2004) evaluated the reliability of defect-tolerant
architectures for nanotechnology with probabilistic model checking. Keller et al. (2005) also
expressed concern in their investigation for the need of developing new measurement techniques
for reliability in MEMS and the need for new reliability concepts with fully nano- mechanical
approaches.
Bhaduri et al. (2006) proposed a probabilistic model checking-based methodology to
automate the reliability analysis of MUX architectures. This investigation also quantified
probabilistically fault models and provided a quick reliability evaluation for multiplexing

17
architectures. Zha (2006) developed a web enabled database system for the design and
manufacturing of micro-electro mechanical systems (MEMS) which can provide the networked
design and manufacturing services over the internet.
Otieno et al. (2009) proposed a reliability degradation model of transistor gates to
examine their feasibility at a nanoscale. A methodology of statistical reliability analysis is also
discussed for high k dielectric material. This investigation emphasizes the lack of techniques to
measure parameters to determine reliability under different failure mechanisms.
2.3 Failure Mechanisms and Failure Modes in MEMS
One of the most critical points in developing a reliability analysis is to understand the
way in which a system can fail, or commonly known as its “root cause”. For that reason, a failure
mode is defined as the apparent failure on a system, and the failure mechanism as the physical
cause (mechanical, chemical or thermal) of the failure modes in the system. Bhushan (2007)
emphasized that we have to start with a clear distinction between failure modes and failure
mechanisms in MEMS. In this approach, Beegle et al. (1999) developed a MEMS accelerometer
test lab. Descriptions and usage of the equipment were presented and data of their analysis were
described.
Similar investigations were developed by Tanner et al. (1999) by evaluating the effect of
humidity, vibrations and shock environments in micro-electro mechanical systems. Also, failure
mechanisms and failure modes for each condition were discussed as well as analytical data used
in the experiments. Moreover, Vallett (2002) introduced state-of-the-art microelectronic failure

18
analysis processes, instrumentation, and principles. The major limitations, and future prospects
determined from industry roadmaps were discussed by the author.
Walraven (2003) emphasized the significant success in MEMS products from a
reliability perspective and categorized the following taxonomy groups to address their reliability
concerns:
Class I- No moving parts (pressure sensors and microphones)
Class II- Moving parts, no rubbing or impacting surfaces (gyroscopes,
accelerometers and RF oscillators)
Class III- Moving parts with impacting surfaces.
Class IV- Moving parts with impacting and rubber surfaces
In addition, Walraven (2003) briefly stated that some failure mechanisms described
earlier would affect a MEMS device regardless of its class. Failures due to stiction and particle
contamination have been shown to cause failure in all 4 classes of devices. Other investigators
used Walraven (2003) taxonomy groups classification such as Tanner (2009) who also concluded
that these classes typically share failure mechanisms and increase complexity.
Materials can be considered critical for their behavior under extreme conditions such as
high temperatures, humidity, vibration etc. Sharpe (2006) identifies three general categories for
mechanical properties analysis of MEMS: 1. Elasticity from an applied force or vice versa; 2.
inelastic device behavior; and 3. materials strength to set operating limits. Results of
measurements of metals mechanical properties used in MEMS as well as references on materials
and tests of interest were discussed. Additionally, specific data on important material such as

19
DLC (Diamond-Like-Carbon), nickel and nickel-iron, and polysilicon properties were analyzed
in deep.
Several studies have been conducted to understand MEMS failures depending on the
material composition, especially in silicon, which is commonly used for MEMS. Shea (2006)
discussed MEMS failure mechanisms and failure modes for space applications. Also, he
explained reliability concerns under special environmental conditions such as radiation, vacuum,
and thermal-vibration shocks. Ritchie et al. (2004) examined the premature fatigue failure of
silicon-based micron-scale structures for MEMS, and the fracture properties of mineralized
tissue, specifically human bone. Fitzgerald et al. (2009) described and validated a general
methodology to predict the reliability of Single–Crystal Silicon MEMS devices. This
methodology used experimental data generated from fracture testing specimens combined with
finite element modeling to predict the fracture probability for any MEMS device under any
loading.
Pomeroy et al. (2008) developed a dynamic-stress analysis method, based on time
resolved micro Raman spectroscopy, for reliability studies of micro electromechanical systems.
Also, Jadaan et al. (2003) designed a probabilistic Weibull methodology to understand the
behavior and mechanical properties of MEMS brittle materials. This investigation concluded that
a Weibull probabilistic method is applicable at the MEMS scale size, and that is provides
significant prediction data of their short and long term behavior.
Starman Jr et al. (2000) investigated the measurement of residual and induced stress in a
MEMS micromirror flexure utilizing micro-Raman spectroscopy. This investigation showed that

20
micro-Raman spectroscopy can be used as an effective measurement technique to determine
local and induced stress values in MEMS devices. Schwalke et al. (2001) investigated the
breakdown of extra thick gate oxides (50–150 nm) used in power MOS device. Weibull
probability plots were used to describe the failure distribution of the thick gate oxides. Luo et al.
(2003) examined some fundamental reliability aspects of high- film through ramp voltage stress
testing.
By studying dielectric relaxation, and analyzing the transient conductivity, breakdown
modes of the tested high- film were identified; a sensitive method of breakdown detection in
ramped voltage tests was then proposed.
Accelerated testing has also been used to determine materials properties and measure
reliability. Brown et al. (1997) developed a resonant fatigue accelerated testing to demonstrate a
failure mode that was previously unknown. Their work indicated that moisture can decrease the
lifetime of ciclicly stressed polysilicon components.
2.4 Criticality Schemes
It is a well-known fact that neglecting reliability in early conception and design of
MEMS results catastrophical later on the product lifecycle. Traditional failure methodologies for
macro systems cannot be transferred directly to the micro and nanoscale. However, a good
understanding of failure mechanisms and environmental conditions interactions can be helpful to
apply techniques such as failure mode and effect analysis (FMEA), and analytical hierarchical
procedure (AHP) in order to identify root causes and to apply corrective actions through all

21
stages. Critically levels can be identified in operation conditions as well. Numerous studies have
been conducted for the mentioned methodologies in macro systems applications. Price (1995)
described how an existing tool for automating electrical design failure mode and effects analysis
(FMEA) can be augmented to make incremental design FMEA much less of a burden for the
engineer. The tool is able to generate the effects for each failure mode and to assign significance
values to the effects.
Eubanks et al. (1996) presented a method for developing a device behavior model to
enhance reliability at the early stages of conceptual design. The model facilitates a semi-
automated advanced failure modes and effects analysis. The model performs analyses and
simulations of device behavior, reasons about conditions that depart from desired behaviors, and
analyzes the results of those departures. The proposed method rigorously specifies pre- and post-
conditions, yet it is flexible in the syntax of device operation. The paper shows how the method
can capture failures normally missed by existing FMEA methods.
Kmenta et al. (1998) proposed a systematic method applicable at the early stages of
design to enhance life-cycle quality of ownership: Advanced Failure Modes and Effect Analysis
(AFMEA). The proposed method uses behavior modeling to simulate device operations and
helps identify failure and customer dissatisfaction modes beyond component failures. The
investigation also showed how Advanced FMEA applies readily to the early stages of design and
captures failure modes normally missed by conventional FMEA.
Kimura et al. (2002) proposed a computer aided FMEA, discussing its theoretical basis.
An extended product model is introduced, where possible machine failure information is added

22
to describe used machine status. Generic behaviour simulation to extended product models to
detect abnormal or mal-behaviour of machines under used conditions were developed. For
validating the proposed computer-aided FMEA method, several experiments were performed for
mechatronics products.
Fonseca and Knapp (2000) developed a framework for the implementation of Reliability
Centered Maintenance in the initial design phase of industrial chemical using AHP and
Likelihood Index. Grandzol (2005) developed an Analytic Hierarchy Process for Faculty
Selection in Higher Education. Also, Frei et al (1999) presented a methodology that combines
tournament ranking and AHP approaches to create a ranking scheme that deals explicitly with
missing data and ties in the tournament scheme. Kumar (2003) implemented an analytic
hierarchy process to analyze the risk of operating cross-country petroleum pipelines in India.
2.5 Literature Search Summary
All the previously discussed studies are focused on the need for assessment and analysis
through the design, fabrication, and testing of MEMS. Accelerated testing is the method of
choice to determine MEMS reliability, and to understand their behavior under different
applications. However, there have been no exhaustive studies of using a quantitative/qualitative
methodology such as failure mode effect and criticality analysis (FMECA) in MEMS.
The transfer of these methodologies commonly used in macro-systems into micro-
systems environments represents a great challenge. However, the flexibility of these tools and
availability of reliability data for MEMS represent the key for the development of a procedure to

23
priorizate failure modes in MEMS devices. This study has as a main goal to undertake such an
endeavor.

24
CHAPTER 3
RESEARCH SCOPE AND METHODOLOGY
In this study, a conceptual framework was developed for the assessment of the criticality
of key failure modes in MEMS. To accomplish this, MEMS accelerometers used in the
automotive industry were evaluated. The conceptual framework was established as a step by step
methodology as follows:
1. Select MEMS device and technical specifications.
2. Set MEMS environmental conditions under operation.
3. Select the failure mechanism class as proposed by Walraven (2003).
4. Define general failure mechanisms for the given environmental conditions.
5. Determine the common failure modes in the selected class and create a database.
6. Identify the analysis to be performed: i.e., quantitative/qualitative Failure Mode,
Effect and Criticality Analysis (FMECA) analysis.
7. Apply the FMECA methodologies to priorizate MEMS failure modes.
In order to develop this conceptual framework, a well-known methodology such as
Failure Mode, Effect and Criticality Analysis, commonly used in macro-systems, was adapted to
micro-systems environments by following the above methodology.

25
3.1 MEMS Failure Mechanisms and Failure Modes
A critical part of understanding the reliability of any system comes from understanding
the possible ways in which the system may fail. In MEMS, there are several failure mechanisms
that have been found to be the primary sources of failure within devices (Stark, 1999).
3.1.1 Mechanical Fracture
Mechanical fracture is defined as the breaking of a uniform material into two separate
sections. In MEMS, it usually leads to the catastrophic failure of the device, although there are
some structures that may have moderate performance degradations. No matter what the actual
outcome, any fracturing is a serious reliability concern (Figure 3.1) (Stark, 1999).
Figure 3.1
Surface Fracture
(Courtesy of Sandia National Laboratories)
There are three types of fractures: ductile, brittle, and intercrystalline fractures. Ductile
fracture, as the name implies, occurs in ductile materials. It is characterized by almost
uninterrupted plastic deformation of a material. It is usually signified by the necking, or extreme

26
thinning, of a material at one specific point. Brittle fracture occurs along crystal planes and
develops rapidly with little deformation. Intercrystalline fracture is a brittle fracture that occurs
along grain boundaries in polycrystalline materials, often beginning at a point where impurities
or precipitates accumulate. For MEMS, the latter two types of fracture are more common (Stark,
1999). The stress levels that most accelerometer devices are subjected to are far lower than the
breaking strength of the material used to build the mechanical structure (Delak et al. 1999).
3.1.2 Stiction
Stiction is considered one of the most important problems in MEMS. Internal MEMS
structures are so small that surface forces cause microscopic structures to stick together when
their surfaces come into contact (see Figure 3.2). The most important surfaces forces are: forces
due to capillary condensation, van der Waals molecular forces, and chemical and hydrogen
bonds between the surfaces. Surfaces tend to stick together when they are dried after the release
etch (Bhushan, 2007).
Figure 3.2
Stiction in MEMS Fingers
(Courtesy of Sandia National Laboratories)

27
3.1.3 Wear
Wear is caused by the motion of one surface over another. It is defined as the removal of
material from a solid surface as the result of mechanical action (DiBenedetto, 1967). Wear is
generally considered an undesirable effect in MEMS. There are four main processes that cause
wear, those are: adhesion, abrasion, corrosion, and surface fatigue (Stark, 1999). Figure 3.3
shows the wear debris on the surface of a microengine operated to 600,000 cycles (courtesy of
Sandia National Laboratories).
Figure 3.3
Wear Debris in Microengine
(Courtesy of Sandia National Laboratories)
Adhesive wear is caused by one surface pulling fragments off of another surface while
they are sliding. This is caused by surface forces bonding two materials together. When the
bonds break, they are unlikely to separate at the original interface, which fractures one of the
28
materials. Initial studies on the long-term effects of adhesive wear have been completed, with
some interesting results being discovered (Stark, 1999).
Abrasive wear occurs when a hard, rough surface slides on top of a softer surface and
strips away underlying material. While less prevalent in MEMS than adhesive wear, it can occur
if particulates get caught in microgears and can tear apart a surface. Corrosive wear occurs when
two surfaces chemically interact with one another and the sliding process strips away one of the
reaction products. This type of wear could cause failure in chemically active MEMS. Certain
types of microfluidic systems and biological MEMS are susceptible to corrosive wear. Corrosive
wear is dependent upon the chemical reactions involved (Stark, 1999).
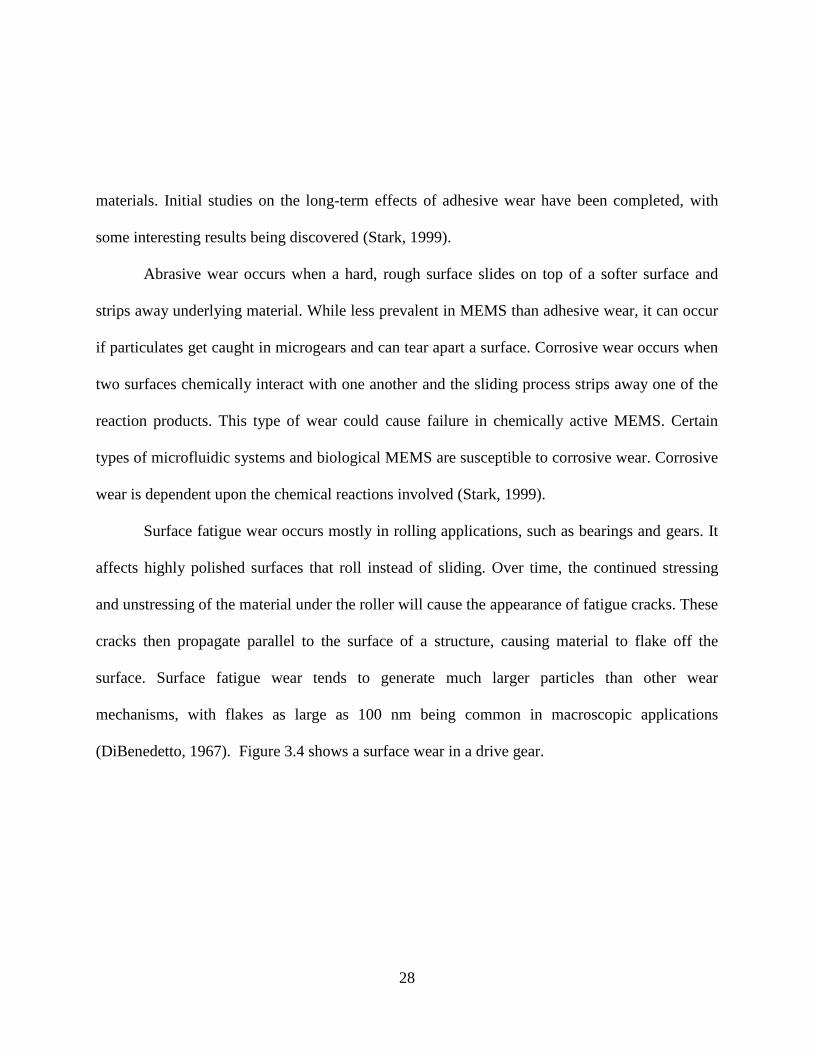
Surface fatigue wear occurs mostly in rolling applications, such as bearings and gears. It
affects highly polished surfaces that roll instead of sliding. Over time, the continued stressing
and unstressing of the material under the roller will cause the appearance of fatigue cracks. These
cracks then propagate parallel to the surface of a structure, causing material to flake off the
surface. Surface fatigue wear tends to generate much larger particles than other wear
mechanisms, with flakes as large as 100 nm being common in macroscopic applications
(DiBenedetto, 1967). Figure 3.4 shows a surface wear in a drive gear.

29
Figure 3.4
Surface Wear in a Drive Gears
(Courtesy of Sandia National Laboratories)
3.1.4 Delamination
A delamination condition occurs when a material interface loses its adhesive bond. It can
be induced by a number of means, from mask misalignments to particulates on the wafer during
processing. It can also arise as the result of fatigue induced by the long term cycling of structures
with mismatched coefficients of thermal expansion. No matter what the actual cause, the effects
of delamination can be catastrophic. If the material is still present on the device, it can cause
shorting or mechanical impedance (Stark, 1999).
3.1.5 Vibration and Shocks
Vibration is a large reliability concern in MEMS. Due to the sensitivity and fragile nature
of many MEMS, external vibrations can have disastrous implications.

30
Either through inducing surface adhesion or through fracturing device support structures,
external vibration can cause failure. Long-term vibration can also contribute to fatigue
(Walraven, 2003). In contrast, shocks differ from vibration in that a shock is a single mechanical
impact instead of a rhythmic event. A shock creates a direct transfer of mechanical energy across
the device. Shocks can lead to both adhesion and fracture. Shocks can also cause wire bond
shearing, a failure mode common to all semiconductor devices (Bhushan, 2007).
3.1.6 Electrostatic Discharge and Dielectric Charging
Electrostatic discharge, or ESD, occurs when a device is improperly handled. A human
body routinely develops an electric potential in excess of 1,000V. Upon contacting an electronic
device, this build-up will discharge, which will create a large potential difference across the
device. The effect is known to have catastrophic effects in circuits and could have similar effects
in MEMS. While the effects of ESD on MEMS structures have not been published to date, it can
be assumed that certain electrostatically actuated devices will be susceptible to ESD damage
(Stark, 1999).
Figure 3.5 shows a typical ESD/EOS damage input protection circuitry and the
catastrophic effect on the device (Walraven, 2003).

31
Figure 3.5
ESD Failure in Electrostatic Actuator
(Courtesy of Sandia National Laboratories)
Dielectric charging and breakdown is the charging that may occur in the dielectric layer.
Sensors are known to drift over time due to charge accumulating at the surface (Stark, 1999).
3.1.7 Radiation Effects
The field of radiation effects on MEMS is becoming increasingly important. It has long
been known that electrical systems are susceptible to radiation, and recent research has raised the
possibility that mechanical devices may also be prone to radiation-induced damage. Especially
sensitive to radiation are devices that have mechanical motion governed by electric fields across
insulators, such as electrostatically positioned cantilever beams. Insulators can fail under single
event dielectric rupture. A further complication is the fact that radiation can cause bulk lattice
damage and make materials more susceptible to fracture (Stark, 1999).

32
3.1.8 Temperature
This is a serious concern for MEMS. Internal stresses in devices are extremely
temperature dependent. The temperature range in which a device will operate within acceptable
parameters is determined by the coefficient of linear expansion. In devices where the coefficients
are poorly matched, there will be a low tolerance for thermal variations (Walraven, 2003).
Thermal effects cause problems in metal packaging, as the thermal coefficient of
expansion of metals can be greater than ten times that of silicon. For these packages, special
isolation techniques have to be developed to prevent the package expansion from fracturing the
substrate of the device. Another area that has yet to be fully examined is the effect of thermal
changes upon the mechanical properties of semiconductors. It has long been known that Young's
modulus is a temperature-dependent value (Stark, 1999).
3.1.9 Humidity
Humidity is considered another serious concern for MEMS. Surface micromachined
devices are extremely hydrophilic for reasons related to processing. In the presence of humidity,
water will condense into small cracks and pores on the surface of these structures (Stark, 1999).
Figure 3.6 shows an experiment performed by Sandia National Laboratories to
microengine gears stressed under different humidity conditions, i.e., 39%, 24%, and 1.8% of
relative humidity (RH) at 25°C. The microengines were stressed for the same number of cycles,
but the amount of wear debris for each humidity value was dramatically different (Sandia
National Laboratories, 2000).

33
Figure 3.6
Micro Engine Gears under Humidity Stress
(Courtesy of Sandia National Laboratories)
3.1.10 Particulates
Particulates are fine particles that are prevalent in the atmosphere. These particles have
been known to electrically short out MEMS and can also induce stiction. While these particles
are normally filtered out of the clean room environment, many MEMS are designed to operate
outside the confines of the clean room and without the safety of a hermetically sealed package.
As a result, devices must be analyzed to ensure that they are particle-tolerant before they can be
used as high-reliable devices in environments with high particulate densities. Another area in
which contaminants cause problems is in adhesion. Proper device processing requires most
materials interfaces to be clean in order to have good adhesion. If dust particles are present, the
two materials are weakly bonded and are more likely to have delamination problems (Stark,
1999).

34
Figure 3.7 shows a wear experiment conducted by Sandia National Laboratories.
Particles can be easily identified in the side wall of the device, and they are responsible to start
the initial wear process.
Figure 3.7
Particles on MEMS
(Courtesy of Sandia National Laboratories)
MEMS components by nature have different and unique failure mechanisms than their
macroscopic counterparts. Walraven (2003) developed a general taxonomy to properly
categorize each MEMS device with their related failure mechanism. Table 3.1 shows the result
of this investigation:

35
Table 3.1
MEMS Failure Mechanisms
Class I: Accelerometers, Pressure sensors,
Inkjet print heads, Strain Gauges.
Failure Mechanism Description:
Unknown to fail due to operation.
Particulate contamination can and typically
will induce failure. Particles can be
difficult to detect because they may not
electrically interfere with the operation of a
device. Particulate contamination may
serve to mechanically obstruct the device
while its electrical integrity is maintained.
Class II: Gyroscopes, comb drives,
resonator ad filters.
Failure Mechanism Description: These
devices have intentionally designed
moveable parts that interact with the rest of
the device to perform a given function, they
are susceptible to fatigue, fracture or
particulate contamination
Class III: Relays and Valves
Failure Mechanism Description: MEMS
devices with impacting surfaces have the
potential to create debris, fracture
components, induce cracks, etc. Impact
failures are very dependent upon the force
exerted on the opposite MEMS structure.

36
Table 3.1-Continued
MEMS Failure Mechanisms
Class IV: Shutters, Scanners, Optical
Switches
Failure Mechanism Description: These
devices have moving, impacting structures
with the addition of rubbing surfaces.
Rubbing creates friction and often will
result in the creation of wear material or
debris. The formation of this material may
result in several different failure
mechanisms. These are: failure by particle
contamination binding the device, particles
causing third body wear changing the
motion tolerance, particulate contamination
preventing or obstructing motion, and
adhesion of rubbing or contacting surfaces .
The mechanism for wear may depend on
the temperatures reached during rubbing.
Many parameters must be examined to
determine the root cause of wear, making
analysis straight forward but time
consuming.
For this investigation, MEMS accelerometers used in the automotive industry were
classified as Class 1 from Table 3.2. Thus, failure mechanisms for the mentioned class are the
main focus off the analysis leading to the identification of the failure modes for the MEMS.

37
3.2 Failure Mode Effect and Analysis
The Failure Mode and Effect Analysis is a logical, structured analysis of a system,
subsystem, device, or process (Schubert, 1992). It is one of the most commonly used reliability
and system safety analysis techniques. A FMEA consists of breaking a system down into what
can fail, how it can fail, and why it fails, and then determining the effects of those failures on the
system (PTC, 2010). The most commonly used FMEA standards include The Department of
Defense MIL-STD-1629, The Department of the Army Technical Manual 5-698-4, the SAE-
ARP5580 (Aerospace Industry), and the SAE J1739 (Automotive Industry).
The FMEA process is a bottom-up approach to system analysis. The analysis begins at
the lowest level desired for study, such as a part or a step in a process, and evaluates the possible
failure modes associated with that item. The next step consists in establishing, based on system
knowledge and analyst experience, the resulting effects of the failure modes. Finally, the analyst
may also determine the severity of that effect, the probability of occurrence of that effect, and
how the effect could be detected (PTC, 2010). This process continues until the overall system
effects are evaluated.
The main objective of a FMEA is to evaluate all parts of a system or process. Also,
FMEA results critical to ensure that system reliability and safety objectives are met, as well as
corrective actions to improve the analysis (Beauregard et al., 1996).
The SAE- J1739 (2009) establishes a step by step guidance for the application of Failure
Mode and Effects Analysis. The document states the following three basic cases for which
FMEA’s are generated, each with a different scope:

38
1. Design FMEA (D-FMEA): Design FMEA evaluates the initial design for
manufacturing, assembly, service and recycling requirements, including functional
requirements and design alternatives. Design FMEA should be initiated before or at the
design concept finalization and be continually updated as changes occur or additional
information is obtained throughout the phases of product development. Design FMEA
should be completed before the production drawings are released for tooling (SAE,
2009).
2. Machinery FMEA (M-FMEA): The Machinery FMEA supports the design processing
reducing the risk of failures through:
Aiding in the objective evaluation of equipment functions, design requirements and
design alternatives.
Increasing the probability that potential failure modes and their effects on the machinery
have been considered in the design and development process.
Providing additional information to aid in the planning of thorough and efficient design,
validation and development programs.
Developing a ranked list of potential failure modes prioritize according to their effect,
thus establishing a priority system for design improvements, development and validation
testing analysis.
Machinery FMEA should be initiated during the design concept development and should
be continually updated as changes occur or additional information is obtained throughout the

39
phases of machinery development. The analysis should be completed before engineering release
for construction (SAE, 2009).
3. Process FMEA (P-FMEA): Process FMEA is utilized to accomplish the following:
Identify the process functions and requirements.
Identify potential product- and process-related failure modes.
Assess the potential customer effects of the failures.
Identify the potential manufacturing/assembly process causes of failures, and identify
process variables on which to focus controls for occurrence reduction or detection of the
failure conditions.
Identify process variables on which to focus process controls.
Develop a ranked list of potential failure modes, thus establishing a priority system for
preventive/corrective action considerations.
Document the results of the manufacturing/assembly process.
Process FMEA should be initiated before or at the feasibility stage and prior to tooling
for production. It should take into account all manufacturing operations from individual
components to assemblies (SAE, 2009).
FMEA can be measured by calculating a risk priority number (RPN). The RPN reveals
the overall risk of a particular failure mode occurring in the system. The RPN is usually
calculated as:
(3.1)
Severity x Occurrence x Detection

40
In order to get the RPN number in a FMEA, established rankings to determine values for
severity (S), occurrence (O) and detection (D) must be considered. For the scope of this
investigation, process FMEA rankings were considered.
Several guidelines such as the MIL-STD-1629, the SAE J1739 and the Department of the
Army define rankings for these variables as follows:
• Severity (S): Indicates the severity of the effect of a particular failure mode. The
severity ranking is important to determine relative concerns amongst failure modes. In Table 3.2,
a severity ranking is assigned to each system level effect. A lower ranking indicates a less severe
failure effect. A higher ranking indicates a more severe failure effect.
Table 3.2
Severity Rankings
(MIL-STD-1629, 1998)
SEVERITY RANKINGS
Ranking Effect Description
1 Minor No noticeable effect. Unable to realize that a
failure has occurred.
2 Marginal Annoying. No system degradation.
3 Moderate Causing dissatisfaction. Some system
degradation.
4 Critical Causing a high degree of dissatisfaction.
Loss of system function.
5 Catastrophic A failure which may cause death or injury.
Extended repair outages.

41
In contrast, Table 3.3 shows the Severity (S) rankings used by the Department of the
Army. The severity ranking criteria selected to perform FMEA analysis must be consistent
throughout the analysis.
Table 3.3
Severity Rankings
(Department of the Army, 2006)
SEVERITY RANKINGS
Ranking Effect Description
1 None
No reason to expect failure to have any
effect on safety, health, environment or
mission.
2 Very Low
Minor disruption t facility function. Repair
to failure can be accomplished during trouble
call.
3 Low
Minor disruption t facility function. Repair
to failure may be longer than trouble call but
does not delay mission.
4 Low to
Moderate
Moderate disruption to facility function.
Some portion of mission may need to
be reworked or process delayed.
5 Moderate
Moderate disruption to facility function.
100% of mission may need to be reworked
or process delayed.
6 Moderate
to High
High disruption to facility function. Some
portion of mission is lost. Significant
delay in restoring function.
7 High
High disruption to facility function. Some
portion of mission is lost. Significant
delay in restoring function.
8 Very High
High disruption to facility function. All of
mission is lost. Significant delay in
restoring function.
9 Hazard Potential safety, health or environmental
issue. Failure will occur with warning.
10 Hazard Potential safety, health or environmental
issue. Failure will occur without warning.

42
Severity classifications provide a qualitative measure of the worst potential consequences
resulting from an item failure (Department of the Army, 2006).
• Occurrence (O): This variable designates how frequently a particular failure mode
occurs. Table 3.4 shows the occurrence ranking that can be used to subjectively assign a failure
rate to a piece of equipment or component. The ranking corresponds to an estimated failure rate
based on the analyst's experience or available reliability data. These values establish the
qualitative failure probability level for entry into a Criticality Analysis (CA) worksheet format
(Department of Defense, 1998).
Table 3.4
Occurrence Rankings
(Department of Defense, 1998)
OCURRENCE RANKINGS
Ranking Failure Rate
(Hours) Description
1 - Unlikely. Unreasonable to expect this failure
mode to occur.
2 1/10,000 Isolated. Based on similar designs having a
low number of failures.
3 1/1,000 Sporadic. Based on similar designs that have
experienced occasional failures.
4 1/100 Conceivable. Based on similar designs that
have caused problems.
5 1/10 Recurrent. Certain that failures will ensue.
The failure rates values can be adjusted for a particular application. Rates can be in hours,
days, or cycles (Department of the Army, 2006). On the other hand, Table 3.5 shows the

43
Occurrence rankings used by the Department of the Army. The occurrence criteria selected to
perform FMEA analysis must be consistent throughout the analysis as well.
Table 3.5
Occurrence Rankings
(Department of the Army, 2006)
OCCURRENCE RANKINGS
Ranking
Failure
Rate
(Hours)
Description
1 1/10,000 Remote probability of occurrence;
unreasonable to expect failure to occur.
2 1/5,000
Very low failure rate. Similar to past design
that has, had low failure rates for given
volume/loads.
3 1/2,000 Low failure rate based on similar design for
given volume/loads.
4 1/1,000
Occasional failure rate. Similar to past
design that has had similar failure rates for
given volume/loads.
5 1/500
Moderate failure rate. Similar to past design
having moderate failure rates for given
volume/loads.
6 1/200
Moderate to high failure rate. Similar to past
design having moderate failure rates for
given volume/loads.
7 1/100
High failure rate. Similar to past design
having frequent failures that caused
problems.
8 1/50
High failure rate. Similar to past design
having frequent failures that caused
problems.
9 1/20
Very high failure rate. Almost certain to
cause problems.
10 1/10
Very high failure rate. Almost certain to
cause problems.

44
• Detection (D): This variable indicates how often a particular failure mode can be detected.
Table 3.6 shows qualitative values that can be used to determine this variable.
Table 3.6
Detection Rankings
(Department of Defense, 1998)
DETECTION RANKINGS
Ranking Detection
Criteria Description
1 80%–100% Very high probability of detecting the failure
before it occurs. Almost always preceded by
a warning.
2 60%–80% High probability of detecting the failure
before it occurs. Preceded by a warning most
of the time.
3 40%–60% Moderate probability of detecting the failure
before it occurs. About a 50% chance of
getting a warning.
4 20%–40% Low probability of detecting the failure
before it occurs. Always comes with little or
no warning.
5 0%–20% Remote probability of detecting the failure
before it occurs. Always without a warning.
In comparison, Table 3.7 shows the detection rankings used by the Department of the
Army.

45
Table 3.7
Detection Rankings
(Department of the Army, 2006)
DETECTION RANKINGS
Ranking Detection Description
1 Almost
Certain
Current control(s) almost certain to detect
failure mode. Reliable controls are known
with similar processes.
2 Very High Very high likelihood current control(s) will
detect failure mode.
3 High High likelihood current control(s) will detect
failure mode
4 Moderately
High
Moderately high likelihood current
control(s) will detect failure mode.
5 Moderate Moderate likelihood current control(s) will
detect failure mode.
6 Low Low likelihood current control(s) will detect
failure mode.
7 Very low Very low likelihood current control(s) will
detect failure mode.
8 Remote Remote likelihood current control(s) will
detect failure mode.
9 Very
Remote
Very remote likelihood current control(s)
will detect failure mode.
10 Almost
Impossible
No known control(s) available to detect
failure mode.
RPN values for every failure modes are obtained after entering the severity, occurrence,
and detection values, and are used to determine how critical the failures are, and how they can be
eliminated, or the risks mitigated.
Figure 3.8 shows an illustrative example of an FMEA worksheet. Relevant data regarding
the system and his mission is presented. Also, a potential failure mode (a water temperature
greater than 75°F), and a failure mechanism (a cooling tower malfunction) are clearly specified.

46
Severity, occurrence, and detection values are entered in order to obtain the preliminary RPN of
96 (Equation 3.1). After this, recommended actions are proposed with a responsible for this
action i.e., (M.Sequera), in order to eliminate or mitigate the existing failure mode. Finally, after
corrective actions are applied, a new analysis for the severity, occurrence, and detection results
in a final RPN of 16 (Equation 3.1). In conclusion, the variation between the preliminary results
(a RPN of 96) and the final (RPN of 16) represents the measurable improvement in the analysis.
Figure 3.8
Failure Mode and Effect Analysis Example
FMEAs are typically performed based on published standards or guidelines, or they can
be developed by organizations following their own standards (PTC, 2010).
Another important aspect is the fact that these variables can be adapted to the system that
is being analyzed. FMEAs that are used to perform analysis of criticality as well are commonly
known as Failure Mode, Effects, and Criticality Analysis (FMECA).

47
3.3 Failure Mode Effect and Criticality Analysis
The FMECA was originally developed by the National Aeronautics and Space
Administration (NASA) to improve and verify the reliability of space program hardware. In
1980, The Department of Defense MIL-STD-1629A (Reliability Program for System and
Equipment Development and Production, Failure Mode, Effects and Criticality Analysis) was
introduced as the standard for the U.S. military until 1998. On August 4, 1998, the military
standard MIL-STD-1629A was rescinded, with instructions for users to “consult various national
and international documents for information regarding failure mode, effects, and criticality
analysis” (O’Conner, 1996).
Later on in 2006, The Department of the Army used the cancelled MIL-STD-1629A to
develop an updated version of the military standard that establishes requirements and procedures
for performing a FMECA. This new technical manual was called the TM 5-698-4. Other military
standards, such as the MIL-STD-785B, were used to establish procedures for performing a
FMECA on equipment or systems as well.
The Department of the Army (2006) established that the TM 5-698-4 evaluates and
documents, by failure mode analysis, the potential impact of each functional or hardware failure
on mission success, personnel and system safety, maintainability, and system performance. Each
potential failure is ranked by the severity of its effect so that corrective actions may be taken to
eliminate or control risk.
Although the MIL-STD-1629A was discontinued, its basic concepts are applied during
the development phases and operation conditions of all critical systems and equipment whether it
48
is military, commercial, or industrial systems. The techniques presented in this standard may be
applied to any electrical or mechanical equipment or system (Department of the Army, 2006).
The TM 5-698-4 explains on a step by step basis how to develop an FMECA. First, a
FMEA is recommended to be completed prior to performing the Criticality Analysis (CA). The
Criticality Analysis adds the benefit of showing the analysts a quantitative ranking of the system
failure modes. On the other hand, the Criticality Analysis allows the analysts to identify
reliability and severity related concerns with particular components or systems.
3.3.1 Criticality Analysis
Dodson and Nolan (1999) define Criticality Analysis (CA) as a procedure by which each
potential failure mode is ranked according to the combined influence of severity and probability
of occurrence. On the other hand, the TM 5-698-4 defines The Criticality Analysis (CA) as the
measure of the frequency of occurrence of the effects of a failure mode, as well as the
significance of an entire piece of equipment or system, on safe, successful operation, and
operation requirements (Department of the Army, 2006).
The Criticality Analysis can be accomplished using either a quantitative or a qualitative
approach. There are differences on each approach. If reliability information is available, a
quantitative analysis must be performed. In contrast, if reliability information is not available, a
qualitative analysis is recommended, and the analyst must perform the criticality analysis based
on his/her experience and expectations on the system. This methodological tool allows analysts
to rank the significance of each potential failure mode for each component in the system based

49
on the available reliability information (failure rate) as well data transferred from the FMEA
such as the severity ranking. This tool can be used to prioritize and minimize the effects of
critical failures early in the design as well as in operation conditions (Department of Defense,
1998).
3.3.2 Quantitative Failure Mode, Effects and Criticality Analysis
Once it is determined that sufficient failure rate data and failure mode distributions are
available, a Quantitative Failure Mode, Effects and Criticality Analysis can be assessed. Some of
the categories can be derived from the FMEA such as failure modes, failure mechanisms, and
severity (S).
The MIL-STD-1629A establishes an approach to calculate the criticality number (Cm). A
description of each category and variables used in the quantitative Criticality Analysis are listed
below (Department of the Army, 2006):
Beta (β): Is defined as the failure effect probability and is used to quantify the described
failure effect for each failure mode indicated in the FMECA. The beta (β) values
represent the conditional probability or likelihood that the described failure effect will
result in the identified criticality classification, given that the failure mode occurs. The β
values represent the analyst's best judgment as to the likelihood that the loss or end effect
occurs. Table 3.8 shows recommended values for (β).

50
Table 3.8
Failure Effect Probability
(Department of Defense, 1998)
Failure Effect Β Value
Actual Loss 1
Probable Loss 0.10 to 1
Possible Loss 0 to 0.10
No effect 0
Alpha (α): The probability, expressed as a decimal fraction, that the given part or item
will fail in the identified mode. If all of the potential failure modes for a device are
considered, the sum of the alphas should equal one. Determining Alpha is done as a two
part process for each component being analyzed. Table 3.9 shows an example of a
hypothetical failure mode ratio (α) used for existing failure modes in a blower.
Table 3.9
Failure Mode Ratio
(Department of the Army, 2006)
Part Failure Modes Failure Mode Ratio (α) Failure Mode Ratio (α) in %
Blows too little air 0.55 55
Blows too much air 0.05 5
Blows no air 0.40 40
The sum of α must be =1 1 100

51
The Failure Rate (λp): Is the ratio between the numbers of failures per unit of time, and
it is typically expressed in failures per million hours or 106 hours. The source of the
failure rate should be clearly specified. Failure rate data from field tests are strongly
recommended; however, information available from manufacturers and previous
investigations can be used as well.
The Modal Failure Rate (λm): Is the fraction of an item’s total failure rate based on the
probability of occurrence of that failure mode. The sum of the modal failure rates for an
item is equal to the total item failure rate for all part failure modes accounted. The modal
failure rate is given by the equation:
λm = α λp (3.2)
Where:
λm = the modal failure rate.
α= the probability of occurrence of the failure mode (failure mode ratio).
λp = the item failure rate.
Failure Mode (modal) Criticality Number (Cm): The failure mode criticality number is
a relative measure of the frequency of a failure mode. In essence, it is a mathematical
means to rank importance of a failure mode effect, based on its failure rate. The equation
used to calculate this number is as follows:
Cm = (β x α x λp x t) (3.3)
Where:
Cm = Failure mode criticality number

52
β = Conditional probability of the current failure mode
α = Failure mode ratio
λp = Item failure rate
t = Duration of applicable mission phase (expressed in hours or operating cycles)
Item criticality number (Cr): The item criticality number is a relative measure of the
consequences and frequency of an item failure. This number is determined by totaling all
of the failure mode criticality numbers of an item with the same severity level. Equation
3.4 is used to calculate such a number:
Cr = Σ (Cm) (3.4)
Where:
Cr = Item criticality number
Cm = Failure mode criticality number
Figure 3.9 shows an illustrative criticality worksheet example of quantitative Failure
Modes, Effect and Criticality Analysis with all the variables previously explained. In this
example, the potential failure mode, the failure mechanism, and severity (s) of a group of failure
modes are transferred from a previously developed FMEA. Also, potential failure modes and
failure mechanism are clearly specified. Other variables, such as the failure rate (λp), the failure
effect probability (β), the failure mode ratio (α), and the operating time (t) are entered in order to
obtain the failure mode criticality number (Cm) ( Equation 3.3 ), and the item criticality number
(Cr) ( Equation 3.4 ).

53
Figure 3.9
Quantitative Failure Modes, Effects and Criticality Analysis (FMECA)
(Department of the Army, 2006)
Methodologies such as the Criticality Matrix are strongly recommended to document and
analyze the results obtained from a FMECA. In this investigation, the Criticality Matrix was
considered as the means to compare the failure modes criticality of automotive MEMS devices.
3.3.3 The Criticality Matrix
This methodology is a graphical tool used to identify and compare failure modes for all
components and their probability of occurring with respect to the severity (S). It is used in
quantitative and qualitative analyses. The matrix can be used along with the Critical Item List, or

54
by itself, in order to prioritize components. The matrix has the distinctive ability to differentiate
criticality of components with similar RPN and criticality values (Department of Defense, 1998).
Table 3.10 represents an example of the criticality matrix used in this investigation. The
matrix is constructed by inserting the assigned Item Number (110.0, 120.0 and 120.1) with their
corresponding failure modes, severity (S) indexes and the criticality number (Cm ) transferred
from Figure 3.9.
Table 3.10
Criticality Matrix Data
(Department of the Army, 2006)
ITEM Failure
Mode Severity (S) Criticality Number (Cm)
110.0 Leak 4 6.38 x10⁻⁴
120.0
Transport
water below
1000 GPM
3 3.00 x 10⁻¹³
120.1 Produce no
water flow 3 5.58 x 10
-13
The criticality matrix displays the distribution of all the failure mode criticality numbers
according to the severity category through the criticality scale. Figure 3.10 shows the visual way
to understand the criticality data from Table 3.10.
For the example of Table 3.10, the Item 110.0 (Leak) represents the failure mode that requires
more attention for having the higher severity number (S), and criticality number (Cm). In contrast, items
120.0 (Transport water below 1000GPM) and 120.1 (Produce no water flow) have a lower
probability of occurrence by their severity numbers (S), and criticality numbers (Cm).

55
In conclusion, items displayed closer to the right hand corner require most attention and items
closer to the left corner have a lower probability of occurrence.
Figure 3.10
Criticality Matrix
3.4 Summary
This chapter defined the scope of the project, as well as its general methodology. The
conceptual framework for the assessment of the criticality of key failure modes in MEMS was
accomplished by following the discussed methodology on a step by step basis. Furthermore,
several widely used MEMS devices were discussed, in particular those used in the automotive
industry.
The creation of a conceptual framework for automotive MEMS accelerometers involves
careful analysis of existing methodologies such as FMECA, that is commonly used in macro-
systems. As it was mentioned before, it is challenging to transfer analytical tools for macro-

56
system to the micro-system realm. Hence, several key factors such as failure mechanisms,
associated failure modes, and pertinent reliability information were considered while establishing
the conceptual framework of this study.

57
CHAPTER 4
CONCEPTUAL FRAMEWORK IMPLEMENTATION
As it was previously stated, the main objective of this project was to design a conceptual
framework for the assessment of the criticality of key failure modes in MEMS accelerometers.
The conceptual framework establishes seven steps to perform the criticality analysis. Also, it
includes operational parameters for MEMS technology such as environmental conditions and
surrounding stresses. Failure mechanisms and failure modes were analyzed in order to perform
the criticality analysis (FMECA). Figure 4.1 shows an illustration of the project’s methodology.
Figure 4.1
Conceptual Framework

58
4.1 Selection of MEMS and Technical Specifications
The first step to develop the conceptual framework was to establish the selection of the
MEMS device for the analysis and its related technical specifications. The World Wide Web was
used to identify and research potential automotive MEMS manufacturers with reliability data
available for this study. The potential manufacturers were consolidated to two companies with a
solid reputation in the automotive industry: 1) Analog Devices; and 2) Robert Bosch.
After careful examination, Analog Devices was selected as the manufacturer of the
MEMS device used in this analysis. This company has more than 20 years of experience in
automotive MEMS. In addition, useful reliability data was readily available at
www.analogdevices.com for all their devices. In contrast, although Robert Bosch has a broad
variety of MEMS accelerometers for automobiles, no reliability data was available at the time of
this research.
4.1.1 ADXL 180 MEMS Accelerometer Description
The ADXL180 accelerometer is a configurable, single axis, integrated satellite sensor
that enables low cost solutions for front and side impact airbag applications.
Acceleration data is sent to the control module via a digital 2-wire current loop interface
bus. The communication protocol is programmable for compatibility with various automotive
interface bus standards. The sensor g range is configurable to provide full-scale ranges from ±50
g to ±500 g. The sensor signal third-order, low-pass Bessel filter bandwidth is configurable at
100 Hz, 200 Hz, 400 Hz, and 800 Hz. The 10-bit analog-to-digital converter (ADC) allows either

59
8-bit or 10-bit acceleration data to be transmitted to the control module. Each part has a unique
electronic serial number. The device is rated for operation from −40°C to +125°C, and it is
available in a 5 mm × 5 mm LFCSP package (Analog Devices, 2011).
Table 4.1 shows the technical specifications for the chosen MEMS accelerometer used in
this analysis (Analog Devices, 2011).
Table 4.1
ADXL180 Technical Specifications
(Analog Devices, 2011)
ANALOG DEVICES ADXL180
Supply Voltage -0.3 V to +21V
Operating Temperature Range -40°C to 125°C
Storage Temperature Range -55°C to 150°C
Sensor Range +-50 G to +- 500 G
Mechanical Shock
Unpowered: +- 4,000 G
Powered: +- 2,000 G
Package 5 x 5 mm
Drop Test 1.2m
4.2 Environmental Conditions for MEMS in the Automotive Industry
The second step in the conceptual framework was to set the environmental conditions to
assess the criticality of key failure modes in MEMS accelerometers. As it was presented in Table
3.3, MEMS are exposed to an aggressive environment in automotive applications. For this

60
investigation, three scenarios were considered for analysis. Table 4.2 depicts the 1st scenario for
the analysis:
Table 4.2
Analysis Scenario 1
Scenario 1 for ADXL180
Variables
Temperature 50°C
Mechanical Shock 3000 G
Vibration 15G
Electromagnetic Impulses 100 to 200 Volts/meter
In this first scenario, a temperature of 50°C was considered for the assessment of
criticality key failure modes. Table 4.3 depicts the second scenario:
Table 4.3
Analysis Scenario 2
Scenario 2 for ADXL180
Variables
Temperature 100°C
Mechanical Shock 3000 G
Vibration 15G
Electromagnetic Impulses 100 to 200 Volts/meter
In the second scenario, a temperature of 100°C was considered for the assessment of
criticality key failure modes. Finally, Table 4.4 depicts the third scenario with a temperature of
150°C:

61
Table 4.4
Analysis Scenario 3
Scenario 3 for ADXL180
Variables
Temperature 150°C
Mechanical Shock 3000 G
Vibration 15G
Electromagnetic Impulses 100 to 200 Volts/meter
4.3 Class 1 Accelerometers
The third step in the development of the conceptual framework consists in understanding
the device class, and failure mechanisms. Walraven (2003) establishes that MEMS
accelerometers used in the automotive industry are classified as Class 1 (Table 3.4). Class 1
accelerometers are devices with no internal moving parts. These devices are unknown to fail due
to regular operation (Walraven, 2003).
The ADXL180 accelerometer provides a fully differential sensor structure and circuit
path. Each sensor includes several differential capacitor unit cells. Each cell is composed of fixed
plates attached to the substrate and movable plates attached to the frame. Displacement of the
frame changes the differential capacitance, measuring the change in acceleration (Analog
Devices, 2011). The ADXL180 acceleration sensor uses two electrically isolated, mechanically
coupled sensors to measure acceleration as shown in Figure 4.2:

62
Figure 4.2
ADXL180 Accelerometer
4.4 Failure Mechanisms and Failure Modes in Class 1 Accelerometers
A clear distinction between failure mechanisms and failure modes is necessary to perform
a criticality analysis. A failure mechanism is the physical, chemical, or thermal changes that lead
to a failure. In contrast, the failure mode is the way in which a failure is observed and its impact
on the device operation. Steps 4 and 5 in the conceptual framework are closely related and they
are the key to perform the criticality analysis.
4.4.1 Failure Mechanisms in Class 1 Accelerometers
As it was stated previously, Class 1 accelerometers are unknown to fail due to operation.
For this specific class, particulate contamination and stiction can typically induce to a failure.
Particles can be difficult to detect because they may not electrically interfere with the operation

63
of the device. Other general failure mechanisms, such as degradation, ESD, mechanical shock,
vibration, stress and corrosion, can affect Class 1 accelerometers as well.
Several studies have been conducted to confirm these premises. Hartzell et al. (1999)
proposed a methodology for the prediction of stiction behavior in micromachined
accelerometers. The model was based on an empirical work to determine the probability of
survival after stress shocks that cause stiction.
Figure 4.3 shows the survival probability of an accelerometer subjected to a single shock
event.
Figure 4.3
Single Shock Survival Probability (Stiction)
(Courtesy of Analog Devices)
In this approach, Hartzell et al. (1999) performed a stress testing analysis in
accelerometers. The stresses were applied to 4,590 devices by using techniques such as high
temperature operating life (HTOL), thermal shocks, thermal cycles and high temperature storage.

64
Off all the reliability tests conducted, only one failure occurred, and it was caused by stiction at
high temperatures (150°C x 1000 hours).
Tanner et al. (2005) performed accelerated testing to MEMS devices at temperatures
from 200°C to 300°C which were higher than the standard MEMS operating range of -50 to
125°C. Humidity was also considered for this study by using humidity levels of 500 ppmv and
2,000 ppmv, which are lower than the military standard of 5,000 ppmv (15, 8 % RH).
The results were conclusive; the failures are dependent on both temperature and
humidity. Failures occur at higher temperatures (300°C) and low humidity. The predominant
failure mechanisms were degradation and wear, and they can vary depending of the complexity
of internal structure of the MEMS.
Tanner et al. (2000) also developed an analysis of vibration in MEMS. The vibration
stress test was performed at four times the level of the typical system requirements in the
automotive industry (from 20 to 30 G). Higher vibrations can produce stiction and adhesion on
surfaces. Also, presence of wear debris occurs at higher vibration levels.
Brown and Davis (1998) presented another interesting investigation using ANALOG
DEVICES accelerometers model ADXL05, ADXL50, ADXL150, ADXL181, commonly used
for airbag usage for tests into ground and flight testing with high-g loading. The accelerometers
were tested at shock levels of 13,500G and 26,000G. All the accelerometers survive the shock
test. In addition, accelerometers were also tested in an air gun test that simulates extreme artillery
level and tank level launch accelerations. The accelerometers survived to levels of shock up to
80,000G which are higher than the standard MEMS automotive operating range of 50-500G.

65
This investigation demonstrates how reliable MEMS accelerometers can be under shocks in
automotive environment.
Sandia National Laboratories (2000) suggest that particulate contamination can be
expected to have a serious effect on devices under shock and vibration environments. These
environments cause the particles to move and can short out working devices. Also, other failure
mechanisms such handling and oven curing during the packaging process of the MEMS are
considered critical for their probability to induce a failure in the device.
Table 4.5 shows the failure mechanisms that were considered for the failure modes
database performed later in this chapter:
Table 4.5
Failure Mechanisms
Stiction
Wear
Humidity
Fatigue
Shock and Vibration
Contamination
Temperature
Dielectric Charging and ESD
4.4.2 Failure Modes Database in Class 1 Accelerometers
For this investigation, a failure mode database was created to perform a criticality
analysis. This database is based on the results of the previously mentioned literature research.
Table 4.6 shows the failure modes, and their respective failure mechanisms, that were used for

66
the criticality analysis in this study. A total of 13 failure modes were identified and were used to
assess their criticality under the three established scenarios as explained in Section 4.2.
Table 4.6
Failure Modes and Failure Mechanisms
Failure Mode Failure Mechanism
Wear debris between rubbing surfaces Humidity, Wear
Sticking of finger structures due to surface forces Stiction
Internal fracture on structure Fatigue Stress
Finger and Substrate Adhesion Stiction
Surface Adhesion Shock
Cracks and Pores on the surface Humidity , Temperature
Internal structural stress Humidity, Wear
Collapse of electrodes due to excessive deformation Stiction
Welding of the polysilicon finger to the ground plane Fatigue Stress
Noise in sensor output Stiction
Sensor output variation with temperature Shock
Mechanical obstruction of the fingers Contamination
Internal aging of Polysilicon Humidity , Temperature
4.5 Failure Mode, Effect and Criticality Analysis
The last step in the development of the conceptual framework was the implementation of
the Failure Mode, Effect, and Criticality Analysis . The FMECA provides a way to measure the
frequency of occurrence and the effect of selected failure modes.
4.5.1 System Requirements
Based on the structure of the conceptual framework, several system technical conditions
are required. Among them, high quality of graphical representations, statistical data

67
interpretation, and user friendliness were considered essential. Therefore, Microsoft Excel 2007
was selected for this investigation for the following reasons:
Microsoft Office 2007 is a reliable tool to introduce data, formulas and keep relation
between entered values.
The Excel spreadsheet lets the user to perform a sequential input of FMECA variables
that must be introduced to complete the Criticality Analysis.
4.5.2 FMECA Preliminary Data
Preliminary data was submitted before starting the FMECA analysis. This preliminary
data provides information about the system, the responsible party of the analysis, and the mission
of the device. The preliminary data are listed as follows:
System: Information on the system to be analyzed.
Part Name: Part number by the manufacturer.
Reference Drawing: Additional graphical info that can be useful for the analysis.
Mission: Defines the device mission.
Date: Date when the analysis was performed.
Sheet: Referential number of pages from the analysis.
Compiled by: Responsible of performing the analysis.
Approved by: Responsible of validating the analysis.
For this investigation, these variables were classified as depicted in Table 4.7:

68
Table 4.7
FMECA Preliminary Data
FMECA Preliminary Data
System MEMS Airbag Deployment System
Part Name ADXL180 (Analog Devices)
Reference Drawing Not available
Mission Deployment of airbag system
Date 2/10/2011
Sheet 1 of 1
Compiled By M.Sequera
Approved By D.Fonseca
.
Figure 4.4 illustrates the preliminary data submitted in the Microsoft Excel sheet of the
FMECA used in this investigation.
Figure 4.4
FMECA Preliminary Data
4.5.3 FMECA Variables
As it was explained in Chapter 3, a group of relevant FMECA variables were defined in
order to get a criticality number for every failure mode. In this study, these variables were
considered as follows:
Item Number: ADXL180 (Accelerometer described in Section 4.1.1).

69
Item functional ID for Failure Modes, and Failure Mechanisms: Successive numbers that
identifies failure mode and failure mechanisms. Table 4.8 shows the functional items
identification for this study.
Table 4.8
Item Functional ID
Item Number Item
Functional ID Potential Failure Mode
Failure
Mechanism
ADXL180 1 Wear debris between rubbing
surfaces Humidity-Wear
ADXL180 2 Sticking of finger structures
due to surface forces Stiction
ADXL180 3 Internal fracture on structure Fatigue Stress
ADXL180 4 Finger and substrate adhesion Stiction
ADXL180 5 Surface adhesion Shock
ADXL180 6 Cracks and pores on the
surface
Humidity ,
Temperature
ADXL180 7 Internal structural stress Humidity-Wear
ADXL180 8 Collapse of electrodes due to
excessive deformation Stiction
ADXL180 9 Welding of the polysilicon
finger to the ground plane Fatigue Stress
ADXL180 10 Noise in sensor output Stiction
ADXL180 11 Sensor output variation with
temperature Shock
ADXL180 12 Mechanical obstruction of the
fingers Contamination
ADXL180 13 Internal aging of polysilicon Humidity -
Temperature
Severity (S): Assigned Severity values from Table 3.6.
The highest severity value possible was assumed in this investigation for every failure
mode (i.e., 10 out of 10). This is because the failure modes effects are considered catastrophic

70
when they occur in a MEMS device. Table 4.9 shows the assigned severity values for the failure
modes in this study.
Table 4.9
Failure Modes Severity
Item
Functional
ID
Potential Failure Mode Failure Mechanism Severity
1 Wear debris between rubbing
surfaces Humidity-Wear 10
2 Sticking of finger structures
due to surface forces Stiction 10
3 Internal fracture on structure Fatigue Stress 10
4 Finger and substrate adhesion Stiction 10
5 Surface adhesion Shock 10
6 Cracks and pores on the
surface
Humidity ,
Temperature 10
7 Internal structural stress Humidity-Wear 10
8 Collapse of electrodes due to
excessive deformation Stiction 10
9 Welding of the polysilicon
finger to the ground plane Fatigue Stress 10
10 Noise in sensor output Stiction 10
11 Sensor output variation with
temperature Shock 10
12 Mechanical obstruction of the
fingers Contamination 10
13 Internal aging of polysilicon Humidity -
Temperature 10
Failure Rate (λp): Assigned failure rate from the manufacturer reliability data.
Failure rates for ADXL180 accelerometers were available at www.analogdevices.com.
Table 4.10 depicts the failure rates in hours-1
from ADXL180 MEMS at different
temperatures, and a 90 % confidence level.

71
Table 4.10
Failure Rate from ADXL180 at 90% C.L
Failure Rate (λp) from ADXL180 at 90% C.L
Temperature C Failure Rate (1/hr)
-10 0
0 0
10 0.00001E-6
20 0.00002E-6
30 0.00005E-6
40 0.00013E-6
50 0.00028E-6
60 0.0006E-6
70 0.001E-6
80 0.002E-6
90 0.004E-6
100 0.0082E-6
110 0.014E-6
120 0.024E-6
130 0.041E-6
140 0.06745E-6
150 0.107E-6
In addition, Table 4.11 shows the failure rate values used for the three scenarios of this
investigation.
Table 4.11
Failure Rate for Scenarios
Failure Rate (λp) for Scenarios
50 0.00028E-6
100 0.0082E-6
150 0.107E-6

72
Failure Effect Probability (β): The beta (β) values were assumed by the author of this
research, based on the findings from the conducted literature research that suggest an
approach based on the probabilities of different failure mechanisms. Table 4.12 shows the
assigned values of beta (β) assumed in this investigation.
Failure Mode Ratio (α): Qualitative ratio of probability of failure. Table 4.12 shows the
assigned values of alpha (α) assumed in this investigation.
Table 4.12
Failure Effect Probability (β) and Failure Mode Ratio (α)
Item
Functional ID Failure Mode
Failure
Effect (β)
Failure Mode
Ratio (α)
1 Wear debris between
rubbing surfaces 0.25 0.025
2
Sticking of finger
structures due to surface
forces
0.50 0.175
3 Internal fracture on
structure 0.25 0.015
4 Finger and substrate
adhesion 0.50 0.15
5 Surface adhesion 0.25 0.05
6 Cracks and pores on the
surface 0.25 0.025
7 Internal structural stress 0.25 0.018
8 Collapse of electrodes due
to excessive deformation 0.25 0.125
9 Welding of the polysilicon
finger to the ground plane 0.50 0.02
10 Noise in sensor output 0.25 0.15
11 Sensor output variation
with temperature 0.50
0.07
12 Mechanical obstruction of
the fingers 0.25 0.1
13 Internal aging of
polysilicon 0.50 0.017
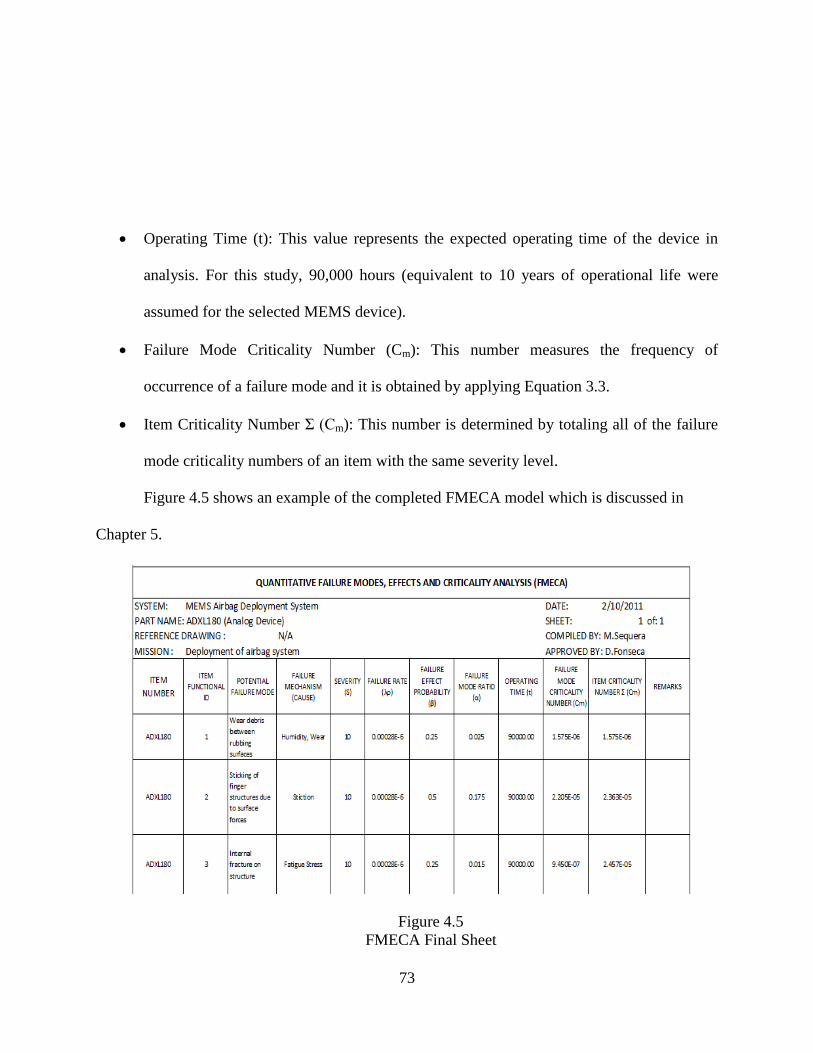
73
Operating Time (t): This value represents the expected operating time of the device in
analysis. For this study, 90,000 hours (equivalent to 10 years of operational life were
assumed for the selected MEMS device).
Failure Mode Criticality Number (Cm): This number measures the frequency of
occurrence of a failure mode and it is obtained by applying Equation 3.3.
Item Criticality Number Σ (Cm): This number is determined by totaling all of the failure
mode criticality numbers of an item with the same severity level.
Figure 4.5 shows an example of the completed FMECA model which is discussed in
Chapter 5.
Figure 4.5
FMECA Final Sheet

74
4.6 Summary
This chapter described the implementation of the conceptual FMECA framework to
assess the criticality of key failure modes in MEMS accelerometers used in the automotive
industry. The conceptual implementation was accomplished by following the methodology
discussed in Chapter 3. In addition, three scenarios for the criticality analysis were defined as
well as the failure modes, failure mechanisms, severity and the variables to perform the FMECA
for class 1 MEMS accelerometers. Chapter 5 focuses on the results obtained from the
implementation of this conceptual framework.

75
CHAPTER 5
FMECA RESULTS AND VALIDATION
Once the conceptual framework was completed and reviewed, the criticality values for
key failure modes in MEMS accelerometers were obtained. This chapter discusses the results
obtained through the FMECA analysis. Also, the face validation of the results by an expert in
MEMS is briefly discussed as well.
5.1 MEMS FMECA Results
Following the previously explained FMECA methodology in chapters 3 and 4, the
Criticality Number (Cm) for every failure mode was obtained for the three described scenarios.
Equation 3.3 was used to obtain criticality values:
Cm = (β x α x λp x t) (3.3)
Where:
Cm = Failure mode criticality number
β = Conditional probability of the current failure mode
α = Failure mode ratio
λp = Item failure rate
t = Duration of applicable mission phase (expressed in hours)
As it was previously stated, the failure mode Criticality Number (Cm) is a relative
measure of the frequency of a failure mode. In essence, it is a mathematical means to rank the
importance of a failure mode effect, based on its failure rate. Table 5.1 shows the results from the
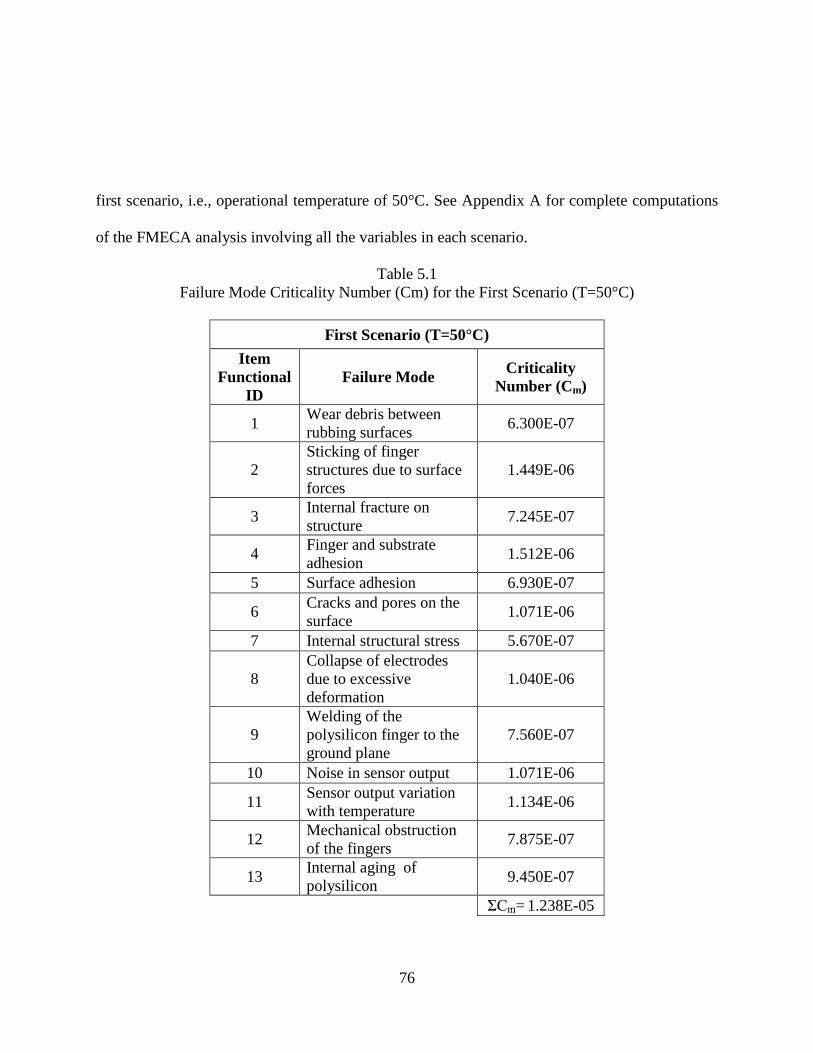
76
first scenario, i.e., operational temperature of 50°C. See Appendix A for complete computations
of the FMECA analysis involving all the variables in each scenario.
Table 5.1
Failure Mode Criticality Number (Cm) for the First Scenario (T=50°C)
First Scenario (T=50°C)
Item
Functional
ID
Failure Mode Criticality
Number (Cm)
1 Wear debris between
rubbing surfaces 6.300E-07
2
Sticking of finger
structures due to surface
forces
1.449E-06
3 Internal fracture on
structure 7.245E-07
4 Finger and substrate
adhesion 1.512E-06
5 Surface adhesion 6.930E-07
6 Cracks and pores on the
surface 1.071E-06
7 Internal structural stress 5.670E-07
8
Collapse of electrodes
due to excessive
deformation
1.040E-06
9
Welding of the
polysilicon finger to the
ground plane
7.560E-07
10 Noise in sensor output 1.071E-06
11 Sensor output variation
with temperature 1.134E-06
12 Mechanical obstruction
of the fingers 7.875E-07
13 Internal aging of
polysilicon 9.450E-07
ƩCm= 1.238E-05

77
Table 5.2 shows the results from the Second Scenario, where the operation temperature
was 100°C.
Table 5.2
Failure Mode Criticality Number (Cm) for the Second Scenario (T=100°C)
Second Scenario (T=100°C)
Item
Functional
ID
Failure Mode Criticality
Number (Cm)
1 Wear debris between
rubbing surfaces 3.32E-05
2
Sticking of finger
structures due to surface
forces
6.27E-05
3 Internal fracture on
structure 1.85E-05
4 Finger and substrate
adhesion 5.90E-05
5 Surface adhesion 1.66E-05
6 Cracks and pores on the
surface 5.17E-05
7 Internal structural stress 5.90E-05
8
Collapse of electrodes
due to excessive
deformation
6.64E-05
9
Welding of the
polysilicon finger to the
ground plane
2.77E-05
10 Noise in sensor output 5.35E-05
11 Sensor output variation
with temperature 5.54E-05
12 Mechanical obstruction
of the fingers 2.21E-05
13 Internal aging of
polysilicon 3.69E-05
ƩCm= 5.627E-04

78
Table 5.3 shows the results from the Third Scenario, i.e., operational temperature of
150°C.
Table 5.3
Failure Mode Criticality Number (Cm) for the Third Scenario (T=150°C)
Third Scenario (T=150°C)
Item
Functional
ID
Failure Mode Criticality
Number (Cm)
1 Wear debris between
rubbing surfaces 3.611E-04
2
Sticking of finger
structures due to surface
forces
1.445E-03
3 Internal fracture on
structure 2.408E-04
4 Finger and substrate
adhesion 9.630E-04
5 Surface adhesion 1.204E-04
6 Cracks and pores on the
surface 4.334E-04
7 Internal structural stress 1.083E-03
8
Collapse of electrodes
due to excessive
deformation
1.445E-03
9
Welding of the
polysilicon finger to the
ground plane
4.815E-04
10 Noise in sensor output 1.445E-03
11 Sensor output variation
with temperature 1.083E-03
12 Mechanical obstruction
of the fingers 4.815E-04
13 Internal aging of
polysilicon 7.223E-04
ƩCm= 1.171E-02

79
5.2 Analysis of the FMECA Results
Past studies of accelerated life testing mentioned in Chapter 4 demonstrated that failure
mechanisms in MEMS accelerometers are as unique as their internal structures. MEMS
accelerometers are robust to failure mechanisms such as fatigue, and wear, for having no moving
components internally. In addition, other experiments showed that the failure modes in MEMS
are dependant to temperature and humidity. Stiction and adhesion were also mentioned as the
predominant failure mechanisms in MEMS accelerometers. The results of this study show nearly
perfect agreement with the previous premises.
5.2.1 Analysis of the Item Criticality Number (Cr)
As it was defined in Chapter 4, the Item Criticality Number (Cr) is determined by totaling
all of the failure modes Criticality Numbers (Cm) with the same severity level. Table 5.4 shows
the Item Criticality Numbers(Cr) results obtained for the three scenarios.
Table 5.4
Item Criticality Numbers (Cr)
Scenarios Item Criticality
Number (Cr)
Scenario 1
at 50 °C 1.238E-05
Scenario 2
100 °C 5.627E-04
Scenario 3
150 °C 1.171E-02

80
In order to analyze the variation of the Item Criticality Number (Cr) and the way that
temperature affects each scenario, a Theoretical Maximum Criticality Number (CMmax) was
determined. This number was calculated by using Equation 5.1:
CMmax = (βmax x αmax x λpmax x t) (5.1)
Where:
CMmax = Theoretical Maximum Criticality Number
βmax = Maximum conditional probability of the current failure mode
αmax = Maximum failure mode ratio
λpmax = Item failure rate
t = Duration of applicable mission phase (expressed in hours)
This calculation is considered the worst scenario and the maximum possible value of the
criticality for the device. The βmax equals 1 by considering the highest probability of the effect.
Similarly, the failure mode ratio αmax equals 1. Finally, λpmax corresponds to the failure rate value
given by the manufacturer at the highest operational temperature condition (i.e., 0.176E-06 hr-1
).
Hence, the Theoretical Maximum Criticality Number (CMmax) was calculated as follows:
CMmax = (1 x 1 x 0.107E-6 hr-1
x 90,000hrs) (5.2)
CMmax = 9.63E-02
The Item Criticality Number (Cr) obtained from the three different scenarios were divided
by the CMmax to obtain the percentage of the Theoretical Maximum Criticality Number (%CMmax)
for each scenario (Equation 5.3).

81
% CMmax= Cr / CMmax (5.3)
Table 5.5 shows the % maximum values under different temperatures of operation in
MEMS accelerometers.
Table 5.5
Percentage of the Theoretical Maximum Criticality Number (%CMmax)
Scenarios Item Criticality
Number (Cr)
% of the Theoretical
Maximum Criticality
Number (%CMmax)
Scenario 1
at 50 °C 1.238E-05 0.0128
Scenario 2
100 °C 5.627E-04 0.58
Scenario 3
150 °C 1.171E-02 12.16
In the First Scenario, the Item Criticality Number (Cr) represents a 0.0128% of the
Theoretical Maximum Criticality Number (CMmax). The Failure Rate (λp), the Failure Mode
Effect probability (β), and the Failure Mode Ratio (α) have lower values for the assumed
temperature of 50°C (See Appendix A). In conclusion, the obtained values means that the failure
modes presented in the First Scenario at 50° C are not critically affected by the temperature, and
do not represent a high risk of failure to the ADXL180 MEMS accelerometer.
In the Second Scenario, the Item Criticality Number (Cr) increases considerably to 0.58%
of the Theoretical Maximum Criticality Number (CMmax). In this case, the Failure Rate (λp), the
Failure Mode Effect probability (β), and the Failure Mode Ratio (α) are increased for the

82
assumed temperature of 100°C (See Appendix B). At this point the failure modes suffer an initial
degradation process that activates failure mechanisms such as stiction, wear, and contamination.
In the Third Scenario, the Item Criticality Number (Cr) increases dramatically from
0.58% to 12.16% of the Theoretical Maximum Criticality Number (CMmax). For this scenario, the
Failure Rate (λp), the Failure Mode Effect probability (β), and the Failure Mode Ratio (α) are
increased to the maximum value for operational conditions of a temperature of 150°C (See
Appendix C). This result clearly indicates that higher temperatures accelerated failure modes in
MEMS. Also, failure mechanisms such as stiction, adhesion, and wear can affect the device.
5.2.2 Individual Failure Modes Analysis
Individual failure mode analysis was performed by comparing the obtained data from
tables 5.1, 5.2 and 5.3. To measure the change in the respective criticality numbers, an Increment
Index (II) was created to compare the result for each scenario. Equation 5.4 was used to obtain
the Increment Index (II) results in the Table 5.6:
II = Final Cm Value – Initial Cm Value / Initial Cm Value (5.4)
Table 5.6 shows the failure mode’s Increment Index (II) values from the First Scenario
(50 °C) to the Second Scenario (100°C). In addition, Table 5.7 shows the rankings for the failure
modes with the highest Increment Index (II). The highest II was that of Item 7 with an II of

83
103.13 times the criticality number at 50°C. Other failure modes such as items 8, 1, 10, 11, 6,
and 2 have considerably high Increment Index (II).
These results confirm the premise that MEMS accelerometers are highly dependent on
the temperature changes.
Table 5.6
Failure Modes Increment Index (II) from 50°C to 100°C
Item
Id Failure Mode Scenario 1 Scenario 2 II
1 Wear debris between
rubbing surfaces 6.300E-07 3.321E-05 51.71
2
Sticking of finger
structures due to surface
forces
1.449E-06 6.273E-05 42.29
3 Internal fracture on
structure 7.245E-07 1.845E-05 24.47
4 Finger and substrate
adhesion 1.512E-06 5.904E-05 38.05
5 Surface adhesion 6.930E-07 1.661E-05 22.96
6 Cracks and pores on the
surface 1.071E-06 5.166E-05 47.24
7 Internal structural stress 5.670E-07 5.904E-05 103.13
8 Collapse of electrodes due
to excessive deformation 1.040E-06 6.642E-05 62.90
9
Welding of the
polysilicon finger to the
ground plane
7.560E-07 2.768E-05 35.61
10 Noise in sensor output 1.071E-06 5.351E-05 48.96
11 Sensor output variation
with temperature 1.134E-06 5.535E-05 47.81
12 Mechanical obstruction of
the fingers 7.875E-07 2.214E-05 27.11
13 Internal aging of
polysilicon 9.450E-07 3.690E-05 38.05

84
Table 5.7
Failure Modes Increment Index (II) Ranking from 50°C to 100°C
Item
ID Failure Mode
Increment
Index (II) Ranking
7 Internal structural stress 103.13 1
8 Collapse of electrodes due to excessive
deformation 62.90 2
1 Wear debris between rubbing surfaces 51.71 3
10 Noise in sensor output 48.96 4
11 Sensor output variation with temperature 47.81 5
6 Cracks and pores on the surface 47.24 6
2 Sticking of finger structures due to surface
forces 42.29 7
4 Finger and substrate adhesion 38.05 8
13 Internal aging of polysilicon 38.05 9
9 Welding of the polysilicon finger to the
ground plane 35.61 10
12 Mechanical obstruction of the fingers 27.11 11
3 Internal fracture on structure 24.47 12
5 Surface adhesion 22.96 13
Table 5.8 shows the failure mode’s Increment Index (II) values from the Second Scenario
(100 °C) to the Third Scenario (150°C). Table 5.9 shows the rankings for the failure modes with
the highest Increment Index (II). The highest II corresponds to that of Item 10 with an II of 26
times the criticality number at 100°C. In this case, the II indexes were lower than the ones
showed in Table 5.7. This effect occurs because the failure mechanisms acceleration factor is

85
more aggressive when the device is changing from normal operations temperatures to values
closed to the absolute maximum temperature value.
Table 5.8
Failure Modes Increment Index (II) from 100°C to 150°C
Item
Id Failure Mode Scenario 2 Scenario 3 II
1 Wear debris between
rubbing surfaces 3.321E-05 3.611E-04 9.87
2
Sticking of finger
structures due to surface
forces
6.273E-05 1.445E-03 22.03
3 Internal fracture on
structure 1.845E-05 2.408E-04 12.05
4 Finger and substrate
adhesion 5.904E-05 9.630E-04 15.31
5 Surface adhesion 1.661E-05 1.204E-04 6.25
6 Cracks and pores on the
surface 5.166E-05 4.334E-04 7.39
7 Internal structural stress 5.904E-05 1.083E-03 17.35
8 Collapse of electrodes due
to excessive deformation 6.642E-05 1.445E-03 20.75
9
Welding of the
polysilicon finger to the
ground plane
2.768E-05 4.815E-04 16.40
10 Noise in sensor output 5.351E-05 1.445E-03 26.00
11 Sensor output variation
with temperature 5.535E-05 1.083E-03 18.57
12 Mechanical obstruction of
the fingers 2.214E-05 4.815E-04 20.75
13 Internal aging of
polysilicon 3.690E-05 7.223E-04 18.57

86
Table 5.9
Failure Modes Increment Index (II) Ranking from 100°C to 150°C
Item
ID Failure Mode
Increment
Index (II) Ranking
10 Noise in sensor output 26.00 1
2 Sticking of finger structures due to surface
forces 22.03 2
8 Collapse of electrodes due to excessive
deformation 20.75 3
12 Mechanical obstruction of the fingers 20.75 4
11 Sensor output variation with temperature 18.57 5
13 Internal aging of polysilicon 18.57 6
7 Internal structural stress 17.35 7
9 Welding of the polysilicon finger to the
ground plane 16.40 8
4 Finger and substrate adhesion 15.31 9
3 Internal fracture on structure 12.05 10
1 Wear debris between rubbing surfaces 9.87 11
6 Cracks and pores on the surface 7.39 12
5 Surface adhesion 6.25 13
5.3 Face Validation of the Conceptual Framework
Face validation is a commonly used technique for the validation of conceptual studies. It
is used about thirty percent of the time. Face validation is an approach for checking a model by
inquiring domain experts about a specific problem situation, and contrasting their answers
against those provided by the developed prototype system (O’Leary, 1987) .

87
Face validation was used in this conceptual framework for the assessment of the criticality of key
failure modes in MEMS accelerometers. An expert with broad experience in MEMS devices
reviewed and validated the results of this research.
Dr. Nima Mahmoodi, Assistant Professor of the Department of Mechanical Engineering
at The University of Alabama conducts research in the areas of dynamics, vibrations, and control
of mechanical systems. His current research is focused on piezoelectrically-actuated
nanomechanical biosensors, nonlinear vibrations and controls with application to MEMS, energy
harvesting using smart materials, active vibration control of structures with piezoelectric
actuators, and vibration control of alternative energy sources such as wind turbine and solar
concentrator. Dr. Mahmoodi serves as the Director of the University of Alabama’s Nonlinear
Intelligent Structures laboratory (NIS).
Dr. Mahmoodi commented that the methodology followed in this study is highly
applicable to MEMS. He found the project’s promising for future applications to other MEMS
devices. He also pointed out that the results obtained in this investigation agree with the results
reported by previous studies e.g., (Sandia National Laboratories, 2000; Tanner, 1999; Hartzell et
al., 1999).
5.4 Summary
This chapter discussed the results obtained by the application of the developed conceptual
framework for the assessment of key failure modes in MEMS accelerometers. The results for the
three scenarios were analyzed and discussed. In addition, a Theoretical Maximum Criticality

88
Number (CMmax) was calculated to evaluate the Item Criticality Number (Cr) values from the
three studied scenarios.
An Increment Index (II) was calculated to study the effect of the temperature on each
identified failure mode. Finally, this chapter described the validation phase of the project by an
expert in MEMS from the University of Alabama.
The results of this investigation show agreement with the reported results by other studies
such as Sandia’s National Laboratories accelerated life tests in MEMS accelerometers. Thus, it
was established that the developed conceptual framework is applicable to the MEMS domain.

89
CHAPTER 6
CONCLUSIONS AND FUTURE RESEARCH
The main objective of this research was the development of a conceptual framework for
the assessment of the criticality of key failure modes in MEMS accelerometers. This conceptual
framework represents a straightforward step by step methodology that can be easily applied to
other MEMS devices. It represents a new approach for the criticality analysis of failures in
microsystems.
The results obtained in this investigation were conclusive. MEMS failure modes are
dependent on temperature variation. Temperature affects MEMS failure mechanisms in a
different manner though. The failure modes related to stiction, wear, and adhesion were the most
impacted. The attained results were in agreement with those reported by Sandia National
Laboratories (2000) through Accelerated Life Testing.
6.1 Key Benefits of the Study
The developed conceptual framework represents a step forward in reliability engineering
applied to microsystems. The most important breakthrough from this study is the implementation
of a methodology commonly used in macrosystems to the microsystems domain.
The proposed conceptual framework can be used to evaluate failure mode criticality
under various performance conditions by adjusting the involved parameters accordingly. Also,
This FMECA methodology is also suitable for the design and manufacturing of MEMS devices

90
if probabilistic reliability models for the mechanisms that make up the analyzed device are
available.
This method represents a new approach to determine the criticality of failure modes in
MEMS. Contrary to Accelerated Life Testing (ALT), the developed FMECA framework
provides a mathematical means to understand how given variables such as temperature, vibration
and shock can affect a micro device.
6.2 Recommendations for Future Research
Although this research represents a first attempt to apply a conceptual framework for the
assessment of the criticality of key failure modes in MEMS, the achievements of this study can
be enhanced through the following recommendations.
This project considered only three scenarios originated from different operational
temperatures. Nonetheless, there are several other factors such as vibration and humidity that can
be incorporated in a later effort.
The application of the proposed FMECA framework in either the design or the
micromachining stages of MEMS devices should be investigated. Techniques such as
Accelerated Life Testing (ALT) or stochastic reliability models should be used to determine
more accurate mechanism failure rates that the ones used in this study.
The use of well-known decision-making models based in risk-assessment theory such as
the Analytical Hierarchical Procedure (AHP) and Fuzzy Logic (FL) as an alternative to FMECA
should be explored. In addition, The findings of this study should be extended to the assessment

91
of key criticality failure modes beyond Class 1 MEMS (i.e. classes 2, 3 and 4). Finally, more
complex mathematical paradigms such as Entropy Theory and Markovian Reasoning might be
considered for the evaluation of the effects of operational variables (vibration, and
mechanical/electrical shock particularly) in MEMS.

92
REFERENCES
Andrejasic, M., MEMS Accelerometers, Slovenia: University of Ljubljana, Department
of Physics, 2008.
Analog Devices, Reliability Data for ADXL180 Accelerometers,
http://www.analog.com/en/quality-and-reliability/reliabilitydata/content/index.html,
March 10, 2011.
Arney, S., Designing For MEMS Reliability. MRS Bulletin. Vol. 26, no. 4, pp. 296-299.
2001.
Bazu, M., Galateanu, L., Ilian, V., Loicq, J., Habraken, S., Collete, J., Quantitative
Accelerated Life Testing of MEMS Accelerometers.
Beegle, R., Brocato, R., Grant, R., IMEMS Accelerometer Testing – Test Laboratory
Development and Usage, IEEE, International Test Conference, 1999.
Beauregard, M., Mcdermott, R., Mikulak, R., Basics of FMEA, Productivity Press,
United States, 1996.
Bhaduri, D., Shukla, S., Graham, P., Gokhale, M., Comparing Reliability-Redundancy
Tradeoffs for Two Von Neumann Multiplexing Architectures, IEEE Transactions
on Nanotechnology, Vol.6, No 3, p.265-279, May 2007.
Bhushan, B., Springer Handbook of Nanotechnology, New York: Springer. 2007.
Brown, S., Van Arsdell, W., Muhlstein, C., Materials Reliability in MEMS Devices,
IEEE, Solid State Sensors and Actuators, Vol 1, p 591 – 593 , 1997.
Brown, T., Davis, B., Dynamic High G Loading of MEMS Sensors: Ground and Flight
Testing, SPIE Conference on Materials and Device Characterization in
Micromachining, Santa Clara, CA, September 1998.
De Boer, M., Knapp, J., Redmond, J., Michalske, T., Maboudian, R., Adhesion
Hysteresis and Friction in MEMS Under Controlled Humidity Ambients, ASME
IMECE conference in Anaheim, CA, Symposium on Microscale Mechanics of
Materials and Structures, Nov. 1998.

93
Department of the Army., TM 5-698-4 Failure Modes, Effects and Criticality Analysis
(FMECA) for Command, Control, Communications, Computer, Intelligence,
Surveillance, and Reconnaissance (C4ISR) Facilities, 29 September 2006.
Department of Defense., MIL-STD-1629A Procedures for Performing a Failure Mode,
Effects, and Criticality Analysis, 1998.
DiBenedetto, A., The Structure and Properties of Materials, McGraw-Hill, United States
of America, 1967.
Dixon, R., Automotive MEMS Sensor Market to Reach Record High in 2010, Isupply,
2010.
Dodson, B., Nolan, D., Reliability Engineering Handbook, Quality Publishing, Tucson,
Arizona, 1999.
Eubanks, C., Kmenta, S., Ishii, K., System Behavior Modeling As a Basis For Advanced
Failure Modes and Effect Analysis, Proceedings of The 1996 ASME Design
Engineering Technical Conferences and Computers in Engineering Conference,
Irvine, CA, p 1-8, August 18-22 1996.
Fitzgerald, A., Pierce, D., Huigens, B., White, C., A General Methodology to Predict the
Reliability of Single-Crystal Silicon MEMS Device, IEEE, Journal of
Microelectromechanical Systems, Vol 18, No 4, August 2009.
Fonseca, D., Knapp, G., An Expert System for Reliability Centered Maintenance in the
Chemical Industry, Elsevier , Expert Systems with Applications, p 45-47, 2000.
Frei, F., Harker, P., Measuring aggregate process performance using AHP, European
Journal of Operational Research, Volume 116, Issue 2, Pages 436-442,16 July
1999.
Grandzol, J, Improving the Faculty Selection Process in Higher Education: A Case for
the Analytic Hierarchy Process, Association for Institutional Research, Volume 6,
2005.
Hartzell, A., Delak, K., Bova, P., Woodilla, D., Analysis of Manufacturing Scale MEMS
Reliability Testing, SPIE Conference on MEMS Reliability for Critical and Space
Applications, Santa Clara, CA, p 165-174, September 1999.

94
Hsu, T., Reliability in MEMS Packaging, 44th International Reliability Physics
Symposium, San Jose, CA, March 26-30, 2006.
Jadaan, O., Nemeth, N., Bagdhan, J., Sharpe, W., Probabilistic Weibull Behavior and
Mechanical Properties of MEMS Brittle Materials, Journal of Materials Science,
Vol 38, p 4087-4113, 2003.
Keller, J., Gollhardt, A., Vogel, D., Michel, B., Nanoscale Deformation Measurements
for Reliability Analysis of Sensors, Proceedings of the SPIE, the International
Society for Optical Engineering, 2005, Unpublished.
Kimura, F., Hata, T., Kobayashi, N., Reliability-Centered Maintenance Planning based
on Computer-Aided FMEA, The 35th CIRP-International Seminar on
Manufacturing Systems, Seoul, Korea,12-15 May 2002.
Kmenta, S., Ishii, K., Advanced FMEA Using Meta Behavior Modeling For Concurrent
Design of Products and Controls, Proceedings of DETC, ASME Design
Engineering Technical Conferences, Atlanta, GA, p 1-9, September 13-16, 1998.
Kumar, P., Analytic Hierarchy Process Analyzes Risk of Operating Cross-Country
Petroleum Pipelines in India, Natural Hazards Review, Technical Papers, Volume
4 , Issue 4, 2003.
Mastrangelo, C., Hsu. C., Mechanical stability and adhesion of microstructures under
capillary forces––part I: basic theory, JMEMS, Vol 2, p 33, 1993.
Monk, D.J., MEMS Physical Sensors for Automotive Applications, Arizona: Motorola,
Motorola Sensor Products Division. 2002.
Muller, R., Wagner, U., Bernhard, W., Reliability of MEMS-a methodical approach,
Proc.11th European symposium on reliability of electron devices, failure physics
and analysis, p.1657-62, 2001.
Miller, W., Tanner, D., Miller, S., Peterson, K., MEMS Reliability: The Challenge and
the Promise, 4th Annual "The Reliability Challenge," Dublin, Ireland, p. 4.1-4.7,
May 19, 1998.
Miller, S., Rodgers, M., LaVigne, G., Sniegowski, J., Clews, P., Tanner, D., Peterson, K.,
Failure Modes in Surface Micromachined MicroElectroMechanical Actuators,
IEEE International Reliability Physics Symposium Proceedings, IRPS 1998, p.
17-25, March 31-April 2 1998.

95
Miller, S., LaVigne, G., Rodgers, M., Sniegowski, J., Waters, J., McWorther, P., Routes
To Failure in Rotating MEMS Devices Experiencing Sliding Friction.
Proceedings of SPIE Micromachined Devices and Components III, Vol 3224,
Austin, p 24-30, Sep 29-30 1997.
Miller, S., Rodgers, M., LaVigne, G., Sniegowski, J., Clews, P., Tanner, D., Failure
Modes in Surface Micromachined Microelectromechanical Actuators.
Proceedings of International Reliability Physics Symposium (IRPS), New York,
USA, p. 17, 1998Walraven, J. Failure mechanisms in MEMS, ITC International
Test Conference, Paper 33.1, 2003
Norman, G., Parker, D., Kwiatkowska, M., Shukla, S., Evaluating the Reliability of
Defect-Tolerant Architectures for Nanotechnology with Probabilistic Model
Checking. Proceedings of the 17th International Conference on VLSI Design,
Birmingham, United Kingdom, 1063-9667, 2004.
Lee, J., Tang, W., Barnes, C., Total Dose Effects on Micro Electromechanical Systems
MEMS accelerometers. IEEE Transactions on Nuclear Science, 43(6):3127. 1996.
Lee, C., Johnston, A., Tang, W., Barnes, C., Total Dose Effects On
Microelectromechanical Systems (MEMS): Accelerometers. IEEE Trans Nucl
Sci, Vol 43(6), p 3127, 1996.
Luo, W., Sunardi, D., Kuo, Y., Kuo, W., Stress Testing and Characterization of High-K
Dielectric Thin Films, IEEE International, Integrated Reliability Workshop Final
Report, 2003, Unpublished.
Ohring, M., Reliability and Failure of Electronic Materials and Devices, United States of
America: Academic Press. 1998.
O’Conner., Practical Reliability Engineering, 3rd edition, Revised, John Wiley & Sons,
Chichester, England, 1996.
Otieno, W., Okogbaa, G., Reliability Modeling of Transistor Gates at the Nanoscale,
IEEE, Tampa, 2009.
O’Leary, D. E., “Validation of Expert Systems-With Applications to Auditing and
Accounting Expert Systems”, Decision Sciences, Vol. 18 (3), p 468, Summer.
1987.
Pan, J., MEMS and Reliability, Carnegie Mellon University, 1999.

96
Price, C., Pugh, D., Wilson, M., Snooke, N., The Flame system: automating electrical
failure mode and effects analysis (FMEA), IEEE, Proceedings of Reliability and
Maintainability, p 90-95, 1995.
PTC., Introduction to Relex 10, United States, 2010.
Pomeroy, J., Gkotsis, P., Zhu, M., Leighton, G., Kirby, P., Kuball, M., Dynamic
Operational Stress Measurement of MEMS Using Time-Resolved Raman
Spectroscopy, IEEE, Journal of Microelectromechanical Systems, Vol 17, No 6, p
1315 - 1321 December 2008.
Ritchie, R., Kruzic, J., Muhlstein, C., Nalla, R., Stach, E., Characteristic Dimensions and
the Micro-Mechanisms of Fracture and Fatigue in Nano and Bio Materials,
International Journal of Fracture, Vol 128, No 1, p 1-15, 2004.
Schwalke, U., Polzl, M., Sekinger, T., Kerber, M., Ultra Thick Gate Oxides: Charge
Generation and its impact on Reliability, Microelectronics Reliability, Vol 41, p
1007-1010, 2001.
Starman, L., Busbee, J., Reber, J., Lott, J., Cowan, W., Vandelli, N., Stress measurement
in MEMS devices, 2001 International Conference on Modeling and Simulation of
Microsystems - MSM , p 398 – 401, 2001.
Sharpe, W., Bagdahn, J., Fatigue of Materials Used in Microelectromechanical Systems
(MEMS). 8th International Congress on Fatigue, Stockholm, 2002.
Shea, H., Reliability of MEMS for space applications, Proceedings. of SPIE, 2006.
Stark, B., MEMS Reliability Assurance Guidelines for Space Applications, National
Aeronautics and Space Administration (NASA) and Jet Propulsion Laboratory
(JPL). Pasadena, California: California Institute of Technology, USA, 1999.
Schubert, M., SAE G-11: Reliability, Maintainability, and Supportability Guidebook.
April 1992.
SAE., J1739 Potential Failure Mode and Effects Analysis in Design (Design FMEA) and
Potential Failure Mode and Effects Analysis in Manufacturing and Assembly
Processes (Process FMEA) and Effects Analysis for Machinery (Machinery
FMEA), SAE Standards, 2009.
Sandia National Laboratories., Report: MEMS Reliability: Infrastructure, Test Structures,
Experiments, and Failure Modes, Livermore: CA, 2000.

97
Tanner, D., Walraven, J., Dugger, M., Parson, T., Candeleria, S., Jenkins, M., Corwin,
A., Ohlhausen, J., Huffman, E., Accelerating Aging Failures in MEMS Devices
Proceedings of the 43rd International Reliability Physics Symposium, p 317-324,
2005.
Tanner, D., Walraven, J., Helgesen, K., Irwin, L., Gregory, D., Stake, J., Smith, N.,
MEMS Reliability in a Vibration Environment, Proceedings of IRPS, p 129-138.
2000.
Tanner, D., Walraven, J., Irwin, M., Smith, N., Eaton, W., Miller, W., Miller,
S., The Effect of Humidity on the Reliability of a Microengine, Proceedings of
IRPS, San Diego CA, p 189-197, 1999.
Tanner, D., MEMS reliability: Where Are We Now, Microelectronics Reliability 49, p
937-940, 2009.
Tanner, D., Smith, N., Bowman, D., Eaton, W., Peterson, A., First Reliability Test of a
Surface Micromachined Microengine Using SHiMMeR, Proceedings of SPIE,
Volume 3224, p 14-23, 1997.
Tanner, D., Miller, W., Eaton, W., Irwin, L., Peterson, K., Dugger, M., Senft, D., Smith,
N., Tangyunyong, P., Miller, S., The Effect of Frequency on the Lifetime of a
Surface Micromachined Microengine Driving a Load, 1998 IEEE International
Reliability Physics Symposium Proceedings, p 26-35, March 30 - April 2, 1998.
Tanner, D., Walraven, J., Helgesen, K., Irwin, L., Brown, F., Smith, N., Masters, N.,
MEMS Reliability in Shock Environments, Proceedings of IRPS, p 139-145.
2000.
Vallet, D., Failure Analysis Requirements for Nanoelectronics, IEEE Transactions on
Nanotechnology, Vol.1, No 3, p.117-121, Sep 2002.
Van Spengen, W., De Wolf, P., A physical model to predict stiction in MEMS. Journal of
Micromechanical Microengineering, 2002.
Van Spengen, W., MEMS Reliability From A Failure Mechanisms Perspective,
Microelectronics Reliability, Vol 43, p 1049–1060, 2003.
Walraven, J., Future Challenges for MEMS Failure Analysis, ITC International Test
Conference, paper 33.4, p 850-855,2003.

98
Walraven, J., Failure Mechanisms in MEMS , ITC International Test Conference, paper
33.1, p 828-832, 2003.
Zha, X., Toh, W., Du, H., Web-Enabled Database System Development for Design and
Manufacturing of Micro-Electro-Mechanical Systems (MEMS), International
Journal of Advanced Manufacturing Technology, p 378-392, 2006.
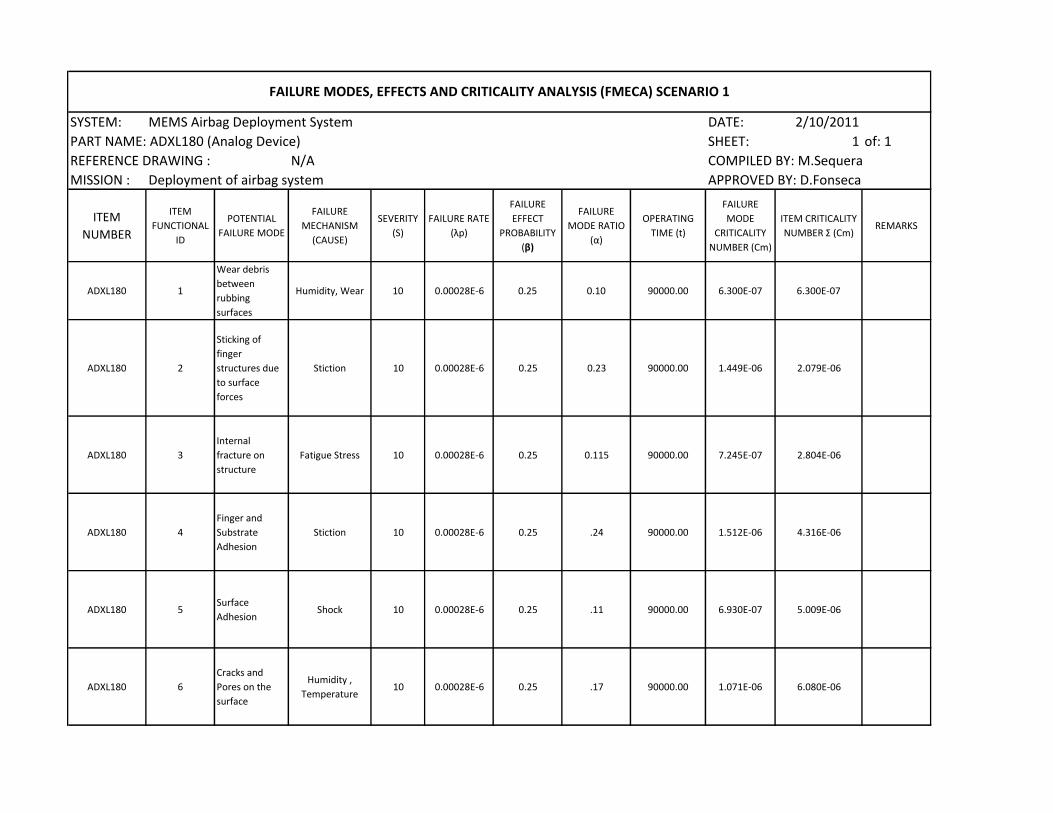
SYSTEM: MEMS Airbag Deployment System DATE: 2/10/2011
PART NAME: ADXL180 (Analog Device) SHEET: 1 of: 1
REFERENCE DRAWING : N/A COMPILED BY: M.Sequera
MISSION : Deployment of airbag system APPROVED BY: D.Fonseca
ITEM
NUMBER
ITEM
FUNCTIONAL
ID
POTENTIAL
FAILURE MODE
FAILURE
MECHANISM
(CAUSE)
SEVERITY
(S)
FAILURE RATE
(λp)
FAILURE
EFFECT
PROBABILITY
(β)
FAILURE
MODE RATIO
(α)
OPERATING
TIME (t)
FAILURE
MODE
CRITICALITY
NUMBER (Cm)
ITEM CRITICALITY
NUMBER Σ (Cm)REMARKS
ADXL180 1
Wear debris
between
rubbing
surfaces
Humidity, Wear 10 0.00028E-6 0.25 0.10 90000.00 6.300E-07 6.300E-07
ADXL180 2
Sticking of
finger
structures due
to surface
forces
Stiction 10 0.00028E-6 0.25 0.23 90000.00 1.449E-06 2.079E-06
ADXL180 3
Internal
fracture on
structure
Fatigue Stress 10 0.00028E-6 0.25 0.115 90000.00 7.245E-07 2.804E-06
ADXL180 4
Finger and
Substrate
Adhesion
Stiction 10 0.00028E-6 0.25 .24 90000.00 1.512E-06 4.316E-06
ADXL180 5Surface
AdhesionShock 10 0.00028E-6 0.25 .11 90000.00 6.930E-07 5.009E-06
ADXL180 6
Cracks and
Pores on the
surface
Humidity ,
Temperature10 0.00028E-6 0.25 .17 90000.00 1.071E-06 6.080E-06
FAILURE MODES, EFFECTS AND CRITICALITY ANALYSIS (FMECA) SCENARIO 1

SYSTEM: MEMS Airbag Deployment System DATE: 2/10/2011
PART NAME: ADXL180 (Analog Device) SHEET: 2 of: 2
REFERENCE DRAWING : N/A COMPILED BY: M.Sequera
MISSION : Deployment of airbag system APPROVED BY: D.Fonseca
ITEM
NUMBER
ITEM
FUNCTIONAL
ID
POTENTIAL
FAILURE MODE
FAILURE
MECHANISM
(CAUSE)
SEVERITY
(S)
FAILURE RATE
(λp)
FAILURE
EFFECT
PROBABILITY
(β)
FAILURE
MODE RATIO
(α)
OPERATING
TIME (t)
FAILURE
MODE
CRITICALITY
NUMBER (Cm)
ITEM CRITICALITY
NUMBER Σ (Cm)REMARKS
ADXL180 7Internal
structural stressHumidity, Wear 10 0.00028E-6 0.25 0.09 90000.00 5.670E-07 6.647E-06
ADXL180 8
Collapse of
electrodes due
to excessive
deformation
Temperature 10 0.00028E-6 0.25 0.165 90000.00 1.040E-06 7.686E-06
ADXL180 9
Welding of the
polysilicon
finger to the
ground plane
Fatigue Stress 10 0.00028E-6 0.25 0.12 90000.00 7.560E-07 8.442E-06
ADXL180 10Noise in sensor
outputStiction 10 0.00028E-6 0.25 0.17 90000.00 1.071E-06 9.513E-06
ADXL180 11Sensor output
variation with
temperature
Temperature 10 0.00028E-6 0.25 0.18 90000.00 1.134E-06 1.065E-05
ADXL180 12Mechanical
obstruction of
the fingers
Contamination 10 0.00028E-6 0.25 0.125 90000.00 7.875E-07 1.143E-05
ADXL180 13Internal aging
of Polysilicon
Humidity ,
Temperature10 0.00028E-6 0.25 0.15 90000.00 9.450E-07 1.238E-05
FAILURE MODES, EFFECTS AND CRITICALITY ANALYSIS (FMECA) SCENARIO 1

SYSTEM: MEMS Airbag Deployment System DATE: 2/10/2011
PART NAME: ADXL180 (Analog Device) SHEET: 1 of: 1
REFERENCE DRAWING : N/A COMPILED BY: M.Sequera
MISSION : Deployment of airbag system APPROVED BY: D.Fonseca
ITEM
NUMBER
ITEM
FUNCTIONAL
ID
POTENTIAL
FAILURE MODE
FAILURE
MECHANISM
(CAUSE)
SEVERITY
(S)
FAILURE RATE
(λp)
FAILURE
EFFECT
PROBABILITY
(β)
FAILURE
MODE RATIO
(α)
OPERATING
TIME (t)
FAILURE
MODE
CRITICALITY
NUMBER (Cm)
ITEM CRITICALITY
NUMBER Σ (Cm)REMARKS
ADXL180 1
Wear debris
between
rubbing
surfaces
Humidity, Wear 10 0.0082E-6 0.50 .09 90000.00 3.32E-05 3.32E-05
ADXL180 2
Sticking of
finger
structures due
to surface
forces
Stiction 10 0.0082E-6 0.50 0.17 90000.00 6.27E-05 9.594E-05
ADXL180 3
Internal
fracture on
structure
Fatigue Stress 10 0.0082E-6 0.25 0.10 90000.00 1.85E-05 1.144E-04
ADXL180 4
Finger and
Substrate
Adhesion
Stiction 10 0.0082E-6 0.50 0.16 90000.00 5.90E-05 1.734E-04
ADXL180 5Surface
AdhesionShock 10 0.0082E-6 0.25 .09 90000.00 1.66E-05 1.900E-04
ADXL180 6
Cracks and
Pores on the
surface
Humidity ,
Temperature10 0.0082E-6 0.50 0.14 90000.00 5.17E-05 2.417E-04
FAILURE MODES, EFFECTS AND CRITICALITY ANALYSIS (FMECA) SCENARIO 2

SYSTEM: MEMS Airbag Deployment System DATE: 2/10/2011
PART NAME: ADXL180 (Analog Device) SHEET: 2 of: 2
REFERENCE DRAWING : N/A COMPILED BY: M.Sequera
MISSION : Deployment of airbag system APPROVED BY: D.Fonseca
ITEM
NUMBER
ITEM
FUNCTIONAL
ID
POTENTIAL
FAILURE MODE
FAILURE
MECHANISM
(CAUSE)
SEVERITY
(S)
FAILURE RATE
(λp)
FAILURE
EFFECT
PROBABILITY
(β)
FAILURE
MODE RATIO
(α)
OPERATING
TIME (t)
FAILURE
MODE
CRITICALITY
NUMBER (Cm)
ITEM CRITICALITY
NUMBER Σ (Cm)REMARKS
ADXL180 7Internal
structural stressHumidity, Wear 10 0.0082E-6 0.50 0.16 90000.00 5.90E-05 3.007E-04
ADXL180 8
Collapse of
electrodes due
to excessive
deformation
Temperature 10 0.0082E-6 0.50 0.18 90000.00 6.64E-05 3.672E-04
ADXL180 9
Welding of the
polysilicon
finger to the
ground plane
Fatigue Stress 10 0.0082E-6 0.25 0.15 90000.00 2.77E-05 3.948E-04
ADXL180 10Noise in sensor
outputStiction
100.0082E-6 0.50 0.145 90000.00 5.35E-05 4.483E-04
ADXL180 11Sensor output
variation with
temperature
Temperature
10
0.0082E-6 0.50 0.15 90000.00 5.54E-05 5.037E-04
ADXL180 12Mechanical
obstruction of
the fingers
Contamination
10
0.0082E-6 0.25 0.12 90000.00 2.21E-05 5.258E-04
ADXL180 13Internal aging
of Polysilicon
Humidity ,
Temperature
10
0.0082E-6 0.50 0.1 90000.00 3.69E-05 5.627E-04
FAILURE MODES, EFFECTS AND CRITICALITY ANALYSIS (FMECA) SCENARIO 2

SYSTEM: MEMS Airbag Deployment System DATE: 2/10/2011
PART NAME: ADXL180 (Analog Device) SHEET: 1 of: 1
REFERENCE DRAWING : N/A COMPILED BY: M.Sequera
MISSION : Deployment of airbag system APPROVED BY: D.Fonseca
ITEM
NUMBER
ITEM
FUNCTIONAL
ID
POTENTIAL
FAILURE MODE
FAILURE
MECHANISM
(CAUSE)
SEVERITY
(S)
FAILURE RATE
(λp)
FAILURE
EFFECT
PROBABILITY
(β)
FAILURE
MODE RATIO
(α)
OPERATING
TIME (t)
FAILURE
MODE
CRITICALITY
NUMBER (Cm)
ITEM CRITICALITY
NUMBER Σ (Cm)REMARKS
ADXL180 1
Wear debris
between
rubbing
surfaces
Humidity, Wear 10 0.107E-6 0.75 .05 90000.00 3.611E-04 6.02E-05
ADXL180 2
Sticking of
finger
structures due
to surface
forces
Stiction 10 0.107E-6 0.75 0.20 90000.00 1.445E-03 1.505E-03
ADXL180 3
Internal
fracture on
structure
Fatigue Stress 10 0.107E-6 0.5 0.10 90000.00 4.815E-04 1.986E-03
ADXL180 4
Finger and
Substrate
Adhesion
Stiction 10 0.107E-6 0.75 0.20 90000.00 1.445E-03 3.431E-03
ADXL180 5Surface
AdhesionShock 10 0.107E-6 0.5 .05 90000.00 2.408E-04 3.671E-03
ADXL180 6
Cracks and
Pores on the
surface
Humidity ,
Temperature10 0.107E-6 0.75 0.18 90000.00 1.300E-03 4.971E-03
FAILURE MODES, EFFECTS AND CRITICALITY ANALYSIS (FMECA) SCENARIO 3

SYSTEM: MEMS Airbag Deployment System DATE: 2/10/2011
PART NAME: ADXL180 (Analog Device) SHEET: 2 of: 2
REFERENCE DRAWING : N/A COMPILED BY: M.Sequera
MISSION : Deployment of airbag system APPROVED BY: D.Fonseca
ITEM
NUMBER
ITEM
FUNCTIONAL
ID
POTENTIAL
FAILURE MODE
FAILURE
MECHANISM
(CAUSE)
SEVERITY
(S)
FAILURE RATE
(λp)
FAILURE
EFFECT
PROBABILITY
(β)
FAILURE
MODE RATIO
(α)
OPERATING
TIME (t)
FAILURE
MODE
CRITICALITY
NUMBER (Cm)
ITEM CRITICALITY
NUMBER Σ (Cm)REMARKS
ADXL180 7Internal
structural stressHumidity, Wear 10 0.107E-6 0.75 0.15 90000.00 1.083E-03 6.055E-03
ADXL180 8
Collapse of
electrodes due
to excessive
deformation
Temperature 10 0.107E-6 0.75 0.2 90000.00 1.445E-03 7.499E-03
ADXL180 9
Welding of the
polysilicon
finger to the
ground plane
Fatigue Stress 10 0.107E-6 0.5 0.1 90000.00 4.815E-04 7.981E-03
ADXL180 10Noise in sensor
outputStiction 10 0.107E-6 0.75 0.2 90000.00 1.445E-03 9.425E-03
ADXL180 11Sensor output
variation with
temperature
Temperature 10 0.107E-6 0.75 0.15 90000.00 1.083E-03 1.051E-02
ADXL180 12Mechanical
obstruction of
the fingers
Contamination 10 0.107E-6 0.5 0.1 90000.00 4.815E-04 1.099E-02
ADXL180 13Internal aging
of Polysilicon
Humidity ,
Temperature10 0.107E-6 0.75 0.1 90000.00 7.223E-04 1.171E-02
FAILURE MODES, EFFECTS AND CRITICALITY ANALYSIS (FMECA) SCENARIO 3