a consolidated method for the analysis of vocs in soil by
TRANSCRIPT

APPLICATION NOTE 73742
A consolidated method for the analysis of VOCs in soil by HS-GC-MS in analytical testing laboratories
Authors: David Lee and Cristian CojocariuThermo Fisher Scientific, Runcorn, UK
Keywords: Gas chromatography, GC, valve and loop, headspace, TriPlus 500 HS, single quadrupole mass spectrometer, ISQ 7000, MS, soil, environmental, EPA 5021, HJ642-2013, HJ736-2015
GoalTo develop and test a consolidated analytical method for the analysis of volatile organic compounds in soil using headspace (HS) gas chromatography (GC) single quadrupole mass spectrometry (MS), following the U.S. EPA 5021 sample preparation guidelines and aligned with the requirements of HJ642-2013 and HJ736-2015 Chinese standard methods.
IntroductionVolatile organic compounds (VOCs) are defined by the United States Environmental Protection Agency (U.S. EPA) as “any compound of carbon, excluding carbon monoxide, carbon dioxide, carbonic acid, metallic carbides or carbonates, and ammonium carbonate, which participate in atmospheric photochemical reactions.”1 VOCs are ubiquitous in the environment and they consist of many different classes, including both naturally occurring and man-made. Anthropogenic VOCs are generally used in fragrances, solvents, paints, cleaning materials and as fuels.2 Many of these compounds are considered toxic for the environment and can cause negative health effects
to humans.2 Compounds, such as trichloroethene and toluene, are of particular concern for the environment, especially when linked to contaminated soils and sediments which to remove to a safe limit would require costly site remediations. Detecting the level of VOC contamination in these types of samples can trigger the decision to potentially start site remediation, a costly process that relies on the accuracy of VOC measurements.
There are several methods available for the analysis of VOCs including U.S. EPA Method 524.4 for analysis in drinking water,3 TO-15 for analysis in air,4 and 8260 for analysis in a wide variety of matrices including water and soil.5 U.S. EPA Method 50216 provides a general purpose method for sample preparation of VOCs in soil and is utilized as the preparation method for Chinese standards HJ642-2013 and HJ736-2015.

2
One major challenge for contract testing labs is having to satisfy the requirements of multiple standards. This leads to multiple methods for the analysis of VOCs, increasing the time spent on sample preparation. Multiple instruments and operators are required, adding to the cost per sample that can impact the competitiveness of the lab. As well as cost, sample turn-around times are also impacted due to the additional time required for data processing, instrument maintenance and cross training.
In the experiments described here a robust, cost effective, time efficient and sensitive consolidated analytical method was developed and tested for the analysis of 61 VOCs in soil samples by HS-GC-MS within analytical testing laboratories. The method combines the HJ642-2013, HJ736-2015, and EPA 5021 standards with a significant time saving and reduced cost per sample.
ExperimentalInstrument and method setupThe Thermo Scientific™ TRACE™ 1310 gas chromatograph was coupled with a Thermo Scientific™ ISQ™ 7000 single quadrupole mass spectrometer. The Thermo Scientific™ TriPlus™ 500 valve and loop headspace autosampler was used for VOC extraction and sampling into the GC-MS system. Chromatographic separation was achieved on a Thermo Scientific™ TraceGOLD™ TG-624 60 m × 0.25 mm × 1.4 µm column (P/N 26085-3330). The TriPlus 500 HS is directly connected to the analytical column by-passing the GC inlet, significantly reducing the sample path and optimizing the sample transfer. Full instrument conditions can be found in Table 1.
Table 1a. GC instrument conditions
Standard and sample preparationSeparate custom mixed standard solutions of analytes and internal standards, all at 2000 µg/mL in methanol, were purchased from LGC Ltd. UK. A standard stock solution containing 61 VOCs was prepared and diluted in methanol to obtain seven calibration standards ranging from 5 to 250 μg/mL. The internal standard stock solution was diluted in methanol to a final concentration of 25 μg/mL and used to spike the VOCs calibration solutions.
A matrix modifying solution was prepared by adding concentrated phosphoric acid to 1 L of deionized water (resistance 18.2 MΩ) until the pH was 2.0. The solution was saturated with HPLC grade sodium chloride.
Calibration standards were prepared by adding 2 g of quartz sand, 10 mL of matrix modifying solution and a 4 µL aliquot of the appropriate standard solution to a 20 mL headspace vial (P/N 20-CV) and sealed with magnetic caps (P/N 20-MCBC). This produced standards in the range 10–500 µg/kg (ppb) with internal standards at 50 µg/kg.
Samples were prepared by adding 2 g of locally sourced soil to a 20 mL headspace vial and adding 10 mL of matrix modifying solution and 4 µL of internal standard. The vials were then sealed with magnetic caps for analysis.
TRACE 1310 parameters
Carrier gas He
Column flow 2 mL/min constant flow
Inlet mode Split
Split flow 40 mL/min
Column TG-624, 60 m × 0.25 mm × 1.4 µm
Oven temp. program
Temperature 1 Temperature 2 Temperature 3
Rate (°C/min) Target temp. (°C) Hold time (min) - 40 5 6 120 0 20 250 5
Run time 29.4 min
TriPlus 500 HS parameters
Vial incubation temperature 60 °C
Vial incubation time 30 min
Vial shaking Medium
Vial pressurization mode Pressure
Vial pressure 160 kPa
Vial pressure equilibration time 1 min
Loop/sample path temperature 110 °C
Loop pressure 100 kPa
Loop equilibration time 1 min
Injection mode Standard
Injection time 1 min
ISQ 7000 parameters
Transfer line temperature 240 °C
Ion source temperature 300 °C
Mass range 35–300 m/z
Ionization mode EI @70 eV
Acquisition type Full scan
Dwell time 0.2 s
Solvent delay 2.5 min
Table 1b. Headspace autosampler instrument conditions
Table 1c. MS instrument conditions

3
Figure 1. Screenshot of the BFB tune report showing injection details, obtained mass spectrum, and the criteria and results for a passing BFB tune at the start of analysis
Data acquisition, processing and reportingThe data were acquired in full scan, processed, and reported using the Thermo Scientific™ Chromeleon™ Chromatography Data System (CDS) software, version 7.3. Integrated instrument control ensures full automation from instrument setup, to raw data processing, reporting, and storage with all calculations performed within the software. Simplified eWorkflows™ deliver effective data management ensuring ease of use, data integrity, and full traceability. Intelligent run control allows actions to be taken automatically by the software during a sequence in case of SST failure, such as pausing or aborting a sequence, saving the vials to analyze later. Chromeleon CDS also offers the option to scale up the entire analytical process in the laboratory from a single workstation to an enterprise environment.
Results and discussionTuningBefore analysis, the ISQ 7000 system was automatically tuned using bromofluorobenzene (BFB). Chromeleon CDS makes the ongoing monitoring of the BFB tune easy with the report designer feature, allowing automatic pass/fail assessment. An example is shown in Figure 1.
ChromatographyConsistent retention times, Gaussian chromatographic peak shape, and repeatable peak areas are essential to provide reliable identification and quantitation. An example of the achieved chromatographic separation is reported in Figure 2.

4
Figure 2. Extracted ion chromatogram of quantitation ions of a 50 µg/kg standard showing retention times 3–19 minutes (top) and 19–26 minutes (bottom). Peak names are given in Appendix 1.
5
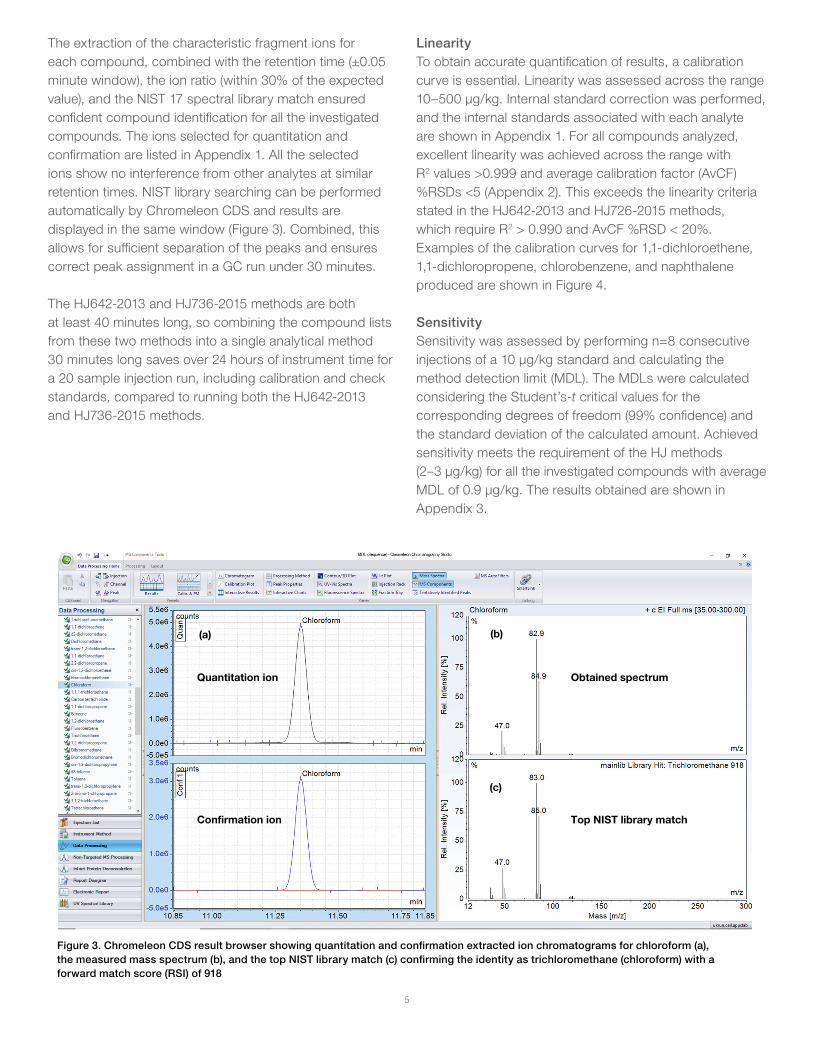
The extraction of the characteristic fragment ions for each compound, combined with the retention time (±0.05 minute window), the ion ratio (within 30% of the expected value), and the NIST 17 spectral library match ensured confident compound identification for all the investigated compounds. The ions selected for quantitation and confirmation are listed in Appendix 1. All the selected ions show no interference from other analytes at similar retention times. NIST library searching can be performed automatically by Chromeleon CDS and results are displayed in the same window (Figure 3). Combined, this allows for sufficient separation of the peaks and ensures correct peak assignment in a GC run under 30 minutes.
The HJ642-2013 and HJ736-2015 methods are both at least 40 minutes long, so combining the compound lists from these two methods into a single analytical method 30 minutes long saves over 24 hours of instrument time for a 20 sample injection run, including calibration and check standards, compared to running both the HJ642-2013 and HJ736-2015 methods.
LinearityTo obtain accurate quantification of results, a calibration curve is essential. Linearity was assessed across the range 10–500 µg/kg. Internal standard correction was performed, and the internal standards associated with each analyte are shown in Appendix 1. For all compounds analyzed, excellent linearity was achieved across the range with R2 values >0.999 and average calibration factor (AvCF) %RSDs <5 (Appendix 2). This exceeds the linearity criteria stated in the HJ642-2013 and HJ726-2015 methods, which require R2 > 0.990 and AvCF %RSD < 20%. Examples of the calibration curves for 1,1-dichloroethene, 1,1-dichloropropene, chlorobenzene, and naphthalene produced are shown in Figure 4.
SensitivitySensitivity was assessed by performing n=8 consecutive injections of a 10 µg/kg standard and calculating the method detection limit (MDL). The MDLs were calculated considering the Student’s-t critical values for the corresponding degrees of freedom (99% confidence) and the standard deviation of the calculated amount. Achieved sensitivity meets the requirement of the HJ methods (2–3 µg/kg) for all the investigated compounds with average MDL of 0.9 µg/kg. The results obtained are shown in Appendix 3.
Quantitation ion Obtained spectrum
Confirmation ion Top NIST library match
(a) (b)
(c)
Figure 3. Chromeleon CDS result browser showing quantitation and confirmation extracted ion chromatograms for chloroform (a), the measured mass spectrum (b), and the top NIST library match (c) confirming the identity as trichloromethane (chloroform) with a forward match score (RSI) of 918

6
0 100 200 300 400 500 5500
200
400
600
800
1000
1200
0 100 200 300 400 500 550
0
1000
2000
3000
4000
0 100 200 300 400 500 5500
100
200
300
400
500
0 100 200 300 400 500 550Concentration (µg/kg)
0
1000
2000
3000
4000
5000
5500
Are
a (%
ISTD
)
µg/kg
(a) (b)
(c) (d)
1,1-dichloroetheneR2=0.99965 AvCF %RSD=2.8
Are
a (%
ISTD
)
Are
a (%
ISTD
)A
rea
(% IS
TD)
1,1-dichloropropeneR2=0.99978 AvCF %RSD=2.2t
ChlorobenzeneR2=0.99997 AvCF %RSD=0.8
NaphthaleneR2=0.99997 AvCF %RSD=0.8
Concentration (µg/kg)
Concentration (µg/kg) Concentration (µg/kg)
Figure 4. Example of calibration plots for (a) 1,1-dichloroethene, (b) 1,1-dichloropropene, (c) chlorobenzene, and (d) naphthalene assessed over a concentration range of 10–500 µg/kg showing R2 values of 0.99965, 0.99978, 0.99997, and 0.99997 and AvCF %RSDs of 2.8, 2.2, 0.8, and 0.8, respectively
PrecisionPrecision was assessed using n=8 standard injections at 100 µg/kg and 200 µg/kg. A %RSD (n=8) of the calculated amounts of <12 was obtained for all compounds. In fact, only four analytes, dichlorodifluoromethane, chloromethane, chloroethene, and bromomethane, had a %RSD >5, comparing favorably with the 20% limit set out in the HJ methods. The values obtained are shown in Appendix 3.
Quantification of target compounds in soil samplesSoil was sampled locally, homogenized, and used for the analysis as spiked (at 100 µg/kg and 200 µg/kg) and unspiked samples in duplicate. The mean % recoveries of target analytes in these samples were within the limits specified in the HJ methods (70–130%) for all analytes, indicating that the method is suitable for the analysis of soil samples. The obtained values are shown in Appendix 4.
RobustnessMethod robustness was tested by analyzing a QC standard at 200 µg/kg at defined intervals across n=128 sample injections acquired over 4.5 days without any
instrument maintenance or mass spectrometer tuning and monitoring recovery over time. The robustness of the method was assessed by monitoring the accuracy and precision of the analytical results. With the exception of dichlorodifluoromethane and bromomethane (unstable in solution for this length of time), the average recovery was within 70–130% and the %RSD of the calculated amounts for n=10 injections were <20 for all compounds. This can be easily monitored within Chromeleon CDS using interactive charts and examples of this are shown in Figure 5. The full list of values obtained are shown in Appendix 5.
This information could also be used as a system suitability test in conjunction with the intelligent run control feature within Chromeleon CDS. This feature allows actions to be taken automatically by the software during a sequence in case of SST failure. These actions can include pausing or aborting a sequence, thereby saving any further prepared samples for injection once the cause of the SST failure has been established. This saves both time and money that would otherwise need to be spent on re-preparation of the samples.

7
Retention time alignmentFor analytical science labs it is important that the retention time of analytes remains consistent over time. The Thermo Scientific™ Retention Time Alignment (RTA) software tool can be used to account for differences when column maintenance has been performed or a method is transferred to a different GC. Either the column flow or column dimensions can be changed to adjust compound retention times. In the example shown here the column dimensions were adjusted to provide the retention time alignment after approximately 3 m was removed from the injector side of the analytical column. This allows for validated parameters, such as column flow and split flow to remain unchanged. RTA was performed very easily by using pentane (C5) as the reference compound, run
isothermally at 40 °C for 15 min. This reference compound eluted at 5.177 minutes before trimming the column, and the RTA worked to maintain this retention time after the column cut. All other instrument parameters were as shown in Table 1.
Applying the suggested settings from the RTA software tool, after trimming the column and re-injecting pentane using the same conditions, all target analytes were still within the assigned retention time window (±0.05 min) and correctly identified by Chromeleon CDS. If the RTA correction had not been performed, then the peaks would fall outside this expected window. Examples of this for d2-dicloroemethane, d8-toluene and d4-1,2-dichlorobenzene are shown in Figure 6.
Figure 5. Chromeleon generated control charts showing the 70–130% limits and the recoveries obtained for (a) chloroethane, (b) benzene, (c) bromoform, and (d) n-butylbenzene across 128 consecutive headspace analyses
(a) (b)
(c) (d)

8
Figure 6. Extracted ion chromatograms, including the peak identification window for (a) d2-dichloromethane, (b) d8-toluene, and (c) d4-1,2-dichlorobenzene, showing the initial retention time before column cut (top), retention time after column cut with RTA applied (middle) and the retention time after column cut without RTA applied (bottom). The retention time difference to the initial retention time is also displayed.
(a) (b) (c)
d2-dichloromethaneRT = 7.343 min
d8-tolueneRT = 15.921 min
d2-dichloromethaneRT = 7.350 minRT di�erence = 0.007 min
d4-1,2-dichlorobenzeneRT = 23.203 min
d8-tolueneRT = 15.455 minRT di�erence = -0.446 min
d8-tolueneRT = 15.931 minRT di�erence = 0.010 min
d2-dichloromethaneRT = 6.935 minRT di�erence = -0.408 min
d4-1,2-dichlorobenzeneRT = 22.913 minRT di�erence = -0.290 min
d4-1,2-dichlorobenzeneRT = 23.209 minRT di�erence = 0.006 min
ConclusionsLaboratories analyzing VOCs in environmental samples can consolidate three methods into one, increasing throughput three-fold by running one 30 minute method instead of two methods each >40 minutes, therefore significantly reducing the time from sampling to reporting and the need for multiple GC-MS systems and analysts, decreasing the cost per sample. The HS-GC-MS method presented here allows for simultaneous determination of 61 VOCs in <30 minutes per sample, using the Thermo Scientific TriPlus 500 HS with the TRACE 1310 GC and ISQ 7000 single quadrupole MS. The analytical results obtained in the experiments performed here comply with the HJ methods requirements with the following performance parameters demonstrated:
• Data was acquired in full scan, which simplified the method setup. Additionally, no compromise in the peak shape with sufficient chromatographic resolution of the analytes was achieved.
• Excellent linearity was obtained over the range 10–500 µg/kg with coefficient of determination, R2, values >0.999 and AvCF %RSD <5 allowing precise quantification of target compounds at low and high concentrations.
• Outstanding sensitivity was obtained with MDLs ≤ 2 µg/kg for 60 compounds.
• Precision values as %RSD of calculated concentration were <12% for all compounds and below 5% for most compounds.
• Quantification of spiked soil samples resulted in calculated concentrations close to the spiking level with compound recoveries between 70% and 130%.
• Instrument robustness was tested over 128 injections across a 4.5 day period with no maintenance or mass spectrometer tuning performed, and mean recoveries of a QC standard within 70–130% and %RSDs of calculated amounts <20 for all compounds.
• The retention time alignment tool allowed for analyte retention times to remain within the expected window even after cutting a significant section from the capillary column, saving analysis time and ensuring consistency of results.
• Users can be up and running quickly and easily using eWorkflows, which allow the user to swiftly set up, run, and process a sequence.

9
Appendix 1a. Table showing compound names, peak numbers, retention times, quantitation and confirmation ions, and associated internal standards for peaks 1–34
References1. United States Environmental Protection Agency, https://www.epa.gov/air-emissions-
inventories/what-definition-voc, Accessed July 02, 2020.
2. United States Environmental Protection Agency, https://www.epa.gov/indoor-air-quality-iaq/volatile-organic-compounds-impact-indoor-air-quality, Accessed July 02, 2020.
3. Thermo Scientific Application note AN 73415, https://appslab.thermofisher.com/App/4425/routine-analysis-purgeable-organic-compounds-drinking-water-with-isq-7000-gcms, Accessed July 02, 2020.
4. Thermo Scientific Application note AN 10729, https://www.revbase.com/tt/sl.ashx?z=73090c66&DataID=4591009&ft=1, Accessed July 02, 2020.
5. United States Environmental Protection Agency, https://www.epa.gov/hw-sw846/sw-846-test-method-8260d-volatile-organic-compounds-gas-chromatographymass-spectrometry, Accessed July 02, 2020.
6. United States Environmental Protection Agency, https://archive.epa.gov/epawaste/hazard/testmethods/web/pdf/method%205021%2C%20revision%200%20-%201996.pdf, Accessed July 02, 2020.
Appendices
Peak number Compound name
Retention time (min)
Quantitation ion (m/z)
Confirmation ion (m/z) Associated internal standard
1 Dichlorodifluoromethane 3.34 85 87 d2-dichloromethane
2 Chloromethane 3.75 50 52 d2-dichloromethane
3 Chloroethene 3.99 62 64 d2-dichloromethane
4 Bromomethane 4.77 94 96 d2-dichloromethane
5 Chloroethane 5.00 64 66 d2-dichloromethane
6 Trichlorofluoromethane 5.51 101 103 d2-dichloromethane
7 1,1-dichloroethene 6.74 61 96 d2-dichloromethane
8 d2-dichloromethane 7.89 53 90 Internal standard
9 Dichloromethane 7.94 84 49 d2-dichloromethane
10 trans-1,2-dichloroethane 8.44 61 96 d2-dichloromethane
11 1,1-dichloroethane 9.46 63 65 d2-dichloromethane
12 2,2-dichloropropane 10.65 77 79 d2-dichloromethane
13 cis-1,2-dichloroethene 10.72 96 61 d2-dichloromethane
14 Bromochloromethane 11.24 130 128 Fluorobenzene
15 Chloroform 11.37 83 85 Fluorobenzene
16 1,1,1-trichloroethane 11.69 97 99 Fluorobenzene
17 Carbon tetrachloride 11.95 117 119 Fluorobenzene
18 1,1-dichloropropene 12.03 75 110 Fluorobenzene
19 Benzene 12.47 78 77 Fluorobenzene
20 1,2-dichloroethane 12.68 62 98 Fluorobenzene
21 Fluorobenzene 13.11 96 70 Internal standard
22 Trichloroethene 13.85 130 132 Fluorobenzene
23 1,2-dichloropropane 14.46 63 62 Fluorobenzene
24 Dibromomethane 14.72 172 174 Fluorobenzene
25 Bromodichloromethane 15.02 83 85 d8-toluene
26 cis-1,3-dichloropropylene 16.02 75 110 d8-toluene
27 d8-toluene 16.50 98 100 Internal standard
28 Toluene 16.65 91 92 d8-toluene
29 trans-1,3-dichloropropylene 17.31 75 110 2-bromo-1-chloropropane
30 2-bromo-1-chloropropane 17.48 77 79 Internal standard
31 1,1,2-trichloroethane 17.72 97 99 2-bromo-1-chloropropane
32 Tetrachloroethene 17.81 164 166 2-bromo-1-chloropropane
33 1,3-dichloropropane 18.12 76 78 2-bromo-1-chloropropane
34 Dibromochloromethane 18.55 129 127 2-bromo-1-chloropropane

10
Appendix 1b. Table showing compound names, peak numbers, retention times, quantitation and confirmation ions and associated internal standards for peaks 35–67
Peak number Compound name
Retention time (min)
Quantitation ion (m/z)
Confirmation ion (m/z) Associated internal standard
35 1,2-dibromoethane 18.83 107 109 d5-chlorobenzene
36 d5-chlorobenzene 19.67 117 119 Internal standard
37 Chlorobenzene 19.72 112 77 d5-chlorobenzene
38 Ethylbenzene 19.85 91 106 d5-chlorobenzene
39 1,1,1,2-tetrachloroethane 19.88 131 133 d5-chlorobenzene
40 m & p-xylene 20.06 91 106 d5-chlorobenzene
41 o-xylene 20.73 91 106 d5-chlorobenzene
42 Styrene 20.78 104 103 d5-chlorobenzene
43 Bromoform 21.11 173 175 d5-chlorobenzene
44 Isopropylbenzene 21.28 105 120 d5-chlorobenzene
45 Bromofluorobenzene 21.58 174 176 d5-chlorobenzene
46 Bromobenzene 21.79 156 158 d5-chlorobenzene
47 1,1,2,2-tetrachloroethane 21.82 83 85 d5-chlorobenzene
48 n-propylbenzene 21.86 91 120 d5-chlorobenzene
49 1,2,3-trichloropropane 21.90 75 110 d5-chlorobenzene
50 2-chlorotoluene 22.03 91 126 d5-chlorobenzene
51 1,3,5-trimethylbenzene 22.11 105 120 d5-chlorobenzene
52 4-chlorotoluene 22.19 91 126 d5-chlorobenzene
53 tert-butylbenzene 22.52 119 134 d5-chlorobenzene
54 1,2,4-trimethylbenzene 22.60 105 120 d5-chlorobenzene
55 sec-butylbenzene 22.80 105 134 d5-chlorobenzene
56 4-isopropyltoluene 22.97 119 134 d5-chlorobenzene
57 1,3-dichlorobenzene 23.00 146 148 d4-1,4-dichlorobenzene
58 d4-1,4-dichlorobenzene 23.09 152 115 Internal standard
59 1,4-dichlorobenzene 23.12 146 148 d4-1,4-dichlorobenzene
60 n-butylbenzene 23.45 91 134 d4-1,2-dichlorobenzene
61 d4-1,2-dichlorobenzene 23.54 152 115 Internal standard
62 1,2-dichlorobenzene 23.56 146 148 d4-1,2-dichlorobenzene
63 1,2-dibromo-3-chloropropane 24.43 157 155 d4-1,2-dichlorobenzene
64 1,2,4-trichlorobenzene 25.25 180 182 d4-1,2-dichlorobenzene
65 Hexachlorobutadiene 25.35 225 227 d4-1,2-dichlorobenzene
66 Naphthalene 25.56 128 129 d4-1,2-dichlorobenzene
67 1,2,3-trichlorobenzene 25.81 180 182 d4-1,2-dichlorobenzene

11
Appendix 2. Table showing R2 and AvCF %RSD values obtained for all compounds
Peak name R2 AvCF %RSD Peak name R2 AvCF %RSD
Dichlorodifluoromethane 0.99997 0.9 1,2-dibromoethane 0.99992 1.3
Chloromethane 0.99977 2.4 Chlorobenzene 0.99997 0.8
Chloroethene 0.99914 4.7 Ethylbenzene 0.99997 0.8
Bromomethane 0.99978 2.3 1,1,1,2-tetrachloroethane 0.99983 2.0
Chloroethane 0.99998 0.6 m & p-xylene 0.99994 1.1
Trichlorofluoromethane 0.99996 1.0 o-xylene 0.99994 1.1
1,1-dichloroethene 0.99965 2.8 Styrene 0.99936 3.9
Dichloromethane 0.99988 1.6 Bromoform 0.99904 4.9
trans-1,2-dichloroethene 0.99993 1.2 Isopropylbenzene 0.99990 1.5
1,1-dichloroethane 0.99997 0.8 Bromofluorobenzene 0.99985 1.8
2,2-dichloropropane 0.99990 1.5 Bromobenzene 0.99993 1.2
cis-1,2-dichloroethene 0.99999 0.5 1,1,2,2-tetrachloroethane 0.99994 1.2
Bromochloromethane 0.99975 2.4 n-propylbenzene 0.99978 2.1
Chloroform 0.99985 1.8 1,2,3-trichloropropane 0.99932 3.7
1,1,1-trichloroethane 0.99968 2.7 2-chlorotoluene 0.99971 2.5
Carbon tetrachloride 0.99983 2.0 1,3,5-trimethylbenzene 0.99921 4.1
1,1-dichloropropene 0.99978 2.2 4-chlorotoluene 0.99992 1.3
Benzene 0.99993 1.2 tert-butylbenzene 0.99967 2.7
1,2-dichloroethane 0.99992 1.3 1,2,4-trimethylbenzene 0.99963 2.8
Trichloroethene 0.99990 1.5 sec-butylbenzene 0.99938 3.6
1,2-dichloropropane 0.99996 1.0 4-isopropyltoluene 0.99986 1.7
Dibromomethane 0.99963 2.9 1,3-dichlorobenzene 0.99992 1.3
Bromodichloromethane 0.99995 1.1 1,4-dichlorobenzene 0.99999 0.5
cis-1,3-dichloropropylene 0.99998 0.7 n-butylbenzene 0.99992 1.3
Toluene 0.99996 1.0 1,2-dichlorobenzene 0.99998 0.6
trans-1,3-dichloropropylene 0.99997 0.8 1,2-dibromo-3-chloropropane 0.99948 3.4
1,1,2-trichloroethane 0.99999 0.5 1,2,4-trichlorobenzene 0.99984 1.9
Tetrachloroethene 0.99976 2.4 Hexachlorobutadiene 0.99995 1.0
1,3-dichloropropane 0.99996 0.9 Naphthalene 0.99997 0.8
Dibromochloromethane 0.99965 2.8 1,2,3-trichlorobenzene 0.99987 1.7

12
Appendix 3. Table showing the calculated MDLs and % RSDs for n=8 injections of standard at 100 µg/kg and 200 µg/kg
Peak name MDL%RSD at 100 ppb
%RSD at 200 ppb Peak name MDL
%RSD at 100 ppb
%RSD at 200 ppb
Dichlorodifluoromethane 0.8 10.5 11.1 1,2-dibromoethane 1.3 2.0 1.6
Chloromethane 1.6 6.8 8.6 Chlorobenzene 0.6 1.1 1.8
Chloroethene 1.0 4.3 6.9 Ethylbenzene 0.8 1.0 1.7
Bromomethane 2.3 6.5 3.5 1,1,1,2-tetrachloroethane 0.9 1.7 1.4
Chloroethane 1.0 2.1 4.5 m & p-xylene 1.5 1.1 2.1
Trichlorofluoromethane 1.3 2.5 4.2 o-xylene 1.5 1.1 2.0
1,1-dichloroethene 1.2 2.6 3.0 Styrene 0.5 2.0 1.4
Dichloromethane 1.2 1.2 2.2 Bromoform 0.8 2.1 2.0
trans-1,2-dichloroethene 1.1 2.5 2.2 Isopropylbenzene 1.0 0.8 2.2
1,1-dichloroethane 1.0 1.9 2.3 Bromofluorobenzene 0.6 1.9 1.7
2,2-dichloropropane 1.9 3.6 1.4 Bromobenzene 1.5 2.0 2.2
cis-1,2-dichloroethene 0.6 2.1 1.8 1,1,2,2-tetrachloroethane 1.2 3.1 1.5
Bromochloromethane 1.3 2.3 2.1 n-propylbenzene 0.8 1.4 1.6
Chloroform 1.4 2.8 1.5 1,2,3-trichloropropane 1.1 3.2 1.8
1,1,1-trichloroethane 0.9 1.0 0.4 2-chlorotoluene 0.7 1.3 1.4
Carbon tetrachloride 1.2 1.1 0.7 1,3,5-trimethylbenzene 0.8 1.3 1.9
1,1-dichloropropene 1.3 0.5 0.5 4-chlorotoluene 0.8 1.3 2.5
Benzene 0.4 1.0 0.7 tert-butylbenzene 1.0 2.1 1.9
1,2-dichloroethane 0.9 1.4 1.3 1,2,4-trimethylbenzene 1.1 1.1 1.2
Trichloroethene 0.7 0.8 0.7 sec-butylbenzene 1.4 1.8 2.8
1,2-dichloropropane 1.1 1.2 1.2 4-isopropyltoluene 1.0 1.5 1.8
Dibromomethane 1.4 3.0 2.2 1,3-dichlorobenzene 0.8 1.7 1.5
Bromodichloromethane 0.5 2.1 1.7 1,4-dichlorobenzene 0.6 1.7 1.6
cis-1,3-dichloropropylene 0.5 1.7 1.9 n-butylbenzene 1.3 1.4 2.1
Toluene 0.5 0.9 1.3 1,2-dichlorobenzene 1.1 2.3 1.5
trans-1,3-dichloropropylene 0.9 2.0 1.7 1,2-dibromo-3-chloropropane 1.5 3.5 1.6
1,1,2-trichloroethane 1.0 1.5 1.0 1,2,4-trichlorobenzene 1.1 3.0 2.1
Tetrachloroethene 1.1 2.5 2.5 Hexachlorobutadiene 2.0 2.5 3.1
1,3-dichloropropane 1.0 2.2 1.2 Naphthalene 0.6 1.4 1.2
Dibromochloromethane 0.9 1.4 1.2 1,2,3-trichlorobenzene 0.1 2.0 2.2

13
Appendix 4. Table displaying the obtained recoveries of analytes from soil samples spiked at 100 µg/kg and 200 µg/kg
Peak name% Recovery at
100 ppb% Recovery at
200 ppb Peak Name% Recovery at
100 ppb% Recovery at
200 ppb
Dichlorodifluoromethane 104.0 98.5 1,2-dibromoethane 100.0 104.0
Chloromethane 82.7 101.1 Chlorobenzene 94.0 99.4
Chloroethene 100.5 112.5 Ethylbenzene 91.2 96.1
Bromomethane 87.4 110.0 1,1,1,2-tetrachloroethane 92.1 96.8
Chloroethane 105.7 118.4 m & p-xylene 89.7 93.3
Trichlorofluoromethane 73.5 90.4 o-xylene 78.3 84.8
1,1-dichloroethene 87.1 98.1 Styrene 91.4 93.6
Dichloromethane 95.0 104.1 Bromoform 82.4 84.5
trans-1,2-dichloroethene 89.3 98.7 Isopropylbenzene 88.6 93.3
1,1-dichloroethane 93.0 100.8 Bromofluorobenzene 99.4 104.0
2,2-dichloropropane 97.7 109.5 Bromobenzene 100.1 102.5
cis-1,2-dichloroethene 92.5 98.9 1,1,2,2-tetrachloroethane 109.6 110.1
Bromochloromethane 97.6 103.4 n-propylbenzene 97.0 100.9
Chloroform 98.5 102.6 1,2,3-trichloropropane 110.9 114.6
1,1,1-trichloroethane 94.5 98.9 2-chlorotoluene 100.0 103.4
Carbon tetrachloride 90.9 98.3 1,3,5-trimethylbenzene 96.7 102.5
1,1-dichloropropene 91.3 97.5 4-chlorotoluene 99.6 102.6
Benzene 94.9 99.5 tert-butylbenzene 94.5 99.7
1,2-dichloroethane 100.1 103.6 1,2,4-trimethylbenzene 93.8 99.3
Trichloroethene 92.6 98.3 sec-butylbenzene 91.1 94.9
1,2-dichloropropane 96.6 101.0 4-isopropyltoluene 86.2 91.5
Dibromomethane 99.7 103.6 1,3-dichlorobenzene 95.8 99.8
Bromodichloromethane 91.3 92.9 1,4-dichlorobenzene 95.2 99.2
cis-1,3-dichloropropylene 93.4 98.3 n-butylbenzene 78.4 84.5
Toluene 93.3 96.7 1,2-dichlorobenzene 95.0 95.6
trans-1,3-dichloropropylene 93.7 99.7 1,2-dibromo-3-chloropropane 105.6 99.7
1,1,2-trichloroethane 97.8 100.9 1,2,4-trichlorobenzene 86.1 89.8
Tetrachloroethene 90.6 94.7 Hexachlorobutadiene 71.0 74.0
1,3-dichloropropane 99.2 102.9 Naphthalene 96.1 96.4
Dibromochloromethane 85.4 90.4 1,2,3-trichlorobenzene 86.8 88.8

© 2020 Thermo Fisher Scientific Inc. All rights reserved. All trademarks are the property of Thermo Fisher Scientific and its subsidiaries. This information is presented as an example of the capabilities of Thermo Fisher Scientific Inc. products. It is not intended to encourage use of these products in any manners that might infringe the intellectual property rights of others. Specifications, terms and pricing are subject to change. Not all products are available in all locations. Please consult your local sales representative for details. AN73742-EN 0820S
Find out more at thermofisher.com
Appendix 5. Table showing the %RSD and the mean % recovery (n=10) for a 200 µg/kg QC standard run at intervals over 128 injections
Peak name %RSD Mean % recovery Peak name %RSD Mean % recovery
Chloromethane 14.0 83 Chlorobenzene 1.1 100
Chloroethene 8.4 76 Ethylbenzene 3.1 99
Chloroethane 4.9 85 1,1,1,2-tetrachloroethane 2.1 101
Trichlorofluoromethane 5.6 91 m & p-xylene 4.1 99
1,1-dichloroethene 3.6 96 o-xylene 3.0 97
Dichloromethane 1.3 103 Styrene 9.3 85
trans-1,2-dichloroethene 2.7 98 Bromoform 2.5 96
1,1-dichloroethane 1.6 102 Isopropylbenzene 3.5 99
2,2-dichloropropane 11.0 96 Bromofluorobenzene 3.2 107
cis-1,2-dichloroethene 1.8 99 Bromobenzene 5.3 109
Bromochloromethane 3.1 100 1,1,2,2-tetrachloroethane 11.1 122
Chloroform 3.1 102 n-propylbenzene 6.3 116
1,1,1-trichloroethane 2.4 104 1,2,3-trichloropropane 10.8 125
Carbon tetrachloride 4.3 107 2-chlorotoluene 4.6 111
1,1-dichloropropene 2.2 100 1,3,5-trimethylbenzene 5.6 118
Benzene 1.6 100 4-chlorotoluene 3.8 108
1,2-dichloroethane 4.3 104 tert-butylbenzene 8.3 122
Trichloroethene 1.0 99 1,2,4-trimethylbenzene 3.2 111
1,2-dichloropropane 3.1 103 sec-butylbenzene 7.7 123
Dibromomethane 3.4 99 4-isopropyltoluene 5.5 115
Bromodichloromethane 3.7 104 1,3-dichlorobenzene 1.3 102
cis-1,3-dichloropropylene 4.9 96 1,4-dichlorobenzene 1.3 101
Toluene 1.2 99 n-butylbenzene 4.3 107
trans-1,3-dichloropropylene 8.5 92 1,2-dichlorobenzene 1.6 98
1,1,2-trichloroethane 1.5 99 1,2-dibromo-3-chloropropane 7.4 108
Tetrachloroethene 5.3 94 1,2,4-trichlorobenzene 8.1 88
1,3-dichloropropane 1.4 101 Hexachlorobutadiene 5.1 108
Dibromochloromethane 1.9 100 Naphthalene 2.4 96
1,2-dibromoethane 3.4 104 1,2,3-trichlorobenzene 7.4 87