a continuous improvement and monitoring - ibima publishing
TRANSCRIPT

IBIMA Publishing
IBIMA Business Review
http://www.ibimapublishing.com/journals/IBIMABR/ibimabr.html
Vol. 2011 (2011), Article ID 917557, 15 pages
DOI: 10.5171/2011.917557
Copyright ©2011 Vito Romaniello, Paolo Renna and Vincenzo Cinque. This is an open access article distributed
under the Creative Commons Attribution License unported 3.0, which permits unrestricted use, distribution,
and reproduction in any medium, provided that original work is properly cited. Contact author: Vito
Romaniello e-mail: [email protected]
A Continuous Improvement and Monitoring
Performance System: Monitor - Analysis -
Action – Review (MAAR) Charts
Vito Romaniello1, Paolo Renna
2 and Vincenzo Cinque
1
1ANSALDO STS, Tito Scalo (PZ), Italy
2University of Basilicata – DIFA, Potenza, Italy
_________________________________________________________________________________________________________________
Abstract
The research presented in this paper concerns the development of a methodology for monitoring
and continuous performance improvement. The proposed approach is derived from the classical
Deming cycle adapted to a real industrial environment. The approach consists of four phases:
Monitor, Analysis, Action and Review (MAAR); these phases are summarized in a single information
panel that allows to improve the monitoring process. This paper presents a discussion of the real
case study application of the methodology in area manufacturing of ANSALDO STS S.p.A. The case
study discussed here shows the application of basic principles, management tools and techniques
towards performance improvement in a manufacturing plant. The innovative issues of the MAAR
approach developed regard: the possibility to apply the methodology to wide fields of enterprises
(as maintenance, quality management, design, financial, etc.) and the real-manufacturing
orientation. The results show the real benefits obtained by the implementation of the proposed
methodology.
Keywords: quality management, continuous improvement, manufacturing systems, industrial case
study, performance monitoring.
__________________________________________________________________________________________________________________
Introduction
The measure of performance is a question in
which all companies are involved. The
performance monitoring has the goal to
improve the ability for the control process of
the results of a company. There must be clear
objectives, indicators, operational plans, and
then we measure the performance achieved.
Often, the common meaning of performance
is confused with the efficiency of direct labor,
which tends to take marginal importance
compared with the other inputs, such as non-
quality costs, productivity, material, indirect
labor and capital invested in stocks and
assets.
A monitoring system is necessary to measure
the achievement of targets, and the deviation
from the objectives; The instrument will be
more effective and accurate if it can track the
individual contributors that affect directly
and indirectly objectives. The difficulties of
setting up a system of performance
measurement are not few. For example, an
initial problem is to determine the period of
controlling and planning. If the time periods
are too long, the connection between goals

IBIMA Business Review 2
and daily actions may be lost. If the time
periods are too short, the necessary freedom
of action may be lost.
The main characteristics of the system to
pursue what planned are the following: a
dynamic and flexible system; to be able to
monitor in real-time the performance; to
detect the contributors which adversely
affect performance; to show the trend of the
individual contributors; furthermore, based
on these elements, the system has the
possibility to trigger a system of continuous
improvement.
The MAAR chart methodology was born as an
operational need to respond in real time to
the trends of the Key Performance Indicators
(KPIs) and it needs to be able to take
decisions on possible corrective actions more
quickly than KPIs.
The embryo of this methodology was
implemented and tested in production
environments of electronic cards of Ansaldo
STS Company in the factory of Tito (PZ, Italy)
and it allowed to monitor and improve the
already high quality performance products.
This methodology allowed finding the right
tool to monitor and keep the high levels of
performance on product quality.
The paper is structured as follows. Section 2
provides a briefly review of the literature on
the methodologies developed for continuous
improvement. The proposed methodology is
described in Section 3, while in Section 4 the
case study is discussed. Finally, in Section 5
the conclusions and future development are
discussed.
Literature Review
Many authors investigated the productivity
measurement and improvement problem in
manufacturing systems. Muthiah and Huang
(2006) presented a literature review on
manufacturing systems productivity
measurement and improvement. They
classified the literature under four
categories: operations research based
methods, system analysis-based methods,
continuous improvement methods and
performance metrics-based methods.
Moreover, they presented a survey of the
methodologies proposed in literature as
showed in table 1.
Table 1: Methodologies Proposed in Literature
Methodologies proposed Main scientific literature references
Graphs with Results and Actions
Interrelated (GRAI)
Doumeingts (1985); Doumeingts et al. (1995);
Grislain and Pun (1979)
Integrated Compute-Aided Manufacturing
Definition (IDEF0)
Bravoco and Yadav (1985); Ross (1985)
Structured Analysis and Design Technique
(SADT)
Marca and McGowan (1988); Ross and
Schoman
(1977); Ross (1985); Santarek and Buseif
(1998)
Structured Systems Analysis and Design
Method (SSADM) Structured Systems
Down et al. (1988); Eva (1992)
GRAI Integrated Methodology (GIM) Doumeingts et al. (1995)
Strathclyde Integration Method (SIM) Carrie and Macintosh (1997); Pandya et al.
(1997)
GI-SIM (GRAI grid, IDEF0 and SIMAN tools) Al-Ahmari and Ridgway (1999)

3 IBIMA Business Review
However, these modeling techniques are not
designed to facilitate productivity
measurement and analysis. Rather they focus
on the availability of the unit/equipment,
which is only one aspect of the system
performance (Huang et al., 2002).
Taninecz (2004a) reports a summary of
IW/MPI Census plants’ progress towards
achieving world-class manufacturing status
from enterprises across USA. From this
report, more than 75% of plants have no
progress or some progress. Figure 1 shows
the methodologies and percentage of plants
with improvements (Taninecz, 2004b).
Fig 1. Methodologies and Improvements
Figure 1 shows the methodologies that are
more used. The survey (Taninecz, 2004b)
described that the plants with no
methodology have poor manufacturing
performance; therefore any methodology is
better than no methodology implementation.
The survey concludes that a methodology
will only be good according to those who
guide and execute it.
Witcher and Chau (2007) discussed a
complementary use of the balanced
scorecard and hoshin kanri. It aims to posit a
model for the combination of these long and
short-term organizational activities as a
framework for a senior level to manage a
firm strategy that fits as an integrated
organization-wide system that links top
management goals to daily management.
Friday-Stroud and Sutterfield (2007)
proposed a framework to integrate six-sigma
and strategic management methodologies to
quantify decision making. Also, this paper
concerns the strategic decision in medium-
long term.
Witcher and Chau (2008) presented two
contrasting applications of the balanced
scorecard, at EDF Energy and Tesco, where
the scorecard is called a steering wheel. A
distinction is drawn between a strategic
scorecard based on vision and a performance
management scorecard based on mission and
values. Execution is the translation of mid-
term plans into annual priorities for daily or
routine work.
Wazed and Ahmed (2009) presented a case
study on how a theory driven real time
empirical investigation can offset the quality
related problems and bring better results in
other performance dimensions. A systematic
approach and application of the basic and
advanced management tools and techniques
are used to solve the rejection part problem

IBIMA Business Review 4
in a plastic moulding manufacturing plant. In
order to illustrate this, the study focused on
joint application of PDCA and 5S approaches.
From the discussion of the recent literature
(reported above) the following issues can be
drawn:
• Most of the studies focused only on one
part: the framework to manage the
improvements or the performance analysis
in order to make a decision.
• The approaches proposed in literature
focus on particular enterprise’s area such as:
maintenance, product development, quality
control, etc; or they focus on particular
typology of enterprise.
The research presented in this paper
overcomes the above limits by a general and
integrated approach called Monitor Analysis
Action Review (MAAR). The approach
proposed is characterized by a module for
introducing analysis and collecting the
performance information in order to provide
the important issues to take the
improvement decision. The second module
manages the improvement actions from a
managerial point of view in order to check
the status of the actions and their success.
MAAR Chart Methodology
The methodology proposed is a practical
application tool based on Deming cycle (Plan-
Do-Act-Check). The MARR chart tool
proposes a dashboard that allows
supervising, introducing corrective actions
and tracking the status/efficacy of them. All
these information are showed in a compact
style in order to facilitate the use in real
applications and highlight the problems in
the first stage of corrective actions
introduction.
The second important issue concerns the
time horizon; the proposed methodology is
adaptable for both short-term and medium-
term, therefore, it can be applicable to
several levels of an enterprise.
The third issue is the modularity of the tool
proposed; this characteristic allows the
adaption of the tool to several different
industrial processes to improve.
If the methodology is implemented, then
using a computerized system can monitor in
real time key performance Indicators (KPIs),
highlight in real time the causes of possible
factors affecting KPIs negatively and the
trend of these factors in previous periods;
then it can implement corrective actions
outlined in the system.
The use of computer allows taking data
directly from the machines with the
possibility of data entry with bar code
technology or RFID, etc.
Using multiple joint technology from the
possibility of taking data at no cost and
process in real time, and only if this data has
a negative impact on KPIs, will implement
actions for continuous improvement.
The objectives pursued by the MAAR tool are
two: the continuous improvement and the
analysis of resources use. The tool proposed
applies the four phases of Deming Cycle with
the continuous interaction of all the actors
involved in the generic process supervised.
Figure 2 shows the Deming cycle thinking
applied to the proposed methodology.
5 IBIMA Business Review
Monitor
Analysis
Action
Review
Fig 2. Continuous Improvement Cycle
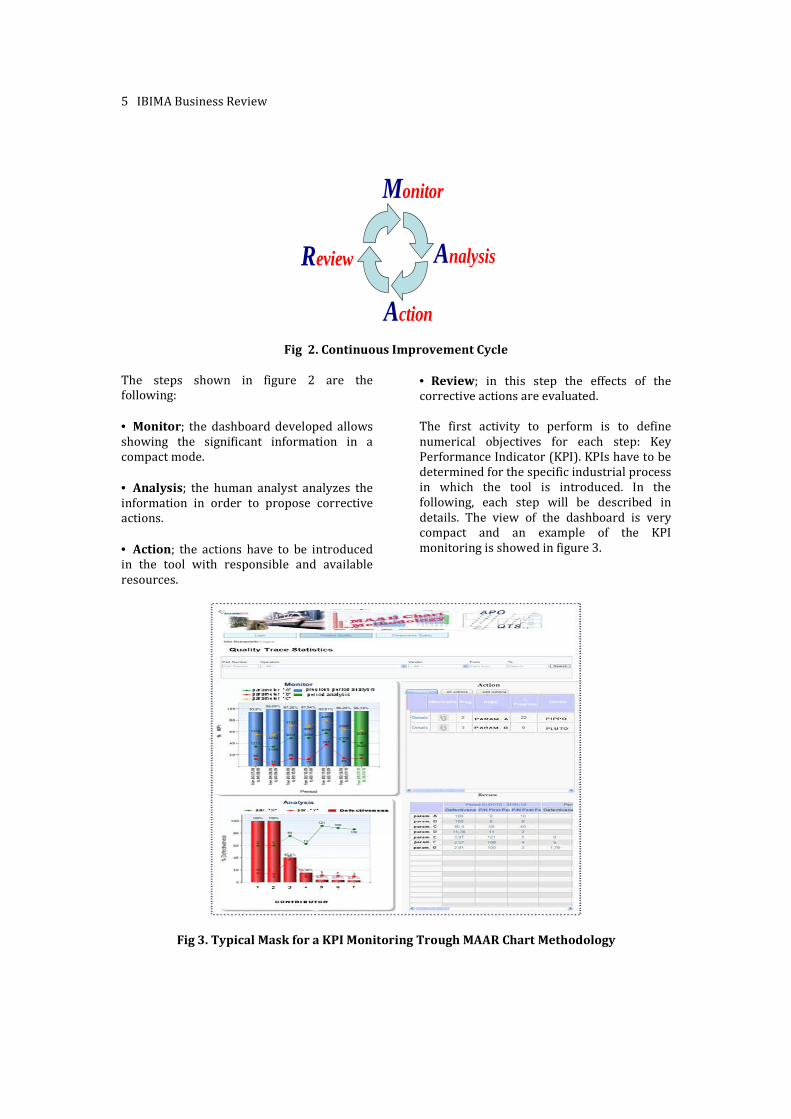
The steps shown in figure 2 are the
following:
• Monitor; the dashboard developed allows
showing the significant information in a
compact mode.
• Analysis; the human analyst analyzes the
information in order to propose corrective
actions.
• Action; the actions have to be introduced
in the tool with responsible and available
resources.
• Review; in this step the effects of the
corrective actions are evaluated.
The first activity to perform is to define
numerical objectives for each step: Key
Performance Indicator (KPI). KPIs have to be
determined for the specific industrial process
in which the tool is introduced. In the
following, each step will be described in
details. The view of the dashboard is very
compact and an example of the KPI
monitoring is showed in figure 3.
Fig 3. Typical Mask for a KPI Monitoring Trough MAAR Chart Methodology

IBIMA Business Review 6
Before starting with the methodology, it is
important to set the KPIs relevant to the
control at various stages of the process,
service or other activities. Everyone
(involved in the process) will set the KPIs of
the MAAR chart and show them in the
dashboard. As the reader can notice, in figure
3, the mask developed allows supervising all
the stages of the continuous improvement
cycle.
Step 1 – Monitor
In this step, the dashboard shows the
performance supervised by the KPIs defined.
The graph shows the last six periods (this can
be modified by the analyst) that are
necessary for comparing the same indicator
in previous periods.
If the MAAR-chart methodology is
implemented on informatics system, it is
possible in real time to choose the period
analysis and have a value and trend of KPI;
for example, if the analyst chooses one day as
a period, then the trend showed is related to
one week; if the period selected is one month
the trend showed is related to one semester,
e.g.
Moreover, it is possible to show more
parameters significant for the process
analyzed (Figure 4 shows an example of the
graphs). This graph allows highlighting the
KPI trend with the related parameters.
The information of the graphs is obtained by
the enterprise database and it shows the
trend of each parameter that concurs to
obtain the total KPI value.
Fig 4. Example of Performance Graph

7 IBIMA Business Review
Step 2 - Analysis
In this step, the dashboard highlights the
parameters that affect negatively the KPI
analyzed, and in particular on the KPI
defined in the objective to pursue. Several
parameters can be summarized within the
same graphs that allow a rapid analysis of the
trend. These parameters are organized as a
Pareto diagram (e.g. choose the parameter
which has the highest impact on the costs of
not quality).
Figure 5 shows the example of Pareto; the
analyst can easily observe the contribution of
each parameter. Then, the analyst can
investigate the more relevant parameters for
the improvement analysis.
Fig 5. Example of Pareto Diagram
Step 3- Action
In this step, the analyst can introduce the
corrective actions and supervise the progress
of them. The introduction of new actions is
performed by the procedure described in the
following. The analyst has to activate the
“action” panel. The minimal requirements to
introduce a new action are the following (see
figure 6):
1. Part Number: this part number is a
parameter which has a negative effect on the
KPI. The part number is related to the
parameters shown in the monitoring step. In
fact, each part number is the parameter that

IBIMA Business Review 8
has a negative effect on the performance
analyzed.
2. Attachment: in this area, all the files
necessary are attached for mapping the
corrective action (in this area e.g. vi is the
document that reduce the meeting of quality
review or document received by external
partner;…). This allows managing to manage
all the information related to the actions
introduced.
3. Prog.: it is a progressive identification of
the corrective action;
4. Progress: it is the percentage progress of
the corrective action. It allows monitoring
the state of the corrective action.
5. Vendor: in this area, the provenance of
the part number is indicated; this area is
used if the action involves external actor
from ANSALDO.
6. Action: in this part, a shortly
description of corrective action is indicated;
7. date input: this part indicates the
starting date of corrective action and this
date is inserted automatically into the
system;
8. delivery date: this part indicates the
closing date of corrective action;
9. date: this part indicates the starting date
of corrective action;
10. Internal Action Responsible: it is the
internal action responsible for the corrective
action;
11. External Action Responsible: it is the
external action responsible for the corrective
action.
Fig 6. Screen for Corrective Action Opened and Update
Figure 7 shows the mask of the action section.
It’s always possible in the action section to
show:
1) under windows “action”, when
effectuated by the dynamic selection, it’s
possible to only show corrective actions
correlated with the selection;
2) under windows “all action” it is possible
to show all actions inserted in the system.
For all views, it is possible to dedicate for
each parameter and possible selection, sorted
for each parameter and possible selection,
corrective action for updating the percentage
of progress or attach other material on this
argument (see figure 7).

9 IBIMA Business Review
Fig 7. Screen for Corrective Action Show
Step 4 - Review
In this step (see figure 8), the parameters that
have a negative effect on the KPI are
compared before and after the corrective
actions are introduced in the previous step.
In this section, the progress of each
contributor, who has a negative impact on
KPI (set by the system), can be monitored on
the last six periods.

IBIMA Business Review 10
Fig8. Screen For Monitor the Progress
As shown in figure 3, this methodology can
monitor directly and in real time the KPIs and
if there is a need for a lower level of analysis,
it is possible to use the same methodology to
monitor the main KPI.
We will have a dashboard with KPI and the
parameter A we will have:
� Section monitor for the parameter A;
� The section of the Pareto Analysis of the
contributors has a negative effect on the
parameter A;
� Section review to monitor the progress of
all the negative contributors to the parameter
A;
� The Action section devoted only to
remedial actions parameter A.
So we will have the same parameters but with
relatively dashboard KPI major accidents.

11 IBIMA Business Review
It is possible and necessary to lower the level
of analysis to reach a level that can control
the main KPI.
Discussion of Case Study
This methodology has been studied
experimented, designed and implemented in
a production environment. The methodology
has been studied in Ansaldo STS Italy of Tito
and was first implemented on electronics and
certification of electronics boards, and later
extended to the whole factory to monitor and
control the entire production of all products.
After two years of its implementation, the
following considerations can be reached:
1) The tool has proved to be efficient and
effective for monitoring and controlling
production quality.
2) It has further helped improve the already
high levels of quality products that
distinguish Ansaldo STS
3) Its implementation also monitor launches
of new production has proven to be an
effective and efficient way to improve
performance and product quality since the
first launch of new products.
4) It has also proven to be flexible, effective
and efficient in the short term and has
allowed structuring a system of continuous
improvement.
5) The methodology presented itself as an
effective, efficient and dynamic indicator to
monitor any process or system.
In year 2009, for example, only in Tito plant
529 different electronic boards code were
managed; the quantity for each code was
from some units to about 6.000 pieces per
type.
In the first part of the MAAR Chart study and
implementation, six productive departments
were chosen (in all production area) (see
figure 9).
Fig 9. Productive Departments
Each department standardizes (as much
as possible) the possible defect that can
be chosen in each department (see
figure 10).

IBIMA Business Review 12
Fig 10. Defects
The following is the first test of the
methodology that was decided to be extended
throughout the factory. The Important steps
are the implementation of key performance
indicators and the selection of monitoring
points. The key performance indicators used
in the case study developed are the following.
Quality Boards:
(1)
Expression (1) computes the percentage of
electronic boards that comply with the
specifications related to the total number of
electronic boards manufactured by the
process analyzed.
Quality single Boards:
(2)
Expression (2) evaluates the percentage of
electronic boards that comply with the
specifications related to the total number of
electronic boards for each part number i-th
(PNi).
After an initial period of experimentation, the
Methodology was introduced for monitoring
other KPI (also in an economical field), for
example other types of indicators are as
follows:

13 IBIMA Business Review
Raw materials stock coverage:
Stock value at a certain moment on the average value of the
output for next 3 months (budget or forecast).
WIP stock coverage:
WIP stock value at a certain moment on the average value
of the output for next 3 months (budget or forecast).
Variance on WO:
Variance is the difference between goods released in stock
at standard cost and actual costs on WO (material + labor)
It can be positive or not.
WO efficiency: Ratio of hours spent on WO on the period on the number of
hours expected in the routings.
Unplanned materials Ratio of the amount of raw materials used in addition to the
BOM on the total amount of components consumed for the
WO on the period
- Trend of KPI (A1)-
- Trend of KPI (B1)-
- Trend of KPI (B1-1)-
Fig 11. Performance Improvements

IBIMA Business Review 14
The improvements of the performance
obtained by the proposed approach are
shown in the figure 11.
Figure 11 shows the trend of three KPIs
monitored from September 2006 to
November 2009. The red line is the target of
the indicator observed, while the blue line is
the real value of the KPIs. As the reader can
notice, the introduction of the proposed
methodology allowed improving significantly
all the three KPIs analyzed. The green line
shows the trend of the KPI over the periods
observed. The improvement of the KPIs
allows reaching to reach the target objective
of the KPIs.
Conclusions and Future Development
The study presented in this paper focuses on
the implementation and deployment of a
methodology for continuous performance
improvements defined MAAR charts at
ANSALDO STS S.p.A., Italy area
Manufacturing. The MAAR charts approach is
based on the integration of the continuous
improvement process throughout the
following steps: Monitor, Analysis, Action and
Review.
We can confirm that this project provides the
firm with a lot of advantages such as:
1) monitoring any indicator in operative,
structured and in real time mode;
2) monitor each contributor that adversely
affect on the main indicator;
3) using the same methodology for several
levels of analysis in order to obtain a totally
control of KPIs;
4) Monitoring over time the trend of
indicators.
5) Monitoring over time the trends of each
negative contributor on the indicator.
6) Corrective action system to map and
assess the temporal effects.
7) Having in a single compact panel all
information for monitoring and
implementing corrective actions of any
indicator.
ANSALDO STS took advantage of the
flexibility and scalability of the proposed
approach in order to make decisions and
focus on essential needs while maintaining
full adaptability to develop the system and
respond to changing requirements. In
addition, this integration of data between the
different functions allows easy analysis of
performance indicators, which in the past
used to be an extremely time-consuming
process. As planned, ANSALDO STS will
continue to extend the use of MAAR charts
approach to its other processes of the
manufacturing. In parallel, it will make
enhancements and will introduce further
developments to further maximize the
benefits. This ultimate goal will allow the firm
to have a complete overview of all its internal
and external processes with users, partners,
suppliers, and customers, on one single
platform.
Future development paths concern: the
possibility to extend the methodology
described in different enterprise areas in
order to investigate the robustness of the
methodology for several applications; the
development of a decision support tool to
propose the corrective actions to the analyst.
References
Al-Ahmari, A. M. A. & Ridgway, K. (1999). "An
Integrated Modeling Method to Support
Manufacturing Systems Analysis and Design,"
Computers in Industry, 38, 225–238.
Bravoco, R. and Yadav, S. (1985), ‘A
methodology to model functional structure of
an organization’, Computers in Industry, 6,
345–361.
Carrie, A. & Macintosh, R. (1997). "An
Assessment of GRAI Grids and their Use in the
Strathclyde Integration Method," Production
Planning and Control, 8,106–113.

15 IBIMA Business Review
Doumeingts, G. (1985). "How to Decentralize
Decision through GRAI Model in Production
Management," Computers in Industry, 6, 501–
514.
Doumeingts, G., Vallespir, B. & Chen, D.
(1995). "Methodologies for Designing CIM
System: a Survey," Computers in Industry, 25,
263–280.
Down, E., Clare, P. & Coe, T. (1988).
'Structured System Analysis and Design
Method,' New York: Prentice-Hall.
Eva, M. (1992). 'SSADM Version 4 – A User
Guide,' London, McGraw-Hill.
Friday-Stroud S. S. & Sutterfield J. S. (2007).
"A Conceptual Framework for Integrating Six-
sigma and Strategic Management
Methodologies to Quantify Decision Making,"
the TQM Magazine, 19(6), 561-571.
Grislain, J. & Pun, L. (1979). 'Graphical
Methods for Production Control,' Fifth
International Conference on Production
Research, Amsterdam 12-16 August 1979,
265–270.
Huang, S. H., Dismukes, J. P., Shi, J., Su, Q.,
Wang, G., Razzak, M. A. & Robinson, D. E.
(2002). "Manufacturing System Modeling for
Productivity Improvement," Journal of
Manufacturing Systems, 21 (4), 249–259.
Marca, D. A. & McGowan, C. L. (1987).
Structured Analysis and Design Technique,
New York: McGraw Hill.
Muthiah K. M. N. & Huang S. H. (2006). "A
Review of Literature on Manufacturing
Systems Productivity Measurement and
Improvement," International Journal of
Industrial and Systems Engineering, 1(4), 461-
484.
Pandya, K. (1995). 'Review of Modeling
Techniques and Tools for Decision Making in
Manufacturing Management,' IEE Proceedings
on Science, Management and Technology, 142
(5), 371–377.
Ross, D. T. & Schoman, K. (1977). "Structured
Analysis for Requirement Definition," IEEE
Transactions on Software Engineering, SE, 3,
6–15.
Ross, D. T. (1985). 'Application of SADT,' IEEE
Transactions on Computers, April, 25–34.
Santarek, K. & Buseif, I. M. (1998). "Modeling
and Design of Flexible Manufacturing Systems
Using SADT and Petri Net Tools," Journal of
Materials Processing Technology, 76, 212–
218.
Taninecz, G. (2004a). 'Faster but not Better,'
Industry Week, May.
Taninecz, G. (2004b). 'Long-term
Commitments,' Industry Week, February.
Wazed, M. A. & Ahmed, S., (2009). "Theory
Driven Real Time Empirical Investigation on
Joint Implementation of PDCA and 5S for
Performance Improvement in Plastic
Moulding Industry," Australian Journal of
Basic and Applied Sciences, 3(4), 3825-3835.
Witcher, B. J. & Chau, V. S. (2007). "Balanced
Scorecard and Hoshinkanri: Dynamic
Capabilities for Managing Strategic Fit,"
Management Decision, 45(3), 518-538.
Witcher, B. J. & Chau, V. S. (2008).
"Contrasting Uses of Balanced Scorecards:
Case Studies at Two UK Companies," Strategic
Change, 17, 101–114.