a cooperative program to reduce incidents of vehicles
TRANSCRIPT

North Carolina Department of Public InstructionTransportation Services Section301 N. Wilmington StreetRaleigh, NC 27601 (919) 715-1950
A Cooperative Program to Reduce Incidents ofVehicles Passing Stopped School Buses in a Coastal Region of North Carolina
This project was funded in part by the National Highway Traffic Safety Administration and conducted by theInstitute for Transportation Research and Education at N.C. State University.

A Cooperative Program to Reduce the Incidents of Motorists Passing Stopped School Buses in a Coastal Region of N.C
Report to the National Highway Traffic Safety Administration (NHTSA), October, 2000 2
Executive Summary
In September, 1998, the North Carolina Department of Public Instruction was awarded one of four nationalgrants by the National Highway Traffic Safety Administration (NHSTA) to demonstrate strategies forreducing the incidences of motorists passing stopped school buses. The North Carolina project focused onthree coastal school districts: Onslow County, Pender County, New Hanover County. The project wasconducted by the pupil transportation program at the Institute for Transportation Research and Education,North Carolina State University.
An approach designed to demonstrate various applications of technology yielded lessons learned more inthe area of cooperation among agencies and, more specifically, the individuals within those agencies. Thestatewide Information Management System (TIMS) – a computer assisted system for school bus routingand scheduling – was used to document and report on incidents of motorists passing stopped school busesreported by school bus drivers. Law enforcement agencies were provided with these data to conduct week-long stepped-up enforcement campaigns, funded in part by the grant. In addition to providing anopportunity for increased enforcement, the campaigns provided an opportunity for public awarenessthrough the local media.
The key component of this project, however, resulted from the installation of a video camera on a schoolbus in Onslow County. Stop arm violations caught on video tape provided law enforcement with additionalinformation about stop arm violations reported by school bus drivers. Working together to review theseviolations, Onslow County Transportation Director Mr. Jeff Smith and State Highway Patrol Trooper R.A.Hood developed a close working relationship that has turned things around in Onslow County. As seen inthe charts below, Onslow County’s stop arm violations have decreased significantly.
Average Daily Number of Reported ViolationsDate New Hanover Onslow PenderOctober 12-16, 1998 19.4 22.6 4.0January 19-22, 1999 22.5 15.0 2.0March 1-5, 1999 20.6 15.4 2.4January 10-13, 2000 18.75 7.5 2.25Feb 28-Mar 2, 2000 17.25 - -
The success of the video camera has spread to other North Carolina school districts. Further, it was pickedup by the media and continues to generate free publicity to bring this issue to the attention of the public. This was supplemented by statewide radio advertising and local television advertising during the project.
The project also highlighted the need for continuing training of school bus drivers on this subject andseveral important training materials were developed. These included brochures, an instructional video tapeand school bus stop arm pamphlets targeted at the public.
While it is not an exact science, the numbers clearly tell us that somewhere between 1000 and 2000 times aday across the state of North Carolina, a motorist passes a stopped school bus, endangering the lives ofstudents. School bus drivers, school district transportation staff, law enforcement and motorists have an important part to play in preventing such a risky act. Technology can be a valuable tool in this endeavorbut, like most other things, it comes down to hard work and determination. The efforts displayed byindividuals in the course of this project emphasize that and show that it is possible to better protect ourchildren by reducing these incidents.
For more information on this project, contact the Department of Public Instruction Transportation Servicesat (919) 715-1950, or the Pupil Transportation in North Carolina web page at www.ncbussafety.org.

A Cooperative Program to Reduce the Incidents of Motorists Passing Stopped School Buses in a Coastal Region of N.C
Report to the National Highway Traffic Safety Administration (NHTSA), October, 2000 3
TABLE OF CONTENTS Page
1. Introduction 42. Background and Introduction 43. Project Structure and Initial Activity 4
3.1 Agency Involvement 53.2 Kickoff Meeting 6
4. Driver Training Issues 64.1 Training of Bus Drivers 74.2 Time and Motion Study 74.3 Training Program for School Bus Drivers 9
5. Stop Arm Violation Counts 105.1 Five Day Counts 105.2 Violation Count Results 115.3 Statewide Stop Arm Violation Counts 11
6 Providing Data for Law Enforcement 137 Operation Stop Arm 15
7.1 Operation Stop Arm #1 – February 8-12, 1999 157.2 Operation Stop Arm #2 – January 24-31, 2000 15
8 School Bus Stop Arm Violation Video Surveillance 168.1 Video Cameras in Onslow County 178.2 Video Camera in New Hanover County 188.3 Other Counties 19
9 Public Awareness 199.1 Radio Advertising 199.2 Television Advertising 209.3 Press Conference 209.4 Response to Fatality in Winston-Salem 219.5 Education Materials 229.6 Public Awareness: School Bus Safety Week 1999 and North
Carolina State Fair 2210 Summary 23
10.1 Public Awareness 2310.2 The Importance of Data and Its Use 2410.3 Enforcement – An Important Key to Reducing Incidents 2510.4 Next Steps 26
Appendix A1. Project Kickoff Meeting Agenda, Participants 272. Sample Daily Stop Arm Violation Report 293. Stop Arm Violation Summary Reports 304. Statewide Stop Arm Violation Counts (2000,1999,1998,1997) 345. Sample TIMS Map Provided to Law Enforcement 466. Law Enforcement Questionnaires, Citations Issued 477. Memorandum – Clarification “Corner Bus Stops” 508. School Bus Stop Law Brochure 51
Appendix B – Kickoff Meeting PowerPoint Slides 52

A Cooperative Program to Reduce the Incidents of Motorists Passing Stopped School Buses in a Coastal Region of N.C
Report to the National Highway Traffic Safety Administration (NHTSA), October, 2000 4
1. Introduction
This report summarizes the project entitled “A Cooperative Program to Reduce the Incidents ofMotorists Passing Stopped School Buses in North Carolina.” The program was funded primarilyby the National Highway Traffic Safety Administration (NHTSA) and the North CarolinaDepartment of Public Instruction (NCDPI).
The intent of the report is to provide an account of project activity and to focus on “lessonslearned” so that other communities may benefit from the experience of this project. In addition tosome initial background information, the report describes the various aspects of the program,including providing data to law enforcement, Operation Stoparm, public awareness and the use ofvideo cameras on school buses.
2. Background and Introduction
In November, 1996, a report on the Florida stoparm study was presented at the NationalAssociation for Pupil Transportation Conference. Within two weeks of that presentation, a carthat passed their stopped school bus hit two students in Davidson County, North Carolina. Onestudent was treated and released; the other was very seriously injured. This drove home the factthat stop arm violations are not only a problem in Florida but in North Carolina as well. Takingthe lead from the Florida study, the North Carolina pupil transportation community gatheredbaseline data in April, 1997.
Of 117 school districts in North Carolina, 114 participated in a one day stop arm violation count.This yielded a result of 2,636 stop arm violations reported by drivers on April 15, 1997. The 1997stop arm violation count was instituted through a stoparm violation task force includingrepresentatives of local school districts, the Department of Public Instruction, Institute forTransportation Research and Education (NC State), Division of Motor Vehicles, State HighwayPatrol, and the Governor’s Highway Safety Program. The task force felt that in order to do anymeaningful measurement of the number of stop arm violations and any potential reductions, somebaseline data was important. The results of the one-day count were used at a press conference inAugust, 1997, to emphasize this issue before the opening of school.
The statewide count has been conducted each spring since that time. This project, made possiblethrough NHTSA funding, allowed the task force to continue working in a more proactive way tocombat motorists passing stopped school buses.
3. Project Structure and Initial Activity
The numbers of violations reported on the statewide counts in 1997 and 1998 led to the selectionof Onslow and New Hanover Counties to be included in the NHTSA project due to the relativelyhigh number of occurrences compared with other parts of the state. Pender County, locatedbetween the other two counties, was included as well, since it shares media markets with Onslowand New Hanover.

A Cooperative Program to Reduce the Incidents of Motorists Passing Stopped School Buses in a Coastal Region of N.C
Report to the National Highway Traffic Safety Administration (NHTSA), October, 2000 5
3.1 Agency Involvement
The project, coordinated by the Department of Public Instruction, was conducted by the Institutefor Transportation Research and Education (ITRE) at NC State University. Mr. Jeff Tsai, pupiltransportation program director and Ms. Cynthia Wilson, pupil transportation research associate,staffed the project.
The pupil transportation program at ITRE is responsible for the implementation of theTransportation Information Management System (TIMS). TIMS, a program of computer-assisted routing and scheduling for school buses, is used by all school districts in North Carolina. The TIMS coordinators and transportation directors in the three school systems were very heavilyinvolved, responsible for the project at the local level. Involved staff are shown below.
Onslow County SchoolsJeff Smith, Transportation DirectorBarbara Rooks, TIMS Coordinator
Pender County SchoolsThurman Casey, TIMS Coordinator & Transportation Supervisor
New Hanover County SchoolsMichael Wayne, Transportation DirectorJackie Genes, TIMS Coordinator
Law enforcement agencies in the three counties participated in the project as key participants. Education is important, but without motorists realizing that there are consequences to theiractions, a program such as this is less effective. The State Highway Patrol had been involved forsome time in working to combat stop arm violations from the patrol headquarters in Raleigh. Programs were in place where officers were directed to follow (shadow) buses and even ridebuses in order to nab motorists who disregard the stop arm. In an effort to model the OperationStop arm implemented successfully in Guilford County for a number of years, local lawenforcement agencies were asked to partner with the public schools and the Patrol to focus on thestop arm issue. The involvement of local and state law enforcement agencies was critical to thesuccess of this project.
Bus drivers in North Carolina are trained and certified by driver education specialists in theSchool Bus and Traffic Safety Section of the Division of Motor Vehicles. DMV bus drivertrainers have regular contact with bus drivers and good insight into the issues that the drivers face.DMV Specialists were instrumental in the preparation of training materials in the course of thisproject.

A Cooperative Program to Reduce the Incidents of Motorists Passing Stopped School Buses in a Coastal Region of N.C
Report to the National Highway Traffic Safety Administration (NHTSA), October, 2000 6
3.2 Kickoff Meeting
On September 21, 1998 in Burgaw, NC (Pender County) a meeting was held of key participantsin the project. The agenda for that meeting is shown in the Appendix, Exhibit 1A; the list ofattendees is shown in the Appendix, Exhibit 1B. Representatives were in attendance from all keyagencies, including school districts, State Highway Patrol, local law enforcement, Governor’sHighway Safety Program, DMV School Bus and Traffic Safety, ITRE and the Department ofPublic Instruction. A copy of the PowerPoint slides used in the introductory presentation isincluded in the Appendix, Exhibit 9 at the end of this report. While the leadership from thevarious agencies had coordinated during the NHTSA proposal process, this was the first time thatall project participants met together to discuss the project.
The most important thing that resulted from this meeting – one of the most important revelationsof the entire project - resulted from opinions expressed by members of law enforcement. Information on the statewide problem of stop arm violations to date had been based on the one-day counts from 1997 and 1998. They felt that, while a problem exists with motorists passingstopped school buses, the figures that had been published during the past two years did not reflectreality. Further, they felt that some figures were inflated because of the driving practices of someschool bus drivers. Specifically, the red flashing lights and the stop sign are not to be displayed(on most buses) until the vehicle has come to a complete stop. All too often, bus drivers attemptto control traffic by using these red lights too early. In such cases, a vehicle may appear to bepassing a school bus, but the school bus has not completely stopped. The project team agreedthat, before any stepped up enforcement was requested, a new set of baseline data would becollected, emphasizing proper procedures.
Lessons LearnedThe project was set up to involve a variety of individuals and agencies in order to reducestop arm violations most effectively. However, law enforcement staff “in the trenches”were not involved early enough in the process and, as a result, did not have the sameconviction that a serious problem existed. By the time the kickoff meeting took place, thepresentation focused on “Here’s the problem and here’s how you’re going to help us solveit.” Information should have been sent to them early on. The project team was caught offguard and had to very quickly implement some strategies to address the concerns raisedand more closely involve all participants.
4. Driver Training IssuesBetween the September 21 kickoff meeting and the first scheduled weeklong count in mid-October, a series of training sessions was conducted for all bus drivers that would be participatingin the stop arm violation counts during the project. Additional information taken from a time andmotion study pointed out the need for continual training, which resulted in the production of abrochure and a training video for school bus drivers.
A Cooperative Program to Reduce the Incidents of Motorists Passing Stopped School Buses in a Coastal Region of N.C
Report to the National Highway Traffic Safety Administration (NHTSA), October, 2000 7
4.1 Training of Bus Drivers
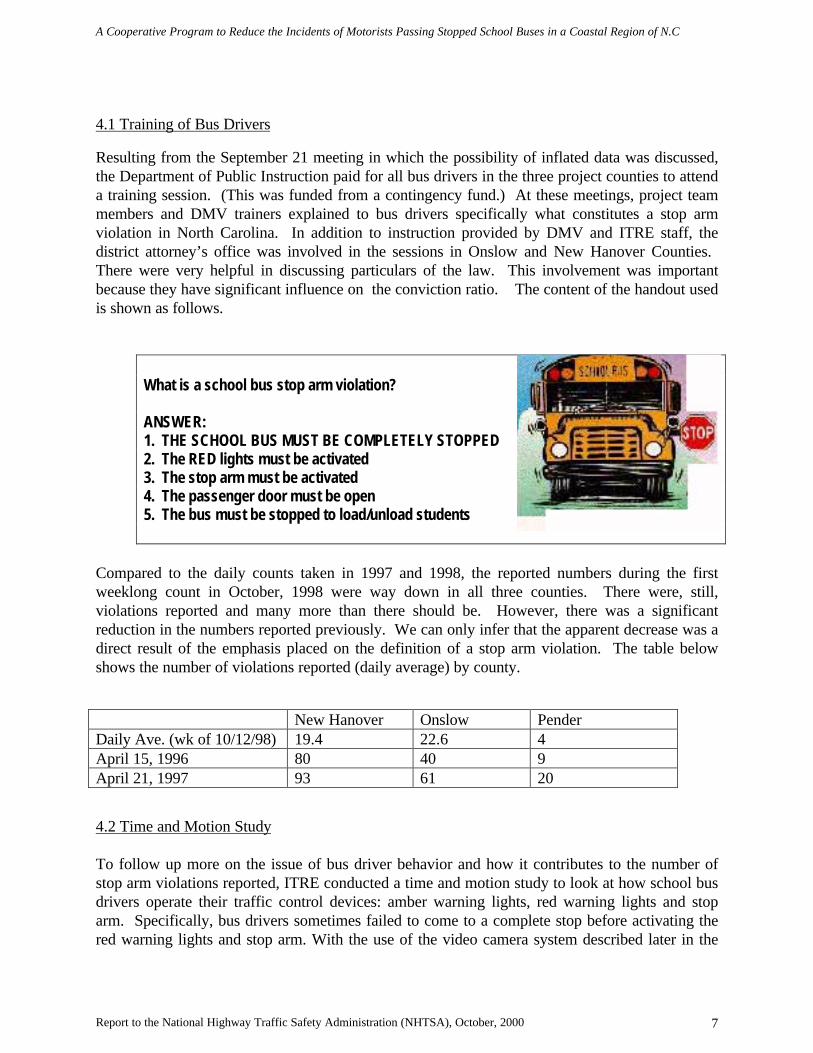
Resulting from the September 21 meeting in which the possibility of inflated data was discussed,the Department of Public Instruction paid for all bus drivers in the three project counties to attenda training session. (This was funded from a contingency fund.) At these meetings, project teammembers and DMV trainers explained to bus drivers specifically what constitutes a stop armviolation in North Carolina. In addition to instruction provided by DMV and ITRE staff, thedistrict attorney’s office was involved in the sessions in Onslow and New Hanover Counties. There were very helpful in discussing particulars of the law. This involvement was importantbecause they have significant influence on the conviction ratio. The content of the handout usedis shown as follows.
What is a school bus stop arm violation?
ANSWER:1. THE SCHOOL BUS MUST BE COMPLETELY STOPPED2. The RED lights must be activated3. The stop arm must be activated4. The passenger door must be open5. The bus must be stopped to load/unload students
Compared to the daily counts taken in 1997 and 1998, the reported numbers during the firstweeklong count in October, 1998 were way down in all three counties. There were, still,violations reported and many more than there should be. However, there was a significantreduction in the numbers reported previously. We can only infer that the apparent decrease was adirect result of the emphasis placed on the definition of a stop arm violation. The table belowshows the number of violations reported (daily average) by county.
New Hanover Onslow PenderDaily Ave. (wk of 10/12/98) 19.4 22.6 4April 15, 1996 80 40 9April 21, 1997 93 61 20
4.2 Time and Motion Study
To follow up more on the issue of bus driver behavior and how it contributes to the number ofstop arm violations reported, ITRE conducted a time and motion study to look at how school busdrivers operate their traffic control devices: amber warning lights, red warning lights and stoparm. Specifically, bus drivers sometimes failed to come to a complete stop before activating thered warning lights and stop arm. With the use of the video camera system described later in the

A Cooperative Program to Reduce the Incidents of Motorists Passing Stopped School Buses in a Coastal Region of N.C
Report to the National Highway Traffic Safety Administration (NHTSA), October, 2000 8
report, project staff at ITRE conducted a time and motion study on the operation of school bustraffic devices to identify any training needs. In North Carolina, the majority of the school buses are equipped with an eight light warningsystem. The “textbook procedure” for making a passenger stop is as follows:
• Activate the amber lights 300’ prior to the passenger stop,• Stop the bus 15’ short of the closest passenger,• Come to a complete stop, and then open the door. Opening the door activates the red
warning lights and the stop arm.
Using the recorded video, ITRE conducted the time and motion study for one bus equipped witha camera to capture exactly how the bus driver operated these traffic control devices. The firstchart shown below is the bus speed when the door is opened (which activates the red warninglights and deploy the stop arm). Ideally, the bus should come to a complete stop before the redwarning lights and stop arm are activated.
The second chart illustrates the distance traveled – for the same bus - from the point where theamber warning lights are activated to point where the red warning lights are activated. This chartassumes that the driver decelerates at the same rate for each stop.
Bus Speed When Arm Deployed
0
2
4
6
8
10
12
0 5 10 15 20 25 30 35
Stop Number
Bu
s S
pee
d (
MP
H)
Distance from Amber to Red
0
100
200
300
400
500
600
0 5 10 15 20 25 30 35
Stop Number
Dis
tan
ce in
Fee
t

A Cooperative Program to Reduce the Incidents of Motorists Passing Stopped School Buses in a Coastal Region of N.C
Report to the National Highway Traffic Safety Administration (NHTSA), October, 2000 9
The results of these two charts reveal two major operating issues:
(1) The bus driver at times will “crack open” the door to activate the red warning lights and stoparm before the bus comes to a complete stop; and
(2) The distance between the point when the amber lights are activated to the point where the busstops is inconsistent.
This study reinforced the need for the project team to continue with bus driver training activities.
Lessons LearnedDespite one training session held for all bus drivers in the project area, there are somebehaviors of some school bus drivers that may need some reinforcement to correct. Thetime and motion study, conducted several months after the project began and after the busdriver training session, pointed out that there is a need for continuing training.
4.3 Training Program for School Bus Drivers
In an effort to educate all 13,000+ bus drivers in 117 school systems in North Carolina on exactlywhat constitutes a school bus stop arm violation, a training video was produced entitled “YourSchool Bus Passenger Stop… Consistency Makes the Difference”. The six and a half minutevideotape delivers a simple but clear message to bus drivers: “The school bus warning lights andstop arm is the main way for you to communicate to motorists sharing your roadway. Consistency in how and when to operate these devices is critical, so motorists near the schoolbuses are fully aware of where and when the bus is about to make a passenger stop.” The videoalso states specifically that the following must occur in order for a passing vehicle to be guilty ofpassing the stop arm:
• the bus must be completely stopped for loading or unloading passengers• the red warning lights must be activated, and• the stop arm must be fully extended
Examples of roadway layouts are also illustrated in the video explaining when traffic in eitherdirection must stop. Over 200 copies were made and the video made its debut during the NorthCarolina Pupil Transportation Association summer conference in the week of June 21st, 1999. The video was distributed to 117 school systems and all (about 90) school bus driver trainers inthe state.
In addition to thevideo, 20,000brochures (copyenclosed) were alsoproduced for busdrivers to reiteratekey points from thetraining video. The
Your School BusPassenger Stop…
Consistency Makes TheDifference!
Length 06:47North Carolina Department Of Public Instruction
Institute For Transportation Research & Education,North Carolina State University
Funding provided by the National Highway Traffic Safety Administration

A Cooperative Program to Reduce the Incidents of Motorists Passing Stopped School Buses in a Coastal Region of N.C
Report to the National Highway Traffic Safety Administration (NHTSA), October, 2000 10
brochures were mailed to school systems just in time for school opening. Production of thetraining video and brochure was a joint effort between ITRE, the Department of PublicInstruction, the North Carolina State Highway Patrol, and the Division of Motor Vehicle, SchoolBus and Traffic Safety section. The training materials were very well received by local schooldistricts.
Lessons LearnedThe production of materials that can be used from year to year provides an opportunity tocarry forward the message rather than relying on one-time events. For instance, a driverthat may have had to miss the one-time driver meetings held in early October, 1998 willhave a chance to receive a very similar message by watching the video. Further, it can bepulled off the shelf and easily used for refresher training on an annual basis.
5. Stop Arm Violation Counts
One key to measuring the success of this project is having data measured over a period of time.The reporting process was based on the same process followed for the one-day counts that hadbeen conducted in 1997 and 1998.
5.1 Five Day Counts
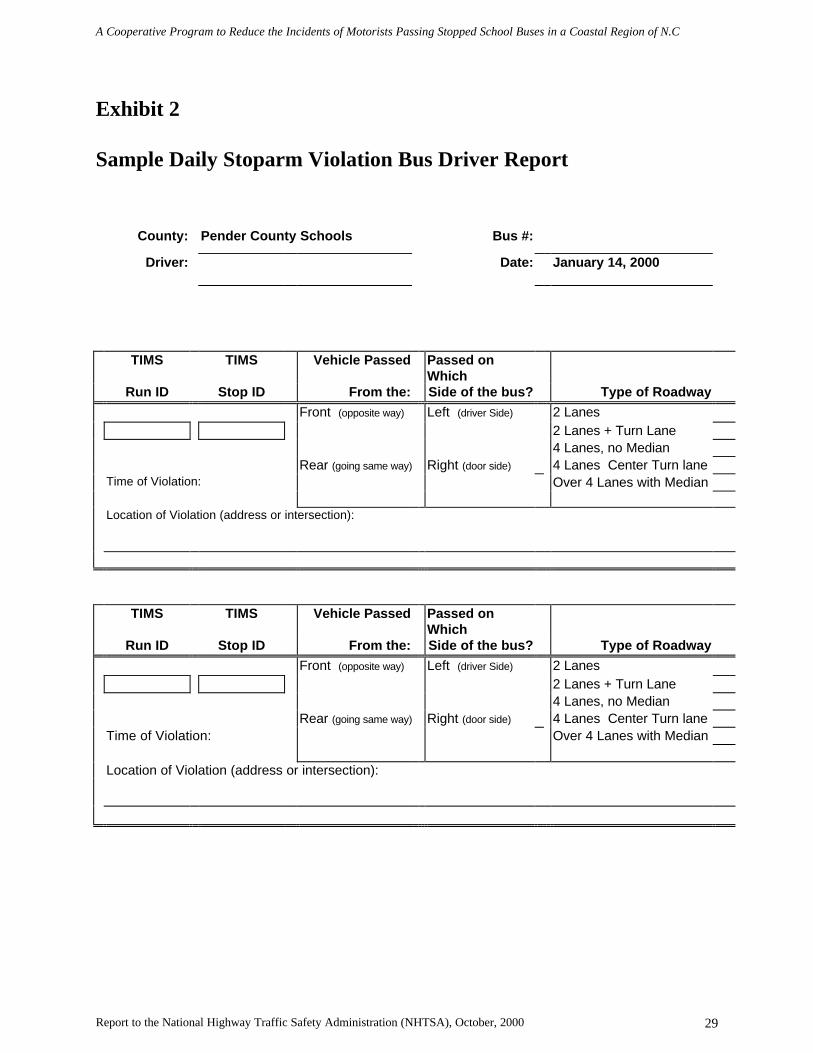
For a period of 5 consecutive days, school bus drivers were asked to count the number of timesthat a motorist passed their stopped school bus. They were to use the definitions and conceptspresented during the October, 1998 training sessions. The following information was recordedfor each violation, on the form shown in Exhibit 2 of the Appendix:
• Time of Violation• Location of Violation
• TIMS Bus Run ID• TIMS Bus Stop ID
• Whether the vehicle passed from the• Front• Rear
• Which side the vehicle passed on• Left• Right
• Type of Roadway• 2 lanes• 2 lanes + turn lane• 4 lanes• 4 lanes + turn lane• More than 4 lanes with median

A Cooperative Program to Reduce the Incidents of Motorists Passing Stopped School Buses in a Coastal Region of N.C
Report to the National Highway Traffic Safety Administration (NHTSA), October, 2000 11
The violations were to be reported regardless of whether the driver could identify the motorist orthe driver. The data collected were consistent with those items gathered statewide during the one-day counts conducted in 1997-2000.
Transportation directors were responsible for compiling the bus driver sheets and submitting themto the ITRE office for distribution to law enforcement and analysis.
Lessons LearnedThis data gathering process had been worked out pretty smoothly through the statewidecounts that were conducted in the past. We had already eliminated some data items tostreamline the report. For instance, original data were gathered on whether or not theroad was paved. That item did not add any value to the resulting data since nearly all ofthe violations occurred on paved roads, because nearly all route miles are on paved roads.
5.2 Violation Count Results
Four weeklong counts were conducted. In some cases, a 4-day count was used instead of a 5-daycount due to a school holiday. Stop arm violation counts (as well as an Operation Stop arm)were delayed in the Fall, 1999, due to Hurricane Floyd and its aftermath which hit eastern NorthCarolina, including the project area, very hard. Counts were conducted in October 1998, January1999, March 1999 and January 2000. An extra count was conducted in New Hanover County inMarch, 2000, following the television Public Service Announcements that aired in Wilmingtonduring January.
Exhibits 3A, 3B and 3C show the data reported during the four weeklong counts. The followingsummary table gives an indication of how the numbers changed through the course of the project.
Average Daily Number of Reported ViolationsDate New Hanover Onslow PenderOctober 12-16, 1998 19.4 22.6 4.0January 19-22, 1999 22.5 15.0 2.0March 1-5, 1999 20.6 15.4 2.4January 10-13, 2000 18.75 7.5 2.25Feb 28-Mar 2, 2000 17.25 - -
The measures taken in Onslow County, including video cameras and working closely with theState Highway Patrol, proved very beneficial and can be seen in the decreasing numbers. Becauseof the lack of decline in New Hanover County, the television PSA’s were targeted for thatlocation. Pender County experienced some decline from the initial count, but the numbers areconsistently low and difficult to draw any significant conclusions.
5.3 Statewide Stop arm Violation Counts
On April 28, 1999, school districts across the state participated in the third annual stop armviolation count in which each driver is asked to record instances of stop arm violations, regardless

A Cooperative Program to Reduce the Incidents of Motorists Passing Stopped School Buses in a Coastal Region of N.C
Report to the National Highway Traffic Safety Administration (NHTSA), October, 2000 12
of whether or not he/she has enough information for law enforcement to prosecute the offense. Ofthe 117 local education agencies (LEAs) in the state, 98 participated in the count. This accountsfor about 94% of the state’s 13,000 school buses.
Statewide, drivers reported 1,756 stop arm violations on this date. This was down from 1,935 theprevious year. In 1998 there was actually less participation (about 50 fewer buses). The first yearof the count, 1997, yielded 2,636 violations reported, with over 99% of buses participating. Ingeneral there is a definite downward trend, attributable – we believe – to two main factors.
• Bus drivers are more aware than ever of what exactly constitutes a stop arm violation andare doing a better job of identifying incidents what are true violations.
• Motorists are more aware of the dangers of passing stopped school buses, presumablythrough more coverage in the press than in the past.
On March 22, 2000, the fourth annual statewide count was conducted (after the end of thisproject period). The total number of violations reported was 1,511. The results for the statewidecounts are shown in the Appendix , Exhibits 4A-4D.

A Cooperative Program to Reduce the Incidents of Motorists Passing Stopped School Buses in a Coastal Region of N.C
Report to the National Highway Traffic Safety Administration (NHTSA), October, 2000 13
Legend
VIOLATIONS
STREET NAMES
CITY LIMIT
Onslow County,NC
January 10-13,
6. Providing Data for Law Enforcement
One of the main emphases of the project was to provide information to law enforcement on thelocations of reported stop arm violations. Stop arm violation count data were compiled and,through the Transportation Information Management System (TIMS), maps and reports weregenerated to indicate exact locations of reported violations. All bus stops in each county are inthat county’s TIMS database. TIMS, which is normally used for bus routing, was used togenerate the reports and maps to provide some geographical reference for use by lawenforcement. A sample screen from TIMS displaying bus stop locations is shown below.
The first step in the process is to identify the locations of the stop arm violations. Bus driversreported these on the Bus Driver Survey Form described earlier and summarized on the countyreporting form.
The Bus Stop ID’s from TIMS were then entered into a spreadsheet and cross-referenced withthe TIMS Database. From this, a report was generated that indicated the bus stop locationswhere the reported violations occurred.

A Cooperative Program to Reduce the Incidents of Motorists Passing Stopped School Buses in a Coastal Region of N.C
Report to the National Highway Traffic Safety Administration (NHTSA), October, 2000 14
1/19/99
ONSLOW COUNTYREPORTED STOP ARM VIOLATIONS
JANUARY 19, 1999 Vehiclepassed from
Passed onwhich side Type of Roadway
Stop ID ofViolation:
AM PM Stop Description Front Rear Left Right 2 Lns 2Ln+turn
4Ln,no
med.
4Ln+turn
> 4 Lnw. med.
324814 6:00 113 NEW RIVER DR x x x304024 7:45 367 BELL FORK RD x x x312125 3:30 CORNER BELL FORK RD & CAVINESS DR x x x312101 3:41 126 BELL FORK RD x x x312101 3:41 126 BELL FORK RD x x x344183 7:55 HICKORY HILLS TRAILER PARK x x x343173 7:08 BEYOND PONY FARM/HWY 53 AT FLOYD TRANS x x x343008 3:17 JUST BEFORE INTERSECTION OF HWY 53 &
PONYx x x
308030 2:23 4332 RICHLANDS HWY – RIGHT x x x345215 2:50 641 BEN WILLIAM RD x x x314254 7:15 742 N 17 W x x x321002 7:30 2390 PINEY GREEN RD x x x322023 7:25 2331 PINEY GREEN RD x x x322213 7:46 CORNER LAKE COLE RD & ROCKY RUN x x x351174 6:40 CORNER HWY 172 & WILLOW ST x x x670002 2:55 125 BELL FORK ROAD x x x
The graphical output that corresponds to this report is shown in the Appendix A, Exhibit 5.
After the first count in October, 1998, the process was fine-tuned. Data from the January 1999count were mapped and reported to various law enforcement agencies. The maps and reportswere sent through the mail to the various law enforcement agencies. Possibly because this wasearly in the project and there was not sufficient “buy in” from law enforcement, it appears thatthese data were not used extensively during February. All subsequent distributions of maps andreports were done in person either by ITRE staff or LEA transportation staff to ensure a clearcommunication of expectations.
Lessons LearnedThe geographic tools available for doing school bus routing are very well suited to beingused for locating stop arm violations. Rather than recording physical descriptions ofviolations, drivers simply had to record the TIMS bus stop number. Since stop armviolations, by definition, occur at bus stops, all of the potential locations for violations arepre-loaded in the routing system. Even though this seemed to be a very good way todistribute the information, law enforcement agencies tended to rely on more traditionalmethods (see following discussion under Operation Stop Arm).
A Cooperative Program to Reduce the Incidents of Motorists Passing Stopped School Buses in a Coastal Region of N.C
Report to the National Highway Traffic Safety Administration (NHTSA), October, 2000 15
7. Operation Stop Arm
One of the key components of the project was specific time periods to be identified for stepped upenforcement. This was modeled after a successful program in Guilford County where all lawenforcement agencies joined together to focus on the stop arm problem for a specified week. Inpreparation for Operation Stop Arm, NHTSA grant funds were used to contract with the StateHighway Patrol for additional trooper hours in New Hanover and Onslow Counties, in addition tothe regularly assigned hours dedicated to school bus issues.
7.1 Operation Stop Arm # 1 – February 8-12, 1999
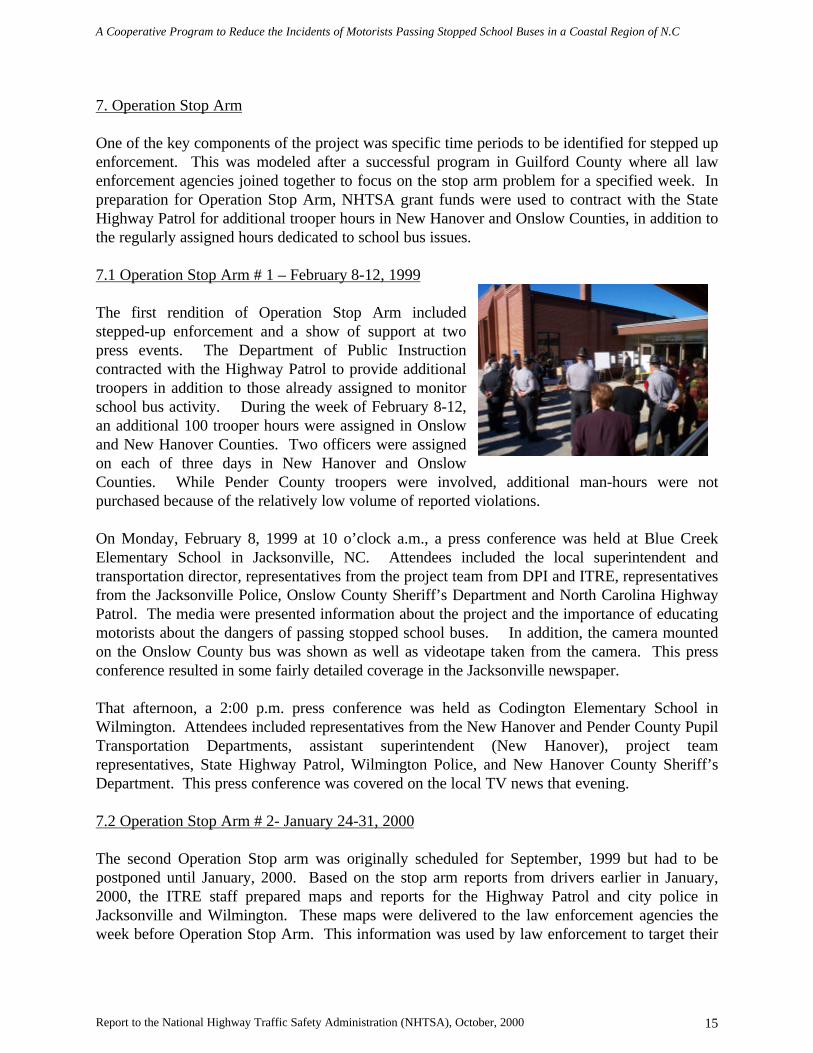
The first rendition of Operation Stop Arm includedstepped-up enforcement and a show of support at twopress events. The Department of Public Instructioncontracted with the Highway Patrol to provide additionaltroopers in addition to those already assigned to monitorschool bus activity. During the week of February 8-12,an additional 100 trooper hours were assigned in Onslowand New Hanover Counties. Two officers were assignedon each of three days in New Hanover and OnslowCounties. While Pender County troopers were involved, additional man-hours were notpurchased because of the relatively low volume of reported violations.
On Monday, February 8, 1999 at 10 o’clock a.m., a press conference was held at Blue CreekElementary School in Jacksonville, NC. Attendees included the local superintendent andtransportation director, representatives from the project team from DPI and ITRE, representativesfrom the Jacksonville Police, Onslow County Sheriff’s Department and North Carolina HighwayPatrol. The media were presented information about the project and the importance of educatingmotorists about the dangers of passing stopped school buses. In addition, the camera mountedon the Onslow County bus was shown as well as videotape taken from the camera. This pressconference resulted in some fairly detailed coverage in the Jacksonville newspaper.
That afternoon, a 2:00 p.m. press conference was held as Codington Elementary School inWilmington. Attendees included representatives from the New Hanover and Pender County PupilTransportation Departments, assistant superintendent (New Hanover), project teamrepresentatives, State Highway Patrol, Wilmington Police, and New Hanover County Sheriff’sDepartment. This press conference was covered on the local TV news that evening.
7.2 Operation Stop Arm # 2- January 24-31, 2000
The second Operation Stop arm was originally scheduled for September, 1999 but had to bepostponed until January, 2000. Based on the stop arm reports from drivers earlier in January,2000, the ITRE staff prepared maps and reports for the Highway Patrol and city police inJacksonville and Wilmington. These maps were delivered to the law enforcement agencies theweek before Operation Stop Arm. This information was used by law enforcement to target their

A Cooperative Program to Reduce the Incidents of Motorists Passing Stopped School Buses in a Coastal Region of N.C
Report to the National Highway Traffic Safety Administration (NHTSA), October, 2000 16
areas of observation. During this week there was also news coverage of Operation Stop Armstimulated by a press release issued by the Department of Public Instruction.
Surveys were completed by two Highway Patrol representatives and are shown in Appendix A,Exhibit 6A, B. In addition, a summary of the citations issued by officers during this week ofstepped up enforcement is shown in the Appendix, Exhibit 6C.
Lessons LearnedLaw enforcement agencies are very willing to show their support for safety initiatives suchas this. However, they need to be involved in the entire process. The project team wentinto the project with the thought that using “our” data would be the best way for lawenforcement to approach “their” enforcement efforts. There was not the closecommunication that was needed in order for them to provide input into the form or formatof the data that could be supplied. Further, the maps and reports only duplicated what thecounty schools already knew in terms of “hot spots” of violation report. As a result, therewas not the value added to the project that was originally anticipated.
8. School Bus Stop Arm Violation Video Surveillance One of the technologies that the project team wanted toinvestigate was the use of video cameras to “nab” stop armviolators. There had been some work done in this area, butno technology had been identified for use in schooltransportation that could effectively deal with the problem.Onslow County Schools was the first in North Carolina toinstall a video camera system to monitor school bus stoparm violation activities: a SilentWitness System SWS310system equipped with a weatherproof camera. The camera head measures barely over 3” x 2 ¾”. The camera has a unique locking system so it can be removed easily from the bus for security atthe end of day. The recorder is an industry standard VHS analog recording system that is capableof recording electronic sensor activities. The installation at Onslow County records time, busspeed, activation of amber warning lights, activation of red warning lights and stop armdeployment. This system is widely used for in-bus surveillance purposes in U.S. and Canadaschool districts. The installation in Onslow County is the first application of this technology forschool bus stop arm violations. The equipment described in this section was funded by theDepartment of Public Instruction.

A Cooperative Program to Reduce the Incidents of Motorists Passing Stopped School Buses in a Coastal Region of N.C
Report to the National Highway Traffic Safety Administration (NHTSA), October, 2000 17
In the sequence below, a vehicle is shown approaching and passing the school bus while it isstopped. The time stamp also indicates that the lights are RED and the speed is 0 m.p.h.
8.1 Video Cameras in Onslow County
The results of the implementation of this technology in Onslow County were very different thanwhat was originally envisioned. In Onslow County, the most important advantage of videotapingstop arm violations for this project was providing law enforcement officials with “hard evidence”that the problem existed. A general perception by law enforcement was that the numbers ofreports were highly inflated, fueled somewhat by thedriver behavior issues discussed previously. Prior tothis project, law enforcement officers did not have astandard procedure established to follow-up reportedviolations. Reports were handled differently dependingon the individual trooper. In many cases, if the busdriver could not positively identify the perpetrator,then the report was marked as “incomplete” anddropped.
As a result of the videotaping, Onslow County now has a dedicated trooper that responds to stoparm violation reports, works closely with school transportation personnel and is involved indrivers’ training. One example of such a relationship was illustrated in the February 2, 1999memo regarding proper procedure to make a “corner bus stop” (Exhibit 7) which was initiated bylaw enforcement and the district attorney.
The video camera technology is not sufficiently sophisticated to reveal license tag numbers, oreven to identify the driver. But it is sufficient for the highway patrol to use as the basis for afollow-up investigation and, in many cases, motorists have pleaded guilty (to passing a stoppedschool bus or possibly a reduced charge) without ever going to court.
It is also noted that the involvement of the district attorney is critical to the success of this project.In Onslow County, the majority of violators are now not going to court. Rather they are pleading

A Cooperative Program to Reduce the Incidents of Motorists Passing Stopped School Buses in a Coastal Region of N.C
Report to the National Highway Traffic Safety Administration (NHTSA), October, 2000 18
guilty and the charge is reduced from a school bus stop arm violation (5 points) to improperpassing (4 points). At first glance, this might seem to be a “watering down” of the punishment, 4points is still a major violation that impacts not only the driver’s license, but insurance costs aswell. After learning that they were caught on videotape, very few violators decide to go to trial. Afew of the charges were not reduced due to unusual circumstances. Onslow County has beenvery successful in increasing the conviction rate of motorists that pass stopped school busesbecause the videotape has served as a catalyst for cooperation between law enforcement, thepublic schools and the district attorney.
Lessons Learned. This sense of cooperation is the “big story” in this project. The focus on stop armviolations and the implementation of the video technology brought the school systemtransportation staff and law enforcement agencies together to work toward a common goal. While each group had dealt with the issue in its own way prior to the project, thevideotaped evidence and exchange of information helped to increase convictions ofreported violations and the resulting publicity has helped to decrease overall violations. Itcomes down to the close working relationship developed by Transportation Director JeffSmith and State Trooper R. A. Hood.
8.2 Video Cameras in New Hanover County
One of the very important issues identified by the project team from the success in OnslowCounty is the need to convince law enforcement agencies of the magnitude of the stop armviolation problem. The school stop arm violation is the ONLY type of traffic violation in NorthCarolina where law enforcement relies on citizens’ reports; therefore, it is important to presentsufficient evidence. This project showed that videotaping of actual stop arm violations was theconvincing factor for Onslow County’s law enforcement agencies.
Since New Hanover County had not seen significant reductions in reported violations in the lastthree counts, two video cameras identical to the ones installed in Onslow County were installedon buses there. A concerted effort was put forth by the New Hanover County Schoolstransportation staff during the week of a stop arm violation count in January 10-13, 2000 torecord all violations and share the information with law enforcement agencies. Project teammembers made a personal visit to meet with city and state law enforcement officials in NewHanover County. They reviewed video clips, violation maps and other statistics. The NewHanover County school transportation personnel and project team members felt that the videoclips of violations made a significant impact.
Again, while the videotapes did not show positive identifications of drivers or license tags, theyprovided a point of reference for the school staff and law enforcement staff to talk from.
In New Hanover County, while significant interest was developed initially between theWilmington Police, Highway Patrol and local schools, the continuity seen in Onslow Countynever materialized during the remainder of the school year. At this writing, school has been out
A Cooperative Program to Reduce the Incidents of Motorists Passing Stopped School Buses in a Coastal Region of N.C
Report to the National Highway Traffic Safety Administration (NHTSA), October, 2000 19
for the summer, so what proactive efforts may materialize during the 2000-01 school year remainto be seen.
8.3 Other Counties
Several school systems, based on the Spring, 1999 statewide stop arm violation count, were giventhe opportunity to place external video cameras on buses to observe stop arm violations. Thisincluded additional cameras in Onslow County and new cameras in New Hanover County – bothin the project area. In addition, cameras were purchased by the Department of Public Instructionfor Winston Salem/Forsyth County Schools (where a stop arm fatality occurred). The staff at theInstitute for Transportation Research and Education (ITRE) worked directly with the camerasupplier on the project and discussed the need for new technology to improve the image of thetapes. At this time, the cost of development for this application seems to be keeping themanufacturer from making much progress in this area.
9. Public Awareness
One of the key aspects of this project was to investigate ways to heighten public awareness of thedanger associated with passing a stopped school bus. It is the feeling of task force members that,if people realize the danger involved, they will be less likely to pass the stop arm. A number ofapproaches were used to get this word out. Unfortunately, it is difficult to measure theeffectiveness of any one approach. But, to be sure, any amount of education of the public is moreeffective then no education of the public.
9.1 Radio Advertising
The North Carolina Department of Public Instruction entered into a partnership with AlltelCommunications for a program of radio advertising featuring a message that motorists should beaware of the dangers of passing stopped school buses. The partnership called for the publicservice announcements to be aired during August before school started, during National SchoolBus Safety Week in October and during the first two weeks in January as students returned fromthe holiday vacation. In exchange for a brief tag line at the end of the commercial, Alltelpurchased about $42,000 in airtime matched by $8,000 in state funds from the Department ofPublic Instruction. The public service message was aired on the eight-five affiliate stations of theNorth Carolina News Network.
Lessons Learned.Advertising is very expensive. Given the limits of public funding for school transportation,such a program is virtually impossible without external sponsorship. The partnership withAlltel gave that company a way to become associated with a “cause” and provided themeans for joint participation in the exhibit at the state fair, etc. There was no real way tomeasure how effective the campaign was, but using this statewide radio network provideda means to reach a large segment of the population.

A Cooperative Program to Reduce the Incidents of Motorists Passing Stopped School Buses in a Coastal Region of N.C
Report to the National Highway Traffic Safety Administration (NHTSA), October, 2000 20
9.2 Television Advertising
The 30 second Public Service Announcement “The Bus Stops Here” was produced jointly by theDepartment of Public Instruction and the DMV School Bus and Traffic Safety Section withassistance from the Stop Arm Violation task force prior to the NHTSA project. (The PSA can beseen online at http://itre.ncsu.edu/GHSP/stream.html.) Since it was originally produced, it hasbeen distributed to various TV stations from time to time with a plea to air it as a public serviceannouncement free of charge. This met with very little success.
In order to ensure that the PSA was aired, advertising time was purchased in Wilmington where itwas aired at least 100 times during the week of Operation Stop Arm in January, 2000. Paid forby the Department of Public Instruction, three TV stations (ABC, NBC and WB) aired thecommercial during this one-week period. There was even an airing during the Super Bowlpreview show! The total cost, paid by the Department of Public Instruction was $4425.
Lessons Learned:Advertising is very expensive. Given the limits of public funding for school transportation, such aprogram is virtually impossible without external sponsorship. There was no real way to measurehow effective the campaign was; however, the count that was conducted in March AFTER thecampaign showed slightly lower numbers of violations reported compared to the count BEFOREthe campaign. The PSA was also shown during a period of time when there was some additionalpress coverage from Operation Stop Arm.
9.3 Press Conferences
Earlier in the report, information was provided on the press conferences in Onslow and NewHanover Counties during Operation Stop Arm in early 1999. The show of support from theschool system, law enforcement and state agencies guaranteed at least some coverage on the newsthat day. This is publicity that is much less expensive than paying to air a public serviceannouncement.
Later that year, a task force initiated by the Division of Motor Vehicles was assembled inresponse to two loading zone fatalities at the end of the 1998-99 school year. One was a stoparm violation fatality reported last quarter; the other was an incident where a student who hadalready left the bus ran back in front of it.

A Cooperative Program to Reduce the Incidents of Motorists Passing Stopped School Buses in a Coastal Region of N.C
Report to the National Highway Traffic Safety Administration (NHTSA), October, 2000 21
Press conferences were held in Raleigh on August 12, 1999 and in Winston-Salem and Charlotteon August 13. Participants in the press conferences included the State Superintendent (above,right), the DMV commissioner and Secretary of Crime Control and Public Safety (above, left) aswell as state troopers and other agencies representatives. Visuals included poster depictions ofthe school bus stop arm law and a computer kiosk (above, right) focusing on North Carolina’sschool bus safety web application for students. By holding three different press events in differentparts of the state, interest was generated by several media that would not have covered the storyotherwise.
Lessons Learned:Including high profile officials – such as the heads of state agencies and departments – ensuresdecent press coverage at events such as those described above. The 30 seconds to three minutesof coverage on the evening news is free and much more cost effective than paying to air publicservices announcements. Also, the involvement of these individuals bolsters their support for andincreases their familiarity with the issue.
9.4 Response to Fatality in Winston-Salem
Unfortunately, at the same time that this key project activity was underway, North Carolinaexperienced the death of a student (whose father, ironically, was a member of the local board ofeducation) when a motorist passed a stop school bus in Winston-Salem. The incident wasparticularly disturbing in that the primary cause was an area not targeted in any of the work thathas been done thus far in the area of education and prevention:
• The motorist was a lady from out of the country driving a rental car.• She carried only an International driver’s license.• In her country (Costa Rica) she stated that motorists are not required to stop for
school buses.
Based on this event, the project team is exploring the concept of providing a written descriptionof the school bus stop arm law to rental car agencies.

A Cooperative Program to Reduce the Incidents of Motorists Passing Stopped School Buses in a Coastal Region of N.C
Report to the National Highway Traffic Safety Administration (NHTSA), October, 2000 22
This tragic event led to the formulation of a local task force in Winston-Salem. While not in theproject area, it serves as a model for other school systems. The task force involved staff from theschool system, law enforcement, district attorney’s office and judges. The group held a variety ofpress events to send the message clearly to the public that passing a stopped school bus can – anddoes – have deadly consequences for students.
One of the real tragedies is that such a devastating event had to take place to spur the communityto action. Across the state of North Carolina, of the 96 counties that were neither involved in theNHTSA project nor suffered a fatality, only a small handful have taken a proactive approach toreducing stop arm violations.
Lessons Learned:A tragedy such as the death of a student – and few things are more tragic – served as the catalystto pull together community agencies to promote school bus safety. The show of support from thelegal system, law enforcement and the school system got the attention of the community and,through this deadly example, the public was educated. By assembling the task force andproactively taking their message to the public through press conferences, etc. the school systemtook a terrible situation and generated something positive.
9.5 Education Materials
For quite some time, the Division of Motor Vehicles School Bus and Traffic Safety Section hasproduced a brochure that details the state’s school bus stop arm law. During the course of thisproject, the brochure was refined to provide additional examples of when vehicles have to stop ona variety of road configuration (e.g. 4 lane, 2 lanes plus a turn lane, etc.). Through the NHTSAgrant, 200,000 of these brochures were printed. The brochure is shown in Exhibit 8. These willbe distributed at the State Fair and are available for school districts to use at local fairs andexhibits or other for other needs.
Lessons Learned:An important part of public awareness is talking to people about the issue, whether at a pressevent, one-on-one, at a community event or elsewhere. Having something in writing that explainsto people the rules of the school bus stop sign is very important, especially as the rules aredifferent from one state to the next. This brochure serves as that vehicle.
9.6 Public Awareness: School Bus Safety Week 1999 and North Carolina State Fair
Two main activities took place during National School Bus Safety Week in North Carolina. First,our partnership with Alltel resulted in statewide radio advertising for a week. The message,which encourages motorists to not pass a stopped school bus, aired on the eight-five affiliatestations of the North Carolina News Network (NCNN).

A Cooperative Program to Reduce the Incidents of Motorists Passing Stopped School Buses in a Coastal Region of N.C
Report to the National Highway Traffic Safety Administration (NHTSA), October, 2000 23
During the North Carolina State Fair, which ran October 15-24, 1999, an outdoor exhibit was setup to focus on school bus safety and education regarding the school bus stop arm law. Theexhibit featured the following three large props:
• A 1999 conventional school bus• A 1961 (restored) school bus• A kiosk provided by Alltel allowing visitors to
make free local phone calls (a large banner over thekiosk reads Alltel Supports School Bus Safety)
Volunteers from school districts around the state(including Pender and Onslow counties in the studyarea) staffed the exhibit. They passed out stickers tokids and passed out copies of the stop arm law to fairgoers. Inside the “new” school bus, a continuous airing of several public service announcements(focusing primarily on the stop arm law) was played.
Lessons Learned:There are a number of benefits to this type of public awareness. First, it provides an opportunityfor citizens from around the state to become aware of some important school bus safety issues. One of the most important things in the exhibit is for people to be able to get on a school bus andsee the safety features built into the construction of today’s bus. It also provides an opportunityfor them to receive information on the school bus stop arm law. An important side benefit isinvolving school districts from around the state in this effort and the team building that it fosters.
10. Summary
The proposal that led to this project funded by NHTSA laid out an approach that built onhistorical data and systems to provide information to law enforcement for stepped upenforcement and public awareness for motorist education. As the project progressed,some aspects played out as expected and some unexpected lessons were learned.
10.1 Public Awareness
One of the keys to reducing the incidents of motorists passing stopped school buses is makingpeople aware of the danger to kids. Over the course of this project there were two categories ofeducation: activities involving significant cost and those involving little or no cost.
Television advertising is very expensive. DPI spent over $4000 to broadcast the public servicemessage during one week in January 2000 in one television market (Wilmington). Thepartnership with Alltel made it possible to take limited state funds ($8000) along with Alltel’smatch ($42,000) and broadcast a public service message on the radio statewide during 4-5 weeksover the course of the school year.

A Cooperative Program to Reduce the Incidents of Motorists Passing Stopped School Buses in a Coastal Region of N.C
Report to the National Highway Traffic Safety Administration (NHTSA), October, 2000 24
The Alltel partnership also developed a relationship whereby the company provided promotionalitems for the state fair exhibit, free print “advertising” on their Community Watch page in thenewspaper and more. The value of this public/private partnership should not be underestimated.
A disadvantage that state governments and local school districts have in getting their message tothe public is limited financial resources. However, an advantage that they have is access to themedia in making news. Several media events during the course of this project resulted incoverage during the 6:00 news. For instance, the back to school press conferences featuringleaders of state agencies generated interest from TV and radio stations in each media marketwhere the event was held. Further, the press conferences held before the first Operation Stop armfeatured the first video camera installed on a school bus in Onslow County. Not only did themedia cover the press conference; they also followed up and featured numerous stories on thevideo cameras.
In terms of this particular project, the most important lessons learned were (1) the value ofpartnering to find resources to get the message on the air and (2) the value of “making our ownnews” through media events. It is difficult – if not impossible – to measure the effectiveness ofthe advertising campaigns. But, it is absolutely certain that more people in North Carolina heardthe message of stop arm safety than they would have in the absence of the advertising efforts.
10.2 The Importance of Data and Its Use
The reason that North Carolina submitted an application to NHTSA for this project wasdue to a need for reducing stop arm violations demonstrated through historical data. There is a lot of value in having a wealth of information on this subject. But, in additionto presenting the data, it must be explained and possibly defended.
Modeled after the 1996 Florida Study, the data collection process of asking school busdrivers to document and report stop arm violations has worked very well for over 4 yearsin North Carolina. The key data elements have been refined so that the data gathered areuseful, but not too burdensome for the bus driver.
The state’s stop arm task force, initiated in 1997, included representatives of the StateHighway Patrol (SHP) representing the law enforcement community. The SHP alsosupported the application for this grant. However, when the NHTSA grant kickoffmeeting took place, the project team was surprised to learn that the law enforcementcommunity (whose involvement was a critical part of the project strategy) was veryskeptical of the historical data leading up to this point. In short, they didn’t believe that thenumber of violations was as high as reported. And, while the number of violations is stillhigh, the earlier reports were, indeed, exaggerated. In the opinion of the project team, thisexaggeration was due to bus drivers counting some incidents as violations when, indeed,they were not (possibly because the bus was not completely stopped).
This provided an opportunity (by necessity) to train bus drivers in the project area aboutwhat exactly constitutes a stop arm violation. Materials developed for this purposeinclude the video “Your School Bus Stop – Consistency Makes the Difference.” Had it
A Cooperative Program to Reduce the Incidents of Motorists Passing Stopped School Buses in a Coastal Region of N.C
Report to the National Highway Traffic Safety Administration (NHTSA), October, 2000 25
not been for the discussion about bus drivers’ procedures, this training opportunity wouldhave been lost. Further, the materials developed can be used for continuing training forbus drivers for some time to come.
The approach of using the geographical data from TIMS was quite unique. Because thebus drivers were already using TIMS output for their route descriptions, cross-referencingthe bus stops with the reported incidents was very straightforward. The project team wasable to use TIMS to generate reports and maps specific to reported stop arm violations. This resource was not used to a large extent during Operation Stop arm; rather, officerschose to rely on their own knowledge of the geography and previous reports. In order tointegrate the data in law enforcement, a more detailed training process – includinginvolvement up front from the field – is needed.
10.3 Enforcement – An Important Key to Reducing Incidents
Ultimately, it is up to state and local law enforcement agencies to cite motorists for failureto stop for a stopped school bus. Bus drivers and school transportation officials do nothave the enforcement authority. Judges and District Attorneys cannot prosecute andsentence motorists without the citation. So, the officer is the key to enforcing the stop armviolation law. As mentioned previously, these officers in general, were skeptical of theinitial data and this dampened their enthusiasm at the outset.
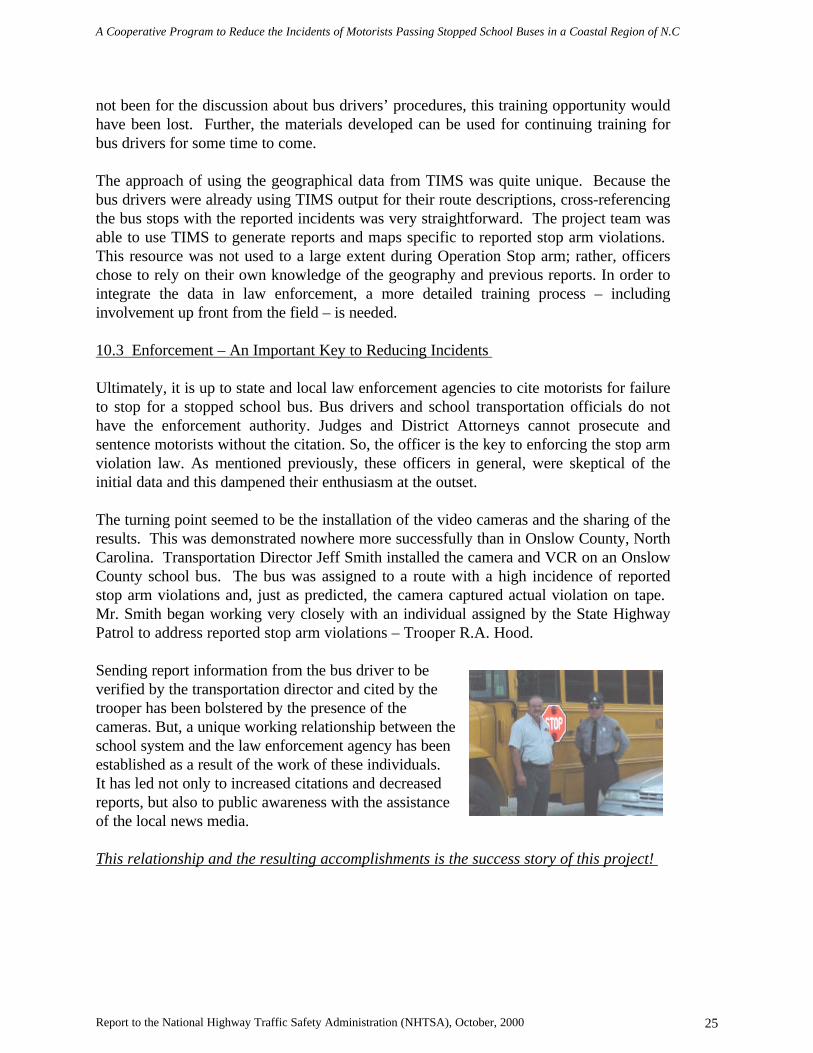
The turning point seemed to be the installation of the video cameras and the sharing of theresults. This was demonstrated nowhere more successfully than in Onslow County, NorthCarolina. Transportation Director Jeff Smith installed the camera and VCR on an OnslowCounty school bus. The bus was assigned to a route with a high incidence of reportedstop arm violations and, just as predicted, the camera captured actual violation on tape. Mr. Smith began working very closely with an individual assigned by the State HighwayPatrol to address reported stop arm violations – Trooper R.A. Hood.
Sending report information from the bus driver to beverified by the transportation director and cited by thetrooper has been bolstered by the presence of thecameras. But, a unique working relationship between theschool system and the law enforcement agency has beenestablished as a result of the work of these individuals. It has led not only to increased citations and decreasedreports, but also to public awareness with the assistanceof the local news media.
This relationship and the resulting accomplishments is the success story of this project!

A Cooperative Program to Reduce the Incidents of Motorists Passing Stopped School Buses in a Coastal Region of N.C
Report to the National Highway Traffic Safety Administration (NHTSA), October, 2000 26
10.4 Next Steps
In the time that has passed since the end of the project and the preparation of thisdocument, several of the project initiatives continue to go forward. Onslow County nowhas four video cameras. Other counties with cameras mounted on buses (or that havebeen ordered) include Lee, New Hanover, Forsyth and Craven Counties. The message forthose school systems is to use the video as a tool to establish or build on an excellentworking relationship between the school district and law enforcement.
The partnership with Alltel has been renewed and the message “The Bus Stops Here….and So Should You.” is being aired statewide via the North Carolina News radionetwork. Alltel is also helping to sponsor the state fair exhibit. (Because of the costinvolved, television advertising will probably not be pursued in the absence of somecorporate sponsorship.)
The education materials developed will continue to be used for public awareness andtraining of bus drivers. As a result of this project, bus drivers are more aware than ever ofwhat exactly constitutes a stop arm violation and are doing a better job of identifyingincidents what are true violations. The video and brochures can be used for drivers yearafter year as part of continuation training.
By making the results of this study available to all school districts in North Carolina, it isanticipated that others will have the chance to make the progress seen in this project.LEAs statewide are encouraged to adopt the public awareness approach, the technologyand the data-based strategies demonstrated in this project. If they are willing to worktoward the type of cooperation demonstrated by Jeff Smith and Trooper R.A. Hood inOnslow County, there is no question that the incidents of motorists passing stoppedschool buses will be reduced.

A Cooperative Program to Reduce the Incidents of Motorists Passing Stopped School Buses in a Coastal Region of N.C
Report to the National Highway Traffic Safety Administration (NHTSA), October, 2000 27
Exhibit 1A
A Cooperative Program to Reduce Incidents of Vehicles Passing StoppedSchool Buses in Onslow, Pender and New Hanover Counties
Meeting AgendaBurgaw, NC
Monday, September 21, 1998
I. WELCOME /INTRODUCTIONS/Project Overview..…. Derek GrahamDPI Transportation Services
II. LAW ENFORCEMENT INVOLVEMENT
Officer on the Bus……. …………………………….. Sgt. Jeff WinsteadStop for the School Bus NC Highway Patrol
B. Operation Stop Arm……………………………………. Jim MoenGuilford County Schools
Sgt. Ray PuckettGuilford County Sheriff’s Office
III. DATA GATHERING
A. TIMS Overview………………………………………….. Jeff TsaiInstitute for TransportationResearch & Education (ITRE)
B. Data Gathering………………………………………… Cynthia WilsonITRE
IV. TECHNOLOGY APPLICATIONS…………………………… Jeff TsaiITRE
Onboard computers and Video Cameras
V. PUBLIC AWARENESS
Public Service Announcement ………………………….. Derek Graham
VI. NEXT STEPS

A Cooperative Program to Reduce the Incidents of Motorists Passing Stopped School Buses in a Coastal Region of N.C
Report to the National Highway Traffic Safety Administration (NHTSA), October, 2000 28
Exhibit 1BKickoff Meeting Attendees
Monday, September 21, 1998Burgaw, NC
Name, Organization Name, Organization
Jeff Smith * Donnie Smith – Lumberton Dist 4
Onslow County Schools * DMV School Bus Traffic Safety
Barbara Rooks * Joan Silvey
Onslow County Schools * DMV School Bus Traffic Safety
Jeri Blick * Charles Mitchell
Onslow County Schools * DMV School Bus Traffic Safety
Dr. Ron Singletary * Mick Wayne
Onslow County Schools * New Hanover County Schools
Pete Andrews * Jackie Genes
Onslow County Schools * New Hanover County Schools
Deputy Bright *
Jacksonville PoliceDepartment
* Governors Highway Safety Prog
Sargent Houston * Capt Apple
Jacksonville PoliceDepartment
* Highway Patrol
Jerry Faulk * Sgt. Strickland
Pender County Schools * New Hanover
Thurman Casey * Sgt. Dewane Ward
Pender County Schools * New Hanover Sheriff Dept.
Billy Sugg * Jim Moen
NCDPI * Guilford County
Derek Graham * Sgt. Jeff Winstead
NCDPI * State Highway Patrol
Jeff Tsai * Capt. David West
NCSU-ITRE * Onslow County Sheriff Dept.
Cynthia Wilson * Capt. Paul Brian
NCSU-ITRE * Onslow County Sheriff Dpet
Tracey Ennis * 1st Sgt. Christopher
DMV School Bus Traffic Safety * State Highway Patrol
Sargent Austin Nevi * Keith Hinkle
Wilmington Police Dept * Burgaw Police Dept
A Cooperative Program to Reduce the Incidents of Motorists Passing Stopped School Buses in a Coastal Region of N.C
Report to the National Highway Traffic Safety Administration (NHTSA), October, 2000 29
Exhibit 2
Sample Daily Stoparm Violation Bus Driver Report
County: Pender County Schools Bus #:
Driver: Date: January 14, 2000
TIMS TIMS Vehicle Passed Passed onWhich
Run ID Stop ID From the: Side of the bus? Type of Roadway
Front (opposite way) Left (driver Side) 2 Lanes2 Lanes + Turn Lane4 Lanes, no Median
Rear (going same way) Right (door side) 4 Lanes Center Turn laneTime of Violation: Over 4 Lanes with Median
Location of Violation (address or intersection):

A Cooperative Program to Reduce the Incidents of Motorists Passing Stopped School Buses in a Coastal Region of N.C
Report to the National Highway Traffic Safety Administration (NHTSA), October, 2000 30
Exhibits 3A, 3B, 3C
Stoparm Violation Summary ReportsResults of Four One-Week Counts of Stop arm Violations
• New Hanover County• Onslow County• Pender County

A Cooperative Program to Reduce the Incidents of Motorists Passing Stopped School Buses in a Coastal Region of N.C
Report to the National Highway Traffic Safety Administration (NHTSA), October, 2000 31
Exhibit 3A
New Hanover County Schools
Vehicle passed from Passed on which side Type of RoadwayDate AM PM Daily Total Front Rear Left Right 2 Lns 2 Ln+turn 4 Ln, no med. 4 Ln+turn > 4 Ln w. med.
10/12/98 9 20 29 21 8 29 13 4 5 1 610/13/98 6 12 18 12 6 17 10 2 2 2 210/14/98 10 13 23 16 7 24 13 4 2 2 310/15/98 6 9 15 12 3 15 8 3 1 2 110/16/98 5 7 12 9 3 12 6 2 2 1 1
5-Day Total 97 70 27 97 0 50 15 12 8 13Daily Average 19.4 72% 28% 100% 0% 51% 15% 12% 8% 13%
Vehicle passed from Passed on which side Type of RoadwayDate AM PM Daily Total Front Rear Left Right 2 Lns 2 Ln+turn 4 Ln, no med. 4 Ln+turn > 4 Ln w. med.
1/19/99 12 11 23 15 8 23 10 2 3 2 61/20/99 5 18 23 17 6 23 9 6 2 1 51/21/99 7 13 20 11 9 20 8 3 1 0 81/22/99 7 17 24 21 3 24 8 8 5 0 3
4-Day Total 90 64 26 90 0 35 19 11 3 22Daily Average 22.5 72% 28% 100% 0% 51% 15% 12% 8%
Vehicle passed from Passed on which side Type of RoadwayDate AM PM Daily Total Front Rear Left Right 2 Lns 2 Ln+turn 4 Ln, no med. 4 Ln+turn > 4 Ln w. med.
3/1/99 14 13 27 24 3 27 0 13 10 1 2 13/2/99 5 12 17 11 5 17 2 9 3 33/3/99 10 9 19 17 2 19 11 6 1 13/4/99 9 6 15 9 6 15 6 2 1 3 23/5/99 12 13 25 21 3 25 14 10 1
5-Day Total 103 82 19 103 0 46 37 6 6 7Daily Average 20.6 81% 19% 100% 0% 45% 36% 6% 6% 7%
Vehicle passed from Passed on which side Type of RoadwayDate AM PM Daily Total Front Rear Left Right 2 Lns 2 Ln+turn 4 Ln, no med. 4 Ln+turn > 4 Ln w. med.
1/10/00 9 10 19 15 4 19 0 5 7 4 1 21/11/00 7 14 21 14 7 20 1 10 3 2 2 41/12/00 8 13 21 11 10 20 1 9 3 2 2 51/13/00 6 8 14 13 1 14 0 12 1 1 0 0
4-Day Total 75 53 22 73 2 36 14 9 5 11Daily Average 18.75 71% 29% 97% 3% 48% 19% 12% 7% 15%

A Cooperative Program to Reduce the Incidents of Motorists Passing Stopped School Buses in a Coastal Region of N.C
Report to the National Highway Traffic Safety Administration (NHTSA), October, 2000 32
Exhibit 3B
Onslow CountySchools
Vehicle passed from Passed on which side Type of RoadwayDate AM PM Daily Total Front Rear Left Right 2 Lns 2 Ln+turn 4 Ln, no med. 4 Ln+turn > 4 Ln w. med.
10/12/98 8 19 27 20 6 25 1 17 4 4 110/13/98 10 15 25 18 7 25 14 3 2 610/14/98 11 13 24 18 6 23 2 14 3 3 510/15/98 8 15 23 20 2 23 14 3 2 410/16/98 5 9 14 10 4 14 7 3 2 1 1
5-Day Total 113 86 25 110 3 66 16 9 20 2Daily Average 22.6 77% 23% 97% 3% 58% 14% 8% 18% 2%
Vehicle passed from Passed on which side Type of RoadwayDate AM PM Daily Total Front Rear Left Right 2 Lns 2 Ln+turn 4 Ln, no med. 4 Ln+turn > 4 Ln w. med.
1/19/99 9 6 15 10 5 14 1 10 2 1 21/20/99 10 10 20 12 8 20 5 5 4 5 11/21/99 4 7 11 9 2 11 7 0 1 21/22/99 6 8 14 11 3 14 9 1 2 1 1
4-Day Total 60 42 18 59 1 31 8 8 10 2Daily Average 15 70% 30% 98% 2% 53% 14% 14% 17% 3%
Vehicle passed from Passed on which side Type of RoadwayDate AM PM Daily Total Front Rear Left Right 2 Lns 2 Ln+turn 4 Ln, no med. 4 Ln+turn > 4 Ln w. med.
3/1/99 6 7 13 10 3 13 0 11 1 0 1 03/2/99 5 11 16 14 2 16 0 10 2 2 2 03/3/99 5 10 15 13 2 15 0 8 0 4 2 13/4/99 7 13 20 14 6 20 0 12 1 2 3 23/5/99 8 5 13 8 5 13 0 5 3 4 1
5-Day Total 77 59 18 77 0 46 7 8 12 4Daily Average 15.4 77% 23% 100% 0% 60% 9% 10% 16% 5%
Reported to lawenforcement:
7
Vehicle passed from Passed on which side Type of RoadwayDate AM PM Daily Total Front Rear Left Right 2 Lns 2 Ln+turn 4 Ln, no med. 4 Ln+turn > 4 Ln w. med.
1/10/00 8 5 13 7 6 13 0 5 0 3 0 31/11/00 4 4 8 7 1 8 0 5 1 1 1 01/12/00 0 3 3 1 2 3 0 0 1 0 1 11/13/00 2 4 6 4 2 6 0 3 0 1 0 1
4-Day Total 30 19 11 30 0 13 2 5 2 5Daily Average 7.5 63% 37% 100% 0% 48% 7% 19% 7% 19%

A Cooperative Program to Reduce the Incidents of Motorists Passing Stopped School Buses in a Coastal Region of N.C
Report to the National Highway Traffic Safety Administration (NHTSA), October, 2000 33
Exhibit 3C
Pender CountySchools
Vehicle passed from Passed on which side Type of RoadwayDate AM PM Daily Total Front Rear Left Right 2 Lns 2 Ln+turn 4 Ln, no med. 4 Ln+turn > 4 Ln w. med.
10/12/98 2 4 6 4 2 6 3 1 210/13/98 1 3 4 3 1 4 2 2 110/14/98 2 1 3 3 3 1 210/15/98 5 5 3 2 5 1 3 110/16/98 2 2 1 1 2 1 1
5-Day Total 20 11 9 20 0 6 8 0 6 1Daily Average 4 55% 45% 100% 0% 29% 38% 0% 29% 5%
Vehicle passed from Passed on which side Type of RoadwayDate AM PM Daily Total Front Rear Left Right 2 Lns 2 Ln+turn 4 Ln, no med. 4 Ln+turn > 4 Ln w. med.
1/19/99 1 3 4 4 4 1 31/20/991/21/99 1 2 3 2 1 3 1 1 11/22/99 1 0 1 1 1 1
4-Day Total 8 7 1 8 0 2 5 0 1 0Daily Average 2 88% 13% 100% 0% 25% 63% 0% 13% 0%
Vehicle passed from Passed on which side Type of RoadwayDate AM PM Daily Total Front Rear Left Right 2 Lns 2 Ln+turn 4 Ln, no med. 4 Ln+turn > 4 Ln w. med.
3/1/99 2 2 4 4 4 3 13/2/99 1 1 2 2 2 1 13/3/99 1 2 3 2 2 1 13/4/99 2 2 1 1 2 1 13/5/99 1 1 1 1 1
5-Day Total 12 9 2 11 0 6 4 0 1 0Daily Average 2.4 82% 18% 100% 0% 55% 36% 0% 9% 0%
Vehicle passed from Passed on which side Type of RoadwayDate AM PM Daily Total Front Rear Left Right 2 Lns 2 Ln+turn 4 Ln, no med. 4 Ln+turn > 4 Ln w. med.
1/10/00 1 1 2 1 1 2 0 2 0 0 0 01/11/00 2 4 6 5 1 6 0 5 0 0 0 11/12/00 1 0 1 0 1 1 0 1 0 0 0 01/13/00 0
4-Day Total 9 6 3 9 0 8 0 0 0 1Daily Average 2.25 67% 89% 0% 0% 0% 11%

A Cooperative Program to Reduce the Incidents of Motorists Passing Stopped School Buses in a Coastal Region of N.C
Report to the National Highway Traffic Safety Administration (NHTSA), October, 2000 34
Exhibit 4A2000 Statewide
Count
MARCH22,2000
Time of Day # Stu. atStop
PassedFrom:
Side of Bus: Passing Vehicle Roadway
LEAN0.
School District(LEA) NAME
#Buses
Operated
#Passing
s PerBus
AM PM Total 1-5 6 -10
11+ Front Rear Left Right
Car PU/Van
Truck
2Lane
2 ln+
turn
4Lan
e
4+turn
4+median
010 ALAMANCE 152 0.230 13 22 35 25 6 4 29 6 32 3 18 9 8 27 3 4 1020 ALEXANDER 61 0.000 0 0 0030 ALLEGHANY 25 0.000 0 0 0040 ANSON 82 0.159 10 3 13 13 4 9 13 10 1 2 12050 ASHE 57 0.105 2 4 6 6 5 1 6 4 2 6060 AVERY 36 0.000070 BEAUFORT 95 0.063 2 4 6 6 0 0 5 1 6 0 3 3 2 1 3080 BERTIE 86 0.000 0 0 0090 BLADEN 100 0.010 0 1 1 1 1 1 1 1100 BRUNSWICK 139 0.072 3 7 10 9 1 5 5 10 7 3 4 4 2110 BUNCOMBE 267 0.176 18 29 47 35 7 5 38 9 46 1 29 17 1 22 8 7 7 1111 ASHEVILLE 31 0.000120 BURKE 107 0.084 4 5 9 9 7 2 9 6 3 8 1130 CABARRUS 142 0.183 11 15 26 16 5 5 22 4 25 1 17 9 24 1 1132 KANNAPOLIS 18 0.167 1 2 3 3 3 3 2 1 3140 CALDWELL 113 0.115 3 10 13 12 1 7 6 3 10 8 2 3 7 1 5150 CAMDEN 18 0.000 0 0 0160 CARTERET 93 0.194 9 9 18 17 1 17 1 17 1 11 7 3 14 1170 CASWELL 67 0.015 0 1 1 1 0 0 1 1 1 1180 CATAWBA 142 0.056 3 5 8 8 8 8 5 3 6 2181 HICKORY 22 0.000182 NEWT-CON. 31 0.387 1 11 12 11 1 0 11 1 12 0 12 0 0 12 0 0 0 0190 CHATHAM 92 0.207 7 12 19 12 0 5 13 3 15 1 11 6 0 11 1 3 1200 CHEROKEE 46 0.000210 CHOWAN 40 0.000 0 0 0220 CLAY 20 0.000 0 0 0230 CLEVELAND 111 0.234 13 11 26 24 1 1 17 9 26 15 9 1 18 8231 KINGS MT. 37 0.000232 SHELBY 24 0.000240 COLUMBUS 144 0.076 4 7 11 10 1 11 11 8 3 10 1241 WHITEVILLE 31 X250 CRAVEN 156 0.090 8 6 14 5 6 3 12 2 13 1 9 5 6 7 1260 CUMBERLAND 475 0.133 36 27 63 40 13 10 39 24 63 50 12 1 35 1 12 13 2270 CURRITUCK 47 0.000 0 0 0280 DARE 41 0.000 0 0 0290 DAVIDSON 182 0.121 9 13 22 15 2 2 23 1 22 13 11 16 10291 LEXINGTON 22 X292 THOMASVILLE 11 0.000300 DAVIE 59 0.136 2 6 8 8 8 8 5 3 4 3 1 2310 DUPLIN 130 0.085 4 7 11 9 0 2 10 1 11 9 2 9320 DURHAM 287 0.164 26 21 47 40 3 4 36 11 46 1 35 11 1 28 7 11 1330 EDGECOMBE 107 0.131 7 7 14 14 0 0 11 3 11 3 12 2 0 12 1 1340 FORSYTH 359 0.159 15 42 57 50 4 3 48 9 57 44 12 1 38 8 5 6350 FRANKLIN 98 0.133 9 4 13 13 10 3 11 1 9 3 1 9 3 1360 GASTON 181 0.138 8 17 25 21 3 1 22 3 24 1 20 5 21 4370 GATES 36 0.056 1 1 2 2 2 2 1 1 2380 GRAHAM 21 0.000 0 0 0390 GRANVILLE 105 0.038 4 0 4 3 1 0 4 4 3 1 3 1400 GREENE 50 0.000 0 0 0410 GUILFORD 577 0.189 44 65 109 84 11 14 82 27 107 2 84 24 1 64 7 28 6 4420 HALIFAX 127 0.094 3 9 12 8 1 3 11 1 12 7 3 2 8 3 1

A Cooperative Program to Reduce the Incidents of Motorists Passing Stopped School Buses in a Coastal Region of N.C
Report to the National Highway Traffic Safety Administration (NHTSA), October, 2000 35
MARCH22,2000
Time of Day # Stu. atStop
PassedFrom:
Side of Bus: Passing Vehicle Roadway
LEAN0.
School District(LEA) NAME
#Buses
Operated
#Passing
s PerBus
AM PM Total 1-5 6 -10
11+ Front Rear Left Right
Car PU/Van
Truck
2Lane
2 ln+
turn
4Lan
e
4+turn
4+median
421 R. RAPIDS 11 X422 WELDON 14 X430 HARNETT 198 0.146 21 8 29440 HAYWOOD 77 0.026 0 2 2 2 0 2 2 1 1 1 1450 HENDERSON 102 0.059 2 4 6 5 1 0 6 6 4 2 6460 HERTFORD 73 0.027 1 1 2 1 1 1 1 1 1470 HOKE 71 0.000 0 0 0480 HYDE 14 0.000 0 0 0490 IREDELL 148 0.088 4 9 13 13 11 2 13 11 2 10 2 1491 MOORESVILLE 16 0.250 0 4 4 0 4 0 4 4 3 1 4500 JACKSON 44 0.136 2 4 6 5 1 1 5 4 2 5 1 6510 JOHNSTON 261 0.077 10 10 20 13 5 2 18 2 20 9 8 3 13 3 4520 JONES 33 0.000 0 0 0530 LEE 92 0.196 9 9 18 13 1 4 16 2 18 11 6 1 9 3 6540 LENOIR 142 0.049 2 5 7 6 1 5 2 6 1 4 3 1 7550 LINCOLN 101 0.099 5 5 10 6 2 2 10 10 5 3 2560 MACON 50 0.100 2 3 5 5 5 5 3 2 5570 MADISON 51 0.000 0 0 0580 MARTIN 65 0.015 1 0 1 1 1 1 1 1590 McDOWELL 67 0.060 0 4 4 2 2 3 1 3 1 3 1 3 1600 MECKLENBURG 924 0.136 48 78 126 89 29 19 85 34 117 9 98 26 4 25 19 62 13610 MITCHELL 36 0.000 0 0 0620 MONTGOMERY 59 0.034 0 2 2 2 2 2 1 1 1 1630 MOORE 135 0.000 0 0 0640 NASH 200 0.110 8 14 22 18 2 2 22 22 17 5 20 2650 NEW HANOVER 174 0.195 13 21 34 28 5 1 18 16 34 22 10 1 16 9 3 6660 NORTHAMPTON 69 0.000 0 0 0670 ONSLOW 201 0.184 19 18 37 34 1 11 22 15 33 4 19 17 1 11 5 8 7 6680 ORANGE 81 0.000 0 0 0681 CHAPEL HILL 54 0.222 4 8 12 8 4 9 3 12 10 2 5 4 2 1690 PAMLICO 33 0.091 2 1 3 3 2 1 2 1 1 2 3700 PASQUOTANK 56 0.107 2 4 6 3 3 6 5 1 6710 PENDER 85 0.035 3 0 3 1 2 1 2 3 2 1 3720 PERQUIMANS 34 0.000 0 0 0730 PERSON 76 0.092 3 4 7 7 7 7 3 3 1 5 2740 PITT 206 0.121 12 13 25 24 1 17 11 25 21 10 1 7 3 7 8 1750 POLK 32 0.063 2 0 2 1 0 1 1 2 2 2 2760 RANDOLPH 165 0.061 3 7 10 7 3 10 10 10 7 1 2761 ASHEBORO 14 0.214 2 1 3 3 3 3 2 1 3770 RICHMOND 92 0.174 12 4 16 13 1 2 14 2 16 13 3 6 8 2780 ROBESON 268 0.056 5 10 15 13 1 1 13 2 15 11 4790 ROCKINGHAM 145 0.117 8 9 17 17 0 0 17 16 1 13 4 9 5 3 2800 ROWAN 197 0.239 20 27 47 38 4 5 43 4 47 33 10 4 26 13 7 1810 RUTHERFORD 112 0.045 2 3 5 5 5 5 3 2 4 1820 SAMPSON 130 0.046 2 4 6 6 5 1 6 6 3 3821 CLINTON 22 0.273 4 2 6 5 1 5 1 6 5 1 6830 SCOTLAND 79 0.114 4 5 9 5 1 3 8 1 8 1 9 6 2 1840 STANLY 103 0.058 1 5 6 4 1 1 4 2 6 0 3 3 3 2 0 1850 STOKES 103 0.010 0 1 1 1 1 1 1 1860 SURRY 118 0.153 5 13 18 16 1 1 15 3 17 1 11 6 1 8 7 1 2861 ELKIN 7 X

A Cooperative Program to Reduce the Incidents of Motorists Passing Stopped School Buses in a Coastal Region of N.C
Report to the National Highway Traffic Safety Administration (NHTSA), October, 2000 36
MARCH22,2000
Time of Day # Stu. atStop
PassedFrom:
Side of Bus: Passing Vehicle Roadway
LEAN0.
School District(LEA) NAME
#Buses
Operated
#Passing
s PerBus
AM PM Total 1-5 6 -10
11+ Front Rear Left Right
Car PU/Van
Truck
2Lane
2 ln+
turn
4Lan
e
4+turn
4+median
862 MOUNT AIRY 10 X870 SWAIN 26 0.000 0 0 0880 TRANSYLVANI
A36 0.056 2 0 2 1 0 1 1 1 2 0 2 0 2
890 TYRRELL 12 0.000 0 0 0900 UNION 194 0.015 2 1 3 3 3 3 2 1 3910 VANCE 84 0.071 3 3 6 5 1 0 6 0 5 1 5 1 0 3 0 3 0920 WAKE 711 0.287 94 110 204 136 41 29 153 48 192 10 148 70 9 115 31 22 21 9930 WARREN 55 0.018 1 0 1 1 1 1 1 1940 WASHINGTON 48 0.021 0 1 1 1 1 1 1 1950 WATAUGA 62 0.258 4 12 16 16 13 3 16 9 7 7 9960 WAYNE 216 0.097 17 4 21 18 3 16 5 19 2 17 4 12 3 6970 WILKES 108 0.130 3 11 14 14 14 14 10 4 12 1 1980 WILSON 140 0.036 4 1 5 4 1 3 2 5 4 1 1 2 1 1990 YADKIN 72 0.056 3 1 4 3 1 4 4 3 1 4995 YANCEY 43 0.093 0 4 4 4 4 4 3 1 2 2
TOTALS 12,957 656 853 1,511 1,158 185 157 1,150 324 1,412 61 1,049 410 53 833 206 251 114 35
X = did not conduct survey 43% 57% 77% 12% 10% 78% 22% 96% 4% 69% 27% 4% 58% 14% 17% 8% 2%

A Cooperative Program to Reduce the Incidents of Motorists Passing Stopped School Buses in a Coastal Region of N.C
Report to the National Highway Traffic Safety Administration (NHTSA), October, 2000 37
Exhibit 4B1999 Statewide
Count
APRIL 28,1999
Time of Day # Stu. atStop
PassedFrom:
Side of Bus: Passing Vehicle Roadway
LEAN0.
School District(LEA) NAME
#Buses
Operated
#Passing
s PerBus
AM PM Total 1-5 6 -10
11+ Front Rear Left Right
Car PU/Van
Truck
2Lane
2 ln+
turn
4Lan
e
4+turn
4+median
010 ALAMANCE 152 0.132 9 11 20 15 2 3 17 3 19 1 13 7 16 3 1020 ALEXANDER 61 0.000 0 0 0030 ALLEGHANY 25 0.040 1 1 1 1 1 1040 ANSON 82 X050 ASHE 57 0.035 1 1 2 2 2 2 1 1060 AVERY 36 0.028 0 1 1 1 0 1 0 1 0 1 1 0 0 1 0 0 0 0070 BEAUFORT 95 0.105 2 8 10 9 1 8 2 10 5 5 2 7 1080 BERTIE 86 0.000 0 0 0090 BLADEN 100 0.000 0 0 0100 BRUNSWICK 139 0.129 6 12 18 14 4 0 11 4 12 3 9 6 2 7 6 0 3 0110 BUNCOMBE 267 0.139 12 25 37 30 5 2 26 11 36 1 21 14 2 21 6 5 4 0111 ASHEVILLE 31 X120 BURKE 107 0.168 8 10 18 16 2 14 4 17 1 13 5 0 12 3 2 1 0130 CABARRUS 142 0.056 3 5 8 5 3 0 7 1 8 0 7 1 0 8 0 0 0 0132 KANNAPOLIS 18 X140 CALDWELL 113 0.159 8 10 18 18 0 0 9 9 18 0 8 9 1 13 2 0 3 0150 CAMDEN 18 0.000 0 0 0160 CARTERET 93 0.215 5 15 20 19 1 19 1 20 15 5 10170 CASWELL 67 0.000 0 0 0180 CATAWBA 142 0.070 5 5 10 7 0 3 10 0 10 0 8 2 0 10 0 0 0181 HICKORY 22 0.318 3 4 7 4 3 0 5 2 7 0 5 2 0 2 3 2182 NEWTON-CON. 31 0.097 2 1 3 2 0 1 3 0 3 0 3 0 0 1 0 2 0190 CHATHAM 92 X200 CHEROKEE 46 0.000 0 0 0210 CHOWAN 40 0.025 0 1 1 0 1 0 1 0 1 0 1 0 0 1 0 0 0 0220 CLAY 20 0.000 0 0 0230 CLEVELAND 111 0.063 1 6 7 4 2 1 5 2 7 0 5 1 1 5 0 0 1 1231 KINGS MT. 37 0.135 1 4 5 4 0 1 4 1 5 0 3 2 0 4 0 1 0232 SHELBY 24 0.292 2 5 7 6 1 0 5 2 6 1 6 1 0 6 0 1 0 0240 COLUMBUS 144 X241 WHITEVILLE 31 X250 CRAVEN 156 0.186 12 17 29 21 6 2 24 5 28 1 23 5 1 6 0 20 3 0260 CUMBERLAND 475 0.164 45 33 78 58 12 8 43 35 78 0 57 20 1 34 9 9 16270 CURRITUCK 47 X280 DARE 41 0.000 0 0 0290 DAVIDSON 182 0.110 8 12 20 12 5 3 20 0 20 0 12 5 3 15 4 0 1 0291 LEXINGTON 22 X292 THOMASVILLE 11 0.182 2 0 2 1 1 0 2 0 2 0 2 0 0 1 1 0 0 0300 DAVIE 59 0.271 6 10 16 11 0 5 13 3 14 2 11 5 0 13 3 0 0 0310 DUPLIN 130 0.046 5 1 6 5 1 0 2 4 6 0 3 2 1 3 0 2 0 1320 DURHAM 287 0.240 37 32 69 56 7 6 57 12 66 3 59 9 1 46 4 12 5 0330 EDGECOMBE 107 0.093 6 4 10 7 1 1 8 2 9 0 5 6 0 7 1 0 0 0340 FORSYTH 359 0.245 39 49 88 68 11 9 78 10 87 1 52 33 3 53 25 7 3 0350 FRANKLIN 98 0.143 10 4 14 11 2 1 11 3 12 2 9 4 2 12 0 1 1360 GASTON 181 0.271 20 29 49 30 7 12 42 7 43 6 42 6 1 40 0 0 9 0370 GATES 36 0.111 0 4 4 4 0 0 2 2 4 0 2 2 0 3 1 0 0 0380 GRAHAM 21 0.000 0 0 0390 GRANVILLE 105 X400 GREENE 50 0.020 1 0 1 1 0 0 1 0 1 0 0 1 0 1 0 0 0 0410 GUILFORD 577 0.158 42 49 91 68 16 7 66 25 87 4 75 14 2 47 12 24 7 0

A Cooperative Program to Reduce the Incidents of Motorists Passing Stopped School Buses in a Coastal Region of N.C
Report to the National Highway Traffic Safety Administration (NHTSA), October, 2000 38
APRIL 28,1999
Time of Day # Stu. atStop
PassedFrom:
Side of Bus: Passing Vehicle Roadway
LEAN0.
School District(LEA) NAME
#Buses
Operated
#Passing
s PerBus
AM PM Total 1-5 6 -10
11+ Front Rear Left Right
Car PU/Van
Truck
2Lane
2 ln+
turn
4Lan
e
4+turn
4+median
420 HALIFAX 127 0.000 0 0 0421 R. RAPIDS 11 X422 WELDON 14 X430 HARNETT 198 0.076 5 10 15440 HAYWOOD 77 0.065 1 4 5 5 0 0 4 1 4 1 2 5 0 4 0 0 1 0450 HENDERSON 102 0.039 2 2 4 4 0 0 3 0 0 1 3 1 0 4 0 0 0 0460 HERTFORD 73 0.027 1 1 2 1 0 0 1 0 1 0 1 1 0 1 0 0 0 0470 HOKE 71 0.239 10 7 17 13 1 3 14 3 17 0 13 4 0 17 0 0 0 0480 HYDE 14 0.000 0 0 0490 IREDELL 148 0.128 6 13 19 16 2 1 19 0 19 0 18 1 0 18 0 1 0 0491 MOORESVILLE 16 0.125 0 2 2500 JACKSON 44 X510 JOHNSTON 261 0.073 7 12 19 13 0 6 16 3 19 0 14 5 0 14 2 0 3 0520 JONES 33 X530 LEE 92 0.337 11 20 31 26 4 1 23 8 31 0 21 8 2 14 3 11 3 0540 LENOIR 142 0.148 12 9 21 20 1 0 20 4 22 0 13 9 1 16 6 0 0 0550 LINCOLN 101 0.129 11 2 13 10 0 3 13 0 13 0 8 5 0 12 1 0 0 0560 MACON 50 0.120 2 4 6 4 1 1 1 5 6 0 2 4 0 3 2 0 1 0570 MADISON 51 X580 MARTIN 65 0.092 4 2 6 6 0 0 6 0 5 1 3 3 0 6 0 0 0 0590 McDOWELL 67 0.090 2 4 6 5 1 0 3 3 6 0 2 2 1 5 0 0 1 0600 MECKLENBURG 924 0.326 158 143 301 219 93 39 206 95 268 33 243 61 3 91 35 119 21 35610 MITCHELL 36 X620 MONTGOMERY 59 0.017 0 1 1 1 0 0 1 0 1 0 1 0 0 0 1 0 0 0630 MOORE 135 0.044 4 2 6 5 0 1 4 2 6 0 6 0 0 5 0 0 1 0640 NASH 200 0.100 6 14 20 12 6 2 17 3 18 2 16 4 0 13 0 2 5 0650 NEW HANOVER 174 0.138 14 10 24 17 5 2 18 6 24 0 17 9 0 11 5 4 2 2660 NORTHAMPTON 69 0.000 0 0 0670 ONSLOW 201 0.070 6 8 14 14 0 0 12 2 14 0 10 4 0 9 3 0 2 0680 ORANGE 81 0.062 1 4 5 4 0 1 5 0 5 0 3 2 0 2 3 0 0 0681 CHAPEL HILL 54 0.259 5 9 14 7 6 1 11 3 14 0 9 5 0 14 0 0 0 0690 PAMLICO 33 0.121 3 1 4 1 0 0 3 1 4 0 2 2 0 1 0 0 0 0700 PASQUOTANK 56 0.054 2 1 3 1 0 2 1 2 3 0 3 0 0 3 0 0 0 0710 PENDER 85 0.106 3 6 9 6 3 0 8 1 9 0 5 4 0 4 4 0 1 0720 PERQUIMANS 34 0.029 0 1 1 1 0 0 1 0 1 0 1 0 0 1 0 0 0 0730 PERSON 76 0.197 6 9 15 12 1 2 13 2 14 1 14 0 1 7 7 1 0 0740 PITT 206 0.073 10 5 15 15 0 0 8 7 15 0 12 3 0 9 1 1 4 0750 POLK 32 0.031 1 0 1 0 0 0 0 1 0 1 1 0 0 1 0 0 0 0760 RANDOLPH 165 0.055 7 2 9 8 0 1 5 4 8 0 10 5 1 6 1 0 1 0761 ASHEBORO 14 X770 RICHMOND 92 0.174 5 11 16 11 3 2 13 3 16 0 11 4 1 5 11 0 0 0780 ROBESON 268 0.108 9 20 29 21 6 2 22 7 28 1 21 7 1 25 3 0 1 0790 ROCKINGHAM 145 0.069 2 8 10 8 2 0 8 2 10 0 8 2 0 8 0 0 2 0800 ROWAN 197 0.259 22 29 51 50 4 1 43 9 44 1 30 21 1 18 18 15 0 0810 RUTHERFORD 112 0.036 3 1 4 3 1 4 4 0 4 0 4 0 0 4 0 0 0 0820 SAMPSON 130 0.038 4 1 5 5 0 5 0 5 0 4 0 1 0 5 0 0 0 0821 CLINTON 22 X830 SCOTLAND 79 0.127 2 8 10 9 0 1 9 1 10 0 10 0 0 5 2 0 3 0840 STANLY 103 0.078 3 5 8 7 1 0 6 2 8 0 5 3 0 5 1 0 2 0850 STOKES 103 0.000 0 0 0860 SURRY 118 0.076 3 6 9 9 0 0 8 1 9 0 3 6 0 6 3 0 0 0
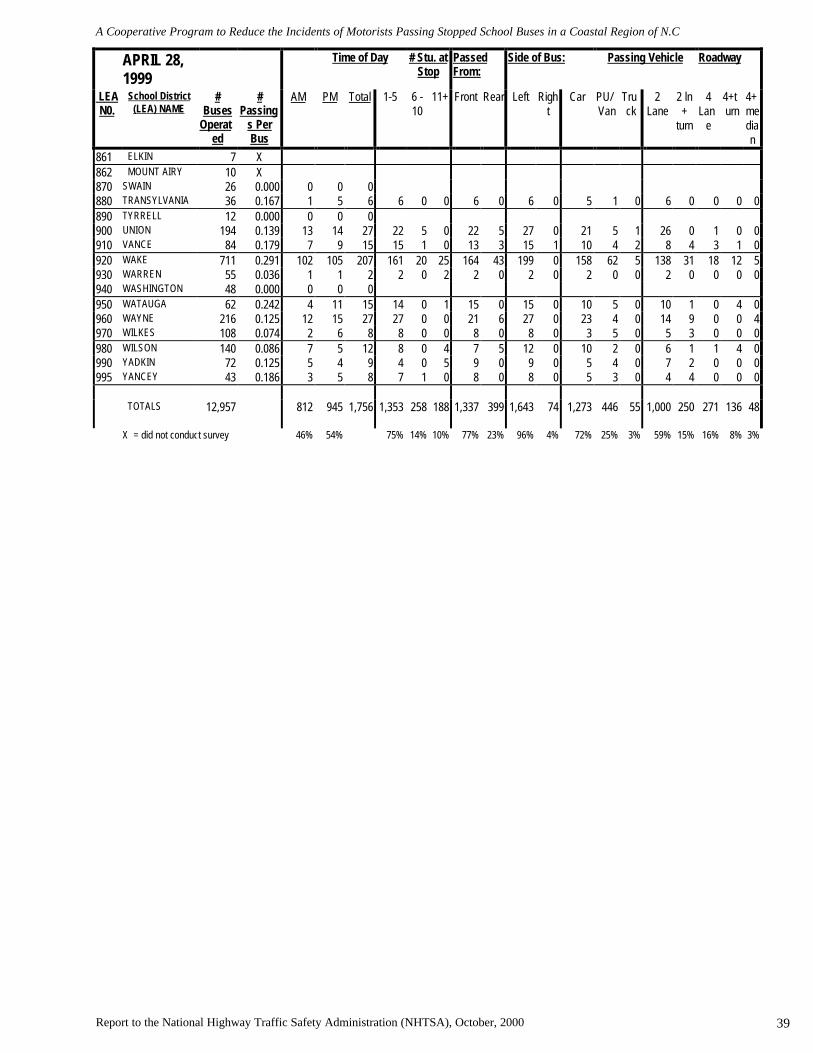
A Cooperative Program to Reduce the Incidents of Motorists Passing Stopped School Buses in a Coastal Region of N.C
Report to the National Highway Traffic Safety Administration (NHTSA), October, 2000 39
APRIL 28,1999
Time of Day # Stu. atStop
PassedFrom:
Side of Bus: Passing Vehicle Roadway
LEAN0.
School District(LEA) NAME
#Buses
Operated
#Passing
s PerBus
AM PM Total 1-5 6 -10
11+ Front Rear Left Right
Car PU/Van
Truck
2Lane
2 ln+
turn
4Lan
e
4+turn
4+median
861 ELKIN 7 X862 MOUNT AIRY 10 X870 SWAIN 26 0.000 0 0 0880 TRANSYLVANIA 36 0.167 1 5 6 6 0 0 6 0 6 0 5 1 0 6 0 0 0 0890 TYRRELL 12 0.000 0 0 0900 UNION 194 0.139 13 14 27 22 5 0 22 5 27 0 21 5 1 26 0 1 0 0910 VANCE 84 0.179 7 9 15 15 1 0 13 3 15 1 10 4 2 8 4 3 1 0920 WAKE 711 0.291 102 105 207 161 20 25 164 43 199 0 158 62 5 138 31 18 12 5930 WARREN 55 0.036 1 1 2 2 0 2 2 0 2 0 2 0 0 2 0 0 0 0940 WASHINGTON 48 0.000 0 0 0950 WATAUGA 62 0.242 4 11 15 14 0 1 15 0 15 0 10 5 0 10 1 0 4 0960 WAYNE 216 0.125 12 15 27 27 0 0 21 6 27 0 23 4 0 14 9 0 0 4970 WILKES 108 0.074 2 6 8 8 0 0 8 0 8 0 3 5 0 5 3 0 0 0980 WILSON 140 0.086 7 5 12 8 0 4 7 5 12 0 10 2 0 6 1 1 4 0990 YADKIN 72 0.125 5 4 9 4 0 5 9 0 9 0 5 4 0 7 2 0 0 0995 YANCEY 43 0.186 3 5 8 7 1 0 8 0 8 0 5 3 0 4 4 0 0 0
TOTALS 12,957 812 945 1,756 1,353 258 188 1,337 399 1,643 74 1,273 446 55 1,000 250 271 136 48
X = did not conduct survey 46% 54% 75% 14% 10% 77% 23% 96% 4% 72% 25% 3% 59% 15% 16% 8% 3%

A Cooperative Program to Reduce the Incidents of Motorists Passing Stopped School Buses in a Coastal Region of N.C
Report to the National Highway Traffic Safety Administration (NHTSA), October, 2000 40
Exhibit 4C – 1998 Statewide CountAPRIL,1998
No. # Passings Time of Day # Stu. atStop
Passed from: Side of Bus: Passing Vehicle Roadway
LEAN0.
LEA NAME Buses per Bus AM PM Total 1-5 6 -10
11+ Frt Rear Left Rt Car PU/Van
Truck 2 Ln 2+turn
4 Ln 4+turn
4+med
10 ALAMANCE did not participate020 ALEXANDER 61 0.066 2 2 4 4 0 0 4 0 4 0 3 1 0 4 0 0 0 0030 ALLEGHANY 24 0.000 0 0040 ANSON 49 0.061 1 2 3 0 0 0 2 1 2 1 1 2 0 1 0 0 0 0050 ASHE 62 0.000 0 0 0 0 0 0 0 0 0 0 0 0 0 0 0 0 0 0060 AVERY 36 0.056 1 1 2 2 2 2 1 1 1 1 1 1 0 1 0 1 0 0070 BEAUFORT 96 0.094 4 5 9 7 1 1 5 1 8 0 7 2 0 5 0 3 1 0080 BERTIE 86 0.047 2 2 4 4 0 0 4 0 4 0 3 1 0 3 1 0 0 0090 BLADEN 100 0.070 3 4 7 7 0 0 7 0 5 0 6 1 0 7 0 0 0 0100 BRUNSWICK 119 0.067 2 6 8 8 0 0 4 3 9 0 6 2 1 7 2 0 0 0110 BUNCOMBE 311 0.199 21 41 62 54 6 2 47 15 60 2 46 16 0 25 3 28 6 0120 BURKE 104 0.240 11 14 25 23 0 2 21 4 24 1 15 8 2 16 1 2 6 0130 CABARRUS 142 0.092 7 6 13 10 2 1 12 1 13 0 7 6 0 11 0 1 1 0132 KANNAPOLIS 18 0.556 5 5 10 7 2 1 0 0 10 0 8 1 1 3 0 7 0 0140 CALDWELL 113 0.274 9 22 31 72 0 0 25 6 31 0 26 3 2 31 0 0 0 0150 CAMDEN 18 0.000 0 0 0 0 0 0 0 0 0 0 0 0 0 0 0 0 0 0160 CARTERET 92 0.163 7 8 15 13 2 0 12 3 15 0 10 4 1 8 5 1 1 0170 CASWELL 69 0.000 0 0 0 0 0 0 0 0 0 0 0 0 0 0 0 0 0 0180 CATAWBA 143 0.077 3 8 11 7 1 3 11 0 11 0 8 3 0 11 0 0 0 0181 HICKORY 18 0.667 3 9 12 7 3 2 9 3 12 0 9 3 0 10 0 0 2 0182 NEWTON-
CON.26 0.115 1 2 3 1 1 1 3 0 3 0 2 1 0 3 0 0 0 0
190 CHATHAM 92 0.239 11 11 22 20 2 0 21 1 22 0 15 6 1 20 1 0 1 0200 CHEROKEE 46 0.043 2 0 2 2 0 0 2 0 2 0 0 0 2 0 0 0 0 0210 CHOWAN 40 0.000 0 0 0 0 0 0 0 0 0 0 0 0 0 0 0 0 0 0220 CLAY 20 0.000 0 0 0 0 0 0 0 0 0 0 0 0 0 0 0 0 0 0230 CLEVELAND 172 0.099 8 9 17 15 1 1 15 2 17 0 13 4 0 12 1 3 0 1231 KINGS MT.
240 COLUMBUS 175 0.023 4 0 4 3 0 0 3 1 4 0 3 1 0 3 1 0 0 0241 WHITEVILLE
250 CRAVEN 156 0.160 15 10 25 19 4 2 19 6 24 1 17 7 1 19 0 3 3 0260 CUMBERLAND 474 0.289 50 87 137 105 19 13 89 48 131 6 101 34 2 79 23 9 18 8270 CURRITUCK 12 0.000 0 0 0 0 0 0 0 0 0 0 0 0 0 0 0 0 0 0280 DARE 41 0.000290 DAVIDSON 182 0.104 10 9 19 16 0 3 16 3 18 1 12 7 0 17 2 0 0 0291 LEXINGTON
292 THOMASVILLE
300 DAVIE 59 0.034 0 2 2 2 0 0 2 0 2 0 2 0 0 1 1 0 0 0310 DUPLIN 130 0.092 7 5 12 11 1 0 11 1 12 0 8 3 1 6 1 3 2 0320 DURHAM 281 0.228 24 40 64 57 3 4 49 15 60 4 51 13 0 30 3 24 7 0330 EDGECOMBE 107 0.028 1 2 3 1 1 1 3 0 2 0 2 0 1 3 0 0 0 0340 FORSYTH 359 0.362 59 71 130 102 12 16 112 118 129 1 91 38 1 90 16 12 9 3350 FRANKLIN 106 0.000 0 0 0 0 0 0 0 0 0 0 0 0 0 0 0 0 0 0360 GASTON 181 0.033 3 3 6 0 1 5 6 0 6 0 5 1 0 6 0 0 0 0370 GATES did not participate380 GRAHAM 22 0.000 0 0 0 0 0 0 0 0 0 0 0 0 0 0 0 0 0 0390 GRANVILLE 105 0.076 3 5 8 7 1 0 6 2 8 0 8 0 0 8 0 0 0 0400 GREENE 50 0.060 1 2 3 3 0 0 3 0 3 0 3 0 0 2 1 0 0 0410 GUILFORD 575 0.193 48 63 111 84 16 11 78 33 110 1 87 22 2 65 8 16 12 10420 HALIFAX 151 0.000 0 0 0 0 0 0 0 0 0 0 0 0 0 0 0 0 0 0421 R. RAPIDS

A Cooperative Program to Reduce the Incidents of Motorists Passing Stopped School Buses in a Coastal Region of N.C
Report to the National Highway Traffic Safety Administration (NHTSA), October, 2000 41
APRIL,1998
No. # Passings Time of Day # Stu. atStop
Passed from: Side of Bus: Passing Vehicle Roadway
LEAN0.
LEA NAME Buses per Bus AM PM Total 1-5 6 -10
11+ Frt Rear Left Rt Car PU/Van
Truck 2 Ln 2+turn
4 Ln 4+turn
4+med
422 WELDON
430 HARNETT 198 0.000 0 0 0 0 0 0 0 0 0 0 0 0 0 0 0 0 0 0440 HAYWOOD 77 0.130 2 8 10 10 0 0 9 1 10 0 9 0 1 9 0 0 1 0450 HENDERSON 0 11 11 0 0 11 0 11 0 6 5 0 11 0 0 0 0460 HERTFORD 73 0.027 0 2 2 0 0 2 2 0 1 1 2 0 0 1 1 0 0 0470 HOKE 71 0.113 5 3 8 8 0 0 8 0 8 0 7 1 0 8 0 0 0 0480 HYDE 15 0.000 0 0 0 0 0 0 0 0 0 0 0 0 0 0 0 0 0 0490 IREDELL 148 0.101 7 8 15 15 0 0 13 2 13 0 12 1 2 10 3 2 0 0491 MOORESVILLE 0 0 0 0 0 0 0 0 0 0 0 0 0 0 0 0 0 0500 JACKSON 45 0.222 1 9 10 10 0 0 8 2 10 0 6 1 3 7 0 0 0 3510 JOHNSTON 261 0.100 14 12 26 24 1 1 18 8 26 0 18 7 1 23 3 0 0 0520 JONES 33 0.061 1 1 2 2 0 0 2 0 2 0 1 1 0 2 0 0 0 0530 LEE 92 0.174 10 6 16 12 2 2 11 5 16 0 13 3 0 11 1 4 0 0540 LENOIR 142 0.092 8 5 13 10 0 3 9 4 13 0 7 5 1 9 0 0 4 0550 LINCOLN 101 0.089 4 5 9 8 1 9 8 1 9 5 4 0 6 1 2 0 0560 MACON 50 0.040 1 1 2 0 2 0 2 0 2 0 2 0 0 0 0 0 2 0570 MADISON 42 0.024 1 0 1 1 0 0 1 0 1 0 1 0 0 1 0 0 0 0580 MARTIN 65 0.000 0 0 0 0 0 0 0 0 0 0 0 0 0 0 0 0 0 0590 McDOWELL 67 0.104 3 4 7 3 4 0 3 4 7 0 4 3 0 2 0 1 4 0600 MECKLENBURG 927 0.391 168 194 362 267 49 46 268 94 328 34 276 74 12 153 25 135 25 24610 MITCHELL 36 0.056 1 1 2 2 0 0 2 2 2 2620 MONTGOMERY 58 0.017 1 0 1 1 0 0 1 0 1 0 1 0 0 1 0 0 0 0630 MOORE did not participate640 NASH 200 0.160 17 15 32 27 4 1 22 9 30 1 26 5 1 17 1 8 5 0650 NEW HANOVER 174 0.460 35 45 80 53 16 11 46 34 80 0 59 20 1 37 13 18 6 6660 NORTHAMPTON 74 0.135 6 4 10 9 1 0 8 2 10 0 7 2 1 10 0 0 0 0670 ONSLOW 203 0.197 21 19 40 32 3 5 29 11 40 0 25 13 2 21 4 7 8 0680 ORANGE 76 0.092 4 3 7 5 2 0 6 1 6 1 5 2 0 6 1 0 0 0681 CHAPEL HILL 55 0.455 13 12 25 12 6 7 22 3 24 1 17 6 2 15 8 0 2 0690 PAMLICO 33 0.091 1 2 3 3 0 0 3 0 3 0 3 0 0 1 2 0 0 0700 PASQUOTANK 56 0.125 3 4 7 5 2 0 6 1 7 0 4 3 0 6 1 0 0 0710 PENDER 85 0.106 9 0 9 7 2 0 7 2 9 0 5 2 2 9 0 0 0 0720 PERQUIMANS 34 0.000 0 0 0 0 0 0 0 0 0 0 0 0 0 0 0 0 0 0730 PERSON 76 0.224 13 6 17 14 3 0 16 1 16 1 9 8 0 16 1 0 0 0740 PITT 206 0.214 25 19 44 31 6 7 35 9 44 0 30 12 1 29 9 3 3 0750 POLK 32 0.031 1 0 1 1 0 0 0 1 1 0 0 1 0 1 0 0 0 0760 RANDOLPH 165 0.067 6 5 11 10 0 1 10 1 11 0 5 6 0 9 1 1 0 0761 ASHEBORO
770 RICHMOND 93 0.097 3 6 9 7 2 0 6 3 9 0 6 2 1 7 2 0 0 0780 ROBESON 275 0.029 4 4 8 5 0 1 5 0 7 0 5 2 1 7 1 0 0 0790 ROCKINGHAM 153 0.059 6 3 9 9 0 0 6 3 9 0 8 1 0 8 1 0 0 0800 ROWAN 192 0.141 13 14 27 21 4 2 22 4 27 0 16 8 0 18 2 7 2 0810 RUTHERFORD 117 0.051 2 4 6 3 1 2 6 0 6 0 5 1 0 6 0 0 0 0820 SAMPSON 130 0.015 0 2 2 2 0 0 2 0 2 0 1 1 0 2 0 0 0 0821 CLINTON 22 0.409 0 9 9 1 0 0 9 0 9 0 8 1 0 9 0 0 0 0830 SCOTLAND 79 0.063 4 1 5 5 0 0 4 1 5 0 5 0 0 5 0 0 0 0840 STANLY 103 0.078 4 4 8 7 1 0 6 2 8 0 4 3 1 3 4 0 1 0850 STOKES
860 SURRY 137 0.044 2 4 6 6 0 0 5 1 5 1 4 2 0 5 1 0 0 0861 ELKIN
862 MOUNT AIRY
870 SWAIN did not participate880 TRANSYLVANIA 36 0.333 1 11 12 11 1 0 12 0 12 0 5 7 0 6 0 6 0 0890 TYRRELL 12 0.083 1 0 1 0 0 1 0 1 1 0 0 1 0 1 0 0 0 0

A Cooperative Program to Reduce the Incidents of Motorists Passing Stopped School Buses in a Coastal Region of N.C
Report to the National Highway Traffic Safety Administration (NHTSA), October, 2000 42
APRIL,1998
No. # Passings Time of Day # Stu. atStop
Passed from: Side of Bus: Passing Vehicle Roadway
LEAN0.
LEA NAME Buses per Bus AM PM Total 1-5 6 -10
11+ Frt Rear Left Rt Car PU/Van
Truck 2 Ln 2+turn
4 Ln 4+turn
4+med
900 UNION did not participate910 VANCE 84 0.143 5 7 12 12 0 0 10 2 12 0 7 5 0 8 0 0 4 0920 WAKE 714 0.244 84 90 174 130 26 18 138 34 160 7 116 52 9 110 29 19 8 5930 WARREN 55 0.018 1 0 1 1 0 0 1 0 1 0 1 0 0 1 0 0 0 0940 WASHINGTON 48 0.063 1 2 3 3 0 0 1 2 3 0 2 1 0 1 1 0 1 0950 WATAUGA 62 0.290 8 10 18 18 0 0 18 0 18 0 12 5 1 16 1 1 0 0960 WAYNE 217 0.051 8 3 11 9 2 0 8 3 11 0 7 3 1 8 3 0 0 0970 WILKES 108 0.185 7 13 20 14 3 3 16 4 17 3 9 10 1 14 3 3 0 0980 WILSON 145 0.145 9 12 21 14 1 6 14 7 21 0 14 7 0 13 1 2 2 3990 YADKIN 72 0.028 2 0 2 2 0 0 2 0 2 0 1 1 0 1 1 0 0 0995 YANCEY 43 0.093 1 3 4 4 0 0 4 0 4 0 2 2 0 2 2 0 0 0
------- ------- ------- ------- ------- -------
-------
------- ------- ------- ------- ------- -------
-------
------- -------
-------
-------
TOTALS 12,090 0.119 875 1,051 1,935 1,550 226 199 1,483 531 1,852 69 1,381 491 63 1,191 197 332 147 63
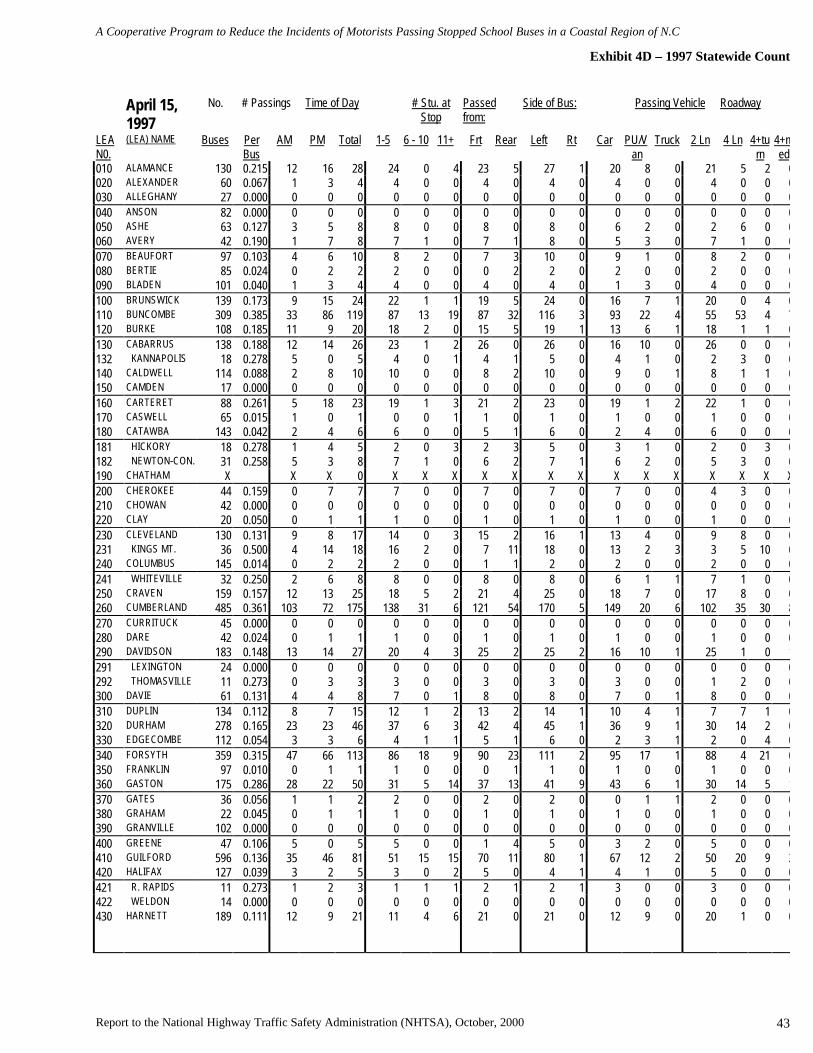
A Cooperative Program to Reduce the Incidents of Motorists Passing Stopped School Buses in a Coastal Region of N.C
Report to the National Highway Traffic Safety Administration (NHTSA), October, 2000 43
Exhibit 4D – 1997 Statewide Count
April 15,1997
No. # Passings Time of Day # Stu. atStop
Passedfrom:
Side of Bus: Passing Vehicle Roadway
LEAN0.
(LEA) NAME Buses PerBus
AM PM Total 1-5 6 - 10 11+ Frt Rear Left Rt Car PU/Van
Truck 2 Ln 4 Ln 4+turn
4+med
010 ALAMANCE 130 0.215 12 16 28 24 0 4 23 5 27 1 20 8 0 21 5 2 0020 ALEXANDER 60 0.067 1 3 4 4 0 0 4 0 4 0 4 0 0 4 0 0 0030 ALLEGHANY 27 0.000 0 0 0 0 0 0 0 0 0 0 0 0 0 0 0 0 0040 ANSON 82 0.000 0 0 0 0 0 0 0 0 0 0 0 0 0 0 0 0 0050 ASHE 63 0.127 3 5 8 8 0 0 8 0 8 0 6 2 0 2 6 0 0060 AVERY 42 0.190 1 7 8 7 1 0 7 1 8 0 5 3 0 7 1 0 0070 BEAUFORT 97 0.103 4 6 10 8 2 0 7 3 10 0 9 1 0 8 2 0 0080 BERTIE 85 0.024 0 2 2 2 0 0 0 2 2 0 2 0 0 2 0 0 0090 BLADEN 101 0.040 1 3 4 4 0 0 4 0 4 0 1 3 0 4 0 0 0100 BRUNSWICK 139 0.173 9 15 24 22 1 1 19 5 24 0 16 7 1 20 0 4 0110 BUNCOMBE 309 0.385 33 86 119 87 13 19 87 32 116 3 93 22 4 55 53 4 7120 BURKE 108 0.185 11 9 20 18 2 0 15 5 19 1 13 6 1 18 1 1 0130 CABARRUS 138 0.188 12 14 26 23 1 2 26 0 26 0 16 10 0 26 0 0 0132 KANNAPOLIS 18 0.278 5 0 5 4 0 1 4 1 5 0 4 1 0 2 3 0 0140 CALDWELL 114 0.088 2 8 10 10 0 0 8 2 10 0 9 0 1 8 1 1 0150 CAMDEN 17 0.000 0 0 0 0 0 0 0 0 0 0 0 0 0 0 0 0 0160 CARTERET 88 0.261 5 18 23 19 1 3 21 2 23 0 19 1 2 22 1 0 0170 CASWELL 65 0.015 1 0 1 0 0 1 1 0 1 0 1 0 0 1 0 0 0180 CATAWBA 143 0.042 2 4 6 6 0 0 5 1 6 0 2 4 0 6 0 0 0181 HICKORY 18 0.278 1 4 5 2 0 3 2 3 5 0 3 1 0 2 0 3 0182 NEWTON-CON. 31 0.258 5 3 8 7 1 0 6 2 7 1 6 2 0 5 3 0 0190 CHATHAM X X X 0 X X X X X X X X X X X X X X200 CHEROKEE 44 0.159 0 7 7 7 0 0 7 0 7 0 7 0 0 4 3 0 0210 CHOWAN 42 0.000 0 0 0 0 0 0 0 0 0 0 0 0 0 0 0 0 0220 CLAY 20 0.050 0 1 1 1 0 0 1 0 1 0 1 0 0 1 0 0 0230 CLEVELAND 130 0.131 9 8 17 14 0 3 15 2 16 1 13 4 0 9 8 0 0231 KINGS MT. 36 0.500 4 14 18 16 2 0 7 11 18 0 13 2 3 3 5 10 0240 COLUMBUS 145 0.014 0 2 2 2 0 0 1 1 2 0 2 0 0 2 0 0 0241 WHITEVILLE 32 0.250 2 6 8 8 0 0 8 0 8 0 6 1 1 7 1 0 0250 CRAVEN 159 0.157 12 13 25 18 5 2 21 4 25 0 18 7 0 17 8 0 0260 CUMBERLAND 485 0.361 103 72 175 138 31 6 121 54 170 5 149 20 6 102 35 30 8270 CURRITUCK 45 0.000 0 0 0 0 0 0 0 0 0 0 0 0 0 0 0 0 0280 DARE 42 0.024 0 1 1 1 0 0 1 0 1 0 1 0 0 1 0 0 0290 DAVIDSON 183 0.148 13 14 27 20 4 3 25 2 25 2 16 10 1 25 1 0 1291 LEXINGTON 24 0.000 0 0 0 0 0 0 0 0 0 0 0 0 0 0 0 0 0292 THOMASVILLE 11 0.273 0 3 3 3 0 0 3 0 3 0 3 0 0 1 2 0 0300 DAVIE 61 0.131 4 4 8 7 0 1 8 0 8 0 7 0 1 8 0 0 0310 DUPLIN 134 0.112 8 7 15 12 1 2 13 2 14 1 10 4 1 7 7 1 0320 DURHAM 278 0.165 23 23 46 37 6 3 42 4 45 1 36 9 1 30 14 2 0330 EDGECOMBE 112 0.054 3 3 6 4 1 1 5 1 6 0 2 3 1 2 0 4 0340 FORSYTH 359 0.315 47 66 113 86 18 9 90 23 111 2 95 17 1 88 4 21 0350 FRANKLIN 97 0.010 0 1 1 1 0 0 0 1 1 0 1 0 0 1 0 0 0360 GASTON 175 0.286 28 22 50 31 5 14 37 13 41 9 43 6 1 30 14 5 1370 GATES 36 0.056 1 1 2 2 0 0 2 0 2 0 0 1 1 2 0 0 0380 GRAHAM 22 0.045 0 1 1 1 0 0 1 0 1 0 1 0 0 1 0 0 0390 GRANVILLE 102 0.000 0 0 0 0 0 0 0 0 0 0 0 0 0 0 0 0 0400 GREENE 47 0.106 5 0 5 5 0 0 1 4 5 0 3 2 0 5 0 0 0410 GUILFORD 596 0.136 35 46 81 51 15 15 70 11 80 1 67 12 2 50 20 9 2420 HALIFAX 127 0.039 3 2 5 3 0 2 5 0 4 1 4 1 0 5 0 0 0421 R. RAPIDS 11 0.273 1 2 3 1 1 1 2 1 2 1 3 0 0 3 0 0 0422 WELDON 14 0.000 0 0 0 0 0 0 0 0 0 0 0 0 0 0 0 0 0430 HARNETT 189 0.111 12 9 21 11 4 6 21 0 21 0 12 9 0 20 1 0 0

A Cooperative Program to Reduce the Incidents of Motorists Passing Stopped School Buses in a Coastal Region of N.C
Report to the National Highway Traffic Safety Administration (NHTSA), October, 2000 44
April 15,1997
No. # Passings Time of Day # Stu. atStop
Passedfrom:
Side of Bus: Passing Vehicle Roadway
LEAN0.
(LEA) NAME Buses PerBus
AM PM Total 1-5 6 - 10 11+ Frt Rear Left Rt Car PU/Van
Truck 2 Ln 4 Ln 4+turn
4+med
440 HAYWOOD 79 0.139 4 7 11 9 2 0 8 3 11 0 5 5 1 8 1 2 0450 HENDERSON 103 0.126 7 6 13 13 0 0 13 0 13 0 9 4 0 13 0 0 0460 HERTFORD 73 0.096 1 6 7 7 0 0 5 2 7 0 5 2 0 7 0 0 0470 HOKE 69 0.188 6 7 13 12 0 1 8 5 13 0 10 1 2 9 0 0 4480 HYDE 15 0.000 0 0 0 0 0 0 0 0 0 0 0 0 0 0 0 0 0490 IREDELL 140 0.093 7 6 13 11 1 1 13 0 13 0 12 1 0 12 1 0 0491 MOORESVILLE 14 0.071 1 0 1 1 0 0 1 0 1 0 1 0 0 1 0 0 0500 JACKSON 47 0.043 0 2 2 2 0 0 2 0 2 0 1 1 0 2 0 0 0510 JOHNSTON 250 0.120 14 16 30 27 1 2 21 9 29 1 24 3 3 26 0 4 0520 JONES 33 0.182 6 0 6 6 0 0 5 1 6 0 2 4 0 6 0 0 0530 LEE 90 0.333 14 16 30 25 1 4 28 2 30 0 20 7 3 22 8 0 0540 LENOIR 142 0.155 14 8 22 18 1 3 19 3 21 1 13 7 2 9 8 5 0550 LINCOLN 102 0.049 4 1 5 4 0 1 5 0 5 0 4 1 0 5 0 0 0560 MACON 51 0.059 1 2 3 2 0 1 2 1 3 0 2 1 0 3 0 0 0570 MADISON 51 0.078 2 2 4 4 0 0 4 0 4 0 2 2 0 4 0 0 0580 MARTIN 67 0.000 0 0 0 0 0 0 0 0 0 0 0 0 0 0 0 0 0590 McDOWELL 71 0.042 1 2 3 3 0 0 3 0 3 0 3 0 0 3 0 0 0600 MECKLENBURG 854 0.391 167 167 334 245 46 43 249 85 288 46 272 53 9 153 137 31 13610 MITCHELL 36 0.083 3 0 3 3 0 0 3 0 3 0 2 1 0 2 1 0 0620 MONTGOMERY 58 0.052 1 2 3 1 0 2 3 0 3 0 2 1 0 3 0 0 0630 MOORE 127 0.087 5 6 11 9 1 1 7 4 11 0 11 0 0 11 0 0 0640 NASH 197 0.132 14 12 26 15 3 8 20 6 23 3 24 1 1 20 4 2 0650 NEW HANOVER 168 0.554 42 51 93 67 6 20 59 34 92 1 57 29 7 51 34 6 2660 NORTHAMPTON 74 0.176 6 7 13 12 1 0 11 2 13 0 9 2 2 11 0 2 0670 ONSLOW 201 0.303 30 31 61 43 10 8 53 8 59 2 43 14 4 52 7 2 0680 ORANGE 73 0.110 2 6 8 7 1 0 7 1 7 1 5 3 0 8 0 0 0681 CHAPEL HILL 54 0.093 3 2 5 5 0 0 3 2 3 2 5 0 0 5 0 0 0690 PAMLICO 35 0.057 2 0 2 2 0 0 0 2 2 0 1 1 0 2 0 0 0700 PASQUOTANK 55 0.145 6 2 8 8 0 0 6 2 7 1 8 0 0 3 4 1 0710 PENDER 83 0.241 11 9 20 15 5 0 19 1 20 0 9 7 4 19 1 0 0720 PERQUIMANS 34 0.088 2 1 3 2 1 0 3 0 3 0 2 1 0 3 0 0 0730 PERSON 74 0.176 9 4 13 11 0 2 9 4 13 0 9 2 2 12 0 0 1740 PITT 200 0.220 21 23 44 32 3 9 32 12 40 4 33 7 4 34 5 4 1750 POLK 32 0.031 1 0 1 1 0 0 0 1 0 1 1 0 0 1 0 0 0760 RANDOLPH 168 0.054 3 6 9 7 1 1 9 0 9 0 7 2 0 8 1 0 0761 ASHEBORO 14 0.571 3 5 8 3 4 1 8 0 8 0 4 4 0 7 1 0 0770 RICHMOND 92 0.033 0 3 3 3 0 0 2 1 2 1 3 0 0 0 3 0 0780 ROBESON 271 0.280 30 46 76 64 5 7 52 24 76 0 57 19 0 69 7 0 0790 ROCKINGHAM 160 0.138 8 14 22 19 1 2 15 7 21 1 19 1 2 17 2 1 2800 ROWAN 191 0.257 18 31 49 46 0 3 46 3 49 0 34 14 1 34 12 3 0810 RUTHERFORD 108 0.111 4 8 12 10 1 1 9 3 10 2 8 3 1 10 2 0 0820 SAMPSON 128 0.000 0 0 0 0 0 0 0 0 0 0 0 0 0 0 0 0 0821 CLINTON 22 0.409 3 6 9 9 0 0 4 5 9 0 8 1 0 9 0 0 0830 SCOTLAND 80 0.050 2 2 4 3 0 1 4 0 4 0 1 3 0 4 0 0 0840 STANLY 103 0.039 1 3 4 3 1 0 4 0 4 0 3 1 0 4 0 0 0850 STOKES 113 0.133 5 10 15 13 0 2 13 2 15 0 12 3 0 13 1 1 0860 SURRY 117 0.137 7 9 16 13 1 2 15 1 16 0 10 6 0 14 2 0 0861 ELKIN X X X 0 X X X X X X X X X X X X X X862 MOUNT AIRY X X X 0 X X X X X X X X X X X X X X870 SWAIN 29 0.000 0 0 0 0 0 0 0 0 0 0 0 0 0 0 0 0 0880 TRANSYLVANIA 36 0.500 6 12 18 18 0 0 14 4 16 2 11 7 0 7 7 4 0890 TYRRELL 12 0.000 0 0 0 0 0 0 0 0 0 0 0 0 0 0 0 0 0900 UNION 108 0.370 22 18 40 37 2 1 33 7 40 0 35 4 1 37 3 0 0910 VANCE 84 0.226 10 9 19 18 1 0 13 6 18 1 13 6 0 12 3 4 0
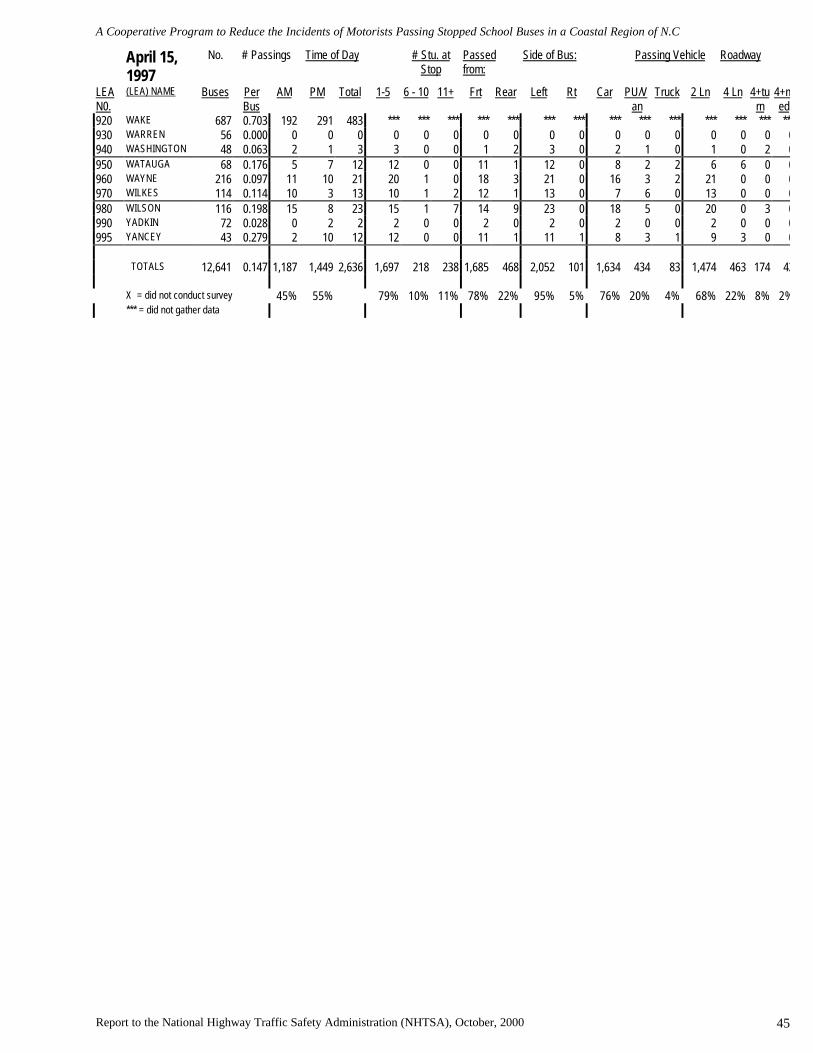
A Cooperative Program to Reduce the Incidents of Motorists Passing Stopped School Buses in a Coastal Region of N.C
Report to the National Highway Traffic Safety Administration (NHTSA), October, 2000 45
April 15,1997
No. # Passings Time of Day # Stu. atStop
Passedfrom:
Side of Bus: Passing Vehicle Roadway
LEAN0.
(LEA) NAME Buses PerBus
AM PM Total 1-5 6 - 10 11+ Frt Rear Left Rt Car PU/Van
Truck 2 Ln 4 Ln 4+turn
4+med
920 WAKE 687 0.703 192 291 483 *** *** *** *** *** *** *** *** *** *** *** *** *** ***930 WARREN 56 0.000 0 0 0 0 0 0 0 0 0 0 0 0 0 0 0 0 0940 WASHINGTON 48 0.063 2 1 3 3 0 0 1 2 3 0 2 1 0 1 0 2 0950 WATAUGA 68 0.176 5 7 12 12 0 0 11 1 12 0 8 2 2 6 6 0 0960 WAYNE 216 0.097 11 10 21 20 1 0 18 3 21 0 16 3 2 21 0 0 0970 WILKES 114 0.114 10 3 13 10 1 2 12 1 13 0 7 6 0 13 0 0 0980 WILSON 116 0.198 15 8 23 15 1 7 14 9 23 0 18 5 0 20 0 3 0990 YADKIN 72 0.028 0 2 2 2 0 0 2 0 2 0 2 0 0 2 0 0 0995 YANCEY 43 0.279 2 10 12 12 0 0 11 1 11 1 8 3 1 9 3 0 0
TOTALS 12,641 0.147 1,187 1,449 2,636 1,697 218 238 1,685 468 2,052 101 1,634 434 83 1,474 463 174 42
X = did not conduct survey 45% 55% 79% 10% 11% 78% 22% 95% 5% 76% 20% 4% 68% 22% 8% 2%*** = did not gather data

A Cooperative Program to Reduce the Incidents of Motorists Passing Stopped School Buses in a Coastal Region of N.C
Report to the National Highway Traffic Safety Administration (NHTSA), October, 2000 46
ReportedViolations
Exhibit 5. Sample map provided to lawenforcement to show locations ofstoparm violations. Stop ID Numberscorrespond to report printouts.

A Cooperative Program to Reduce the Incidents of Motorists Passing Stopped School Buses in a Coastal Region of N.C
Report to the National Highway Traffic Safety Administration (NHTSA), October, 2000 47
Exhibit 6ANational Highway Traffic Safety Administration (NHTSA)
Demonstration Project DTNH22-98-H-15130
A Cooperative Program to Reduce the Incidence of Motorists Passing Stopped Schools Buses in a Coastal Area of North Carolina: ActivitySummary
Agency: NC Highway Patrol Contact Person, Title F/Sgt. D.G. Christopher Person Completing Questionnaire, Title F/Sgt. D.G. Christopher
During the week of September 8-17, 1999 your agency was asked to be involved in a stepped-up enforcement of school bus stop armviolations. Please complete the following information as it relates to both ongoing activities and activity during that week.
1. How many stop arm violations were reported to your agency during the week of September 8-17, 1999?Troopers are patrolling in areas where we are having problems with vehicles not stopping for the buses. Troopers are
following the buses and taking the appropriate actions when the troopers see violations.
2. How many stop arm violations were investigated by your agency during the week of September 8-17, 1999?All available troopers followed buses in there assigned area. Troopers made serveral charges in conjunction with the stop
arm program.
3. How many stop arm violations resulted in citations being issued by your agency during the week of September 8-17, 1999?Several charges were made for failing to stop for a school bus the week of this program. We are continuing to enforce
G.S. 20-217 and other violations the troopers encounter while monitoring the school buses.
4. How many law enforcement officers from your agency participated in the on-site observations?I feel the program is off to a great start. The new media is doing a good job my making the public aware. Troopers know
there problem areas and are delegating patrolling and enforcing problems in these areas.
5. How did you select the site?
6. Did your agency use the maps provided by the Transportation Office?
7. In your opinion, were the maps and stop locations provided by the Transportation Office adequate?
8. In your opinion, are North Carolina School Bus Drivers adequately trained on the definition of a Stop Arm Violation?
Thank you for your participation in this important project. Feel free to attach additional sheets if necessary. Please return by September 10,1999 to:
Jeff TsaiPupil Transportation Program DirectorNCSU-ITRECampus Box 8601Raleigh, NC 27695-8601

A Cooperative Program to Reduce the Incidents of Motorists Passing Stopped School Buses in a Coastal Region of N.C
Report to the National Highway Traffic Safety Administration (NHTSA), October, 2000 48
Exhibit 6BNational Highway Traffic Safety Administration (NHTSA)
Demonstration Project DTNH22-98-H-15130
A Cooperative Program to Reduce the Incidence of Motorists Passing Stopped Schools Buses in a Coastal Area of North Carolina: ActivitySummary
Agency: State Highway Patrol Contact Person, Title Person Completing Questionnaire, Title F/Sgt. J.C. Strickland
During the week of September 8-17, 1999 your agency was asked to be involved in a stepped-up enforcement of school bus stop armviolations. Please complete the following information as it relates to both ongoing activities and activity during that week.
1. How many stop arm violations were reported to your agency during the week of September 8-17, 1999? We discuss the issue of school bus safety with all school bus drivers at the beginning of each school year. We also ensure
that all drivers are familiar with the correct process for filing an alleged violation of school bus law (G.S. 20-217). We also placed oneach school b us what elements they must have to report a violation.
We place troopers on school buses periodically and follow these buses using unmarked cars. Shift assignmentsare made so Troopers can follow assigned school buses in the morning and afternoon each day that school is in session.
We have utilized our TV stations and new media to educate the general public on school bus safety.
2. How many stop arm violations were investigated by your agency during the week of September 8-17, 1999?During the week of 8-12 February 1999, our Troopers did TSI programs in the schools, patrolled school zones and
monitored school bus stops for stop arm violations. Troopers also rode school buses and followed them during this week.
2. How many stop arm violations resulted in citations being issued by your agency during the week of September 8-17, 1999?During the week of February 8-12 1999, our Troopers issued 26 citations for speeding; 1 improper passing; 2 no operators
licenses; 1 revoked license; 18 seat belt citations; and 3 other school zones in New Hanover County.
5. How many law enforcement officers from your agency participated in the on-site observations?School bus drivers must receive more training on what constitutes passing a stopped school bus. The numbers that they
are seeing is not occurring in New Hanover County. Our court systems must be made aware that this is a serious violation and thatthe charge should not be reduced to dismissed as they have been in New Hanover County.
5. How did you select the site?
6. Did your agency use the maps provided by the Transportation Office?
8. In your opinion, were the maps and stop locations provided by the Transportation Office adequate?
8. In your opinion, are North Carolina School Bus Drivers adequately trained on the definition of a Stop Arm Violation?
Thank you for your participation in this important project. Feel free to attach additional sheets if necessary. Please return by September 10,1999 to:
Jeff TsaiPupil Transportation Program DirectorNCSU-ITRECampus Box 8601Raleigh, NC 27695-8601

A Cooperative Program to Reduce the Incidents of Motorists Passing Stopped School Buses in a Coastal Region of N.C
Report to the National Highway Traffic Safety Administration (NHTSA), October, 2000 49
NC SHP Citations Issued Exhibit 6C
DATE ONSLOW NEW HANOVER
IMPLIEDCONSENT
YIELD TOOCLOSELY
PASSINGSTOPPED
SCHOOL BUS
OTHERPASSING
SUSP/REV
OTHER TOTALS IMPLIEDCONSENT
YIELD TOOCLOSELY
PASSING STOPPEDSCHOOL BUS
OTHERPASSING
SUSP/REV
OTHER TOTALS
1/10/2000 0 01/11/2000 0 01/12/2000 1 1 01/13/2000 1 19 20 01/14/2000 0 0
1/17/2000 0 0
1/18/2000 0 0
1/19/2000 0 5 5
1/20/2000 1 2 16 24 43 0
1/21/2000 0 0
1/24/2000 0 3 3
1/25/2000 0 0
1/26/2000 0 1 9 10
1/27/2000 0 20 20
1/28/2000 0 0
1/31/2000 0 0
2/1/2000 0 0
2/2/2000 0 0
2/3/2000 0 0
2/4/2000 0 0
TOTALS 1 0 0 0 2 17 44 64 0 1 0 0 0 0 0 37 38

A Cooperative Program to Reduce the Incidents of Motorists Passing Stopped School Buses in a Coastal Region of N.C
Report to the National Highway Traffic Safety Administration (NHTSA), October, 2000 50
Exhibit 7MEMORANDUM FROM DIRCTOR OF TRANSPORTATION, ONSLOW
COUNTY SCHOOLS, REGARDING THE CLARIFICATION OF HOW TO MAKEPASSENGER STOPS AT CORNERS.
Date: February 2, 1999
To: Transportation Coordinators All School Bus Drivers
From: Jeff Smith, Transportation Director Barbara Rooks, TIMS Coordinator
Re: Bus Stops in Intersections “Corner Bus Stops”
There has been some discussion on the proper way to make a “corner bus stop” at a three-way or four-way intersection. Apparently some buses have been pulling into theintersection to make the passenger stop in an attempt to stop traffic from all directions, forthe safety of the students . The Highway Patrol has discussed these type bus stops with theDistrict Attorney, and they have determined that the bus can not legally stop the trafficfrom 3 or 4 directions at once. This means that traffic on the cross street does notlegally have to stop. If you attempt to make stops in this manner, you could be liable inthe event of an accident.
In the future, this should not be done. If you have to, make 2 stops, one on each side ofthe intersection in the direction that you are traveling. This is how this kind of stop shouldbe handled. Please see the attached diagram to clarify this.
If you have been making bus stops on this manner, inform the students, and make theneeded changes immediately. The students need to be informed to wait at their proper busstops. If you know that a student is crossing an intersection to go to the incorrect busstop, the student needs to be warned and the parents notified. This way, if an accidentoccurs in this situation, we have taken the proper precautions and made our passengerstops in the safest manner possible.
If you have to make additional bus stops to correct this type of situation, don’t forget togive the information to your coordinator so that your TIMS information can be modified.
c C.T. Hoyt R.A. Hood Otis Johnston A.W. Zaremski
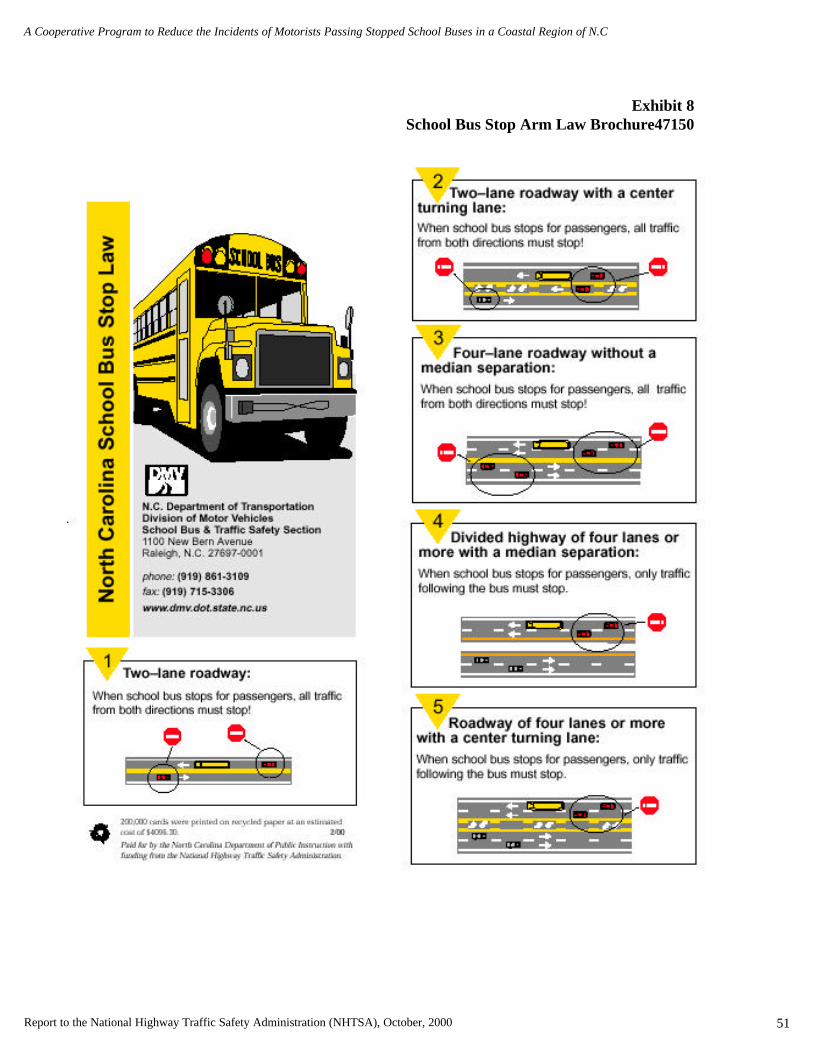
A Cooperative Program to Reduce the Incidents of Motorists Passing Stopped School Buses in a Coastal Region of N.C
Report to the National Highway Traffic Safety Administration (NHTSA), October, 2000 51
Exhibit 8School Bus Stop Arm Law Brochure47150

A Cooperative Program to Reduce the Incidents of Motorists Passing Stopped School Buses in a Coastal Region of N.C
Report to the National Highway Traffic Safety Administration (NHTSA), October, 2000 52
APPENDIX B – POWERPOINT SLIDES from KICKOFF MEETING