a cooperative switching algorithm for multi-agent …n/pub/2015/cooperative-eaai.pdf · a...
TRANSCRIPT

A Cooperative Switching Algorithm for Multi-AgentForaging
Zedadra Ouardaa,b, Jouandeau Nicolasc, Seridi Hamida, Fortino Giancarlod
[email protected], [email protected], [email protected], [email protected]
aLabSTIC Laboratory, 8 may 1945 UniversityP.O.Box 401, 24000 Guelma, Algeria
bDepartment of computer science, Badji Mokhtar-Annaba UniversityP.O.Box 12, 23000 Annaba, Algeria
cAdvanced Computing laboratory of saint-Denis Paris 8 UniversitySaint Denis 93526, France
dDIMES, Universita’ della CalabriaVia P. Bucci, cubo 41c - 87036 - Rende (CS) - Italy
Abstract
Foraging is the act of searching for, and when found transporting objects to one or moresinks. Although foraging can be accomplished by one single robot operating individ-ually, it can be supported more efficiently by multiple robots operating collectively.The efficiency of the group of robots can be sufficiently improved through coordina-tion. Pheromone-based communication is well suited for the coordination of swarmof robots. It is one of the main subjects of swarm intelligence that provides intelligentglobal behaviors from simple local behaviors. The goal of this work, is to study thebenefit of collective foraging via the implicit recruitment when one agent alerts theothers to the location of food. We present therefore, a multi-agent foraging algorithmnamed Cooperative Switching Algorithm for Foraging (C-SAF) inspired from the clas-sical ant system, where agents use pheromone to collectively search and avoid alreadyvisited cells, and to communicate the food location. C-SAF provides a quick search,optimal paths to return to nest and quick exploitation of food. We then generalizethe algorithm to produce a flexible and extensible framework for foraging, that can bereused or extended by other foraging algorithms. A qualitative comparison with somerelated search and foraging algorithms is presented in this paper. A quantitative com-parison shows that our algorithm outperforms the reference c-marking algorithm acrossa range of scenarios that differ in terms of agent, environment and food parameters.
Keywords: Multi-agent system, coordination, Stigmergy, Stigmergic Multi-AntSearch Area (S-MASA) algorithm, foraging task, search task
1. Introduction
Multi-Agent Systems are a suitable approach to develop many multi-robot dis-tributed applications such as: mine detecting [1] [2], search in damaged buildings [3] [4],fire fighting [5], and exploration of spaces [6] [7], where neither a map, nor a Global
Preprint submitted to Engineering Applications of Artificial Intelligence April 17, 2015
ManuscriptClick here to view linked References

Positioning System (GPS) are available [8]. The efficiency of the group of robots in thiscase can be dramatically improved through coordination. Coordination issues [9] ofmulti-robot systems are considering more robots and more complex tasks, sometimesincluding robots and humans together. Swarm robotic investigates multi-robot coor-dination in a distributed way. It is interested in the implementation of systems whichare composed of thousands simple robots rather than one single complex robot [10].The challenge is to develop a group of robots with limited perception and computingcapabilities to resolve a task in a collective and distributed manner. Stigmergic-basedcoordination mechanisms have been used in many robotic problems (aggregation for-mation and flocking [11], patrolling [12], localization and mapping [13], explorationand fire searching [14]), where agents adopt an indirect communication by depositingpheromone in their environment. This mechanism takes its inspiration from social in-sects (ants, bees, termites) which provide collectively intelligent systems [15] that, inspite of the simplicity of their individuals, present a highly structured social organiza-tion. As a result of this organization, ant colonies can accomplish complex tasks thatin some cases far exceed the individual capacities of a single ant [16].
Foraging is a complex task, that involves the coordination of multiple sub-taskseach constitutes a difficult task (searching, harvesting, homing and unloading). It lendsitself to multi-robot systems, even if the task can be achieved by one single robot, it isprofitable to use multiple robots with careful design of cooperation and coordinationstrategies [17]. The sophisticated foraging behavior observed in social insects, providesinspirations to produce simple individuals (like ants) that use simple coordination rulesand provide more complex behaviors as a whole.
We focus in this work on multi-agent foraging, inspired from social insects foragingbehavior, where we study the tendency of using multiple simple agents that collectivelysearch and forage food, rather than one single agent that forages individually. We pro-pose therefore, an extended and revised version of the multi-agent foraging algorithmin [18], which is also an extension version of the foraging algorithm in [19] that usesAPF values rather than pheromone to coordinate the agent’s actions. It is called Co-operative Switching Algorithm for Foraging (C-SAF). We assume in this work, thatthere is no central control, and agents have limited processing power and memory,simple sensors (can just perceive the four neighboring cells), do not know the positionof targets nor the map of environment and use pheromone to communicate. Agents inC-SAF, use the Stigmergic Multi-Ant Search Area (S-MASA) algorithm [20] as theirsearch strategy. It holds a strong preference to locating nearby food sources beforethose that are further away(same principle as central place foraging theory [21]). S-MASA provides:(1) a quick search by the large dispersion of agents when avoidingalready visited cells; optimizing by this their chance to find food, (2) optimal pathsto return to nest results from the wavefront of pheromone concentration (values) ex-pansion created by agents simultaneously when exploring. In C-SAF, the collectiveexploitation of food by means of recruitment has the priority rather than the environ-ment exploration. When a food is found the agent finder alerts the other agents to itslocation by depositing pheromone, a recruitment can take place then.
The remainder of the paper is organized such as follows: Section 2 presents thebackground and related work of search and foraging tasks. Section 3 describes theC-SAF algorithm. A qualitative comparison between C-SAF and Non-Cooperative
2

Switching Algorithm for Foraging (NC-SAF) which is the non cooperative versionof C-SAF, c-marking which is a cooperative multi-agent foraging algorithm inspiredfrom ant systems, based on the Artificial Potential Field (APF) and uses pseudo randomwalk for search task; and Non-Cooperative c-marking (NC-c-marking) which is the noncooperative version of the c-marking algorithm, is presented in Section 4. In Section 5,we present the proposed foraging framework. Section 6 details the different scenarios,obtained results and quantitative comparison between the four algorithms. We finishwith a conclusion in Section 7 and some future works.
2. Background and Related Work
2.1. Basic Concepts
This section defines and clarifies some key terms and concepts which will be usedthroughout this paper:
• Agent-Based Modeling (ABM): is a class of computational models for simulatingthe actions and interactions of autonomous agents (both individual or collectiveentities such as organizations or groups) with a view to assessing their effects onthe system as a whole.
• Swarm Intelligence: is the study of natural and artificial systems of multipleagents, that adopt a distributed autonomous control. Instead, global intelligentbehaviors emerge from simple individual behaviors [22].
• Artificial Potential Field (APF): It is a wavefront of integer values written byagents in the environment, to mark the short distance between any cell and thenest [23].
• Stigmergy: It is a particular form of indirect communication mediated by modifi-cations of the environment used by social insects to coordinate their actions [24].
• Foraging: is the act of searching for and collecting food to one or more storagepoints. It is a complex task that involves the coordination of multiple other tasks,such as searching, homing, grabbing [17].
• Search: is defined as the action to look into or over carefully and thoroughly inan effort to find or discover something [25].
2.2. S-MASA Algorithm
The S-MASA algorithm [20], was proposed for multi-target search and foragingtasks. It can also be used for any other search task. It is designed according to the mainideas of the artificial ant system [16] [26] [27] and the water vortex dynamics. Basi-cally, the system is a group of homogenous artificial agents (e.g.: robots) moving andtaking decisions based on the stimuli received from the environment. While the agentsnavigate they deposit pheromone to mark visited cells and can sense the existence ofpheromone in their vicinity. The absence of pheromone in right cell calls the agent tochange its heading and to move to its right cell, else the agent will keep going forward
3

in its current heading. We adopt in this algorithm the opposite logic of ant system the-ory. So, instead of following the cells that contain pheromone, our agents are guided tonot yet visited cells (where no pheromone is there). Pheromone in S-MASA algorithmis used to repulse agents from already visited cells, this produces a global fascinatingbehavior, which is the same as water vortex dynamics which ensures a large dispersionof agents and a quick search of the environment.
The Detect_Pheromone_Adjust_Heading() (detailed in Algorithm 1) is used to ex-tract the stimuli and to decide about the next direction to take. There will be a changingin the heading of agent if there is no pheromone in its right cell (Figure 1). In all cases(if there is a changing in heading or not), the agent moves in forward direction.
Data: pheromone_value, current_headingResult: heading
if (pheromone_value in right cell = 0) thenif (current_heading = 270) then
Set heading to 0else
Set heading to current_heading + 90
Algorithm 1: Detect_Pheromone_Adjust_Heading()
(a) (b) (c) (d)
Figure 1: S-MASA coordination principle: (a) Changing heading from 180 to 270 (b)Changing heading from 270 to 0 (c) Changing heading from 0 to 90 (d) Changingheading from 90 to 180, where white crosses represent already visited cells
2.3. Related WorkIn most search strategies based on random walk, the agent tends to return to the
same point many times before finally wandering away, because it has no historicalinformation about visited regions. But when time and energy consumption are deter-minants, it will be efficient to guide the agent to not visited regions and repulse it fromvisited ones. Inverse Ant System-Based Surveillance System (IAS-SS) is a cooperativeand distributed coordination strategy that is applied to exploration and surveillance ofunknown environments [27]. It is a modified version of the artificial ant system, wherethe pheromone left has the property of repelling of robots rather than attraction. Ran-dom walk movements and stigmergic guidance were combined to produce a guidedprobabilistic exploration strategy for unknown areas [26]. Same in [28], random walk,
4

APF values and stigmergic communication via pheromone were combined to producea multi-agent foraging algorithm. An asynchronous algorithm that uses identical ants,based on marking visited grid points by pheromone was used for foraging task [29]. Itlacks robustness to faults. The swarm intelligence based algorithm for distribute searchand collective clean up [30], divides the map into a set of distinct sub-area and eachsub-area is divided into some grid. Each robot decides individually based on its localinformation to which subarea it should move. A direct communication via WIFI modelis used between robots and their neighbors. Ants Nearby Treasure Search (ANTS) isa problem in which k identical agents, initially placed at some central location, collec-tively search for a treasure in a two-dimensional plane. This problem can be resolvedby a collection of identical ants that does not communicate between each other [31].Some works present a survey on online algorithms for searching and exploration inthe plan [32]. S-MASA [20] is our simple search algorithm that uses pheromone toguide the search process, agents are reactive and do not need any memory. It can lo-cate nearby targets as fast as possible and at a rate that scales well with the number ofagents. It operates as some animal species that search for food around a central loca-tion, known as central place foraging theory [21]. Table 1 gives a comparison betweenour S-MASA algorithm and some of the related works according to the search processused. It is inspired from the an other foraging taxonomy [17]. The table 1, is dividedinto five major axis according to characteristics corresponding to: environment, agents,algorithms (methods), simulations done and applications field. Each major axis is spec-ified by a set of parameters represented in the minor axis and each parameter can takeseveral values shown in value column.
A large number of foraging algorithms focus on creating a gradient between thebase and the found food, using the capabilities of the robot (chemical sensing or com-munication). A distributed adaptive foraging algorithm was proposed from two otherones [33], where robots can cooperate to choose the best algorithm. It adopts theprinciple of switching within the same algorithm [34]. Switching between multiple be-haviors have been widely studied in behavior-based robotics [35] [36]. c-marking is aparameter-free foraging algorithm [23]. It is a distributed and asynchronous version ofthe wavefront algorithm [37]. Agents construct paths simultaneously while exploring,by writing integer values in each visited cell. Direct Ant Colony Foraging (DACF2)and Direct Ant Colony Foraging (DACF3) are two ant colony foraging models [38] thatadapt Panait’s [39] and Wilinskey’s [? ] models, by adding direct interaction betweenagents to exchange stored variables in order to create the shortest path. The effect ofbiasness in brood caring on the performance of colony was investigated through usingheterogenous agents [15]. Our C-SAF algorithm (Section 3) is similar to [23] in creat-ing wavefront expansion from the base station and in using coloring principle to keeptrack of already discovered food. Table 2, gives a comparison between foraging relatedwork inspired from another foraging taxonomy [17]. This Table 2 incorporates fourmajor axis representing the environmental, agent, task and performance features. Eachmajor axis has several minor axis and each of these can take the values listed in thevalue column of this Table. In the minor axis and value columns values in bold wereadded by us, in order to clearly situate the related works.
5

Table 1: A comparison of some search related works
MajorAMinor axis Value [29][27][26][31][30]S-MASA
Env
iron
men
t
structure infinite 2D grid X X2D grid with 7 rooms Xbounded 2D grid X X X
initial location center X Xroom 1 Xrandom X Xgiven X
Age
nt(s
)
number multiple X X X X X Xtype homogenous X X X
heterogenous X X Xsensors four grid neighbors X X X
five grid neighbors Xlaser range sensor Xlow range sensor X
Alg
orith
m
basis online X X X X X Xdistributed X X X X X Xcooperation X X X X X X
redundancy yes X X Xno X X X
robustness yes X X X Xno X X
communicationstigmergy X X X Xno Xdirect X
Sim
ulat
ions type robots X
3DX robot X2DX robot Xagents Xno simulation X X
App
licat
ion
no exploitation multi target search X Xexploration and surveillance Xexploration XANTS Xdistributed search and clean up Xcoverage X
6
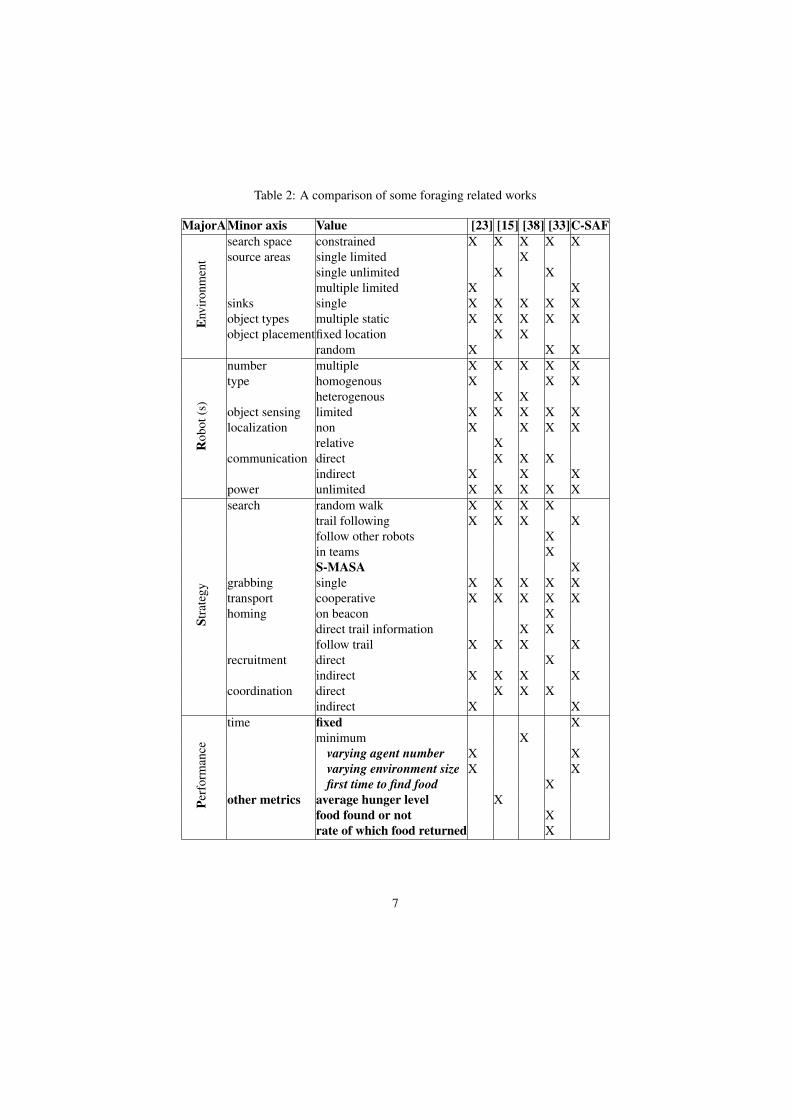
Table 2: A comparison of some foraging related works
MajorAMinor axis Value [23] [15] [38] [33]C-SAF
Env
iron
men
t
search space constrained X X X X Xsource areas single limited X
single unlimited X Xmultiple limited X X
sinks single X X X X Xobject types multiple static X X X X Xobject placementfixed location X X
random X X X
Rob
ot(s
)
number multiple X X X X Xtype homogenous X X X
heterogenous X Xobject sensing limited X X X X Xlocalization non X X X X
relative Xcommunication direct X X X
indirect X X Xpower unlimited X X X X X
Stra
tegy
search random walk X X X Xtrail following X X X Xfollow other robots Xin teams XS-MASA X
grabbing single X X X X Xtransport cooperative X X X X Xhoming on beacon X
direct trail information X Xfollow trail X X X X
recruitment direct Xindirect X X X X
coordination direct X X Xindirect X X
Perf
orm
ance
time fixed Xminimum X
varying agent number X Xvarying environment size X Xfirst time to find food X
other metrics average hunger level Xfood found or not Xrate of which food returned X
7
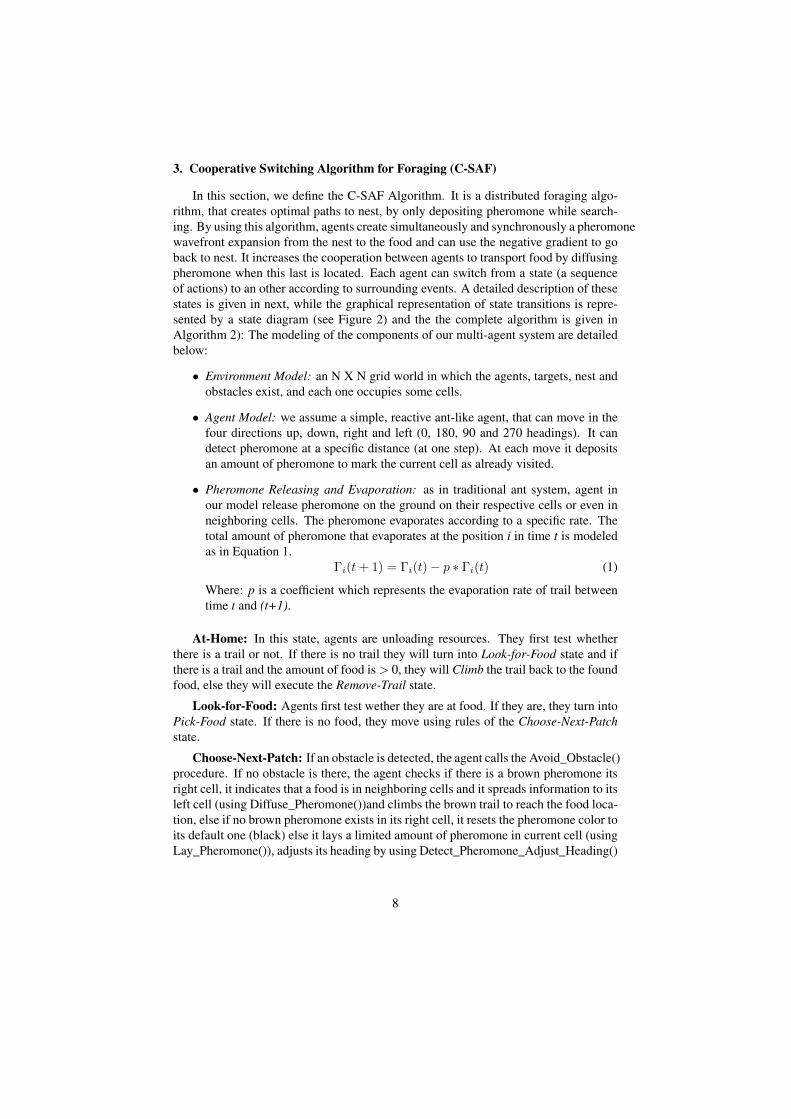
3. Cooperative Switching Algorithm for Foraging (C-SAF)
In this section, we define the C-SAF Algorithm. It is a distributed foraging algo-rithm, that creates optimal paths to nest, by only depositing pheromone while search-ing. By using this algorithm, agents create simultaneously and synchronously a pheromonewavefront expansion from the nest to the food and can use the negative gradient to goback to nest. It increases the cooperation between agents to transport food by diffusingpheromone when this last is located. Each agent can switch from a state (a sequenceof actions) to an other according to surrounding events. A detailed description of thesestates is given in next, while the graphical representation of state transitions is repre-sented by a state diagram (see Figure 2) and the the complete algorithm is given inAlgorithm 2): The modeling of the components of our multi-agent system are detailedbelow:
• Environment Model: an N X N grid world in which the agents, targets, nest andobstacles exist, and each one occupies some cells.
• Agent Model: we assume a simple, reactive ant-like agent, that can move in thefour directions up, down, right and left (0, 180, 90 and 270 headings). It candetect pheromone at a specific distance (at one step). At each move it depositsan amount of pheromone to mark the current cell as already visited.
• Pheromone Releasing and Evaporation: as in traditional ant system, agent inour model release pheromone on the ground on their respective cells or even inneighboring cells. The pheromone evaporates according to a specific rate. Thetotal amount of pheromone that evaporates at the position i in time t is modeledas in Equation 1.
Γi(t+ 1) = Γi(t)− p ∗ Γi(t) (1)
Where: p is a coefficient which represents the evaporation rate of trail betweentime t and (t+1).
At-Home: In this state, agents are unloading resources. They first test whetherthere is a trail or not. If there is no trail they will turn into Look-for-Food state and ifthere is a trail and the amount of food is > 0, they will Climb the trail back to the foundfood, else they will execute the Remove-Trail state.
Look-for-Food: Agents first test wether they are at food. If they are, they turn intoPick-Food state. If there is no food, they move using rules of the Choose-Next-Patchstate.
Choose-Next-Patch: If an obstacle is detected, the agent calls the Avoid_Obstacle()procedure. If no obstacle is there, the agent checks if there is a brown pheromone itsright cell, it indicates that a food is in neighboring cells and it spreads information to itsleft cell (using Diffuse_Pheromone())and climbs the brown trail to reach the food loca-tion, else if no brown pheromone exists in its right cell, it resets the pheromone color toits default one (black) else it lays a limited amount of pheromone in current cell (usingLay_Pheromone()), adjusts its heading by using Detect_Pheromone_Adjust_Heading()
8

(detailed in Algorithm 1). Pheromone evaporates over time, the procedure that guar-antee this evaporation is Update_Pheromone() and moves one step forward (procedureMove()). It turns then automatically to Look-for-Food state.
Pick-Food: The agent picks a given amount of food and diffuses the information tothe neighboring cells by depositing diffusible pheromone (with brown color). It looksafter that for a trail, if there is one it executes a Return-to-Nest state; else it turns intoReturn-and-Color state.
Remove-Trail: When the food is exhausted, the agent moves to a colored cell withthe greatest pheromone concentration and resets its color to the default color (black).It remains in this state until no colored cell is found, it turns then to the Look-for-Foodstate.
Climb: In order to return to the food location, an agent climbs the yellow trail bymoving to one of its four neighbors with yellow color and with a pheromone valuegreater than the pheromone value of the current cell. It remain in this state until noyellow trail is there (no yellow colored cell with greater pheromone value), it turnsthen into Look-for-Food state.
Return-to-Nest: If there exists a trail, the agent moves to one of colored neighbor-ing cells (part of trail) with the lowest pheromone concentration. If nest is reached, itturns into At-Home state.
Return-and-Color: The agent moves to one of the four neighboring cells with thelowest pheromone concentration and changes its color from default one (scale of greencolor, which represents the evaporation of pheromone) to a trail color (yellow) until itreaches the nest; it turns then to the At-Home state.
4. Related Algorithms: A Comparison
The C-SAF algorithm (Section 3), allow to recruit as much as possible agents intrails to cooperate in exploitation of food. To show that cooperation may improvethe performance of the individual agents or the overall behavior of the system, weaddress in this section a qualitative comparison between C-SAF (Algorithm 2), NC-SAF (Algorithm 3), c-marking [23](Algorithm 4) and NC-c-marking (Algorithm 5).An in-depth quantitative evaluation between the C-SAF and these three algorithms iscarried out in Section 6.
The NC-SAF algorithm uses the state diagram depicted by Figure 2 and the C-SAFset of behaviors. However, it does not allow cooperation between agents to transportthe food when it is found. Instead, each found food is exploited and transported by itsfinder. The agent finder will not alert the other agents to the food location, hence theyproceed at search process rather than exploiting the food collectively. It uses the samestate machine, with some changes in the Choose-Next-Patch state, which is defined asfollows:
Choose-Next-Patch: This state allows the agent to decide where to move next.This behavior uses Algorithm 1. When the next step is taken, the agent turns automat-
9

if AT-HOME thenunload food;if ( ∃ trail and food > 0) then goto CLIMB;else if ( ∃ trail and food = 0) then goto REMOVE-TRAIL;else goto LOOK-FOR-FOOD;
if LOOK-FOR-FOOD thenif (food > 0) then goto PICK-FOOD;else goto CHOOSE-NEXT-PATCH;
if CHOOSE-NEXT-PATCH thenif (obstacle detected) then Avoid_Obstacle();else
if (brown P here) and (brown P in right cell) thenDiffuse(P); move to food location using brown cells;
elseif (brown P here) and (no brown P in right cell) then
Remove brown trail;
elseLay(P);Detect_And_Adjust_Heading(P);Update(P);Move();
if PICK-FOOD thenPick up a given amount of food;Diffuse(P);if (∃ trail) then goto RETURN-TO-NEST;else goto RETURN-AND-COLOR;
if REMOVE-TRAIL thenwhile ∃ no trail do
Move to neighboring colored cell with the greater value of P;Update its color to the default one (black);
goto LOOK-FOR-FOOD;
if CLIMB thenwhile ∃ no trail do
Move to neighboring colored cell with the greater value of P;
goto LOOK-FOR-FOOD;
if RETURN-TO-NEST thenwhile home not reached do
move to a colored neighboring cell with the lowest P value;goto AT-HOME;
if RETURN-AND-COLOR thenwhile home not reached do
move to a neighboring cell with the lowest P value;Color that cell to a specific trail color (yellow);
goto AT-HOME;
Algorithm 2: C-SAF Algorithm where pheromone is noted P.
10

Figure 2: State diagram showing the possible states of a foraging agent in C-SAF andNC-SAF algorithms. Black circle is the entry point, white circles are decision points,the diamond is a fusion point and rectangles are states.
ically to the Look-for-Food state. Agents in this state do not diffuse brown pheromoneto attract other agents. This procedure is used by the C-SAF algorithm to spread infor-mation to alert the other agents to the food location in order to exploit it collectively.
Algorithm 4 (shown in Figure 3 which represents c-marking algorithm [23]) is aparameter free foraging algorithm. It is a distributed and asynchronous version of Bar-raquand et al wavefront algorithm [37]. Agents while exploring the environment buildsimultaneously paths between food and the nest which results in computing a wavefrontfrom the agent destination which involves building an ascending APF incrementally.One exploration iteration, when all the agents move, is not equivalent to one loop ofwavefront algorithm [37] and agents may therefore need to visit the same cell severaltimes before the APF reaches its optimal value. A c-marking agent is always in oneof the states depicted by Figure 3. It starts always from the state SEARCH & CLIMBTRAIL which is the default state for all agents. It builds simultaneously paths while itexplores its environment using a pseudo random walk (preference to move to a cell notyet marked). As soon as a food is found, it picks a given food quantity and returns tonest by using a trail if it exists or creating one if it doesn’t exist, by following the neg-ative gradient. Other agents can be recruited in existing trails, resulting in cooperationto exploit food. When the food is exhausted, the last agent must remove the trail (inorder not to attract agents to an exhausted food).
NC-c-marking (Algorithm 5) is an alternative of c-marking, that does not allowcooperation to exploit the food, and so there is no recruitment of agents in existingtrails. Each agent which found a food can create a trail and after that climb it to returnback to the food and remove it at the end. The two algorithms use the same state
11

Figure 3: State diagram showing the possible states of a foraging agent in c-marking[23] and in NC-c-marking algorithms. Black circle is the entry point, white circle is adecision point and rectangles are states.
diagram depicted by Figure 3, where the difference is in the states SEARCH & CLIMBand RETURN AND COLOR TRAIL.
if CHOOSE-NEXT-PATCH thenif (obstacle detected) then
Avoid_Obstacle();
elseLay(P);Detect_And_Adjust_Heading(P);Update(P);Move();
if PICK-FOOD thenPick up a given amount of food;if (∃ trail) then goto RETURN-TO-NEST;else goto RETURN-AND-COLOR;
if (LOOK-FOR-FOOD or REMOVE-TRAIL or CLIMB or RETURN-TO-NESTor RETURN-AND-COLOR or AT-HOME) then
do the same as in algorithm 2;
Algorithm 3: NC-SAF Algorithm where pheromone is noted P.
The taxonomy of foraging developed in [17], describes a multi-agent foraging sys-tem in four major axis representing environment, robots, performance and strategy
12

if SEARCH & CLIMB (Repeat) thenif (food exist in neighboring cell) then move into that cell; goto LOADING;if (there exits no colored neighboring cell) then
goto EXPLORATION & APF CONSTRUCTION;else if (previous position was not a trail cell) then
move to the highest valued colored neighboring cell;
elsemove to a new cell with the current trail color;
UPDATE-VALUE;
if EXPLORATION & APF CONSTRUCTION thenif (there exist neighboring cells without a value) then move randomly to oneof them;UPDATE-VALUE;else move randomly to one of neighbors;UPDATE-VALUE;
if UPDATE-VALUE thenCompute val = 1 + min(4-neighbor values);Write val in the current cell if its different from the starting cell;
if LOADING thenPick up a quantity Qmax of food;if (food is not exhausted) then if (the cell is colored) then
goto RETURN-TO-BASEelse
goto RETURN-AND-COLOR-TRAILelse goto RETURN-AND-REMOVE-TRAIL;
if RETURN-AND-COLOR-TRAIL thenColor the cell in a specific color;UPDATE-VALUE;if (base reached) then Unload food;goto SEARCH & CLIMB;else move to a neighboring cell with the smallest value;
if RETURN-AND-REMOVE-TRAIL thenif (cell has the trail color) then remove this color and UPDATE-VALUE;if (base is reached) then Unload food;goto SEARCH & CLIMB;else if (there exists a neighboring cell with trail color) then move toneighboring trail cell;else move to the smallest neighboring cell
Algorithm 4: c-marking Algorithm [23]
13

if SEARCH & CLIMB (Repeat) thenif (food exist in neighboring cell) then
move into that cell;update marker to true;goto LOADING
if marker t̄rue thenif there exists a colored cell with great value then
move to itelse
goto EXPLORATION & APF CONSTRUCTION
else goto EXPLORATION & APF CONSTRUCTION;
if RETURN-AND-COLOR-TRAIL thencolor the cell in a specific color;UPDATE-VALUE;memorize the last step before the base cell;if (base reached) then Unload food;goto SEARCH & CLIMB;else move to a neighboring cell with the smallest value;
if (EXPLORATION & APF CONSTRUCTION or UPDATE-VALUE orLOADING or RETURN-AND-REMOVE-TRAIL) then
do the same as in algorithm 4;
Algorithm 5: NC-c-marking Algorithm
features. Each major axis is represented by several characteristics (minor axis) each ofwhich has some values (value axis). To be more detailed in the qualitative compari-son that we give in this paper between C-SAF and the three other algorithms, we addedtwo other major axis which represents pheromone and trail features. We associate somecharacteristics for each axis(in bold in minor axis and value columns in Table 3). In thepheromone axis, we want to specify if the pheromone is static, dynamic and if it candiffuse in the environment. While in the trail axis, we added some characteristics todifferentiate how the trail is built in each algorithm. In the strategy, the trail is createdby APF values or pheromone. The optimality of the algorithms is compared in senseof revisiting already visited cells or not. The pheromone in trail is it of nature static ordynamic. The trail is used to keep track of the food location or to save the last searchposition (from where agents can continue search when food is exhausted). When foodis exhausted, from where agents start the remove (from food to nest or the opposite).Since in the four algorithms, agents mark their environment while searching, we addedin the minor axis mark environment with values integer values or pheromone in thestrategy major axis, to specify the marking strategy used by agents.
14

Table 3: Differences and similarities between C-SAF (1), NC-SAF (2), c-marking (3)and NC-c-marking (4) algorithms
MajorA Minor axis Value 1 2 3 4Environmentsearch space constrained X XXX
source areas multiple limited X XXXsink single X XXXobject types multiple static X XXXobject placement random X XXX
Robot (s) number multiple X XXXtype homogenous X XXXobject sensing limited X XXXlocalization none X XXXcommunication stigmergy X XXXpower unlimited X XXX
Performance time fixed X XXXminimum X XXXagent’s number X XXXenvironment size X XXX
Strategy search random XXS-MASA X X
grabbing single X Xmultiple X X
transport single X Xmultiple X X
homing follow trail X XXXrecruitment none X X
yes X Xcoordination stigmergy X XXXmark environment integer values XX
pheromone X XPheromone properties diffusion X
static (to mark trail) X XXXevaporation X X
Trail strategy APF values XXpheromone value X X
optimality revisiting cells XXno revisiting X X
type of pheromone static X XXXgoal save food position X XXX
save last search positionX Xorientation of removefrom food to base XX
from base to food X X
15

5. A Framework for Foraging Algorithms
5.1. Description of the framework
The fact of representing a problem (even foraging problems) as a collection of inde-pendent actors that interact together to achieve some goal, constitute serious progresstowards algorithms solution of the problem [40]. Independent objects result from thisdecomposition which can be reused as a whole in similar problems. Most of foragingproblems ranging from direct communication to stigmergic communication to gradientbased methods to switching algorithms, use each an ABM, or even specific algorithms.Instead, we place all of these foraging mechanisms into a general modeling framework.We intend the framework as a guide to researchers interested in modeling and under-standing particular foraging systems. By providing a common framework, we makecomparisons among many foraging systems easier to do. UML graphical modelinglanguage have been used to model our foraging framework. Indeed, it is extensiblesince the definition of each object is independent from the others, and it can be reusedin other foraging algorithms. It is also flexible, since other foraging algorithms can addimportant classes, remove classes that are not important in their systems, or modifythe definition of some methods (move method of an agent for example), or even to addother states (such as waiting, recharging..), that can be directly defined in the behaviorclass.
In Figure 4, the framework is depicted through a UML class diagram, highlightingthe fundamental classes and the associations among them. The main classes of ourframework are:
• World: includes all the main actors of the simulation;
• Cell: is the physical site where food, agents, obstacles and nest are located.It had two variables, pheromone and color that can be modified by foragers.Pheromone value can be modified over time due to evaporation;
• Food: which can be exploited by some foragers. It is a sort of stationary agentthat has a random position and a limited quantity of units, it decreases its quan-tity, each time a forager consumes a part of it and disappear from simulationwhen it is exhausted.;
• Obstacle and Nest that can take place at some cells (randomly or in the environ-ment center respectively);
• Forager: is an agent, that can move from a cell to another free from obstacles.It searches for food using S-MASA algorithm [20] and depose a quantity ofpheromone at each step to mark a cell as visited. As the framework is designedto be flexible, new algorithms or even behaviors can be defined and seamlesslyused, hence agents can use searching and homing algorithms other than S-MASAone by changing the Move() Method in the sub-classes Laden and Walker. It canconsume and transport Food to the Nest, while coloring the trail used for getting(ask cell to change its color to yellow) to Nest (ask Nest to increase its quantitythen). Individual behaviors of Forager are sufficiently complex and we represent
16
them by a separated class (Behavior class). The Forager class gives birth to twosubclasses (Laden and Walker) through the inheritance type of relationship;
Laden and Walker are subclasses of the Forager class. They inherit the sameattributes and methods of the superclass Forager, but can also add some specificattributes, methods or even redefine methods present in the superclass. The ab-stract method move() is redefined in the two subclasses Laden, Walker, becausethe way a Laden Forager move is different from the way a Walker Forager andthe way of coloring cells is too different from a subclass to the other, a Ladenfor example will create or climb a trail and the Walker will execute the S-MASAalgorithm to search food;
• Behavior: includes a specific foraging algorithm (see Algorithm 2). It describeshow these agents change over time from a state to another according to surround-ing events. The state diagram depicted by Figure 2, represents these states;
Foraging framework classes are linked by the following associations:
• World is a composition of Forager, Food, Cell, Obstacle and Nest. This compo-sition is a strong form of association and at the disappearance of the world, allits composers will be destroyed as well;
• 1 to 1 association between Cell and Food (same between Cell and Nest, Obstacle)since any food object is located on only one cell object;
• 1 to * association between Agent and Cell, since one or more gents can occupythe same cell at time t;
• 1 to 4 auto-association characterizes the class cell, meaning that each cell isassociated to its four neighbors. Each cell discovers the not-occupied and not-marked cells among its four neighboring cells. So as to inform its agent of apossible free location;
• A dependency association between Forager and Food (Forager and Nest as well).During a simulation, a Forager is not in a permanent relationship with Food (orNest), it changes its behavior regarding the food quantity.
5.2. Netlogo ImplementationThe framework is implemented in Netlogo [41]. Netlogo is a multi-agent pro-
grammable modeling environment which allows to prototype quickly systems of situ-ated agents evolving in a two dimensions world. Two types of world can be used: the2D environment can be either simulated as a grid or simulated as a continuous metricspace. In this paper simulations are performed with a grid environment where cellscan be either empty or occupied by food, agent, obstacle or the nest. We considertwo environment settings: the first one is obstacle-free, the second one contains someobstacles. The position of obstacles is fixed for all simulations in order to exclude itsimpact on the multi-agent systems performance. Agents have the same size as a cellthey communicate by depositing pheromone in each visited cell and they start all frominitial given positions and they have specific initial heading.
17

The Basic framework depicted by Figure 4, is transformed into platform-specificmodel in Netlogo, hence the transformation doesn’t support some traits of agent-orientedprogramming. Because there are no true objects in Netlogo, agent have to be trans-formed to data structures and code.
• Each Forager is represented by Breed. It helps at defining groups of simi-lar members called agentset. They are mobile agents that can move in theirenvironment (Turtles). Agents modify patches color when needed to createtrails or to alert other agents to food location. Percepts of agents are modeledas reading information from patches in some cases (defined methods: listeOf-ColoredNeighborswithminvalue(), listeOfColoredNeighborswithmaxvalue() useNetlogo methods as neighbors4, patch-here, patch-at-heading-and-distance, patch-ahead to extract information), agent variables of other agents (food-here to testquantity of food at patch food..) or globals (colony-food to test the quantity offood in Nest..). Agents use the Netlogo method move() to move in their environ-ment;
• Each Food is represented by breed too, as immobile agents Patch;
• World which is a set of patches on which foragers, obstacles, Food and Nest cantake place, is modeled as the setup procedure in Netlogo. Datastores of World,are modeled as global variables;
• Forager, Food, World datastores are represented with agent variables. The key-word globals, is used to define global variables while Foragers-own, Food-ownand patches-own are used to define local variables for the agentsets foragers,food and patches respectively;
• communication between our agents is indirect, it is implemented as a part ofbehaviors’ procedures code, when the procedures directly adjust the values ofagent variables;
• The setup procedure, is used to setup the different variables of foragers, food,world and obstacles by calling the procedures: setup-foragers, setup-food, setup-patches and setup-obstacles. It resets also the ticks;
• All agent behaviors, are modeled as procedures that are called from the go pro-cedure (Move-Ants, return-and-color-min, at-Home, look-for-food, choose-next-patch, avoid-obstacle..);
• The Patch class is superclass of the two classes Food and World through theinheritance type of relationship. These two subclasses are an exact replica ofthe superclass Patch (hence ’inheritance’), but is also allowed to have its ownspecific attributes, methods, or to redefine some methods already present in thesuperclass. The Food class for example adds the Decrease() method that allowsit to decrease its quantity each time a Forager load food. Forager is a Turtle. Itis relied to the superclass turtle by inheritance association and so it can add othermethods or properties;
18

Figure 4: Class diagram of our foraging framework
6. Performance Evaluation
In this section, we discuss the performance of the four algorithms (C-SAF, NC-SAF, c-marking and NC-c-marking) in obstacle-free and obstacle environments. Wepresent in Subsection 6.1 the simulation parameters and performance indices used toevaluate the algorithms. In Subsection 6.2, we describe three fundamental scenar-ios that are used for simulations, and report the importance and the benefits of thesethree scenarios in understanding and comparing the different algorithms. In the lastSubsection 6.3 we present, compare and discuss the obtained results by the differentalgorithms in the three scenarios.
6.1. Simulation Parameters and Performance Indices
The two world setups that are used for simulations including positions of nest, food,obstacles and agents, are reported in Figure 5. There are several related parameterswhich must be chosen, such as world size, food density, food concentration, agent’scapacity and agent’s number where: world size is the dimension of the search space,it is a grid of N X N cells. Food density is the number of food locations (sites), eachsite contains a limited amount of food. These locations are distributed randomly in theenvironment. Food concentration, indicates the amount of food that each site contains(we refer to it as unit in the paper). Agent’s capacity is the amount of food (units)
19
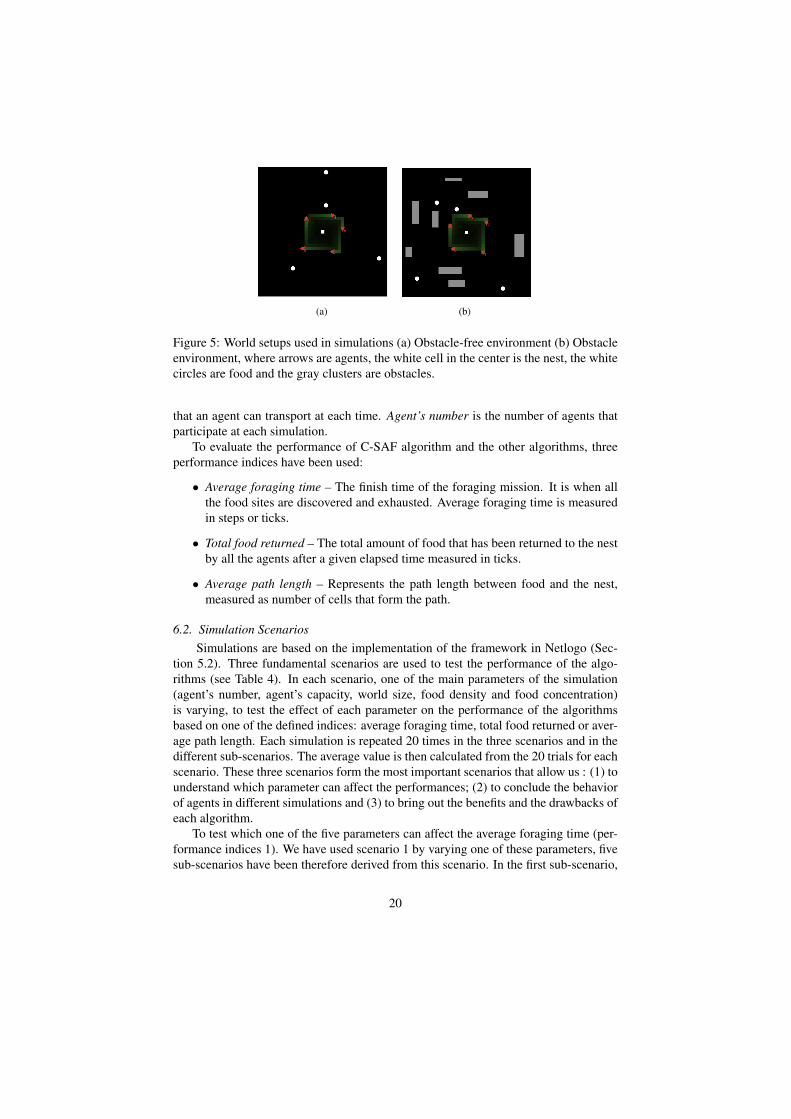
(a) (b)
Figure 5: World setups used in simulations (a) Obstacle-free environment (b) Obstacleenvironment, where arrows are agents, the white cell in the center is the nest, the whitecircles are food and the gray clusters are obstacles.
that an agent can transport at each time. Agent’s number is the number of agents thatparticipate at each simulation.
To evaluate the performance of C-SAF algorithm and the other algorithms, threeperformance indices have been used:
• Average foraging time – The finish time of the foraging mission. It is when allthe food sites are discovered and exhausted. Average foraging time is measuredin steps or ticks.
• Total food returned – The total amount of food that has been returned to the nestby all the agents after a given elapsed time measured in ticks.
• Average path length – Represents the path length between food and the nest,measured as number of cells that form the path.
6.2. Simulation ScenariosSimulations are based on the implementation of the framework in Netlogo (Sec-
tion 5.2). Three fundamental scenarios are used to test the performance of the algo-rithms (see Table 4). In each scenario, one of the main parameters of the simulation(agent’s number, agent’s capacity, world size, food density and food concentration)is varying, to test the effect of each parameter on the performance of the algorithmsbased on one of the defined indices: average foraging time, total food returned or aver-age path length. Each simulation is repeated 20 times in the three scenarios and in thedifferent sub-scenarios. The average value is then calculated from the 20 trials for eachscenario. These three scenarios form the most important scenarios that allow us : (1) tounderstand which parameter can affect the performances; (2) to conclude the behaviorof agents in different simulations and (3) to bring out the benefits and the drawbacks ofeach algorithm.
To test which one of the five parameters can affect the average foraging time (per-formance indices 1). We have used scenario 1 by varying one of these parameters, fivesub-scenarios have been therefore derived from this scenario. In the first sub-scenario,
20
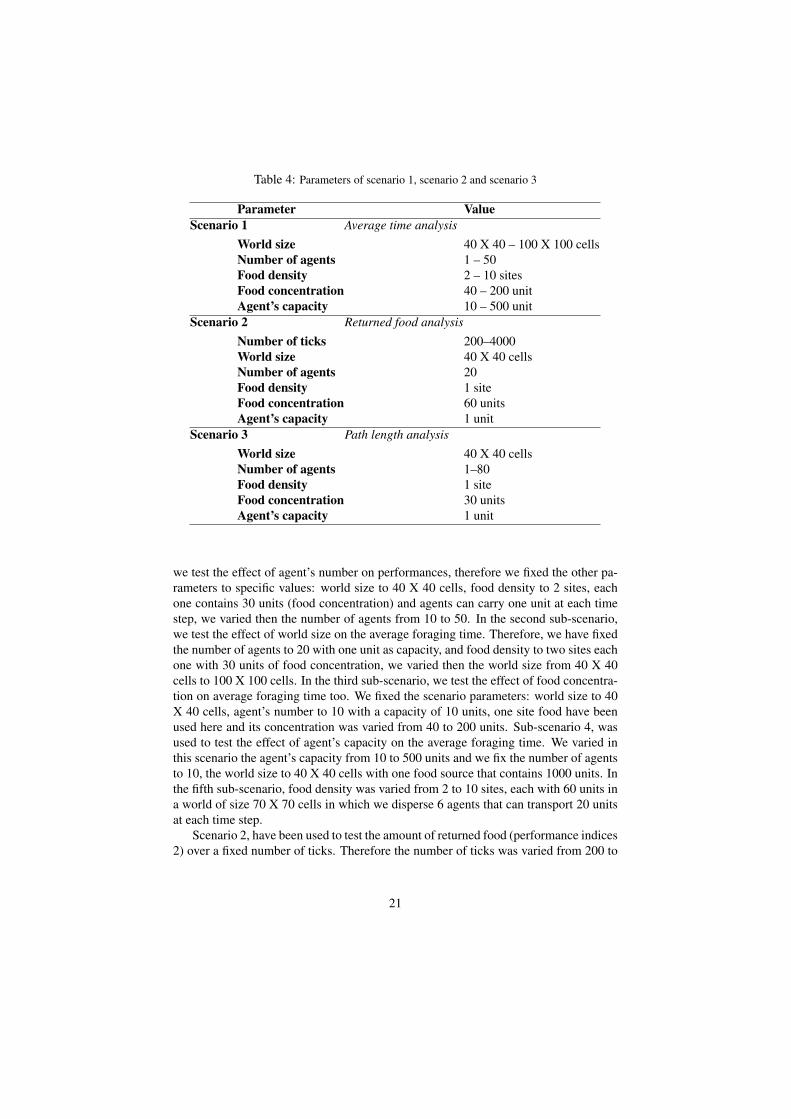
Table 4: Parameters of scenario 1, scenario 2 and scenario 3
Parameter ValueScenario 1 Average time analysis
World size 40 X 40 – 100 X 100 cellsNumber of agents 1 – 50Food density 2 – 10 sitesFood concentration 40 – 200 unitAgent’s capacity 10 – 500 unit
Scenario 2 Returned food analysisNumber of ticks 200–4000World size 40 X 40 cellsNumber of agents 20Food density 1 siteFood concentration 60 unitsAgent’s capacity 1 unit
Scenario 3 Path length analysisWorld size 40 X 40 cellsNumber of agents 1–80Food density 1 siteFood concentration 30 unitsAgent’s capacity 1 unit
we test the effect of agent’s number on performances, therefore we fixed the other pa-rameters to specific values: world size to 40 X 40 cells, food density to 2 sites, eachone contains 30 units (food concentration) and agents can carry one unit at each timestep, we varied then the number of agents from 10 to 50. In the second sub-scenario,we test the effect of world size on the average foraging time. Therefore, we have fixedthe number of agents to 20 with one unit as capacity, and food density to two sites eachone with 30 units of food concentration, we varied then the world size from 40 X 40cells to 100 X 100 cells. In the third sub-scenario, we test the effect of food concentra-tion on average foraging time too. We fixed the scenario parameters: world size to 40X 40 cells, agent’s number to 10 with a capacity of 10 units, one site food have beenused here and its concentration was varied from 40 to 200 units. Sub-scenario 4, wasused to test the effect of agent’s capacity on the average foraging time. We varied inthis scenario the agent’s capacity from 10 to 500 units and we fix the number of agentsto 10, the world size to 40 X 40 cells with one food source that contains 1000 units. Inthe fifth sub-scenario, food density was varied from 2 to 10 sites, each with 60 units ina world of size 70 X 70 cells in which we disperse 6 agents that can transport 20 unitsat each time step.
Scenario 2, have been used to test the amount of returned food (performance indices2) over a fixed number of ticks. Therefore the number of ticks was varied from 200 to
21
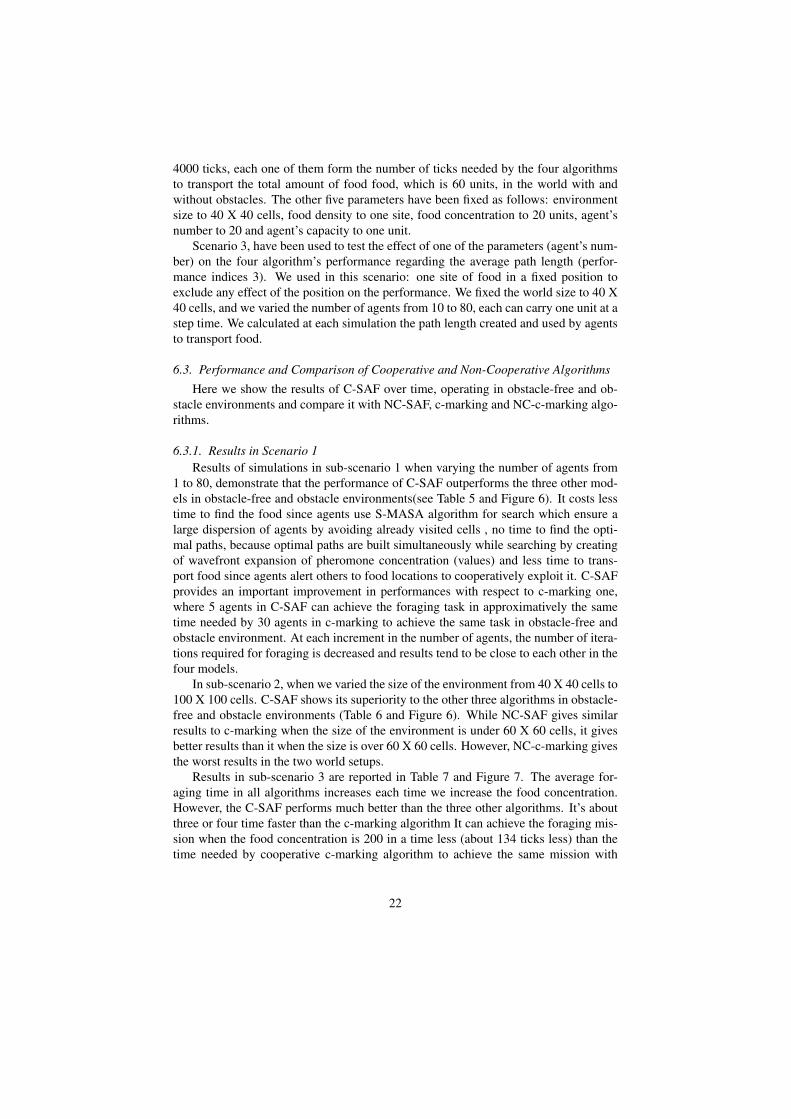
4000 ticks, each one of them form the number of ticks needed by the four algorithmsto transport the total amount of food food, which is 60 units, in the world with andwithout obstacles. The other five parameters have been fixed as follows: environmentsize to 40 X 40 cells, food density to one site, food concentration to 20 units, agent’snumber to 20 and agent’s capacity to one unit.
Scenario 3, have been used to test the effect of one of the parameters (agent’s num-ber) on the four algorithm’s performance regarding the average path length (perfor-mance indices 3). We used in this scenario: one site of food in a fixed position toexclude any effect of the position on the performance. We fixed the world size to 40 X40 cells, and we varied the number of agents from 10 to 80, each can carry one unit at astep time. We calculated at each simulation the path length created and used by agentsto transport food.
6.3. Performance and Comparison of Cooperative and Non-Cooperative Algorithms
Here we show the results of C-SAF over time, operating in obstacle-free and ob-stacle environments and compare it with NC-SAF, c-marking and NC-c-marking algo-rithms.
6.3.1. Results in Scenario 1Results of simulations in sub-scenario 1 when varying the number of agents from
1 to 80, demonstrate that the performance of C-SAF outperforms the three other mod-els in obstacle-free and obstacle environments(see Table 5 and Figure 6). It costs lesstime to find the food since agents use S-MASA algorithm for search which ensure alarge dispersion of agents by avoiding already visited cells , no time to find the opti-mal paths, because optimal paths are built simultaneously while searching by creatingof wavefront expansion of pheromone concentration (values) and less time to trans-port food since agents alert others to food locations to cooperatively exploit it. C-SAFprovides an important improvement in performances with respect to c-marking one,where 5 agents in C-SAF can achieve the foraging task in approximatively the sametime needed by 30 agents in c-marking to achieve the same task in obstacle-free andobstacle environment. At each increment in the number of agents, the number of itera-tions required for foraging is decreased and results tend to be close to each other in thefour models.
In sub-scenario 2, when we varied the size of the environment from 40 X 40 cells to100 X 100 cells. C-SAF shows its superiority to the other three algorithms in obstacle-free and obstacle environments (Table 6 and Figure 6). While NC-SAF gives similarresults to c-marking when the size of the environment is under 60 X 60 cells, it givesbetter results than it when the size is over 60 X 60 cells. However, NC-c-marking givesthe worst results in the two world setups.
Results in sub-scenario 3 are reported in Table 7 and Figure 7. The average for-aging time in all algorithms increases each time we increase the food concentration.However, the C-SAF performs much better than the three other algorithms. It’s aboutthree or four time faster than the c-marking algorithm It can achieve the foraging mis-sion when the food concentration is 200 in a time less (about 134 ticks less) than thetime needed by cooperative c-marking algorithm to achieve the same mission with
22

Table 5: Results in scenario 1: when varying the agent’s number
Agent Number 1 5 10 20 25 30 50Ticks in obstacle-free environmentNC-SAF 2236 1294 1111 822 752 714 658C-SAF 2295 509 414 293 251 234 218NC-c-marking 6900 2236 1777 1393 1228 1096 1786c-marking 6777 1566 1210 779 665 427 340Ticks in obstacle environmentNC-SAF 3125 1403 1208 833 771 720 718C-SAF 3179 527 429 307 259 237 231NC-c-marking 9093 2100 1490 1165 1107 985 1918c-marking 10735 1603 1266 814 641 455 372
Table 6: Results in scenario 1: when varying world size
World Size 40X40 60X60 80X80 100X100Ticks in obstacle-free environmentNC-SAF 822 1144 1666 2515C-SAF 293 360 444 594NC-c-marking 1393 3033 3355 4270c-marking 779 1227 1813 3004Ticks in obstacle environmentNC-SAF 833 1194 1716 2565C-SAF 307 410 494 594NC-c-marking 1824 3198 4263 5155c-marking 814 1613 1921 3057
Table 7: Results in scenario 1: when varying food concentration
Food Concentration 40 80 100 140 180 200Obstacle-free environmentNC-SAF 211.3 279.4 332.5 426.8 645.4 727.4C-SAF 111.6 138.5 169.4 180.1 195.1 245.6NC-c-marking 439.4 643.7 748.9 1068.2 1189.4 1261.9c-marking 379.7 424.3 543.3 588.9 757.9 928.7Obstacle environmentNC-SAF 242.3 321.9 357.2 464.8 701.5 805.9C-SAF 171.5 193 217 233.3 253.1 276.4NC-c-marking 513.7 696.3 813.5 1218.4 1316.3 1440.8c-marking 400.6 550.2 613.9 648.7 702.8 804.9
only 40 food concentration. Also, the NC-SAF performs better than the c-marking andNC-c-marking algorithms in obstacle-free and obstacle environments.
In sub-scenario 4 (Table 8 and Figure 7), the average foraging time decreases with
23

(a) (b)
(c) (d)
Figure 6: Simulation results for scenario 1: (a), (b) Results of sub-scenario 1 inobstacle-free and obstacle environment. (c), (d) Results of sub-scenario 2 in obstacle-free and obstacle environment.
each increase in agent’s capacity in obstacle-free and obstacle environments. The C-SAF algorithm gave the best results, where agents can finish the foraging task veryquickly (77 and 50 ticks) when we consider a great agent’s capacity (200 and 500 unitsrespectively). Even if we consider a small agent’s capacity (10 and 20 units), we gotsmall foraging time with only 10 agents, while the same performance is obtained withgreat agent’s capacity (100 and 200 units) in cooperative c-marking algorithm with 10agents too. In real world applications, it is complex and expensive to produce robotswhich can carry a large quantity of items, it needs more complex and sophisticatedrobots. The C-SAF performs much faster in this sub-scenario too, it is about 3 to 4times faster than the c-marking one, and much more faster than the NC-SAF and theNC-c-marking in obstacle-free and obstacle environments.
In sub-scenario 5 (Table 9 and Figure 7), we got an increase in the average foragingtime with each increase in food density. The minimum foraging time is always givenby the the C-SAF algorithm. It is about two times faster than the NC-SAF, and aboutthree to four times faster than the c-marking and much faster than the NC-c-markingone in obstacle-free environment. It is eight times faster than the c-marking algorithmin some simulations in obstacle environment.
24

(a) (b)
(c) (d)
(e) (f)
Figure 7: Simulation results for scenario 1: (a), (b) Results of sub-scenario 3 inobstacle-free and obstacle environment. (c), (d) Results of sub-scenario 4 in obstacle-free and obstacle environment. (e), (f) Results of sub-scenario 5 in obstacle-free andobstacle environment.
25

Table 8: Results in scenario 1: when varying the agent’s capacity
Agent’s Capacity 10 20 50 100 200 500Obstacle-free environmentNC-SAF 2241.2 1353.9 621.6 384.6 195.9 121.7C-SAF 358.4 201.8 151.6 113.3 77.8 50.3NC-c-marking 4903.4 2430.4 1198.5 623.1 409.6 246.9c-marking 1362.7 870.3 592.1 362.3 311.6 197.6Obstacle environmentNC-SAF 3450.6 1736.4 742.7 405.2 217.8 148.7C-SAF 787.8 337.4 175.5 142.5 95.8 78.8NC-c-marking 5290.8 2677.7 1310.9 650.9 456.9 303c-marking 1518.6 896.9 606.9 435.7 361.5 243.5
Table 9: Results in scenario 1: when varying food density
Food Density 2 3 4 6 8 10Obstacle-free environmentNC-SAF 634.3 776.2 929.9 1050.3 1188.4 1404.6C-SAF 312.5 523.3 667.9 828.5 1038 1215NC-c-marking 2080.7 2543.3 3000.6 3294.3 4286.7 6558.8c-marking 1445.2 2255.7 2515.9 3087.3 3830.8 5294.9Obstacle environmentNC-SAF 702 785.6 997.9 1091.7 1225.7 1464.6C-SAF 368.2 604.4 725.8 947.3 1173.1 1296.6NC-c-marking 2980.7 3543.3 4300.6 4394.3 5186.7 7608.8c-marking 2945.2 3455.7 3515.9 4187.3 5030.8 6094.9
6.3.2. Results in Scenario 2C-SAF and NC-SAF provide significant better results than results than c-marking
and NC-c-marking respectively, in terms of amount of food returns over 4000 ticks(Table 10 and Figure 8). C-SAF reaches and returns the total amount of food in only300 ticks, which is less than half of the time needed by c-marking in obstacle-free andobstacle environment. However, NC-SAF takes more time to exhaust the found food(2300, 2500 ticks in obstacle-free and obstacle environment respectively), but it stillmuch less than NC-c-marking (3950, 4000 ticks obstacle-free and obstacle environ-ment respectively) in the two environment settings. In this scenario, we have variedthe number of ticks while the other parameters kept fix to some specific values. Thisscenario is very lickety related to average foraging time, and so the performance willbe the same as in scenario 1 when we vary one of the parameters. If we increase thenumber of agents for example, we will get an increase in the amount of returned foodbecause the average foraging time was decreased (see scenario 1 when varying numberof agents). If we increase the world size, we got an increase in the average foragingtime and so a decrease in the amount of food returned. However, we will always havethe best results with the C-SAF algorithm in obstacle-free or obstacle environments.
26

Table 10: Results in scenario 2: returned food over 4000 ticks
Ticks 200 300 350 850 1100 1300 2300 2500 3950 4000
Obstacle-free environmentNC-SAF 11 15 22 39 42 49 60 60 60 60C-SAF 55 60 60 60 60 60 60 60 60 60NC-c-marking 3 4 9 30 43 48 49 51 60 60c-marking 8 18 26 60 60 60 60 60 60 60Obstacle environmentNC-SAF 9 11 19 27 33 45 57 60 60 60C-SAF 53 58 60 60 60 60 60 60 60 60NC-c-marking 2 5 6 16 26 32 42 49 59 60c-marking 5 13 25 60 60 60 60 60 60 60
(a) (b)
Figure 8: Comparison results of C-SAF, NC-SAF, c-marking and NC-c-marking, whenvarying the ticks number (a) Obstacle-free environment (b) Obstacle environment
6.3.3. Results in Scenario 3The food position in this scenario was fixed, and the optimal path length that relays
the food to the nest was calculated in advance. C-SAF and NC-SAF algorithms producean optimal path simultaneously and synchronously when exploring the environment, itis similar to the wavefront algorithm. Even with one agent the path is optimal. How-ever, in c-marking algorithms the path is non optimal and the creation of the wavefrontis asynchronous, which means that agents need to visit the cell several times to getto the optimal value. The length of the path decreases when we increase the numberof agents and the optimal value is reached with 40 agents and over in obstacle-freeenvironments, while it was not reached in obstacle environments and it increases over80 agents (Table 11 and Figure 9). We varied one parameter in this scenario which isthe agent’s number. We will get the same results when we increase the world size, thefood density or even the food concentration. With our algorithm the only parameterthat affects the average path length is the position of the food (which was random in allthe previous simulations). If we change the position closer to the nest, the average path
27

length will decrease and if we change the food position to one farther from the nest theaverage path length will increase.
Table 11: Results in scenario 3: Average path length
Agent Number 1 10 15 30 40 80Obstacle-free environmentNC-SAF 18 18 18 18 18 18C-SAF 18 18 18 18 18 18NC-c-marking 34.8 21.2 19.4 18.7 18 18c-marking 34.75 21.9 19.3 18.6 18 18Obstacle environmentNC-SAF 18 18 18 18 18 18C-SAF 18 18 18 18 18 18NC-c-marking 35 28.8 24.25 21.55 20.1 19.3c-marking 36.4 27.1 25.1 20.4 19.1 18.9
(a) (b)
Figure 9: Comparison results of C-SAF, NC-SAF, c-marking and NC-c-marking by theaverage path length (a) Obstacle-free environment (b) Obstacle environment
7. Conclusion
We have presented in this paper, a distributed foraging algorithm called C-SAF.Agents used are simple, reactive with small memory and limited perception capability.They communicate by depositing pheromone (stigmergic communication). We havepresented also a flexible framework for foraging, that can be reused or extended toaddress the needs of other foraging algorithms.
Three fundamental scenarios have been used to test the effect of the simulationparameters on the performances of four algorithms (C-SAF, NC-SAF, c-markimg andNC-c-marking) using the defined performance indices: average foraging time, amountof returned food and average path length. In the first scenario, we have varied at each
28
time one of the parameters to test its effect on the average foraging time, while in thesecond scenario, we varied only the number of ticks and in the third scenario we variedthe number of agents. In all the scenarios, the C-SAF provided the best results interms of average foraging time, total amount of returned food and average path lengthin obstacle-free and obstacle environments. The average foraging time was about 3or 4 times faster than the c-marking one which is a main reference in the literature.Simulations demonstrate the superiority of the C-SAF algorithm with respect to theother algorithms with and without cooperation. Moreover it demonstrates the benefit ofcooperation in multi-agent foraging when the team of agents is efficiently coordinated.
The C-SAF outperforms the c-marking one in three fundamental points: (1) thequick search provided by the S-MASA algorithm; (2) the optimal paths created simul-taneously and synchronously while exploring and (3) the high level of cooperation toexploit and transport food by diffusing pheromone to neighboring cells. But also theC-SAF algorithm has some degradation in performances in some cases: (1) the pres-ence of obstacles with complex shape; (2) when food is close to boundaries, a smallnumber of agents will contribute to transport the others to reach the boundaries, andso the foraging time will increase and (3) for large world scale, visiting all the envi-ronment to reach the food which is very far from the nest, could duplicate the area tosearch and results are obtained in more foraging time.
As future works, we intend to enhance the algorithm to deal with complex envi-ronment with different shape obstacles, and to test its ability to adapt to changes indynamic environments.
8. References
[1] E. Acar, H. Choset, Y. Zhang, M. Schervish, Path planning for robotic dem-ining: Robust sensor-based coverage of unstructured environments and proba-bilistic methods, International Journal of Robotics Research 22(7-8) (2003) 441–466doi:10.1177/02783649030227002.
[2] D. Gage, Many-robot mcm search systems, in: Autonomous Vehicles in MineCountermeasures Symposium, vol. 9, 1995, pp. 56–64. doi:10.1.1.38.771.
[3] G. Kantor, S. Singh, R. Peterson, D. Rus, A. Das, V. Kumar, G. Pereira, Dis-tributed search and rescue with robot and sensor teams, in: Field and ServiceRobotics, Springer Berlin Heidelberg, 2006, pp. 529–538. doi:10.1007/10991459-51.
[4] J. Jennings, G. Whelan, W. Evans, Cooperative search and rescue with a teamof mobile robots, in: IEEE 8th International Conference on Advanced Robotics(ICAR), 1997, pp. 193–200. doi:10.1109/ICAR.1997.620182.
[5] A. Marjovi, J. unes, L. Marques, A. de Almeida, Multi-robot exploration and firesearching, in: IEEE/RSJ International Conference on Intelligent Robots and Sys-tems (IROS), 2009, pp. 1929–1934. doi:10.1109/IROS.2009.5354598.
29

[6] Landis, A. Geoffrey, Robots and humans: Synergy in planetary exploration, in:Space technology and applications int. Forum-Staif 2003: Conf. on Thermo-physics in Microgravity; Commercial/Civil Next Generation Space Transporta-tion; Human Space Exploration; Symps. on Space Nuclear Power and Propulsion(20th); Space Colonization (1st), Vol. 654, AIP Publishing, 2003, pp. 853–860.doi:org/10.1063/1.1541377.
[7] K. Schilling, C. Jungius, Mobile robots for planetary exploration, Control En-gineering Practice 4 (4) (1996) 513–524. doi:10.1016/0967-0661(96)00034-2.
[8] M. A. Batalin, G. S. Sukhatme, Spreading out: A local approach to multi-robotcoverage, in: Distributed autonomous robotic systems 5, Springer, 2002, pp. 373–382. doi:10.1007/978-4-431-65941-9-37.
[9] Z. Yan, N. Jouandeau, A. A. Cherif, A survey and analysis of multi-robot coordi-nation, International Journal of Advanced Robotic Systems 10.
[10] R. Vaughan, Massively multi-robot simulation in stage, Swarm Intelligence 2 (2-4) (2008) 189–208.
[11] Y. X. F. WeiXing, W. KeJun, G. ShuXiang, Novel algorithms for coordination ofunderwater swarm robotics, in: IEEE International Conference on Mechatronicsand Automation, 2006, pp. 654–659.
[12] F. Pasqualetti, A. Franchi, F. Bullo, On optimal cooperative patrolling, in: 49thIEEE Conference on Decision and Control (CDC), 2010, pp. 7153–7158.
[13] J. Stipes, R. Hawthorne, D. Scheidt, D. Pacifico, Cooperative localization andmapping, in: Proceedings of the IEEE International Conference on Networking,Sensing and Control (ICNSC), 2006, pp. 596–601.
[14] A. Marjovi, J. G. Nunes, L. Marques, A. de Almeida, Multi-robot exploration andfire searching, in: IEEE/RSJ International Conference on Intelligent Robots andSystems (IROS), 2009, pp. 1929–1934.
[15] S. Momen, Ant-inspired decentralized task allocation strategy in groups of mobileagents, Procedia Computer Science 20 (2013) 169–176.
[16] M. Dorigo, E. Bonabeau, G. Theraulaz, Ant algorithms and stigmergy, FutureGeneration Computer Systems 16 (8) (2000) 851–871.
[17] A. F. Winfield, Foraging robots, in: Encyclopedia of Complexity and SystemsScience, Springer, 2009, pp. 3682–3700.
[18] O. Zedadra, N. Jouandeau, H. Seridi, G. Fortino, Design and analysis of cooper-ative and non-cooperative stigmergy-based models for foraging, in: Proceedingsof the 19th IEEE International Conference on Computer Supported CooperativeWork in Design, 2015, (to appear).
30

[19] O. Zedadra, N. Jouandeau, H. Seridi, G. Fortino, A distributed foraging algorithmbased on artificial potential field, in: Proceedings of the 12th IEEE InternationalSymposium on Programming and Systems (ISPS), 2015, (to appear).
[20] O. Zedadra, N. Jouandeau, H. Seridi, G. Fortino, S-MASA: A stigmergy basedalgorithm for multi-target search, in: M. P. M. Ganzha, L. Maciaszek (Ed.), Pro-ceedings of the 2014 Federated Conference on Computer Science and Informa-tion Systems, Vol. 2 of Annals of Computer Science and Information Systems,IEEE, 2014, pp. 1477–1485.
[21] G. H. Orians, N. E. Pearson, On the theory of central place foraging, Analysis ofecological system (1979) 155–177.
[22] E. Bonabeau, M. Dorigo, G. Theraulaz, Swarm intelligence: from natural to arti-ficial systems, no. 1, Oxford university press, 1999.
[23] O. Simonin, F. Charpillet, E. Thierry, Revisiting wavefront construction with col-lective agents: an approach to foraging, Swarm Intelligence (2014) 113–138.
[24] P.-P. Grassé, La reconstruction du nid et les coordinations interindividuelles chez-bellicositermes natalensis etcubitermes sp. la théorie de la stigmergie: Essaid’interprétation du comportement des termites constructeurs, Insectes sociaux6 (1) (1959) 41–80.
[25] D. C. V. Méndez, F. Bartumeus, Random search strategies, Stochastic Founda-tions in Movement Ecology, Springer-Verlag Berlin Heidelberg (2014) 177–205.
[26] I. T. T. Kuyucu, K. Shimohara, Evolutionary optimization of pheromone-based stigmergic communication, in: Applications of Evolutionary Computation,Springer, 2012, pp. 63–72. doi:10.1007/978-3-642-29178-4-7.
[27] M. F. R. Calvo, J. R. de Oliveira, R. A. F. Romero, Bio-inspired coordinationof multiple robots systems and stigmergy mechanims to cooperative explorationand surveillance tasks, in: IEEE 5th International Conference on Cybernetics andIntelligent Systems (CIS), 2011, pp. 223–228. doi:10.1109/ICCIS.2011.6070332.
[28] G. Fortino, O. Zedadra, N. Jouandeau, H. Seridi, A decentralized ant colony for-aging model using only stigmergic communication, in: Proceedings of XV Work-shop Dagli Oggetti agli Agenti (WOA 2014), Vol. 1260, CEUR, 2014.
[29] C. Lenzen, T. Radeva, The power of pheromones in ant foraging, in: 1st Work-shop on Biological Distributed Algorithms (BDA), 2013.
[30] A. L. D. Liu, X. Zhou, H. Guan, A swarm intelligence based algorithm for dis-tribute search and collective cleanup, in: IEEE International Conference on Intel-ligent Computing and Intelligent Systems (ICIS), Vol. 2, IEEE, 2010, pp. 161–165. doi:10.1109/ICICISYS.2010.5658776.
31

[31] O. Feinerman, A. Korman, Z. Lotker, J. S. Sereni, Collaborative search on theplane without communication, in: Proceedings of the 2012 ACM symposium onPrinciples of distributed computing, ACM, 2012, pp. 77–86. doi:10.1145/2332432.2332444.
[32] S. K. Ghosh, R. Klein, Online algorithms for searching and exploration in theplane, Computer Science Review 4 (4) (2010) 189–201. doi:10.1016/j.cosrev.2010.05.001.
[33] N. Hoff, R. Wood, R. Nagpal, Distributed colony-level algorithm switching forrobot swarm foraging, in: Springer Distributed Autonomous Robotic Systems,2013, pp. 417–430.
[34] S. Nouyan, R. Groß, M. Bonani, F. Mondada, M. Dorigo, Teamwork in self-organized robot colonies, IEEE Transactions on Evolutionary Computation 13 (4)(2009) 695–711.
[35] R. C. Arkin, Behavior-based robotics, MIT press, 1998.
[36] T. Balch, M. Hybinette, Social potentials for scalable multi-robot formations,in: Proceedings IEEE International Conference on Robotics and Automation(ICRA), Vol. 1, 2000, pp. 73–80.
[37] J. Barraquand, B. Langlois, J.-C. Latombe, Numerical potential field techniquesfor robot path planning, IEEE Transactions on Systems, Man and Cybernetics22 (2) (1992) 224–241.
[38] Z. Meng, B. Zou, Y. Zeng, Considering direct interaction of artificial ant colonyforaging simulation and animation, Journal of Experimental & Theoretical Arti-ficial Intelligence 24 (1) (2012) 95–107.
[39] L. Panait, S. Luke, A pheromone-based utility model for collaborative forag-ing, in: Proceedings of the Third International Joint Conference on AutonomousAgents and Multiagent Systems-Volume 1, IEEE Computer Society, 2004, pp.36–43.
[40] H. Bersini, Uml for abm, Journal of Artificial Societies and Social Simulation15 (1) (2012) 9.
[41] U. Wilensky, Netlogo. http://ccl.northwestern.edu/netlogo/„ in: Center forConnected Learning and Computer-Based Modeling, Northwestern University,Evanston, IL, 1999.
32