a correlational study of the relationship between by casey
TRANSCRIPT

A Correlational Study of the Relationship Between Learner Autonomy and Academic Performance
By Casey Lowe
Master of Business Administration, May 1997, American University Bachelor of Arts, May 1990, University of Southern California
A Dissertation Submitted to
The Faculty of the Graduate School of Education and Human Development
The George Washington University In partial fulfillment of the requirements for the degree of Doctor of Education
January 31, 2009
Dissertation directed by
Michael J. Marquardt Professor of Human and Organizational Learning

ii
The Graduate School of Education and Human Development of The George
Washington University certifies that Casey Lowe has passed the Final
Examination for the degree of Doctor of Education as of December 5, 2008.
This is the final and approved form of the dissertation.
A Correlational Study of the Relationship Between Learner Autonomy and Academic Performance
Casey Lowe
Dissertation Research Committee:
Michael J. Marquardt, Professor of Human and Organizational Learning, Dissertation Director
Gary J. Confessore, Professor Emeritus of Higher Education Administration,
Committee Member
Maria Cseh, Associate Professor of Human and Organizational Learning, Committee Member

iii
Dedication
For Kristi, Anne, Dale, Kathy and Floyd

iv
Acknowledgments
First and foremost I give thanks to God for his patience, love and grace.
Thank you almighty father for helping me.
Next I’d like to give thanks to my wife Kristi who was by my side for the
whole journey. LYLM4E. I’d also like to recognize my Mom for her
unconditional love. You were always there for me and I’m so grateful for it. My
thanks also to Dad who guided me to college in the first place and who always
knew just what to say – in good times and bad. To Kathy – thanks for being my
friend and supporter. I’m blessed to have you in my life.
Additionally I’d like to thank Floyd and Mary Jane for inspiring me to
higher education; John and Sue for loving me like one of their own and Deke and
Celesta for making my childhood such an adventure.
A special thanks to my aunt Lois who has been everything to me: friend,
mom, mentor and all-around good influence. Thanks to my aunt Millie who has
always loved me and been there for me. Also to my aunt Janet whose courage
and determination have been an inspiration for me.
My friend Dino has been a source of strength for me and I appreciate it
very much. Likewise my lifelong friends Marc , Shawnie and Dawn have my
thanks and admiration. Finally, I offer thanks to my advisors: Mike , Gary and
Maria . Thank you for your patience and guidance as I made this journey.

v
Abstract
The study examined the relationship between Learner Autonomy as
measured by the Learner Autonomy Profile Short Form (LAP-SF) and Academic
Performance as measured by GPA. The research question that was investigated
was: What is the correlation between Learner Autonomy and academic
performance in adult learners, as measured by the constructs and components of
the Learner Autonomy Profile (LAP)? The correlation was measured for 125
participants from the George Washington University in Washington, D.C. and
analysis of the results found that there is a positive, significant relationship
between the LAP-SF and GPA for the total score, all four LAP-SF constructs and
nine of the 22 components. Of these elements, the Planning component had the
strongest correlation coefficient at .275 and was closely followed by the Self-
Regulation component with a coefficient of .270. The findings point to the
possibility that the LAP-SF may be useful as a proxy for GPA in some cases, and
as a diagnostic tool for improving academic performance.

vi
Table of Contents
Dedication.………………………………………………………………………iii
Acknowledgments.……………….……………………………...………………iv
Abstract………….………………………………………………...……….……..v
CHAPTER 1 - INTRODUCTION…………………………….………………….1
Overview………………………………………………...………………..1
Statement of the Problem…………………………..…….……………….3
Purpose and Research Questions………………..……….……….………3
Hypotheses and Research Question……………………...……………....4
Statement of Potential Significance………..……………...……..…….…8
Conceptual Framework……………………………………....…..………9
Summary of the Methodology…………………………....………..……11
Limitations and Delimitations………………………..…......…………..13
Definition of Key Terms…………………………..………..…………..14
CHAPTER 2 - LITERATURE REVIEW…………………………....…………20
Introduction…………………………………………………………….20
Learner Autonomy…………………………………………….……….22

vii
Adult Learners……………………………………………………22
Andragogy………………………………………………..22
Self-Directed Learning…………………….……………..23
The Learner Autonomy Profile (LAP)………………...…………26
Academic Performance………………………………………..…………27
Academic Performance…………………………………………..27
Meaning & Measurement………………………………..27
Summative vs. Formative……………………….……….28
Underachievement and Overachievement……………….28
Prediction of Performance………………………………………29
Problems with Prediction……………………………….29
Intellectual Predictors……………………….………….30
Personality Predictors………………………….……….31
Summary……………………………………………………...………..32
CHAPTER 3 - METHODS…………………………………….…….………...34
Overview of Methodology………………………………….………….34
Research Question and Hypotheses……………………………………34
Research Design………………………………………………..……...39

viii
Data analysis…………………………………………….…....………....43
Human Participants and Ethics Precautions……………………...……...45
CHAPTER FOUR: RESULTS…………………………………………….……47
Overview..…………………………………………………..…………..47
Instrumentation………………………………………………………….47
Hypotheses………………………………………………………..……..48
Response Rate……………………………………………...……………53
Descriptive Statistics…………………………………………………….53
Results of Hypotheses Testing…………………………………………..55
Summary of Results…………………………………………….………85
Chapter Summary………………………………………………………90
CHAPTER FIVE: SUMMARY AND CONCLUSION……………….……….91
Overview of the Study………………………………………………….91
Discussion of Findings………………………………………………….92
Limitations of the Study………………………………………….…….99
Implications for Theory and Practice…………………………………..100
Concluding Remarks……………………………………….………….103
REFERENCES………………………………………………...………………105
APPENDIX A – COVER LETTER………………………………….………..110
APPENDIX B – LEARNER AUTONOMY PROFILE QUESTIONS…….....111
APPENDIX C – IRB REVIEW AND APPROVAL……………………….…118

ix
List of Figures
Figure 1. Functional Learner Autonomy……………………………………….....2
Figure 2. Spear & Mocker’s Learning Types…………………………………....24
Figure 3. Long’s Self-Directed Learning Framework……………………….…..25
Figure 4 – IRB Approval………………………………………………………119
Figure 5 – Study Information Sheet……………………………………………120
Figure 6 – Sample Advertisement………………………………………...……122

x
List of Tables
Table 1: Response Summary……………………………………………...……..53
Table 2 – Gender…………………………………………………………………54
Table 3 – Age…………………………………………………………….………54
Table 4 – Domestic Status………………………………………………….……54
Table 5 – Education Completed…………………………………………….……55
Table 6 – GPA and Learner Desire Construct (Correlation)…………………….55
Table 7 – GPA and Learner Desire Construct (R2)…………………………..….56
Table 8 – GPA and Circumstance Component (Correlation)…………………....57
Table 9 – GPA and Circumstance Component (R2)……………………………..57
Table 10 – GPA and Expression Component (Correlation)……………………..58
Table 11 – GPA and Expression Component (R2)………………………………58
Table 12 – GPA and Group Identity Component (Correlation)…………………59
Table 13 – GPA and Group Identity Component (R2)……………………….….59
Table 14 – GPA and Growth & Balance Component (Correlation)………….….60
Table 15 – GPA and Growth & Balance Component (R2)………………….…..60
Table 16 – GPA and Love Issues Component (Correlation)…………………….61
Table 17 – GPA and Love Issues Component (R2)……………………………..61
Table 18 – GPA and Communication Skills Component (Correlation)…………62
Table 19 – GPA and Communication Skills Component (R2)…………………..63
Table 20 – GPA and Change Skills Component (Correlation)………………….63

xi
Table 21 – GPA and Change Skills Component (R2)……………………………64
Table 22 – GPA and Learner Initiative Construct (Correlation)…………...……64
Table 23 – GPA and Learner Initiative Construct (R2)……………………….…65
Table 24 – GPA and Goal-Directedness Component (Correlation)…………..…65
Table 25 – GPA and Goal-Directedness Component (R2)…………………..….66
Table 26 – GPA and Action Orientation Component (Correlation)………….…67
Table 27 – GPA and Action Orientation Component (R2)…………………...…67
Table 28 – GPA and Overcoming Obstacles Component (Correlation)…….….68
Table 29 – GPA and Overcoming Obstacles Component (R2)……………....…68
Table 30 – GPA and Active Approach Component (Correlation)…………..….69
Table 31 – GPA and Active Approach Component (R2)…………………...…..69
Table 32 – GPA and Self-Starting Component (Correlation)……………......…70
Table 33 – GPA and Self-Starting Component (R2)……………………….…...70
Table 34 – GPA and Learner Persistence Construct (Correlation)…………..…71
Table 35 – GPA and Learner Persistence Construct (R2)……………………...71
Table 36 – GPA and Volition Component (Correlation)…………………..…..72
Table 37 – GPA and Volition Component (R2)…………………………….....72
Table 38 – GPA and Self-Regulation Component (Correlation)……….….…..73
Table 39 – GPA and Self-Regulation Component (R2)…………………….…73
Table 40 – GPA and Goal-Maintenance Component (Correlation)……….…..74
Table 41 – GPA and Goal Maintenance Component (R2)……………………..74

xii
Table 42 – GPA and Learner Resourcefulness Construct (Correlation)……...….75
Table 43 – GPA and Learner Resourcefulness Construct (R2)…………………..76
Table 44 – GPA and Learning Priority Component (Correlation)………………76
Table 45 – GPA and Learning Priority Component (R2)………………………..77
Table 46 – GPA and Deferring Gratification Component (Correlation)………...78
Table 47 – GPA and Deferring Gratification Component (R2)………………….78
Table 48 – GPA and Resolving Conflict Component (Correlation)……………..79
Table 49 – GPA and Resolving Conflict Component (R2)……………………....79
Table 50 – GPA and Future Orientation Component (Correlation)…………..…80
Table 51 – GPA and Future Orientation Component (R2)……………………….80
Table 52 – GPA and Planning Component (Correlation)…………………….….81
Table 53 – GPA and Planning Component (R2)…………………………………81
Table 54 – GPA and Evaluating Alternatives Component (Correlation)………..82
Table 55 – GPA and Evaluating Alternatives Component (R2)……………...….82
Table 56 – GPA and Anticipating Consequences Component (Correlation)……83
Table 57 – GPA and Anticipating Consequences Component (R2)……………..83
Table 58 – GPA and Short Form Total Score (Correlation)………………….…84
Table 59 – GPA and Short Form Total Score (R2)………………………………85
Table 60 – Summary of Results………………………………………………….86
Table 61 – Summary of Findings…………………………………………..……97

CHAPTER 1 – INTRODUCTION
Overview
While standardized test scores and past academic performance have been
noted to be the best predictors of college performance (Shivpuri, Schmitt, Oswald,
Kim, 2006), there are still some significant problems associated with them. A
review of the performance literature by Mouw & Khanna (1993) found that these
measures have an R2 value less than .25 – leaving a great deal of unexplained
variance in collegiate academic performance.
This is important because of the huge investment that students and schools
make in the educational marketplace. Students seek education with an outcome in
mind and if the time and money they spend on their education is for naught then
they have wasted precious resources. Likewise, schools typically choose their
incoming classes based on predictors of academic performance (GPA, Class
Rank, SAT, etc.). How well they succeed in graduating students has a huge
impact on reputation, which in turn impacts grants, and funding for important
research.
With this in mind, this dissertation explored an area that has promise for
predicting academic performance: Learner Autonomy (LA). LA is described
(Confessore, G., 2000) as a continuum with dysfunctional learner dependence
residing at one extreme and dysfunctional learner independence at the other (see
1

2
Fig. 1, below). The middle of this continuum is described as functional learner
autonomy – a state in which optimal learning can occur because the learner is able
to perform independent study, but is also willing to seek help when necessary.
Figure 1. Functional Learner Autonomy.
Functional Learner
Autonomy |-------------------------(------------------------------------)-------------------------|
Dysfunctional Dysfunctional Learner Learner Dependence Independence
Two questions immediately come to mind: Can LA be measured? And if
so, how does it correlate with academic performance? The first question has been
answered through the development of an instrument called the Learner Autonomy
Profile (LAP). This fully validated tool (Confessore, 2000) allows researchers to
determine the placement of individual learners on a number of constructs and
components. The makeup of this instrument will be further discussed in the
methods section of this document.
The second question was the central focus of this dissertation. I
investigated the relationship between LA and academic performance in order to
help establish the meaning and significance of the LA construct while also
providing a potential benefit to the educational community.

3
Statement of the Problem
Academic researchers and college admissions boards often question the
value of standard measures such as high school GPA because of socio-economic
factors impacting the student, and potential disparity in the quality of education
received (Chaker, 2003; Ferber, Birnbaum and Green, 1983; DeBerard, Spielman
and Julka, 2004). Therefore other measures – with a potential for greater
predictive ability – can only help in selection and retention of students.
Research on Learner Autonomy has been largely confined to validation of
the construct, description of groups, or investigation of Asian student cohorts
(Carr, 1999; Ponton, 1999; and Derrick, 2001). A clear link between LA and
academic performance has not yet been explored which leaves a gap in the
literature of both LA and academic performance.
Purpose and Research Question
The purpose of this study was to investigate the relationship between
learner autonomy and academic performance. The central question of this study
was: What is the correlation between Learner Autonomy and academic
performance in adult learners, as measured by the constructs and components of
the Learner Autonomy Profile (LAP)?

4
Hypotheses:
Hypothesis 1: There is a significant correlation between the Learner Desire
construct score of the Learner Autonomy Profile-Short Form and academic
performance as measured by college GPA.
1a. There is a significant correlation between the Circumstance component
score of the Learner Autonomy Profile-Short Form and academic
performance as measured by college GPA.
1b. There is a significant correlation between the Expression component
score of the Learner Autonomy Profile-Short Form and academic
performance as measured by college GPA.
1c. There is a significant correlation between the Group Identity
component score of the Learner Autonomy Profile-Short Form and
academic performance as measured by college GPA.
1d. There is a significant correlation between the Growth and Balance
component score of the Learner Autonomy Profile-Short Form and
academic performance as measured by college GPA.
1e. There is a significant correlation between the Love Issues component
score of the Learner Autonomy Profile-Short Form and academic
performance as measured by college GPA.

5
1f. There is a significant correlation between the Communication Skills
component score of the Learner Autonomy Profile-Short Form and
academic performance as measured by college GPA.
1g. There is a significant correlation between the Change Skills component
score of the Learner Autonomy Profile-Short Form and academic
performance as measured by college GPA.
Hypothesis 2: There is a significant correlation between the Learner Initiative
construct score of the Learner Autonomy Profile-Short Form and academic
performance as measured by college GPA.
2a. There is a significant correlation between the Goal-Directedness
component score of the Learner Autonomy Profile-Short Form and
academic performance as measured by college GPA.
2b. There is a significant correlation between the Action-Orientation
component score of the Learner Autonomy Profile-Short Form and
academic performance as measured by college GPA.
2c. There is a significant correlation between the Overcoming Obstacles
component score of the Learner Autonomy Profile-Short Form and
academic performance as measured by college GPA.

6
2d. There is a significant correlation between the Active-Approach
component score of the Learner Autonomy Profile-Short Form and
academic performance as measured by college GPA.
2e. There is a significant correlation between the Self-Starting component
score of the Learner Autonomy Profile-Short Form and academic
performance as measured by college GPA.
Hypothesis 3: There is a significant correlation between the Learner Persistence
construct score of the Learner Autonomy Profile-Short Form and academic
performance as measure by college GPA.
3a. There is a significant correlation between the Volition component
score of the Learner Autonomy Profile-Short Form and academic
performance as measured by college GPA.
3b. There is a significant correlation between the Self-Regulation
component score of the Learner Autonomy Profile-Short Form and
academic performance as measured by college GPA.
3c. There is a significant correlation between the Goal-Maintenance
component score of the Learner Autonomy Profile-Short Form and
academic performance as measured by college GPA.

7
Hypothesis 4: There is a significant correlation between the Learner
Resourcefulness construct score of the Learner Autonomy Profile-Short Form and
academic performance as measured by college GPA.
4a. There is a significant correlation between the Learning Priority
component score of the Learner Autonomy Profile-Short Form and
academic performance as measured by college GPA.
4b. There is a significant correlation between the Deferring Gratification
component score of the Learner Autonomy Profile-Short Form and
academic performance as measured by college GPA.
4c. There is a significant correlation between the Resolving Conflict
component score of the Learner Autonomy Profile-Short Form and
academic performance as measured by college GPA.
4d. There is a significant correlation between the Future Orientation
component score of the Learner Autonomy Profile-Short Form and
academic performance as measured by college GPA.
4e. There is a significant correlation between the Planning component
score of the Learner Autonomy Profile-Short Form and academic
performance as measured by college GPA.

8
4f. There is a significant correlation between the Evaluating Alternatives
component score of the Learner Autonomy Profile-Short Form and
academic performance as measured by college GPA.
4g. There is a significant correlation between the Anticipating
Consequences component score of the Learner Autonomy Profile-Short
Form and academic performance as measured by college GPA.
Hypothesis 5: There is a significant correlation between the Total score of the
Learner Autonomy Profile-Short Form and academic performance as measured by
college GPA.
Statement of Potential Significance
This study made three major contributions. The first is to the literature on
Learner Autonomy, where a relationship between LA and academic performance
has not been fully explored. A second contribution was to the literature on
academic performance, where most of the focus is on the educational needs of
children. Here there is a dearth of research on adult learners – particularly in
terms of Learner Autonomy. Finally, this study provided a practical benefit in that
it may help allow students and schools to capitalize on their investment.
Current measures of educational potential (GPA, Class Rank, SAT, etc.)
have been shown to be valid predictors of college academic performance but

9
don’t necessarily point toward a student’s real potential (Mouw & Khanna, 1993).
Variables such as learning style, class size and emotional development can impact
these indicators in such a way as to not give a clear picture of what a student is
capable of (Rode et al., 2005).
Given the amount of unexplained variance in collegiate academic
performance (Mouw & Khanna, 1993), standardized test scores and past academic
performance may not be the best predictors of college achievement. With the
huge investment that students and schools make in the educational marketplace, it
is imperative that factors be explored that may help. The value of this effort is that
the time and money students spend on their education won’t be for naught and
schools will see better graduation rates – positively impacting their reputation,
grants and funding for important research.
Conceptual Framework
In order to fully investigate the role of learner autonomy in academic
performance, it was necessary to look at two constructs: learner autonomy and
academic performance. The first construct is grounded in the early work of Houle
(1961), Knowles (1980), Spear and Mocker (1984) along with more contemporary
research by Confessore (1992), Ponton (1999), Carr, (1999), Meyer (2001) and
Derrick (2001). The second builds on Lavin (1965) and Mouw & Khanna
(1993) as well as more contemporary research on achievement and

10
assessment (Tross et al, 2000; Deberard et al, 2004; Grove, Wasserman &
Grodner, 2006)
Constructs & Variables
Learner Autonomy
Learner autonomy is the relative capacity to participate in learning
experiences (Confessore & Confessore, 1999). It is a continuum that has
functional learner autonomy at its center with extremes of dysfunctional learner
autonomy at its ends. The dysfunctional states are labeled dependent and
independent with an assumption that too much of either quality takes a learner
away from the optimal state known as functional learner autonomy.
The variables associated with learner autonomy are: desire,
resourcefulness, initiative, and persistence. Desire to learn describes the
individual’s motivation to participate in a learning experience, while
resourcefulness means the learner’s intention to be resourceful. Initiative
describes the person’s willingness to initiate learning and persistence describes
the person’s intention to continue learning activities (see Ponton, 1999; Carr,
1999; Meyer , 2001 and Derrick, 2001 for research focused on these specific
components of LA)
Academic performance
The second construct that served as a foundation for the theoretical
framework was the idea of academic performance. Academic performance has
11
been a central issue in education for as long as it has existed. While there is a
dearth of literature in this area, the dialogue tends to be centered along three
major themes: Meaning & Measurement, Summative vs. Formative measurement,
Underachievement and Overachievement, and predictors of performance. This
section seeks to review the issues centered on these themes.
Relationship between the Constructs
The range of possible conditions inherent in LA creates a non-linear
relationship with academic performance. That is to say, when learner autonomy is
low, so too will achievement be low. Likewise, when autonomy is high,
achievement will again be low. Only at the center – the condition known as
functional learner autonomy – is academic performance high.
Many factors influence the potential relationship between the constructs.
For example, Wood & Atkins (2000) suggested that strategy plays a mediating
role between self-efficacy (a key component of LA) and performance on complex
tasks. Likewise Rode et al. (2005) explored the relationship between life
satisfaction and student performance while Braunstein, McGrath and Pescatrice
(2000) investigated the impact of financial factors on persistence (another key
component of LA).
Summary of the Methodology
This study used an empirical approach to investigate the relationship
between Learner Autonomy and academic performance in adult learners enrolled

12
at a university in the Washington, D.C. metropolitan area. The level of LA was
determined by using the Learner Autonomy Profile (LAP) constructs and
components, while academic performance was determined by cumulative GPA.
Research Design
In this correlational study, participants’ scores received on the LAP
constructs and components were treated as dependent variables and their
cumulative GPAs were treated as independent variables.
Population and Sampling
The population of interest for this study was adult learners attending a
formal educational institution such as a college or university. The sample
consisted of adult learners enrolled at a university in the Washington, D.C.
metropolitan area.
Data Collection Procedures
The Learner Autonomy Profile was administered online to study
participants. Once potential participants had been recruited, a letter was sent to
them with instructions and an informed consent form. When participants signed
and returned the IRB required consent form, an ID# and password was assigned to
them so that they could access the online instrument. When participants accessed
the instrument, demographic data, including cumulative GPA was collected to
inform the study.

13
Instrumentation
Data for this study was gathered via the LAP instrument. The LAP has 22
components that are centered around four constructs: desire, resourcefulness,
initiative, and persistence. Desire describes the individual’s motivation to
participate in a learning experience, while resourcefulness means the learner’s
intention to be resourceful. Initiative describes the person’s willingness to initiate
learning and persistence describes the person’s intention to continue learning
activities. Taken together, these four constructs provide an accurate assessment of
an individual’s relative capacity to undertake a self-directed learning experience.
Data Analysis
When LAP scores were collected for the study participants an analysis
was conducted on the data to determine the correlation between LA and academic
performance.
Limitations and Delimitations
While this study has important implications for adult learning, academic
performance and learner autonomy, it is important to recognize the limitations
related to the effort. This study was limited by a number of constraints including
the following:

14
1) The sample consisted of students enrolled at a single university in
the Mid-Atlantic region of the United States. Therefore, the results may not be
generalizable to all college students throughout the country.
2) The university used for this study was a private institution so the
findings may not be the same as those that would be found at a public or state
university.
3) Though the instrument sought to minimize it, it is possible that the
nature of a survey-based study may introduce issues such as question ambiguity,
personal bias and lack of knowledge by the respondent.
4) Because this was not a longitudinal study, the overall stability of
the study may be subject to question.
Definition of Terms
Academic performance – Collegiate academic performance as measured by
objective standards such as G.P.A., Class Rank, etc.
Action Orientation – The behavior of a learner quickly translating a learning goal
into a learning activity (Ponton, 1999).
Active-Approach – Refers to the behavior of a learner taking the responsibility to
develop solutions that overcome the aforementioned obstacles (Ponton, 1999).
Adult – An Individual who has reached the age of 18 or older.

15
Anticipating Consequences – The process of looking forward and considering the
potential consequences of an intended course of action as they may affect possible
learning results (Carr, 1999).
Autonomy – The relative capacity to independently participate in experiences.
Change Skills – Refers to the capacity to consciously select correct responses to
situations that arise (Meyer, 2001).
Circumstance – An acquired skill learned from one’s family forming an
individual’s perception of fairness, orderliness, honesty, justice and their place in
the world (Meyer, 2001).
Communication Skills – Refers to the ability to create an environment where a
genuine sharing of ideas and feelings can exist (Meyer, 2001).
Deferred Gratification – The extent to which a person delays the immediate
gratification of engaging in a more pleasurable non-learning activity in favor of a
learning alternative.
Desire – A behavioral construct formed by three major factors: Basic Freedom,
Managing Power and Acquired Skill. For purposes of learner autonomy research,
it consists of seven components: circumstances, issues of expression, group
identity, growth and balance, love issues, basic communication skills and basic
change skills (Meyer, 2001).

16
Discipline – The ability to choose the best course of action without external
motivation.
Dysfunctional Learner Dependence – A state in which there is a lack of balance
between the relative control of the learner and others. Characterized by an
inability or unwillingness to embark on learning without substantial direction.
(Cofessore, G.J., 2000, p.3).
Dysfunctional Learner Independence – A state in which there is a lack of balance
in the relative control of the student and others. Characterized by an unwillingness
to let others participate in the student’s learning process. (Confessore, G.J., 2000,
p.3).
Evaluating Alternatives – The process of assessing the advantages of optional
plans to determine the mode of action in regards to the learning endeavor (Carr,
1999).
Expression – An individual’s ability to defend oneself, to investigate and seek
information, to express oneself, to do as one wishes and to speak freely (Meyer,
2001).
Functional Learner Autonomy – A state in which there is balance between control
by the student and control by others within a learning context. (Confessore, G.J.
2000, p.2).

17
Future Orientation – The extent to which an individual looks to future gains and
rewards of learning undertaken in the present (Carr, 1999).
Goal-Directedness – The behavior of establishing goals that serve as motivators
and targets for accomplishment (Ponton, 1999).
Goal Maintenance – The behavior of establishing goals that serve as motivation
for action (Confessore, G.J., 2000).
Group Identity – Refers to the extent to which one perceives the family to respect
and encourage the development of talents/abilities (Meyer, 2001).
Growth and Balance – Refers to the ability to bring order to one’s life, to have
strength of character through adversity and to exercise good judgment to
consciously choose the direction of one’s life (Meyer, 2001).
Initiative – A behavioral syndrome comprised of the following components: goal-
directedness, action-orientation, persistence in overcoming obstacles, active
approach to problem solving and self-startedness (Ponton, 1999).
Learner Autonomy – “The relative capacity to productively participate in learning
experiences. This capacity consists of a range of functional learner autonomy that
is bounded by two relatively dysfunctional learner states, which are dysfunctional
learner dependence and dysfunctional learner independence” (Confessore, G.J.,
2000, p.2).

18
Learning Priority – The degree to which an individual makes choices in favor of
learning when in conflict with other activities (Carr, 1999).
Love Issues – Refers to the level of consciousness that allows one to experience
serenity and power simultaneously (Meyer, 2001).
Overcoming Obstacles – The behavior of a learner’s continual engagement in a
learning activity despite the presence of impediments (Ponton, 1999).
Persistence – The behavior of continuing action in spite of the presence of
obstacles or competing goals (Derrick, 2001).
Planning – Behavioral intentions that lead to prior arrangements that will factor
into the achievement of a specific learning endeavor (Carr, 1999).
Resolving Conflict – The extent to which an individual makes choices in favor of
learning activities when in conflict with other activities (Carr, 1999).
Resourcefulness – The behavioral syndrome of self-control skills requisite for
autonomous learning. These include: prioritizing learning over other things,
making choices in favor of learning when in conflict with other activities, looking
to the future benefits of the learning undertaken now, and solving problems
(planning, evaluating alternatives, and anticipating consequences)(Carr, 1999).
Self-Regulation – Processes that exercise control over thinking, affect, and
behavior as knowledge and skills are acquired (Derrick, 2001).

19
Self-Startedness – Refers to the behavior of a learner motivating his or herself to
begin, either initially or after a period of inactivity, a learning activity (Ponton,
1999).
Volition – The maintenance of intentional focus (the will of the individual to
learn) and effort toward goals despite distractions (Derrick, 2001).
Outline of Dissertation
Chapter two reviews the literature relevant to this study. It focuses on the
areas of adult learning, learner autonomy, academic performance and the issues
associated with each. Particular focus is placed on the history of adult learning
and how this development shapes our concept today. In addition, issues related to
autonomous learning are explored such as the conditions that increase or decrease
it. Finally, the area of academic performance is reviewed with attention placed on
the factors impacting it – and the difficulty in measuring it.
Chapter three describes the research methodology as it applies to the
research questions. It includes the sample, measurement techniques and statistical
methods used to explore the meaning of the data. Chapter four will present the
study findings while Chapter Five will discuss the meaning of these findings in
the context of the conceptual framework and literature review.

20
CHAPTER 2 - LITERATURE REVIEW
Introduction
This review focuses on the literature that serves as the roots for the
constructs upon which this research was founded. The first section reviews the
construct of learner autonomy from its historical beginnings in the literature
relating to adult learing - Houle (1961); Knowles (1968, 1980) - to research on
self-directed learning - Bandura (1977); Spear & Mocker (1981); Tough (1981) –
to the latest research in this area.- Long (1992); Confessore (1991, 2000).
Section two reviews the literature related to academic performance and
includes definitions and factors that contribute to the relative success of adult
learners in academics. It follows the major lines of though in this area: meaning
and measurement (Lavin, 1965), summative vs. formative measurement (Knight,
2002), underachievement and overachievement (Emerick, 1992; Peterson &
Colangelo, 1996; Whitmore, 1980), and predictors of performance (Willingham,
1985).
The literature review was conducted using numerous tools. Initially, a
computer-aided search was conducted using the Washington Regional Library
Consortium’s (WRLC) Alladin database. General keywords were used such as
“Adult Learning”, “Learner Autonomy” and “Academic performance”. However
this yielded only about 35 good sources (Full text from peer-reviewed
publications). Next a more specific search was conducted in the same database
21
using keywords such as “Andragogy”, “Self-Reliance” and “Summative
Assessment”. These yielded an additional 20 sources. Individual databases in the
Alladin tool included: ABI/Inform, Dissertation Abstracts, Educational Resource
Information Center (ERIC) and JSTOR.
Next, references within these sources were reviewed for foundational
research that might lead to a better understanding of the topics and issues
associated with the study conceptual framework. This created an additional 15
sources including both books and articles. The library catalog for the WRLC was
then used to determine the availability of the books. Those that were readily
available were borrowed and read, while those that were not available were
purchased where practicable.
Among the journals and publications used for this study were: Academy of
Management Journal, The Academy of Management Review, The Academy of
Management Executive, The Academy of Management Learning and Education,
College Student Journal, Journal of Economic Education, Administrative Science
Quarterly, Journal of Organizational Behavior, Journal of Workplace Learning,
Human Resource Development Quarterly, Human Resource Management Review,
Guideposts to self-directed learning Human Resource Management, Public
Administration Quarterly, Studies in Higher Education, Training and
Development, and Leadership & Organization Development Journal.

22
Learner Autonomy
Adult Learners
While researchers have been addressing the issue of adult learning since
the early 1920’s, according to Merriam (2001, p. 3), “…we have no single
answer, no one theory or model of adult learning that explains all that we know
about adult learners…”). However, she does identify two streams of thought that
are most representative of adult learning theory: Andragogy and Self-Directed
Learning (SDL).
Andragogy
The concept of Andragogy is rooted in the work of Houle (1961), who
identified the reasons why adult’s seem to pursue learning. Some, he argued, saw
learning as a means to an end, while others participated in learning because of an
enjoyment of the activity and interaction. Finally, some chose to learn because of
an innate desire to learn for the sake of learning. While this was an important
acknowledgement and discussion of the educational needs of different types of
adult learners, no distinction was placed between adult and younger learners.
Knowles’ (1968, 1980) made the proposition that the educational needs of
adults (andragogy) are different than those of children (pedagogy). Knowles
(1980, p. 43-44) distinguished adult learners from younger ones through four
crucial assumptions: That adult learners are more oriented toward self-directed
learning experiences; that they have a large pool of experiences to draw from; that

23
adults learn in order to fill a need they identify; and that adult learners seek
learning to fill more immediate educational needs. Knowles concept of
andragogy, however, is criticized by Merriam (2001, p. 5) as being more a set of
assumptions than an actual theory of adult learning. Moreover, she points out that
these assumptions are not necessarily descriptive of adults only. Many children
can be self-directed learners, while many adults require heavy direction from
instructors.
Self-Directed Learning
The most immediate predecessors to the construct of learner autonomy are
found in the self-directed learning literature. Bandura’s (1977) research on self-
efficacy, Tough’s (1981) focus on learning without the aid of an instructor, Spear
& Mocker’s (1981) research on environmental factors of self-directed learning,
and Long’s (1992) championing of the need for the study of self-directed
learning. Each of these supporting theories are reviewed here to provide a context
for the development of learner autonomy as a construct.
Bandura (1977, p. 194) defined self-efficacy as a person’s own estimate of
how competent he or she feels in particular environment. As a result of this
confidence in their abilities, the level of reinforcement can either be direct
external, self-administered, or vicarious in nature. The importance of this
perspective is that the learner and environment are both accounted for and their
interaction with one another is acknowledged in creating the learning experience.

24
Tough (1981) went a step further to try to find the extent to which adults
participate in self-directed learning activities. In his research, he studied 66
Canadian adults to determine their self-directed learning process and found that
this kind of learning is widespread, is part of everyday life, and is systematic
(linear) despite the absence of an instructor.
Spear & Mocker (1981, p. 5) identified four learning types: formal,
nonformal, informal, and self-directed. Each is distinguished from the other in
terms of the learner’s control over the subject matter and the process (See Figure
2, below).
Figure 2. Spear & Mocker’s Learning Types.
In formal learning, the learner controls neither the subject matter nor the
process, while in nonformal environments, the learner controls the subject matter
Process
Subject Matter
H L
H
Non-Formal
Formal
Self -Directed
Informal

25
but not the process. Informal learning gives the learner control over the process
but not the subject, while in self-directed learning, the person controls both the
subject matter and process.
Long (1992) proposed that the study of self-directed learning could best be
understood by using a theoretical framework that accounted for pedagogical and
psychological control (see figure 3, below). Psychological control refers to the
way in which an individual assumes control for learning. Pedagogical control
refers to who determines the content, scope and direction of the learning
experience.
Figure 3. Long’s Self-Directed Learning Framework.
PSYCH CONTROL (HIGH) QUAD 1 QUAD 2 (Highest SDL) ANDRAGOGY PEDAGOGY QUAD 3 QUAD 4 (Lowest SDL)
(LOW)

26
Where psychological control is high and pedagogical control is low, the highest
self-directed learning is achieved. Likewise, when the amount of psychological
control is low and the pedagogical control is also high, the self-directedness of the
learning experience is low.
The Learner Autonomy Profile (LAP)
Confessore (1991) first introduced the concept of learner autonomy in a
selection process to choose gifted high school students to participate in an early
college summer arts program. In order to make the selections, he used four
criteria: Desire, Resourcefulness, Initiative, and Persistence. Desire describes the
individual’s motivation to participate in a learning experience, while
resourcefulness means the learner’s intention to be resourceful. Initiative
describes the person’s willingness to initiate learning and persistence describes
the person’s intention to continue learning activities.
These four criteria later became the four components of a learner
autonomy construct that could be measured with the use of an instrument
Confessore developed called the Learning Profile Questionnaire (LPQ).
Confessore & Confessore (1994) then conducted a series of research studies
aimed at solidifying the connection between learner autonomy and the four
components.
This was followed by development of separate instruments to test each
component (Carr, 1999; Ponton, 1999; Derrick, 2001 and Meyer (2001). When

27
combined, these separate instruments form a Learner Autonomy Profile (LAP)
that seeks to understand a learner’s behavioral intentions rather than simply their
observed actions.
Academic performance
Academic Performance
Academic performance has been a central issue in education throughout
recorded history (Plato, Apology, 399 B.C.). While it is daunting to try to make
sense of all the literature in this area, the dialogue tends to be centered along four
major themes: (1) meaning and measurement, (2) summative vs. formative
measurement, (3) underachievement and overachievement, and (4) predictors of
performance. This section seeks to review the issues centered on these themes.
Meaning & Measurement
Lavin (1965, p. 18) provides a useful definition of the term academic
performance: “As traditionally used, the term ‘academic performance’ refers to
some method of expressing a student’s scholastic standing. Usually this is a grade
for a course, an average for a group of courses in a subject area, or an average for
all courses expressed on a 0-to-100 or other quantitative scale.”
How performance is measured is one of the most important and volatile
discussions in academics. While “academic ability is the most important
explanatory variable in studies of student learning, researchers control for it with
a wide array and combination of proxies.” (Grove, Wasserman and Grodner,

28
2006). These proxies include: GPA, class rank, SAT, ACT and literally hundreds
of other standard measures that purport to demonstrate ability. The most popular
of these is GPA and SAT scores. While these proxies help to point toward who
will perform academically, they still only account for a small fraction of the
variability (Tross et al., 2000) in academic performance.
Summative vs. Formative Assessment
Knight (2002) tackled the issue of whether assessments should be
summative vs. formative. His article defined summative assessment as “When
assessment certifies or warrants achievement it has a feedout function, in that the
grades and classifications can then be treated as a performance indicator for the
student, department, institution, employer, funding body, quality agency or
compilers of league tables. So important are those feedout functions that such
assessment is often called high stakes or summative assessment, and greater
emphasis is consequently put on making it robust.”
Underachievement and Overachievement
While academic underachievement is a frequent topic in education, there
is no uniform definition or standard for it. Most researchers agree, though, that
academic underachievement is a disparity between potential and actual
performance (Emerick, 1992; Peterson & Colangelo, 1996; Whitmore, 1980).
Lavin (1965, p. 28) described a framework for discussing the relatively subjective
terms of underachievement and overachievement (see Chart 1, below).

29
Ability
Chart 1: Types of Scholastic Performance at Different Ability Levels
High
Low Ability
Low �-----------------------------------------------------� High
Performance
Other factors that may influence achievement include life satisfaction
(Rode et al, 2005), socioeconomic status (Braunstein, McGrath and Pescatrice,
2000), Intelligence (Wedemyer, 1953; Argyris, 1991) and Personality (Tross, et
al, 200; DeBerard et al., 2004).
Prediction of Performance
Problems with Prediction
While standardized test scores and past academic performance have been
noted to be the best predictors of college achievement (Shivpuri, et. al., 2006),
there are some significant problems associated with them. A review of the
achievement literature by Mouw & Khanna (1993) found that these measures
have an R2 value less than .25 – leaving a great deal of unexplained variance in
collegiate academic performance.
Pronounced Underachievement
Underachievement Performance
Equal to Capacity
Underachievement Performance Equal to
Capacity Overachievement
Performance Equal to Capacity
Overachievement Pronounced
Overachievement

30
Willingham (1985, p. 179) had this to say about trying to predict academic
performance: “The two traditional academic predictors, high school rank (HSR)
and admissions test score (SAT), were by far the best at forecasting the scholastic
types of achievement. In a comparison of the two, HSR was a somewhat better
predictor of college honors (based on cumulative grade average), while the SAT
was a somewhat better predictor of departmental honors. The latter were based on
independent scholarship, arguably more characteristic of preprofessional work in
the discipline than is grade point average.”
Intellectual Predictors
While intelligence is strongly correlated with academic performance, it is
often the case that potential does not translate to success. Indeed, up to 30% of
gifted students are at risk for failure, while nearly half are not working to their full
potential.
Though discussion over the nature of human intelligence has been going
on since Plato and Aristotle, the systematic research of intelligence began in the
mid-19th century with the pioneering work of Sir Francis Galton. In his book
Hereditary Genius (1869) he observed that traits we would attribute with “smart”
people appeared to be passed from generation to generation. Galton founded what
has come to be called the London School (focused on determining the “why” of
intelligence) and is contrasted with the French School, founded by Alfred Binet,
which was focused on the “what” of intelligence.

31
Binet is famous for developing his groundbreaking test of intelligence and
for the observation that individuals who perform well on certain tests of cognitive
ability generally tend to excel on others as well. This led some to posit that there
was a general factor of intelligence (g) that lay behind these abilities (Spearman,
1904). General cognitive ability is seen as the best predictor of future success in
academic and professional endeavors (Jensen, 1998; Gustafson, 1999; and
Plomin, 1999).
An interesting topic in the study of cognition is the concept of Boolean or
K-Complexity in which the ability to attack complex problems is tied to the
process by which the individual’s brain operates (Chater, 2000). Proponents of
this theory suggest that higher K (for Kolmorov) complexity results in the
recruitment of different methods for processing information. For example, a
decision-making exercise may require one to way three or four elements before
deciding. This becomes a simple Boolean statement of A+B+C+D vs. some
variation on that theme such as A+B+C, but not D.
Personality Predictors
Recently, more focus has begun to be placed on the role of personality in
predicting academic performance. Tross et al (2000) focused on three personality
factors: Achievement, Conscientiousness and resiliency. Achievement was
defined as “The Tendency to strive for competence in one’s work, to improve on
one’s past performance, to succeed.” Conscientiousness was seen as “The

32
tendency to carry out tasks in a careful manner until their completion.” Finally,
resiliency was defined as “The tendency to demonstrate commitment to a course
of action when challenged, remain calm and emotionally stable.” It is interesting
to note how much these definitions are in line with the terminology used in the
Learner Autonomy literature (Confessore, 1991) to show the intentions of
learners. Tross et al found that of these, conscientiousness was the most closely
correlated with performance (pp 329).
Purkey (1970, p. 14) notes: “For generations, wise teachers have sensed
the significant and positive relationship between a student’s concept of himself
and his performance in school. They believed that the students who feel good
about themselves and their abilities are the ones who are most likely to succeed.”
Summary
While the concept of learner autonomy may be a relatively new addition to
the canon of adult learning theory, it is founded upon a solid foundation of theory:
Houle (1961); Knowles (1968, 1980), Bandura (1977); Spear & Mocker (1981);
Tough (1981) and Long (1992). LA represents an important factor to consider
when conducting research in adult learning – and potentially in predicting
academic performance.
The academic performance literature currently follows four major lines of
thought: meaning and measurement (Lavin, 1965), summative vs. formative

33
measurement (Knight, 2002), underachievement and overachievement (Emerick,
1992; Peterson & Colangelo, 1996; Whitmore, 1980), and predictors of
performance (Willingham, 1985). While the research in this are has traditionally
focused on measurement (GPA, SAT, etc.) it is increasingly moving toward
inclusion of socio-economic and personality factors. This has been driven mostly
by the failure of traditional methods to provide an explanation for the variance
found in predictive models (Tross et al, 2000).
Chapter 3 will present the research design, data collection and data
analysis utilized in this study.

34
CHAPTER 3 – METHODS
Overview of Methodology
This study used an empirical approach to investigate the relationship
between Learner Autonomy and academic performance in adult learners enrolled
at a university in the Washington, D.C. metropolitan area. The level of LA was
determined by using the Learner Autonomy Profile (LAP), while academic
performance was determined by cumulative GPA.
Creswell (2003) described the recent development and strategies involved
with the quantitative approach to research: “During the late 19th century and
throughout the 20th, strategies of inquiry associated with quantitative research
were those that invoked the postpositivist perspectives. These include the true
experiments and the less rigorous experiments called quasi-experimental and
correlational studies…more recently, quantitative strategies involved complex
experiments with many variables and treatments (e.g. factorial designs and
repeated measure designs). They also included elaborate structural equation
models that incorporated causal paths and the identification of the collective
strength of multiple variables.”
Research Question and Hypotheses
According to Creswell (2003), in good quantitative research questions and
hypotheses, “the use of variables…is typically limited to three basic approaches:
the researcher may compare groups on an independent variable to see its impact

35
on a dependent variable. Alternatively, the investigator may relate one or more
independent variables to a dependent variable. Third, the researcher may describe
responses to the independent, mediating, or dependent variables.”
The central question of this study was: What is the correlation between
Learner Autonomy and academic performance in adult learners, as measured by
the main and subscales of the Learner Autonomy Profile (LAP)?
Hypotheses:
Hypothesis 1: There is a significant correlation between the Learner Desire
construct score of the Learner Autonomy Profile-Short Form and academic
performance as measured by college GPA.
1a. There is a significant correlation between the Circumstance component
score of the Learner Autonomy Profile-Short Form and academic
performance as measured by college GPA.
1b. There is a significant correlation between the Expression component
score of the Learner Autonomy Profile-Short Form and academic
performance as measured by college GPA.
1c. There is a significant correlation between the Group Identity
component score of the Learner Autonomy Profile-Short Form and
academic performance as measured by college GPA.

36
1d. There is a significant correlation between the Growth and Balance
component score of the Learner Autonomy Profile-Short Form and
academic performance as measured by college GPA.
1e. There is a significant correlation between the Love Issues component
score of the Learner Autonomy Profile-Short Form and academic
performance as measured by college GPA.
1f. There is a significant correlation between the Communication Skills
component score of the Learner Autonomy Profile-Short Form and
academic performance as measured by college GPA.
1g. There is a significant correlation between the Change Skills component
score of the Learner Autonomy Profile-Short Form and academic
performance as measured by college GPA.
Hypothesis 2: There is a significant correlation between the Learner Initiative
construct score of the Learner Autonomy Profile-Short Form and academic
performance as measured by college GPA.
2a. There is a significant correlation between the Goal-Directedness
component score of the Learner Autonomy Profile-Short Form and
academic performance as measured by college GPA.

37
2b. There is a significant correlation between the Action-Orientation
component score of the Learner Autonomy Profile-Short Form and
academic performance as measured by college GPA.
2c. There is a significant correlation between the Overcoming Obstacles
component score of the Learner Autonomy Profile-Short Form and
academic performance as measured by college GPA.
2d. There is a significant correlation between the Active-Approach
component score of the Learner Autonomy Profile-Short Form and
academic performance as measured by college GPA.
2e. There is a significant correlation between the Self-Starting component
score of the Learner Autonomy Profile-Short Form and academic
performance as measured by college GPA.
Hypothesis 3: There is a significant correlation between the Learner Persistence
construct score of the Learner Autonomy Profile-Short Form and academic
performance as measure by college GPA.
3a. There is a significant correlation between the Volition component
score of the Learner Autonomy Profile-Short Form and academic
performance as measured by college GPA.

38
3b. There is a significant correlation between the Self-Regulation
component score of the Learner Autonomy Profile-Short Form and
academic performance as measured by college GPA.
3c. There is a significant correlation between the Goal-Maintenance
component score of the Learner Autonomy Profile-Short Form and
academic performance as measured by college GPA.
Hypothesis 4: There is a significant correlation between the Learner
Resourcefulness construct score of the Learner Autonomy Profile-Short Form and
academic performance as measured by college GPA.
4a. There is a significant correlation between the Learning Priority
component score of the Learner Autonomy Profile-Short Form and
academic performance as measured by college GPA.
4b. There is a significant correlation between the Deferring Gratification
component score of the Learner Autonomy Profile-Short Form and
academic performance as measured by college GPA.
4c. There is a significant correlation between the Resolving Conflict
component score of the Learner Autonomy Profile-Short Form and
academic performance as measured by college GPA.

39
4d. There is a significant correlation between the Future Orientation
component score of the Learner Autonomy Profile-Short Form and
academic performance as measured by college GPA.
4e. There is a significant correlation between the Planning component
score of the Learner Autonomy Profile-Short Form and academic
performance as measured by college GPA.
4f. There is a significant correlation between the Evaluating Alternatives
component score of the Learner Autonomy Profile-Short Form and
academic performance as measured by college GPA.
4g. There is a significant correlation between the Anticipating
Consequences component score of the Learner Autonomy Profile-Short
Form and academic performance as measured by college GPA.
Hypothesis 5: There is a significant correlation between the Total score of the
Learner Autonomy Profile-Short Form and academic performance as measured by
college GPA
Research Design
In this correlational study, participants’ scores received on the LAP main
and subscales were treated as dependent variables and their cumulative GPAs
were treated as independent variables.

40
Population and Sampling
According to Creswell (2003), the population and sample portion of a
quantitative research study should address the following components:
• Identify the population in the study
• Identify whether the sampling design for this population is single
or multi-stage (called clustering)
• Identify the selection process for individuals
• Identify whether the study will involve stratification of the
population before selecting the sample
• Discuss the procedure for selecting the sample from available lists
• Indicate the number of people in the sample and the procedure
used to compute this number
Population
The population of interest for this study was adult learners attending a
formal educational institution such as a college or university. It consisted of 125
adult learners enrolled at a university in the Washington, D.C. metropolitan area.
Sample Frame
Alreck and Settle (2004) define sampling as “the number and/or
identification of respondents in the population who will be or have been included
in the survey”. This section will describe how the sample frame will be identified
and addressed.

41
Data Collection Procedures
The Learner Autonomy Profile was administered online to study
participants. Once potential participants were recruited, a letter was sent to them
with instructions and an informed consent form. When participants signed and
returned the IRB required consent form, an ID# and password were assigned to
them so that they could access the online instrument. When participants accessed
the instrument, demographic data, including cumulative GPA was collected to
inform the study.
Instrumentation
With regard to selecting and describing instrumentation, Creswell (2003)
recommends that the researcher consider the following:
• Name the survey instrument used to collect data in the research
study
• To use an existing instrument, describe the established validity and
reliability of scores obtained from past use of the instrument
• Include sample items from the instrument so that readers can see
the actual items used
• Indicate the major content sections in the instrument, such as the
cover letter…the items (e.g. demographics, attitudinal items,
behavioral items, factual items), and the closing instructions

42
• Discuss plans for pilot testing or field testing the survey and
provide a rationale for these plans
• For a mailed survey, identify steps for administering the survey
and for following up to ensure a high response rate
Data for this study was primarily be gathered via the LAP instrument. The
LAP has 22 components that are centered around four constructs: desire,
resourcefulness, initiative, and persistence. Desire to learn describes the
individual’s motivation to participate in a learning experience, while
resourcefulness means the learner’s intention to be resourceful.
Initiative describes the person’s willingness to initiate learning and
persistence describes the person’s intention to continue learning activities. Taken
together, these four scales provide an accurate assessment of an individual’s
relative capacity to undertake a self-directed learning experience.
Reliability & Validity
Reliability and validity of the four scales of the LAP instrument have been
determined through principal component analysis, Pearson’s Correlations, and
calculation of Cronbach’s Alphas through a test-retest design. The first construct,
desire, had an alpha of .9376 with the second, resourcefulness, having an alpha of
.9644. The third construct, initiative, had an alpha of .9593, and the final
construct, persistence, had an alpha of .9677.

43
Data Analysis
When LAP scores and GPAs had been collected for the study participants,
the data was prepared and an analysis was conducted to determine the correlation
between LA and AA. This section will first describe the preliminary data handling
in terms of data editing, data entry, and finally data transformations. I will then
detail the analysis of the data that was collected.
Preliminary Data Handling
Data Edits
Data editing was fairly easy, as I was using an online instrument to gather
data from participants. The Learner Autonomy Profile (LAP) could be accessed
when participants provide their study ID number and password that was assigned
by me. However, data still needed to be reviewed to ensure that all fields had been
entered with valid responses, and that the participant had answered all items on
the short form version of the LAP.
Data Entry Procedures
Data entry was accomplished using the data and variable views of the
SPSS statistics package (Ver. 11.5). The variables were set up first with the study
ID number being a string variable and the participants LAP score and GPA being
numeric variables. Once the variables have been set up, I switched to the data
view and entered data for the 66 items of the short form LAP.
Data Transformations

44
Some items in the LAP require a positive response, while others require a
negative response. With this in mind, and using the data transformation function
in the SPSS statistical package, I “flipped” the responses so that all of them were
“in the same direction”.
Data Analysis
Alreck and Settle (2004) define data analysis as “the manipulation of
numbers, letters, or symbols in order to suppress the detail and reveal the relevant
facts or relationships”. In order to make sense of the data, I used a correlational
study to determine the relationship between learner autonomy and academic
performance in the population that I studied. The purpose of using this type of
data analysis was in part due to the nature of my research question, but also
because of the manner in which data were collected. My research question
specifically stated: “Is learner autonomy correlated with academic performance”
which calls for a correlational approach. Also, the data was collected using an
instrument that provided a numeric indicator of the level of autonomy in a learner.
As such, when analyzed with academic performance, it begs for a correlational
view of the relationship between them.
Correlation Analysis
The test that was conducted on the data was a simple correlational
comparison of the LA and AA variables (Pearson Correlation). However, “when

45
one continuous variable can be identified as an independent variable and another
continuous variable as the dependent variable, regression analysis is the
appropriate technique to measure the relationship between them and assess its
significance” (Alreck & Settle, 1994, p. 315-319).
Therefore, I also determined the r-square for the relationship in order to
“measure the degree and direction of influence the independent variable has on
the dependent variable.” (p. 319).
Demographic Data
To provide adequate data for this study, demographic information was
collected in addition to LAP scores. This data gram included name, sex, city,
state, and GPA.
Human Participants and Ethics Precautions
According to Creswell (2003) a researcher needs to consider a number of
elements when undertaking a study. Specifically, he admonishes that one must do
the following:
• Do not put participants at risk, and respect vulnerable populations
• Researchers need to respect the research site so that the sites are
left undisturbed after a research study
• In experimental studies, investigators need to collect data so that
all participants, and not only a experimental group, benefit from
the treatments

46
• Researchers also need to anticipate the possibility of harmful
information being disclosed during the data collection process
Participants in this study were protected in a number of ways. First, the
administration of the LAP was conducted online so that those taking the
instrument, and those grading it, did not meet. In addition, prior to using the
online instrument, participants were assigned a code to use and were not required
to furnish their name.
Once participants used the instrument, only the researcher had access to
the data and the list of participants and scores were kept in separate locations to
prevent unauthorized viewing or use.

47
CHAPTER FOUR: RESULTS
Overview
This chapter presents the results of the study techniques used to analyze
the data and answer the research question. It begins with instrumentation and a
restatement of the research question and hypotheses and is followed by the
descriptive statistics for the study. Following the presentation of the results of
hypotheses testing, a final summary of the study results concludes the chapter.
The central question of this study was: What is the correlation between
Learner Autonomy and academic performance in adult learners, as measured by
the constructs and components of the Learner Autonomy Profile-Short Form-
Short Form (LAP-SF-SF)? Whether the correlation was positive or negative was
not a part of the question, however it is noted in the results in order to provide a
complete picture of the results.
Instrumentation
Data for this study was gathered via the Learner Autonomy Profile-Short
Form (LAP-SF) instrument. The LAP-SF has four constructs and 22 components
that are centered around four constructs: desire, resourcefulness, initiative, and
persistence. Desire describes the individual’s motivation to while resourcefulness
means the learner’s intention to be resourceful. Initiative describes the person’s
willingness to initiate learning and persistence describes the person’s intention to
continue learning activities. Taken together, these four constructs provide an

48
accurate assessment of an individual’s relative capacity to undertake a self-
directed learning experience. Since the instrument has 66 questions, describe how
many questions are there per construct and component and give examples of
questions for each – include this part in your methodology section, too.
Reliability and validity of the four constructs and 22 components of the
LAP-SF instrument have been determined [by whom? (use citations) – include
this part in your methodology section, too.] through principal component analysis,
Pearson’s Correlations, and calculation of Cronbach’s Alphas through a test-retest
design. The first construct, desire, had an alpha of .9376 with the second,
resourcefulness, having an alpha of .9644. The third construct, initiative, had an
alpha of .9593, and the final construct, persistence, had an alpha of .9677.
The following hypotheses were examined to inform the research question:
Hypothesis 1: There is a significant correlation between the Learner Desire
construct score of the Learner Autonomy Profile-Short Form and academic
performance as measured by college GPA.
1a. There is a significant correlation between the Circumstance component
score of the Learner Autonomy Profile-Short Form and academic
performance as measured by college GPA.

49
1b. There is a significant correlation between the Expression component
score of the Learner Autonomy Profile-Short Form and academic
performance as measured by college GPA.
1c. There is a significant correlation between the Group Identity
component score of the Learner Autonomy Profile-Short Form and
academic performance as measured by college GPA.
1d. There is a significant correlation between the Growth and Balance
component score of the Learner Autonomy Profile-Short Form and
academic performance as measured by college GPA.
1e. There is a significant correlation between the Love Issues component
score of the Learner Autonomy Profile-Short Form and academic
performance as measured by college GPA.
1f. There is a significant correlation between the Communication Skills
component score of the Learner Autonomy Profile-Short Form and
academic performance as measured by college GPA.
1g. There is a significant correlation between the Change Skills component
score of the Learner Autonomy Profile-Short Form and academic
performance as measured by college GPA.

50
Hypothesis 2: There is a significant correlation between the Learner Initiative
construct score of the Learner Autonomy Profile-Short Form and academic
performance as measured by college GPA.
2a. There is a significant correlation between the Goal-Directedness
component score of the Learner Autonomy Profile-Short Form and
academic performance as measured by college GPA.
2b. There is a significant correlation between the Action-Orientation
component score of the Learner Autonomy Profile-Short Form and
academic performance as measured by college GPA.
2c. There is a significant correlation between the Overcoming Obstacles
component score of the Learner Autonomy Profile-Short Form and
academic performance as measured by college GPA.
2d. There is a significant correlation between the Active-Approach
component score of the Learner Autonomy Profile-Short Form and
academic performance as measured by college GPA.
2e. There is a significant correlation between the Self-Starting component
score of the Learner Autonomy Profile-Short Form and academic
performance as measured by college GPA.

51
Hypothesis 3: There is a significant correlation between the Learner Persistence
construct score of the Learner Autonomy Profile-Short Form and academic
performance as measure by college GPA.
3a. There is a significant correlation between the Volition component
score of the Learner Autonomy Profile-Short Form and academic
performance as measured by college GPA.
3b. There is a significant correlation between the Self-Regulation
component score of the Learner Autonomy Profile-Short Form and
academic performance as measured by college GPA.
3c. There is a significant correlation between the Goal-Maintenance
component score of the Learner Autonomy Profile-Short Form and
academic performance as measured by college GPA.
Hypothesis 4: There is a significant correlation between the Learner
Resourcefulness construct score of the Learner Autonomy Profile-Short Form and
academic performance as measured by college GPA.
4a. There is a significant correlation between the Learning Priority
component score of the Learner Autonomy Profile-Short Form and
academic performance as measured by college GPA.

52
4b. There is a significant correlation between the Deferring Gratification
component score of the Learner Autonomy Profile-Short Form and
academic performance as measured by college GPA.
4c. There is a significant correlation between the Resolving Conflict
component score of the Learner Autonomy Profile-Short Form and
academic performance as measured by college GPA.
4d. There is a significant correlation between the Future Orientation
component score of the Learner Autonomy Profile-Short Form and
academic performance as measured by college GPA.
4e. There is a significant correlation between the Planning component
score of the Learner Autonomy Profile-Short Form and academic
performance as measured by college GPA.
4f. There is a significant correlation between the Evaluating Alternatives
component score of the Learner Autonomy Profile-Short Form and
academic performance as measured by college GPA.
4g. There is a significant correlation between the Anticipating
Consequences component score of the Learner Autonomy Profile-Short
Form and academic performance as measured by college GPA.
Hypothesis 5: There is a significant correlation between the Total score of the
Learner Autonomy Profile-Short Form and academic performance as measured by
college GPA

53
Response Rate
For this study, all 334 student organizations at The George Washington
University were contacted in order to recruit subjects. Additionally, 2,348
individual students were contacted via the GWU student e-mail system for a total
of 2,682 potential participants. Students were contacted randomly by e-mail until
enough had completed the instrument. As a result of these efforts, a total of 264
students contacted the researcher and volunteered to participate. Of these, 191
registered for the study with a total of 138 actually completing the online LAP-SF
instrument. Three participants did not provide a GPA and were not considered in
the study. Table 1, below, summarizes the response to the recruitment effort.
Students Contacted 2682 100%
Volunteered to Take Online Instrument 264 9.80%
Completely Registered for Online Instrument 191 7.10%
Completed Online Instrument 135 5.00%
Table 1: Response Summary
Descriptive Statistics
This section describes the students that participated in the study. In terms
of gender, the study participants included 59 male (43.7%) and 76 female (56.3%)
students (Table 2). The participants ranged in age from 17 to 67 with the mean
age being just under 28 years old (Table 3). In terms of marital status, 96 (71.1%)

54
were single while 39 (28.9%) were not single (Table 4). Finally, 50 of the
participants (37%) identified high school as their highest education completed; 48
(35.6%) had earned a bachelor’s degree; and 37 (27.4%) had earned a graduate or
professional degree (Table 5).
Gender
Frequency Percent Valid Percent
Cumulative
Percent
Valid Male 59 43.7 43.7 43.7
Female 76 56.3 56.3 100.0
Total 135 100.0 100.0
Table 2 – Gender
Age
N Minimum Maximum Mean Std. Deviation
Age 135 17 67 27.97 10.978
Valid N (listwise) 135
Table 3 – Age
Domestic Status
Frequency Percent Valid Percent
Cumulative
Percent
Valid Single 96 71.1 71.1 71.1
Not Single 39 28.9 28.9 100.0
Total 135 100.0 100.0
Table 4 – Domestic Status

55
Education Completed
Frequency Percent Valid Percent
Cumulative
Percent
Valid High School Diploma 50 37.0 37.0 37.0
Batchelor Degree 48 35.6 35.6 72.6
Graduate or Professional
Degree 37 27.4 27.4 100.0
Total 135 100.0 100.0
Table 5 – Education Completed
Results of Hypotheses Testing Learner Desire
Table 6 reveals that there is a positive, significant correlation between the
Learner Desire construct of the Learner Autonomy Profile-Short Form and Grade
Point Average while Table 7 reveals that the value of R2 is .037 meaning that the
Learner Desire construct and GPA share 3.7% of the variance between
themselves. According to Alreck & Settle (1994, p. 319) regression analysis is the
appropriate technique to measure the relationship between variables and assess
their significance.
Learner Desire
Grade Point
Average
Short Form
Desire Score
Grade Point Average Pearson Correlation 1.000 .193*

56
Sig. (2-tailed) .025
N 135.000 135
Short Form Desire Score Pearson Correlation .193* 1.000
Sig. (2-tailed) .025
N 135 135.000
*. Correlation is significant at the 0.05 level (2-tailed).
Table 6 – GPA and Learner Desire Construct (Correlation)
Model Summary
Model R R Square
Adjusted R
Square
Std. Error of the
Estimate
1 .193a .037 .030 .36903
a. Predictors: (Constant), Short Form Desire Score
Table 7 – GPA and Learner Desire Construct (R2) Circumstance
Table 8 reveals that there is a positive, but not significant correlation
between the Circumstance Component of the Learner Autonomy Profile-Short
Form and Grade Point Average while Table 9 reveals that the value of R2 is .022
meaning that the Circumstance Component and GPA share 2.2% of the variance
between themselves. According to Alreck & Settle (1994, p. 319) regression
analysis is the appropriate technique to measure the relationship between
variables and assess their significance.

57
Circumstance
Grade Point
Average Circumstance
Grade Point Average Pearson Correlation 1.000 .147
Sig. (2-tailed) .089
N 135.000 135
Circumstance Pearson Correlation .147 1.000
Sig. (2-tailed) .089
N 135 135.000
Table 8 – GPA and Circumstance Component (Correlation)
Model Summary
Model R R Square
Adjusted R
Square
Std. Error of the
Estimate
1 .147a .022 .014 .37205
a. Predictors: (Constant), Circumstance
Table 9 – GPA and Circumstance Component (R2) Expression
Table 10 reveals that there is a positive, but not significant correlation
between the Expression Component of the Learner Autonomy Profile-Short Form
and Grade Point Average while Table 11 reveals that the value of R2 is .003
meaning that the Expression Component and GPA share 0.3% of the variance
between themselves. According to Alreck & Settle (1994, p. 319) regression
analysis is the appropriate technique to measure the relationship between
variables and assess their significance.

58
Expression
Grade Point
Average Expression
Grade Point Average Pearson Correlation 1.000 .056
Sig. (2-tailed) .517
N 135.000 135
Expression Pearson Correlation .056 1.000
Sig. (2-tailed) .517
N 135 135.000
Table 10 – GPA and Expression Component (Correlation)
Model Summary
Model R R Square
Adjusted R
Square
Std. Error of the
Estimate
1 .056a .003 -.004 .37553
a. Predictors: (Constant), Expression
Table 11 – GPA and Expression Component (R2) Group Identity
Table 12 reveals that there is a positive, significant correlation between the
Group Identity Component of the Learner Autonomy Profile-Short Form and
Grade Point Average while Table 13 reveals that the value of R2 is .040 meaning
that the Group Identity Component and GPA share 4% of the variance between
themselves. According to Alreck & Settle (1994, p. 319) regression analysis is the

59
appropriate technique to measure the relationship between variables and assess
their significance.
Group Identity
Grade Point
Average Group Identity
Grade Point Average Pearson Correlation 1.000 .200*
Sig. (2-tailed) .020
N 135.000 135
Group Identity Pearson Correlation .200* 1.000
Sig. (2-tailed) .020
N 135 135.000
*. Correlation is significant at the 0.05 level (2-tailed).
Table 12 – GPA and Group Identity Component (Correlation)
Model Summary
Model R R Square
Adjusted R
Square
Std. Error of the
Estimate
1 .200a .040 .033 .36854
a. Predictors: (Constant), Group Identity
Table 13 – GPA and Group Identity Component (R2) Growth & Balance
Table 14 reveals that there is a positive, significant correlation between the
Growth and Balance Component of the Learner Autonomy Profile-Short Form
and Grade Point Average while Table 15 reveals that the value of R2 is .038
meaning that the Growth & Balance Component and GPA share 3.8% of the

60
variance between themselves. According to Alreck & Settle (1994, p. 319)
regression analysis is the appropriate technique to measure the relationship
between variables and assess their significance.
Growth and Balance
Grade Point
Average
Growth &
Balance
Grade Point Average Pearson Correlation 1.000 .194*
Sig. (2-tailed) .024
N 135.000 135
Growth & Balance Pearson Correlation .194* 1.000
Sig. (2-tailed) .024
N 135 135.000
*. Correlation is significant at the 0.05 level (2-tailed).
Table 14 – GPA and Growth & Balance Component (Correlation)
Model Summary
Model R R Square
Adjusted R
Square
Std. Error of the
Estimate
1 .194a .038 .031 .36895
a. Predictors: (Constant), Growth & Balance
Table 15 – GPA and Growth & Balance Component (R2) Love Issues
Table 16 reveals that there is a positive, but not significant correlation
between the Love Issues Component of the Learner Autonomy Profile-Short
Form and Grade Point Average while Table 17 reveals that the value of R2 is .004

61
meaning that the Love Issues Component and GPA share 0.4% of the variance
between themselves. According to Alreck & Settle (1994, p. 319) regression
analysis is the appropriate technique to measure the relationship between
variables and assess their significance.
Love Issues
Grade Point
Average Love Issues
Grade Point Average Pearson Correlation 1.000 .062
Sig. (2-tailed) .476
N 135.000 135
Love Issues Pearson Correlation .062 1.000
Sig. (2-tailed) .476
N 135 135.000
Table 16 – GPA and Love Issues Component (Correlation)
Model Summary
Model R R Square
Adjusted R
Square
Std. Error of the
Estimate
1 .062a .004 -.004 .37541
a. Predictors: (Constant), Love Issues
Table 17 – GPA and Love Issues Component (R2)

62
Communication Skills
Table 18 reveals that there is a positive, significant correlation between the
Communication Skills Component of the Learner Autonomy Profile-Short Form
and Grade Point Average while Table 19 reveals that the value of R2 is .043
meaning that the Communication Skills Component and GPA share 4.3% of the
variance between themselves. According to Alreck & Settle (1994, p. 319)
regression analysis is the appropriate technique to measure the relationship
between variables and assess their significance.
Communication Skills
Grade Point
Average
Communication
Skills
Grade Point Average Pearson Correlation 1.000 .208*
Sig. (2-tailed) .015
N 135.000 135
Communication Skills Pearson Correlation .208* 1.000
Sig. (2-tailed) .015
N 135 135.000
*. Correlation is significant at the 0.05 level (2-tailed).
Table 18 – GPA and Communication Skills Component (Correlation)

63
Model Summary
Model R R Square
Adjusted R
Square
Std. Error of the
Estimate
1 .208a .043 .036 .36789
a. Predictors: (Constant), Communication Skills
Table 19 – GPA and Communication Skills Component (R2) Change Skills
Table 20 reveals that there is a positive, but not significant correlation
between the Change Skills Component of the Learner Autonomy Profile-Short
Form and Grade Point Average while Table 21 reveals that the value of R2 is .018
meaning that the Change Skills Component and GPA share 1.8% of the variance
between themselves. According to Alreck & Settle (1994, p. 319) regression
analysis is the appropriate technique to measure the relationship between
variables and assess their significance.
Change Skills
Grade Point
Average Change Skills
Grade Point Average Pearson Correlation 1.000 .136
Sig. (2-tailed) .116
N 135.000 135
Change Skills Pearson Correlation .136 1.000
Sig. (2-tailed) .116
N 135 135.000

64
Table 20 – GPA and Change Skills Component (Correlation)
Model Summary
Model R R Square
Adjusted R
Square
Std. Error of the
Estimate
1 .136a .018 .011 .37264
a. Predictors: (Constant), Change Skills
Table 21 – GPA and Change Skills Component (R2) Learner Initiative
Table 22 reveals that there is a positive, significant correlation between the
Learner Initiative Construct of the Learner Autonomy Profile-Short Form and
Grade Point Average while Table 23 reveals that the value of R2 is .034 meaning
that the Learner Initiative Component and GPA share 3.4% of the variance
between themselves. According to Alreck & Settle (1994, p. 319) regression
analysis is the appropriate technique to measure the relationship between
variables and assess their significance.
Learner Initiative
Grade Point
Average
Short Form
Initiative Score
Grade Point Average Pearson Correlation 1.000 .186*
Sig. (2-tailed) .031
N 135.000 135
Short Form Initiative Score Pearson Correlation .186* 1.000

65
Sig. (2-tailed) .031
N 135 135.000
*. Correlation is significant at the 0.05 level (2-tailed).
Table 22 – GPA and Learner Initiative Construct (Correlation)
Model Summary
Model R R Square
Adjusted R
Square
Std. Error of the
Estimate
1 .186a .034 .027 .36960
a. Predictors: (Constant), Short Form Initiative Score
Table 23 – GPA and Learner Initiative Construct (R2) Goal-Directedness
Table 24 reveals that there is a positive, but not significant correlation
between the Goal Directedness Component of the Learner Autonomy Profile-
Short Form and Grade Point Average while Table 25 reveals that the value of R2
is .016 meaning that the Goal Directedness Component and GPA share 1.6% of
the variance between themselves. According to Alreck & Settle (1994, p. 319)
regression analysis is the appropriate technique to measure the relationship
between variables and assess their significance.
Goal Directedness
Grade Point
Average
Goal-
Directedness
Grade Point Average Pearson Correlation 1.000 .126

66
Sig. (2-tailed) .144
N 135.000 135
Goal-Directedness Pearson Correlation .126 1.000
Sig. (2-tailed) .144
N 135 135.000
Table 24 – GPA and Goal-Directedness Component (Correlation)
Model Summary
Model R R Square
Adjusted R
Square
Std. Error of the
Estimate
1 .126a .016 .009 .37312
a. Predictors: (Constant), Goal-Directedness
Table 25 – GPA and Goal-Directedness Component (R2) Action Orientation
Table 26 reveals that there is a positive, significant correlation between the
Action Orientation Component of the Learner Autonomy Profile-Short Form and
Grade Point Average while Table 27 reveals that the value of R2 is .062 meaning
that the Action Orientation Component and GPA share 6.2% of the variance
between themselves. According to Alreck & Settle (1994, p. 319) regression
analysis is the appropriate technique to measure the relationship between
variables and assess their significance.
Action Orientation

67
Grade Point
Average
Action
Orientation
Grade Point Average Pearson Correlation 1.000 .248**
Sig. (2-tailed) .004
N 135.000 135
Action Orientation Pearson Correlation .248** 1.000
Sig. (2-tailed) .004
N 135 135.000
**. Correlation is significant at the 0.01 level (2-tailed).
Table 26 – GPA and Action Orientation Component (Correlation)
Model Summary
Model R R Square
Adjusted R
Square
Std. Error of the
Estimate
1 .248a .062 .055 .36436
a. Predictors: (Constant), Action Orientation
Table 27 – GPA and Action Orientation Component (R2) Overcoming Obstacles
Table 28 reveals that there is a positive, but not significant correlation
between the Overcoming Obstacles Component of the Learner Autonomy Profile-
Short Form and Grade Point Average while Table 29 reveals that the value of R2
is .006 meaning that the Overcoming Obstacles Component and GPA share 0.6%
of the variance between themselves. According to Alreck & Settle (1994, p. 319)
regression analysis is the appropriate technique to measure the relationship
between variables and assess their significance.

68
Overcoming Obstacles
Grade Point
Average
Overcoming
Obstacles
Grade Point Average Pearson Correlation 1.000 .077
Sig. (2-tailed) .377
N 135.000 135
Overcoming Obstacles Pearson Correlation .077 1.000
Sig. (2-tailed) .377
N 135 135.000
Table 28 – GPA and Overcoming Obstacles Component (Correlation)
Model Summary
Model R R Square
Adjusted R
Square
Std. Error of the
Estimate
1 .077a .006 -.002 .37502
a. Predictors: (Constant), Overcoming Obstacles
Table 29 – GPA and Overcoming Obstacles Component (R2) Active Approach
Table 30 reveals that there is a positive, but not significant correlation
between the Active Approach Component of the Learner Autonomy Profile-Short
Form and Grade Point Average while Table 31 reveals that the value of R2 is .022
meaning that the Active Approach Component and GPA share 2.2% of the
variance between themselves. According to Alreck & Settle (1994, p. 319)

69
regression analysis is the appropriate technique to measure the relationship
between variables and assess their significance.
Active Approach
Grade Point
Average Active Approach
Grade Point Average Pearson Correlation 1.000 .149
Sig. (2-tailed) .085
N 135.000 135
Active Approach Pearson Correlation .149 1.000
Sig. (2-tailed) .085
N 135 135.000
Table 30 – GPA and Active Approach Component (Correlation)
Model Summary
Model R R Square
Adjusted R
Square
Std. Error of the
Estimate
1 .149a .022 .015 .37193
a. Predictors: (Constant), Active Approach
Table 31 – GPA and Active Approach Component (R2) Self-Starting
Table 32 reveals that there is a positive, but not significant correlation
between the Self-Starting Component of the Learner Autonomy Profile-Short
Form and Grade Point Average while Table 33 reveals that the value of R2 is .028

70
meaning that the Self-Starting Component and GPA share 2.8% of the variance
between themselves. According to Alreck & Settle (1994, p. 319) regression
analysis is the appropriate technique to measure the relationship between
variables and assess their significance.
Self-Starting
Grade Point
Average Self-Starting
Grade Point Average Pearson Correlation 1.000 .169
Sig. (2-tailed) .051
N 135.000 135
Self-Starting Pearson Correlation .169 1.000
Sig. (2-tailed) .051
N 135 135.000
Table 32 – GPA and Self-Starting Component (Correlation)
Model Summary
Model R R Square
Adjusted R
Square
Std. Error of the
Estimate
1 .169a .028 .021 .37075
a. Predictors: (Constant), Self-Starting
Table 33 – GPA and Self-Starting Component (R2) Learner Persistence
Table 34 reveals that there is a positive, significant correlation between the
Learner Persistence Construct of the Learner Autonomy Profile-Short Form and

71
Grade Point Average while Table 35 reveals that the value of R2 is .040 meaning
that the Learner Persistence Construct and GPA share 4% of the variance between
themselves. According to Alreck & Settle (1994, p. 319) regression analysis is the
appropriate technique to measure the relationship between variables and assess
their significance.
Learner Persistence
Grade Point
Average
Short Form
Persistence
Score
Grade Point Average Pearson Correlation 1.000 .200*
Sig. (2-tailed) .020
N 135.000 135
Short Form Persistence
Score
Pearson Correlation .200* 1.000
Sig. (2-tailed) .020
N 135 135.000
*. Correlation is significant at the 0.05 level (2-tailed).
Table 34 – GPA and Learner Persistence Construct (Correlation)
Model Summary
Model R R Square
Adjusted R
Square
Std. Error of the
Estimate
1 .200a .040 .033 .36850
a. Predictors: (Constant), Short Form Persistence Score
Table 35 – GPA and Learner Persistence Construct (R2)

72
Volition
Table 36 reveals that there is a positive, but not significant correlation
between the Volition Component of the Learner Autonomy Profile-Short Form
and Grade Point Average while Table 37 reveals that the value of R2 is .020
meaning that the Volition Component and GPA share 2% of the variance between
themselves. According to Alreck & Settle (1994, p. 319) regression analysis is the
appropriate technique to measure the relationship between variables and assess
their significance.
Volition
Grade Point
Average Volition
Grade Point Average Pearson Correlation 1.000 .140
Sig. (2-tailed) .105
N 135.000 135
Volition Pearson Correlation .140 1.000
Sig. (2-tailed) .105
N 135 135.000
Table 36 – GPA and Volition Component (Correlation)
Model Summary
Model R R Square
Adjusted R
Square
Std. Error of the
Estimate
1 .140a .020 .012 .37241
a. Predictors: (Constant), Volition
Table 37 – GPA and Volition Component (R2)

73
Self-Regulation
Table 38 reveals that there is a positive, significant correlation between the
Self-Regulation Component of the Learner Autonomy Profile-Short Form and
Grade Point Average while Table 39 reveals that the value of R2 is .073 meaning
that the Self-Regulation Component and GPA share 7.3% of the variance between
themselves. According to Alreck & Settle (1994, p. 319) regression analysis is the
appropriate technique to measure the relationship between variables and assess
their significance.
Self-Regulation
Grade Point
Average Self-Regulation
Grade Point Average Pearson Correlation 1.000 .270**
Sig. (2-tailed) .002
N 135.000 135
Self-Regulation Pearson Correlation .270** 1.000
Sig. (2-tailed) .002
N 135 135.000
**. Correlation is significant at the 0.01 level (2-tailed).
Table 38 – GPA and Self-Regulation Component (Correlation)
Model Summary
Model R R Square
Adjusted R
Square
Std. Error of the
Estimate
1 .270a .073 .066 .36212
a. Predictors: (Constant), Self-Regulation

74
Table 39 – GPA and Self-Regulation Component (R2) Goal-Maintenance
Table 40 reveals that there is a positive, but not significant correlation
between the Goal-Maintenance Component of the Learner Autonomy Profile-
Short Form and Grade Point Average while Table 41 reveals that the value of R2
is .019 meaning that the Goal-Maintenance Component and GPA share 1.9% of
the variance between themselves. According to Alreck & Settle (1994, p. 319)
regression analysis is the appropriate technique to measure the relationship
between variables and assess their significance.
Goal Maintenance
Grade Point
Average
Goal
Maintenance
Grade Point Average Pearson Correlation 1.000 .138
Sig. (2-tailed) .110
N 135.000 135
Goal Maintenance Pearson Correlation .138 1.000
Sig. (2-tailed) .110
N 135 135.000
Table 40 – GPA and Goal-Maintenance Component (Correlation)
Model Summary
Model R R Square
Adjusted R
Square
Std. Error of the
Estimate
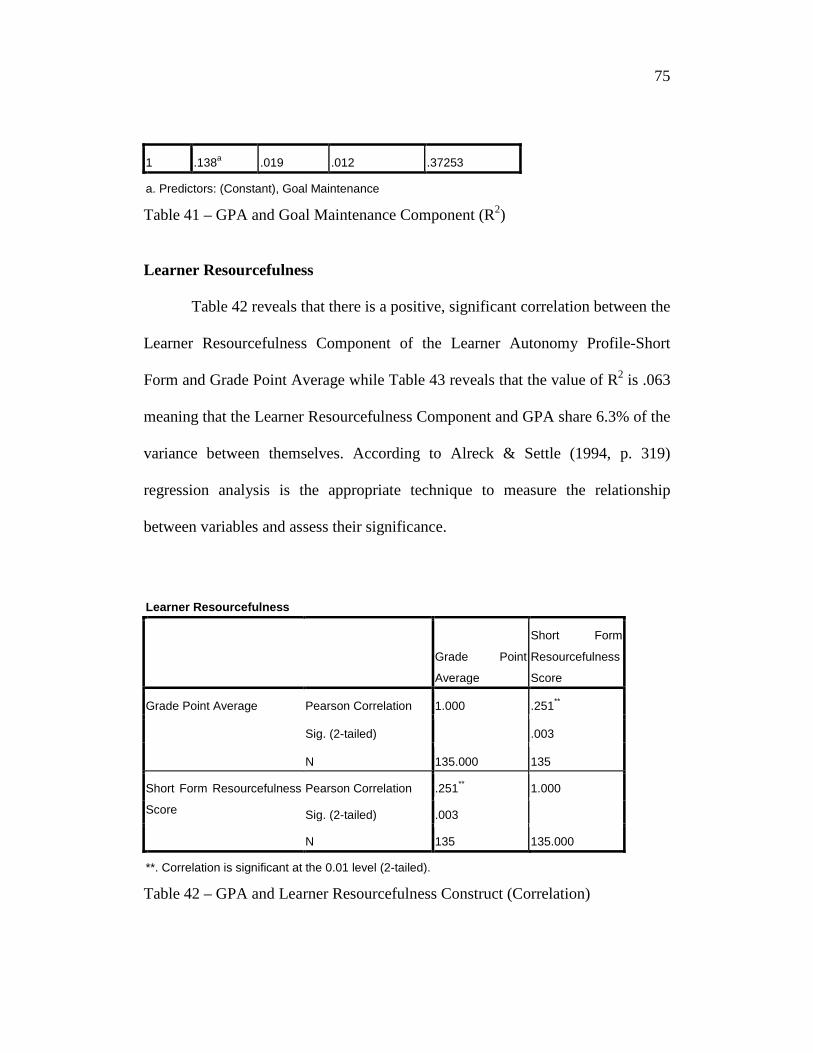
75
1 .138a .019 .012 .37253
a. Predictors: (Constant), Goal Maintenance
Table 41 – GPA and Goal Maintenance Component (R2) Learner Resourcefulness
Table 42 reveals that there is a positive, significant correlation between the
Learner Resourcefulness Component of the Learner Autonomy Profile-Short
Form and Grade Point Average while Table 43 reveals that the value of R2 is .063
meaning that the Learner Resourcefulness Component and GPA share 6.3% of the
variance between themselves. According to Alreck & Settle (1994, p. 319)
regression analysis is the appropriate technique to measure the relationship
between variables and assess their significance.
Learner Resourcefulness
Grade Point
Average
Short Form
Resourcefulness
Score
Grade Point Average Pearson Correlation 1.000 .251**
Sig. (2-tailed) .003
N 135.000 135
Short Form Resourcefulness
Score
Pearson Correlation .251** 1.000
Sig. (2-tailed) .003
N 135 135.000
**. Correlation is significant at the 0.01 level (2-tailed).
Table 42 – GPA and Learner Resourcefulness Construct (Correlation)

76
Model Summary
Model R R Square
Adjusted R
Square
Std. Error of the
Estimate
1 .251a .063 .056 .36407
a. Predictors: (Constant), Short Form Resourcefulness Score
Table 43 – GPA and Learner Resourcefulness Construct (R2) Learning Priority
Table 44 reveals that there is a positive, but not significant correlation
between the Learning Priority Component of the Learner Autonomy Profile-Short
Form and Grade Point Average while Table 45 reveals that the value of R2 is .019
meaning that the Learning Priority Component and GPA share 1.9% of the
variance between themselves. According to Alreck & Settle (1994, p. 319)
regression analysis is the appropriate technique to measure the relationship
between variables and assess their significance.
Learning Priority
Grade Point
Average Learning Priority
Grade Point Average Pearson Correlation 1.000 .136
Sig. (2-tailed) .115
N 135.000 135
Learning Priority Pearson Correlation .136 1.000
Sig. (2-tailed) .115

77
Learning Priority
Grade Point
Average Learning Priority
Grade Point Average Pearson Correlation 1.000 .136
Sig. (2-tailed) .115
N 135.000 135
Learning Priority Pearson Correlation .136 1.000
Sig. (2-tailed) .115
N 135 135.000
Table 44 – GPA and Learning Priority Component (Correlation)
Model Summary
Model R R Square
Adjusted R
Square
Std. Error of the
Estimate
1 .136a .019 .011 .37262
a. Predictors: (Constant), Learning Priority
Table 45 – GPA and Learning Priority Component (R2) Deferring Gratification
Table 46 reveals that there is a positive, significant correlation between the
Deferring Gratification Component of the Learner Autonomy Profile-Short Form
and Grade Point Average while Table 47 reveals that the value of R2 is .065
meaning that the Deferring Gratification Component and GPA share 6.5% of the
variance between themselves. According to Alreck & Settle (1994, p. 319)

78
regression analysis is the appropriate technique to measure the relationship
between variables and assess their significance.
Deferring Gratification
Grade Point
Average
Deferring
Gratification
Grade Point Average Pearson Correlation 1.000 .255**
Sig. (2-tailed) .003
N 135.000 135
Deferring Gratification Pearson Correlation .255** 1.000
Sig. (2-tailed) .003
N 135 135.000
**. Correlation is significant at the 0.01 level (2-tailed).
Table 46 – GPA and Deferring Gratification Component (Correlation)
Model Summary
Model R R Square
Adjusted R
Square
Std. Error of the
Estimate
1 .255a .065 .058 .36365
a. Predictors: (Constant), Deferring Gratification
Table 47 – GPA and Deferring Gratification Component (R2) Resolving Conflict
Table 48 reveals that there is a positive, significant correlation between the
Resolving Conflict Component of the Learner Autonomy Profile-Short Form and
Grade Point Average while Table 49 reveals that the value of R2 is .067 meaning
that the Resolving Conflict Component and GPA share 6.7% of the variance

79
between themselves. According to Alreck & Settle (1994, p. 319) regression
analysis is the appropriate technique to measure the relationship between
variables and assess their significance.
Resolving Conflict
Grade Point
Average
Resolving
Conflict
Grade Point Average Pearson Correlation 1.000 .259**
Sig. (2-tailed) .002
N 135.000 135
Resolving Conflict Pearson Correlation .259** 1.000
Sig. (2-tailed) .002
N 135 135.000
**. Correlation is significant at the 0.01 level (2-tailed).
Table 48 – GPA and Resolving Conflict Component (Correlation)
Model Summary
Model R R Square
Adjusted R
Square
Std. Error of the
Estimate
1 .259a .067 .060 .36327
a. Predictors: (Constant), Resolving Conflict
Table 49 – GPA and Resolving Conflict Component (R2) Future Orientation
Table 50 reveals that there is a positive, significant correlation between the
Future Orientation Component of the Learner Autonomy Profile-Short Form and
Grade Point Average while Table 51 reveals that the value of R2 is .038 meaning

80
that the Future Orientation Component and GPA share 3.8 % of the variance
between themselves. According to Alreck & Settle (1994, p. 319) regression
analysis is the appropriate technique to measure the relationship between
variables and assess their significance.
Future Orientation
Grade Point
Average
Future
Orientation
Grade Point Average Pearson Correlation 1.000 .196*
Sig. (2-tailed) .023
N 135.000 135
Future Orientation Pearson Correlation .196* 1.000
Sig. (2-tailed) .023
N 135 135.000
*. Correlation is significant at the 0.05 level (2-tailed).
Table 50 – GPA and Future Orientation Component (Correlation)
Model Summary
Model R R Square
Adjusted R
Square
Std. Error of the
Estimate
1 .196a .038 .031 .36885
a. Predictors: (Constant), Future Orientation
Table 51 – GPA and Future Orientation Component (R2) Planning
Table 52 reveals that there is a positive, significant correlation between the
Planning Component of the Learner Autonomy Profile-Short Form and Grade
Point Average while Table 53 reveals that the value of R2 is .076 meaning that the

81
Planning Component and GPA share 7.6% of the variance between themselves.
According to Alreck & Settle (1994, p. 319) regression analysis is the appropriate
technique to measure the relationship between variables and assess their
significance.
Planning
Grade Point
Average Planning
Grade Point Average Pearson Correlation 1.000 .275**
Sig. (2-tailed) .001
N 135.000 135
Planning Pearson Correlation .275** 1.000
Sig. (2-tailed) .001
N 135 135.000
**. Correlation is significant at the 0.01 level (2-tailed).
Table 52 – GPA and Planning Component (Correlation)
Model Summary
Model R R Square
Adjusted R
Square
Std. Error of the
Estimate
1 .275a .076 .069 .36164
a. Predictors: (Constant), Planning
Table 53 – GPA and Planning Component (R2)

82
Evaluating Alternatives
Table 54 reveals that there is a positive, but not significant correlation
between the Evaluating Alternatives Component of the Learner Autonomy
Profile-Short Form and Grade Point Average while Table 55 reveals that the value
of R2 is .012 meaning that the Evaluating Alternatives Component and GPA share
1.2% of the variance between themselves. According to Alreck & Settle (1994, p.
319) regression analysis is the appropriate technique to measure the relationship
between variables and assess their significance.
Evaluating Alternatives
Grade Point
Average
Evaluating
Alternatives
Grade Point Average Pearson Correlation 1.000 .109
Sig. (2-tailed) .207
N 135.000 135
Evaluating Alternatives Pearson Correlation .109 1.000
Sig. (2-tailed) .207
N 135 135.000
Table 54 – GPA and Evaluating Alternatives Component (Correlation)
Model Summary
Model R R Square
Adjusted R
Square
Std. Error of the
Estimate
1 .109a .012 .005 .37388

83
Model Summary
Model R R Square
Adjusted R
Square
Std. Error of the
Estimate
1 .109a .012 .005 .37388
a. Predictors: (Constant), Evaluating Alternatives
Table 55 – GPA and Evaluating Alternatives Component (R2) Anticipating Consequences
Table 56 reveals that there is a positive, but not significant correlation
between the Anticipating Consequences Component of the Learner Autonomy
Profile-Short Form and Grade Point Average while Table 57 reveals that the value
of R2 is .016 meaning that the Anticipating Consequences Component and GPA
share 1.6% of the variance between themselves. According to Alreck & Settle
(1994, p. 319) regression analysis is the appropriate technique to measure the
relationship between variables and assess their significance.
Anticipating Consequences
Grade Point
Average
Anticipating
Consequences
Grade Point Average Pearson Correlation 1.000 .125
Sig. (2-tailed) .150
N 135.000 135
Anticipating Consequences Pearson Correlation .125 1.000
Sig. (2-tailed) .150
N 135 135.000
Table 56 – GPA and Anticipating Consequences Component (Correlation)

84
Model Summary
Model R R Square
Adjusted R
Square
Std. Error of the
Estimate
1 .125a .016 .008 .37320
a. Predictors: (Constant), Anticipating Consequences
Table 57 – GPA and Anticipating Consequences Component (R2) Short Form Total Score
Table 58 reveals that there is a positive, significant correlation between the
Total Score of the Learner Autonomy Profile-Short Form and Grade Point
Average while Table 59 reveals that the value of R2 is .057 meaning that the Total
Score and GPA share 5.7% of the variance between themselves. According to
Alreck & Settle (1994, p. 319) regression analysis is the appropriate technique to
measure the relationship between variables and assess their significance.
Short Form Total
Grade Point
Average
Short Form Total
Score
Grade Point Average Pearson Correlation 1.000 .238**
Sig. (2-tailed) .005
N 135.000 135
Short Form Total Score Pearson Correlation .238** 1.000
Sig. (2-tailed) .005
N 135 135.000
**. Correlation is significant at the 0.01 level (2-tailed).
Table 58 – GPA and Short Form Total Score (Correlation)

85
Model Summary
Model R R Square Adjusted R Square
Std. Error of the
Estimate
1 .238a .057 .050 .36533
a. Predictors: (Constant), Short Form Total Score
Table 59 – GPA and Short Form Total Score (R2)
Summary of Results
Table 60 (next page) reveals that the Total Score and all four Constructs of
the Learner Autonomy Profile-Short Form have a positive, significant correlation
with Grade Point Average. However, only the Total Score and Learner
Resourcefulness Construct have a significant correlation at the .01 level; Learner
Desire, Learner Initiative, and Learner Persistence have significant correlations
with Grade Point Average at the .05 level. Results that were significant at the .01
level indicate a 99% chance that the results are correct while those that were
significant at the .05 level have a 95% chance of being correct.
In addition, there are nine components that have a positive, significant
correlation with Grade Point Average. Of these the Action Orientation, Self-
Regulation, Deferring Gratification, Resolving Conflict and Planning
Components are significant at the .01 level while the Group Identity, Growth and

86
Balance, Communication Skills and Future Orientation Components are
significant at the .05 level.
A total of 13 Components have a positive, but not significant correlation
with Grade Point Average: Circumstance, Expression, Love Issues, Change
Skills, Goal-Directedness, Overcoming Obstacles, Active Approach, Self-
Starting, Volition, Goal Maintenance, Learning Priority, Evaluating Alternatives
and Anticipating Consequences.
Table 60 – Summary of Results
Hypothesis Description Result H1 There is a significant correlation between
the Learner Desire construct of the Learner Autonomy Profile-Short Form and
academic performance as measured by college GPA.
Positive, Significant*
H1a There is a significant correlation between the Circumstances component of the
Learner Autonomy Profile-Short Form and academic performance as measured by
college GPA.
Positive, Not Significant
H1b There is a significant correlation between the Expression component of the Learner
Autonomy Profile-Short Form and academic performance as measured by
college GPA.
Positive, Not Significant
H1c There is a significant correlation between the Group Identity component of the
Learner Autonomy Profile-Short Form and academic performance as measured by
college GPA.
Positive, Significant*
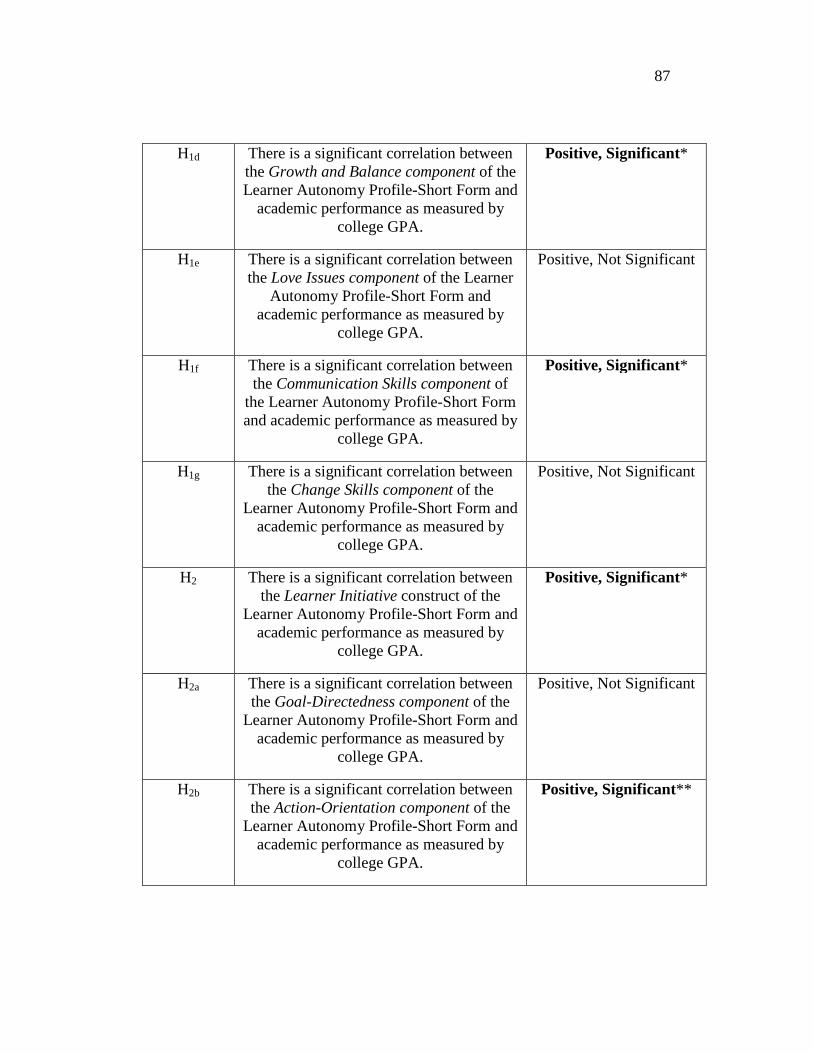
87
H1d There is a significant correlation between the Growth and Balance component of the Learner Autonomy Profile-Short Form and
academic performance as measured by college GPA.
Positive, Significant*
H1e There is a significant correlation between the Love Issues component of the Learner
Autonomy Profile-Short Form and academic performance as measured by
college GPA.
Positive, Not Significant
H1f There is a significant correlation between the Communication Skills component of
the Learner Autonomy Profile-Short Form and academic performance as measured by
college GPA.
Positive, Significant*
H1g There is a significant correlation between the Change Skills component of the
Learner Autonomy Profile-Short Form and academic performance as measured by
college GPA.
Positive, Not Significant
H2 There is a significant correlation between the Learner Initiative construct of the
Learner Autonomy Profile-Short Form and academic performance as measured by
college GPA.
Positive, Significant*
H2a There is a significant correlation between the Goal-Directedness component of the
Learner Autonomy Profile-Short Form and academic performance as measured by
college GPA.
Positive, Not Significant
H2b There is a significant correlation between the Action-Orientation component of the
Learner Autonomy Profile-Short Form and academic performance as measured by
college GPA.
Positive, Significant**

88
H2c There is a significant correlation between the Overcoming Obstacles component of
the Learner Autonomy Profile-Short Form and academic performance as measured by
college GPA.
Positive, Not Significant
H2d There is a significant correlation between the Active-Approach component of the
Learner Autonomy Profile-Short Form and academic performance as measured by
college GPA.
Positive, Not Significant
H2e There is a significant correlation between the Self-Starting component of the Learner
Autonomy Profile-Short Form and academic performance as measured by
college GPA.
Positive, Not Significant
H3 There is a significant correlation between the Learner Persistence construct of the
Learner Autonomy Profile-Short Form and academic performance as measure by
college GPA.
Positive, Significant*
H3a There is a significant correlation between the Volition component of the Learner
Autonomy Profile-Short Form and academic performance as measured by
college GPA.
Positive, Not Significant
H3b There is a significant correlation between the Self-Regulation component of the
Learner Autonomy Profile-Short Form and academic performance as measured by
college GPA.
Positive, Significant**
H3c There is a significant correlation between the Goal-Maintenance component of the
Learner Autonomy Profile-Short Form and academic performance as measured by
college GPA.
Positive, Not Significant

89
H4 There is a significant correlation between the Learner Resourcefulness construct of
the Learner Autonomy Profile-Short Form and academic performance as measured by
college GPA.
Positive, Significant**
H4a There is a significant correlation between the Learning Priority component of the
Learner Autonomy Profile-Short Form and academic performance as measured by
college GPA.
Positive, Not Significant
H4b There is a significant correlation between the Deferring Gratification component of the Learner Autonomy Profile-Short Form and academic performance as measured by
college GPA.
Positive, Significant**
H4c There is a significant correlation between the Resolving Conflict component of the
Learner Autonomy Profile-Short Form and academic performance as measured by
college GPA.
Positive, Significant**
H4d There is a significant correlation between the Future Orientation component of the
Learner Autonomy Profile-Short Form and academic performance as measured by
college GPA.
Positive, Significant*
H4e There is a significant correlation between the Planning component of the Learner
Autonomy Profile-Short Form and academic performance as measured by
college GPA.
Positive, Significant**
H4f There is a significant correlation between the Evaluating Alternatives component of the Learner Autonomy Profile-Short Form and academic performance as measured by
college GPA.
Positive, Not Significant

90
H4g There is a significant correlation between the Anticipating Consequences component
of the Learner Autonomy Profile-Short Form and academic performance as
measured by college GPA.
Positive, Not Significant
H5 There is a significant correlation between the Total Score of the Learner Autonomy
Profile – Short Form and academic performance as measured by college GPA.
Positive, Significant**
* Correlation is Significant at the 0.05 Level (2-tailed)
** Correlation is Significant at the 0.01 Level (2-tailed)
Chapter Summary
This chapter presented the results of the study and described the
techniques used to analyze the data and answer the research question. The central
question of this study was: What is the correlation between Learner Autonomy
and academic performance in adult learners, as measured by the constructs and
components of the Learner Autonomy Profile-Short Form (LAP-SF)?
This chapter has shown that for the total score, each of the constructs and
some of the components there is a positive, significant correlation with GPA. The
following chapter will present conclusions and recommendations for future
research in this area.

91
CHAPTER FIVE: SUMMARY AND CONCLUSION
Overview of the Study
This chapter summarizes the study and discusses the findings in light of
the research question, constructs and components. It is divided into five sections:
Overview, Discussion of Findings, Limitations of the Study, Implications for
Theory and Practice and a Conclusion.
The central question of this study was: What is the correlation between
Learner Autonomy and academic performance in adult learners, as measured by
the constructs and components of the Learner Autonomy Profile-Short Form-
Short Form (LAP-SF-SF)?
Research on Learner Autonomy has been largely confined to validation of
the construct, description of groups, or investigation of Asian student cohorts
(Carr, 1999; Ponton, 1999; and Derrick, 2001). A clear link between LA and
academic performance has not yet been explored which leaves a gap in the
literature of both LA and academic performance.
This study sought to fill this gap by exploring the relationship between the
LAP-SF and academic success as measured by college GPA. In the following
section, the various findings from the study are described and potential reasons
are suggested for them along with a short discussion of the potential importance
of the finding

92
Discussion of Findings
The research study resulted in six major findings. These included overall
correlation, construct correlation, component correlation, strongest correlation,
general strength of correlation and the positive nature of the correlations.
Overall Correlation
The first major finding of the study was that a positive, significant
correlation was found between the Total Score on the LAP-SF and GPA. This
may be due to the fact that many of the components in the LAP-SF are seen as
contributors to academic success. This is important because it points to the
possibility that the LAP-SF may be seen as a diagnostic tool for helping to
identify areas for improvement that can positively impact GPA – and thus
academic success.
Indeed, while GPA is one of the most popular proxies for academic ability
(Grove, Wasserman and Grodner, 2006), it – like most proxies – still only
accounts for a small fraction of the variability in academic performance (Tross et
al., 2000). Part of this may lie in the fact that GPA is a single measure that cannot
be parsed to investigate further. Conversely, the LAP-SF, which correlates
significantly with GPA, can be parsed into four major constructs and 22
components, thus allowing for meaningful questions about the elements that
impact an individual’s academic success.

93
Construct Correlation
The second major finding has to do with the relationship between the four
constructs and GPA. In the study it was determined that all four of the constructs
had a significant correlation with GPA. However, three of the four constructs had
a significant relationship with GPA at the .05 level while one had a significant
relationship at the .01 level.
This may be due to the specific components that make up each of the
constructs and that make them each unique. Combined they make a significant
predictor of GPA, but separately they do not always do so by the same amount.
This is important because if the LAP-SF is to be used as a diagnostic tool, it is
important to determine which parts are most helpful in fulfilling this requirement.
That the four constructs differ in correlation is not surprising given that
prediction of academic performance – especially traditional measures) is
inherently difficult (Mouw & Khanna, 1993). This has been found to be true for
intellectual predictors (Gustafson, 1999) and personality predictors (Tross et al.,
2000). It seems that throughout the literature, even the best predictors don’t
explain all the variation thus a predictor that correlates significantly with GPA but
that also offers many components to it would seem to be advantageous for future
research.

94
Component Correlation
Another important finding dealt with the individual components that make
up the LAP-SF. It was found that only nine individual components have a
significant relationship with GPA while 13 did not. This may be true because of
the varying degrees by which they support specific ends like higher grades. This
is important because effort to improve specific components may have varying
degrees of impact on academic success as measured by GPA. Knowing which
areas to concentrate on can lead to better results and more focused efforts for
students and educators.
It is interesting to speculate whether the same breakout of components
would occur in a sample of self-directed learners. As Speark and Mocker (1981)
pointed out, in formal learning the student controls neither the subject matter nor
the process while in self-directed learning the student controls both. It is possible
that some components favor one situation over the other so this is an area that
might be fruitful for further research.
Strongest Correlation
The next major finding is that a few components were much stronger than
the rest in terms of correlation coefficient. The strongest correlation was between
the Planning Component and GPA with a coefficient of .275. This was closely
followed by the Self-Regulation Component at .270. Planning would not seem to
be a surprise as a strong predictor of GPA in that so much of study is tied to

95
planning and overall preparation. (See Tross, 2000, discussion on the importance
of conscientiousness in academic success).
The importance of this finding is that it demonstrates the most important
areas for focus in development in order to diagnose and perhaps improve GPA. It
is important to consider that while some components are more significantly
correlated with GPA than others, that since the Total LAP-SF score is
significantly correlated with GPA, these “non-significant” measures still may
have value in helping to diagnose a gap between academic potential and
performance.
Strength of Correlation
The penultimate major finding was that the overall strength of correlations
was fairly weak. Though many of the constructs and components – and the total
LAP-SF score – had significant correlations with GPA, none had a correlation
coefficient greater than .275. This indicates that a relationship does exist but it is
not definitive.
This may be due to the limited number of participants and suggests a need
for further research. This is important because if the LAP-SF is to become a tool
for diagnosis and improvement in academic performance, the strength of its
predictive power must be better understood. Though the correlation is fairly weak,
it is important to note that many other predictors of academic success have

96
correlations with an r-squared of less than .25 – leaving a great deal of
unexplained variance (Mouw & Khanna, 1993).
Positive Nature of Correlations
The final major finding of the study was the positive nature of the
correlations. All four constructs, each of the 22 components and the total LAP-SF
score correlated with GPA positively. This indicates that changes in the LAP-SF
elements track consistently with GPA and may be due to the fact that LAP-SF
elements in general are good predictors of success at any endeavor – it also points
to an interesting topic for further research.
The positive nature of the correlation is important because it points toward
a better understanding of the reasons why the relationship exists. Finding proxies
like this for GPA can only strengthen the canon of adult learning and academic
success literature.
Though foundational figures like Houle (1961), Knowles (1968, 1980) and
Bandura (1977) still have important things to say about how we learn and how
that learning is measured, we still have a great deal of questions about
measurement of academic success (Mouw & Khanna, 1993) and the LAP-SF may
be an important tool for helping to answer them. See Table 61, below, for a
summary of the major findings discussed in this section.

97
Table 61 – Summary of Findings
Finding Importance References
Overall Correlation . There
was a positive, significant
relationship found between
the LAP-SF and GPA.
The LAP-SF may potentially be
used as a diagnostic tool for
helping students to improve
grades.
Grove,
Wasserman and
Grodner, 2006;
Tross et al.,
2000
Construct Correlation.
Three constructs had a
significant correlation at the
.05 level while one was
correlated at the .01 level.
If the LAP-SF is to be used as a
diagnostic tool for improving
academic success it is important
to know which parts are most
helpful in doing so.
Mouw &
Khanna, 1993;
Gustafson, 1999
Component Correlation.
Nine of the components had
significant correlations
while 13 did not.
Different components may have
varying degrees of impact on a
student’s academic performance.
Knowing which components
impact a student most may help
them to focus their efforts on
improvement.
Spear &
Mocker, 1981

98
Strongest Correlation.
The strongest correlation
found was for the Planning
component which had a
coefficient of .275.
Planning, closely followed by
Self-Regulation, appeared to be
the most closely correlated with
GPA. Knowing this may help to
inform further study into the
usefulness of the LAP-SF as a
diagnostic tool for improving
academic success for students.
Tross, 2000
Strength of Correlations.
The correlations between
the Total LAP-SF,
constructs and components
included many that were
significant, however, the
overall strength of
correlations was fairly
weak.
The relative weakness of the
correlations may point toward
the need for a larger sample of
students or to the inherent
difficulties of survey research; it
is important to note that most
proxies for academic success
(including GPA) have an R-
Squared of less than .25.
Mouw &
Khanna, 1993
Positive Nature of
Correlations. The Total
LAP-SF, all four constructs
That all the elements of the
LAP-SF had a positive
correlation with GPA points to
Houle, 1961;
Knowles, 1968,
1980; Bandura,

99
and each of the 22
components had a positive
relationship with GPA.
the stability of the instrument for
predicting academic success and
to the need for further research
to investigate this relationship.
1977; Mouw &
Khanna, 1993
Limitations of the Study
While this study has important implications for adult learning, academic
performance and learner autonomy, it is important to recognize the limitations
related to the effort. This study is limited by a number of constraints including the
following:
1) The sample consisted of students enrolled at a single university in
the Mid-Atlantic region of the United States. Therefore, the results
may not be generalizable to all college students throughout the
country.
2) The university used for this study was a private institution so the
findings may not be the same as those that would be found at a public or state
university.
3) Though the instrument seeks to minimize it, it is possible that the
nature of a survey-based study may introduce issues such as question ambiguity,
personal bias and lack of knowledge by the respondent.

100
4) Because this is not a longitudinal study, the overall stability of the
study may be subject to question.
Implications for Theory and Practice
The results of the study suggested a number of implications. These can be
divided into either theoretical or practical impacts. This section describes those
implications first for theory, then for practice.
For Theory
The first implication has to do with the literature on Learner Autonomy,
where a relationship between LA and academic performance as measured by GPA
has not been fully explored. Previous studies (Carr, 1999; Ponton, 1999; Derrick,
2001; Meyer, 2001) have sought to validate the theory of LAP and to describe
different kinds of populations in terms of LAP.
A gap exists in the literature in terms of showing that Learner Autonomy
can serve as a diagnostic tool because of its potential relationship with academic
success in the form of GPA. Further study in this area is warranted and may lead
to a new way of looking at the utility of Learner Autonomy that will benefit
student and educator alike such as emergency intervention for at-risk students.
One way to do this would be to study the correlation of the LAP-SF and GPA in a
much larger group. Similarly, researching this correlation in a longitudinal study
may also point to an important link between them.

101
A second implication for the literature on academic performance, where
most of the focus is on the educational needs of children. Here there is a dearth of
research on adult learners – particularly in terms of Learner Autonomy. By adding
learner autonomy to this canon researchers and educators may find that the LAP
(or its constructs or components) can lead them to better answers as to why some
students succeed while other do not meet their goals.
A third implication for theory is in the area of adult learning. By tying
together Learner Autonomy and Academic Success, a foundation has been laid
that should be continued. Though many studies have looked at both ideas, none to
date have looked to see how they inter-relate with one another. Questions that
remain to be answered include: Can the LAP-SF be used as a diagnostic tool for
intervention in cases of underperformance? Should the LAP-SF be used for such
purposes? Is the LAP-SF more correlated with GPA as one ages?
A final implication for research would be extend the work of Houle (1961)
who had identified different reasons why adult learners choose to participate in a
learning experience. It would be interesting to study if there is a relationship
between a person’s motivation to learn and their scores on the LAP-SF.
For Practice
The first practical implication of the study has to do with the Learner
Autonomy Profile (Short Form). As more research is done on the theory of

102
Learner Autonomy and on the instruments that measure it, a body of knowledge is
being built that helps us to understand the place of Learner Autonomy in the
canon of adult learning. This study helps to do that by tying Learner Autonomy
with an important indicator of academic success. One way to do this might be to
use the LAP-SF in an interventional study in which students who’s academic
success does not meet their potential. The students could take the instrument and,
based on their scores, could receive training. A follow up could then assess how
(or if) their degree of academic success improved after the intervention.
Next, this study provides a practical benefit in that it will help allow
students and schools to capitalize on their investment. By helping to show
elements of the LAP-SF that have relationships with academic success in the form
of GPA, we add to the understanding of why some students succeed while others
do not meet their educational goals.
This is particularly important given the large investment that students
make in their education - and that institutions make in their students. For students
this means the time and money they spend in attempting to earn a degree. For
educators this means the graduation rate which is tied to school ranking and
overall prestige.
Another interesting implication for practice might be the usability of the
LAP-SF in the non-collegiate learning environment (i.e. corporate training). It
seems plausible that a relationship exists between learner autonomy and learning

103
in any kind of environment, including the workplace, but to date this has not been
established conclusively.
A final implication for practice has to do with the nature of counseling. In
many educational settings a student who does not feel they are meeting their (or
their school’s) academic expectations will speak with a mentor, counselor or
tutor. The suggestions for improvement typically tend to center on the subject
being studied rather than on the individual who is undergoing the study. Using the
LAP-SF as a diagnostic tool may help to move the focus from the work to the
individual.
Concluding Remarks
This study sought to explore the relationship between learner autonomy
and academic success as measured by college GPA. Its findings suggest that there
is a positive, significant relationship between the two but that further study is
required to best understand how the two relate and to what extent they influence
each other.
Doing so will help to improve the literature for adult learning, learner
autonomy and academic success – and more importantly may lead to another set
of diagnostic tools for helping students and educators to get the most out of their
learning investment. In terms of practice, use of the LAP-SF may lead to
interventional tools that start with diagnosis of learning needs and result in

104
improved academic success. Moreover, use of the LAP-SF may change the focus
of performance counseling from the subject being taught, to the needs of the
individual.

105
References
Alreck, P & Settle, R. (1994). The survey research handbook, New York:
McGraw-Hill.
Braunstein, A., McGrath, M. and Pescatrice, D. (2000). Measuring the Impact of
Financial Factors on College Persistence. Journal of College Student
Retention, 2000, 2 (3), 191-203.
Carr, Paul B. (1999). The measurement of resourcefulness intentions in the adult
autonomous learner. (Doctoral dissertation, The George Washington
University, 1999)_Dissertation Abstracts International.
Chaker, A.M. (2003). Why colleges Scoff at Your Kid’s GPA. Wall Street Journal,
July 24, D1-2.
Chater, N. (2000, October). The logic of human learning. Nature, 407, 572-573.
Confessore, G. (1992). An introduction to the study of self-directed learning. In
G.J. Confessore & S.J. Confessore (Eds.), Guideposts to self-directed
learning: Expert commentary on essential concepts (pp. 1-6). King of
Prussia, PA: Organization Design and Development, Inc.
Confessore, G. (2000). Validation of the Learner Autonomy Profile,
Version 3.0 and Extraction of the Short Form, Unpublished Manuscript
Provided by the Author.
Confessore, S. & Kops, W. (1998). Self-directed learning and the learning
organization: Examining the connection between the individual and the

106
learning environment. Human Resource Development Quarterly, 9 (4),
370-371.
Creswell, J.W. (2003). Research design: Qualitative, Quantitative and Mixed
Methods Approaches. Thousand Oaks, CA, Sage Publications.
DeBerard, Scott, Spielman, Glen & Julka, Deana (2004). Predictors of
Academic performance and Retention Among College Freshmen: A
Longitudinal Study. College Student Journal, March 2004, 66-84.
Derrick, M.G. (2000). The measurement of intentions to exhibit persistence in
adult autonomous learners. (Doctoral dissertation, The George
Washington University Washington, D.C.)
Ferber, M., Birnbaum B. & Green, C. (1983). Gender differences in
Economic Knowledge: a Reevaluation of the Evidence. Journal of
Economic Education, 14, 24-37.
Fontaine, R.H. (1996). Participation in Self-Directed Learning by Older Adults
(Doctoral Dissertation, University of Southern Mississippi, 1996).
Abstract from: Dissertation Abstracts International, Accession Number:
1564958.
Galton, F. (1869). Hereditary Genius: An Inquiry Into its Laws and
Consequences. London, Macmillan.
Goldberg, E. (2001). The executive Brain: Frontal Lobes and the Civilized Mind.
New York, Oxford University Press.

107
Gustafsson, J.E. (1999). Measuring and understanding G: Experimental and
correlation approaches. In P. L. Ackerman, P. C. Kyllonen, & R. D.
Roberts (Eds.), Learning and individual differences: Process, trait, and
content determinants, Washington, DC: American Psychological
Association, 275-289.
Houle, C.O. (1961). The inquiring Mind. Norman, OK Center for Continuing
Professional and Higher Education.
Jensen, A. R. (1998). The g factor. Westport, CT: Praeger.
Johnstone, J.W.C. & Rivera, R.J. (1965). Volunteers for learning. Chicago:
Aldine Publishing Company.
Kanji, G. (1999). 100 Statistical Tests, Thousand Oaks, CA: Sage.
Knight, P. (2002). Summative Assessment in Higher Education: practices in
disarray. Studies in Higher Education, 27-3.
Knowles, M. (1980). Modern practice of adult, education: From pedagogy to
andragogy. San Francisco, CA: Jossey-Bass Publishers.
Lavin, D. (1965), The Prediction of Academic Performance: A Theoretical
Analysis and Review of Research. Russell Sage Foundation, New York.
Merriam, Sharan and Caffarella, Rosemary (1991) Learning in adulthood. San
Francisco: Jossey-Bass.
Meyer (2001). Learner Autonomy Dissertation: Validating the Learner Autonomy
Profile. The George Washington University. Dissertation Abstracts.

108
Mezirow, J. (1988). On Critical Reflection. Adult Education Quarterly, 48 (3),
185-198.
Mouw, J.T. and Khanna, R.K. (1993). Prediction of Academic performance: A
Review of the Literature and Some Recommendations. College Student
Journal, 27, 328-336.
Plato (399 B.C.). Apology. Translated by G.M.A. Grube, Hackett Publishing,
Indianapolis, IN, 1981. 23-44.
Plomin, R. (1999, December). Genetics and General Cognitive Ability. Nature,
402, C25-C29.
Ponton, M.K. and Confessore, G. (1998). Characteristic Behaviors of Personal
Initiative: a Conate Associated with Self-Directed Learning. Paper
Presented at the International Symposium of Self-Directed Learning,
Kissimmee, FL.
Ponton, M.K. (1999). Validating the components of the learner autonomy profile.
(Doctoral dissertation, The George Washington University,
1999)_Dissertation Abstracts International.
Purkey, W. (1970). Self concept and School Achievement. Prentice-Hall,
Englewood Cliffs, New Jersey.
Rode, J.C., Arthaud-Day, M.L., Mooney, C.H., Near, J.P., Baldwin, T.T.,

109
Bommer, W.H., and Rubin, R.S (2005). Life satisfaction and Student
Performance. Academy of Management Learning & Education, 4 (4),
421-433.
Shivpuri, Smriti; Schmitt, Neal; Oswald, Frederick and Kim, Brian (2006).
Individual Differences in Academic Growth: Do They Exist, and Can We
Predict Them? Journal of College Student Development, 47 (1), 69.
Thompson, S. (1992). Sampling, New York: Wiley. Tross, S., Harper, J., Osher, L. and Kneidinger, L. (2000). Not just the usual cast
of characteristics: Using personality to predict college performance and
retention. Journal of College Student Development, May/June 2000, 41
(3), 323-334.
Willingham, W. (1985). Success in College: The Role of Personal Qualities and
Academic Ability. College Entrance Examination Board, New York.
Wood R.E. and Atkins P. (2000): “Self-efficacy and strategy on complex tasks”
Applied psychology: An international review 49 (3), pp. 430-446.

110
Appendix A – Cover Letter
May 1, 2006
Dear Student,
Thanks for your interest in a research study that I am conducting that
relates to learner autonomy. As you may know, the concept of learner autonomy
is important in the field of adult education. With your help I hope to find out some
implications that have yet to be studied – and that may help educators to design
courses and training that are more effective.
Your participation in this study will be important, but luckily, won’t take
much of your time. Once you’ve signed and returned the consent form attached
here [IRB form will be attached], I will assign you an ID# and password. These
will allow you to access and use an online instrument that assesses learner
autonomy. Your responses will be kept in strictest confidence and measures will
be in place to protect your identity. When the study is completed, if you request it,
a copy of the findings for the study will be forwarded to you. Thanks again for
your participation in this important study!
Sincerely,
William C. Lowe

111
Appendix B – Learner Autonomy Profile Questions1
1. Permission to use this excerpt has been requested but not yet approved Survey is the property of the copyright owner: HRD Enterprises

112

113

114

115

116

117

118
Appendix C – IRB Review and Approval

119
Figure 4 – IRB Approval

120
Figure 5 – Study Information Sheet
121

122
Figure 6 – Sample Advertisement