a cosmological framework for the co# evolution of quasars
TRANSCRIPT

A Cosmological Framework for the Co#evolution of Quasars, SupermassiveBlack Holes, and Elliptical Galaxies.
I. Galaxy Mergers and Quasar ActivityThe Harvard community has made this
article openly available. Please share howthis access benefits you. Your story matters
Citation Hopkins, Philip F., Lars Hernquist, Thomas J. Cox, and Dušan Kereš.2008. “A Cosmological Framework for the Co#evolution of Quasars,Supermassive Black Holes, and Elliptical Galaxies. I. Galaxy Mergersand Quasar Activity.” The Astrophysical Journal Supplement Series175 (2): 356–89. https://doi.org/10.1086/524362.
Citable link http://nrs.harvard.edu/urn-3:HUL.InstRepos:41381603
Terms of Use This article was downloaded from Harvard University’s DASHrepository, and is made available under the terms and conditionsapplicable to Open Access Policy Articles, as set forth at http://nrs.harvard.edu/urn-3:HUL.InstRepos:dash.current.terms-of-use#OAP

arX
iv:0
706.
1243
v2 [
astr
o-ph
] 18
Jun
200
7SUBMITTED TO APJ, JUNE 8, 2007Preprint typeset using LATEX style emulateapj v. 08/22/09
A COSMOLOGICAL FRAMEWORK FOR THE CO-EVOLUTION OF QUASARS, SUPERMASSIVE BLACK HOLES,AND ELLIPTICAL GALAXIES: I. GALAXY MERGERS & QUASAR ACTIVIT Y
PHILIP F. HOPKINS1, LARS HERNQUIST1, THOMAS J. COX1, & D UŠAN KEREŠ1
Submitted to ApJ, June 8, 2007
ABSTRACTWe develop a model for the cosmological role of mergers in theevolution of starbursts, quasars, and
spheroidal galaxies. By combining theoretically well-constrained halo and subhalo mass functions as a func-tion of redshift and environment with empirical halo occupation models, we can estimate where galaxies ofgiven properties live at a particular epoch. This allows us to calculate, in ana priori cosmological manner,where major galaxy-galaxy mergers occur and what kinds of galaxies merge, at all redshifts. We compare thiswith the observed mass functions, clustering, fractions asa function of halo and galaxy mass, and small-scaleenvironments of mergers, and show that this approach yieldsrobust estimates in good agreement with obser-vations, and can be extended to predict detailed propertiesof mergers. Making the simple ansatz that major,gas-rich mergers cause quasar activity (but not strictly assuming they are the only triggering mechanism), wedemonstrate that this model naturally reproduces the observed rise and fall of the quasar luminosity densityfrom z= 0−6, as well as quasar luminosity functions, fractions, host galaxy colors, and clustering as a functionof redshift and luminosity. The recent observed excess of quasar clustering on small scales atz∼ 0.2− 2.5 is anatural prediction of our model, as mergers will preferentially occur in regions with excess small-scale galaxyoverdensities. In fact, we demonstrate that quasar environments at all observed redshifts correspond closelyto the empirically determined small group scale, where major mergers of∼ L∗ gas-rich galaxies will be mostefficient. We contrast this with a secular model in which quasar activity is driven by bars or other disk insta-bilities, and show that while these modes of fueling probably dominate the high-Eddington ratio population atSeyfert luminosities (significant atz= 0), the constraints from quasar clustering, observed pseudobulge popu-lations, and disk mass functions suggest that they are a small contributor to thez& 1 quasar luminosity density,which is dominated by massive BHs in predominantly classical spheroids formed in mergers. Similarly, low-luminosity Seyferts do not show a clustering excess on smallscales, in agreement with the natural prediction ofsecular models, but bright quasars at all redshifts do so. Wealso compare recent observations of the colors ofquasar host galaxies, and show that these correspond to the colors of recent merger remnants, in the transitionregion between the blue cloud and the red sequence, and are distinct from the colors of systems with observedbars or strong disk instabilities. Even the most extreme secular models, in which all bulge (and therefore BH)formation proceeds via disk instability, are forced to assume that this instability acts before the (dynamicallyinevitable) mergers, and therefore predict a history for the quasar luminosity density which is shifted to earliertimes, in disagreement with observations. Our model provides a powerful means to predict the abundance andnature of mergers, and to contrast cosmologically motivated predictions of merger products such as starburstsand AGN.Subject headings:quasars: general — galaxies: active — galaxies: evolution —cosmology: theory
1. INTRODUCTION
1.1. Motivation
Over the past decade, observations have established thatsupermassive black holes likely reside in the centers of allgalaxies with spheroids (e.g., Kormendy & Richstone 1995;Richstone et al. 1998; Kormendy & Gebhardt 2001), andthat the properties of these black holes and their hosts arecorrelated. These correlations take various forms, relatingthe black hole mass to e.g. the mass (Magorrian et al.1998; McLure & Dunlop 2002; Marconi & Hunt 2003;Häring & Rix 2004), velocity dispersion (Ferrarese & Merritt2000; Gebhardt et al. 2000; Tremaine et al. 2002), andconcentration or Sersic index (Graham et al. 2001;Graham & Driver 2006) of the spheroid. Most recently,Hopkins et al. (2007c) have demonstrated that these relation-ships are not independent and can be understood as variousprojections of a black hole fundamental plane analogous to
1 Harvard-Smithsonian Center for Astrophysics, 60 Garden Street, Cam-bridge, MA 02138
the fundamental plane for elliptical galaxies (Dressler etal.1987; Djorgovski & Davis 1987). The striking similaritybetween these two fundamental planes indicates that galaxyspheroids and supermassive black holes are not formedindependently, but originate via a common physical process.
Furthermore, although there may be some relatively weakevolution in the correlation between BH mass and hostmass or velocity dispersion owing to changes in spheroidstructural properties and internal correlations with redshift(e.g., Peng et al. 2006; Shields et al. 2003, 2006; Walter et al.2004; Salviander et al. 2006; Woo et al. 2006; Hopkins et al.2006e), the fundamental plane appears to be preserved(Hopkins et al. 2007c), and in any casesomecorrelation existsat all redshifts. There are not, at any redshifts, bulgelesssys-tems with large black holes or bulges without correspondinglylarge black holes. This empirically demonstrates that what-ever process builds up black hole massmusttrace the forma-tion of spheroids (albeit with potentially redshift-dependentefficiency).
These connections extend to other phenomena associ-

2 Hopkins et al.
ated with galaxies that have sometimes been interpreted asbeing independent. For example, by estimating the to-tal energy radiated by quasars, Soltan (1982) showed thatnearly all the mass in supermassive black holes must havebeen accumulated during periods of bright quasar activ-ity. This analysis has since been revisited on a num-ber of occasions (Salucci et al. 1999; Yu & Tremaine 2002;Marconi et al. 2004; Shankar et al. 2004; Yu & Lu 2004),with various assumptions for quasar obscuration and bolomet-ric corrections. Hopkins et al. (2007e) have reformulated theSoltan argument from the evolution of thebolometricquasarluminosity function (LF). In their analysis, Hopkins et al.combined observations of the quasar LF in a variety of wave-bands with purely empirical determinations of the luminos-ity dependence of quasar obscuration and spectral emissionto infer the bolometric quasar LF. By integrating this over lu-minosity and redshift, it is then possible to obtain amodel-independentestimate of the total energy density of radiationfrom quasars. The cosmic black hole mass density then fol-lows if black holes in quasars accrete with constant radia-tive efficiencyǫr (Shakura & Sunyaev 1973), by integratingLbol = ǫr MBH c2. This yields az= 0 black hole mass density of
ρBH(z= 0) = 4.81+1.24−0.99
(0.1ǫr
)
h270×105M⊙ Mpc−3, (1)
consistent with estimates ofρBH(z = 0) obtained from lo-cal bulge mass, luminosity, and velocity dispersion functions(e.g., Marconi et al. 2004; Shankar et al. 2004).
Taken together, the black hole fundamental plane andthe Soltan argument imply that the common physical pro-cess which produces galaxy spheroids and supermassiveblack holes also must be responsible for triggeringmostbright quasars. Moreover, there is compelling evidencethat quasar activity is preceded by a period of intensestar formation in galaxy centers so that, for example, ul-traluminous infrared galaxies (ULIRGs) and distant sub-millimeter galaxies (SMGs) would eventually evolve intoquasars (Sanders et al. 1988a,c; Sanders & Mirabel 1996;Dasyra et al. 2006b). Essentially all sufficiently deep stud-ies of the spectral energy distributions (SEDs) of quasarhost galaxies reveal the presence of young stellar pop-ulations indicative of a recent starburst (Brotherton et al.1999; Canalizo & Stockton 2001; Kauffmann et al. 2003;Yip et al. 2004; Jahnke et al. 2004a,b; Sánchez et al. 2004;Vanden Berk et al. 2006; Barthel 2006; Zakamska et al.2006). There further appears to be a correlation in the sensethat the most luminous quasars have the youngest host stel-lar populations (Jahnke et al. 2004a; Vanden Berk et al. 2006)and the greatest prominence of post-merger tidal features anddisturbances (Canalizo & Stockton 2001; Kauffmann et al.2003; Hutchings et al. 2003; Hutchings 2003; Hutchings et al.2006; Zakamska et al. 2006; Letawe et al. 2006). These ob-servations indicate that intense starbursts must result from thesame process as most quasars and supermassive black holes.
In the simplest interpretation, we seek an explanation forthe various phenomena summarized above such that they re-sult from thesame event. There are general, theoretical re-quirements that any such event must satisfy. In particular,itmust be fast and violent, blend together gas and stellar dynam-ics appropriately, and involve a supply of mass comparable tothat in large galaxies. Why should this be the case?
The accepted picture for the growth of supermassive blackholes is that the mass is primarily assembled by gas accretion
(Lynden-Bell 1969). From the Soltan argument, we knowthat this mass must be gathered in a time comparable to thelifetimes of bright quasars, which is similar to the Salpeter(1964) time∼ 107.5 years, for black holes accreting at theEddington rate. Independent limits (Martini 2004, and refer-ences therein) from quasar clustering, variability, luminosityfunction evolution, and other methods demand atotal quasarlifetime (i.e. duration of major growth for a given BH) of. 108.5yr. In order to explain the existence of black holeswith masses∼ 109M⊙, the amount of gas required is likelycomparable to that contained in entire large galaxies. Thus,the process we seek must be able to deliver a galaxy’s worthof gas to the inner regions of a galaxy on a relatively shorttimescale,≪ 109 years.
If this event is to simultaneously build galaxy spheroids, itmust involve stellar dynamics acting on a supply of stars sim-ilar to that in large galaxies because the stellar mass is∼ 1000times larger than that of the black hole and it is believed thatspheroids are assembled mainly (albeit not entirely) throughdissipationless physics (i.e. the movement of stars from a cir-cular disk to random spheroid orbits). A plausible candidateprocess is violent relaxation (e.g. Lynden-Bell 1967) whichhas been demonstrated to yield phase space distributions akinto those of elliptical galaxies through large, rapid fluctuationsin the gravitational potential. Violent relaxation operates on atimescale similar to the free-fall time for self-gravitating sys-tems, again≪ 109 years for the bulk of the mass.
Motivated by these considerations, Hopkins et al. (2006a)developed a model where starbursts, quasars, supermas-sive black hole growth, and the formation of red, ellipti-cal galaxies are connected through an evolutionary sequence,caused bymergersbetweengas-rich galaxies. There is,in fact, considerable observational evidence indicating thatmergers are responsible for triggering ULIRGs, SMGs, andquasars (see references in Hopkins et al. 2006a; for re-views see Barnes & Hernquist 1992; Schweizer 1998; Jogee2004). Furthermore, the long-standing “merger hypothesis,”which proposes that most elliptical galaxies formed in merg-ers (Toomre & Toomre 1972; Toomre 1977), is supportedby the structure of known ongoing mergers (e.g., Schweizer1992; Rothberg & Joseph 2006a,b) and the ubiquitous pres-ence of fine structures such as shells, ripples, tidal plumes,nuclear light excesses, and kinematic subsystems in ellipticals(e.g. Schweizer & Seitzer 1992; Schweizer 1996), which aresignatures of mergers (e.g. Quinn 1984; Hernquist & Quinn1987; Hernquist & Spergel 1992; Hernquist & Barnes 1991;Mihos & Hernquist 1994a).
Numerical simulations performed during the past twentyyears verify thatmajor mergers ofgas-rich disk galaxiescan plausibly account for these phenomena and have eluci-dated the underlying physics. Tidal torques excited duringamerger lead to rapid inflows of gas into the centers of galax-ies (Hernquist 1989; Barnes & Hernquist 1991, 1996). Theamount of gas involved can be a large fraction of that inthe progenitor galaxies and is accumulated on roughly a dy-namical time in the inner regions,≪ 109 years (Hernquist1989). The resulting high gas densities trigger starbursts(Mihos & Hernquist 1994b, 1996), and feed rapid black holegrowth (Di Matteo et al. 2005). Gas consumption by the star-burst and dispersal of residual gas by supernova-driven windsand feedback from black hole growth (Springel et al. 2005a)terminate star formation so that the remnant quickly evolvesfrom a blue to a red galaxy. The stellar component of the pro-

Co-Evolution of Quasars, Black Holes, and Galaxies I 3
genitors provides the bulk of the material for producing theremnant spheroid (Barnes 1988, 1992; Hernquist 1992, 1993)through violent relaxation.
The simulations also place significant constraints on thetypes of mergers that can initiate this sequence of events.First, a major merger is generally required in order for thetidal forces to excite a sufficiently strong response to set upnuclear inflows of gas. Although simulations involving minormergers with mass ratios∼ 10 : 1 show that gas inflows canbe excited under some circumstances (e.g. Hernquist 1989;Hernquist & Mihos 1995; Bournaud et al. 2005), a systematicstudy indicates that such an outcome is limited to specific or-bital geometries (Younger et al. 2007) and that the overall ef-ficiency of triggering inflows declines rapidly with increas-ing mass ratio. Thus, while the precise definition of a ma-jor merger in this context is blurred by the degeneracy be-tween the mass ratio of the progenitors and the orbit of theinteraction, it appears that a mass ratio∼ 3 : 1 or smalleris needed. This is further supported by observational stud-ies (Dasyra et al. 2006a; Woods et al. 2006), which find thatstrong gas inflows and nuclear starbursts are typically seenonly below these mass ratios, despite the much greater fre-quency of higher mass-ratio mergers.
Second, the merging galaxies must contain a supply ofcoldgas, which in this context refers to gas that is rotationallysup-ported, in order that the resonant response leading to nuclearinflows of gas in a merger be excited. Elliptical galaxies con-tain large quantities of hot, thermally supported gas, but evenmajor mergers between two such objects will not drive thenuclear inflows of gas that fuel rapid black hole growth.
It also must be emphasized that essentially all numeri-cal studies of spheroid kinematics find thatonly mergerscan reproduce the observed kinematic properties of ellipti-cal galaxies and “classical” bulges (Hernquist 1989, 1992,1993; Barnes 1988, 1992; Schweizer 1992; Naab et al. 1999;Naab & Burkert 2003; Naab et al. 2006a,b; Naab & Trujillo2006; Bournaud et al. 2005; Jesseit et al. 2006; Cox et al.2006b). Disk instabilities and secular evolution (e.g. barinstabilities, harassment, and other isolated modes) can in-deed produce bulges, but these are invariably “pseudobulges”(Schwarz 1981; Athanassoula et al. 1983; Pfenniger 1984;Combes et al. 1990; Raha et al. 1991; Kuijken & Merrifield1995; O’Neill & Dubinski 2003; Athanassoula 2005), withclearly distinct shapes (e.g. flattened or “peanut”-shapedisophotes), rotation properties (largev/σ), internal correla-tions (obeying different Kormendy and Faber-Jackson rela-tions), light profiles (nearly exponential Sersic profiles), andcolors and/or substructure from classical bulges (for a re-view, see Kormendy & Kennicutt 2004). Observations indi-cate that pseudobulges constitute only a small fraction of thetotal mass density in spheroids (. 10%; see Allen et al. 2006;Ball et al. 2006; Driver et al. 2007), becoming a large frac-tion of the bulge population only for small bulges in late-typehosts (e.g. Sb/c, corresponding to typicalMBH . 107M⊙; seeCarollo et al. 1998; Kormendy & Kennicutt 2004, and refer-ences therein). Therefore, it is clear that although such pro-cesses may be important for the buildup of the smallest blackhole and spheroid populations, secular evolutioncannotbe theagent responsible for the formation of most elliptical galaxies,or for the buildup of most black hole mass, or the triggeringof bright quasar activity.
We are thus led to suggest a generalization of the merger hy-pothesis proposed by Toomre (1977) whereby major mergersof gas-richdisk galaxies represent the dominant process for
producing the supermassive black hole and spheroid popula-tions in the Universe. Then, by the Soltan argument and theassociation of starbursts with quasars, it follows that this mustalso be the primary mechanism for triggering the most intenseinfrared luminous galaxies and the brightest quasars and ac-tive galactic nuclei (AGN). It is important to keep in mind thatthis does not rule out other processes occurring at lower lev-els and under other circumstances. For example, we are notclaiming that all AGN result from mergers. In fact, low levelsof such activity, as in Seyfert galaxies, often appear in undis-turbed galaxies. For these objects, other modes of fueling arelikely more significant, as in the stochastic accretion scenarioof Hopkins & Hernquist (2006). The primary requirement onour model is that the bulk of the supermassive black hole massdensity should have accumulated through gas-rich mergers,consistent with the redshift evolution of the quasar popula-tion (Hopkins et al. 2007e). Similarly, spheroid evolutionbygas-free (“dry”) mergers will go on, but does not explain howstellar mass is initially moved onto the red sequence or howblack hole mass is initially accreted.
1.2. Outline
To test our hypothesis, we have developed methods for fol-lowing the growth of black holes in numerical simulations ofgalaxy mergers, using a multiphase model for the star-forminggas that enables us to consider progenitor disks with large gasfractions. Generically, we find that major mergers of gas-richgalaxies evolve through distinct phases that can plausiblybeidentified with the various observed phenomena summarizedabove.
Figure 1 presents a schematic outline of these phases. Inthis picture, galactic disks grow mainly in quiescence, withthe possibility of secular-driven bar or pseudobulge forma-tion, until the onset of a major merger. A significant, per-haps even dominant fraction of Seyferts and low-luminosityquasars will almost certainly arise from this secular evolu-tion, but the prevalence of pseudobulges only in the hosts of. 107M⊙ black holes suggests this is limited to luminositiesMB & −23 (see the discussion in § 3.3).
During the early stages of the merger, tidal torques excitesome enhanced star formation and black hole accretion, butthe effect is relatively weak, and the combination of largegalactic dust columns and relatively small nuclear black holesmeans that only in rare circumstances (involving particularinitial orbits and/or bulge-to-disk ratios) will the pair be iden-tified as Seyferts or quasars. Most observationally identi-fied mergers (and essentially all merging pairs) will be inthis stage, and numerical simulations suggest it is the laststage at which the distinct nuclei enable automated morpho-logical selection criteria to efficiently identify the system asa merger (Lotz et al. 2004, 2007). Care must therefore betaken with conclusions regarding the prevalence of starburstsand AGN in these samples, as the small observed incidenceof quasar activity (Dasyra et al. 2006a; Myers et al. 2006b;Straughn et al. 2006; Alonso et al. 2007) is actually expected.
During the final coalescence of the galaxies, massive in-flows of gas trigger starbursts with strengths similar to thoseinferred for ULIRGs and SMGs, although the actual massin stars formed in these bursts is generally small comparedto the stellar mass contributed by the merging disks. Thehigh gas densities feed rapid black hole growth, but theblack holes are obscured at optical wavelengths by gas anddust and are initially small compared to the newly form-ing spheroid. However, by the final stages, high accretion

4H
op
kin
set
al.
FIG. 1.— An schematic outline of the phases of growth in a “typical” galaxy undergoing a gas-rich major merger.Image Credit: (a) NOAO/AURA/NSF; (b) REU program/NOAO/AURA/NSF; (c)NASA/STScI/ACS Science Team; (d) Optical (left): NASA/STScI/R. P. van der Marel & J. Gerssen; X-ray (right): NASA/CXC/MPE/S. Komossa et al.; (e) Left: J. Bahcall/M. Disney/NASA;Right: Gem-ini Observatory/NSF/University of Hawaii Institute for Astronomy; (f) J. Bahcall/M. Disney/NASA; (g) F. Schweizer (CIW/DTM); (h) NOAO/AURA/NSF.

Co-Evolution of Quasars, Black Holes, and Galaxies I 5
rate, heavily obscured (and in some cases nearly Compton-thick) BH growth in a ULIRG stage (often with merg-ing binary BHs) appears ubiquitous (Komossa et al. 2003;Alexander et al. 2005a; Borys et al. 2005; Brand et al. 2006),and by high redshifts (z∼2) may dominate the obscured lumi-nous quasar population (Alexander et al. 2005b; Stevens et al.2005; Martínez-Sansigre et al. 2006; Brand et al. 2007).
Most of the nuclear gas is consumed by the starburstand eventually feedback from supernovae and the blackhole begins to disperse the residual gas. This brief tran-sition or “blowout” phase will be particularly associatedwith highly dust-reddened (as opposed to more highly ob-scured Type II) and/or IR-luminous quasars. As a relativelyshort phase, such objects constitute only∼ 20− 40% of thequasar population, similar to that observed (Gregg et al. 2002;White et al. 2003; Richards et al. 2003, 2006a; Hopkins et al.2004). In fact, observational studies find that red quasarpopulations are related to mergers, with& 75% (and ashigh as 100%) showing clear evidence of recent/ongoingmerging (Hutchings et al. 2003, 2006; Kawakatu et al. 2006;Guyon et al. 2006; Urrutia et al. 2007), with young post-starburst stellar populations (Guyon et al. 2006), much of thedust arising on scales of the galaxy (in turbulent motions, in-flow, and outflow; Urrutia et al. 2007), and extremely highEddington ratios indicative of a still active period - makingthem (as opposed to most fully obscured quasars) a substan-tial contributor to the most luminous quasars in the Universe(White et al. 2003; Hutchings et al. 2006; Zakamska et al.2006). As the dust is removed, the black hole is then visi-ble as a traditional optical quasar (although very small-scale“torus” obscuring structures may remain intact, allowing forsome rare, bright Type II systems).
Here, observations of the host morphology are more am-biguous (see e.g. Bahcall et al. 1997; Canalizo & Stockton2001; Floyd et al. 2004; Zakamska et al. 2006; Pierce et al.2006), but this is expected, for two reasons. First, the pointspread function of the bright and unobscured optical quasarmust be subtracted and host galaxy structure recovered, a dif-ficult procedure. Second, by this time the merger is com-plete and the spheroid has formed, leaving only fading tidaltails as evidence for the recent merger. Mock observationsconstructed from the simulations (Krause et al. 2007) implythat, with the best presently attainable data, these features aredifficult to observe even locally and (for now) nearly impos-sible to identify at the redshifts of greatest interest (z& 1).This appears to be borne out, as Bennert et al. (2007) havere-examined low-redshift quasars previously recognized fromdeep HST imaging as having relaxed spheroid hosts, andfound (after considerably deeper integrations) that everysuchobject shows clear evidence for a recent merger. These dif-ficulties will lead us to consider a number of less direct, butmore robust tests of the possible association between mergersand quasars.
Finally, as the remnant relaxes, star formation and quasaractivity decline as the gas is consumed and dispersed, andthe remaining galaxy resembles an elliptical with a quiescentblack hole satisfying observed correlations between blackhole and spheroid properties. During this intermediate∼Gyrdecay, depending on details of the merger and exact viewingtime, the remnant may be classified as a low-luminosity (de-caying) AGN in a massive (and relatively young) spheroid, oras a post-starburst (E+A/K+A) galaxy. Observationally, thelink between K+A galaxies and mergers is well-established(e.g. Yang et al. 2004; Goto 2005; Hogg et al. 2006, and ref-
erences therein), and there is a clear tendency for these galax-ies to host low-luminosity AGN or LINERs (Yang et al. 2006;Goto 2006). Again, for the reasons given above, the situationis less clear for all low-luminosity AGN (and there will be,as noted above, many such sources driven by secular mech-anisms in disks). But more importantly most objects seenin this stage are expected to have relaxed to resemble nor-mal spheroids. The merger exhausts gas and star formationin an immediate sense very efficiently, so the remnant red-dens rapidly onto the red sequence. If this is also associatedwith quenching of future star formation (see Paper II), thenthespheroid will evolve passively, growing largely by dry merg-ers.
Individual simulations of mergers have enabled us to quan-tify the duration of these stages of evolution and how thisdepends on properties of the merging galaxies, such as theirmasses and gas content and the mass ratio and orbit of the en-counter. In particular, we used the results to suggest a phys-ical interpretation of quasar lifetimes (Hopkins et al. 2005d),to examine how quasars (Hopkins et al. 2005a) and starbursts(Chakrabarti et al. 2007) would evolve in this scenario, andquantify structural properties of the remnant and how theydepend on e.g. the gas fractions of the merging galaxies(Cox et al. 2006a,b; Robertson et al. 2006b,c; Hopkins et al.2007c).
In addition to making predictions for individual systems,we would also like to characterize how entirepopulationsofobjects would evolve cosmologically in our picture to test themodel against the large body of observational data that existsfrom surveys of galaxies, quasars, and starbursts. Previously,we have adopted a semi-empirical approach to this problem,as follows. In our simulations, we can label the outcome bythe final black hole mass in the remnant,MBH, f or, equiva-lently, the peak bolometric luminosity of the quasar,Lpeak.Our simulations predict a regular behavior for the evolution ofthe different merger phases as a function ofMBH, f or Lpeakandalso for the properties of the remnant as a function ofMBH, for Lpeak. If we have an estimate of the observed distributionof systems in one phase of the evolution, we can then use ourmodels to deconvolve the observations to infer the impliedbirthrate of such objects as a function ofMBH, f or Lpeak. Giventhis, the time behavior of the simulations provides a mappingbetween the different phases enabling us to make indepen-dent predictions for other populations. For example, knowingthe observed quasar luminosity function (QLF) at some red-shift, our simulations allow us to predict how many quasar-producing mergers of a given mass must be occurring at thetime, which can then be tested against the observed mergerstatistics.
We exploited this approach to examine the relationship be-tween the abundance of quasars and other manifestations ofquasar activity, and showed that our model for quasar life-times and lightcurves yields a means to interpret the shapeof the QLF (Hopkins et al. 2005b), provides a consistent ex-planation for observations of the QLF at optical and X-rayfrequencies (Hopkins et al. 2005c), explains observed evolu-tion in the faint-end slope of the QLF (Hopkins et al. 2006b),and can account for the spectral shape of the cosmic X-raybackground (Hopkins et al. 2006a, 2007e). Using this tech-nique to map between different types of objects, we demon-strated that the observed evolution and clustering of the quasarpopulation is consistent with observations of red galaxies(Hopkins et al. 2006c, 2007d, 2006d) and merging systems(Hopkins et al. 2007a, 2006f), as well as the mass function

6 Hopkins et al.
of supermassive black holes and its estimated evolution withredshift (Hopkins et al. 2006a, 2007e). In each case, we foundgood agreement with observations provided that the mappingswere based on the lifetimes and lightcurves from our mergersimulations and not idealized ones that have typically beenused in earlier theoretical studies. We further showed thatourpicture makes numerous predictions (Hopkins et al. 2007a,2006a) that can be used to test our hypothesis, such as theluminosity dependence of quasar clustering (Lidz et al. 2006).However, the cosmological context of our results was not pro-vided in an entirely theoretical manner because our analysisrelied on an empirical estimate of one of the connected popu-lations.
Obtaining a purely theoretical framework for our scenariois difficult because cosmological simulations including gasdynamics currently lack the resolution to describe the small-scale physics associated with disk formation, galaxy mergers,star formation, and black hole growth. Semi-analytic methodsavoid some of these limitations, but at the expense of parame-terizing the unresolved physics in a manner this is difficulttocalibrate independently of observational constraints. For thetime being, neither approach is capable of making an entirelyab initio prediction for how the various populations we areattempting to model would evolve with time.
In this paper, we describe a strategy that enables us, forthe first time, to provide a purely theoretical frameworkfor our picture. Our procedure is motivated by, but doesnot rely upon, observations suggesting that there is a char-acteristic halo mass hosting bright quasars. This infer-ence follows from measurements of the clustering of quasarsin the 2dF, SDSS, and other surveys (Porciani et al. 2004;Porciani & Norberg 2006; Wake et al. 2004; Croom et al.2005; Coil et al. 2007; Myers et al. 2006a; da Angela et al.2006; Shen et al. 2007) and investigations of the quasar prox-imity effect (Faucher-Giguere et al. 2007; Kim & Croft 2007;Nascimento Guimaraes et al. 2007). By adopting simplemodels for the merger efficiency of galaxies as a function ofenvironment and mass ratio, we show that this characteristichalo mass for quasars corresponds to the most favorable en-vironment for major mergers between gas-rich disks to occur,namely the “small group” scale. This finding argues for an in-timate link between such mergers and the triggering of quasaractivity and naturally leads to a method for determining theredshift evolution of the quasar population from dark mattersimulations of structure formation in aΛCDM Universe.
By combining previous estimates of the evolution of thehalo mass function with halo occupation models and our esti-mates for merger timescales, we infer the statistics of mergersthat excite quasar activity. We then graft onto this our mod-eling of quasar lightcurves and lifetimes, obtained from oursimulations of galaxy mergers that include star formation andblack hole growth to deduce, in anab initio manner, the red-shift dependent birthrate of quasars as a function of their peakluminosities and the corresponding formation rate of blackholes as a function of mass. Because our merger simulationsrelate starbursts, quasars, and red galaxies as different phasesof the same events, we can then determine the cosmologicalformation rate of these various populations and their evolu-tion with redshift. In particular, as we demonstrate in whatfollows, the observed abundance of all these objects is well-matched to our estimates, unlike for other theoretical mod-els, supporting our interpretation that mergers between gas-rich galaxies represent the dominant production mechanismfor quasars, intense starbursts, supermassive black holes, and
elliptical galaxies.We investigate this in a pair of companion papers. Here
(Paper I), we describe our model and use it to investigate theproperties of mergers and merger-driven quasar activity. Inthe companion paper (Hopkins et al. 2007b, henceforth PaperII), we extend our study to the properties of merger remnantsand the formation of the early-type galaxy population. Specif-ically, § 2 outlines our methodology, describing the physi-cal criteria for and identification of major mergers (§ 2.1),the distribution of mergers across different scales and galaxytypes (§ 2.2), and the dependence of mergers on environmen-tal properties (§ 2.3). We then examine the predicted mergermass functions, fractions, and clustering properties fromthismodel, and compare with observations to verify that we areappropriately modeling the merger history of the Universe(§ 2.4). In § 3 we examine the consequences of a generalmodel in which mergers trigger quasar activity. We present anumber of robust predictions both independent of (§ 3.1) andincluding (§ 3.2) physical models for the quasar lightcurvesand duty cycles in mergers. We contrast this with a “secular”model in which quasar activity is caused by disk instabilities(§ 3.3), and show that a variety of independent constraintssuggest that such a mode cannot dominate the formation ofbright, high redshift quasars. We discuss and summarize ourconclusions in § 4.
Throughout, we adopt a WMAP3 (ΩM, ΩΛ, h, σ8, ns) =(0.268, 0.732, 0.704, 0.776, 0.947) cosmology (Spergel et al.2006), and normalize all observations and models shown tothese parameters. Although the exact choice of cosmologymay systematically shift the inferred bias and halo masses(primarily scaling withσ8), our comparisons (i.e. relative bi-ases) are for the most part unchanged, and repeating our cal-culations for a “concordance” (0.3, 0.7, 0.7, 0.9, 1.0) cosmol-ogy or the WMAP1 (0.27, 0.73, 0.71, 0.84, 0.96) results ofSpergel et al. (2003) has little effect on our conclusions. Wealso adopt a diet Salpeter IMF following Bell et al. (2003b),and convert all stellar masses and mass-to-light ratios accord-ingly. Again, the choice of the IMF systematically shifts thenormalization of stellar masses herein, but does not substan-tially change our comparisons.UBV magnitudes are in theVega system, and SDSSugrizmagnitudes are AB.
2. MERGERS
2.1. What Determines Whether Galaxies Merge2.1.1. Physical processes
To begin, we postulate which mergers are relevant to ourpicture. Minor mergers (mass ratios≫ 3 : 1) will not triggersignificant star formation or quasar activity for most orbits,and consequently will neither exhaust a large fraction of thelarger galaxy’s gas supply nor be typically identified as merg-ers observationally. We are therefore specifically interested inmajor mergers, with mass ratios≤ 3 : 1, but note that our con-clusions are unchanged if, instead of this simple threshold, weinclude all mergers and adopt some mass-ratio dependent ef-ficiency (e.g. assuming the fractional BH/bulge growth scaleswith mass ratioR in some power-law fashion,∝ R−1, as sug-gested by numerical simulations; Younger et al. 2007). In thiscase, the decreasing efficiency of BH fueling in minor merg-ers leads (as expected) to the conclusion that they are onlyimportant at low masses/luminosities (similar to where secu-lar activity may dominate quasar populations; see § 3.3), andour predictions for massive bulges and BHs are largely unaf-fected. If the timescale for two galaxies to merge is long com-

Co-Evolution of Quasars, Black Holes, and Galaxies I 7
pared to the Hubble time, they clearly will not have mergedin the actual Universe. However, the merger timescale mustalso be short compared to the time required to tidally strip ordisrupt either of the galaxies – if it is not, then by the time thegalaxies finally coalesce, the end result will simply be tidalaccretion of material at large radii.
This defines two fundamental criteria for galaxy mergers tooccur in the setting of a halo of massMhalo:
• The halo must host at least two galaxies of comparablemass∼Mgal. Note that even for mergers of distinct hosthalos in the field, the halo-halo merger proceeds muchfaster than the merger of the galaxies, so there is someperiod where the two can be considered distinct sub-structures or distinct galaxies within a common host.
• The merger must be efficient – i.e. occur in much lessthan a Hubble time. This requires that the mass of thegalaxies and their associated (bound) dark matter sub-halos be comparable to the mass of the parent halo (e.g.for the simplest dynamical friction arguments, requir-ing Mhalo/Mgal ≪ 30).
Together, these criteria naturally define a preferred massscale for major mergers (host halo massMhalo) for galaxiesof massMgal. A halo of mass〈Mhalo〉(Mgal) typically hostsa galaxy of massMgal. At smaller (relative) halo massesMhalo≪〈Mhalo〉, the probability that the halo hosts a galaxy aslarge asMgal declines rapidly (and eventually must be zero orelse violate limits from the cosmic baryon fraction). At largerMhalo≫ 〈Mhalo〉, the probability that the halo will merge withor accrete another halo hosting a comparable∼ Mgal galaxyincreases, but the efficiency of the merger of these galaxiesdeclines rapidly. Eventually theMgal galaxies are relativelysmall satellites in a large parent halo of massMhalo≫〈Mhalo〉,for which (satellite-satellite) mergers are extremely inefficient(given the high virial velocities of the host, and dynamicalfriction timescales≫ tH).
The preferred major-merger scale for galaxies of massMgalis therefore only slightly larger (factor∼ 2) than the averagehost halo mass for galaxies of this mass. We refer to this asthe small group scale, and emphasize the termsmall in thisname: the average halo of this mass still hosts only 1 galaxyof mass∼Mgal, and the identifiable groups will only consist of2− 3 members of similar mass (although there may of coursebe several much smaller systems in the group, which have lit-tle dynamical effect). This is very different from large groupscales, easily identified observationally, which consist of ≫ 3members.
Figure 2 illustrates several of these points. We adopt themerger timescales derived below and use the halo occupationfits from Wang et al. (2006) to determine the probability of ahalo hosting a pair of galaxies of a given mass: the details ofthe formalism are described below and used throughout, butwe wish to illustrate the key qualitative points. The mergertimescale for galaxies of a given mass is shortest when theyare large relative to their host halo mass, as expected fromdynamical friction considerations. However, the probabilityof a pair being hosted cuts off sharply at low halo masses.Moreover, the contribution to mergers of galaxies of massMgal from larger halos is further suppressed by the simple factthat there are fewer halos of larger masses.
Modern, high-resolution dark matter-only cosmologicalsimulations (e.g. Springel et al. 2005c) have made it pos-sible to track the merger histories of galaxy halos over
0.001
0.010
0.100
1.000
t Hub
ble
/ ⟨t m
erge
r⟩
0.01 M∗
0.1 M∗
M∗
3 M∗
10-6
10-5
10-4
10-3
10-2
⟨N(p
air)
⟩ * (
t Hub
ble
/ ⟨t m
erge
r⟩)
10 11 12 13 14log( Mhalo / h
-1 MO • )
10-8
10-7
10-6
10-5
n(M
halo)
* ⟨N
(pai
r)⟩ *
(t H
ubbl
e / ⟨
t mer
ger⟩)
FIG. 2.— Efficiency of major galaxy mergers (of a certain galaxy massrelative to the characteristic local Schechter-functionM∗) as a function ofhost halo mass (atz = 0, but the results are qualitatively similar at all red-shifts). Top: Merger timescale relative to the Hubble time (assuming a pairof galaxies of massMgal are hosted in a halo of massMhalo) – mergers occurrapidly (tmerger≪ tH) when the halo mass is small relative to the galaxy mass(we temporarily ignore the obvious requirement thatMgal < fbaryonMhalo).Middle: Same, but now multiplied by the probability that the halo actuallyhosts a pair of galaxies of the given mass (technically, within a mass ratio3 : 1), given the empirical halo occupation model from Wang etal. (2006).Although mergers are most rapid in the lowest-mass halos, these halos donot host relatively massive galaxies.Bottom:Same, but further multiplied bythe abundance of halos of a given mass – the fact that the halo mass func-tion and merger efficiency are decreasing functions ofMhalo (for fixed Mgal)means that the contribution to galaxy mergers of a givenMgal will be domi-nated by the lowest-mass halos in which there is a significantprobability toaccrete/host a pair ofMgal galaxies – the small group scale.
large ranges in cosmic time and halo mass. For our pur-poses, the critical information is contained in the subhalomass function, which has been quantified in great detail di-rectly from such simulations (Kravtsov et al. 2004; Gao et al.2004; Nurmi et al. 2006) and from extended Press-Schechtertheory and semi-analytic approaches (Taylor & Babul 2004;Zentner et al. 2005; van den Bosch et al. 2005) calibrated

8 Hopkins et al.
against numerical simulations.When a halo (containing a galaxy and its own subhalo pop-
ulations) is accreted, the accretion process is relativelyrapid– the accreted halo will always be identifiable forsomeperiodof time as a substructure in the larger halo. Although the newsubhalo may lose mass to tidal stripping, there will still besome dark matter subhalo associated with the accreted galaxy,which will remain until the substructure merges with the cen-tral galaxy via dynamical friction or (much more rarely) an-other satellite substructure. Therefore, knowing the subhalopopulations of all halos at a given instant, the calculationof the rate and distribution ofgalaxymergers depends onlyon calculating the efficiency of the subhalo/galaxy mergerswithin these halos. This is a great advantage – we do notneed to calculate halo-halo merger rates, which are not well-defined (even when extracted directly from cosmological sim-ulations) and depend sensitively on a number of definitions(see, e.g. Gottlöber et al. 2001; Maller et al. 2006), but insteadwork from the robust (and well-defined) subhalo mass func-tion (see Gao et al. 2004, and references therein).
This is similar to many of the most recent semi-analyticmodels, which adopt a hybrid approach to determine galaxymergers, in which galaxies survive independently so long astheir host halo remains a distinct substructure, after whichpoint a dynamical friction “clock” is started and the galaxymerges with the central galaxy in its parent halo at the end ofthe dynamical friction time. Fortunately, for our purposesweare only interested in major mergers with mass ratios. 3 : 1.In these cases, dynamical friction acts quickly on the subhalos(infall time . tH/3 at all redshifts), and the primary ambigu-ity will be the galaxymerger time in their merged or mergingsubhalos.
To perform this calculation, we need to know the proper-ties of the merging galaxies. For now, we only want to cal-culate where and when galaxies are merging, not how theyevolved to their present state in the first place. This is our pri-mary reason for not constructing a full semi-analytic model:rather than introduce a large number of uncertainties, theo-retical prescriptions which we are not attempting to test here,and tunable parameters in order to predict that e.g. a 1011M⊙
halo typically hosts a∼ 1010M⊙ star-forming galaxy, we canadopt the established empirical fact that this is so. In de-tail, we populate subhalos according to an empirical halo oc-cupation model (e.g., Tinker et al. 2005; Conroy et al. 2006;Vale & Ostriker 2006; van den Bosch et al. 2006; Wang et al.2006); i.e. matching the observed statistics of where galax-ies of a given type live (accounting for different occupationsfor different galaxy types/colors, and the scatter in galaxieshosted in halos of a given mass).
This is sufficient for most of our predictions. We do notnecessarily need to know exactly how long it will take forthese mergers to occur, only that they are occurring at a givenredshift – i.e. that the objects will merge and that the mergertime is shorter than the Hubble time (which for the mass ratiosof interest is essentially guaranteed). For example, predictingthe clustering of galaxy mergers does not require knowledgeof how rapidly they occur, onlywherethey occur. Even pre-dicting the observed merger mass function does not rely sen-sitively on this information, since the duration over whichthemerger is visible will be comparable (albeit not exactly equal)to the duration over which the merger occurs (such that a fixedfraction∼ 1 of all merging systems are observable).
However, for the cases where it is necessary, we estimate
the timescales for the galaxies to merge and to be identi-fied as mergers. This is the most uncertain element in ourmodel. Part of this uncertainty owes to the large parameterspace of mergers (e.g. differences in orbital parameters, rela-tive inclinations, etc.). These uncertainties are fundamental,but can at least be controlled by comparison to large suitesof hydrodynamic simulations which sample these parameterspaces (Robertson et al. 2006b) and allow us to quantify theexpected range of merger properties owing to these (essen-tially random) differences. The more difficult question is howappropriate any analytic merger timescale or cross sectioncanbe. To address this, we will throughout this paper consider afew representative models:
Dynamical Friction:The simplest approximation is that thegalaxies are point masses, and (once their subhalos merge)they fall together on the dynamical friction timescale. This iswhat is adopted in most semi-analytic models. In fact, this isonly an appropriate description when the galaxies are smallrelative to the enclosed halo mass, and are both moving to thecenter of the potential well – which is often not the case atthese late stages. While unlikely to be incorrect by orders ofmagnitude, this approximation begins to break down when thegalaxies are relatively large compared to their halos (commonin . 1012M⊙ halos) and when the galaxies are very close (andcould e.g. enter a stable orbit). What finally causes galaxiesto merge is not, in fact, simple dynamical friction, but dis-sipation of angular momentum via a resonance between theinternal and orbital frequencies.
Group Capture (Collisional):On small scales, in satellite-satellite mergers, or in the merger of two small field halos, it ismore appropriate to consider galaxy mergers as a collisionalprocess in which there is some effective gravitational crosssection. In other words, galaxy mergers proceed once thegalaxies pass at sufficiently small distances with sufficientlylow relative velocity. There have been a number of theoreti-cal estimates of these cross sections – we adopt here the fit-ting formulae from Krivitsky & Kontorovich (1997), who cal-ibrate the appropriate cross-sections from a set of numericalsimulations of different encounters and group environments.This compares well with other calculations (White 1976;Makino & Hut 1997; Mamon 2006, and references therein),and we find little difference using these alternative estima-tions. For large mass ratios and separations, the expressionsappropriately reduce to the dynamical friction case.
Angular Momentum:Binney & Tremaine (1987) considerthis problem from the perspective of the angular momentum-space in which galaxy mergers are allowed. This approachis similar to the capture estimates above, but accounting forcapture into orbits as well. Whether or not such orbits willmerge is, of course, somewhat ambiguous – it is likely thatsome significant fraction are stable, and will not merge, whileothers decay rapidly owing to resonance between the disk cir-cular frequencies and the orbital frequency. Nevertheless, thisserves to bracket the range of likely merger configurations.
2.1.2. Synopsis of model and uncertainties
Thus, to summarize our approach: at a given red-shift, we calculate the halo mass functionn(Mhalo) forour adopted cosmology following Sheth et al. (2001). Foreach halo, we calculate the (weakly mass and redshift de-pendent) subhalo mass function (or distribution of sub-halos, P[Nsubhalo|Msubhalo, Mhalo]) following Zentner et al.(2005) and Kravtsov et al. (2004). Alternatively, we haveadopted it directly from Gao et al. (2004); Nurmi et al.

Co-Evolution of Quasars, Black Holes, and Galaxies I 9
(2006) or calculated it following van den Bosch et al. (2005);Vale & Ostriker (2006), and obtain similar results. Note thatthe subhalo masses are defined as the masses upon accretionby the parent halo, which makes them a good proxy for thehosted galaxy mass (Conroy et al. 2006) and removes the un-certainties owing to tidal mass stripping.
Mergers are identified by the basic criteria described above.We populate these halos and subhalos with galaxies follow-ing the empirical halo occupation models of Conroy et al.(2006) (see also Vale & Ostriker 2006) normalized directlywith group observations following Wang et al. (2006) atz= 0(considering instead the occupation fits in Yang et al. 2003;Cooray 2005, 2006; Zheng et al. 2005; van den Bosch et al.2006, makes little difference). This determines both the meanstellar mass and dispersion in stellar masses of galaxies hostedby a given halo/subhalo massP(Mgal|Msubhalo), which (op-tionally) can be broken down separately for blue and redgalaxy types.
Figure 3 shows the mean galaxy mass as a function ofhalo mass from this model atz = 0. Since the halo occupa-tion models consider stellar mass or luminosity, we use thebaryonic and stellar mass Tully-Fisher relations calibrated byBell & de Jong (2001) to convert between the two. (We havealso compared the global baryonic mass function estimatedin this manner with that observationally inferred in Bell etal.(2003a) and find good agreement). If necessary, we calcu-late the galaxy-galaxy merger efficiency/timescale using thedifferent estimators described above. Figure 3 also showsthe expected merger efficiency as a function of halo massfor these mean values (i.e. probability of hosting a subhalowithin the appropriate mass range convolved with the calcu-lated merger timescale). The qualitative features are as ex-pected from Figure 2. The different merger timescale estima-tors agree well at large halo masses, with the dynamical fric-tion treatment yielding a somewhat longer (factor. a few)timescale at intermediate masses (but this is near the regimeof low Mhalo/Mgal where the dynamical friction approxima-tion is least accurate).
The main elements and their uncertainties in our model are:1. Halo Mass Function: We begin by computing the over-
all halo mass function. There is very little ambiguity in thiscalculation at all redshifts and masses of interest (z. 6; seee.g. Reed et al. 2007), and we do not consider it a significantsource of uncertainty.
2. Subhalo Mass Function: The subhalo mass functionof each halo is then calculated. Although numerical simula-tions and semi-analytic calculations generally give very simi-lar results (especially for the major-merger mass ratios ofin-terest in this paper, as opposed to very small subhalo popula-tions; see van den Bosch et al. 2005), there is still some (typi-cal factor< 2) disagreement between different estimates. Wetherefore repeat most of our calculations adopting both our“default” subhalo mass function calculation (Zentner et al.2005; Kravtsov et al. 2004) and an alternative subhalo massfunction calculation (van den Bosch et al. 2005) (normalizedto match cosmological simulations as in Shaw et al. 2006),which bracket the range of a number of different estimates(e.g., Springel et al. 2001; Tormen et al. 2004; De Lucia et al.2004; Gao et al. 2004; Nurmi et al. 2006) and demonstrate theuncertainty owing to this choice. The difference is ultimatelynegligible atMgal & 1010M⊙ at all redshifts, and rises to onlya factor∼ 2 atMgal. 1010M⊙ (probably owing to differencesin the numerical resolution of different estimates at low halo
7
8
9
10
11
12
log(
Mga
l / M
O • )
HOD Fit:Baryonic MassStellar Mass
Alternate HOD Fit
10
100
1000
Mha
lo /
Mga
l
10 11 12 13 14log( Mhalo / h
-1 MO • )
0.0
0.2
0.4
0.6
0.8
1.0
⟨N(p
air)
⟩ * (
t Hub
ble
/ ⟨t m
erge
r⟩)
Merger Timescale From:Group
Capture
AngularMomentum
DynamicalFriction
FIG. 3.— Illustration of basic elements of importance to where galaxy-galaxy mergers occur.Top: Average central galaxy stellar (dotted) and bary-onic (solid) mass as a function of host halo mass, in our typically adopted halooccupation model (Conroy et al. 2006; Vale & Ostriker 2006, black), and thealternate halo occupation model from Yang et al. (2003, green; only baryonicmass shown)Middle: Corresponding halo-to-galaxy mass ratio.Bottom:Av-erage major merger timescale/efficiency (calculated as in the middle panel ofFigure 2, but for the appropriate meanMgal(Mhalo)). Timescales are deter-mined as described in the text, from dynamical friction (dot-dashed), groupcapture (solid), or angular momentum (long dashed) considerations.
masses).3. Halo Occupation Model: We then populate the cen-
tral galaxies and “major” subhalos with an empirical halooccupation model. Although such models are constrained,by definition, to reproduce the mean properties of the ha-los occupied by galaxies of a given mass/luminosity, thereare known degeneracies between parameterizations that giverise to (typical factor∼ 2) differences between models. Wetherefore again repeat all our calculations for our “default”model (Conroy et al. 2006) (see also Vale & Ostriker 2006)and an alternate halo occupation model (Yang et al. 2003) (seealso Yan et al. 2003; Zheng et al. 2005), which bracket therange of a number of calculations (e.g., Cooray 2005, 2006;

10 Hopkins et al.
Zheng et al. 2005; van den Bosch et al. 2006). Again, we findthis yields negligible differences atMgal & 1010M⊙ (as theclustering and abundances of massive galaxies are reasonablywell-constrained, and most of these galaxies are central halogalaxies), and even at low masses the typical discrepancy risesto only∼ 0.2dex.
We note that we have also considered a variety of pre-scriptions for the redshift evolution of the halo occupationmodel: including that directly prescribed by the quotedmodels, a complete re-derivation of the HOD models ofConroy et al. (2006) and Vale & Ostriker (2006) at differentredshifts from the observed mass functions of Fontana et al.(2006); Bundy et al. (2005); Borch et al. (2006); Blanton(2006) (see § 3.1), or simply assuming no evolution (in termsof galaxy mass distributions at fixed halo mass; for either allgalaxies or star-forming galaxies). We find that the resultingdifferences are small (at least atz. 3), comparable to thoseinherent in the choice of halo occupation model. This is notsurprising, as a number of recent studies suggest that thereisvery little evolution in halo occupation parameters (in terms ofmass, or relative toL∗) with redshift (Yan et al. 2003; Cooray2005; Conroy et al. 2006), or equivalently that the massesof galaxies hosted in a halo of a given mass are primarilya function of that halo mass, not of redshift (Heymans et al.2006; Conroy et al. 2007). This appears to be especially truefor star-forming and∼ L∗ galaxies (of greatest importancefor our conclusions; Conroy et al. 2007), unsurprising giventhat “quenching” is not strongly operating in those systemstochange their mass-to-light ratios.
4. Merger Timescale: Having populated a given halo andits subhalos with galaxies, we then calculate the timescaleformergers between major galaxy pairs. This is ultimately thelargest source of uncertainty in our calculations, at all red-shifts and masses. Again, we emphasize that some of ourcalculations are completely independent of these timescales.However, where adopted, we illustrate this uncertainty by pre-senting all of our predictions for three estimates of the mergertimescale: a simple dynamical friction formula, a group cap-ture or collisional cross section estimate, and an angular mo-mentum (orbital cross section) capture estimate, all as de-scribed above. At large masses and redshiftsz. 2.5, this isa surprisingly weak source of uncertainty, but the estimatedmerger rates/timescales can be very different at low massesMgal . 1010M⊙ and the highest redshiftsz∼ 3− 6.
At low masses, this owes to a variety of effects, includingthe substantial difference between infall or merger timescalesand the timescale for morphological disturbances to be ex-cited (different in e.g. an impact approximation as opposedtothe circular orbit decay assumed by dynamical friction).
The difference in redshift evolution is easily understood:at fixed mass ratio, the dynamical friction timescale scalesastdf ∝ tH ∝ ρ−1/2, but a “capture” timescale will scale withfixed cross section ast ∝ 1/(n〈σv〉) ∝ ρ−1, so that (while thedetails of the cross-sections and dependence of halo concen-tration on redshift make the difference not quite as extremeas this simple scaling) the very large densities at high redshiftmake collisional merging increase rapidly in efficiency. Thetrue solution is probably some effective combination of thesetwo estimates, and the “more appropriate” approximation de-pends largely on the initial orbital parameters of the subhalos.At present, we therefore must recognize this as an inherentuncertainty, but one that serves to bracket the likely rangeofpossibilities at high redshifts.
2.2. Where Mergers Occur
We are now in a position to predict the statistics of mergers.First, we illustrate some important qualitative features.Fig-ure 4 shows the merger efficiency (as in Figure 2) for differ-ent classes of mergers: major mergers with the central galaxyin a halo, minor mergers with the central galaxy, and majormergers of two satellite galaxies in the halo. We show the re-sults for our “default” model, adopting the dynamical frictionmerger timescale, but the qualitative results are independentof these choices. The key features are expected: major merg-ers are efficient at small group scales (halo masses) compa-rable to or just larger than the average host halo mass for agivenMgal. At largerMhalo, major mergers become more rarefor the reasons in § 2.1. However, although dynamical fric-tion times increase, the rapidly increasing number of satellitesystems in massive halos means that minor merger accretiononto the central galaxy proceeds with a relatively constantef-ficiency. This will not trigger substantial quasar or starburstactivity or morphological transformation, but may be impor-tant for overall mass growth in large cD galaxies, althoughrecent cosmological simulations (Maller et al. 2006) suggestthat major mergers dominate minor mergers in the assemblyof massive galaxies (although their simulation does not extendto the largest cD galaxies).
Satellite-satellite minor mergers are a small effect at allmasses, as expected (by the time a halo is sufficiently massiveto host a large number of satellites of a givenMgal, the orbitalvelocity of the galaxies about the halo is much larger thantheir individual internal velocities). In what follows, wewillgenerally ignore satellite-satellite mergers. Includingthemis a very small correction (generally≪ 10%), and their dy-namics are uncertain. Moreover, their colors and star forma-tion histories are probably affected by processes such as tidalstripping, harassment, and ram-pressure stripping, whichweare neither attempting to model nor test. We have howeverchecked that there are no significant or qualitative changestoour predictions if we (naively) include the satellite-satelliteterm.
Although the consequences of the merger will be very dif-ferent, the efficiency with which two galaxies merge doesnot depend strongly on whether they are star-forming orred/passive (all else being equal). It is therefore a conse-quence that, at low redshifts, gas-rich mergers are generallyrelegated to low stellar masses and field environments wheresuch galaxies are common. Figure 5 illustrates this. We plotthe mean efficiency of major, central galaxy mergers (as inFigure 4, but for the meanMgal at eachMhalo) as a functionof halo mass at each of three redshifts. At each redshift, wedivide this into the observed fraction of red and blue galax-ies at the given galaxy/halo mass, using the appropriate ob-served, type-separated galaxy mass functions. The efficiencyof mergers at a given halo and galaxy mass does not evolve(note that this isnot a statement that the overall merger rateswill not change, but rather a statement that the same galaxiesin the same halos will merge at the same rate). However, atlow redshifts, red galaxies dominate the mass budget, whereasat high redshifts, most galaxies are still blue (star-forming) inall but the most massive halos. We will discuss the possi-bility that mergers themselves drive this change in the blueand red fractions in Paper II, but for now illustrate that thelocations of gas-rich and dry mergers reflect where gas-richand gas-poor galaxies dominate the population, respectively,which is empirically determined at the redshifts of interest

Co-Evolution of Quasars, Black Holes, and Galaxies I 11
10-6
10-5
10-4
10-3
10-2
Central Galaxy Major Mergers (per Halo)
10-6
10-5
10-4
10-3
10-2
Pro
babi
lity
(Effi
cien
cy)
Central-Satellite Minor Mergers
10 11 12 13 14 15log( Mhalo / h
-1 MO • )
10-6
10-5
10-4
10-3
10-2
Satellite-Satellite Major Mergers
FIG. 4.— Merger efficiency (arbitrary units; defined in the same manneras the lower panel of Figure 2, with different linestyles in the same style forvarious mass galaxies) for different classes of mergers. Using the subhalomass functions and halo occupation models, we can separate major mergersonto the central galaxy in a halo (top), minor (mass ratio> 3 : 1 but< 10 :1) mergers onto the central galaxy (middle), and satellite-satellite mergers(bottom). Major mergers occur efficiently in central galaxies near the smallgroup scale for eachMgal. When galaxies live in very massive halos, theyexperience a large number of minor mergers from the satellite population.Satellite-satellite mergers are a relatively small effectat all galaxy and halomasses.
here. We note that our halo occupation models do not ex-plicitly model a dependence of halo populations on centralgalaxy properties; i.e. the tentative observational suggestionthat, at fixed halo and galaxy mass, red central galaxies arepreferentially surrounded by red (as opposed to blue) satel-lites (Weinmann et al. 2006). If real, the effect of such a trendis to make the transition plotted in Figure 4 somewhat sharper– this has little effect on our conclusions, but does somewhatlower the predicted gas-rich merger rates (and correspondingpredicted quasar luminosity density) atz. 0.5 (since a redcentral galaxy would have a lower probability of an infalling,gas-rich system).
10-6
10-5
10-4
10-3
10-2
z = 0
10-6
10-5
10-4
10-3
10-2
Pro
babi
lity
(Effi
cien
cy)
z = 1
All
Blue (Gas-Rich)
Red (Gas-Poor)
10 11 12 13 14 15log( Mhalo / h
-1 MO • )
10-6
10-5
10-4
10-3
10-2
z = 2
FIG. 5.— Merger efficiency (arbitrary units; calculated as in Figure 2)as a function of halo mass (adopting the meanMgal(Mhalo) from Figure 3).Using the type-separated galaxy mass functions from Bell etal. (2003b);Borch et al. (2006); Fontana et al. (2004) atz= 0, 1, 2, respectively, we showthe fraction of galaxies at each mass expected to be gas-richand gas-poor,at each of three redshifts. At high redshifts, all but the most massive merg-ing galaxies will be gas-rich, whereas at low masses the gas-poor populationdominates at most masses where mergers are efficient.
Integrating over the appropriate galaxy populations, Fig-ure 6 compares the predictedz= 0 merger fraction as a func-tion of halo mass from this model with that observed. Theagreement is good over a wide dynamic range. Althoughthere is a significant (factor∼ 2) systematic difference basedon how this fraction is calculated, this is within the range ofpresent observational uncertainty. It is also important todis-tinguish the merger fraction of parent halos (i.e. fractionofgroups which contain a merger) and that of galaxies (i.e. frac-tion of all galaxies at a givenMgal orMhalo which are merging),as at large halo masses the rate of mergers onto the centralgalaxy could remain constant (giving a constant merger rateper halo), but the inefficient merging of the increasingly largenumber of satellites will cause the galaxy merger fraction to

12 Hopkins et al.
fall rapidly.We also show the distribution of mergers (interacting pairs)
and all galaxies in environmental density (local projectedsur-face densityΣ5 = 5/(πd2
5), whered5 is the distance to thefifth nearest-neighbor) from the local group catalogues ofSol Alonso et al. (2006) – we compare this data set directlyto our prediction by convertingΣ5 to Mhalo using the meanrelation from Croton et al. (2006), as in Baldry et al. (2006)(although as they note, the relation has considerable scatter).Similarly, we show the post-starburst (generally merger rem-nant) fraction from Hogg et al. (2006) and Goto (2005), as afunction of surface density on large scales.
Our predictions and the observations emphasize that galaxymergers occur on all scales (in halos of all masses), and in allenvironments. In a global sense, there is no preferred mergerscale. That is not to say that mergers of galaxies of a particularmass do not have a preferred scale (indeed, in our modeling,this is explicitly the small group scale), but rather becausethis scale is a function of galaxy mass, mergers ofsomemassoccur in all halo masses and environments. It is clear that itis a mistake to think that mergers would not occur in field (oreven void) environments, a fact which is very important to theformation of spheroids and quasars in these locations.
2.3. How Mergers Are Influenced By Environment
Figure 6 demonstrates that, all else being equal, mergersdo not depend on the large scale environment. This is con-ventional wisdom, of course, because mergers are an essen-tially local process. However, there is one sense in whichthe merger rate should depend on environment. If the localdensity of galaxies (supply of systems for major mergers) isenhanced by some factor 1+ δ, then the probability (or rate)of major mergers should be enhanced by the same factor.
In detail, our adopted model for the merger/capture crosssection of galaxies (§ 2.1) allows us to calculate the differen-tial probability that some halo/subhalo or galaxy population ata given distancer will merge with the central galaxy in a time< tH. Given the observed galaxy-galaxy correlation functionas a function of stellar mass (Li et al. 2006a), we can triv-ially calculate the mean number density of galaxies (possiblefuel for major mergers) in a shelldr at r, and combining thiswith the merger rate/cross section calculation determinesthedifferential contribution to the total merger rate of galaxies ofthat mass, from pairs at the separationdr. This can be thoughtof as either a capture process from halo/subhalo orbits, or aglobal inflow rate from dynamical friction and gravitationalmotions; the results are the same, modulo the absolute mergerrate normalization (Binney & Tremaine 1987; Masjedi et al.2006). Next, assume that the density of these companionsis multiplied, at this radius, by a factor 1+ δr (relative to themean〈(1+ δr )〉 expected at thatr for the given central halomass). Integrating over all radii, we obtain the total mergerrate/probability, with the appropriate enhancement.
Figure 7 illustrates this, calculated in several radial shellsusing our gravitational capture cross sections to estimatetheenhancement (the other cross sections yield similar results).The absolute value of the probability shown will be a functionof galaxy mass, halo mass, and redshift, but the qualitativebehavior is similar. Unsurprisingly, density enhancements onsmall scales (r . 100kpc, where most systems will merge)linearly increase the merger rate accordingly. Note that den-sity decrements decrease the merger rate only to a point –this is because even for a galaxy with no companions withina 100kpc radius, there is of course some non-zero probabil-
ity that companions will be accreted or captured from initiallylarger radii and merge int ≪ tH.
At larger radii, the enhancement is less pronounced. Agalaxy in the center of a halo of a given mass in a∼ 3Mpcoverdensity is not substantially more likely to experienceamajor merger, because there is little contribution to its mergerrate from those large radii (at least on short timescales; ofcourse, overt ∼ tH subhalos may be accreted from these radii,but by then the density structure will change and the mergerrate will reflect that). Naturally, an overdensity at the∼ 3Mpcscale implies an enhanced density within that scale. However,we are considering this for galaxies and halos of a specificmass, for which the virial radii are generally much smallerthan these scales, so the increased density in this annulus doesnot necessarily imply an enhanced galaxy density within thehalos themselves (for thatMhalo), although it may affect theoverall abundance of the halos. As a general rule, mergerrates will scale with environmental density on scales less thanthe virial radii of the masses of interest, and be independentof density on larger scales.
If the merger rate increases in regions with small-scale over-densities, then mergers themselves should be biased to suchregions. To the extent that the small-scale galaxy overdensityaround a merger traces this overdensity (which we caution isnotnecessarilytrue, as one of the initial galaxies in this over-density is, by definition, consumed in the merger), this impliesthat mergers and merger remnants should preferentially ex-hibit small-scale density excesses. The magnitude of this ex-cess is straightforward to determine: for a given galaxy/halomass, the distribution of environments (densities (1+ δr) on agiven scaler) is known. Then, for each scaler, the calculationin Figure 7 gives the relative probability of a merger as a func-tion of overdensity. Convolving the probability of any objectbeing in given overdensity with the probability of a merger inthat overdensity gives the mean overdensity of mergers at thatscale, i.e.
〈xmerger〉
〈xall〉=
∫
xPmerger(x)P(x|Mhalo)dx∫
xP(x|Mhalo)dx, (2)
wherex≡ (1+ δr).It is straightforward in extended Press-Schechter theory to
calculate of the probability of forming a halo of a given massin a given overdensity on a particular scale (Mo & White1996). However, since we are calculating a galaxy overden-sity in radii about the merger candidate, Poisson noise is dom-inant on small scales where the average number of compan-ions is. 1 – nevertheless it is again straightforward to cal-culate the probability of a given overdensity. In any casewe account for both effects, and show the results in Fig-ure 8. Specifically, we show the average number of com-panions within a radius of a givenr about a merger, for allfield galaxies. We then multiply the field curve by the cal-culated overdensity of mergers as a function ofr. The exer-cise can then be trivially repeated for the correlation functionξ(r). We compare with observed post-starburst populations(E+A/K+A) galaxies, and find that they display a similar ex-cess on small scales. As before, the difference on large scalesis negligible – unsurprisingly, the density excess becomesim-portant atr . rvir for the typical galaxies of interest.
Finally, we stress that the excess of companions on smallscales doesnot, in this model, stem from those galaxies them-selves having any interaction with the central merger (rem-nant), but reflects a genuine small-scale overdensity (as in

Co-Evolution of Quasars, Black Holes, and Galaxies I 13
11 12 13 14 15log(Mhalo / h
-1 MO • )
0.00
0.02
0.04
0.06
0.08
0.10
0.12M
erge
rs /
Hal
o
Default ModelAlternate Subhalo Mass Function FitsAlternate HOD FitMerger Timescales Recalculated (as Fig. 3)
11 12 13 14 15log(Mhalo / h
-1 MO • )
-3.5
-3.0
-2.5
-2.0
-1.5
-1.0
log(
Mer
gers
/ G
alax
y)
Mgal > M∗
-2 -1 0 1 2log( Σ5 / Mpc-2 )
0.0
0.2
0.4
0.6
0.8
1.0
df /
dlog
Σ 5
Interacting PairsAll Galaxies
Sol Alonso et al. (2006)
-1.0 -0.5 0.0 0.5 1.0log(Environmental Density)
0.0000.002
0.004
0.006
0.008
0.010
0.0120.014
K+
A F
ract
ion
8 Mpc (Hogg et al. 2006)1.5 Mpc (Goto 2005)
FIG. 6.— Top: Merger fraction as a function of host halo mass. The fractionof all halos (groups) predicted to host at least one major merger of galaxy mass& 1010M⊙ is plotted (left), as is the fraction of all galaxies in halos of a givenMhalo which are merging (right). We show the predictions for several variationsof our standard model (described in the text) used to identify all merging systems (black lines, as labeled), and adding amore detailed calculation of the actualtimescale for the physical galaxy mergers (blue lines, as labeled) and ability to morphologically identify them. Both are compared with observed merger fractions(points) from Sol Alonso et al. (purple circles 2006) (we convert their measured intermediate-scale densities to average halo masses following Baldry et al. 2006;Kauffmann et al. 2004, shown as open and filled points, respectively). Bottom:The observed distributions (fraction of objects per logarithmic interval in galaxysurface density) of merger and normal galaxy environments,from the group catalogues of Sol Alonso et al. (2006) (left), and the fraction of recent merger remnant(post-starburst, K+A) galaxies as a function of galaxy surface density averaged on intermediate (1.5Mpc) and large (8 Mpc) scales (right). Mergers occur on allscales and in halos of all masses, without a strong feature ata particular scale.
0.01
0.10
P(m
erge
r)
r < 100 kpc
100 < r < 300 kpc
0.1 1.0 10.0
0.01
0.100.3 < r < 1 Mpc
0.1 1.0 10.0
(1 + δr) / ⟨(1 + δr)⟩
1 < r < 3 Mpc
FIG. 7.— Dependence of the merger rate/probability on environmental den-sity decrement/enhancement within a given radiusr ; i.e. galaxy overdensity(1+ δr )/〈(1+ δr )〉 at a fixed galaxy and host halo mass (absolute units are ar-bitrary here, and depend on these quantities). On scales less than the typicalvirial radii of interest, the merger rate increases with overdensity (linearly atδr ≫ 1), but it is independent (for a fixed halo mass) of large-scale environ-ment.
small groups), in which mergers will be more likely.
2.4. Integrated Merger Populations Over Time
At a given redshift, we use our model to predict the massfunction of mergers. For clarity, we take the mass of a mergerto be the total stellar mass of the remnant galaxy (roughly thetotal baryonic mass of the merger progenitors). This avoidsambiguity in merger mass ratios, tends to be observationally
representative (since mergers are generally labeled by totalluminosity/stellar mass), and has been shown in simulationsto be a better proxy for the merger behavior than the initialmass of either progenitor (as long as it is still a major merger;Hopkins et al. 2006a).
Figure 9 shows the mass functions of ongoing mergers ateach of several redshifts. We first consider the mass func-tion of “all” objects which will merge efficiently – i.e. themass function of merging pairs. This requires no knowl-edge of the actual timescale of the merger or e.g. lifetimeof tidal disturbances. The results agree well with the massfunctions and merger fractions estimated at allz. 1.5, sug-gesting that our model does indeed reasonably describe thetrue nature of galaxy mergers. For comparison, we show theresults obtained using a different halo occupation model toas-sociate galaxies and halos, or using a different set of simula-tions/models to estimate the subhalo mass functions. As notedin § 2.1, these choices make very little difference (consider-ably smaller than e.g. the systematics in the observations).
It is not always clear, however, that observations captureall merging pairs (or that our definition of “all” is appropriateas, for some mergers,tmerger→ tH). Often, systems are iden-tified as mergers on the basis of tidal disturbances and otherclear morphological signatures. We therefore calculate themass function of systems observed in this manner. This re-quires that we adopt one of the models in § 2.1 for the mergertimescale, which tells us how long it will characteristicallytake for a given merger to reach the interaction cross sectionwhere tidal disturbances will be excited. Then, using numer-ical simulations to estimate the typical duration of those fea-

14 Hopkins et al.
50 100 150 200r [kpc]
0.05
0.10
0.15
0.20
1.2
1.4N
com
pani
on
Field Galaxies Mergers (Predicted)
E+A Galaxies
0.1 1.0r [Mpc]
100
1000
ξ(r)
FIG. 8.— Excess galaxy overdensity on small scales predicted for mergersfrom our model. Because mergers are more likely when there isa galaxyoverdensity on small scales (Figure 7), mergers will, on average, occur in re-gions with slightly enhanced small-scale densities. We show the real-spacecorrelation function (bottom; technically the merger-galaxy cross correlationfunction) and corresponding number of companions within a given radius(top) of all field galaxies (Goto 2005), and then this multiplied by the pre-dicted excess on small scales for mergers (essentially integrating over theprobability bias to large overdensity on small scales in Figure 7). Dashedblue lines indicate the errors in our estimate from the combination of uncer-tainties in the field galaxy correlation function, the rangeof galaxy massesconsidered (which slightly shifts the physical scale on which the effect is im-portant), and the inclusion/exclusion of Poisson noise in the distribution ofoverdensities for a given halo mass. The observed number of companionsand clustering of post-starburst (likely merger remnant) galaxies is shownfor comparison, from Goto (2005, red circles) and Hogg et al.(2006, purplediamonds).
tures (in which they will be identified by typical morphologi-cal classification schemes, see Lotz et al. 2007), we obtain theobserved “disturbed morphology” mass functions. We per-form this calculation using each of the methods for calculatingthe merger timescale described in § 2.1. Note that the numberof systems according to this convention can exceed that in our“all pairs” definition if the timescale on which disturbancesare visible is longer than the “infall” timescale or timescaleon which the subhalo survives (the case for very efficient in-fall/capture).
At high masses, the difference between samples of merg-ing pairs and those of disturbed systems is small, as is thedifference between our choice of methodology in calculatingthe merger abundances and/or timescales. This is because
-6.0-5.5
-5.0
-4.5
-4.0
-3.5
z = 0.1
log(
φ(M
)) [
Mer
gers
Mpc
-3 lo
g(M
)-1 ]
z = 0.4
10.0 10.5 11.0 11.5 12.0
-6.0-5.5
-5.0
-4.5
-4.0
-3.5
z = 0.8
log( Mgal / MO • )
10.0 10.5 11.0 11.5 12.0
z = 1.2
FIG. 9.— Mass functions (in terms of the remnant stellar mass) ofongoingmergers at each of several redshifts (labeled). Observed mass functions (solidred points) are shown from Xu et al. (2004, stars) and Bundy etal. (2005, cir-cles) (for a detailed analysis of the mass functions, see Hopkins et al. 2007a).Error bars donot include cosmic variance. Observed merger fractions (openorange points), converted to a mass function estimate over the mass rangesampled (horizontal errors) are shown from Bell et al. (2006, cross) andLotz et al. (2006b, squares), with errors including cosmic variance. We com-pare the prediction of our default model (thick solid black line), for the abun-dance of mergers and merging pairs. Dotted line employs a different halooccupation model, and dashed line adopts a different fit to the subhalo massfunctions (see Figure 6 and § 2.1.2). We also show the predictions for mor-phologically identified mergers (thin blue lines), which requires estimatingthe merger timescale/capture efficiency and duration of morphological distur-bances (see § 2.1). We estimate these using a group capture/collisional model(solid), angular momentum capture cross-sections (long dashed), and simpledynamical friction considerations (dotted), calibratingthe duration of distur-bances from numerical simulations (Lotz et al. 2007). At masses&1010M⊙,there is little difference owing to methodology. At very lowmasses, simula-tions suggest that the merger timescale (i.e. orbital or crossing time after firstpassage) is considerably longer than the time period over which strong dis-turbances are excited; however, this is below the mass scales of interest formost of our predictions.
high-mass systems merge more quickly, excite morphologi-cal disturbances more easily on first passage, and are brighter(making faint morphological features easier to identify).Atvery low massesMgal . 1010M⊙, our predictions do diverge– this is because the overall infall or merger timescale canbecome substantially longer than the timescale over whichmorphological disturbances are excited (in these cases, thisoccurs closer to the final coalescence). Although this con-clusion merits more detailed numerical investigation in futurework, it has little effect on any of our predictions – for ex-ample, the total merger fraction (especially at high redshift) isrestricted to larger-massMgal&M∗ systems, where the predic-tions agree well, and the overall merger mass density is nearlyidentical regardless of the methodology. Furthermore, quasarand galaxy formation processes are probably influenced (oreven dominated) by other mechanisms (such as secular diskinstabilities and quenching via infall as a satellite galaxy) atthese low masses, which we do not attempt to model.
We next integrate the mass functions in Figure 9 above agiven mass limit to predict the merger fraction as a functionof redshift, shown in Figure 10. The fraction is determinedrelative to the mass functions in Fontana et al. (2006), whoprovide a continuous fit over the range of interest. But we notethat since this is an integrated quantity, the difference adopt-ing other mass function estimates (e.g. Borch et al. 2006) issmall (at least atz. 1.5). Comparing this to a range of obser-vations, the agreement is good, especially for the deeper masslimit. For high mass mergers (Mgal& 1011M⊙) there is greater

Co-Evolution of Quasars, Black Holes, and Galaxies I 15
scatter in the observations, which most likely owes to cosmicvariance (especially atz. 0.2). In both cases, however, themerger fraction is not an especially steep function of redshift.In fact, betweenz = 0.3− 1.5, the fraction increases by onlya factor∼ 3 − 4, consistent with most observations findinga relatively flat merger fraction in this range (e.g. Lin et al.2004; Lotz et al. 2006b) and recent cosmological simulations(Maller et al. 2006). Further, although halos may be mergingmore frequently at high redshift, they are also merging morerapidly, meaning that the fraction merging at any instant canbe relatively flat.
Finally, given our model for the halos hosting mergers, it isstraightforward to calculate the predicted clustering propertiesof those mergers. Specifically, we have already predicted anumber density of mergers as a function of halo mass, galaxymass, and redshift; i.e. somenmerger(Mgal|Mhalo, z). Knowingthe clustering amplitude or bias of each host halob(Mhalo|z),it is straightforward to predict the clustering of the merginggalaxies, in the same manner by which halo occupation mod-els construct the clustering of a given population:
b(Mgal) =
∫
b(Mhalo)nmerger(Mgal|Mhalo)dMhalo∫
nmerger(Mgal|Mhalo)dMhalo. (3)
We calculateb(Mhalo) following Mo & White (1996) as up-dated by Sheth et al. (2001) to agree with the results of nu-merical simulations.
Figure 11 shows this as a function of redshift. Since ob-servations generally sample nearMgal ∼ M∗, we plot thisfor Mgal = M∗(z = 0) ≈ 1011M⊙. We compare with avail-able clustering measurements for likely major-merger popu-lations. At low redshifts, Blake et al. (2004) have measuredthe clustering of a large, uniformly selected sample of post-starburst (E+A/K+A) galaxies in the 2dF. Infante et al. (2002)have also measured the large-scale clustering of close galaxypairs selected from the SDSS at low redshift. At high redshift,no such samples exist, but Blain et al. (2004) have estimatedthe clustering of a moderately large sample of spectroscopi-cally identified sub-millimeter galaxies atz∼ 2− 3, which asdiscussed in § 1 are believed to originate in major mergers.Our prediction is consistent with these constraints – however,given the very limited nature of the data and the lack of a uni-form selection criteria for ongoing or recent mergers at differ-ent redshifts, we cannot draw any strong conclusions.
One caution should be added: recent higher-resolution sim-ulations suggest that the approximation here (and in many –but not all – halo occupation models), that bias is a functiononly of halo mass at a given redshift, may not be accurate(e.g., Gao & White 2006; Harker et al. 2006; Wechsler et al.2006). In particular, because mergers have particularly re-cent halo assembly times for their post-merger masses, theymay represent especially biased regions of the density dis-tribution. Unfortunately, it is not clear how to treat thisin detail, as there remains considerable disagreement in theliterature as to whether or not a significant “merger bias”exists (see, e.g. Kauffmann & Haehnelt 2002; Percival et al.2003; Furlanetto & Kamionkowski 2006; Lidz et al. 2007b).Furthermore the distinction between galaxy-galaxy and halo-halo mergers (with the considerably longer timescale for mostgalaxy mergers) means that it is not even clear whether or not,after the galaxy merger, there would be a significant age bias.
In any case, most studies suggest the effect is quite small:using the fitting formulae from Wechsler et al. (2002, 2006),we find that even in extreme cases (e.g. aMhalo ≫ M∗ halo
merging atz = 0 as opposed to an average assembly redshiftzf ≈ 6) the result is that the standard EPS formalism under-estimates the bias by≈ 30%. For the estimated character-istic quasar host halo masses and redshifts of interest here,the maximal effect is. 10% at allz = 0− 3, much smallerthan other systematic effects we have considered (and gen-erally within the range of our plotted variant calculationsinFigure 11). This is consistent with Gao & White (2006) andCroton et al. (2007) who find that assembly bias is only im-portant (beyond the 10% level) for the most extreme halos orgalaxies in their simulations, where for example the clusteringof small halos which are destined to be accreted as substruc-ture in clusters (& 1015h−1M⊙) will be very different from theclustering of similar-mass halos in field or void environments.Indeed, our own calculation in Figure 8 suggests that mergerbias applies only on small scales, and that mergers show nopreference for excess densities on the large scales for whichthe linear bias description is meaningful. The effect may growwith redshift, however, so care should be taken in extrapolat-ing the predictions in Figure 11 to higher redshifts. For furtherdiscussion of the effects on the data and predictions shownhere, we refer to Hopkins et al. (2007d).
For the sake of future comparison, we show in Figure 12 ourpredictions for the merger fractions and clustering of mergers(Figure 10 & 11, respectively) at all redshiftsz = 0− 6. Wenote the caveat that our merger fraction is defined relative tothe mass functions in Fontana et al. (2006), which become un-certain at high redshifts, although this uncertainty is compara-ble to the differences between the methods of calculating themerger timescale (as discussed in § 2.1.2). It is also less clearwhat the observable consequences of mergers at the highestredshifts may be – if merger rates are sufficiently high, theremay be a large number of multiple mergers (as in Li et al.(2006b)), or systems may effectively be so gas rich that merg-ing preserves disks and operates as a means of “clumpy ac-cretion” (e.g. Robertson et al. 2006a).
Although the estimates differ at the highest redshifts, westress that their integrated consequences at low redshiftsz.3 are similar, as this is where most merging activity andspheroid/BH mass buildup occurs. We also note that high-redshift mergers are likely to be the most massiveMgal ≫ M∗
systems, so we show our predictions for the clustering ofmergers assuming different mass limits (as opposed to strictlyat Mgal = M∗). We also plot the mass flux in mergers, i.e.the integrated rate at which galaxy baryonic/stellar mass ismerged,
∫
Mgal n(Mgal)d logMgal. This compares favorablywith the observationally inferred rates at which mass is movedoff the blue cloud, through the “green valley,” and onto thered sequence (from the evolution in galaxy mass functionsand color-magnitude relations; see Martin et al. 2007), as ex-pected in a model where mergers drive such a transition (fordetails, see Paper II). Future observations of these quantitiesat high redshift will improve the constraints on our halo oc-cupation and merger timescale estimates, allowing for moreaccurate calculations of e.g. quasar triggering and spheroidformation rates at these epochs.
3. QUASARS
3.1. Consequences of Merger-Driven Fueling: WhatDetermines Where and When Quasars Live
Having developed in § 2 a physically-motivated model ofmerger rates as a function of galaxy and halo mass, environ-ment, and redshift (and tested that this model is consistent
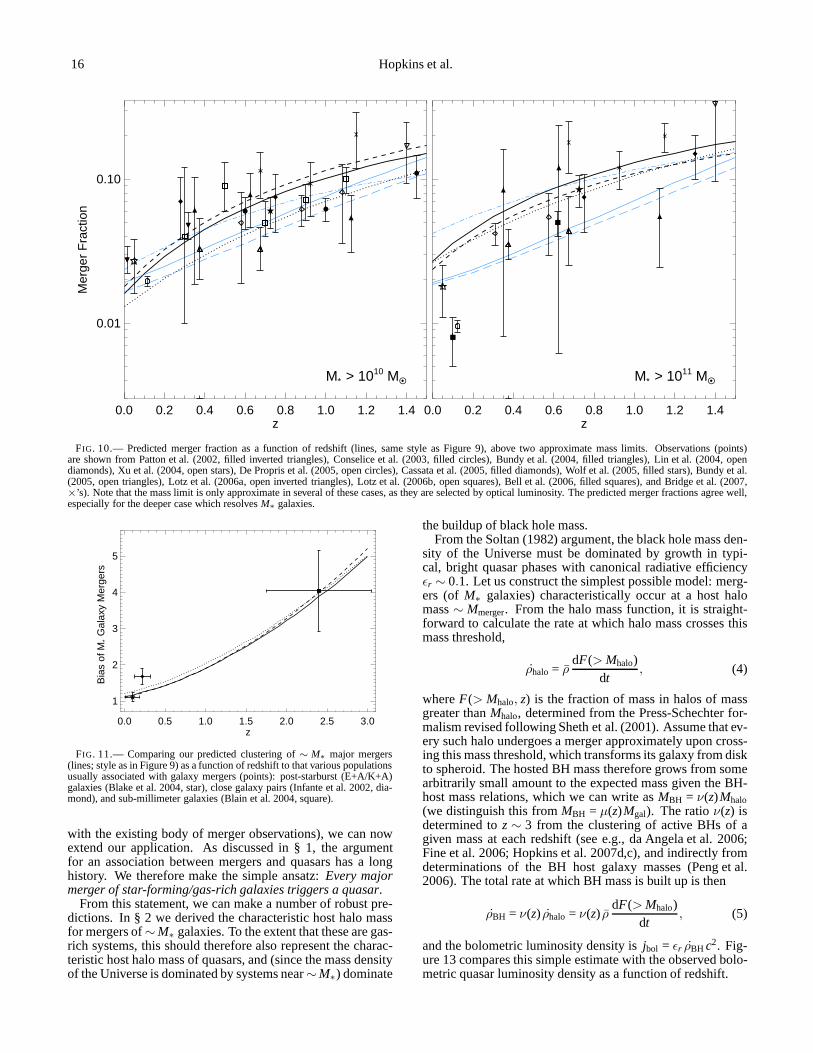
16 Hopkins et al.
0.0 0.2 0.4 0.6 0.8 1.0 1.2 1.4z
0.01
0.10
Mer
ger
Fra
ctio
n
M∗ > 1010 MO •
0.0 0.2 0.4 0.6 0.8 1.0 1.2 1.4z
M∗ > 1011 MO •
FIG. 10.— Predicted merger fraction as a function of redshift (lines, same style as Figure 9), above two approximate mass limits. Observations (points)are shown from Patton et al. (2002, filled inverted triangles), Conselice et al. (2003, filled circles), Bundy et al. (2004, filled triangles), Lin et al. (2004, opendiamonds), Xu et al. (2004, open stars), De Propris et al. (2005, open circles), Cassata et al. (2005, filled diamonds), Wolf et al. (2005, filled stars), Bundy et al.(2005, open triangles), Lotz et al. (2006a, open inverted triangles), Lotz et al. (2006b, open squares), Bell et al. (2006, filled squares), and Bridge et al. (2007,×’s). Note that the mass limit is only approximate in several of these cases, as they are selected by optical luminosity. The predicted merger fractions agree well,especially for the deeper case which resolvesM∗ galaxies.
0.0 0.5 1.0 1.5 2.0 2.5 3.0z
1
2
3
4
5
Bia
s of
M∗
Gal
axy
Mer
gers
FIG. 11.— Comparing our predicted clustering of∼ M∗ major mergers(lines; style as in Figure 9) as a function of redshift to thatvarious populationsusually associated with galaxy mergers (points): post-starburst (E+A/K+A)galaxies (Blake et al. 2004, star), close galaxy pairs (Infante et al. 2002, dia-mond), and sub-millimeter galaxies (Blain et al. 2004, square).
with the existing body of merger observations), we can nowextend our application. As discussed in § 1, the argumentfor an association between mergers and quasars has a longhistory. We therefore make the simple ansatz:Every majormerger of star-forming/gas-rich galaxies triggers a quasar.
From this statement, we can make a number of robust pre-dictions. In § 2 we derived the characteristic host halo massfor mergers of∼M∗ galaxies. To the extent that these are gas-rich systems, this should therefore also represent the charac-teristic host halo mass of quasars, and (since the mass densityof the Universe is dominated by systems near∼M∗) dominate
the buildup of black hole mass.From the Soltan (1982) argument, the black hole mass den-
sity of the Universe must be dominated by growth in typi-cal, bright quasar phases with canonical radiative efficiencyǫr ∼ 0.1. Let us construct the simplest possible model: merg-ers (of M∗ galaxies) characteristically occur at a host halomass∼ Mmerger. From the halo mass function, it is straight-forward to calculate the rate at which halo mass crosses thismass threshold,
ρhalo = ρdF(> Mhalo)
dt, (4)
whereF(> Mhalo, z) is the fraction of mass in halos of massgreater thanMhalo, determined from the Press-Schechter for-malism revised following Sheth et al. (2001). Assume that ev-ery such halo undergoes a merger approximately upon cross-ing this mass threshold, which transforms its galaxy from diskto spheroid. The hosted BH mass therefore grows from somearbitrarily small amount to the expected mass given the BH-host mass relations, which we can write asMBH = ν(z)Mhalo(we distinguish this fromMBH = µ(z)Mgal). The ratioν(z) isdetermined toz∼ 3 from the clustering of active BHs of agiven mass at each redshift (see e.g., da Angela et al. 2006;Fine et al. 2006; Hopkins et al. 2007d,c), and indirectly fromdeterminations of the BH host galaxy masses (Peng et al.2006). The total rate at which BH mass is built up is then
ρBH = ν(z) ρhalo = ν(z) ρdF(> Mhalo)
dt, (5)
and the bolometric luminosity density isjbol = ǫr ρBH c2. Fig-ure 13 compares this simple estimate with the observed bolo-metric quasar luminosity density as a function of redshift.

Co-Evolution of Quasars, Black Holes, and Galaxies I 17
0 1 2 3 4 5 6
0.01
0.10
1.00M
erge
r F
ract
ion
M∗ > 1010 MO •
0 1 2 3 4 5 6
0.001
0.010
0.100
log(
ρ mer
ger)
[MO • y
r-1 M
pc-3]
0 1 2 3 4 5 6z
1
10
Bia
s of
Gal
axy
Mer
gers
Mgal ∼ M∗Mgal > 1010 M
O •
Mgal > 1011 MO •
FIG. 12.—Top: As Figure 10, but extending our predicted merger fractionsto high redshift.Middle: Mass flux through mergers (i.e. total rate of stellarmass merging). Black points are observed merger fractions converted to anestimated mass flux rate following Hopkins et al. (2007a). Green, red, andblue circle show the observationally inferred mass flux through the “greenvalley” (i.e. from blue cloud to red sequence), rate of growth of the red se-quence, and rate of mass loss off the blue cloud (respectively), from z∼ 0−1(Martin et al. 2007) (see Paper II for a more detailed comparison). Bottom:As Figure 11, but extended to higher redshift. Blue and red lines show theclustering of mergers above the given mass thresholds.
The agreement is striking, which suggests that this toymodel, such that the bulk of the assembly of BH mass oc-curs near the transition halo mass, is reasonable. This alsonaturally explains the rise and fall of the quasar luminositydensity with time. However, this is ultimately just a simpleapproximation – we can consider this in greater detail adopt-ing our previous estimate of the merger rate as a function ofstellar mass and redshift,n(Mgal|z), from § 2. Each majormerger transforms disks to spheroids, building a BH of aver-
age massMBH = µ(z)Mgal. We should properly only considermergers of gas-rich or star-forming systems, as dry mergerswill, by definition, not be able to trigger quasar activity andform new BH mass. Therefore, we empirically adopt the frac-tion of red and blue galaxies at eachMgal, Mhalo (as in § 2) torestrict only to mergers of blue galaxies. Again,µ(z) has beendirectly determined from observations (Peng et al. 2006), andestimated from theoretical arguments (Hopkins et al. 2007c).For convenience, we adopt the numerical best-fit estimate ofµ(z) from Hopkins et al. (2007c). A good approximation tothis numerical function is
µ(z) ≈ 0.0012( 1+ z5/2
1+ (z/1.775)5/2
)
, (6)
which matches the asymptotic observed values at low andhigh redshift (Häring & Rix 2004; Walter et al. 2004), andcaptures the observed weak evolution toz∼ 1 and rapid evo-lution betweenz= 1− 3 (Shields et al. 2003; Peng et al. 2006;Salviander et al. 2006). Given the merger raten(Mgal|z), wecan then convert this to a cosmic rate of formation or build-upof BHs in merger-driven quasars,
n(MBH |z) =∫
P(MBH |Mgal) n(Mgal|z)d logMgal. (7)
The intrinsic dispersion about the mean BH-host mass rela-tion appears, at all redshifts, to be roughly lognormal withwidth ≈ 0.27dex, so we modelP(MBH |Mgal) as such. Oncethe total rate of formation of BH mass is calculated, the sameconversion above yields the quasar luminosity density.
Figure 13 shows the results of this more detailed calcu-lation. They are similar to the results from our extremelysimplified model – which reflects the fact that most of themass/luminosity density is contained nearM∗ or L∗. Notethat considering all mergers (i.e. including dry mergers) over-predicts the quasar luminosity density at low redshifts. Thisdemonstrates that the decrease in the quasar luminosity den-sity at low redshifts is, in part, driven by the fact that an in-creasing fraction of massive systems have already been trans-formed to “red and dead” systems at late times, and are nolonger available to fuel quasars, even if they undergo subse-quent dry mergers. Byz∼ 0, for example, a large fraction(∼ 50%) of the mass density in> M∗ systems has alreadybeen gas-exhausted (discussed in detail in Paper II), and there-fore such mergers are no longer a viable fuel supply for quasaractivity. As discussed in § 2.2, the predicted gas-rich mergermass density (and corresponding quasar luminosity density)at z. 0.5 will be slightly lower if these gas-exhausted sys-tems are preferentially surrounding by gas-exhausted satel-lites (compared to gas-rich central galaxies of the same massin similar halos), but it is clear in Figure 13 that this is com-pletely consistent with the observations (especially if secu-lar processes contribute significantly to the quasar luminositydensity at low redshifts and luminosities, as we expect fromour comparisons in § 3.3).
Having calculated the rate of BH formation as a function ofthe remnant BH mass,n(MBH |z), it is trivial to integrate thisforward and predict the BH mass function (BHMF) at anytime. Figure 14 shows the result of this calculation atz = 0,compared to the observationally estimated BHMF. The twoagree well at all masses, even at very largeMBH ∼ 1010M⊙.We also show the BHMF at several other redshifts. Interest-ingly, there is a downsizing behavior, where a large fractionof the most massive BHs are in place byz = 2, while less

18 Hopkins et al.
0.0 0.5 1.0 1.5 2.0 2.5z
6.5
7.0
7.5
8.0
8.5
Lum
inos
ity D
ensi
ty l
og(j b
ol)
[LO • M
pc-3]
0.0 0.5 1.0 1.5 2.0 2.5z
FIG. 13.— Predicted quasar luminosity density, if quasars are triggered in mergers, as a function of redshift.Left: Prediction from a simplified toy model inwhich all halos hosting∼ L∗ galaxies undergo major mergers near their characteristic small group mass scale, and build a BH which obeys the appropriateMBH −Mhalo relation for that redshift (estimatedMBH − Mhalo as a function of redshift from Hopkins et al. 2007d; Fine et al. 2006; Hopkins et al. 2007c, correspondingto solid, long dashed, and dot-dashed lines, respectively). Points show observational estimates from the measured QLFs of Ueda et al. (2003, red circles),Hasinger et al. (2005, blue triangles), Richards et al. (2005, green diamonds), and the large compilation of multiwavelength QLF data in Hopkins et al. (2007e,black stars). The observations from specific bands are converted to a bolometric luminosity density using the bolometric corrections calibrated in Hopkins et al.(2007e). Right: Same, but the predicted luminosity density is calculated properly accounting for all galaxy and halo masses from the merger rate functionsdetermined in § 2, and adopting the observed ratio of BH to host galaxy spheroid mass as a function of redshift (e.g. Peng etal. 2006). Linestyles correspond todifferent means of estimating the exact merger rates, as in Figure 9. Red lines assume all mergers will trigger quasars, black (lower) lines assume only gas-rich(“wet”) mergers can trigger bright quasar activity (adopting the observed fraction of gas-rich/star-forming/blue galaxies as a function ofMgal andMhalo as inFigure 5). A merger-driven model naturally predicts both the rise and fall of the global quasar luminosity density to high precision.
7.0 7.5 8.0 8.5 9.0 9.5 10.0log( MBH/M
O • )
-7
-6
-5
-4
-3
-2
log(
φ(M
BH)
) [M
pc-3 lo
g(M
BH)-1
]
FIG. 14.— Predicted BH mass function (BHMF) from gas-rich merger-driven quasar/BH formation (Figure 13, right). Results areshown atz = 0(black lines; linestyles correspond to different calculations of the mergerrates, as in Figure 9), andz = 1, 2, 3 (blue, green, and red, respectively; forclarity, only our fiducial calculation – solid line – is shown, but relative evo-lution with redshift for each calculation is similar). Yellow (shaded) rangeshows thez= 0 observational estimate of the BHMF in Marconi et al. (2004).Integrating forward the merger mass functions as a functionof redshift yieldsa good match to the local BHMF. The effect of dry mergers is included, butis small.
massive BHs form later (essentially required by the fact thatfew ∼ 109M⊙ BHs are active at low redshift, while a veryhigh fraction are active atz∼ 2, see McLure & Dunlop 2004;Kollmeier et al. 2006; Fine et al. 2006). If we were to ignoredry mergers at low redshifts, this effect would be even morepronounced, but atz. 1 their effect is to move some of theBH mass density from lower-mass systems into higher mass& 109M⊙ systems (at higher redshifts, the effects are negligi-
ble). It is not obvious, however, that this translates to downsiz-ing in galaxy mass assembly, since the ratio of BH to galaxymassµ(z) evolves with redshift. We will return to this ques-tion in Paper II.
Since we begin our calculation with the halos hostingquasars, we should be able to predict the bias of quasars asa function of redshift. As in Figure 11, we use the knownclustering of the halos hosting mergers to calculate the clus-tering of those mergers as a function of redshift. Assumingeach merger produces a quasar of the appropriate mass, thisyields the expected clustering of quasars as a function of red-shift. Figure 15 compares this prediction to observed quasarclustering as a function of redshift. Technically, we adoptthequasar lightcurve models from § 3.2 below to determine theclustering specifically ofL∗ quasars (i.e. determining the rel-ative contribution toL∗ from different host masses and theirclustering as in Figure 11), but the result is nearly identical toassuming thatL∗ quasars traceM∗ mergers (Figure 11). Thisshould be true in any model, as long as the quasar lifetime is asmooth function of luminosity or host mass. We also comparewith the directly observed clustering of small groups similarto our definition.
The agreement is quite good at allz. 2. At higher red-shifts, the observations show considerably larger scatter, per-haps owing to their no longer being complete near the QLFL∗ – future observations, sufficiently deep to clearly resolveL∗, are needed to test this in greater detail. We also considerthe predicted clustering ifL∗ quasars were associated with thelarge group scale ofM∗ galaxies (for simplicity we take thisto be halo masses& 5− 10 times larger than the small groupscale, where our halo occupation model predicts of order& 3satellite∼ M∗ galaxies), and the expectation from a secularmodel, in which quasar clustering traces the observed clus-

Co-Evolution of Quasars, Black Holes, and Galaxies I 19
0.0 0.5 1.0 1.5 2.0 2.5 3.0z
1
2
3
4
5
Bia
s of
L∗
Qua
sars
Mergers (Smallest Groups)SecularLarge Groups
Coil et al. (2006) : Small Groups
FIG. 15.— Predicted quasar clustering as a function of redshift, as-suming merger-triggering (black lines, as in Figure 9), correspondingto the small group scale of∼ M∗ galaxies. Red (upper) shadedrange show the prediction if quasars were associated with large groupscales, blue (lower) range show the prediction from a secular modelin which quasar clustering traces that of star-forming galaxies ob-served at each redshift (lines show±1σ range estimated from thecompiled observations in Hopkins et al. (2007d), from Shepherd et al.(2001); Giavalisco & Dickinson (2001); Norberg et al. (2002); Coil et al.(2004); Zehavi et al. (2005); Adelberger et al. (2005); Allen et al. (2005);Phleps et al. (2006); Meneux et al. (2006); Lee et al. (2006)). Points showquasar clustering measurements from Croom et al. (2005, redsquares),Porciani & Norberg (2006, green diamonds), Myers et al. (2006a,c, cyan andblue circles), and da Angela et al. (2006, violet stars). Large black starsshow the observed clustering ofz∼ 1 small groups (of∼ L∗ galaxies) fromCoil et al. (2006), corresponding to the most efficient scales for major∼ L∗
galaxy mergers. Quasar clustering measurements are consistent with thesmall group scale in which mergers proceed efficiently.
tering of star-forming galaxies (taken from the observationscollected in Hopkins et al. 2007d) – neither agrees with theobservations. Note that these estimates may not be applicableto the highest-redshift quasar clustering measurements, whereflux limits allow only the most massiveL ≫ L∗ systems to beobserved (but see Figure 12 for how the clustering amplitudevaries with merger masses).
We can invert this, and compare the empirically determinedscales of quasar host systems with the small group scale whichshould dominate gas-rich∼ L∗ galaxy mergers. Figure 16shows the mean host massMhalo which corresponds to var-ious quasar clustering measurements (i.e. range ofMhalo forwhich the expected quasar bias agrees with the observed±1σrange). We compare this with direct measurements of thehalo masses corresponding to small groups of∼ M∗ galaxies,determined from both clustering measurements and velocitydispersion measurements of observationally identified groupswith dispersionsσ . 200kms−1. We can also estimate theappropriate small group scale from the halo occupation for-malism.
Specifically, following the formalism of Conroy et al.(2006), if galaxy luminosity/mass is monotonic with subhalomass (at the time of subhalo accretion), then we can take anygalaxy mass function, monotonically rank it and match to ourhalo+subhalo mass functions, and obtain a new halo occupa-tion model which predicts a small group scale – i.e. the rangeof halo masses at which satellites of mass∼ L∗ first appear.As discussed in § 2.1, the choice of mass functions and howthe HOD is constructed makes little difference (factor< 2) toour predictions, so (unsurprisingly) these all yield a similarestimate of the small group scale to our default model predic-tions.
11.5
12.0
12.5
13.0
Quasar Clustering
11.5
12.0
12.5
13.0
Qua
sar
Hos
t / S
mal
l Gro
up S
cale
lo
g( M
halo /
h-1 M
O • )
Direct Small-Group Measurements
0 1 2 3 4z
11.5
12.0
12.5
13.0
Small Group Scale from Halo Occupation
FIG. 16.—Top: Characteristic halo mass implied by quasar clustering mea-surements. Points show the 1σ allowed range in host halo massMhalo corre-sponding to the quasar bias measurements in Figure 15 (in thesame style).Shaded magenta regions show the range of halo masses for the correspond-ing redshift bins in the SDSS (Shen et al. 2007). The solid line shows thebest-fitMhalo(z) to all observations, with the 1σ (2σ) allowed range shadedorange (cyan).Middle: Shaded range again shows the characteristic host halomass implied by quasar clustering. Points show the halo massscale impliedby direct measurements of observationally identified smallgroups (velocitydispersions. 200kms−1), from Brough et al. (2006) atz≈ 0 (squares), andfrom from clustering measurements of groups from Eke et al. (2004, trian-gles) and Coil et al. (2006, stars).Bottom:Same, but showing the small grouphalo mass estimated indirectly from the empirically determined halo occupa-tion distribution (HOD). Black inverted triangles adopt the best-fit HOD fromConroy et al. (2006) (our default model), other points adoptthe methodol-ogy of Vale & Ostriker (2006) to construct the HOD from various measuredgalaxy stellar mass functions in Fontana et al. (2006, blue stars), Borch et al.(2006, purple squares), Bundy et al. (2005, 2006, red circles), and Blanton(2006, orange triangles). The characteristic scale of∼ L∗ quasar hosts ap-pears to robustly trace the characteristic small group scale of∼ L∗ galaxies;i.e. the mass scale at which galaxy mergers are most efficient.
At all observed redshifts, the scale of∼ L∗ quasars appearsto trace the small group scale – i.e. whatever mechanism trig-gers∼ L∗ quasars operates preferentially at the characteristicsmall group scale for∼ L∗ galaxies, where mergers are ex-pected to be most efficient.
In § 2.3, we demonstrated that the increased probabilityof mergers in regions with excesssmall scaleoverdensitiesmeans that the typical merger is more likely to exhibit an ex-cess of clustering on small scales, relative to average systemsof the same halo mass. If quasars are triggered in mergers,this should be true as well. We therefore apply the identicalmethodology from Figure 8 to calculate the excess clusteringsignal expected in active quasars. Figure 17 shows the re-sults of this exercise. We adopt the large-scale mean cluster-ing expected from Myers et al. (2006b), specifically using theformulae of Smith et al. (2003) to model the expected non-linear correlation function in the absence of any bias, then

20 Hopkins et al.
0.01 0.10 1.00 10.00r [ h-1 Mpc ]
10-1
100
101
102
103
104
ξ(r)
1
2
3
4
5
Bia
s b Q
z ∼ 0 - 0.5(Serber et al. 2006)
0.01 0.10 1.00 10.00r [ h-1 Mpc ]
2
3
4
5z ∼ 1 - 2
(Myers et al. 2006)
0.0 0.5 1.0 1.5 2.0 2.5z
0
1
2
3
4
5
b Q(
r <
100
h-1 k
pc )
/ ⟨b
Q⟩
FIG. 17.— Excess small-scale clustering of quasars expected ifthey are triggered in mergers, as in Figure 8.Left: Observed correlation functions fromMyers et al. (2006b, blue circles) and Hennawi et al. (2006, green diamonds), measured for∼ L∗ quasars over the redshift rangesz∼ 1 − 2. Dashed blackline shows the expected correlation function (nonlinear dark matter clustering from Smith et al. (2003), multiplied bythe appropriate constant large-scale biasfactor) without a small-scale excess. Red lines multiply this by the predicted additional bias as a function of scale from § 2.3, namely the fact that small-scaleoverdensities increase the probability of mergers. Solid line shows our mean prediction, dashed the approximate∼ 1σ range, as in Figure 8.Center: Same, butdividing out the best-fit large-scale correlation function(i.e. bias as a function of scale). Black squares in upper panel show the measurement for true opticalquasars (−23.3 > Mi > −24.2) from Serber et al. (2006) atz∼ 0.1− 0.5. Right: Ratio of the mean bias at small radii (r < 100h−1 kpc) to that at large radii(the asymptotic values in the center panel), at all redshifts where this has been observed. Lines show the predicted excess from the previous panels (lower lineaverages down to a minimum radiusr = 50h−1 kpc, upper line to a – potentially unphysical – minimumr = 10h−1 kpc).
apply the formalism from Figure 8 to estimate the additionalbias as a function of scale. Comparing this to observations,the measurements clearly favor an excess bias on small scales(r . 100− 200h−1kpc; Hennawi et al. 2006), similar to ourprediction, over a constant bias at all scales. This appearstobe true at all observed redshifts; the excess relative bias wepredict at small scales is simply a consequence of how theprobability of a merger scales with local density, so it doesnot vary substantially as a function of redshift.
It should be noted that the excess of quasar clustering onsmall scales might also reflect an excess of merging binaryquasars, i.e. merging systems in which the interaction hastriggered quasars in each merging counterpart. For the rea-sons given in § 1, this situation is expected to be relativelyrare (even if all quasars are initially triggered by galaxy merg-ers), but Myers et al. (2006b) note that only a small fractionofmerging pairs need to excite quasar activity in both membersin order to explain the observed clustering excess. Figure 17demonstrates that a similar excess is observed in both thequasar-quasar autocorrelation function (Hennawi et al. 2006;Myers et al. 2006b) and the quasar-galaxy cross-correlationfunction (Serber et al. 2006), arguing that it primarily reflectsa genuine preference for quasar activity in small-scale over-densities. In any case, however, the excess on small scalesis a general feature of a merger-driven model for quasar ac-tivity. Indeed, the predicted excess is also seen in high-resolution cosmological simulations (Thacker et al. 2006), ifquasars are specifically identified with (“attached to”) majormergers. Secular (bar or disk instability) fueling mechanisms,on the other hand, should (by definition) show no clusteringexcess relative to median disk galaxies of the same mass andproperties, in contrast to what is observed (although in agree-ment with what is seen for low-luminosity Seyfert galaxies,see § 3.3).
3.2. Model-Dependent Predictions: AdditionalConsequences of Quasar Light Curves
To proceed further, we must adopt some estimatesfor quasar lightcurves and/or lifetimes. Following themethodology developed by Springel & Hernquist (2003) andSpringel et al. (2005b), Hopkins et al. (2006a,b) use a largeset of several hundred hydrodynamical simulations (seeRobertson et al. 2006b) of galaxy mergers, varying the rele-vant physics, galaxy properties, orbits, and system masses,to quantify the quasar lifetime (and related statistics) asafunction of the quasar luminosity. They define the quan-tity tQ(L |MBH), i.e. the time a quasar of a given BH massMBH (equivalently, peak quasar luminosityLpeak) will be ob-served at a given luminosityL. They further demonstratethat this quantity is robust across the wide range of var-ied physics and merger properties; for example, to the ex-tent that the final BH mass is the same, any major mergerof sufficient mass ratio (less than∼ 3 : 1) will producean identical effect. We adopt these estimates in what fol-lows, and note that while there is still considerable uncer-tainty in a purely empirical determination of the quasar life-time, the model lightcurves are consistent with the presentobservational constraints from variability studies (Martini2004, and references therein), clustering (Croom et al.2005; Adelberger & Steidel 2005; Porciani & Norberg 2006;Myers et al. 2006a; da Angela et al. 2006; Shen et al. 2007),Eddington ratio measurements (McLure & Dunlop 2004;Kollmeier et al. 2006), active BH mass functions (Vestergaard2004; Fine et al. 2006; Greene & Ho 2007), and cosmic back-ground measurements (Volonteri et al. 2006; Hopkins et al.2007e).
The quasar luminosity functionφ(L) is given by the convo-lution over the merger rate (rate of formation of BHs of finalmassMBH in mergers) and quasar lifetime (differential timespent at luminosityL by a BH of final massMBH):
φ(L) =∫
tQ(L |MBH) n(MBH |z)d logMBH. (8)
Note this technically assumestQ ≪ tH, but this is true for allluminosities and redshifts of interest here. Figure 18 shows

Co-Evolution of Quasars, Black Holes, and Galaxies I 21
-10
-8
-6
-4
z = 0.0
z = 0.5
z = 1.0
-10
-8
-6
-4
z = 1.5
log(
φ(L)
) [M
pc-3 lo
g(L)
-1]
z = 2.0
z = 2.5
10 11 12 13 14 15-10
-8
-6
-4
z = 3.0
10 11 12 13 14 15
z = 4.0
log( L/LO • )
10 11 12 13 14 15
z = 5.0
FIG. 18.— Predicted quasar luminosity functions, convolving our predicted merger rate functions (Figure 9; same line styles) with quasar lightcurves fromsimulations (Hopkins et al. 2006a). Red lines allow dry mergers to trigger quasar activity as well (leading to an overestimate at low redshifts, as in Figure 13).Points show observed bolometric luminosity functions at each redshift, from the compilation of observations in Hopkins et al. (2007e). QLF measurementsderived from observations in the optical, soft X-ray, hard X-ray, mid-IR, and narrow emission lines are shown as green, blue, red, cyan, and orange points,respectively. The merger-driven model naturally predictsthe observed shape and evolution of the QLF at all redshifts.
this prediction at a number of redshifts, compared to thelarge compilation of QLF measurements from Hopkins et al.(2007e). The agreement is surprisingly good at all redshifts.At the most extreme luminositiesLbol > 3× 10¹⁴L⊙ at eachredshift, our predictions may begin to fall short of the ob-served QLF, but this somewhat expected, as these luminosi-ties naively imply> 1010M⊙ BHs accreting at the Edding-ton limit. It is therefore likely that a full resolution at themost extreme luminosities involves either revising the esti-mate of these bolometric luminosities (i.e. the bolometriccor-rections adopted may not be appropriate for the most ex-treme objects, or there may be beaming effects) or includ-ing processes beyond the scope of our current investigation(e.g. super-Eddington accretion or multiple mergers in mas-sive BCGs). Nevertheless, our simple merger-driven scenarioappears to accurately predict the distribution and evolution ofmost quasar activity.
Integrating the QLF over the appropriate range, we triv-ially obtain the active fraction, and can calculate this sepa-rately for each host massMgal or BH massMBH in Equa-tion (8). Figure 19 compares this to observations at bothlow and high redshift, for systems withm≡ L/LEdd > 0.1,representative of typical Seyfert and quasar populations (e.g.McLure & Dunlop 2004). Note that the quasar lifetime in-tegrated above this threshold is close to a constant value
. 108 yr, similar to observational estimates (Martini 2004).At very low masses/levels of activity, other fueling mecha-nisms may be dominant – for comparison with e.g. the ac-tive fractions in Hao et al. (2005) of typical. 107M⊙ BHs(. 1010M⊙ hosts), we refer to secular and/or “stochastic” ac-cretion models in disks (e.g. Hopkins & Hernquist 2006) andold ellipticals (Simões Lopes et al. 2007). Furthermore, atthelowest masses plotted, the typical AGN luminosities becomeextremely faint (typicalMB & −18 in Mgal . 1010M⊙ hosts),and so such systems may be more often classified as non-AGNor typical star-forming systems (e.g. Rodighiero et al. 2007).At high levels of accretion, however, the merger-driven pre-diction agrees well with observations at low and high red-shift, and predicts a downsizing trend similar to that seen –namely that fromz= 2 to z= 0, quasar activity has been par-ticularly suppressed in the most massive systems (althoughithas been suppressed to some extent at all host masses), pre-sumably owing to the conversion of these systems to “red anddead” spheroids without cold gas supplies (see Paper II).
We next follow Lidz et al. (2006), and extend Equation (8)to convolve over the expected bias of the active systems ateach quasar luminosityL,
b(L) =1
φ(L)
∫
b(MBH) tQ(L |MBH) n(MBH |z)d logMBH, (9)

22 Hopkins et al.
0.0
0.2
0.4
0.6
0.8⟨f A
GN⟩
z ∼ 0
Kauffmann et al. 2003
10.5 11.0 11.5 12.0log( Mgal / MO •
)
0.0
0.2
0.4
0.6
0.8
⟨f AG
N⟩
z ∼ 2Erb et al. 2006Kriek et al. 2006
FIG. 19.— Predicted AGN fraction as a function of host properties. Top:Low-redshift quasar fraction (defined here by Eddington ratios m> 0.1) asa function of galaxy mass. Black lines show the prediction ofour merger-driven model, in the style of Figure 9. Observed fractions are shown downto (roughly) their completeness limit, from Kauffmann et al. (2003).Bottom:Same, but atz≈ 2, with the AGN fraction determined observationally in LBG(Erb et al. 2006) andK-selected (Kriek et al. 2006) samples. Some cautionshould be applied atMgal . 1010M⊙, as the AGN luminosities become suf-ficiently low that even moderate star formation will dominate the observedluminosity and systems may not be classified as AGN.
whereb(MBH) is determined just asb(Mgal) in § 2.4, by con-volving over the contributions to each merging range inMBHfrom all Mhalo. Figure 20 plots the expected bias as a func-tion of luminosity at each of several redshifts. As origi-nally demonstrated in Lidz et al. (2006), our model for quasarlightcurves and the underlying triggering rate of quasars pre-dicts a relatively weak dependence of clustering on quasar lu-minosity. Here, we essentially re-derive this result with ana priori prediction of these triggering rates, as opposed tothe purely empirical (fitted to the QLF) rates from Lidz et al.(2006), and find that the conclusion is robust. However,this prediction is not necessarily a consequence of merger-driven models (nor is it unique to them) – we show the pre-dictions from the semi-analytic models of Wyithe & Loeb(2002) and Kauffmann & Haehnelt (2000), who adopt sim-plified “lightbulb”-like quasar lightcurves (for a detailed dis-cussion of these differences, see Hopkins et al. 2007d).
The reason for the weak dependence of quasar clusteringon luminosity in Figure 20 is, in fact, the nature of the quasarlightcurve. Quasars grow rapidly in mergers to a peak quasarphase at the final stages of the merger, which exhausts andexpels the remaining gas, after which the quasar decays tolower luminosities. This decay moves objects of the samehost properties to fainter luminosities in the QLF, making the
clustering properties flat as a function of luminosity. Thus,while an important test of our modeling (that the correct halosand galaxies host quasars of the appropriate luminosities), thisis not a unique prediction of merger-driven models.
We can also use our model to estimate the infrared lumi-nosity functions of various populations versus redshift. Byconstruction, our assumed halo occupation model reproducesthe observed star-forming (blue) galaxy mass function at eachredshift. Using the corresponding fitted star-formation histo-ries as a function of baryonic mass from Noeske et al. (2007)(which fit the observations locally and their evolution at leastto z∼ 1.5), we immediately obtain an estimate of the star for-mation rate function in “quiescent” (non-merging) galaxies ateach redshift. We include a scatter of∼ 0.25dex in SFR atfixed stellar mass, comparable to that observed (in blue galax-ies), but this makes relatively little difference, as the most ex-treme SFR populations are dominated by mergers. We thenadopt the standard conversion from Kennicutt (1998) to trans-form this to an infrared luminosity function (where we referto the total IR 8− 1000µm luminosity).
Our model also yields the mass function of gas-rich merg-ers, for which we can estimate their distribution of star for-mation rates. In Hopkins et al. (2006f), we quantify the dis-tribution of star formation rates as a function of galaxy prop-erties from the same large suite of simulations used to esti-mate the quasar lifetime. Essentially, this quantifies the “life-time” above a given SFR in a merger, which can be reasonablyapproximated as a simple function of galaxy mass and (pre-merger) gas fraction,
t(> M∗) = t∗Γ(
0,M∗
M f fgas/t∗
)
, (10)
whereM f is the post-merger galaxy mass (i.e. ourMgal) andt∗ ≈ 0.3Gyr is a fitted characteristic time. This functionalform simply amounts to the statement that there is a meancharacteristic timescalet∗ in which most of the gas mass of themerger (M f fgas) is converted into stars, which we find is (un-surprisingly) similar to the dynamical time of the merger andto observational estimates of the characteristic star formationtimescale in starbursts and ULIRGs (Kennicutt 1998). Sincethe fitted star-formation histories of Noeske et al. (2007) im-plicitly define a gas fraction as a function of time (or can beused in combination with the Schmidt-Kennicutt star forma-tion law to infer the gas fraction), we simply adopt these forthe pre-merger galaxies (but we have checked that they cor-rectly reproduce observed gas fractions as a function of massat z = 0, 1, 2; see Hopkins et al. 2007c). It is worth notingthat, with this estimate, the explicit dependence onfgascan becompletely factored out in Equation (10), and we can write itas an estimate of the amount of time a system spends above agiven enhancement in SFR (basically a merger enhances theτ -model SFR by∼ τ/t∗), relative to the pre-merger SFR. Us-ing the same SFR toLIR conversion, we obtain a rough esti-mate of the IR luminosity function of mergers.
Finally, adopting the empirically calculated obscured frac-tion as a function of quasar luminosity from Gilli et al. (2007),and assuming that the obscured bolometric luminosity is re-radiated in the IR, we convert our predicted bolometric QLFto an IR QLF of obscured quasars. Technically, not all ofthe luminosity will be obscured, of course, but we find thate.g. using the full distribution of column densities as a func-tion of quasar luminosity from Ueda et al. (2003) to attenu-ate a template AGN SED yields a very similar answer (see

Co-Evolution of Quasars, Black Holes, and Galaxies I 23
0
2
4
6
8
z = 0.5B
ias
z = 1.0
11 12 13 14log( Lbol / LO •
)
0
2
4
6
8
z = 1.5
11 12 13 14log( Lbol / LO •
)
z = 2.0
0.0 0.5 1.0 1.5 2.0z
-1.5
-1.0
-0.5
0.0
0.5
1.0
1.5
d(b
/ b∗)
/ dl
og L
FIG. 20.— Left: Predicted bias as a function of quasar luminosity from our merger-driven model (black lines, style as in Figure 9). To contrast, the expectedbiasb(L) from the semi-analytic models of Wyithe & Loeb (2002, cyan)and Kauffmann & Haehnelt (2000, orange with diamonds) are plotted (dot-dashed lines);these adopt simplified (constant or exponential “on/off”) quasar lightcurves. Points are measurements from Croom et al. (2005, red squares), Adelberger & Steidel(2005, orange crosses), Porciani & Norberg (2006, purple diamonds), Myers et al. (2006a, blue circles), da Angela et al.(2006, magenta stars), and Coil et al.(2007, black open circles). For ease of comparison, all luminosities are converted to bolometric luminosities using the corrections from Hopkins et al. (2007e).Vertical blue dotted lines showL∗ in the QLF at each redshift, from Hopkins et al. (2007e).Right: The best-fit slope of the dependence of bias on luminosity atthe QLFL∗, i.e. d(b/b∗)/d log (L/L∗), whereb∗ ≡ b(L∗). Points are determined from the observations at left, withthe observations from Myers et al. (2006a,cyan circles) and Grazian et al. (2004); Wake et al. (2004, black open diamond) added. Lines are in the style of the left panel, with the red dashed line showingno dependence of bias on luminosity. Adopting an a priori model for merger-triggered quasar activity reproduces the empirical prediction from Lidz et al. (2006),that quasar bias should depend weakly on quasar luminosity.
also Franceschini et al. 2005), as does using a mean X-ray toIR bolometric correction of obscured AGN (Elvis et al. 1994;Zakamska et al. 2004; Polletta et al. 2006). Including the IRcontribution from un-obscured quasars is a negligible correc-tion.
Figure 21 compares the resulting predicted IR luminosityfunctions to observations atz = 0− 2, and to the observedIR luminosity density fromz ∼ 0− 5. At all redshifts, theagreement is good, which suggests that our model accuratelydescribes the star-formation history of the Universe. Thisshould be guaranteed, since at all redshifts the quiescent pop-ulation dominates the∼ L∗ optical and IR luminosity func-tions (hence also the star formation rate and IR luminositydensities) – at this level, we simply confirm that our halo oc-cupation model is a good approximation. However, at highluminosities, typical of ULIRGs, the populations are gener-ally dominated by mergers and (at the highest luminosities)obscured AGN.
We explicitly quantify the transition point as a function ofredshift in Figure 22 (we show the comparison there just forour “default” model, but as is clear in Figure 21, the transi-tion between different populations dominating the LF is sim-ilar regardless of the exact version of our model adopted).Our comparisons generally affirm the conventional wisdom:at low redshift, mergers dominate the ULIRG and much of theLIRG populations, above a luminosity∼ 1011.4L⊙, with heav-ily obscured (potentially Compton-thick) AGN (in starburstnuclei) becoming a substantial contributor to IR luminouspopulations in the most extreme& a few × 1012L⊙ systems(nearing hyper-LIRG> 1013L⊙ luminosities which are com-mon bolometric luminosities for> 108M⊙ BHs near Edding-ton, but would imply potentially unphysical& 1000M⊙yr−1
SFRs). At higher redshifts, disks are more gas-rich, and thushave characteristically larger star formation rates, dominatingthe IR LFs at higher luminosities. Byz∼ 1, most LIRGsare quiescent systems, and byz∼ 2, only extreme systems& a few ×1012L⊙ are predominantly mergers/AGN.
This appears to agree well with recent estimates of the tran-sition between AGN and passive star formation dominatingthe bolometric luminosities of high-redshift systems. Inter-estingly, this shift occurs even while increasing merger rates(and higher gas fractions in typical mergers) lead to a largeroverall contribution of mergers to the star formation rate andIR luminosity densities. Atz∼ 0, mergers contribute neg-ligibly to the total IR luminosity density, but byz∼ 2, theymay contribute∼ 20− 50% of the IR output of the Universe,with that contribution owing comparably to both star forma-tion in mergers and obscured BH growth (which should betrue, given theMBH − Mhost correlations and typicalǫr ∼ 0.1radiative efficiencies; see, e.g. Lidz et al. 2007a).
The integrated contribution of mergers to the star forma-tion rate and IR luminosity densities agrees well with obser-vational estimates (available atz . 2; see Bell et al. 2005;Menanteau et al. 2006), and the constraint from stellar pop-ulation models that only a small fraction of thez = 0 stel-lar mass in typical early-type galaxies was formed in thespheroid-forming merger itself (as opposed to more extendedstar formation in the pre-merger disks; e.g. Noeske et al.2007). For a more detailed comparison and analysis of themerger-induced contribution to the star formation rate densityof the Universe, we refer to Hopkins et al. (2006f).
We caution that the above comparisons are approximate,and intended as a broad check that our models are consistentwith the observed abundance of IR luminous galaxies as a

24 Hopkins et al.
-10
-8
-6
-4
-2 z = 0.0
log(
φ) [
Mpc
-3 lo
g(L)
-1]
z = 0.5
10 11 12 13 14-10
-8
-6
-4
-2 z = 1.0
log( LIR / LO • )
10 11 12 13 14
z = 2.0
0 1 2 3 4z
108
109
ρ IR [
LO • M
pc-3 ]
FIG. 21.—Left: Predicted total IR (8−1000µm) luminosity functions at different redshifts (as labeled). Green, blue, and red lines shows the estimated contribu-tion from non-merging systems, star formation in mergers, and obscured AGN in mergers, respectively. Linestyles are asin Figure 9, for the variants of the mergercalculations. Points show observational estimates from Saunders et al. (1990, magenta stars), Soifer & Neugebauer (1991, blue triangles), Yun et al. (2001, blackcircles), Le Floc’h et al. (2005, black diamonds), Chapman et al. (2005, black inverted triangles), Babbedge et al. (2006, black squares), and Caputi et al. (2007,black×’s). Right: Integrated IR luminosity density. Solid lines show the contributions from non-merging systems (green), star formation in mergers (blue), andobscured quasars in mergers (red). Blue dotted shows the total (star formation+AGN) merger contribution, black dashedshows the total from all sources. Orangepoints show observational estimates ofρIR from the compilation of Hopkins (2004, circles; only the direct IR observations therein are plotted here), as well asLe Floc’h et al. (2005, diamonds), Pérez-González et al. (2005), and Caputi et al. (2007,×’s). Red stars show the bolometric quasar luminosity density fromFigure 13, rescaled by a constant (mean) obscured-to-unobscured ratio of∼ 2 : 1. The agreement in all cases is good – our model reproducesthe star formationhistory of the Universe and distribution of star formation rates and bolometric luminosities.
0 1 2 3 4z
11.0
11.5
12.0
12.5
13.0
13.5
log(
LIR
/ L O
• )
Mergers Dominate
Quiescent Galaxies Dominate
0 1 2 3 4z
(Obscured) AGN Dominate
Star Formation Dominates
FIG. 22.— Left: Total IR luminosity, as a function of redshift, abovewhich mergers (star formation+AGN) dominate the total IR luminosity func-tions (solid line, from Figure 21; dashed lines show the range above which25/75% of systems on the luminosity function are mergers). Point showsthe corresponding transition point (and range) observed inlow-redshift sys-tems (Sanders et al. 1988b).Right: Same, but for the transition between starformation (in non-merging+merging systems) and (obscured) AGN dominat-ing the IR luminosity functions (generally a factor∼ a few larger luminositythan the quiescent system-merger transition). Points showthe observed esti-mates from comparison of PAH feature strengths in Lutz et al.(1998, low red-shift) and Sajina et al. (2007, high redshift). A similar estimate is obtained (atlow redshift) from comparison of emission line strengths (Sanders & Mirabel1996; Kewley et al. 2007), full SED template fitting (Farrah et al. 2003), orindirect comparison with Type 2 AGN luminosity functions (Chary & Elbaz2001). The model predicts the local transitions, and that byz& 1, the LIRGpopulation is dominated by quiescent star formation in gas-rich systems (evenas the total and fractional luminosity density in mergers increases rapidly).
function of redshift. We have ignored a number of potentiallyimportant effects: for example, obscuration is a strong func-tion of time in a merger, and may affect various luminositiesand morphological stages differently. Moreover, our simple
linear addition of the star formation contribution of mergersto the IR LF and the AGN contribution is only technically cor-rect if one or the other dominates the IR luminosity at a giventime in the merger; however, there are clearly times during thefinal merger stages when the contributions are comparable.Resolving these issues requires detailed, time-dependentra-diative transfer solutions through high-resolution simulationsthat properly sample the merger and quiescent galaxy param-eter space at each redshift, and is outside the scope of thiswork (although an important subject for future, more detailedstudy; see, e.g. Li et al. 2007). It would be a mistake, there-fore, to read too much into e.g. the detailed predictions forsub-millimeter galaxies or other extreme populations basedon Figures 21 & 22. However, most of our predicted qualita-tive trends, including the evolution of the luminosity density(and approximate relative contribution of mergers) and theshift in where quiescent or merger-driven populations dom-inate the bright IR LF, should be robust. Critically, a modelinwhich merger-driven quasar activity dominates the QLF pre-dicts an abundance of IR-luminous galaxies consistent withthe observations as a function of both luminosity and redshift.
3.3. When Merger-Triggering Loses to Secular Processes
Despite these arguments for a merger-driven origin forbright, high-redshift quasars, there are good reasons to be-lieve that most local, high-Eddington ratio objects arenot re-lated to mergers. Most active local systems typically involverelatively low-mass BHs (MBH ∼ 107M⊙; Heckman et al.2004), in Sa/b-type host galaxies, without significant evi-dence for recent major interactions (Kauffmann et al. 2003;Pierce et al. 2006), and have relatively low Seyfert-level lu-minosities (−21& MB & −23; Hao et al. 2005), below the tra-ditionalMB = −23 Seyfert-quasar divide. Given this, it is nat-

Co-Evolution of Quasars, Black Holes, and Galaxies I 25
0.01 0.10 1.00r [ h-1 Mpc ]
1
2
3
4
5B
ias
b Q
Quasars (-23.3 > Mi > -24.2)Seyferts (-22.0 > Mi > -23.3)
FIG. 23.— As Figure 17 (upper center panel), but comparing the clus-tering (quasar-galaxy cross-correlation) as a function ofscale measured bySerber et al. (2006) for bright optical quasars and dimmer Seyfert galaxies.Quasar clustering is consistent with our predicted excess on small scales, in-dicating a merger-driven origin, but low-luminosity systems show no suchdependence, suggesting that processes independent of the local, small-scaledensity (e.g. secular processes) may dominate at these luminosities.
ural to ask whether there are additional reasons to believe thatbright quasars have distinct origins, and if so, when (or atwhat luminosities) these non-merger driven fueling mecha-nisms begin to dominate AGN populations.
In addition to the arguments in § 3.1 & 3.2, thereare a number of qualitative differences between bright,high-redshift quasars and local Seyferts. Quasars havesignificantly different clustering amplitudes (Hopkins etal.2007d) and host stellar mass distributions (Hopkins et al.2007a) from star-forming galaxies atz & 1, and typicallyhave hosts with elliptical or merger remnant morphologies(Floyd et al. 2004; Falomo et al. 2004; Zakamska et al. 2006;Letawe et al. 2006), frequently exhibiting evidence of tidaldisturbances (Bahcall et al. 1997; Canalizo & Stockton 2001;Hutchings et al. 2003, 2006; Urrutia et al. 2007; Bennert et al.2007). Figure 23 compares the clustering as a function ofscale measured in Serber et al. (2006) for both bright quasarsand Seyfert galaxies – quasars exhibit the strong trend ofexcess clustering on small scales indicative of a triggeringprocess which prefers small-scale overdensities, but Seyfertsshow no significant preference for local overdensities.
Because galaxy mergers are also associated with the ter-mination of star formation in the remnant (even if only tem-porarily), i.e. a rapid post-starburst phase and transition to thered sequence (discussed in detail in Paper II), the decay of thequasar lightcurve should be associated with the reddening ofthe remnant, in a merger-driven model. This implies a par-ticular preferred track for quasar hosts in the color-magnitudediagram, illustrated in Figure 24. In this scenario, quasarsshould be associated with the crossing of the “green valley”–i.e. the triggering of a quasar occurs at the end of the merger,when young stellar populations imply a bluer-than-averagehost spheroid, and the quasar decays to lower luminosities asthe remnant reddens onto the red sequence.
Alternatively, if quasars were triggered in a purely secu-lar manner, or otherwise independent of whatever quenchingmechanism terminates the galactic supply of cold gas, thentheir natural preferred location is in the blue cloud – i.e. blue-ward of the “green valley.” Systems in this regime still havecold gas supplies and have not yet quenched. Because thequenching is uncorrelated with quasar triggering in such a
-18 -19 -20 -21 -22 -23
-1.0
-0.5
0.0
0.5
1.0
1.5
2.0
U -
V
Mergers
Quasars(In/Post-Transition)
-18 -19 -20 -21 -22 -23
-1.0
-0.5
0.0
0.5
1.0
1.5
2.0
U -
V
Secular/Quenching
Quasars(Pre-Transition)
-18 -19 -20 -21 -22 -23MV
-1.0
-0.5
0.0
0.5
1.0
1.5
2.0
U -
V
Sanchez et al. (2004)
FIG. 24.— Location of quasars in the color-magnitude diagram, expectedfrom different models.Top: Red and blue dotted regions roughly outlinethe red sequence and blue cloud, respectively, with the dashed line divid-ing the bimodality (from Bell et al. 2004). Arrows show the preferred loca-tion of quasar hosts in a merger driven model. At the end of a merger, abright quasar is triggered in a spheroid/merger remnant at the top of the bluecloud (owing to the young stellar populations from pre-merger and merger-induced star formation), and subsequently the quasar luminosity decays whilethe remnant rapidly reddens, leaving a relatively low accretion rate remnanton the red sequence.Middle: Same, but for a secular triggering scenario inwhich quasar activity (which must still require cold gas) isuncorrelated withquenching or itself exhausts the gas supply. In this case, quasars should livein the blue cloud, with gas-rich systems, and their abundance rapidly dropsapproaching the “green valley” as gas supplies are exhausted. Bottom: Wecompare to observations of quasar host galaxy colors atz∼ 0.7 − 1.1 fromSánchez et al. (2004, blue circles). X-ray identified AGN andquasar hostsfrom Nandra et al. (2006, orange diamonds) are also shown (the numbersplotted should not be taken literally, as we have rescaled the authorsU −B vs.MB color-magnitude relation to that shown here for the sake of direct compar-ison, but the result is qualitatively identical to that shown). Arrows reproducethe merger expectation from the top panel. Quasars appear tolive in theregion of color-magnitude space expected if they are triggered at thetermi-nation of star formation, and subsequently decay in luminosity, asexpectedin merger-driven scenarios.

26 Hopkins et al.
model, and the lack of galaxies in the “green valley” impliesthat this transition is rapid, very few quasars would be ex-pected to be triggered just as the quenching occurs, and there-fore few quasars should be present in the “green valley.”
Comparing these qualitative scenarios with observationsappears to favor the former, merger-driven case. Quasars tendto live redwards of the “top” of the blue cloud, with the bright-est/highest accretion rate quasars preferentially in bluer-than-average spheroids in the “green valley” (Kauffmann et al.2003; Sánchez et al. 2004; Nandra et al. 2006).
Figure 25 shows this quantitatively – we plot the distribu-tion of colors of quasar hosts, compared with that fitted to theblue cloud and red sequence, or systems with observed barsand/or disk instabilities (the expected quasar hosts in a secularmodel, regardless of quasar duty cycles during a bar phase),and post-starburst (E+A/K+A) systems, largely identified asmerger remnants and “blue spheroids” (see the discussion in§ 2.3). The quasar hosts clearly lie preferentially betweentheblue cloud and red sequence, with a color distribution verysimilar to observed post-starburst galaxies.
The distribution is quite distinct, however, from observedbarred systems, which lie overwhelmingly on the blue se-quence with, if anything, a bias towards the bluest systems(which is expected, as these are the most gas-rich and there-fore most unstable systems). Even if one assumes that, in themost extreme bar instabilities, dust reddening might move thesystem into the “green valley” as a reddened disk, this ap-pears to contradict the observations above which find quasarsto be in preferentially blue spheroids (even X-ray observa-tions, which suffer less severe bias against dust-reddenedsystems). A more rigorous quantitative comparison of thetracks through color-magnitude space and the relative abun-dances in this transition region will be the topic of future work(Wuyts et al. 2007, in preparation), and we stress that theseare all relatively low-redshift samples, but studying how themean quasar luminosity and accretion rates scale/decay withthe degree of reddening or aging of their host stellar popula-tions can provide a powerful discriminant between these mod-els.
There are a number of additional constraints we can placeon the contribution to the QLF from secular fueling in non-merging disks. Figure 26 considers several of these. First,weplace a limit on secular activity by asking: at a givenz, whatare the brightest QSOs possible in disk/star-forming galax-ies? For that redshift, we take the observed mass function ofstar forming galaxies, and convolve withP(MBH |Mgal) to ob-tain the hosted BH mass function (assuming the most massivedisks are Sa/b-type galaxies). Then, assume that every suchBH is at its Eddington luminosity. At some point (correspond-ing to& 2−4M∗ in the disk mass function) the number densityof these mock quasars falls below the QLF (which declinesmuch less rapidly) at that luminosity and redshift. In otherwords, at high luminosities, the required BH masses from theEddington limit are too large to live in late-type galaxies.Tobe optimistic, we assumeall the quasar luminosity density be-low this limit is contributed by secular activity in disks. Thisthen gives an upper limit to the fraction of the luminosity den-sity from disks. We repeat this procedure for a number ofdifferent mass functions at different redshifts. In all cases,even this limit falls to a fraction≪ 1 byz& 1, as the QLFL∗
reaches large luminosities corresponding toMBH & 108M⊙
BHs at the Eddington limit. Given the BH-host spheroid massrelations, this requires a very massive spheroid, easily formed
in a merger, but not present in even the most early-type disks.Second (alternatively), we assume all BHs in pseudobulges
were formed via secular mechanisms. As discussed in § 1,there is good reason to believe that this is the case, whereasclassical bulges must be formed in mergers. For a givenz = 0 BH population, we infer an accretion history in thestandard fashion from matching the BH mass function andcontinuity equations (e.g. Salucci et al. 1999; Yu & Tremaine2002). We then calculate the fraction of the QLF luminos-ity density at a given redshift from systems which, atz = 0,live in pseudobulges. We consider this for several differ-ent observational estimates of the pseudobulge fraction asa function of e.g. host galaxy morphological type or bulgeSersic index (Kormendy & Kennicutt 2004; Balcells et al.2004; Allen et al. 2006; Noordermeer & van der Hulst 2007),and the directly estimated pseudobulge mass functions inDriver et al. (2007). Although the details are sensitive to howwe define pseudobulges, we find a similar result – massiveBHs which dominate the luminosity density atz& 1 live inthe most massive bulges/ellipticals, which are overwhelm-ingly classical bulges.
Third, we calculate the probability that the observed clus-tering of quasars is consistent with that of star forming/diskgalaxies (see Figure 15). This is subject to some importantcaveats – although quasar clustering depends only weakly onluminosity (see Figure 20), galaxy clustering has been shownto depend quite strongly on galaxy luminosity/stellar mass(Norberg et al. 2002). We use the compilation of clusteringdata from Hopkins et al. (2007d), as in Figure 15. Atz. 1.5,we specifically compare the clustering of∼ L∗ quasars withthat of ∼ L∗ blue/star-forming galaxies. Forany model inwhich quasars are driven by secular activity and the statis-tics of quasar light curves/triggering are continuous as a func-tion of host mass/luminosity (i.e. there is not a second featurein the luminosity function introduced by the statistics of thelight curves themselves), these should roughly correspond. Athigher redshift, galaxy clustering as a function of type andluminosity/mass at∼ L∗ is not clearly resolved so we canonly plot combined clustering of observed star-forming popu-lations (generally selected as Lyman-break galaxies); againcaution is warranted given the known dependence of clus-tering on galaxy mass/luminosity (for LBGs, see Allen et al.2005). Fortunately, the range of particular interest here isz. 1, where we again find a similar trend – quasar cluster-ing is consistent with secular fueling atz∼ 0, but byz∼ 1this is no longer true. As discussed in Hopkins et al. (2007d),this appears to be contrary to some previous claims (e.g.,Adelberger & Steidel 2005); however, in most cases wherequasars have been seen to cluster similarly to blue galaxies,either faint AGN populations (not∼ L∗ quasars) or bright(≫ L∗) blue galaxies were considered. Indeed, quasars docluster in a manner similar to thebrightestblue galaxies ob-served at several redshifts (e.g., Coil et al. 2007; Allen etal.2005, atz∼ 1 andz& 2, respectively). This should not be sur-prising; since quasars require some cold gas supply for theirfueling, they cannot be significantly more clustered than themost highly clustered (most luminous) population of galaxieswith that cold gas.
Finally, we compare these with a simple model expectation.We combine our prediction of the merger-driven QLF with themodel from Hopkins & Hernquist (2006) for the QLF drivenby secular fueling mechanisms in star-forming galaxies. Thisprediction is based on a simple model of feedback-driven self-regulation, calculating the rate of triggering in non-merging

Co-Evolution of Quasars, Black Holes, and Galaxies I 27
1.0 1.5 2.0 2.5 3.00.0
0.2
0.4
0.6
0.8
1.0
N (
Arb
itrar
y U
nits
)
Blue GalaxiesRed Galaxies
(Strateva et al. 2001)
1.0 1.5 2.0 2.5 3.0u - r
Disk Instabilities/Bars(Barazza et al. 2006)
1.0 1.5 2.0 2.5 3.0
E+A/Merger Remnants(Goto 2005)
FIG. 25.— Distribution of quasar host galaxy colors from Figure24 (histograms; from Sánchez et al. (2004) and Nandra et al. (2006) in dark blue and orange,respectively). We compare with fitted (Gaussian) color distributions of blue cloud and red sequence galaxies from Strateva et al. (2001), with the distribution ofcolors of barred galaxies in the SDSS from Barazza et al. (2006) (the expected quasar hosts in a secular or instability-driven quasar fueling model), and with thefitted (Gaussian) distribution of post-starburst (generally merger remnant) E+A/K+A galaxies in Goto (2005). Quasar host colors follow the “transition” betweenblue cloud and red sequence observed and expected in merger remnants, in contrast to the preferentially most gas-rich, blue hosts of observed strong bars.
disks from the observed statistics of gas properties in the cen-tral regions of star-forming galaxies of different types. Theresult is similar to the empirical constraints.
All of these comparisons have important caveats. For exam-ple, secular mechanisms could act so quickly as to completelytransform disks to bulges, rapidly making very large BHs (al-though this conflicts with the pseudobulge constraints) fromdisk hosts. Pseudobulges could form in more systems than weestimated, but be subsequently transformed to classical bulgesvia major mergers. Clustering could be affected by a numberof systematic uncertainties inherent in e.g. the mass and lu-minosity ranges considered. However, these systematics areindependent, and there is no single loophole which can si-multaneously reconcile the three constraints considered herewith the possibility that secular fueling dominates bright∼ L∗
quasar activity atz& 1. Although there are differences in de-tail, all the methods we have considered empirically suggesta similar scenario: secular (non-major merger related) fuel-ing mechanisms contribute little to quasar activity atz& 1,which involves the most massiveMBH & 108M⊙ BHs in themost massive spheroids. Byz∼ 0.5, however, the most mas-sive BHs are no longer active, and a significant fraction of thequasar luminosity density can come from∼ 107M⊙ BHs inundisturbed hosts. Byz∼ 0, the local QLF is largely dom-inated by Seyfert activity in relatively small BHs with late-type, undisturbed host disks (Heckman et al. 2004).
Even if we ignore these constraints, a model in which secu-lar fueling dominates the growth of quasars and BHs has dif-ficulty matching the observed rise and fall of the quasar lumi-nosity density with cosmic time. Figure 27 illustrates this. Weshow the observed bolometric quasar luminosity density as afunction of redshift, compared to our estimate of the merger-driven luminosity density (as in Figure 13). We also show ourestimate of the luminosity density which comes from systemswhich, atz = 0, live in pseudobulges, calculated as in Fig-ure 26. Again, this fairly moderate, empirical model of secu-lar activity can account for the observed luminosity density atlow redshiftsz. 0.5, but provides only a small contributionat high redshiftsz& 1.
We might, however, imagine a “maximal” secular modelin which all spheroids are initially formed by disk instabili-ties. Equivalently (for our purposes), albeit highly contrived,a model might invoke secular processes to rapidly build up
BH mass (to the final mass that will be given by the “future”MBH − σ relation) before a spheroid is formed in later merg-ers and/or instabilities. These have severe difficulty recon-ciling with the kinematics of observed classical bulges (see§ 1) and the tightness of the BH-host spheroid correlations,respectively, and are not favored by simple dynamical argu-ments (see, e.g. Shen et al. 2003), nor the constraints in Fig-ure 26, but they could in principle be invoked. In fact, thesemi-analytic model of Bower et al. (2006) is effectively sucha scenario, in which a very strong disk instability mode is an-alytically adopted, which overwhelmingly dominates initialbulge formation and BH growth (mergers contributing≪ 1%at all redshifts). We therefore compare their estimate for thetotal quasar luminosity density (accretion rate density) as afunction of time. Finally, in the default Bower et al. (2006)model, there is still some growth of BHs via accretion fromthe diffuse ISM, cooling, and mergers (major and minor). Wetherefore also adopt an even more extreme secular model, inwhich we reproduce the Bower et al. (2006) analysis with aneven stronger disk instability mode – essentially renormaliz-ing the model such that allz = 0 bulge mass was formed inthis “secular” mode (i.e. we allowno subsequent growth viaother mechanisms, and demand that the observed integratedz = 0 BH mass density be matched by the integrated secularmode growth). This latter model is of course unphysical, butyields a hard upper limit to secular-mode growth.
It is immediately clear that the “maximal” secular modelpredicts that the quasar luminosity density should peak atmuch higher redshiftsz∼ 4 than the observedz∼ 2. In gen-eral, the rise and fall of the quasar luminosity density in such amodel are offset to earlier times. The reason for this is simple:in a fully cosmological model, mergers areinevitable. And,whether or not most quasars are triggered by mergers, it is ex-tremely difficult to contrive a major, gas-rich merger withoutBH accretion and spheroid formation, with most of the gas be-ing consumed by star formation. The only way that a secularor disk instability model can dominate the integrated buildupof BH mass and quasar luminosity density is to “beat merg-ers to the finish,” i.e. to generally operate early and rapidlyenough such that the BHs have been largely formed, and gasalready exhausted, by the time massive galaxies undergo theirfirst major mergers. In such models, then, one is forced topredict that the quasar luminosity density peaks at very early

28 Hopkins et al.
0.0 0.5 1.0 1.5 2.0 2.5
0.0
0.2
0.4
0.6
0.8
1.0U
pper
Lim
it f s
ecul
ar
0.0 0.5 1.0 1.5 2.0 2.5
0.0
0.2
0.4
0.6
0.8
1.0
f pse
udob
ulge
hos
t
0.0 0.5 1.0 1.5 2.0 2.5 3.0
0.001
0.010
0.100
1.000
P(b
Q =
bla
te ty
pes)
0.0 0.5 1.0 1.5 2.0 2.5z
0.0
0.2
0.4
0.6
0.8
1.0
f sec
ular (
Mod
els)
FIG. 26.— Fraction of the integrated quasar luminosity densityowing tonon-merger driven secular mechanisms.Top: Upper limit to the contribu-tion from BHs in disk galaxy hosts at eachz (see text). Limits are derivedfrom the observed type-separated mass functions in Figure 16 (same style)and Franceschini et al. (2006, cyan stars). Solid line assumes the disk massfunction does not evolve withz. Second from Top:Fractional contributionfrom systems in pseudobulges atz = 0. Local distribution of pseudobulgemasses is estimated from the observed pseudobulge fractionversus galaxytype (Noordermeer & van der Hulst 2007, red dashed line, with∼ 1σ shadedrange), or assuming all bulges with Sersic indexn< 2 are pseudobulges (withthe distribution ofn versus bulge mass from Balcells et al. 2004, black solidline and shading), or from directly measured pseudobulge mass functions(Driver et al. 2007, blue long-dashed line and shading).Second from Bot-tom: Probability (fromχ2) that observed clustering of quasars (data in Fig-ure 15) and star-forming galaxies reflect the same hosts. Solid line is derivedfrom the best-fit to the compilation of Hopkins et al. (2007d)points from theindividual measurements included (see Figure 15).Bottom: Predicted frac-tion of the luminosity density from the the model for secularfueling fromHopkins & Hernquist (2006), when combined with the merger-driven modelherein.
0 1 2 3 4 5 6z
6.5
7.0
7.5
8.0
8.5
Lum
inos
ity D
ensi
ty l
og(j b
ol)
[LO • M
pc-3]
Mergers Dominate BH/Bulge GrowthEmpirical Secular (Disk Instabilities -> Pseudobulges)Maximal Secular (All Spheroids Initially Formed by Disk Instability)Extreme (Unphysical) Secular (All Spheroid Mass From Disk Instabilities:
No Accretion/Minor Mergers/Gas-Rich Mergers)
FIG. 27.— Bolometric quasar luminosity density as a function ofredshift.Black stars show the observations from Hopkins et al. (2007e). Lines showestimates from different models (as labeled): the prediction from a merger-driven model (as in Figure 13) and a moderate secular model inwhich BHsin pseudobulges atz = 0 were formed in disk instabilities (as in Figure 26,line in same style) are in good agreement with the luminositydensity evo-lution and empirical constraints on clustering, host galaxy colors, spheroidkinematics, and disk/spheroid mass functions. We compare amaximal secu-lar model, from Bower et al. (2006), in which most BHs and (even classical)spheroids are initially formed via disk instabilities, andan “extreme” secularmodel, in which allz = 0 BH mass is formed in such instabilities (same asthe maximal secular model, but with no BH growth from cooling, accretion,or mergers; this is unphysical but serves as a strong upper limit). In order fordisk instabilities to dominate BH growth, they must act veryrapidly, beforethe (inevitable) major mergers can exhaust gas and form massive spheroids– this forces such models to predict a luminosity density history offset toearlier times (higher redshifts) compared to the merger-driven model, in dis-agreement with the observations.
times and has largely declined (i.e. most of the gas in massivesystems has already been exhausted) byz∼ 2.
Finally, this relates to a more general point. The quasar lu-minosity density (and especially the number density of brightquasars corresponding to& 108M⊙ BHs at high Edding-ton ratio; see Fan et al. 2004; Richards et al. 2006b) declinesrapidly at z & 2 − 3 (roughly as∼ (1+ z)4−6), compared tothe global star formation rate density of the Universe, whichis relatively flat at these redshifts (declining as∼ (1+ z)0−1.5
from z ∼ 2 − 6; Hopkins & Beacom 2006). This has longbeen recognized, and cited as a reason why quasars and BHgrowth cannot explain reionization at high redshifts (since,similar to the global star formation history, the UV back-ground declines slowly at these redshifts). It further impliesthat BH growth (at least at the masses of interest for our pre-dictions here) cannot generically trace star formation. Thisplaces strong constraints on secular models, as above, as wellas models in which essentially all high-redshift star forma-tion is in bulges or some sort of dissipational collapse (e.g.Granato et al. 2004; Lapi et al. 2006). Some process must de-lay the formation of massive BHs, while allowing star andgalaxy formation to proceed efficiently at high redshifts. Anatural explanation is that massive BH formation requires ma-jor mergers. In our model, at high redshifts, low-mass galax-ies can efficiently form (and potentially build low-mass BHsvia secular instabilities), but they are predominantly disks,which efficiently turn gas into stars and do not form verymassive bulges or BHs. Only later, once their hosts havegrown more massive, are they likely to undergo major merg-ers, which transform the disks into spheroids and build cor-respondingly massive BHs. This automatically explains themuch sharper rise and fall of the quasar luminosity density

Co-Evolution of Quasars, Black Holes, and Galaxies I 29
and number density of bright quasars, relative to the shallowevolution in the star formation rate density and ionizing back-ground of the Universe at high redshifts.
4. DISCUSSION
We have developed a theoretical model for the cosmolog-ical role of galaxy mergers, which allows us to make pre-dictions for various merger-related populations such as star-bursts, quasars, and spheroidal galaxies. By combining the-oretically well-constrained halo and subhalo mass functionsas a function of redshift and environment with empirical halooccupation models, we can estimate where galaxies of givenproperties live at a given epoch. This allows us to calculate, inana priori cosmological manner, where major galaxy-galaxymergers occur and what kinds of galaxies merge, at all red-shifts.
We compare these estimates to a number of observations,including observed merger mass functions; merger fractionsas a function of galaxy mass, halo mass, and redshift; the massflux/mass density in mergers; the large-scale clustering/biasof merger populations; and the small-scale environments ofmergers, and show that this approach yields robust predictionsin good agreement with observations, and can be extended topredict detailed properties of mergers at all masses and red-shifts. There are some uncertainties in this approach. How-ever, we re-calculate all of our predictions adopting differentestimates for the subhalo mass functions and halo occupationmodel (and its redshift evolution) and find this makes littledif-ference (a factor< 2) at all redshifts. The largest uncertaintycomes from our calculation of merger timescales, where, atthe highest redshifts (z & 3), merging via direct collisionalprocesses might be more efficient than merging via dynami-cal friction, given the large physical densities. More detailedstudy in very high-resolution numerical simulations will benecessary to determine the effective breakdown between dif-ferent merger processes. Nevertheless, the difference in ourpredictions at these redshifts is still within the range of obser-vational uncertainty. Ultimately, we find that our predictionsare robust above massesMgal & 1010M⊙, regardless of thesepossible changes to our model, as the theoretical subhalo massfunctions and empirical halo occupation models are reason-ably well-constrained in this regime.
In addition to these specific observational predictions andtests, our model allows us to examine the physical origins ofthe distribution of major mergers of different galaxy massesand types. For example, there is a naturally defined major-merger scale (host halo massMhalo) for galaxies of massMgal– the “small group scale,” only slightly larger than the av-erage halo hosting a galaxy of massMgal. This is the scaleat which the probability to accrete a second galaxy of com-parable mass∼ Mgal (fuel for a major merger) first becomessignificant. At smaller (relative) halo masses, the probabilitythat the halo hosts a galaxy as large asMgal declines rapidly.At larger masses, the probability that the halo will merge withor accrete another halo hosting a comparable∼ Mgal galaxyincreases, but the efficiency of the merger of these galax-ies declines rapidly. We stress that this small group scale isindeed small – the average small group halo will still hostonly 1 galaxy of mass∼ Mgal, and groups will only consistof 2 − 3 members of similar mass. We also note that thisdoes not mean that mergers occur (in a global sense) on aspecific scale, since the small group scale is different for dif-ferent galaxy masses. In fact, a consequence of this model isthat mergers occur in halos of all masses and in all environ-
ments (including field and even void environments), as is ob-served (Sol Alonso et al. 2006; Goto 2005; Hogg et al. 2006),although the characteristic masses and star formation histo-ries of galaxies merging may reflect their different environ-ments/halo masses. Similarly, our model allows us to accu-rately predict and understand the (relatively weak) evolutionof the merger fraction with redshift, and the relative evolutionin merger rates as a function of mass (evolution of the ma-jor merger mass functions). The clustering properties and de-pendence of merger rates on both large-scale and small-scaleenvironment are natural consequences of the fundamentallylocal nature of mergers, and we study in detail the effects ofenvironment on merger rates as a function of scale.
Having characterized mergers in this way, we examinethe role that mergers play in triggering quasars. Even ifthere are other quasar “triggers” dominant at some luminosi-ties/redshifts, it is difficult to imagine a scenario in whichthe strong nuclear gas inflows from a merger do not causerapid, near Eddington-limited accretion and ultimately yieldsome kind of quasar – and indeed such activity is ubiquitousin late-stage mergers (Komossa et al. 2003; Alexander et al.2005a; Borys et al. 2005; Brand et al. 2006). We thereforemake the simple ansatz that gas-rich, major mergers will pro-duce quasars (but do, in principle, allow for other fuelingmechanisms as well). This model, with just the contributionof mergers to the quasar luminosity density, is able to accountfor the observed quasar luminosity density fromz= 0−6. Therise and fall of the luminosity density with redshift, as well asthe shape and evolution of the quasar luminosity function, areaccurately reproduced. This also yields predictions of thelo-cal black hole mass function, cosmic X-ray background (seeHopkins et al. 2006a), AGN fractions as a function of galaxymass/luminosity and redshift, large scale quasar clustering asa function of luminosity and redshift, small-scale quasar clus-tering excesses, quasar host galaxy colors, and infrared lumi-nosity functions, all in good agreement with those observed.In particular, matching the history of the bolometric luminos-ity density of quasars requires no knowledge or assumptionsabout quasar duty cycles, light curves, or lifetimes, only ourdetermination of the global mass density in gas-rich majormergers.
In our model, the sharp rise and fall of the quasar lumi-nosity density over cosmic time is the product of several fac-tors. At high redshifts, the buildup of BH mass fromz& 6 toz∼ 2 owes in part to the growth of galaxy and halo mass, asmost galaxies are rapidly forming, and the galaxy mass den-sity involved in major mergers steadily increases with time.The rise is steeper than that in, for example, the global starformation rate density of the Universe, as it tracks just themajor merger history (effectively, at these redshifts, therisein the density of relatively massive “small group” sized ha-los), as opposed to the global buildup of the (relatively lower-mass) halos hosting the most rapidly star-forming galaxies.Below redshiftz ∼ 2, merger rates begin to decline for allgalaxies, and the exhaustion of gas in evolved systems slowsthe growth of quasars in two ways. First, major mergersof relatively gas-poor disks create shallower central poten-tial wells for the remnant spheroid (i.e. lowerσ values), andas a consequence BH growth self-regulates at lower masses(Hopkins et al. 2007c), in agreement with the observed evolu-tion of the BH-host correlations with redshift (e.g., Peng et al.2006). Second, an increasing fraction of galaxies (especiallyaround∼ L∗, where most of the mass density resides) havealready undergone major mergers and exist as “quenched”

30 Hopkins et al.
spheroids (with very little remaining cold, rotationally sup-ported gas) whose major mergers will not excite quasar activ-ity. Recent high-resolution cosmological simulations whichattempt to resolve the relevant merger and feedback effectsregulating BH growth (Sijacki et al. 2007; Di Matteo et al.2007) further support this scenario, with the combination ofthese effects and, primarily, the merger history of the Universeregulating BH growth (at least at redshiftsz. 6). The productof these effects yields the observed steep rise and fall of thequasar population with respect to its peak atz∼ 2, in goodagreement with the observations and in contrast with the sub-stantially more extended global star formation history of theUniverse.
We compare this model to one in which quasar fuelingis primarily driven by secular processes – i.e. disk instabili-ties, bars, harassment, or any process which operates in non-merging, gas-rich systems. We demonstrate that there are anumber of robust, qualitatively distinct predictions fromthesemodels, including:
Quasar Clustering:A merger-driven model accurately pre-dicts the observed large-scale clustering of quasars (bothat ∼ L∗ and as a detailed function of luminosity) as afunction of redshift for the observed rangez ∼ 0.5 − 4.The clustering is, at all these redshifts, precisely thatpredicted for “small group” halos in which major merg-ers of gas-rich galaxies should proceed most efficiently.It is well-established empirically that quasar clusteringtraces a characteristic host halo mass (Porciani et al. 2004;Wake et al. 2004; Croom et al. 2005; Porciani & Norberg2006; Myers et al. 2006a; da Angela et al. 2006; Coil et al.2007; Shen et al. 2007; Hopkins et al. 2007d), and inves-tigations of the quasar proximity effect reach a similarconclusion (Faucher-Giguere et al. 2007; Kim & Croft 2007;Nascimento Guimaraes et al. 2007). Comparing this to inde-pendent, direct measurements of the small group scale of∼ L∗
gas-rich galaxies, and to the small group scale inferred from awide variety of different halo occupation models, we show inall cases that these trace the same mass. In contrast, the clus-tering of typical star-forming galaxies is somewhat weaker(asexpected relative to their small group scale), and yields anunderestimate of quasar clustering at moderate and high red-shifts. Only at low redshifts (z. 0.5) is there reasonable con-sistency between the clustering of∼ L∗ quasars and “secular”populations (for more details, see Hopkins et al. 2007d).
Small-Scale Environments:Mergers will preferentially oc-cur in environments with an overdensity of galaxies on smallscales, and as a consequence their clustering should reflectabias (relative to a mean galaxy of the same mass) to excessclustering on small scales. Furthermore, triggering of binaryquasars in (even a small fraction of) early interacting pairscan enhance this excess. Indeed, in a purely empirical sense,both bright quasars at all redshiftsz∼ 0.5− 3 (Hennawi et al.2006; Serber et al. 2006; Myers et al. 2006b) and local post-starburst merger remnant galaxies (Goto 2005) are observedto have similar, strong excess clustering on small scales, dis-tinct from quiescent (non-merger related) populations. Thisis true both in terms of the quasar-quasar autocorrelation,and for the quasar-galaxy cross-correlation, suggesting thatit reflects a true tendency for quasars to reside in regions ofsmall-scale overdensity. Our model predicts the magnitudeofthis excess clustering as a function of physical scale and red-shift well for both populations. Interestingly, low-luminositySeyfert galaxies (MB > −23) are observed without such an ex-cess on small scales (Serber et al. 2006), as expected if AGN
triggering at low luminosities (or typicalMBH . 107M⊙) isdominated by secular processes (with the true quasar popula-tions dominated by mergers). However, systems of these lowluminosities contribute significantly to the quasar luminositydensity at only very low redshiftsz. 0.5, once more massivesystems have predominantly quenched.
Host Galaxy Colors: The stellar population colors of agas-rich merger remnant will rapidly redden, at least overthe ∼Gyr period over which subsequent infall or coolingcan be ignored, and the system will (even if only temporar-ily) cross the “green valley” between the blue cloud and redsequence. If a quasar is triggered at the end of a merger,the decay of the quasar lightcurve should be associated withthe host crossing this interval, or equivalently with the pres-ence of a relatively young, blue host spheroid. Observedquasar hosts atz∼ 0.5− 1.1 appear to preferentially occupythis (otherwise relatively empty) locus in color-magnitudespace (Sánchez et al. 2004; Nandra et al. 2006), and it iswell-established that bright quasar hosts tend to be massivespheroids with especially young stellar or post-starburststel-lar populations (e.g. Canalizo & Stockton 2001; Jahnke et al.2004a; Vanden Berk et al. 2006; Barthel 2006, and referencestherein). We show that the color distribution of observedquasar hosts is similar to that observed for clear post-starburstmerger remnant populations. In contrast, a secular model(regardless of the quasar duty cycle or lifetime) would pre-dict that quasar hosts trace the population of systems host-ing strong disk instabilities or bars (unless any quasar activitycould somehow be suppressed over the entire lifetime of arelatively long-lived bar) – these actually tend to be the mostblue, gas-rich disk galaxies. We show that the observed col-ors of quasar hosts are distinct from those of systems observedhosting strong bars.
Host Kinematics (Pseudobulges versus Classical Bulges):Numerical simulations and observations of both barred sys-tems and merger remnants have established that mergers yieldsystems with the observed kinematic and photometric prop-erties of classical bulges, whereas secular disk instabilitiesgenerically give rise to pseudobulges with distinct properties(see the discussion in § 1). At high redshiftsz& 1, the ac-tive ∼ L∗ quasar populations (either from direct quasar BHmass measurements or simply the Eddington argument) aredominated by massive BHs (MBH & 108M⊙), which are di-rectly observed to live in massive bulges at those redshifts(Peng et al. 2006), and whose remnants clearly live in massivebulges locally. These spheroids (Msph& 1011M⊙) are over-whelmingly classical spheroids (in particular, classicaltrueellipticals), whose kinematics argue that they were formedinmergers. To the extent that the buildup of BH mass tracesspheroid origin (true at all redshifts observed, albeit with po-tentially redshift-dependent efficiency), this implies forma-tion in mergers. Adopting a number of different estimatesof e.g. the pseudobulge fraction as a function of host prop-erties, pseudobulge mass distributions, or simply assumingall bulges in star-forming/disk-dominated galaxies are formedvia secular instabilities, we compare with the distribution ofactive BH masses in the quasar luminosity function at all red-shifts, and show that these populations cannot dominate theQLF at redshiftsz& 1. Only at low redshiftsz. 1 are theglobal QLF and buildup of BH mass occurring mainly in sys-tems which typically reside in star-forming, disk-dominatedhosts with pseudobulges potentially formed via disk instabili-ties or bars.

Co-Evolution of Quasars, Black Holes, and Galaxies I 31
Quasar Luminosity Density versus Redshift:As notedabove, a merger-driven model predicts a sharp rise and fallof the quasar luminosity density in good agreement with ob-servations. If, for the sake of argument, we adopt a modelin which all BH growth is driven by disk instabilities, wedemonstrate that, once embedded in a proper cosmologicalcontext, such a model is generically forced to predict a his-tory of quasar luminosity density which is offset to earliertimes (in each of its rise, peak, and fall), in conflict withthe observations. This is because major mergers are dynami-cally inevitable – one cannot simply “remove” the mergers agalaxy will undergo in a true cosmological model. In orderfor disk instabilities to dominate BH growth or spheroid for-mation, they must, therefore, act before massive systems un-dergo their major mergers. Since the global mass flux in gas-rich major mergers peaks aroundz∼ 2−3, a secular-dominantmodel is forced to assume a sufficiently strong disk instabil-ity mode such that the progenitors of these systems rapidlyexhaust their gas supplies and build up most of their finalBH/spheroid mass at redshiftsz& 4. By z∼ 2, then, thesemodels predict the quasar luminosity density is already inrapid decline. We demonstrate this both for current state-of-the-art semi-analytic models (Bower et al. 2006), constrainedsuch that they cannot overproduce thez = 0 mass density inquenched systems nor “avoid” major mergers, and simple il-lustrative toy models. The only way to avoid this is to weakenthe disk instability criterion – i.e. to assume disk instabilitiesare not so efficient at exhausting systems, and can thereforeact continuously over longer times. But then, one obtains aprediction similar to our expectation from assuming all pseu-dobulges are formed in disk instabilities – namely, the highrate of gas-rich mergers at high redshifts will dominate quasaractivity at all z> 1, and this “gentler” disk instability modewill dominate at lower luminosities (i.e. only dominate BHmass buildup at low massesMBH . 107M⊙), becoming im-portant to the total luminosity density only atz< 1.
These comparisons, despite the very different possible sys-tematic effects in the observations, all suggest a similar sce-nario. Secular (non-merger related) fueling mechanisms maydominate AGN activity in low-BH mass systems (MBH .107M⊙), for which mergers are relatively rare and hosts tendto be very gas-rich, potentially bar-unstable disks, but thesecontribute little to quasar activity atz & 1, which involvesthe most massiveMBH & 108M⊙ BHs in the most massivespheroids. Byz∼ 0.5, however, the most massive BHs are nolonger active (their hosts having primarily been gas exhaustedand quenched, and with overall merger rates declining), andasignificant fraction of the AGN luminosity density can comefrom ∼ 107M⊙ BHs in undisturbed hosts, corresponding torelatively low-luminosity (MB > −23) Seyfert galaxies. Byz∼ 0, the local QLF is largely dominated by Seyfert activ-ity in relatively small BHs with late-type, undisturbed hostdisks (Heckman et al. 2004). Our models allow for secu-lar mechanisms, such as the stochastic triggering model ofHopkins & Hernquist (2006), to be important at low luminosi-ties, and a pure comparison between this secular model andour merger-driven prediction here yields a transition to secu-lar dominance at low luminosities in good agreement with theempirical constraints.
Ultimately, one would like to test this by directly studyingthe morphology of true, bright quasar hosts at high redshifts.Unfortunately, as discussed in § 1, this remains extremelydifficult, and results have been ambiguous. As noted previ-
ously, mock observations constructed from numerical majormerger simulations (Krause et al. 2007) imply that, with thebest presently attainable data, the faint, rapidly fading tidalfeatures associated with the quasar phase (i.e. final stagesof the merger, at which the spheroid is largely formed andhas begun to relax) are difficult to observe even locally and(for now) nearly impossible to identify at the redshifts ofgreatest interest (z & 1). Similarly, experiments with au-tomated, non-parametric classification schemes (Lotz et al.2004) suggest that the hosts will generically be classifiedas “normal” spheroids, even with perfect resolution and nosurface brightness dimming. This appears to be borne out,as recently Bennert et al. (2007) have re-examined very low-redshift quasars previously recognized from deep HST imag-ing as having relaxed spheroid hosts, and found (after consid-erably deeper integrations) that every such object shows clearevidence for a recent merger. The ability to identify such fea-tures may be slightly improved if one considers just the popu-lation of highly dust-reddened (but still dominated by quasarlight in the optical/near IR) or IR-luminous quasar expectedto be associated with a (brief) “blowout” stage preceding themore typical optical quasar phase in a merger, and it doesappear that observations of quasars in this stage, somewhatcloser to the peak of merger activity, show ubiquitous evi-dence of recent or ongoing mergers (Hutchings et al. 2003,2006; Kawakatu et al. 2006; Guyon et al. 2006; Urrutia et al.2007), albeit still requiring very deep integrations.
On the other hand, it is increasingly possible to improve theconstraints we have studied in this paper, to break the degen-eracy between secular and merger-driven models of quasarfueling. Improving measurements of merger fractions, massfunctions, and clustering at low redshifts, and extending thesemeasurements to high redshifts, can break the degeneraciesinour cosmological models (regarding, for example, the appro-priate merger timescales at high redshifts) and enable morerobust, tightly constrained predictions. We have also madea large number of predictions in this paper and previous re-lated works (e.g. Hopkins et al. 2006a, 2007d) which can bedirectly tested without the large ambiguities presently inher-ent in quasar host morphology estimates. Better observationsof quasar host galaxy colors (and corresponding estimates oftheir recent star formation history), improved measurementsof quasar clustering at redshiftsz& 3 (especially measure-ments which can resolve∼ L∗ quasars at these redshifts), de-tailed cross-correlation measurements of quasars and othergalaxy populations and clustering measurements which candecompose the excess bias of quasars on small scales as afunction of e.g. redshift and luminosity, improved constraintson the bolometric corrections of the brightest quasars andthe history of the bolometric quasar luminosity density atz& 3−4, and estimates of the evolution with redshift of pseu-dobulge populations will all be able to test the models pre-sented in this paper. The combination of these observationscan greatly strengthen the constraints herein, and ultimatelyallow for more detailed modeling which attempts not just topredict the general origin of quasars in mergers, but to fullybreak down the contribution of major mergers (or mergers ofdifferent types) and other fueling mechanisms to the quasarluminosity functions as a function of luminosity and redshift.
We thank Josh Younger, Volker Springel, Gordon Richards,Chris Hayward, Alice Shapley, Jenny Greene, and YuexingLi for helpful discussions. This work was supported in part

32 Hopkins et al.
by NSF grant AST 03-07690, and NASA ATP grants NAG5- 12140, NAG5-13292, and NAG5-13381.
REFERENCES
Adelberger, K. L., & Steidel, C. C. 2005, ApJ, 630, 50Adelberger, K. L., Steidel, C. C., Pettini, M., Shapley, A. E., Reddy, N. A.,
& Erb, D. K. 2005, ApJ, 619, 697Alexander, D. M., Bauer, F. E., Chapman, S. C., Smail, I., Blain, A. W.,
Brandt, W. N., & Ivison, R. J. 2005a, ApJ, 632, 736Alexander, D. M., Smail, I., Bauer, F. E., Chapman, S. C., Blain, A. W.,
Brandt, W. N., & Ivison, R. J. 2005b, Nature, 434, 738Allen, P. D., Driver, S. P., Graham, A. W., Cameron, E., Liske, J., & de
Propris, R. 2006, MNRAS, 371, 2Allen, P. D., Moustakas, L. A., Dalton, G., MacDonald, E., Blake, C.,
Clewley, L., Heymans, C., & Wegner, G. 2005, MNRAS, 360, 1244Alonso, M. S., Lambas, D. G., Tissera, P., & Coldwell, G. 2007, MNRAS,
375, 1017Athanassoula, E. 2005, MNRAS, 358, 1477Athanassoula, E., Bienayme, O., Martinet, L., & Pfenniger,D. 1983, A&A,
127, 349Babbedge, T. S. R., et al. 2006, MNRAS, 370, 1159Bahcall, J. N., Kirhakos, S., Saxe, D. H., & Schneider, D. P. 1997, ApJ, 479,
642Balcells, M., Graham, A. W., & Peletier, R. F. 2004, ApJ, in press
[astro-ph/0404381]Baldry, I. K., Balogh, M. L., Bower, R. G., Glazebrook, K., Nichol, R. C.,
Bamford, S. P., & Budavari, T. 2006, MNRAS, 373, 469Ball, N. M., Loveday, J., Brunner, R. J., Baldry, I. K., & Brinkmann, J.
2006, MNRAS, 373, 845Barazza, F. D., Jogee, S., & Marinova, I. 2006, in Galaxy Evolution across
the Hubble Time [astro-ph/0610561], ed. F. Combes & J. PalousBarnes, J. E. 1988, ApJ, 331, 699—. 1992, ApJ, 393, 484Barnes, J. E., & Hernquist, L. 1992, ARA&A, 30, 705—. 1996, ApJ, 471, 115Barnes, J. E., & Hernquist, L. E. 1991, ApJ, 370, L65Barthel, P. D. 2006, A&A, 458, 107Bell, E. F., & de Jong, R. S. 2001, ApJ, 550, 212Bell, E. F., McIntosh, D. H., Katz, N., & Weinberg, M. D. 2003a, ApJ, 585,
L117—. 2003b, ApJS, 149, 289Bell, E. F., Phleps, S., Somerville, R. S., Wolf, C., Borch, A., &
Meisenheimer, K. 2006, ApJ, 652, 270Bell, E. F., Wolf, C., Meisenheimer, K., Rix, H.-W., Borch, A., Dye, S.,
Kleinheinrich, M., Wisotzki, L., & McIntosh, D. H. 2004, ApJ, 608, 752Bell, E. F., et al. 2005, ApJ, 625, 23Bennert, N., et al. 2007, ApJ, in preparationBinney, J., & Tremaine, S. 1987, Galactic dynamics (Princeton, NJ,
Princeton University Press, 1987)Blain, A. W., Chapman, S. C., Smail, I., & Ivison, R. 2004, ApJ, 611, 725Blake, C., et al. 2004, MNRAS, 355, 713Blanton, M. R. 2006, ApJ, 648, 268Borch, A., et al. 2006, A&A, 453, 869Borys, C., Smail, I., Chapman, S. C., Blain, A. W., Alexander, D. M., &
Ivison, R. J. 2005, ApJ, 635, 853Bournaud, F., Jog, C. J., & Combes, F. 2005, A&A, 437, 69Bower, R. G., Benson, A. J., Malbon, R., Helly, J. C., Frenk, C. S., Baugh,
C. M., Cole, S., & Lacey, C. G. 2006, MNRAS, 370, 645Brand, K., et al. 2006, ApJ, 644, 143—. 2007, ApJ, in press [astro-ph/0703003]Bridge, C. R., et al. 2007, ApJ, in press [astro-ph/0701040]Brotherton, M. S., et al. 1999, ApJ, 520, L87Brough, S., Forbes, D. A., Kilborn, V. A., & Couch, W. 2006, MNRAS, 370,
1223Bundy, K., Ellis, R. S., & Conselice, C. J. 2005, ApJ, 625, 621Bundy, K., Fukugita, M., Ellis, R. S., Kodama, T., & Conselice, C. J. 2004,
ApJ, 601, L123Bundy, K., et al. 2006, ApJ, 651, 120Canalizo, G., & Stockton, A. 2001, ApJ, 555, 719Caputi, K. I., et al. 2007, ApJ, in press [astro-ph/0701283]Carollo, C. M., Stiavelli, M., & Mack, J. 1998, AJ, 116, 68Cassata, P., et al. 2005, MNRAS, 357, 903Chakrabarti, S., Cox, T. J., Hernquist, L., Hopkins, P. F., Robertson, B., & Di
Matteo, T. 2007, ApJ, 658, 840Chapman, S. C., Blain, A. W., Smail, I., & Ivison, R. J. 2005, ApJ, 622, 772Chary, R., & Elbaz, D. 2001, ApJ, 556, 562
Coil, A. L., Hennawi, J. F., Newman, J. A., Cooper, M. C., & Davis, M.2007, ApJ, 654, 115
Coil, A. L., et al. 2004, ApJ, 609, 525—. 2006, ApJ, 638, 668Combes, F., Debbasch, F., Friedli, D., & Pfenniger, D. 1990,A&A, 233, 82Conroy, C., Wechsler, R. H., & Kravtsov, A. V. 2006, ApJ, 647,201Conroy, C., et al. 2007, ApJ, 654, 153Conselice, C. J., Bershady, M. A., Dickinson, M., & Papovich, C. 2003, AJ,
126, 1183Cooray, A. 2005, MNRAS, 364, 303—. 2006, MNRAS, 365, 842Cox, T. J., Di Matteo, T., Hernquist, L., Hopkins, P. F., Robertson, B., &
Springel, V. 2006a, ApJ, 643, 692Cox, T. J., Dutta, S. N., Di Matteo, T., Hernquist, L., Hopkins, P. F.,
Robertson, B., & Springel, V. 2006b, ApJ, accepted [astro-ph/0607446]Croom, S. M., Boyle, B. J., Shanks, T., Smith, R. J., Miller, L., Outram, P. J.,
Loaring, N. S., Hoyle, F., & da Ângela, J. 2005, MNRAS, 356, 415Croton, D. J., Gao, L., & White, S. D. M. 2007, MNRAS, 374, 1303Croton, D. J., et al. 2006, MNRAS, 365, 11da Angela, J., et al. 2006, MNRAS, in press [astro-ph/0612401]Dasyra, K. M., et al. 2006a, ApJ, 638, 745—. 2006b, ApJ, in press [astro-ph/0610719]De Lucia, G., Kauffmann, G., Springel, V., White, S. D. M., Lanzoni, B.,
Stoehr, F., Tormen, G., & Yoshida, N. 2004, MNRAS, 348, 333De Propris, R., Liske, J., Driver, S. P., Allen, P. D., & Cross, N. J. G. 2005,
AJ, 130, 1516Di Matteo, T., Colberg, J., Springel, V., Hernquist, L., & Sijacki, D. 2007,
ApJ, submitted, arXiv:0705.2269v1 [astro-ph]Di Matteo, T., Springel, V., & Hernquist, L. 2005, Nature, 433, 604Djorgovski, S., & Davis, M. 1987, ApJ, 313, 59Dressler, A., Lynden-Bell, D., Burstein, D., Davies, R. L.,Faber, S. M.,
Terlevich, R., & Wegner, G. 1987, ApJ, 313, 42Driver, S. P., Allen, P. D., Liske, J., & Graham, A. W. 2007, ApJ, in press
[astro-ph/0701728]Eke, V. R., et al. 2004, MNRAS, 355, 769Elvis, M., et al. 1994, ApJS, 95, 1Erb, D. K., Steidel, C. C., Shapley, A. E., Pettini, M., Reddy, N. A., &
Adelberger, K. L. 2006, ApJ, 646, 107Falomo, R., Kotilainen, J. K., Pagani, C., Scarpa, R., & Treves, A. 2004,
ApJ, 604, 495Fan, X., et al. 2004, AJ, 128, 515Farrah, D., Afonso, J., Efstathiou, A., Rowan-Robinson, M., Fox, M., &
Clements, D. 2003, MNRAS, 343, 585Faucher-Giguere, C. ., Lidz, A., Zaldarriaga, M., & Hernquist, L. 2007, ApJ,
in press [astro-ph/0701042]Ferrarese, L., & Merritt, D. 2000, ApJ, 539, L9Fine, S., et al. 2006, MNRAS, 373, 613Floyd, D. J. E., Kukula, M. J., Dunlop, J. S., McLure, R. J., Miller, L.,
Percival, W. J., Baum, S. A., & O’Dea, C. P. 2004, MNRAS, 355, 196Fontana, A., et al. 2004, A&A, 424, 23—. 2006, A&A, 459, 745Franceschini, A., et al. 2005, AJ, 129, 2074—. 2006, A&A, 453, 397Furlanetto, S. R., & Kamionkowski, M. 2006, MNRAS, 366, 529Gao, L., & White, S. D. M. 2006, MNRAS, in press [astro-ph/0611921]Gao, L., White, S. D. M., Jenkins, A., Stoehr, F., & Springel,V. 2004,
MNRAS, 355, 819Gebhardt, K., et al. 2000, ApJ, 539, L13Giavalisco, M., & Dickinson, M. 2001, ApJ, 550, 177Gilli, R., Comastri, A., & Hasinger, G. 2007, A&A, 463, 79Goto, T. 2005, MNRAS, 357, 937—. 2006, MNRAS, 369, 1765Gottlöber, S., Klypin, A., & Kravtsov, A. V. 2001, ApJ, 546, 223Graham, A. W., & Driver, S. P. 2006, ApJ, in press [astro-ph/0607378]Graham, A. W., Erwin, P., Caon, N., & Trujillo, I. 2001, ApJ, 563, L11Granato, G. L., De Zotti, G., Silva, L., Bressan, A., & Danese, L. 2004, ApJ,
600, 580Grazian, A., Negrello, M., Moscardini, L., Cristiani, S., Haehnelt, M. G.,
Matarrese, S., Omizzolo, A., & Vanzella, E. 2004, AJ, 127, 592Greene, J., & Ho, L. C. 2007, ApJ, in preparationGregg, M. D., Lacy, M., White, R. L., Glikman, E., Helfand, D., Becker,
R. H., & Brotherton, M. S. 2002, ApJ, 564, 133Guyon, O., Sanders, D. B., & Stockton, A. 2006, ApJS, 166, 89

Co-Evolution of Quasars, Black Holes, and Galaxies I 33
Hao, L., et al. 2005, AJ, 129, 1795Häring, N., & Rix, H.-W. 2004, ApJ, 604, L89Harker, G., Cole, S., Helly, J., Frenk, C., & Jenkins, A. 2006, MNRAS, 367,
1039Hasinger, G., Miyaji, T., & Schmidt, M. 2005, A&A, 441, 417Heckman, T. M., Kauffmann, G., Brinchmann, J., Charlot, S.,Tremonti, C.,
& White, S. D. M. 2004, ApJ, 613, 109Hennawi, J. F., et al. 2006, AJ, 131, 1Hernquist, L. 1989, Nature, 340, 687—. 1992, ApJ, 400, 460—. 1993, ApJ, 409, 548Hernquist, L., & Barnes, J. E. 1991, Nature, 354, 210Hernquist, L., & Mihos, J. C. 1995, ApJ, 448, 41Hernquist, L., & Quinn, P. J. 1987, ApJ, 312, 1Hernquist, L., & Spergel, D. N. 1992, ApJ, 399, L117Heymans, C., et al. 2006, MNRAS, 371, L60Hogg, D. W., Masjedi, M., Berlind, A. A., Blanton, M. R., Quintero, A. D.,
& Brinkmann, J. 2006, ApJ, 650, 763Hopkins, A. M. 2004, ApJ, 615, 209Hopkins, A. M., & Beacom, J. F. 2006, ApJ, 651, 142Hopkins, P. F., Bundy, K., Hernquist, L., & Ellis, R. S. 2007a, ApJ, 659, 976Hopkins, P. F., Cox, T. J., Kereš, D., & Hernquist, L. 2007b, ApJ, submitted,
arXiv:0706.1246v2 [astro-ph] (Paper II)Hopkins, P. F., & Hernquist, L. 2006, ApJS, 166, 1Hopkins, P. F., Hernquist, L., Cox, T. J., Di Matteo, T., Martini, P.,
Robertson, B., & Springel, V. 2005a, ApJ, 630, 705Hopkins, P. F., Hernquist, L., Cox, T. J., Di Matteo, T., Robertson, B., &
Springel, V. 2005b, ApJ, 630, 716—. 2005c, ApJ, 632, 81—. 2006a, ApJS, 163, 1Hopkins, P. F., Hernquist, L., Cox, T. J., Robertson, B., Di Matteo, T., &
Springel, V. 2006b, ApJ, 639, 700Hopkins, P. F., Hernquist, L., Cox, T. J., Robertson, B., & Krause, E. 2007c,
ApJ, in press [astro-ph/0701351]Hopkins, P. F., Hernquist, L., Cox, T. J., Robertson, B., & Springel, V.
2006c, ApJS, 163, 50Hopkins, P. F., Hernquist, L., Martini, P., Cox, T. J., Robertson, B., Di
Matteo, T., & Springel, V. 2005d, ApJ, 625, L71Hopkins, P. F., Lidz, A., Hernquist, L., Coil, A. L., Myers, A. D., Cox, T. J.,
& Spergel, D. N. 2007d, ApJ, 662, 110Hopkins, P. F., Narayan, R., & Hernquist, L. 2006d, ApJ, 643,641Hopkins, P. F., Richards, G. T., & Hernquist, L. 2007e, ApJ, 654, 731Hopkins, P. F., Robertson, B., Krause, E., Hernquist, L., & Cox, T. J. 2006e,
ApJ, 652, 107Hopkins, P. F., Somerville, R. S., Hernquist, L., Cox, T. J.,Robertson, B., &
Li, Y. 2006f, ApJ, 652, 864Hopkins, P. F., et al. 2004, AJ, 128, 1112Hutchings, J. B. 2003, AJ, 125, 1053Hutchings, J. B., Cherniawsky, A., Cutri, R. M., & Nelson, B.O. 2006, AJ,
131, 680Hutchings, J. B., Maddox, N., Cutri, R. M., & Nelson, B. O. 2003, AJ, 126,
63Infante, L., et al. 2002, ApJ, 567, 155Jahnke, K., Kuhlbrodt, B., & Wisotzki, L. 2004a, MNRAS, 352,399Jahnke, K., et al. 2004b, ApJ, 614, 568Jesseit, R., Naab, T., Peletier, R., & Burkert, A. 2006, MNRAS, in press
[astro-ph/0606144]Jogee, S. 2004, in AGN Physics on All Scales, Lect.Notes Phys. 693 (2006),
143Kauffmann, G., & Haehnelt, M. 2000, MNRAS, 311, 576Kauffmann, G., & Haehnelt, M. G. 2002, MNRAS, 332, 529Kauffmann, G., et al. 2003, MNRAS, 346, 1055—. 2004, MNRAS, 353, 713Kawakatu, N., Anabuki, N., Nagao, T., Umemura, M., & Nakagawa, T.
2006, ApJ, 637, 104Kennicutt, Jr., R. C. 1998, ApJ, 498, 541Kewley, L., et al. 2007, ApJ, in preparationKim, Y.-R., & Croft, R. 2007, MNRAS, in press [astro-ph/0701012]Kollmeier, J. A., et al. 2006, ApJ, 648, 128Komossa, S., Burwitz, V., Hasinger, G., Predehl, P., Kaastra, J. S., & Ikebe,
Y. 2003, ApJ, 582, L15Kormendy, J., & Gebhardt, K. 2001, in AIP Conf. Proc. 586: 20th Texas
Symposium on relativistic astrophysics, ed. J. C. Wheeler &H. Martel,363–+
Kormendy, J., & Kennicutt, Jr., R. C. 2004, ARA&A, 42, 603Kormendy, J., & Richstone, D. 1995, ARA&A, 33, 581Krause, E., et al. 2007, ApJ, in preparation
Kravtsov, A. V., Berlind, A. A., Wechsler, R. H., Klypin, A. A., Gottlöber,S., Allgood, B., & Primack, J. R. 2004, ApJ, 609, 35
Kriek, M., et al. 2006, ApJ, in press [astro-ph/0611724]Krivitsky, D. S., & Kontorovich, V. M. 1997, A&A, 327, 921Kuijken, K., & Merrifield, M. R. 1995, ApJ, 443, L13Lapi, A., Shankar, F., Mao, J., Granato, G. L., Silva, L., De Zotti, G., &
Danese, L. 2006, ApJ, 650, 42Le Floc’h, E., et al. 2005, ApJ, 632, 169Lee, K.-S., Giavalisco, M., Gnedin, O. Y., Somerville, R. S., Ferguson,
H. C., Dickinson, M., & Ouchi, M. 2006, ApJ, 642, 63Letawe, G., Magain, P., Courbin, F., Jablonka, P., Jahnke, K., Meylan, G., &
Wisotzki, L. 2006, MNRAS, in press [astro-ph/0605288]Li, C., Kauffmann, G., Jing, Y. P., White, S. D. M., Börner, G., & Cheng,
F. Z. 2006a, MNRAS, 368, 21Li, Y., et al. 2006b, ApJ, in press [astro-ph/0608190]—. 2007, ApJ, in preparationLidz, A., Hopkins, P. F., Cox, T. J., Hernquist, L., & Robertson, B. 2006,
ApJ, 641, 41Lidz, A., McQuinn, M., Zaldarriaga, M., Hernquist, L., & Dutta, S. 2007a,
ApJ, submitted, [astro-ph/0703667]Lidz, A., et al. 2007b, ApJ, in preparationLin, L., et al. 2004, ApJ, 617, L9Lotz, J. M., Madau, P., Giavalisco, M., Primack, J., & Ferguson, H. C.
2006a, ApJ, 636, 592Lotz, J. M., Primack, J., & Madau, P. 2004, AJ, 128, 163Lotz, J. M., et al. 2006b, ApJ, in press [astro-ph/0602088]—. 2007, ApJ, in preparationLutz, D., Spoon, H. W. W., Rigopoulou, D., Moorwood, A. F. M.,& Genzel,
R. 1998, ApJ, 505, L103Lynden-Bell, D. 1967, MNRAS, 136, 101—. 1969, Nature, 223, 690Magorrian, J., et al. 1998, AJ, 115, 2285Makino, J., & Hut, P. 1997, ApJ, 481, 83Maller, A. H., Katz, N., Kereš, D., Davé, R., & Weinberg, D. H.2006, ApJ,
647, 763Mamon, G. A. 2006, in Groups of Galaxies in the Nearby Universe, ed.
I. Saviane, V. Ivanov, & J. BorissovaMarconi, A., & Hunt, L. K. 2003, ApJ, 589, L21Marconi, A., Risaliti, G., Gilli, R., Hunt, L. K., Maiolino,R., & Salvati, M.
2004, MNRAS, 351, 169Martin, D. C., et al. 2007, ApJS, in press [astro-ph/0703281]Martínez-Sansigre, A., Rawlings, S., Lacy, M., Fadda, D., Jarvis, M. J.,
Marleau, F. R., Simpson, C., & Willott, C. J. 2006, MNRAS, 370, 1479Martini, P. 2004, in Coevolution of Black Holes and Galaxies, ed. L. C. Ho,
169Masjedi, M., et al. 2006, ApJ, 644, 54McLure, R. J., & Dunlop, J. S. 2002, MNRAS, 331, 795—. 2004, MNRAS, 352, 1390Menanteau, F., Ford, H. C., Motta, V., Benítez, N., Martel, A. R., Blakeslee,
J. P., & Infante, L. 2006, AJ, 131, 208Meneux, B., et al. 2006, A&A, 452, 387Mihos, J. C., & Hernquist, L. 1994a, ApJ, 437, L47—. 1994b, ApJ, 431, L9—. 1996, ApJ, 464, 641Mo, H. J., & White, S. D. M. 1996, MNRAS, 282, 347Myers, A. D., Brunner, R. J., Nichol, R. C., Richards, G. T., Schneider,
D. P., & Bahcall, N. A. 2006a, ApJ, in press [astro-ph/0612190]Myers, A. D., Brunner, R. J., Richards, G. T., Nichol, R. C., Schneider,
D. P., & Bahcall, N. A. 2006b, ApJ, in press [astro-ph/0612191]Myers, A. D., et al. 2006c, ApJ, 638, 622Naab, T., & Burkert, A. 2003, ApJ, 597, 893Naab, T., Burkert, A., & Hernquist, L. 1999, ApJ, 523, L133Naab, T., Jesseit, R., & Burkert, A. 2006a, MNRAS, 372, 839Naab, T., Khochfar, S., & Burkert, A. 2006b, ApJ, 636, L81Naab, T., & Trujillo, I. 2006, MNRAS, 369, 625Nandra, K., et al. 2006, ApJ, in press [astro-ph/0607270]Nascimento Guimaraes, R., Petitjean, P., Beaumont Rollinde, E., Ramos De
Carvalho, R., Djorgovski, G., Srianand, R., Aghaee, A., & Castro, S.2007, MNRAS, in press [astro-ph/0702369]
Noeske, K. G., et al. 2007, ApJ, in press [astro-ph/0703056]Noordermeer, E., & van der Hulst, J. M. 2007, MNRAS, in press
[astro-ph/0701730]Norberg, P., et al. 2002, MNRAS, 332, 827Nurmi, P., Heinämäki, P., Saar, E., Einasto, M., Holopainen, J., Martínez,
V. J., & Einasto, J. 2006, A&A, in press [astro-ph/0611941]O’Neill, J. K., & Dubinski, J. 2003, MNRAS, 346, 251Patton, D. R., et al. 2002, ApJ, 565, 208

34 Hopkins et al.
Peng, C. Y., Impey, C. D., Rix, H.-W., Kochanek, C. S., Keeton, C. R.,Falco, E. E., Lehár, J., & McLeod, B. A. 2006, ApJ, 649, 616
Percival, W. J., Scott, D., Peacock, J. A., & Dunlop, J. S. 2003, MNRAS,338, L31
Pérez-González, P. G., et al. 2005, ApJ, 630, 82Pfenniger, D. 1984, A&A, 134, 373Phleps, S., Peacock, J. A., Meisenheimer, K., & Wolf, C. 2006, A&A, 457,
145Pierce, C. M., et al. 2006, ApJ, in press [astro-ph/0608381]Polletta, M. d. C., et al. 2006, ApJ, 642, 673Porciani, C., Magliocchetti, M., & Norberg, P. 2004, MNRAS,355, 1010Porciani, C., & Norberg, P. 2006, MNRAS, 371, 1824Quinn, P. J. 1984, ApJ, 279, 596Raha, N., Sellwood, J. A., James, R. A., & Kahn, F. D. 1991, Nature, 352,
411Reed, D. S., Bower, R., Frenk, C. S., Jenkins, A., & Theuns, T.2007,
MNRAS, 374, 2Richards, G. T., et al. 2003, AJ, 126, 1131—. 2005, MNRAS, 360, 839—. 2006a, ApJS, 166, 470—. 2006b, AJ, 131, 2766Richstone, D., et al. 1998, Nature, 395, A14+Robertson, B., Bullock, J. S., Cox, T. J., Di Matteo, T., Hernquist, L.,
Springel, V., & Yoshida, N. 2006a, ApJ, 645, 986Robertson, B., Cox, T. J., Hernquist, L., Franx, M., Hopkins, P. F., Martini,
P., & Springel, V. 2006b, ApJ, 641, 21Robertson, B., Hernquist, L., Cox, T. J., Di Matteo, T., Hopkins, P. F.,
Martini, P., & Springel, V. 2006c, ApJ, 641, 90Rodighiero, G., et al. 2007, MNRAS, 376, 416Rothberg, B., & Joseph, R. D. 2006a, AJ, 131, 185—. 2006b, AJ, 132, 976Sajina, A., Yan, L., Armus, L., Choi, P., Fadda, D., Helou, G., & Spoon, H.
2007, ApJ, in press arXiv:0704.1765v1 [astro-ph]Salpeter, E. E. 1964, ApJ, 140, 796Salucci, P., Szuszkiewicz, E., Monaco, P., & Danese, L. 1999, MNRAS,
307, 637Salviander, S., Shields, G. A., Gebhardt, K., & Bonning, E. W. 2006, New
Astronomy Review, 50, 803Sánchez, S. F., et al. 2004, ApJ, 614, 586Sanders, D. B., & Mirabel, I. F. 1996, ARA&A, 34, 749Sanders, D. B., Soifer, B. T., Elias, J. H., Madore, B. F., Matthews, K.,
Neugebauer, G., & Scoville, N. Z. 1988a, ApJ, 325, 74—. 1988b, ApJ, 325, 74Sanders, D. B., Soifer, B. T., Elias, J. H., Neugebauer, G., &Matthews, K.
1988c, ApJ, 328, L35Saunders, W., Rowan-Robinson, M., Lawrence, A., Efstathiou, G., Kaiser,
N., Ellis, R. S., & Frenk, C. S. 1990, MNRAS, 242, 318Schwarz, M. P. 1981, ApJ, 247, 77Schweizer, F. 1992, in Physics of Nearby Galaxies: Nature orNurture?, ed.
T. X. Thuan, C. Balkowski, & J. Tran Thanh van, 283–+Schweizer, F. 1996, AJ, 111, 109Schweizer, F. 1998, in Saas-Fee Advanced Course 26: Galaxies: Interactions
and Induced Star Formation, ed. R. C. Kennicutt, Jr., F. Schweizer, J. E.Barnes, D. Friedli, L. Martinet, & D. Pfenniger, 105–+
Schweizer, F., & Seitzer, P. 1992, AJ, 104, 1039Serber, W., Bahcall, N., Ménard, B., & Richards, G. 2006, ApJ, 643, 68Shakura, N. I., & Sunyaev, R. A. 1973, A&A, 24, 337Shankar, F., Salucci, P., Granato, G. L., De Zotti, G., & Danese, L. 2004,
MNRAS, 354, 1020Shaw, L. D., Weller, J., Ostriker, J. P., & Bode, P. 2006, ApJ,646, 815Shen, S., Mo, H. J., White, S. D. M., Blanton, M. R., Kauffmann, G., Voges,
W., Brinkmann, J., & Csabai, I. 2003, MNRAS, 343, 978Shen, Y., et al. 2007, AJ, in press [astro-ph/0702214]Shepherd, C. W., et al. 2001, ApJ, 560, 72Sheth, R. K., Mo, H. J., & Tormen, G. 2001, MNRAS, 323, 1Shields, G. A., Gebhardt, K., Salviander, S., Wills, B. J., Xie, B.,
Brotherton, M. S., Yuan, J., & Dietrich, M. 2003, ApJ, 583, 124Shields, G. A., Menezes, K. L., Massart, C. A., & Vanden Bout,P. 2006,
ApJ, 641, 683Sijacki, D., Springel, V., Di Matteo, T., & Hernquist, L. 2007, MNRAS,
submitted, arXiv:0705.2238v1 [astro-ph]Simões Lopes, R. D., Storchi-Bergmann, T., de Fátima Saraiva, M., &
Martini, P. 2007, ApJ, 655, 718Smith, R. E., et al. 2003, MNRAS, 341, 1311
Soifer, B. T., & Neugebauer, G. 1991, AJ, 101, 354Sol Alonso, M., Lambas, D. G., Tissera, P., & Coldwell, G. 2006, MNRAS,
367, 1029Soltan, A. 1982, MNRAS, 200, 115Spergel, D. N., et al. 2003, ApJS, 148, 175—. 2006, ApJ, in press [astro-ph/0603449]Springel, V., Di Matteo, T., & Hernquist, L. 2005a, ApJ, 620,L79—. 2005b, MNRAS, 361, 776Springel, V., & Hernquist, L. 2003, MNRAS, 339, 289Springel, V., White, S. D. M., Tormen, G., & Kauffmann, G. 2001, MNRAS,
328, 726Springel, V., et al. 2005c, Nature, 435, 629Stevens, J. A., Page, M. J., Ivison, R. J., Carrera, F. J., Mittaz, J. P. D., Smail,
I., & McHardy, I. M. 2005, MNRAS, 360, 610Strateva, I., et al. 2001, AJ, 122, 1861Straughn, A. N., Cohen, S. H., Ryan, R. E., Hathi, N. P., Windhorst, R. A.,
& Jansen, R. A. 2006, ApJ, 639, 724Taylor, J. E., & Babul, A. 2004, MNRAS, 348, 811Thacker, R. J., Scannapieco, E., & Couchman, H. M. P. 2006, ApJ, 653, 86Tinker, J. L., Weinberg, D. H., Zheng, Z., & Zehavi, I. 2005, ApJ, 631, 41Toomre, A. 1977, in Evolution of Galaxies and Stellar Populations, ed.
B. M. Tinsley & R. B. Larson, 401Toomre, A., & Toomre, J. 1972, ApJ, 178, 623Tormen, G., Moscardini, L., & Yoshida, N. 2004, MNRAS, 350, 1397Tremaine, S., et al. 2002, ApJ, 574, 740Ueda, Y., Akiyama, M., Ohta, K., & Miyaji, T. 2003, ApJ, 598, 886Urrutia, T., et al. 2007, ApJ, in preparationVale, A., & Ostriker, J. P. 2006, MNRAS, 371, 1173van den Bosch, F. C., Tormen, G., & Giocoli, C. 2005, MNRAS, 359, 1029van den Bosch, F. C., et al. 2006, MNRAS, in press [astro-ph/0610686]Vanden Berk, D. E., et al. 2006, AJ, 131, 84Vestergaard, M. 2004, ApJ, 601, 676Volonteri, M., Salvaterra, R., & Haardt, F. 2006, MNRAS, 373, 121Wake, D. A., Miller, C. J., Di Matteo, T., Nichol, R. C., Pope,A., Szalay,
A. S., Gray, A., Schneider, D. P., & York, D. G. 2004, ApJ, 610,L85Walter, F., Carilli, C., Bertoldi, F., Menten, K., Cox, P., Lo, K. Y., Fan, X., &
Strauss, M. A. 2004, ApJ, 615, L17Wang, L., Li, C., Kauffmann, G., & de Lucia, G. 2006, MNRAS, 371, 537Wechsler, R. H., Bullock, J. S., Primack, J. R., Kravtsov, A.V., & Dekel, A.
2002, ApJ, 568, 52Wechsler, R. H., Zentner, A. R., Bullock, J. S., Kravtsov, A.V., & Allgood,
B. 2006, ApJ, 652, 71Weinmann, S. M., van den Bosch, F. C., Yang, X., & Mo, H. J. 2006,
MNRAS, 366, 2White, R. L., Helfand, D. J., Becker, R. H., Gregg, M. D., Postman, M.,
Lauer, T. R., & Oegerle, W. 2003, AJ, 126, 706White, S. D. M. 1976, MNRAS, 174, 467Wolf, C., et al. 2005, ApJ, 630, 771Woo, J.-H., Treu, T., Malkan, M. A., & Blandford, R. D. 2006, ApJ, 645, 900Woods, D. F., Geller, M. J., & Barton, E. J. 2006, AJ, 132, 197Wuyts, S., et al. 2007, ApJ, in preparationWyithe, J. S. B., & Loeb, A. 2002, ApJ, 581, 886Xu, C. K., Sun, Y. C., & He, X. T. 2004, ApJ, 603, L73Yan, R., Madgwick, D. S., & White, M. 2003, ApJ, 598, 848Yang, X., Mo, H. J., & van den Bosch, F. C. 2003, MNRAS, 339, 1057Yang, Y., Tremonti, C. A., Zabludoff, A. I., & Zaritsky, D. 2006, ApJ, 646,
L33Yang, Y., Zabludoff, A. I., Zaritsky, D., Lauer, T. R., & Mihos, J. C. 2004,
ApJ, 607, 258Yip, C. W., et al. 2004, AJ, 128, 2603Younger, J., et al. 2007, ApJ, in preparationYu, Q., & Lu, Y. 2004, ApJ, 602, 603Yu, Q., & Tremaine, S. 2002, MNRAS, 335, 965Yun, M. S., Reddy, N. A., & Condon, J. J. 2001, ApJ, 554, 803Zakamska, N. L., Strauss, M. A., Heckman, T. M., Ivezic, Ž., & Krolik, J. H.
2004, AJ, 128, 1002Zakamska, N. L., et al. 2006, AJ, 132, 1496Zehavi, I., et al. 2005, ApJ, 630, 1Zentner, A. R., Berlind, A. A., Bullock, J. S., Kravtsov, A. V., & Wechsler,
R. H. 2005, ApJ, 624, 505Zheng, Z., et al. 2005, ApJ, 633, 791