a cost effective, numeric technique for projecting quality of insulation and impending failures...
TRANSCRIPT
A COST EFFECTIVE, NUMERIC TECHNIQUE
FOR PROJECTING QUALITY OF INSULATION
AND IMPENDING FAILURES
A COST EFFECTIVE, NUMERIC TECHNIQUE
FOR PROJECTING QUALITY OF INSULATION
AND IMPENDING FAILURES
Marcus O. Durham THEWAY CorpMarcus O. Durham THEWAY Corp
Robert A. Durham RADCo ConsultingRobert A. Durham RADCo Consulting
Marcus O. Durham THEWAY CorpMarcus O. Durham THEWAY Corp
Robert A. Durham RADCo ConsultingRobert A. Durham RADCo Consulting

Abstract Hi Pot
– Cable & Machines– Numeric technique – Predicts impending failure

DC Limitations
No correlation between AC strength & DC testExperience is used
Aged insulation => AC Use => DC test Life 5 times longer if not tested
Flashover transient weakens insulation Reflected wave = 2 times peak
DC

DC Limitations
Higher test V for DC than AC = Space Charge
Etotal = Espace + Einsulation
Insulation = 5000 V, 90 mil EAC = 55 volts / mil
EDC = 10 X Result = Deterioration of insulation
To Tree or Not To Tree
Problems are recognized in polyethylene
May be in rubber as well
5000 Volt insulation ???
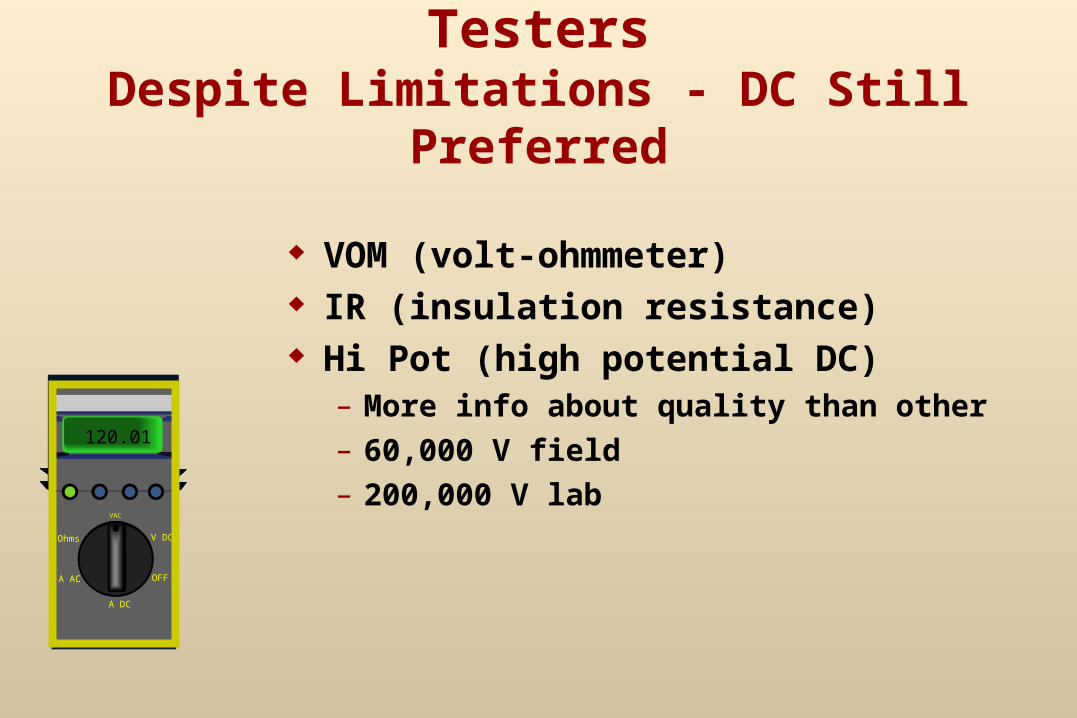
TestersDespite Limitations - DC Still Preferred
VOM (volt-ohmmeter) IR (insulation resistance) Hi Pot (high potential DC)
– More info about quality than other– 60,000 V field– 200,000 V labVAC
A DC
A AC OFF
Ohms V DC
120.01
Elevated Voltage
Can cause any insulation to fail
Difficult to interpret w/o destruction
Most valuable w/ historical data
Experience, skill, knowledge of local conditions - major aids to determining suitability
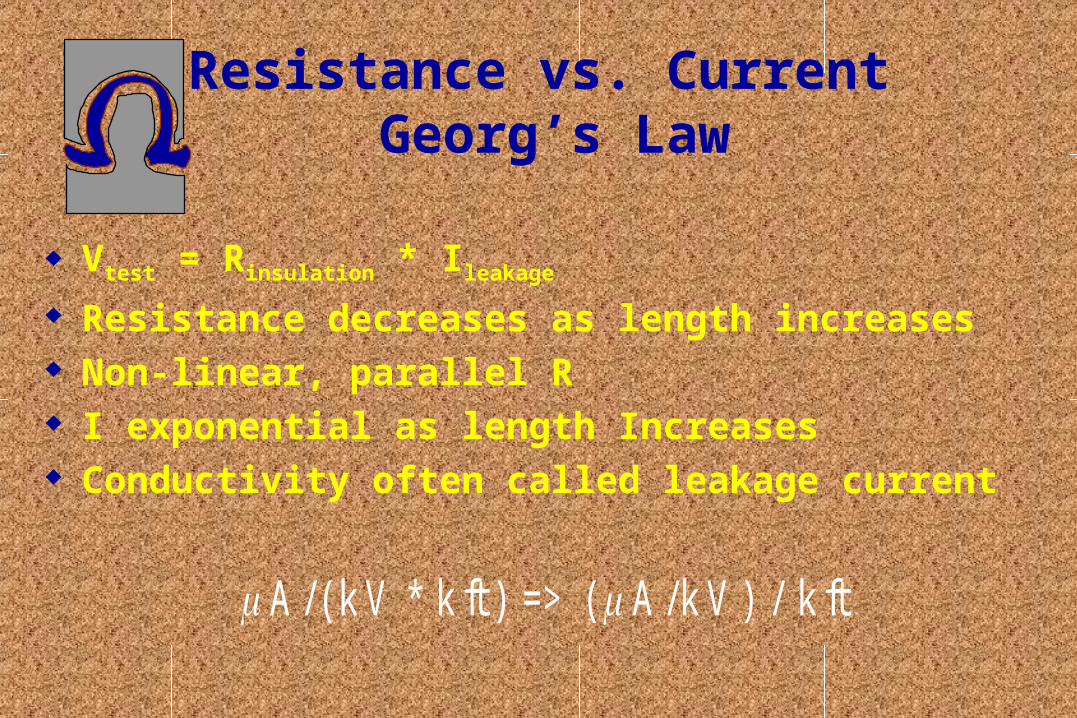
Resistance vs. Current Georg’s Law
Vtest = Rinsulation * Ileakage
Resistance decreases as length increases Non-linear, parallel R I exponential as length Increases Conductivity often called leakage current
A / ( k V * k ft ) => ( A / k V ) / k ft
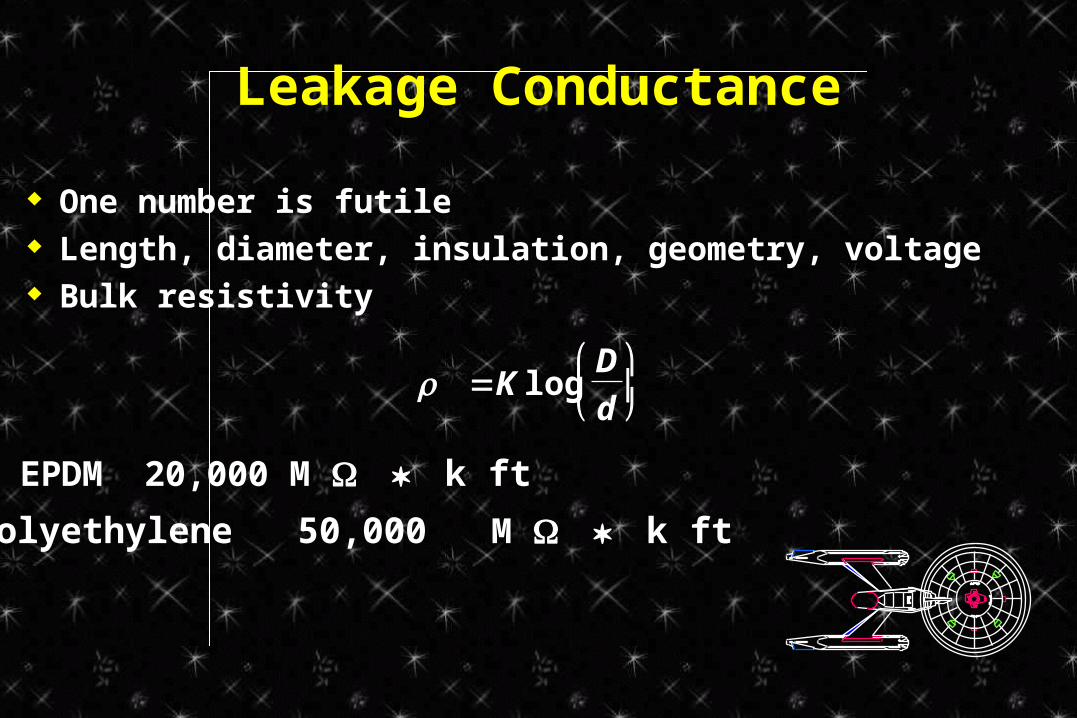
Leakage Conductance
One number is futile Length, diameter, insulation, geometry, voltage Bulk resistivity
K log
D
d
- EPDM 20,000 M k ft
- Polyethylene 50,000 M k ft

Leakage ConductanceEPDM
Derate for temp, moisture, oil
Lower values may still be good
K = 20,000 M k ft
G = .05 A / k V * k ft0
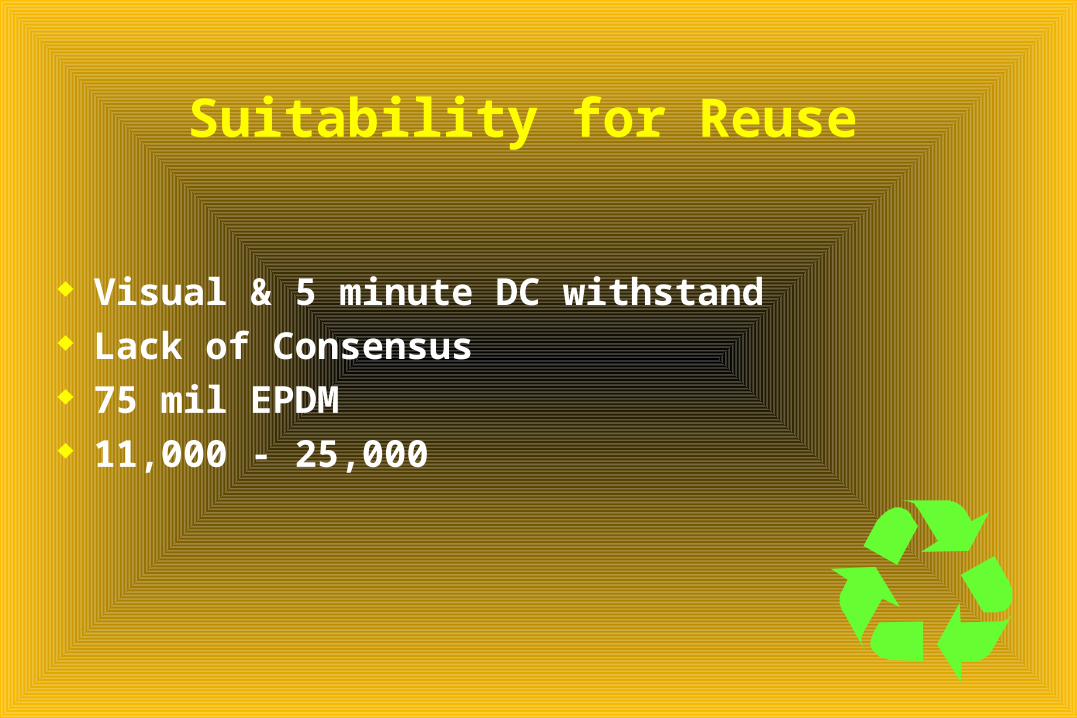
Suitability for Reuse
Visual & 5 minute DC withstand Lack of Consensus 75 mil EPDM 11,000 - 25,000

Comparison MethodsOverpotential Test
Specified leakage current Leakage conductance Leakage w/ ratio of 3 to 1 No consistent guidelines

Leakage Current ComponentsCapacitance Charging
Between conductor & ground Starts extremely high, decrease exponentially Drops to zero in few seconds
1 2 3 4 5 60
0.1
0.2
0.3
0.4
1 2 3 4 5 6

Leakage Current ComponentsAbsorption
Dielectric insulation Result of Polarization Starts high, decreases slowly Stabilize in 5 minutes Reasonable in 2 minutes
1 2 3 4 5 60
0.05
0.1
0.15
0.2
0.25
1 2 3 4 5 6

Leakage Current Components Conductance
Steady state value Over, under, around, through insulation Corona contributes Low value is good
1 2 3 4 5 60
0.10.2
0.3
0.40.5
1 2 3 4 5 6
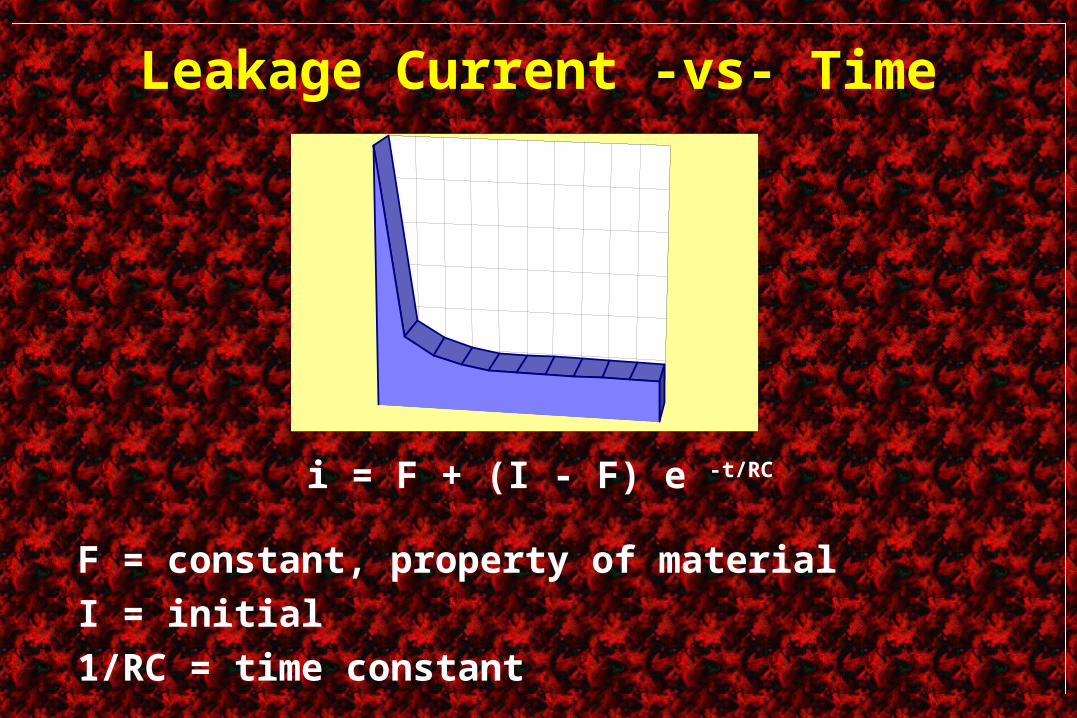
Leakage Current -vs- Time
i = F + (I - F) e -t/RC
F = constant, property of material
I = initial
1/RC = time constant
EvaluationMore Thorough
1 - Apply increasing voltage
2 - Plot leakage current -vs- applied voltage
3 - If R = ideal, V does not affect I
4 - Increasing I => insulation weakened
A TechniqueNot a Number
Forecast failure levels
Normalize– p Megohm - k ft– I Microamps– V Kilovolt– L thousand feet

Step 1Calculate Bulk Conductance
Contrast with measured
G = Ileak / Vtest
G1000
KiloVolts
mic
roA
mp
s
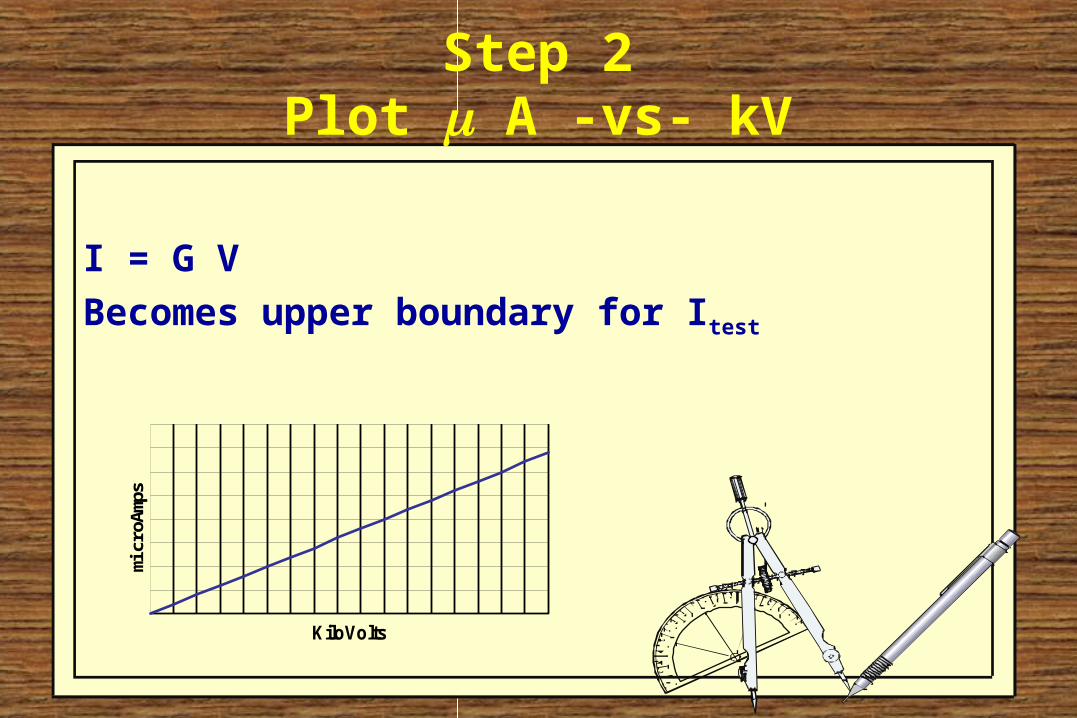
Step 2Plot A -vs- kV
I = G V
Becomes upper boundary for Itest

Step 3 Hi-pot Test
Perform hi pot test in steps
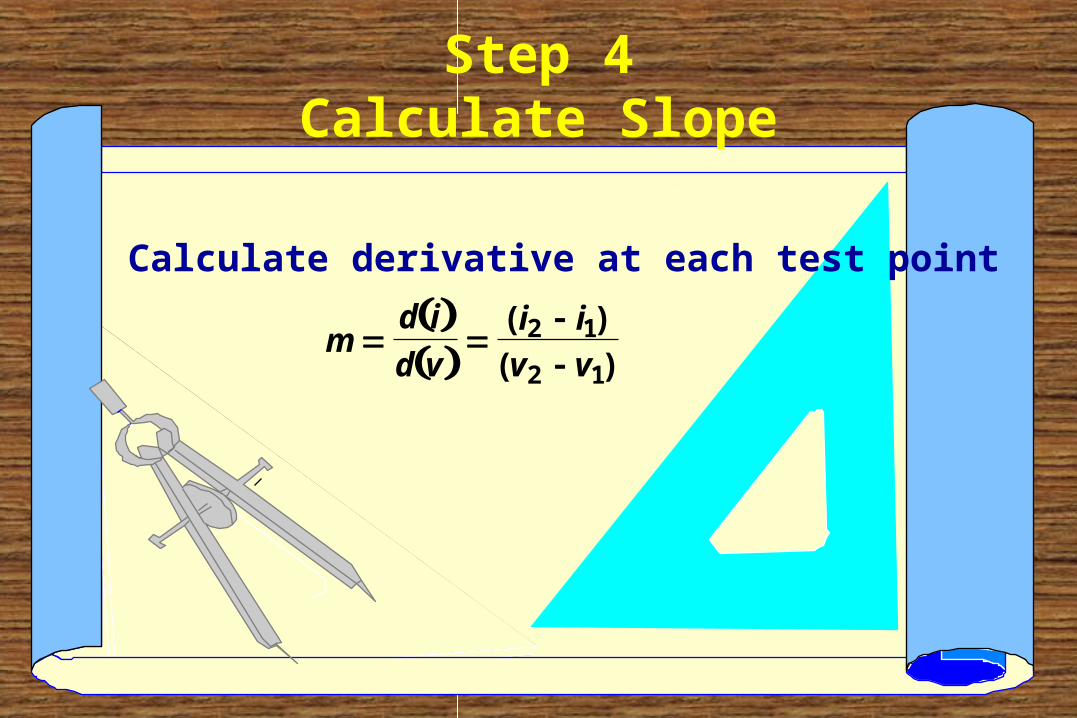
Step 4Calculate Slope
Calculate derivative at each test point
m
d i
d v
i i
v v
( )
( )2 1
2 1

Step 5Compare
Compare slope tobulk conductance
M > G => impending failure
KiloVolts
mic
roA
mp
s
Step 6Plot Forecast of Failure Point
i F e av ( )1
a
i i v v
v v
ln ln ln ln2 1 1 2
2 1
Fiav
1 e
Step 7For Next Test Point
Recalculate
steps 3 - 6
to refine forecast current
Step 8Calculate Forecast Voltage
Bulk
Test
Intersection
i G v
i F eav ( )1
va
G
aF
1ln

Step 9Calculate Comparative Quality
cq = forecast V / rated test V
Changes between tests show deterioration
Ratio < 40% indicates marginal quality
Figure 2 - Results
kiloVolts
mic
roAm
ps
Bulk Conductance
Test Data
Summary Testing
Insulation for reuse - controversial DC Hi Pot common - despite problems
Measure leakage I at test V Math technique to compare quality
Calculate bulk conductance (G) - limit Calculate rate of change of leakage G Compare derivatives (slope) Calculate coefficients of leakage curve Determine forecast V at intersection
Summary Mathematical Technique

Questions ?

Questions ?