a critical analysis of fatigue-crack propagation data for
TRANSCRIPT
A CRITICAL ANALYSIS OF FATIGUE-CRACKPROPAGATION DATA FOR 2024-T3 ALUMINUM
Robert Alan Kish

uUl LIBRARY
VDL'ATE SCHOUBIFORNIA 93yiQ
I BO I,
Monterey, California
L
A CRITICAL ANALYSIS OF FATIGUE-CRACKPROPAGATION DATA FOR 2024-T3 ALUMINUM
by
Robert Alan Kish
December 197^
Thesis Advisor G.H. Lindsey
Approved for public release; distribution unlimited.
U164887


TTNnT.ASSTFTFnSECURITY CLASSIFICATION OF THIS PAGE (When Data Enlarad)
REPORT DOCUMENTATION PAGE RliAD INSTRUCTIONSBEFORE COMPLETING FORM
I. REPORT NUMBER 2. GOVT ACCESSION NO. 3. RECIPIENT'S CATALOG NUMBER
4. TITLE (and Subtitle)
A Critical Analysis of Fatigue-CrackPropagation Data for 2024-T3 Aluminum
3. TYPE OF REPORT ft PERIOO COVERED
Engineer's Thesis;December 1974
S. PERFORMING ORG. REPORT NUMBER
7. AUTHORfa)
Robert Alan KishB. CONTRACT OR GRANT NUMBERf«J
9. PERFORMING ORGANIZATION NAME AND ADDRESSNaval Postgraduate SchoolMonterey, California 939^0
10. PROGRAM ELEMENT, PROJECT, TASKAREA ft WORK UNIT NUMBERS
II. CONTROLLING OFFICE NAME AND ADDRESSNaval Postgraduate SchoolMonterey, California 939^0
12. REPORT DATEDecember 197^
13. NUMBER OF PAGES62
U. MONITORING AGENCY NAME ft ADDRESSf// dlllermt trom Controlling Oftlce)
Naval Postgraduate SchoolMonterey, California 939^0
15. SECURITY CLASS, (ot thle report)
Unclassified
15«. DECL ASSIFI CATION/' DOWN GRADINGSCHEDULE
16. DISTRIBUTION STATEMENT (ol thlm Report)
Approved for public release; distribution unlimited.
17. DISTRIBUTION STATEMENT (ot the abetract entered In Block 20. II dttlerent horn Report)
16. SUPPLEMENTARY NOTES
19. KEY WORDS (Continue on reveree elde II neceeeary end Identity by block number)
Fatigue predictionCrack growth rateCrack closureFatigue-crack growth data
20. ABSTRACT (Continue on reveree elde It neceeeary end Identity by block number)
Fatigue-crack growth data for 2024-T3 aluminum was used toevaluate the accuracy of Forman's equation. Forman's equationwas found to predict from one-third to twi e the observedcycles to a given crack length when applied to multiple cyclicstress ratios. An alternative approach was developed, basedon the observed data, which is applicable to analog or digitalfatigue-crack growth prediction. Data acquisition based on
DD ,!i;SM7i 1473
(Page 1)
EDITION OF 1 NOV 6B IS OBSOLETES/N 0102-014- 6601
I
UNCLA! FTF.DSECURITY CLASSIFICATION OF THIS PAGE (When Dele Entered)


UNCLASSIFIEDCtCUXITV CLASSIFICATION OF THIS PAGErWTi.n D»(« Enl.«[f;
(20. ABSTRACT Continued)
constant increment of crack length has been found to yieldinadequate definition of the crack-growth curve in the low-cycle range for the successful application of the method.An expression was developed which extends the application ofthe crack-closure concept to the entire range of cyclic stressratio. An effective root-mean-square stress was defined whichshows indications of good correlation with the magnitude of thecrack-growth curves.
DD Form 1473. 1 Jan 73
S/N 0102-014-GG01
(BACK) UNCLASSIFIED2 SECURITY CLASSIFICATION OF THIS PAOtfWtn Data Fnl.r.d)


A Critical Analysis of Fatigue-CrackPropagation Data for 2024-T3 Aluminum
by
Robert Alan KishLieutenant, United States Navy
B.A., Arizona State University, 1967M.S., Naval Postgraduate School, 1974
Submitted in partial fulfillment of therequirements for the degree of
AERONAUTICAL ENGINEER
from the
NAVAL POSTGRADUATE SCHOOLDecember 197 1
*

C-/

ABSTRACT
Fatigue-crack growth data for 2024-T3 aluminum was used
to evaluate the accuracy of Forman's equation. Forman's
equation was found to predict from one-third to twice the
observed cycles to a given crack length when applied to
multiple cyclic stress ratios. An alternative approach
was developed, based on the observed data, which is
applicable to analog or digital fatigue-crack growth
prediction. Data acquisition based on constant increment
of crack length has been found to yield inadequate definition
of the crack-growth curve in the low-cycle range for the
successful application of the method. An expression was
developed which extends the application of the crack-closure
concept to the entire range of cyclic stress ratio. An
effective root-mean-square stress was defined which shows
indications of good correlation with the magnitude of the
crack-growth curves.


TABLE OF CONTENTS
I. INTRODUCTION 11
II. BACKGROUND 13
A. MINER'S RULE OF CRACK INITIATION 13
B. CRACK PROPAGATION 15
C. STRESS INTENSITY FACTOR 16
D. FORMAN'S EQUATION 17
E. HUDSON'S DATA 18
III. DEVELOPMENT 20
A. EVALUATION OF FORMAN'S EQUATION 2
B. MATERIAL RESPONSE FUNCTION 2 3
C. EFFECTIVE STRESS 26
FATIGUE-CRACK GROWTH DATA 2 9
E. NORMALIZATION OF THE DATA 31
IV. CONCLUSIONS 34
V. RECOMMENDATIONS FOR FUTURE RESEARCH 35
APPENDIX A. INTEGRATION OF FORMAN'S EQUATION 36
APPENDIX B. THE DERIVATION OF THE RELATIONSHIPBETWEEN THE DAMAGE EFFECTIVE CYCLEFRACTION AND THE CRACK-CLOSUREPARAMETER 39
LIST OF REFERENCES 6l
INITIAL DISTRIBUTION LIST 62


LIST OF TABLES
I. Fatigue-crack growth in 2024-T3 aluminum 43
II. Analysis of the prediction accuracy ofForman's equation for small cracks in2024-T3 aluminum 44
III. Coefficients, di, resulting from the fit ofthe fatigue-crack growth data to the generalsecond order equation 45


LIST OP FIGURES
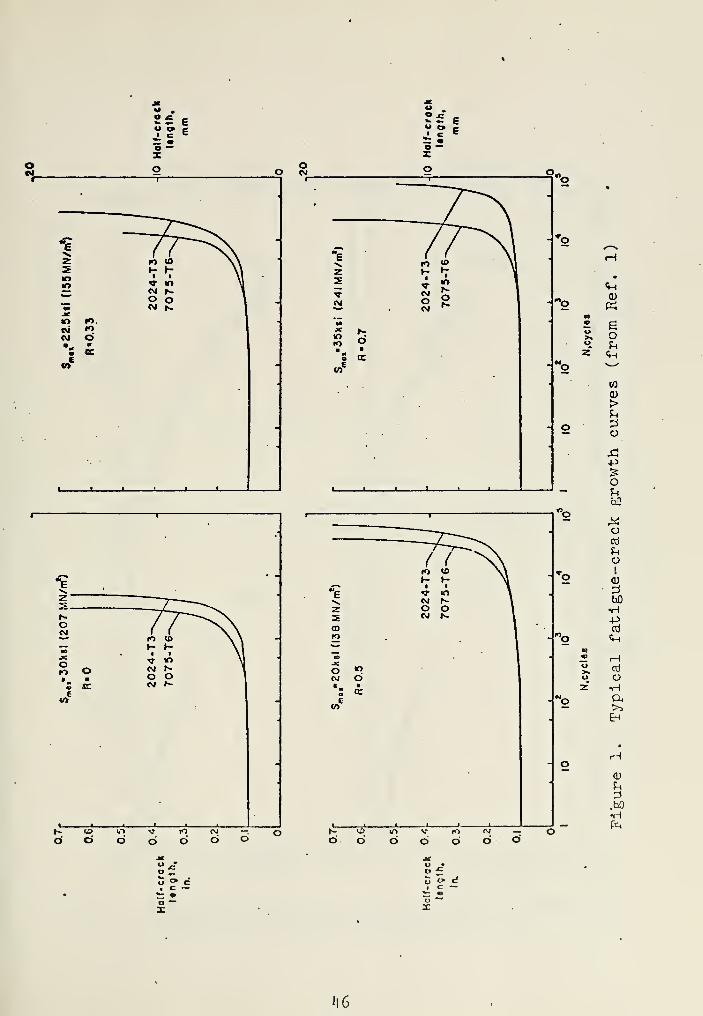
1. Typical fatigue-crack growth curves (from Ref. 1) — 46
2. Hudson's comparison of fatigue-crack growth ratewith Porman's equation (from Ref. 1) l\j
3. Comparison of a fatigue-crack growth curve withthe power-rule prediction (typical) 48
4. Comparison of fatigue-crack growth rate withPorman's equation for a single load case (typical) - 49
5. Constant amplitude loading with crack closure 50
6. Schematic representation of the effect ofincreasingly negative cyclic stress ratios 51
7. Variation of the damage effective cycle fractionwith cyclic stress ratio 52
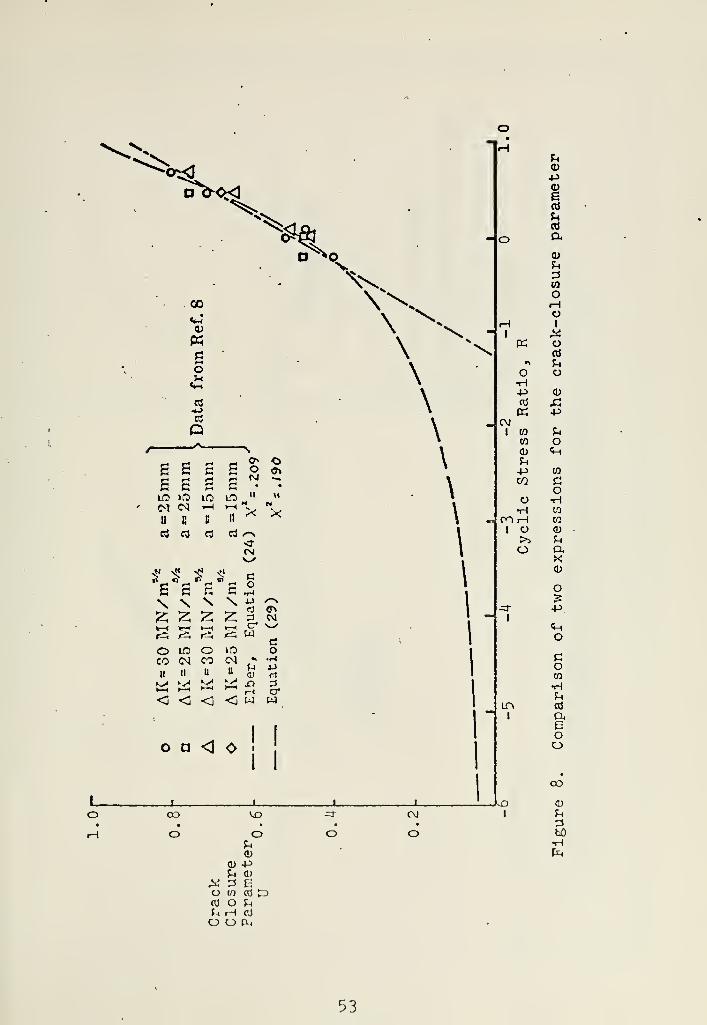
8. Comparison of two expressions for the crack-closure parameter 53
9. Geometric interpretation of the general secondorder polynomial fit to the fatigue-crackgrowth data 54
10. Correlation of the coefficient d-,* with theeffective RMS gross-section stress 55
11. Correlation of the coefficient d2* with theeffective RMS gross-section stress 56
12. Correlation of the coefficient d3* with theeffective RMS gross-section stress 57
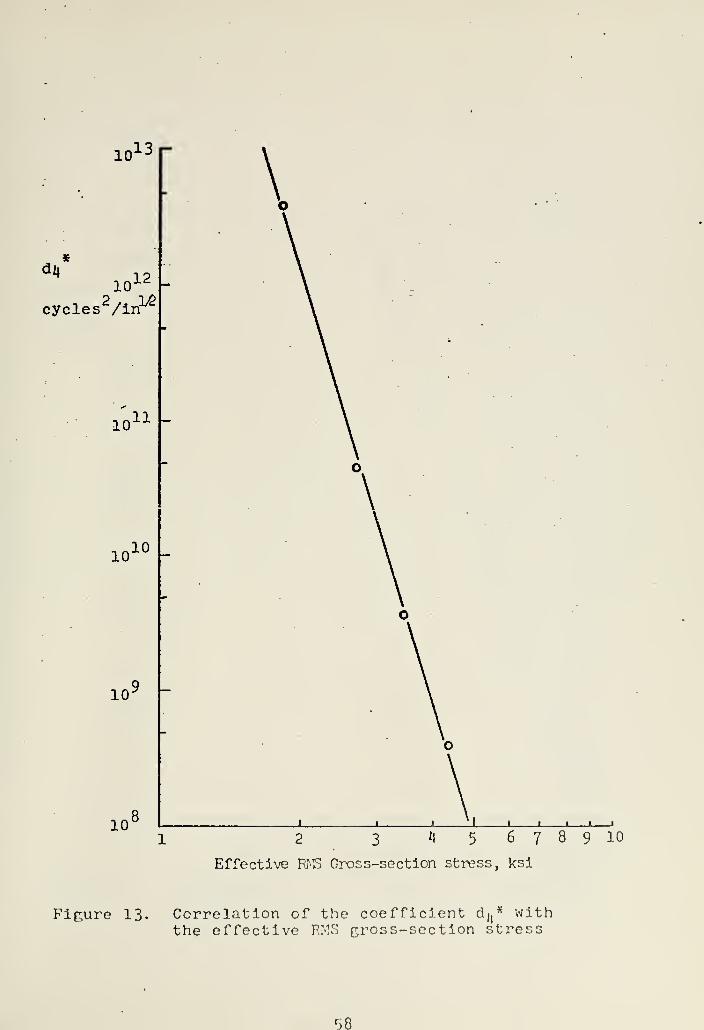
13. Correlation of the coefficient di|* with theeffective RMS gross-section stress 58
14. Correlation of the coefficient dc* with theeffective RMS gross-section stress 59
15. Relationship between the unstable crackpropagation stress intensity factor and theeffective RMS gross-section stress 60


LIST OF SYMBOLS
English
a crack half-length
f/T damage effective portion of a cycle or period
K stress intensity factor
K value of the stress intensity factor in thinsheets which leads to unstable crack propagationunder steady load
N cycles
R cyclic stress ratio
r radial coordinate referenced to the crack tip
5 gross-section stress
T period of load application
t time
U crack closure parameter
W specimen width
x independent variable
Greek
A. . . range of . .
.
6 angular coordinate measured from the line ofcrack advance
X correlation factor
a local stress near the crack tip
a) circular frequency of loading


Subscripts
a amplitude
e effective
ij tensor indices
ins instability, defpropagation unde
m mean
max maximum
min minimum
op opening
P predicted
rms root mean square
w width


ACKNOWLEDGEMENTS
The author wishes to express his appreciation to the
Fatigue Section of the NASA Langley Research Center for the
use of the fatigue-crack data examined in this thesis.
Gratitude is extended to Assistant Professor G.H. Lindsey
for his guidance and suggestions and to Barbara Kish for
her patience and understanding.
10


I. INTRODUCTION
Modern aircraft, particularly military aircraft, must be
designed for high performance and long service life. The
attempt to achieve higher performance in terms of increased
payload, range, speed, or maneuverability implies a reduc-
tion in gross aircraft weight, or in the structural fraction
of that weight. This constraint results in structural
components which carry higher loads per unit area and places
greater demands on their structural integrity.
The design values for the safe-life of non-inspectable
components and the inspection intervals for other components
are predicated upon the service life and the predicted load
spectrum specified by the contracting agency. The aircraft
components are sized to meet these design values using
fatigue prediction techniques. The estimates of remaining
life and maximum safe inspection intervals of operational
aircraft are frequently re-evaluated in light of the opera-
tional load spectrum using similar methods. A factor of
safety, or factor of uncertainty, is used in these calcula-
tions by which the expected life of a given structural
configuration is reduced. This factor of safety (FS)
directly reflects the accuracy of the prediction method used.
Large FS, indicating poor accuracy, results in excessive
structural weight when compared to the optimum and penalizes
the aircraft performance throughout the service life.
11


Optimistic estimates of the accuracy of a method lead
ultimately to costly retrofits and reduced aircraft
availability. The long term economic efficiency of an
aircraft is therefore dependent upon the accuracy of the
fatigue prediction methods available to the designer and
operator; thus considerable motivation exists for the
improvement of fatigue life prediction accuracy.
The fail-safe design philosophy, which admits the
existence of a crack in the structure, is one of the fati
prediction approaches in current use. Crack growth predic-
tions, in units of cycles from an initial size to its lengJa
when it precipitates catastrophic failure, are an essential
element in the fatigue analysis of today's airplanes.
Inspection periods and rework intervals can be prescribed
from this information. This thesis reports an invest! gat jb&
of data and theory used widely, if not exclusively, in
making crack growth predictions for aluminum alloys.
Specifically, Hudson's fatigue crack growth data [1] for
2024-T3 aluminum alloy was examined in order to establish
confidence limits on Forman's equation, which appears to bji:
the most widely accepted crack growth prediction procedure
used. Finally, an alternate method for expressing crack
growth behavior is proposed to improve the accuracy of CESS
length predictions.
12


II. BACKGROUND
The fatigue life of aircraft components is difficult
to predict due to the many factors influencing the structural
response to unsteady loading. These factors may be grouped
into four categories; material characteristics, environmental
effects, structural configuration, and service loading.
The fatigue response to unsteady loads is statistical
in nature and is dependent upon the time history of the
loading and material response, where material response is
defined to be cycles to a given crack length. The response
history may be divided into three stages. The first stage,
termed crack initiation, is characterized by sub-microscopic
cracks. This stage has been shown to be sensitive to a
variety of microscopic damage mechanisms. The intermediate
stage, termed crack propagation, is characterized by the
relatively slow growth of a macroscopic crack (a few grain
diameters) under the influence of the ordered external load.
Pinal failure occupies a small fraction of the fatigue life
of the material and a very high crack growth rate exists
during this stage.
A. MINER'S RULE OF CRACK INITIATION
The obvious complexity of the problem has led investigators
to make certain simplifying assumptions and/or approximations.
Miner [2] proposed a linear damage accumulation over the crack
initiation stage of the fatigue life. This proposal defines
13


damage as the fraction of the initiation life In cycles, N.,
expended at the I load level. An increment of damage
would then take place with each cycle at the I load level
according to 1/N. or for n. cycles, the damage would be
n^/N.. Since the accumulation of damage was assumed to be
linear, Miner's Rule predicts the fatigue life of a
component as
L = E n, (1)i
x
and damage as
ni
»'i 4 (2>
At the completion of the crack initiation stage,
Z n,/N. = 1 . (3)1
1
Fatigue life data is presently available as S vs N,,a i
curves where S is the alternating component of stress and
Nf
is the number of cycles to complete failure of the
specimen rather than formation of a first crack. Application
of Miner's rule to random load tests have yielded damage
predictions at specimen failure considerably different from
unity. Some refinements to Miner's approach to damage
prediction have taken the form of weighting functions on eachmi
term or variable powers on each term such as D = I (n^/N.)
lit

These modifications as well as competing damage hypotheses
have ofttimes resulted in improved prediction accuracy for
a given set of data; however, the Miner summation of damage
continues to be the most widely accepted due to its simplicity
and the minimal improvement in accuracy offered by its more
complicated alternatives.
B. CRACK PROPAGATION
After the crack is formed, fail-safe design practice of
crack-growth predictions requires a knowledge of the crack
growth rate and the load under which the cracked structure
would fail, both of which are not available from any damage
theory. Many investigators, as summarized in Ref. 3, have
attempted to correlate the crack growth per cycle to the
gross section stress and the crack length, leading to
propagation models of the form,
da/dN = f(S,a,A) (4)
where 2a is the total crack length, S is the gross section
stress and X is a correction factor which compensates for
finite width, rivet forces, etc. Paris and Erdogan [4]
concluded that the stress intensity factor (SIF), which is
a function of the same variables, was the parameter which
best correlated with the crack growth rate observed.
15


C. STRESS INTENSITY FACTOR
Mathematically, the stress Intensity factors are undeter-
mined coefficients arising from the solution of the field
equations for any cracked geometry. The normal stress at
the crack tip, under moderate static loading, is given by
this solution as
K K K--, - -i f,;ce) + -| g,,(e) +4h.,(e) (5)'«
vh ^r '
rh&ir u/
vh "u
where K, , K~ , and K~ are the opening mode, in-plane shear
mode, and out-of-plane shear mode SIP respectively, r is
the radial coordinate referenced to the crack tip and is
the angular coordinate measured counter-clockwise from the
advancing crack tip. The stress intensity factors may
therefore be interpreted as parameters that reflect the
redistribution of the stress field in a body resulting from
the introduction of a crack. The magnitude of the stress
intensity factor is dependent upon the geometry of the body
containing the crack, the size and location of the crack,
and distribution and magnitude of the external loads on the
body. The configuration most readily treated is the sheet
specimen containing a central crack of length 2a under
Mode 1 loading, for which
K1
= SAwa (6)
16


where X is a width correction factor. The criterion for
failure in the presence of a crack-like defect is that crack
growth to failure (instability) will occur whenever the
applied stresses, S, as given by equation (6) exceed some
critical condition specified by K, = K . Paris and Ergodan
[4] concluded from the preceding argument that this condition
may be extended to fatigue and applied to the slow growth
phase.
D. FORMAN 'S EQUATION
Forman [5] proposed a model for crack propagation which
utilized the range of the SIF as suggested by Paris [6],
" = Kmax - Kmln «)
to account for the cyclic loading typical of the fatigue
environment. This model included the instability condition
for failure as a singularity such that the growth rate
approaches infinity as K approaches K . Forman '
s
J max cr
equation is written as
da = C(AK) n mdN (l-R)K
r- AK *
°
;
where C and n were assumed to be undetermined material
constants and R is the ratio of minimum stress to maximum
stress (loading ratio).
17


E. HUDSON'S DATA
Hudson [1] conducted a most extensive study of the
material response of two widely used aircraft alloys,
2024-T3 and 7075-T6 aluminum, to evaluate Forman's equation
when applied to a large number of maximum stress conditions
and loading ratio combinations. (The data obtained in
Hudson's investigation was used as the data base for this
study.
)
The specimens used in Hudson's study were nominally
12 Inches in width, 35 inches in length, and 0.090 inches in
thickness. A notch 0.10 inches in length by 0.01 inches in
width was cut into the center of each specimen by an elec-
trical discharge machining technique. A reference grid of
0.050 inch spacing was photographically printed on the
surface of each specimen to mark intervals in the path of
the crack.
"Fatigue-crack growth was observed through 10-power
microscopes while illuminating the specimen with stroboscopic
light. The number of cycles required to propagate the crack
to each grid line was recorded so that crack-propagation
rates could be determined. Approximately two-thirds of the
crack-propagation tests were conducted to failure. The
remaining one-third were stopped before failure, and the
cracked specimens were used in residual-static strength tests, „1
National Aeronautics and Space Administration TechnicalNote D-5390, Effect of Stress Ratio on Fatlr.ue-Crack Growthin 7075-T6 and 202'1-T"-; Aluminum Alloy Specimens , by C.
Michael Hudson, p. 5, August 1969.
18


The results of Hudson's fatigue-crack-growth tests on
the 2024-T3 specimens are presented in Table I (reproduced
from Ref . 1) . Hudson obtained the fatigue-crack propagation
rates graphically from the crack-growth curves defined in
Table I. The crack-growth curves reproduced from Ref. 1
and shown as Figure 1 are typical. The results were
presented as plots of the common logarithms of the experi-
mental value of the crack-propagation rate as functions of
the range of the SIF. Three models were then fitted to the
data by least-squares techniques and compared to the data.
Figure 2, from Ref. 1, is typical of the method used for the
presentation of data and the evaluation of the quality of
fit of empirical equations. Hudson concluded that Forman's
equation produced an excellent fit for both materials whereas
the other equations evaluated "...produced good correlation
with the test data except at the high growth rates for the
7075-T6 alloy" on the basis of graphical representations of
which Figure 2 is typical. This conclusion at first appears
to be justified on the basis of plots such as Figure 2,
however, the fatigue analyst is concerned with the accuracy
with which a crack-propagation model predicts the number of
cycles required for the crack to attain a given length. This
is the basis upon which the fit should be evaluated.
19


III. DEVELOPMENT
A. EVALUATION OF FORMAN'S EQUATION
Hudson used the tangent form of the width correction
factor,
X w= W . iTa—— tan -rr
rra W (9)
in evaluating the material constants, C and n, in Forman's
equation. The differential equation resulting from the use
of this form of width correction in Forman's equation may
be integrated (Appendix A) using the small angle approximation,
tan 6 ^ 9 . This approximation is accurate to within three
percent for crack lengths of less than 0.8 inches for
Hudson's specimens.
The predicted interval of cycles between crack lengths,
AN . was calculated using Hudson's fit of Forman's equation
and the integrated form of Forman's equation becomes
AN, = 2C\P 1
where
" 2=H K S \/a2 ( cr max V o ^a
o Cn~=2 H^3 ]
(1-R)
2-nK
2 , cra (
?T=2
S Vamax vv
n-3.
(10)
C[(1-R)S ]maxn
20


and AN is the predicted number of cycles required to
propagate at half-crack of length a to length a. The ratio
of the predicted to the observed cycle increment is presented
in Table II, where gross discrepancies exist for almost every
case.
The load cases were also fitted individually in order to
determine the cause of the poor predictions reported in
Table II. The expression for AK used in this analysis was
AK = (S -S . ) A -/-^ (11)max min wV Z
where Brown and Srawley's [7] finite width correction for a
centrally cracked sheet,
Xw = 1.77 + -277(^) - .5K^) 2+ 2.7(^) 3
, (12)
was chosen on the basis of its reported accuracy. The test
data for each load case were represented by a power series
of the form
a = p-jN1
+ p 2N
2+ ... + PmN
m(13)
which yields a very good approximation of the observed data
as indicated by Figure 3. An analytic crack-growth rate
expression was obtained by performing a differentiation of
equation (13) with respect to cycles leading to
21

§r = Pi6/ 1""+ p?^^ 2
"1+ ••• + Vr/
111
" 1(12|)
Equations (11) and (13) were applied to each load case and
a least-squares fit of Forman's equation to the data was
performed. Figure 4 is typical of the individual fits thus
obtained.
A regular, periodic variation of the calculated crack-
growth rate about the fitted line was observed which is
believed to indicate that Forman's equation may be an
incorrect or incomplete functional form. These periodic
variations appear as scatter when Forman's equation is called
to fit multiple load cases. An apparent lower bound of
crack-growth rate may also be observed in Figure 4. The
failure of Forman's equation to represent this threshold
level probably accounts for the largest portion of prediction
error. Just as for the integration performed for Hudson's
fit, consistent prediction errors were noted for the fits
of the individual load cases but of smaller magnitude. The
periodic variation of the data about the fitted line and the
apparent lower threshold of crack-growth rate led to the
development of a new material response model. Equation (13)
was not considered to be a practical alternative to Forman's
equation in view of the explicit appearance of the variable
N, which is unknown in the practical application of any
prediction model. Series reversion was likewise discounted
due to non-integer exponents resulting from the fit.
22


B. MATERIAL RESPONSE FUNCTION
A material response function was developed in which the
response was assumed to be a piecewise continuous function
of time, loading conditions, and crack geometry. The
function was also assumed to possess piecewise continuous
time derivatives. This assumption was based on the satis-
factory representation of the data achieved by the power
series approximation of the fatigue data, equation (13) s
which has an infinite number of continuous time derivatives.
Previous investigators have assumed that the fatigue-
crack propagation rate, da/dN, has the functional form
da/dN = f(S(N),a(N),X(N)) (15)
where the variables have the meanings previously defined and
are functions of time or, alternatively, cycles. Although
the relationship between the independent variables N and t
is linear, as expressed by
N = ut (16)
where to is the circular frequency of loading, a distinction
in the growth rates da/dt and da/dN exists. The crack-growth
rate da/dt is an instantaneous rate which must be integrated
over the period of a cycle in order to obtain the time
average rate, da/dN.
23


Paris [6] concluded that the crack growth rate was best
represented as a function of the range SIF as given by
equation (11). The desired function must predict crack
growth rate under constant amplitude and random loading with
equal precision since constant amplitude loading is a special
case of random loading. The stress range is therefore a
constant for either load case taken on a cycle-by-cycle basis.
This argument applies equally well to any other choice of
the characteristic stress to be used in calculating the SIF.
The expression for crack-growth rate could then be represented
equally well by the functional form
§§= f1(a(N)
3Xw ( N )) (17)
or
f§= f
2(x(N)) (18)
where
x = Aw (a,W)-\/a(N)
since X is a function of crack geometry only.
Introduction of the requirement for higher order deri-
vatives can be satisfied by a linear summation of the assumed
form
cdx + c
d_j£ + +c d_21( 19 )C
l dNc2 ,..2
••• Ck,k KXJ}dN dx
2 'I

where the c1
= ci(S). Equation (19) is a linear differential
equation In N with constant coefficients and thus has a
solution of exponential functions. Paris [6] noted that the
crack growth rate is a monotonically increasing function
of the stress intensity factor. The crack length, a,
increases monotonically with time and the width correction,
X, increases monotonically with crack length, therefore the
rate of change of the variable', x, with respect to cycles
(time) must increase monotonically with x. This type of
response is typical of positive feedback systems, which
implies that the roots of the characteristic equation
obtained from equation (19) are real. A mathematical model
of the desired material response function is therefore the
Prony series
x = Z b2i-l exp[b
2iN] (20)
which satisfies all requirements heretofore set forth.
This form of the material response function may be recast
to the differential
,k , , ,2 ,k-ldx_l r dx , d x , ,d n
dNk ck
L -1 dN -2dN
2 '•
• -k-1Nk-1
(21)
when the functional form of the c. is determined. This
differential equation would find utility if programmed for
analog or hybrid computation using non-linear elements
25

eliminating the excessive digital computer time requirements
typical of random loading fatigue calculations; however, it
is beyond the scope of this thesis. This approach to fatigue
prediction calculations would also allow the use of discretized
flight load data without intermediate processing.
The data sampling frequency used by Hudson, based on
equal increments of crack length, provided insufficient data
in the low cycle range of the specimen lives. The crack
growth rate progresses from a nearly constant value at small
crack lengths to much larger values within a small increment
of crack length requiring a more frequent data sampling
frequency in order to achieve a successful analysis of the
exponential form of the fatigue response function through
direct analysis.
C. EFFECTIVE STRESS
The extension of equation (20) to account for random load
sequences requires that the constants be a function of the
loading conditions. The representation of the piecewise
continuous response function, x'(t), as the cycle average
function x(N) leads to the representation of the piecewise
continuous crack-growth rate, da(t)/dt, as the time average
crack-growth rate, da(N)/dN. Consistency requires that the
loading also be represented as a time average variable.
Paris [16] suggested the utility of the Root-Mean-Square
(rms) gross section stress, as defined as
26


S™s2
" k { s2(t) « < 22 >
where S(t) = Sm + Sa sin ut
and Sm is the mean gross section stress during the cycle,
Sa is the amplitude of the gross section varying stress
during the cycle, w is the circular frequency and T is the
period of the cycle.
The entire magnitude of the stress described above does
not contribute to crack propagation. Elber [8] has noted
that plastic yielding at the crack tip results in a compres-
sive residual stress upon unloading. This compressive stress
at the crack tip delays the opening of the crack. Elber
defined the crack closure parameter, U, as
U =3max "
g0P
(23)max min
where S is the gross section stress at which the crack
opens. He found that U seemed to be a linear function of
loading ratio for 2024-T3 aluminum as represented by
U = 0.4R + 0.5 (2^)
Since no crack propagation occurs while the crack is
closed, an effective rms gross section stress may be defined
as
27


Srms
2" I
Se2 f ^
where S = Sm + S sin ?J* _ s^e m a T op
subject to Sg
> .
The nature of the sinusoidal function is such that the limits
of integration can be shifted to write (25) more conveniently
in terms of the damage effective portion of the cycle as
illustrated in Figure 5. This leads to
1 + _f_ 1 _f_
f 2T ¥ 2T
s2
= f s2 &- + f o4r (26)rms J e T J T
' 1 _f_ 1 _f_
¥ 2t V 2t
where f/T is the fraction of the cycle during which the
crack is open and is defined by (See Appendix B)
f/ g cos X(1-2U) . .
Elber's equation for U(R) leads to effective cycle
fractions which are undefined for load ratios less than -1.25
This unnatural behavior in the neighborhood of a subset of
Hudson's data motivated a search for a more satisfactory
representation of the crack closure phenomenon. Figure 7
is a schematic of the loading conditions for increasingly
negative load ratios. Reasoning from this figure indicates
that, in the limit, as S approaches zero (R approachesmax
28


negative infinity) , the fraction of the period over which
the crack is open approaches zero. This physical constraint
is satisfied by an equation of the form
T ~ B^R (28)
where A and B were assumed to be undetermined material
constants. Substitution of equation (28) into the defini-
tion of f/T, equation (27), leads to
U = | [1 - cos tt (^Ar)] (29)
Elber's data [8] was fitted to the function for the
effective cycle fraction, equation (28), as shown in Figure
6. The form satisfies the physical constraint . and yields
a smaller x error than equation (24) when compared in
Figure 7. Figure 7 is a comparison of the functional
representation of U(R) as developed in this study with that
of Elber. Both forms appear to be incomplete in that neither
form considers the effects of absolute load level or crack
geometry on the crack closure phenomenon. S wasI III t> q
calculated on the basis of equations (25) and (28).
D. HYPERBOLIC REPRESENTATION OF FATIGUE -CRACK GROWTH DATA
On the basis of the arguments presented with regard to
the exponential form of the material response function and
the observed similarity of the exponential and hyperbolic
29


curve forms, Hudson's fatigue-crack growth data was fitted
to the general form of the second order equation.
Ax2
+ BxN + CN2
+ Dx + EN = 1 (30)
Solving for N, Table III is a listing of the coefficients of
the equation
N = d-jX + d2
± , y&Tx2+ d^x + d
5, (3D
ordered with decreasing S , which resulted from the fitrms
of equation (30)
.
Figure 8 indicates the quality typical of these coeffi-
cients. The variation in sign which occurs in Table III
reflects both the translation of the x axis (or the N
ordinate of the center of the fitted hyperbola) and the
frequent occurence of parabolic, rather than hyperbolic,
coefficients. The parabolic coefficients (sign of A = sign
of C in equation (30)) resulted from the paucity of data in
the low-cycle range of the specimen fatigue life. The
appearance of parabolic coefficients is unacceptable from
a physical standpoint as the parabolic form implies that
cycles to a given crack length is not a single valued
function, as shown schematically in Figure 9a. The trans-
lation of the center of the assumed hyperbola was an
unavoidable result of the presence of the original machined
30

notch. Figure 9b Is a schematic representation of the
effect of load level and the presence of the artificial
notch on the translation of the x axis.
E. NORMALIZATION OF THE DATA
A unified fatigue prediction method may be formulated
by combining the capabilities of the damage accumulation
method in estimating crack initiation with the fracture
mechanics approach applied over the crack propagation and
failure stages. This usage demands the normalization of
all load cases to a common reference crack length which
should be the minimum detectable crack length defining
initiation. This normalization was accomplished for each
(hyperbolic) load case by estimating the cyclic interval
between Hudson's reference point, typically 0.10 inch, and
the assumed initiation points, 0.003 inch. The estimate was
made on the basis of equation (31) using the d. previously
calculated and was then applied as an increment to the
observed cycles to a given crack length for an unnotched
specimen. The modified data sets were again fit to equation
(30) yielding estimated coefficients, d .* , of the unnotched
sheet which are hypothesized to correlate with Srms e
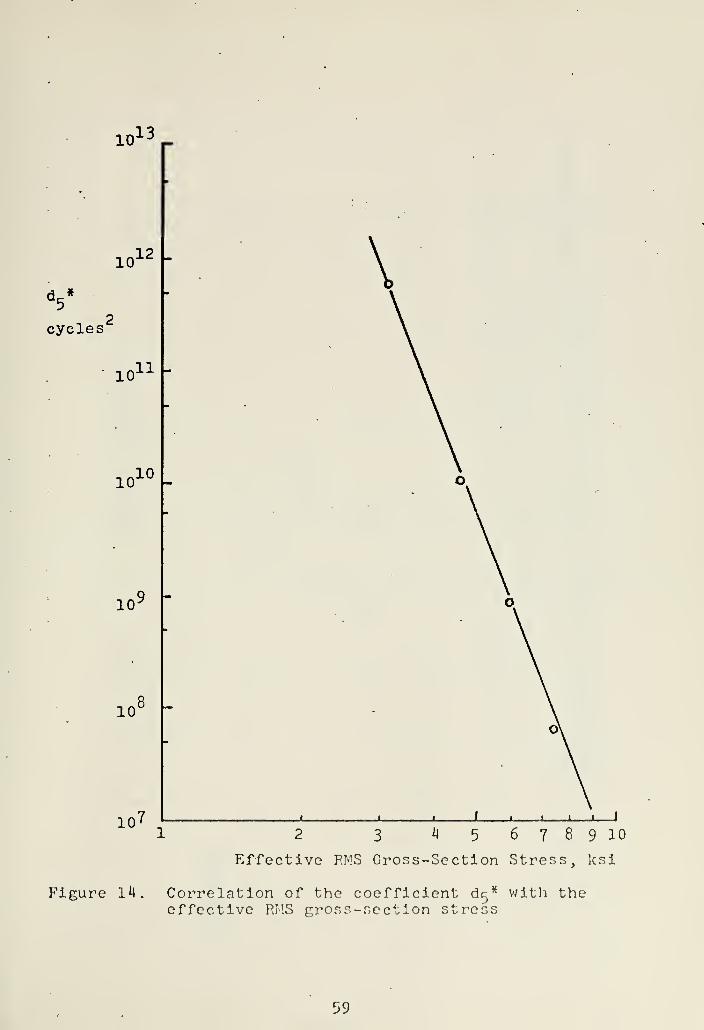
Figures 10 through Ik indicate the degree of this correlation
and suggest that the appropriate functional relation may be
V " »i W"1(32)
e
31

An analytic expression for the crack-growth rate, da/dN,
may be obtained by the chain differentiation
da _ da dx _ 1 1 fr>o\dN dx dN " ,dxv
rdNx UJ;
where g.-±-(* + af|)
(3*0
| (2d x + d^)and jg- = dl - r (35)
rd_x + d^x + dj-
11 "7
This expression for da/dN approaches the constant (threshold)
crack-growth rate observed in Figure *i at small crack lengths
and satisfies the instability condition given that equation
(3*0 has a zero.
The zero of equation (3*0 yields x. and leads to
K. „ = S x. (36)ins max ins
where the instability condition has been assumed to take
place at the instant in the last cycle at which the load
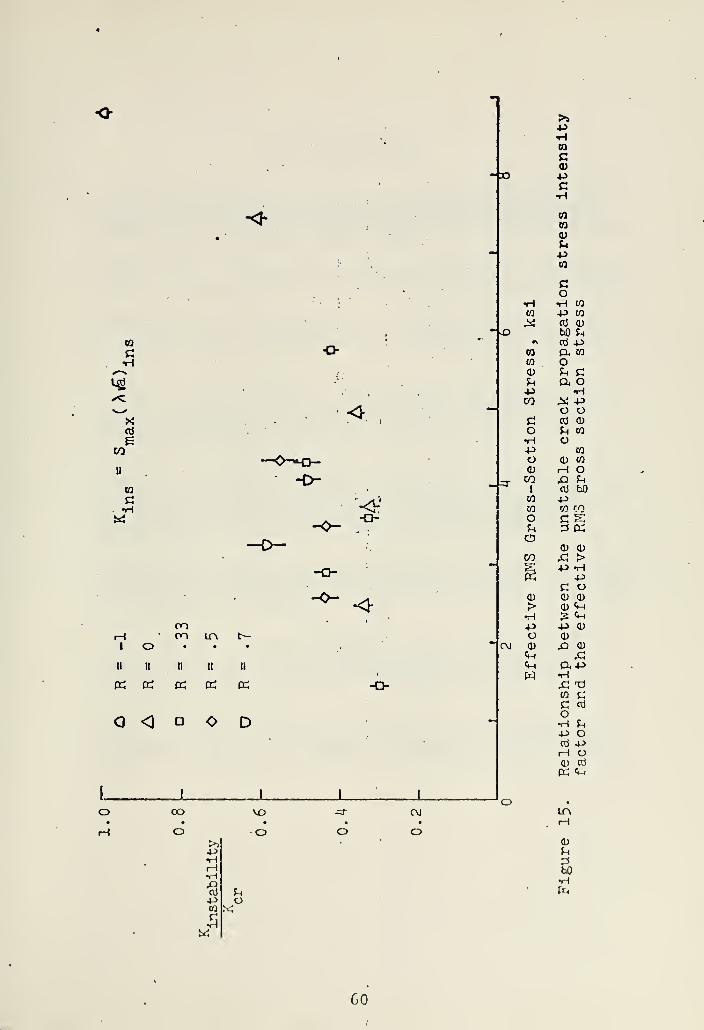
has attained its maximum value. Figure 15 depicts the
variation of the ratio K. /K . This apparent reduction ofins c 3?
the level of the stress intensity factor for unstable crack
32


propagation is attributed to dynamic effects on propagation
and has the effect of minimizing the influence of the
singularity condition in Forman's equation.
The data fits to equation (30) yielded no real solution
to equation (3*0 for some load cases. These load cases
appeared to be the dynamic tests which were terminated well
before failure and therefore contained Insufficient
Information regarding the shape of the response function in
the high-cycle region to give the correct physical response.
33


IV. CONCLUSIONS
Hudson's [1] fatigue-crack growth data for 2024-T3
aluminum was used to evaluate the accuracy of Forman's
equation. An alternative approach to the representation
of the propagation process was developed and analyzed. An
expression was developed which extends Elber's crack-closure
concept to the possible load ratio range. The following
conclusions can be drawn from this study.
1. Forman's equation does not appear to satisfactorily
predict crack propagation in 2024-T3 when evaluated on the
basis of the observed data.
2. Elber's crack-closure concept was successfully
extended to the entire load ratio range in 2024-T3 by the
relation
U - Sln ( 2.l6 9 -R }
3. The development of a crack-growth rate expression
based on empirical analysis of the observed data met with
limited success due to the coarse data resolution in the
low-cycle range.
4. The stress intensity factor at crack instability
under dynamic loading conditions was observed to decrease
with decreasing values of effective rms gross-section
stress, asymptotically approaching a value of approximately
one-third the value measured under static loading.
3^


IV. RECOMMENDATIONS FOR FUTURE RESEARCH
The material response of 2 02 4-T3 aluminum has been shown
to be capable of representation by a continuous response
function. The accumulation of a number of test sets with
more frequent data sampling in the low-cycle phase of the
crack propagation life would allow a determination of a
material response model for which statistical reliability
limits could be determined. Any such model must be based
upon the observed data, as compared to derived data, for
the reliability limits to be meaningful.
The development of the exponential response model will
allow the determination of the governing differential equation
for crack propagation under dynamic loading by the application
of parameter identification techniques. Such a development
would allow the calculation of the expected crack length
under random loading by the use of analog, rather than
digital, computation devices.
35


APPENDIX A. INTEGRATION OF FORMAN'S EQUATION
Forman's equation is written
da _ C(AK) n ,, .
dN ~ (l-R)K - AK KR ±}
where the stress intensity factor, K, is defined as
K =S\-\fta (A-2)
and the range of the stress intensity factor is written
AK = ASX^N/Jra" (A-3)
The tangent form of the width correction factor,
*w -\/? tan if ( A~^w V -rra W
may be used, allowing the small angle approximation. This
approximation, tan 0=9, yields errors of less than three
percent for ratios of crack half-length to width of less
than 1/15.
Limiting the integration to this range allows AK to be
expressed as
AK = AS\/a~ (A-5)
36


The cyclic stress ratio, R, is defined
R = max5min
(A-6)
Therefore AS = (l-R)Smax (A-7)
Forman's equation can be rewritten as
da ^^ Smax
n ^dN
( iI^c7rwI7r)
(A-8)
for the limitations imposed.
Treating this expression as a differential as proposed
by Porman [5]
(1-RMK - S a1/2
)
dN = cr - P»; daC(l-R)
nS
na1/2
max
(A-9)
which may be integrated between crack half-lengths a and a
AN = (1-R)P C(l-R) nS
- V-n JImax o
K - S n acr max
1/2
aHTT da
(A-10)
Carrying out the indicated integration yields
ANp
(1-R)
r 2 ~n
K a2
cr
- 2-n
3-n _
S a2
max
3-n J
a
C(l-R)nS
n1 V
a(A-ll)
37


Simplification of equation (A-ll) leads to
r 2-n
AN = 2C,P 1 n-2
max Fon-3
2-n
- an-2
maxA^"n-3
(A-12)
where
Cl
= (1-R)
C(l-R)nS
nmax
(A-13)
and AN is the cyclic increment predicted to elapse during
the extension of a crack of half-length a to a half-length
of a when subjected to constant amplitude loading conditions
R and Smax-
38


APPENDIX B. THE DERIVATION OP THE RELATIONSHIP BETWEENTHE DAMAGE EFFECTIVE CYCLE FRACTION ANDTHE CRACK-CLOSURE PARAMETER
Crack propagation occurs only when the fatigue crack
is open, allowing the definition of a damage effective
portion of a cycle (period) . This fraction of the period
is bounded by the limits t./T and tp/T representing the
instants of crack opening and crack closing, respectively.
The damage effective fraction is then
f/T = t2/T - t^/T (B-l)
These limits arc- symmetric about the maximum load instant
for constant amplitude loading. Assuming a loading function
of the form
S(t/T) = Sm + S o sin (27Tt/T) (B-2)m a
the limits of the damage effective fraction of the cycle
may be written
t-j/T = 1/4 - f/(2T) (B-3a)
and
t2/T = 1/H + f/(2T) (B-3b)
39


The crack opens during the loading portion of the period
when the effective gross section stress is zero. The crack-
closure concept modifies this stress by the inclusion of
the residual stresses resulting from local tensile yielding
at the crack tip. Defining S to be the gross section
stress at which the crack opens leads to
So (t/T) - S .- S_ + SQ sin (2-irt/T) (B-4)
e m op a
The instant of crack opening is therefore defined by
So (t,/T) = Sm - Snn + S Q sin (2irt,/T) = (B-5)c j. m op a. j.
or
S — S
(^S ~]
= Sln l^ 2^^/ 4 - f/2T)] (B-6)a
Trigonometric reduction yields
S - S
(
_o2^ m}
= cos (7rf/T) (B_ 7)
and the damage effective fraction of the cycle is defined
In terms of the loading and closure parameters
S - S
f/T A cos"1/!! (-2E. 01) (B-8)
a
'10

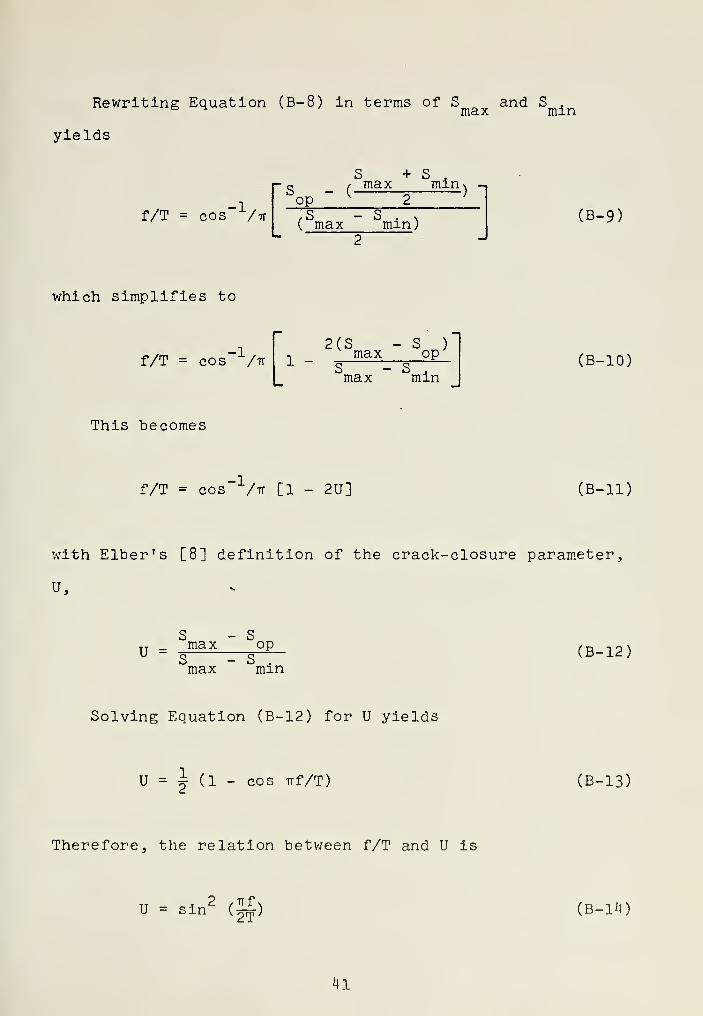
Rewriting Equation (B-8) in terms of S „ and S .
max mln
yields
f/T = cos /it
S + Se, / max min n
op "[
2J
max mm; (B-9)
which simplifies to
f/T = cos /it 1 -2(S - S )max opS — Smax min
(B-10)
This becomes
f/T = cos~1/tt [1 - 2U] (B-ll)
with Elber's [8] definition of the crack-closure parameter
U,
s — sTT
. max opS — Smax min
(B-12)
Solving Equation (B-12) for U yields
U = i (1 - COS TTf/T) (B-13)
Therefore, the relation between f/T and U is
U = sin (^r) (B-1'0
41


and
f/T = 2/tt sin"1
(U)2
(B-15)
H2


-P
ouM
O
UoI
0)
w•H
Ph
m
-I io«m o•o r~ R«mw»^
1
7 -I i i 1
1— o*
MP
CO9*
M*ooCM
c
• . c g § oo g oo g g oo s« £ E o o o 5 o o O o o2 o a o CM o o o eo CO o oM»m CO en ^> T e- o MO« « mo
Pi CM o * CM #o CM
o po CM CM
o o o o o o § o o o oE ie o o o o o o o o s oE
o m o o o o o o o ooaj •n VM M" o p- o •n CM o o o
s cm m> CO t- I- tn CM p- CO p-
«*' © CM CM o " CM p» •"" o CM
M »o CM CM
o o o o o o o o o o o o o o o o oe t~ o o o o o o o o o o o o o o o o_ c co e-> o o o o o -* o o o eo o o o o oo oo M" o n o CI CM o 4 in CM o CM co CO o o o©M- «n tn o to oo CO m CO t- T o o m m© •^m"
~" CM CM o "" "* co "•. o **
CM CM CM
. E o o o o o o o o o o o o O o o o o o 3m c = co co o o o o o o o o o o o o o o o o O_ s CO "* o o e-l in o o m *n o o —" o o o o o oJS oo » o co o m t- o o o *-> o o CM —
.
CD o o o ooo *r CM <o m c- CO in t-i m c- en co c- p-
5 O CM* CM CM ca —• •~* CM <=> co o c
* CM CM CM
S ,*E o o O o o o O o O o o o O o o o o o oc SB o o o o o o o o o o o o o o o o o o
CM o o o o uo o o CD o o o o o o o o o oe ©CM M" o co tit <ri in CO o cn CM lO o P4 o o o co o oEo
CD CO *r CM CM to T m CM m CM CM fl- to CD uo CO C-i oo"o°
"" CM CM o> ^ " CM o to o oCM " CM " CM
je 'Z' o o o o o O o O o O O o o o o o o a o o oo m o o o o o o o o o o 3 o o o o o o o o— c CM c- o o o PS in o o Xi o o O CM o o o o o o ou ©co m- a> o o HO T CM o o CO o o O en o o o o OS o o
r-c- CO CM o c-i PI P4 m C-i *p to CD CM uo o o^ o'r-"
"* CM CM Ci ** o CM o in o CO
CMetf
30
p. E © o o o o o o 3 o o o o o o o o o o O a oe s O o o o m o o o o o o o o o o o o o o oV o o so uT m O o m O o o co CM o o o a o o
5. o^- *r Oi r- in * n CD Xi o t- p- uo o CD CO CM o o o o c© O CM CM =-. CM in T-l CM T in eo to c- co uo p- in
O* L.O*
~" "• CM en ~* o CM pa S) c-
T3 ~ •^ '"" *"
U3 . c o o o o o o o o o o o o o o o O O o o o o o o o o
in o o o o o o o o o o o o 3 O c; o o o o O o o o— c en o CO o o r- o o o o o in o p- o o o o o o o O o o ola oo CO co m t- o T CM to o c o m ^p --. o CO m c- in o p- o CO o o Im p- .-l CM m CO CM o o CO m m CO c- CM eo O !
© CM*** •^ CM CO 1-1 o CM o VH -o en *
1
CJ1
u •=• O o o o o o o o o o o o o o o o o o o o o O o o o 1
5E o o o o o o o o o o o o o o o o o o o o o o o o o3 c- a o o m in o o CM t~* o o o m in o o o o o o o o ,
l» OO eo CO CM «n o «r o CO o o O PJ en m o o CM — co o CO en CM o o .
co o o CM CO en o co m CO p- c- CM en ooo *" —I CM co en CM CO •" PI co o
3 •—
*
*5 a o O o 3 o 3 o o a o O a r> o a 3 o o o 3 o o O-" c
o o o o o o O o o o o o o o o o 3 o a o o o o oCO o to o o o» CI Li o o eo co m o o o m o o o o o o o
h eo CI o PI m CO o 3D CO CM o c- CO o c- » to oft CM "X> o P> c- eo CO co CO Cl p- CO o en> c- e- CM CO CM eo< ©pf. -
Cr o o o a o o o o o 3 o a o o o r? o o o o o o a= E— C
o o o o 3 o o O o o o o o o O a o o o oco CO p- o XI o o o o — o o o 3 m in o a o o o 3 o
cmS*N) mp t> o CM en -r fM o O CM o o C en X) o in 3 H -T- eo oo CM CM CO m CM to o m CD ~io in CM m
°d- -
fl 3«n «*3 «-> CO P5_ .% £-) PI CO m »n m m «n p- r- e- r- r-
E *
zeo o O o o
>, _, MO m e'- 1— r- PI s o o 3 O ^ o o a o O o O a p- i- p- r- r-
t£ U N o o en PI n o o o o a o o O o c o o o o 3 eo CO CO P) 2 1
? 1.
"" *• "* CM CM • :-> CM CM CM J eo CM CM CM CM PI * •" •" ^*
— o o 3 o 5 - s cr o - 3 o o c o o a o o o o o c 3 ~3~1
is C CI CM ^ 5 O 5 o O o o pi PJ PI 1
IT
cm
C
z
CD as CO pi CJ cs Pi CM p) CM 3D PJ PJ PJ so eo V eo CO CO |
CM CO co en (M r> en CM , o en CM to P- CM to M" to p- M" o «T CO CMP- « O o i/» o o m PJ CM CO in CO m CO N PI CO CM
«m Xm ,,-< ..T
^ m tft p- m r» HO m CM f~ m *" MO to t~
JC mo O mo o r* tf> o C-" in r» e r* «o MO ri .t-* C0 MO Pl CM MO V CO CM miCM CM " — --i — •"* •* U
E
7.
o o o o o n en r<i v o CO CO 'O en •p in en PI CO CM r. CM CO CO enO o *n r» CI o I:, o CO m o 1- m o e lOCM
EH Z~
t-l -. «
1
2M"> P" in m r» CM MO
o o o o o ^ o r-' m <n o lA pi o in pi CO ^ *i P-' O Ml -' Ml o" "*..._ 1 • " -' -
. • " -' " C 1 fl < 1 "*_T*._
CM .
I 2
" 4 — < —
^3


TABLE II. Analysis of the prediction accuracy of Forman'sequation for small cracks in 2024-T3 aluminum.
ksi
Sa
ksi
NominalR value
Ratio of cycles predicted to cyclesobserved for propagation from a=0.10 inch
to.2 .3 • V • S .6 • 7 .8
ZS - / .44 .«C3 .4^ .44 .4/5" .4S .46
o ZO -/ .47 V6 •<4T .44 .*</ 44 .44
o IS -/ • 36 .33 .3/ .30
o /O -/ .43 .40 .3? .38 .37 .36 .3(o
o 7S -/ . 30 .30 .30 .30 • 3<2 SO
AS" /S O /.00 • ?<3 .59 /.00 I.OI /.<?/
/O /o O /. ?z /.OS .97 • 93 9f .91 .9(
f.S -7.S O /.3G f.Zl A/2 f.Ol AOZ .99 .97
s s O •94 /.04 /. 07 A 08 /.d& A07 AO£>
3.7S 3.7
£
.5-9 .64 .69 .11 •73 • 7^ 7<r
7.0 (O .33 /.z/ a/4 I.IZ A/3
IS 7.S -33 A7Z /.ss A43 A 38 /.34 A 32- A 3/
/z.iT 6.3 .33 /.2S /.69 /S6 f.So /.47 /.44 /.4z
fo s~ •33 A4B> t.4s 1.44 ?.4£> A36 A3S A 33
5" 2.5- .33 I.7Z /.69 A 69 AGS A £6 A64 /.cc
ZZ.S" 7.S • s" /.5V /.<4z /35 /3<=> /36 /•57
/8.7S" &.ZZ .S-
A.S2. AV0 /. 3 6 A34 /•3/ /. 29 /. 2 9
IS s-
. s Z./4 /.99 A95 /. 56 /.SO
(i.-zS 3.IS s /.03 /• // /./</ /. /s /./$" /. /<r /'. /<.'
7.S" z.s .S" .63 • S8 ,6£> .6V .£6
3o <r .7 .62 .6*/ .6& ,6fi
ZS 4A .7 • 63 .C^8 7o .7 1
ZO 3.5 .7 .</9 • $"4, .S9 .^C> .6< . 62 . c-z
IS z.c* .7 .S8 .58 .£8 fcf ,6.2 .(,3 .£</
/O 1-1 •7 .3/ • 3V .40 vV
')'l


TABLE III. Coefficients, di, resulting from the fit of thefatigue-crack growth data to the generalsecond order equation' •
ksi
Sm.
ksi
Sai
ksiR
Coefficients 6^ of equation (31)
dixlO d2xl0 dodO
8d^xlO
8dc-xlO
8
8.7& o 25" -/ /.£>7ZS" -O./^Z. r.83/6 - Z.Z^ZO o.s^y^-
7-44 <s (Z o /.836/ - o. Z.KZ 3.ZZ<^6 -Z.<^>8o o.&S9'
7-03 o zo -/ -6.80/C -o.8/4? 3&. o</ </#. 742 - /o. 3<=>9
£-.7& 2.o /o .33 -/.6&30 -Z.oq7G -Z&.<?69 CI. oil -9.4o48
S\Z? O IS -/
5.Z*f 22. S" 7.S • 35 W.S73 3.&7oo 178. SG -77.SS-3 GCHG4.<?&> to /£> 3.194o .2/ZZS" /3. £63 -(7.ZZ.I &.Z2CX
4.7 r 30 s • 7 Z5.181 -4.7S3S </<?/. z S" -e/43.08 /03, . Z-4
4.3& I0.7S &.2S" S" -Z90.f7 - 43 .
£"£>£ 833/0 3I3.IO /44. 7G
4.32 /5" 7.S" .33 K.Z73 S.Gloo ns.£-& -77.5S-3 &C.&IC*
4.o7 2? 4.4 •7 -/3.SfZ 2. o4£G -431.81 /VXf.6 -4/4-iZ
3.72. 7-5 7.S o .i4i4G - cf.?77¥ --24Z.4& S'J'tf.ftf -£r,687
3.C*2i <Z.S 6.S ~& l^.G7( l.Sit^ esfe.tfi -173.91 6?. ICo
3. S* o (O -t -Z.S'I'SZ. -.39GZ9 7.n*w zo.718 -r.«?r
3.49 iS S~ S" T-.tJteC* -Z.S77S" - "£•/&/ Z,o4 <-5" -S"o.SSC
3.Z-«£ T.O 3.b~ .7 -S8-^3S ZO. 5"70 Z29J/7 5ZS0.S -lllo, ?
Z.0& \o sf • 33 -/.&OS3 -2.7G^ -• -s.8r 153 S3 -?-C? ?.</'/
Z.<^4, o 7.5 - ( - 76 . S6T7 4.4-64C r -T.s 873*. 4 - V'^^C'. </
Z.CrZ tt.zz J.Z5 $ - ZZ.7-V3 S.8944 354 l-O -A7</3.3
Z.«/S 5" £f O -.C-*C>2-il e.6/?77 - • ;?.o<^ I77<4.1 -3(,3.cr.o
ZMZ IS" 2.C •7 </?.z.sz. - S*f.V/2. n ':o - l3<-/f3o To^."5
[.£'<* 3.7 s 3.7c o </5S". S 1 -8^.234 ' Ao - |l| 74<c ^ 1 ' 33(.75" 7.f 7i. <r • 5 f/7o.3M - 4<?.£W9 2 '1O0 -223^30 (Ao/1 / /
t.<4 S z.s •33 2.234.^ _ \ZZ.C/{ ( ? ( 00 -(CCTSOo 5/&1"^9
( .V9 (O 1/7 •7
'15

+ — E
„ mo —X
2f e
oCM
1
—
1
"e" 7/"—"~-^\
x.z n u> \\5 Kt- \\into <» m MN N 1
"••
o O \CM f. |
jrr> ».CM <oCM o
ccc
v>
•
i 1 I : i
o<M
d
CI)
KSo
CO
0)
>
o
-p
o
1
—
1
H5_r-oCM
ro 10 \\m K t" \l
O O CMO« \J
o 1
B CC CM r-
6VI
« 1
o 6 6lO
6(VI —
!
oauoI
<u
M•H-PGj
cd
o•HiX>>
0)
.bO•H
c cf
oI
i|6


10
10"
io-
Rote,
ia/cycle
I05
10"
10'
Ak.MN/m"10 20
3/2
30 400
R=0
id1 ' 1 T 1 1
"
io-5 -
R==0.5
'
6 /
-
io-4
r /r
Role, f -
in/cycleJ§
•
io5
•
1-
io6 I
•
IJ
-7 X> . i i.i.
Ak,MN/mS"
10 20 30
R = 0.33
40
-NO'
10
Rote,nm/cycle
Role,nm/cycle
Ak.ksi-m A.I " 2Ak.ksi-in
Figure 2. Hudson's comparison of fatigue-crack growth ratewith Forman's equation (From Ref. 1).
'17


omm
oC\J
COH enco •
Xlio•HHO
CO tH.* II P
cdO 0) U rHc\j »c>
3 co •
II +3 CO Cm•H CD CD
CO iH m KCO a-pd) 6 co Em cd oP H Mco co cd Cm
co CC 0) -H cxS
cd u 6 pCD +3 O cd
S CO S Q
CO
CD
i-l
o>>ooiH
O
CU
.G+>
P
CD
>
O
•C-P
ou •
iH^ cd
ocd -Hm aO >>1 pCDw
•H OP -Hcd P<M o
•HCO T3
CU
<M Mo a
o Hco
•H MM I
Ctf Ma, cy
E £O O
on
o
J_ _i-
<^> LTv
• •
O O**
X to
1 ,y p cu
Cm o tc x:iH cd c oat M CD cK O t-l tH
oon
oCM
o
CD
u
bO•HPh
'18


10-V-
10-a
in/cycle
10-S
10-5
Figure 4
Forman's equationi
•Equation (14)
1.
10 20 30
AK, ksi-in
401/2
50 60
Comparison of fatigue-crack growth rate withForman's equation for a single load case (typical)
49


>IH
«Jco
0)
en
oO
O
Uo
-P
•Hxi
o
•d
•p•HrH
Ecd
pc-ptO
oo
IT*
M
X03
E
• o ECO CO
COc »\
o tO
to" •H to
to P <D
o o i-, Hb QJ P to
U) 10 W •^


-P
\ »
W) M5 5a 3co
Ko o0)
-a •S
^ K<m
1
o wW P <L>
O £, tHCD P 10
•HW0)
"8
iHbOc•HCO
cd
<D
^oC•H
<Mo•poa;<^i
<Ma>
<D
.cp wo
<M -HO -P
cti
C ^oH co
•P wcti aj
P ?H
C -P<D w
,.*°'ku o^ -HCMfl> ok >5
oo•H (U
P >Cti -He -pa> aJ
£X hOo a>CO c
u
bO
51


o
o•H
*
PapCO
,/////////y////////////////"""^
DO<^^V
2 XW *sH V\sx
* Vv\
CCS \ ^\ ^~~\\
\s s s sS £ S S1(3 lO m m
\CM CM tH rH
11 u s "\iC3 CC d 03 ^^
\v«»
\* § sL;sl «E E E S.S
\^ N s N « w'
z, Z Z £ 3 8\—< M k—< »—1 C" >—
'
^ g <; rZ w\O lO O lO O
00 <N CO ON •> •**
n II « "art \
•> bd i^ i£ - 3t
< < < <3 w wI
>, i1
I
O D < O
1 1 i
1
1
-, -J
or-i
C\J
I
onI
I
LTV
I
o•HPa&,
co
CO
CD
upCO
o•HiHO>io
o•HrHO>»O
.cp
co•HPOcd
Cm
COiHO>sO
a>
>•HpoCDCmCm
CDbOcd
6cti
aCD
XIP•
Cm OO >HP
O M•Hp Wcd w•H <D
M Maj .p> w
co VD I
CD
> CH oCD P HM O CD P«! DH oE Cm o Kj
Oj Cm >> M
CD
M
s•H
PWOfe
52

\^Cv.•
. ^ •
•
<
•
. „
CO \\\ \ -
s \ \o
\
\
\ -/' s
\S £ £S S £ £ * «
\10 10 10 lO" U
u G S II^
NX
\ .C0 a a cd /-n
CM \
\
I .
<< •
£ fi£3 o
CMk—
<
s so lO o >o OCO11
CM COII u
cs »
" CJ
• r-l
P
>-5 •—
<
3
< < <3 <l Ui W1
"
o a <J •11
1
1 1
1
I
1
. 1
u0)
•P0)
6cd
Jmcd
o ft
<D
^3CO
ot-\
or-\ 1
1 J*K o
cd•% ?Ho CJ
•H-Pa XXK -p
CM• CO ^
CO oCD Cm^P CO
CO CO
O H•H w
OOiH CO
1 o CD
>i Uo ft
X4)
O£
i
P1
<WO
coCO
•Hu
LTV cd
1 ftEOO
CO*
o
ocd
I
\o
UCD
PQ)
ecd
Ucd
OCM
CO
CD
U
60•HPh
O O CVi
53


<D
•duo •
-o pC aJ
O -Oo0) .cw -P
o
bO ctf
-p
oi
o
O -H-P
O «M•H•P 0)
K) £P P^ oa-p
QJ -Pp> -H
O ctf
?u e-P o(U £6 >>O iH<D oa p.
otHO en
§P-. 3
bO^-^ Hrt fe
5 'I


107_
cycles-in1/2
10 d.
10
10
54-
-i
2 3 ^ 5 6789 10
Effective RMS Gross-Section Stress, ksi
Figure 10. Correlation of the coefficient d-, * with theeffective RMS gross-section stress
55


d2«
cycles
10
10-
10
10 I I I I I I I
2 3 'I 5 6 7 8 9 10
Effective RMS Gross-Section Stress, ksi
Figure 11. Correlation of the coefficient d 2* with the
effective W.S gross-section stress
56


1013
10
d3*
pcycles /in
12
1011
1010
10 9 _
102 3 {1.5 6 78910
Effective RMS Gross-Section Stress
Figure 12. Correlation of the coefficient £3* with theeffective RMS c^oss-section stress
57

1013
dn10
12
cycles2/!^
1011
1010
10-
102 3
1' 5 6 7 8 9 10
Effective RMS Gross-section stress, ksi
Figure 13. Correlation of the coefficient di(
* withthe effective RMS gross-section stress
fj8

10«
1012
a5«
cycles'
1011
io10
h
io-
10
10 J. -J I 1
2 3 456789 10
Effective RMS Gross-Section Stress, ksi
Figure 14. Correlation of the coefficient CI5* with theeffective RMS gross-section stress
59

- »
(0
•H
MS
Xcd
co
u
CO
W -D-
-O-
-0- <rH
1 oonm LTV t-
II II ll II II
K K « K K -o-
Q <] a O D
<D
CM
Ooo vo =r C\J
• • •
o o o>>
'
P•Hr-lHjqcd ;-,P oCO X5«
>>pHCO
Ca)
+>c•H
CO
CO
ofc-pCO
CO
•H •H CO
(0 p co
>i a CD
bO ^•\ cd p
CO a co
CO o<u u c£n a o+3 «HCO ^ P
o oC cd <D
O k CO
•H o-P co
O CD CO
<D rH Oco -O ^
\ cd faO
CO PCO CO COo c sU 3 Ko
0) CD
CO .C >S P -HK P
C oCD cu a>
> CD <•-<
•H £<«-P P CD
O CD
0) X3 CU
<H .C«H UPw •H
,c T3co CC cd
o•H ^P oCd 4JH O<D cd
LOrH
CO
u
i•H
CO


LIST OF REFERENCES
1. National Aeronautics and Space Administration TechnicalNote D-5390, Effect of Stress Ratio on Fatigue-CrackGrowth in 7075-T6 and 2024-T3 Aluminum-Alloy Specimens ,
by C. Michael Hudson, August 1969.
2. Miner, M. A., "Cumulative Damage in Fatigue," Journal ofApplied Mechanics , v. 12, p. A159-A164, September 1945.
3. Walton, D. and Ellison, E. G., "Fatigue Crack Initiationand Propagation," International Metallurgical Reviews ,
v. 17, P. 100-116, 1972. :
4. Paris, P. and Erdogan, F., "A Critical Analysis ofCrack Propagation Laws," Transactions of the AmericanSociety of Mechanical Engineers, Ser. D: Journal ofBasic Engineering , v. ti5, p. 528-534, 1963.
5. Forman, R. G., Kearney, V. E., and Engle , R. M.
,
"Numerical Analysis of Crack Propagation in Cyclic-Loaded Structures," Transactions of the American Societyof Mechanical Engineers, Ser. D: Journal of BasicEngineering , V. 89, P . 459-464, September 1967.
6. Paris, P. C, "The Fracture Mechanics Approach to Fatigue,"Fatigue, An Interdisciplinary Approach , edited by Burke,J. J., Reed, N. L., and Weiss, V., p. 107-132, SyracuseUniversity Press, 1964.
7. Brown, W. F., Jr. and Srawley, J. E., Plane StrainCrack Toughness of High Strength Metallic Materials ,
ASTM STP 410 , p. ll, American Society for Testingand Materials, 1966.
8. Elber, W. , "The Significance of Fatigue Crack Closure,"Damage Tolerance in Aircraft STructures, ASTM STP 4 86
,
p~! 230-242, American Society for Testing and Materials,1971.
61


INITIAL DISTRIBUTION LIST
No. Copies
1. Defense Documentation Center 2
Cameron StationAlexandria, Virginia 22314
2. Library, Code 0212 2
Naval Postgraduate SchoolMonterey, California 939^0
3. Chairman 1Department of AeronauticsNaval Postgraduate SchoolMonterey, California 93940
4. Assoc. Professor G.H. Lindsey, Code 57Li 2
Department of AeronauticsNaval Postgraduate SchoolMonterey, California 939^0
5. National Aeronautics and Space Administration 5
Langley Research Center, Attn: MS 188EHampton, Virginia 23665
6. LT Robert Alan Kish 2
604 N. 68th AvenuePensacola, Florida 32506
62


Thesis 157036K535 Kishc.l A critical analysis
of fatigue-crack pro-pagation data for 2024-
T3 aluminum.
Thesis 15703bK535 Kishc.l A critical analysis
of fa tique-cracl' pro-
pagation data for 2024-
T3 aluminum.

r;^lanalvs 1
sof.at,gue-cracki
P;
o
3 2768 002 10922 5
DUDLEY KNOX LIBRARY