a critical band of phase alignment for discrimination but not recognition of human faces
TRANSCRIPT

Vision Research 48 (2008) 2523–2536
Contents lists available at ScienceDirect
Vision Research
journal homepage: www.elsevier .com/locate /v isres
A critical band of phase alignment for discrimination but not recognitionof human faces
Bruce C. Hansen a,b,*, Reza Farivar c, Benjamin Thompson b,1, Robert F. Hess b
a Department of Psychology, Colgate University, 13 Oak Drive, Hamilton, NY 13346, USAb McGill Vision Research Unit, Department of Ophthalmology, McGill University, Montreal, Que., Canada H3A 1A1c Department of Psychology, McGill University, Montreal, Que., Canada H3A 1A1
a r t i c l e i n f o a b s t r a c t
Article history:Received 9 April 2008Received in revised form 18 August 2008
Keywords:Face discriminationFace recognitionSpatial phase alignmentFourier filteringSpatial frequencyFace frequency
0042-6989/$ - see front matter � 2008 Elsevier Ltd. Adoi:10.1016/j.visres.2008.08.016
* Corresponding author. Address: Department of Ps13 Oak Drive, Hamilton, NY 13346, USA.
E-mail address: [email protected] (B.C. H1 Current address: Department of Optometry and
Auckland, New Zealand.
We investigated the processes underlying the discrimination and recognition of human faces as a func-tion of spatial phase alignment to assess whether face processing can be understood in terms of theamplitude spectrum alone. Specifically, we varied the amount of aligned Fourier phase in differentregions of the face frequency spectrum and argue that the properties of the underlying neural processesare best understood in terms of the number of phase alignments as opposed to octave bandwidths. Addi-tionally, we observed performance differences for face discrimination tasks compared to face recognitiontasks. For face recognition, our results show that a narrower range of phase alignment is needed for facefrequencies near 9 cpf when compared to 3 and 27 cpf, thereby supporting the notion of a critical fre-quency for face recognition. However, for face discrimination where participants were required to dis-criminate between an average face and different unique faces along a face morph continuum,performance depended on a fixed signal-to-noise ratio of phase alignment within a contiguous rangeof face frequencies (termed critical band of phase alignments), regardless of the central face frequencyof that range within the face frequency spectrum when compared to non-phase randomized controlthresholds.
� 2008 Elsevier Ltd. All rights reserved.
1. General introduction
The early processing of visual content involves a spatial decom-position of the image by cells in the primary visual cortex that haveband-pass properties for spatial frequency and orientation (e.g.,DeValois, Albrecht, & Thorell, 1982; Maffei & Fiorentini, 1973). Psy-chophysically, the notion of spatial frequency ‘‘channels”, intro-duced some 40 years ago by Campbell and Robson (1968) isthought to represent the properties of individual cells at this earlystage of the visual pathway. Such channels are thought to beapproximately 1 octave in bandwidth (but see Wilson, McFarlane,& Phillips, 1983) and have an orientation bandwidth of approxi-mately 10–20� (Blakemore & Campbell, 1969; Phillips & Wilson,1984; Wilson & Bergen, 1979). The usefulness of this channel con-cept has extended beyond its initial application to the detectabilityof relatively simple (in the Fourier sense) localized stimuli, to spa-tially complex objects in motion (Anderson & Burr, 1985; Hess,Bex, Fredericksen, Brady, 1998; Ledgeway, 1996; but also see Hess,
ll rights reserved.
ychology, Colgate University,
ansen).Vision Science, University of
Wang, & Liu, 2006), stereo (Heckmann & Schor 1989; but also seeHess et al., 2006), and to object recognition in general (Braje, Tjan,& Legge, 1995). On the other hand, there is relatively good evidencefor the rigid combination of channel-based content in the detectionof the motion and disparity of spatially complex objects (Hesset al., 2006) as well as the discrimination of spatially complexobjects (Olzak & Wickens, 1997).
With respect to object recognition, it has been argued that letteridentification can be understood in terms of a single elementaryspatial channel with a bandwidth of 1.6 ± 0.7 (Majaj, Pelli, Kurshan,& Palomares, 2002; Solomon & Pelli, 1994). A similar claim hasbeen made for face recognition, but for a central face frequencyof approximately 10 cycles/face (Näsänen, 1999). In fact, a numberof studies, using a variety of different techniques, have argued forthe importance of a relatively narrow (1–2 octaves) band of facefrequencies located around 8–10 cycles/face (e.g., Costen, Parker,& Craw, 1996; Fiorentini, Maffei & Sandini, 1983; Gold, Bennett,& Sekuler, 1999; but see Hayes, Morrone, & Burr, 1986 who locatedit to 20 c/face). On the other hand, Tieger and Ganz (1979) con-cluded that simple channel content was not sufficient to explaintheir recall task for face recognition and suggested the need for ahigher stage of processing. Regarding human face discrimination,it has been suggested that impaired sensitivity to low spatialfrequencies is related to poorer face discrimination in a study
2524 B.C. Hansen et al. / Vision Research 48 (2008) 2523–2536
investigating face discrimination in young and elderly samples(Owsley, Sekuler, & Boldt, 1981). This was subsequently supportedby the finding that face discrimination performance is not reducedwhen faces are significantly blurred or pixelated (White & Li, 2006;but see Goffaux, Hault, Michel, Vuong, & Rossion, 2005). Addition-ally, Goffaux and Rossion (2006) observed that holistic processingof human faces was dependent on low spatial frequencies.
It seemed somewhat implausible to us that the channel con-cepts that have been so useful in predicting the detectability of sin-gle localized patches of sinusoidal components (Graham, 1980)could, on their own, account for such complex processes as facediscrimination or face recognition. Faces are composed of multiplefeatures that are processed in a holistic way (e.g., Schiltz & Rossion,2006; Sergent, 1984; Tanaka & Farah, 1993; Young, Hellawell, &Hay, 1987). Since the spatial alignment of face features woulddepend critically on the Fourier phase spectrum (refer to Fig. 1),it is reasonable to assume that such processing would need to relyon this phase-defined content across multiple scales. This processwould likely involve the combination of output across individualspatial channels. This would lead one to think in terms of a criticalband of phase alignments rather than simply a critical octave band-width of detectable frequencies for face recognition or discrimina-tion. By phase ‘‘alignment”, we are referring to the complex Fourierphase relationships of the sinusoidal waveforms of any givenimage whereby the convergence of arrival phases has been shownto form the edges, lines, or contours of image structure (Morrone &Burr, 1988; Morone & Owens, 1987; see also Hansen & Hess 2007)refer to Fig. 2 for further details. To test this notion, we investigatedthe spatial range over which face content carried by the phasespectrum needs to be preserved for face discrimination and facerecognition at three different peak face frequencies. In addition,we compared human performance with that obtained from tem-plate-matching simulations in order to provide a benchmark forinterpreting the data.
We used two sets of face stimuli. For face discrimination, weutilized arrays of ‘‘face morphs” (Leopold, O’Toole, Vetter & Blanz,2001), each consisting of samples along a continuum of morphsbetween a standard ‘‘average” face and a given ‘‘unique” face.The stimuli therefore, were a series of face images, graded in theirstrength of identity content. The face morphing technique offers aunique approach for assessing face discrimination thresholds. Con-sider that face discrimination in its purest sense typically yieldscategorical-type results (i.e., a sharp step function as opposed toa smooth psychometric function) without offering insight into
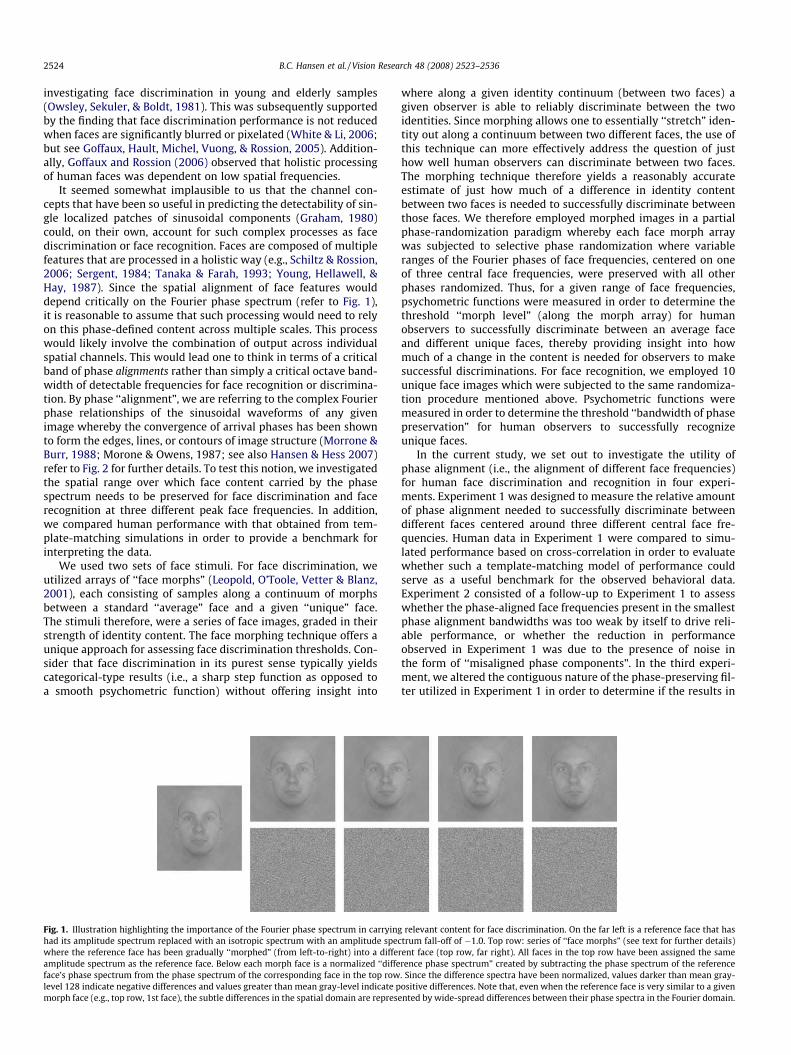
Fig. 1. Illustration highlighting the importance of the Fourier phase spectrum in carryinghad its amplitude spectrum replaced with an isotropic spectrum with an amplitude specwhere the reference face has been gradually ‘‘morphed” (from left-to-right) into a diffeamplitude spectrum as the reference face. Below each morph face is a normalized ‘‘diffeface’s phase spectrum from the phase spectrum of the corresponding face in the top rowlevel 128 indicate negative differences and values greater than mean gray-level indicate pmorph face (e.g., top row, 1st face), the subtle differences in the spatial domain are represe
where along a given identity continuum (between two faces) agiven observer is able to reliably discriminate between the twoidentities. Since morphing allows one to essentially ‘‘stretch” iden-tity out along a continuum between two different faces, the use ofthis technique can more effectively address the question of justhow well human observers can discriminate between two faces.The morphing technique therefore yields a reasonably accurateestimate of just how much of a difference in identity contentbetween two faces is needed to successfully discriminate betweenthose faces. We therefore employed morphed images in a partialphase-randomization paradigm whereby each face morph arraywas subjected to selective phase randomization where variableranges of the Fourier phases of face frequencies, centered on oneof three central face frequencies, were preserved with all otherphases randomized. Thus, for a given range of face frequencies,psychometric functions were measured in order to determine thethreshold ‘‘morph level” (along the morph array) for humanobservers to successfully discriminate between an average faceand different unique faces, thereby providing insight into howmuch of a change in the content is needed for observers to makesuccessful discriminations. For face recognition, we employed 10unique face images which were subjected to the same randomiza-tion procedure mentioned above. Psychometric functions weremeasured in order to determine the threshold ‘‘bandwidth of phasepreservation” for human observers to successfully recognizeunique faces.
In the current study, we set out to investigate the utility ofphase alignment (i.e., the alignment of different face frequencies)for human face discrimination and recognition in four experi-ments. Experiment 1 was designed to measure the relative amountof phase alignment needed to successfully discriminate betweendifferent faces centered around three different central face fre-quencies. Human data in Experiment 1 were compared to simu-lated performance based on cross-correlation in order to evaluatewhether such a template-matching model of performance couldserve as a useful benchmark for the observed behavioral data.Experiment 2 consisted of a follow-up to Experiment 1 to assesswhether the phase-aligned face frequencies present in the smallestphase alignment bandwidths was too weak by itself to drive reli-able performance, or whether the reduction in performanceobserved in Experiment 1 was due to the presence of noise inthe form of ‘‘misaligned phase components”. In the third experi-ment, we altered the contiguous nature of the phase-preserving fil-ter utilized in Experiment 1 in order to determine if the results in
relevant content for face discrimination. On the far left is a reference face that hastrum fall-off of �1.0. Top row: series of ‘‘face morphs” (see text for further details)
rent face (top row, far right). All faces in the top row have been assigned the samerence phase spectrum” created by subtracting the phase spectrum of the reference. Since the difference spectra have been normalized, values darker than mean gray-ositive differences. Note that, even when the reference face is very similar to a givennted by wide-spread differences between their phase spectra in the Fourier domain.
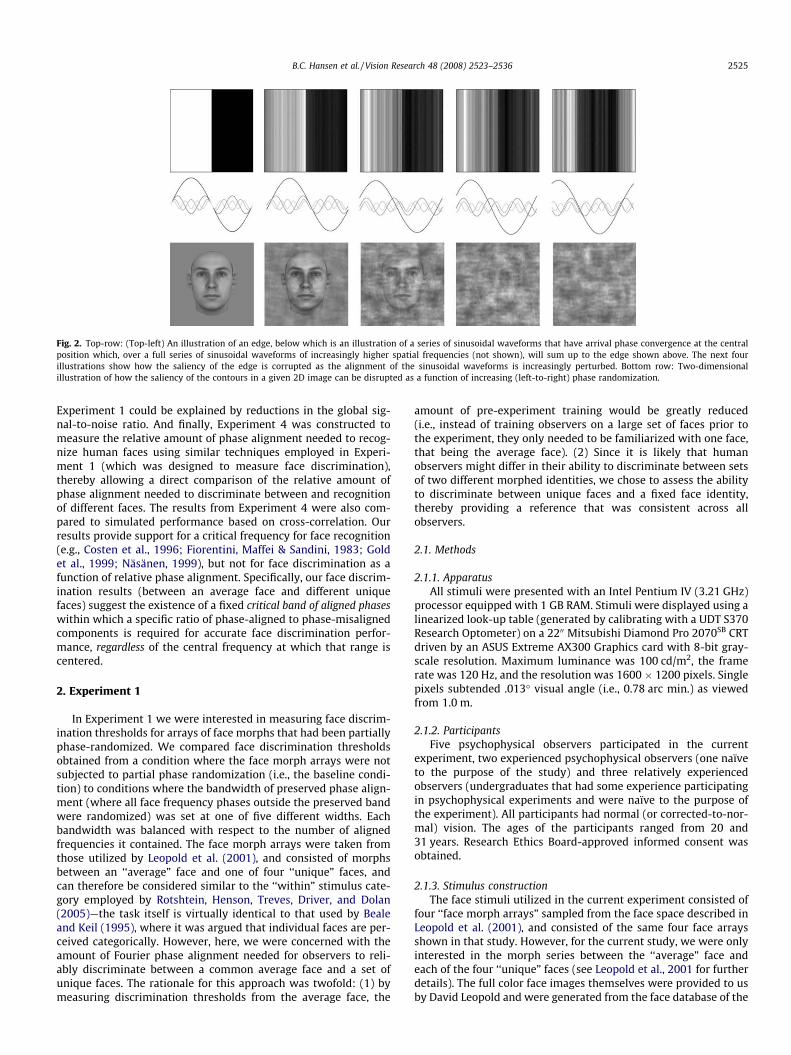
Fig. 2. Top-row: (Top-left) An illustration of an edge, below which is an illustration of a series of sinusoidal waveforms that have arrival phase convergence at the centralposition which, over a full series of sinusoidal waveforms of increasingly higher spatial frequencies (not shown), will sum up to the edge shown above. The next fourillustrations show how the saliency of the edge is corrupted as the alignment of the sinusoidal waveforms is increasingly perturbed. Bottom row: Two-dimensionalillustration of how the saliency of the contours in a given 2D image can be disrupted as a function of increasing (left-to-right) phase randomization.
B.C. Hansen et al. / Vision Research 48 (2008) 2523–2536 2525
Experiment 1 could be explained by reductions in the global sig-nal-to-noise ratio. And finally, Experiment 4 was constructed tomeasure the relative amount of phase alignment needed to recog-nize human faces using similar techniques employed in Experi-ment 1 (which was designed to measure face discrimination),thereby allowing a direct comparison of the relative amount ofphase alignment needed to discriminate between and recognitionof different faces. The results from Experiment 4 were also com-pared to simulated performance based on cross-correlation. Ourresults provide support for a critical frequency for face recognition(e.g., Costen et al., 1996; Fiorentini, Maffei & Sandini, 1983; Goldet al., 1999; Näsänen, 1999), but not for face discrimination as afunction of relative phase alignment. Specifically, our face discrim-ination results (between an average face and different uniquefaces) suggest the existence of a fixed critical band of aligned phaseswithin which a specific ratio of phase-aligned to phase-misalignedcomponents is required for accurate face discrimination perfor-mance, regardless of the central frequency at which that range iscentered.
2. Experiment 1
In Experiment 1 we were interested in measuring face discrim-ination thresholds for arrays of face morphs that had been partiallyphase-randomized. We compared face discrimination thresholdsobtained from a condition where the face morph arrays were notsubjected to partial phase randomization (i.e., the baseline condi-tion) to conditions where the bandwidth of preserved phase align-ment (where all face frequency phases outside the preserved bandwere randomized) was set at one of five different widths. Eachbandwidth was balanced with respect to the number of alignedfrequencies it contained. The face morph arrays were taken fromthose utilized by Leopold et al. (2001), and consisted of morphsbetween an ‘‘average” face and one of four ‘‘unique” faces, andcan therefore be considered similar to the ‘‘within” stimulus cate-gory employed by Rotshtein, Henson, Treves, Driver, and Dolan(2005)—the task itself is virtually identical to that used by Bealeand Keil (1995), where it was argued that individual faces are per-ceived categorically. However, here, we were concerned with theamount of Fourier phase alignment needed for observers to reli-ably discriminate between a common average face and a set ofunique faces. The rationale for this approach was twofold: (1) bymeasuring discrimination thresholds from the average face, the
amount of pre-experiment training would be greatly reduced(i.e., instead of training observers on a large set of faces prior tothe experiment, they only needed to be familiarized with one face,that being the average face). (2) Since it is likely that humanobservers might differ in their ability to discriminate between setsof two different morphed identities, we chose to assess the abilityto discriminate between unique faces and a fixed face identity,thereby providing a reference that was consistent across allobservers.
2.1. Methods
2.1.1. ApparatusAll stimuli were presented with an Intel Pentium IV (3.21 GHz)
processor equipped with 1 GB RAM. Stimuli were displayed using alinearized look-up table (generated by calibrating with a UDT S370Research Optometer) on a 2200 Mitsubishi Diamond Pro 2070SB CRTdriven by an ASUS Extreme AX300 Graphics card with 8-bit gray-scale resolution. Maximum luminance was 100 cd/m2, the framerate was 120 Hz, and the resolution was 1600 � 1200 pixels. Singlepixels subtended .013� visual angle (i.e., 0.78 arc min.) as viewedfrom 1.0 m.
2.1.2. ParticipantsFive psychophysical observers participated in the current
experiment, two experienced psychophysical observers (one naïveto the purpose of the study) and three relatively experiencedobservers (undergraduates that had some experience participatingin psychophysical experiments and were naïve to the purpose ofthe experiment). All participants had normal (or corrected-to-nor-mal) vision. The ages of the participants ranged from 20 and31 years. Research Ethics Board-approved informed consent wasobtained.
2.1.3. Stimulus constructionThe face stimuli utilized in the current experiment consisted of
four ‘‘face morph arrays” sampled from the face space described inLeopold et al. (2001), and consisted of the same four face arraysshown in that study. However, for the current study, we were onlyinterested in the morph series between the ‘‘average” face andeach of the four ‘‘unique” faces (see Leopold et al., 2001 for furtherdetails). The full color face images themselves were provided to usby David Leopold and were generated from the face database of the

Fig. 3. Example stimuli from Experiment 1. Each row corresponds to each of thecentral frequencies upon which PPFILT was centered: 3, 9, and 27 cpf, respectively.Each column corresponds to the bandwidth of PPFILT (i.e., the range of non-randomized phase angles as a function of face frequency) in octaves for each of thecentral face frequencies.
2526 B.C. Hansen et al. / Vision Research 48 (2008) 2523–2536
Max Planck Institute for Biological Cybernetics (Troje & Bülthoff,1996). The face morph vectors were generated by a face morphingalgorithm where point-by-point locations between face pairs werematched using 3D structure and reference maps (Blanz & Vetter,1999) which gradually morphed the average face into one of thefour unique faces in linear steps from 0% unique (i.e., the averageface) to 100% unique. In order to bring the four sets of face morphsinline with the current experiment, all face images were padded inorder to make the total image dimensions 400 � 400 pixels (eachface was centered, with an average ear-to-ear width of 255 pixels,SD = 9 pixels) and were converted to grayscale using the standardNTSC (National Television Standards Committee) formula (i.e.,luminosity = 0.299 * R(x) + 0.587 * G(x) + 0.114 * B(x)). Next, eachgrayscale face was normalized to the range [0,1] and locally (localwith respect to each face area) assigned the same mean luminance(normalized grayscale 0.5) and rms contrast (normalized 0.09),with all pixels falling outside of the face area assigned the samenormalized mean luminance (i.e., 0.5).
In order to test the amount of ‘‘phase alignment” needed forhuman observers to make face discrimination judgments, system-atic selective randomization of the face images’ phase spectra wascarried out in the Fourier domain. Using MATLAB (version 7.0.4)and accompanying Image Processing and Signal Processing Tool-boxes (versions 5.0.3 and 6.3, respectively), each image was, inturn, subjected to a discrete Fourier transform which yielded anamplitude spectrum, IAMP(f,h) and phase spectrum, U(f,h), where fand h represent given spatial frequency and orientation locations,respectively, in polar coordinates.
In order to assure that the stimulus images differed only withrespect to their phase spectra, an isotropic amplitude spectrumwas generated with the amplitude fall-off typical of natural scenesi.e., 1/f a, where a = 1.0 (Billock, 2000, Burton & Moorhead, 1987;Field, 1987; Hansen & Essock, 2005; Ruderman & Bialek, 1994; Tol-hurst, Tadmor, & Tang Chao, 1992; van der Schaaf & van Hateren,1996). The isotropic spectrum, ISOAMP(f,h), was generated by con-structing an empty matrix of the same dimensions as the stimulusimagery and assigning each spatial frequency coordinate (in polarcoordinates) a value from the following function:
ISOAMPðfi; hjÞ ¼1f ai
ð1Þ
Thus, for each f coordinate along the radius axes, the same valueis assigned to each orientation. Using this isotropic spectrumensured that the only difference between the images would be intheir phase spectra, as well as helping to reduce any ‘‘edge effects”that may have arisen during the initial Fourier transform.
Next, the systematic selective randomization algorithm wasimplemented by preserving the phases within a range of spatialfrequencies for all orientations. The phase spectra were filteredin polar coordinates, with an ‘‘ideal filter” which was defined asfollows:
PPFILT fi; hj� �
¼ U fi; hj� �
fL � fi � fH
randð½�p;p�Þ elsewhere
( )ð2Þ
where fL and fH are the lower and upper spatial frequency bounds ofthe phase preserving ‘‘ideal filter” (PPFILT). This filter preserves thephase angles of a given phase spectrum for the frequencies rangingfrom fL to fH (i.e., preserves the original phase angles falling withinthe pass-band of the filter) and assigns a random value ranging from�p to p to the coordinates falling outside of this range (refer toHansen & Hess, 2007 for further details). Thus, PPFILT preservesthe ‘‘aligned” relationship shown in the left-most panel of Fig. 2for frequencies falling within its pass-band and perturbs that rela-tionship (e.g., right-most panel of Fig. 2) for frequencies falling out-side its pass-band. Note that the odd symmetry of the phase
spectrum was maintained (not represented in Eq. (2)) i.e., for hangles in the [p,2p] half of polar space, PPFILT(f,h) =PPFILT(f,h�p) * (�1). For all of the experiments in the current study,PPFILT was centered on one of three different spatial frequencies,calculated with respect to cycles per face. In order to target theappropriate face frequencies in the Fourier domain, the desired facefrequency needed to be converted to cycles/picture. Specifically, thecycles/face-to-cycles/picture calculation involved multiplying thedesired cycle/face frequency by the ratio of the total image widthto the average ear-to-ear face width in pixels. For the current study,the central face frequencies of PPFILT were 3, 9, and 27 cpf. For eachof the three central face frequencies, the bandwidth of PPFILT wasfixed at five different octave widths (or ‘‘levels”, where, for levelone, 3 cpf = 2 � octaves; 9 cpf = 0.6 � octave; and 27 cpf = 0.3 �octave) for each of the central face frequencies: 3 cpf [2.0,3.0,3.5,4.0,5.0], 9 cpf [0.6,1.0,1.5,2.0,3.0], and 27 cpf [0.3,0.6,1.0,1.5,2.0], resulting in five ‘‘levels” of phase alignment for each of the cen-tral face frequencies. The rationale for having different octave band-widths for each central frequency was that since spatial frequencyis assessed with respect to ‘‘cycles per face” (a fixed measure whichdoes not change with viewing distance), an octave of face frequen-cies centered on 3 cpf will only contain face frequencies from the2- to 4-cpf range, whereas an octave centered on 9 cpf will containface frequencies from the 6- to 12-cpf range (i.e., more frequenciesin the latter case means more alignment). Once a given face image’sphase spectrum had been filtered, it was assigned a copy of the iso-tropic amplitude spectrum described above, and subjected to aninverse discrete Fourier transform (refer to Fig. 3 for examples).
It has been argued that when comparing face identification per-formance across different central frequencies, it is important tocorrect for any differences in the amount of ‘‘information” availableto observers. Such corrections have been achieved with the use ofan ideal observer model (e.g., Gold et al., 1999). Here, the band-widths for the three different central face frequencies were notidentical in order to keep the number of phase-aligned frequenciescomparable across each of the three different central face fre-quency conditions. This did not directly ensure that there wasapproximately the same amount of ‘‘information” available withineach bandwidth level, however here we were concerned with the
B.C. Hansen et al. / Vision Research 48 (2008) 2523–2536 2527
relative amount of phase-aligned frequencies needed to discrimi-nate or recognize human faces based on phase-aligned contentand reserve the issue of assessing available information for stimulisuch as those described above for another study. In this context, abench mark to which human performance could be compared wasprovided by conducting multiple template-matching simulations(described below). Template matching was chosen as it not onlyprovided a benchmark for psychophysical performance, butallowed for a direct test of whether this was the strategy employedby the human observers.
2.1.4. Psychophysical procedureThe general psychophysical task in the current experiment
employed a 2AFC method of constant stimuli paradigm. Partici-pants viewed the display monitor at a distance of 1 m; face stimulisubtended 3.1� � 4.18� visual angle. For any given trial, observerswere presented with a fixation dot (0.82� visual angle) placed atthe center of the display monitor (500 ms), followed by stimulusinterval 1 (200 ms), followed by a 1/f noise mask (500 ms), fol-lowed by the fixation dot (500 ms), followed by stimulus interval2 (200 ms), followed by another 1/f noise mask (500 ms), followedby an empty display (set to mean luminance) where the observerswere required to make a response via key-press (the duration ofthe response interval was unlimited). Stimulus interval durationwas chosen to match that used by Leopold et al. (2001). Feedbackwas not provided, and all stimuli were viewed binocularly. Thetask of the observers was to indicate which of the two stimulusintervals did not contain the average face (stimulus interval orderwas random). Note that a different random seed was used for thephase randomization employed to generate the stimuli on eachtrial to ensure that observers engaged in face-based discriminationrather than an ‘‘image-based” (i.e., ‘‘noise-based”) discrimination.
Prior to the start of the current experiment (1 day prior), allobservers were asked to familiarize themselves with the averageface (non-phase filtered) and were allowed to re-familiarize them-selves any time between experimental sessions (though noneneeded to do this). All experimental sessions were grouped byunique face. Within each session, observers were required to dis-criminate between the average face and 10 morphed faces alongthe face morph array between the average face and the unique face(one morphed face presented per trial, selected randomly). For thecurrent study, we chose face morphs ranging from 5% unique to50% unique (in 5% face morph steps), and all sessions wererepeated twice. All observers were allowed practice sessions tofamiliarize themselves with the task prior to engaging in theexperimental sessions. Threshold estimates for successful face dis-crimination were assessed using ‘‘psignifit” (Wichmann & Hill,2001a, 2001b), using the Weibull fit option, and were calculatedfor performance at each PPFILT octave width and central face fre-quency. Threshold estimates were taken for the data averagedacross the four unique faces (preliminary data suggested very sim-ilar performance for each unique face) for each observer and thenaveraged across all observers.
2.1.5. Template-matching benchmarkIn Experiment 1, for any given trial, the task was to identify
which of two sequentially presented faces (both partially phase-randomized) was not the average face. Thus, performance for sucha task could be explained by simple ‘‘template matching” (i.e., spa-tial cross-correlation). Such a template-matching strategy coulduse the broadband (i.e., all spatial frequencies and orientations pre-served) average face as a reference ‘‘template” that is cross-corre-lated with each stimulus interval in each trial. A correct responsecould be given according to which stimulus interval yielded thelowest cross-correlation. Similar approaches have been shown tobe effective for the identification of complex objects and faces
(e.g., Braje et al., 1995; Gold et al., 1999; Tjan, Braje, Legge, &Kersten, 1995). To account for this possibility, template matcherperformance was assessed by simulating the experiment describedabove, where, for each trial, either the non-filtered average face (ora band-pass amplitude-filtered version) was cross-correlated witheach stimulus interval. In order to maximize the cross-correlationsignal, only face areas were cross-correlated, not the total imagearea. The template matcher responded by selecting the lowestcross-correlation on each trial as the interval that did not containthe average face. Estimates of the template matcher’s thresholdswere made using the same procedures described in the psycho-physical procedure section of the current experiment. The experi-ment was simulated five times in order to have one templatematcher for each human subject that participated in the currentexperiment.
2.2. Results
Prior to participating in Experiment 1, all participants weremeasured for their ability to discriminate non-phase-spectrum-fil-tered morphed faces from the average face, utilizing the same psy-chophysical paradigm described above. The average facediscrimination threshold (with respect to the % of unique face con-tent needed to successfully discriminate a given morphed facefrom the average face) was 19.55% unique face, SE = 2.37%. All sub-sequent analyses will be made with respect to this discriminationthreshold obtained from the non-phase-filtered control. The resultsfrom Experiment 1 are shown in Fig. 4. Each of the inset graphs ofthat figure show the psychometric functions for each of the fivedifferent bandwidths of PPFILT centered at each of the three differ-ent central face frequencies. For each central face frequency, thereis a clear improvement in face discrimination threshold as thebandwidth of PPFILT increases. This effect stabilizes around a morphlevel of 20% unique face. This observation is made explicit in Fig. 5awhich shows a plot of the averaged morph-thresholds for each ofthe three different central face frequencies across each of the fivePPFILT bandwidths. Data were analyzed with a 3 (central face fre-quency) � 5 (PPFILT bandwidth) two-way repeated-measures Anal-ysis of Variance (ANOVA) using a reasonably conservativecorrection (i.e., Huynh–Feldt epsilon) to adjust the degrees of free-dom (Cohen, 2001). The main effect of central frequency was notsignificant (F1,4 = 0.194, p > .05) indicating that the thresholdsacross the three different central face frequencies were similar.The main effect of PPFILT bandwidth was significant (F2,6 = 11.87,p < .01), indicating thresholds depended on PPFILT bandwidth. Theinteraction was not significant (F2,6 = 0.43, p > .05) indicating asimilar pattern of threshold data across PPFILT bandwidth for thethree central face frequencies. Post-hoc paired t-tests (assumingun-equal variances) showed that the differences between thresh-olds for each of the last three filter bandwidth levels across eachof the three central frequencies were not significant (p > .05).
For performance to reach the baseline level (i.e., 20% uniqueface), the participants needed different octave bandwidths whichwere broadest for the 3 cpf condition and narrowest for the27 cpf condition, suggesting that human observers require lessphase alignment at higher face frequencies than lower face fre-quencies, with the middle frequencies being intermediate. How-ever, since we chose bandwidths that contained anapproximately equivalent number of aligned frequencies for eachbandwidth ‘‘level”, the most informative way to show the data iswith respect to the number of aligned frequencies within eachbandwidth level. It should be noted that when PPFILT was centeredat 27 cpf, the spatial frequencies at and above 27 cpf were beyondthe spatial frequency resolution limit of the visual system (e.g.,Campbell & Green, 1965). Accordingly, it was necessary to consideronly the spatial frequencies within the lower bound (i.e., at and

Fig. 4. Averaged data from Experiment 1. Each graph shows data, along with theirfitted psychometric functions, for each of the three different central face frequen-cies at which PPFILT was centered: (a) 3, (b) 9, and (c) 27 cpf. On the ordinate of eachgraph is averaged proportion correct (averaged across all observers and four facemorph arrays), and on the abscissa of each graph is the % of the unique face for thefour different face morph arrays. The light-red data plotted in all three graphs arefrom the non-phase randomized face stimuli condition, shown for comparison.
Fig. 5. Data re-plotted from Experiment 1. (a) On the ordinate is averaged facediscrimination threshold, and on the abscissa are the five different PPFILT
bandwidths for each central face frequency. Error bars are ±1SEM (calculatedbetween observers). Refer to the text for further details. (b) On the ordinate isnumber of phase-aligned face frequencies within the pass-band of each of PPFILT. Onthe abscissa are the averaged face discrimination thresholds for each of the centralface frequencies of PPFILT as a function of bandwidth (as plotted in Fig. 5a). Note thatsome of the threshold estimates are outside of the range of the morphed stimuli andshould not be considered to be accurate, rather they reflect the general difficultyparticipants had making discriminations on those trials.
2528 B.C. Hansen et al. / Vision Research 48 (2008) 2523–2536
below 27 cpf) of PPFILT when it was centered on 27 cpf, that is, onlythe alignments below the central frequency were summed. Afteraccounting for that caveat, the number of aligned frequencieswithin each bandwidth of PPFILT were plotted as a function of facediscrimination threshold. Fig. 5b clearly shows that for observersto reach a face discrimination threshold comparable to thatobtained with the non-phase-spectrum-filtered stimuli (i.e.,�20% unique face), the same number of aligned frequencies(�16–18 phase-aligned frequencies) is needed regardless of the
central frequency of PPFILT. The data argue that the amount ofphase alignment needed to successfully discriminate between thecontent of different faces (i.e., when compared to non-phase-ran-domized control face discrimination thresholds) is approximatelyconstant (i.e., independent of face frequency). While outside thefocus of our analysis, it is worth noting that there does appear tobe a performance bias in favor of the lowest central face frequency(3 cpf) condition for the narrowest PPFILT bandwidth. That is, theaveraged thresholds do appear to be somewhat lower than theother two central face frequencies which is somewhat consistentwith previous face discrimination literature (Goffaux & Rossion,2006; Owsley et al., 1981; White & Li, 2006).
The averaged threshold data from the template matchers areplotted in Fig. 6 along with the threshold data of the human sub-jects (re-plotted from Fig. 5a) for comparison. As shown inFig. 6a, the template matchers show the same trend in discrimina-tion threshold as the human observers, with thresholds becomingincreasingly smaller as PPFILT increased in bandwidth. However, in

Fig. 6. Data re-plotted from Experiment 1. (a) Averaged ideal observer performance, figure axes are identical to those in Fig. 5a. (b) Human observer data from Experiment 1re-plotted along with the ideal observer data for the 3 cpf central face frequency condition. (c) Human observer data from Experiment 1 re-plotted along with the idealobserver data for the 9-cpf central face frequency condition. (d) Human observer data from Experiment 1 re-plotted along with the ideal observer data for the 27 cpf centralface frequency condition. Refer to text for further details.
B.C. Hansen et al. / Vision Research 48 (2008) 2523–2536 2529
all three central frequency conditions (i.e., Fig. 6b–d), the humanobservers out-performed the template matchers up to the broadestPPFILT bandwidth, indicating that such a strategy is not employed inhuman face discrimination based on phase alignment. Thus, in therange where the human observers’ thresholds began to approachthose obtained in the control condition, they were able to makeface discriminations more effectively than simple template match-ing would predict when the template made use of all available facefrequencies. In order to determine whether the thresholds for thehuman observers and the template matchers differed, a 2 (humanvs ideal) � 3 (central face frequency) � 5 (PPFILT bandwidth) three-way ANOVA was conducted. There was a significant main effectbetween human and template matcher thresholds (F1,7 = 8.3,p < .05), indicating that the two groups’ thresholds were notidentical.
We also conducted a template matcher simulation where the‘‘face template” consisted of a band-pass amplitude-filtered ver-sion of the average face, with the peak frequency of the band-passfilter centered on one of the three nominal face frequenciesemployed in the current experiment (the method for band-passamplitude filtering used here is described in the method sectionof Experiment 2—in short, no phase randomization was appliedto the template), data not shown. The simulation was identical tothat described above, except with different band-pass filtered tem-
plates. When the spatial frequency bandwidth of the template wasset to 1 octave, the template matcher performed the task perfectlyfor all three central face frequency conditions. It was not until thebandwidth was increased beyond 2–3 octaves that the templatematcher began making errors in all three central face frequencyconditions, suggesting that if humans do indeed employ a tem-plate-matching strategy for discriminating faces based on phasealignment, the template would likely consist of a broad range offace frequencies (but not all face frequencies—see Fig. 6) as it isat those bandwidths where the template matcher began to per-form similarly to the observed human performance in the currentexperiment.
3. Experiment 2
The results of Experiment 1 argue against a critical bandwidthfor face discrimination with respect to different central face fre-quencies. A major factor that influenced a reduction in perfor-mance would have been the number of the phase-alignedfrequencies, rather than the central face frequency of PPFILT. Here,as a follow-up to Experiment 1, we sought to evaluate whetherthe phase-aligned frequencies present in the smallest bandwidthwas too weak by itself to drive reliable performance, or whether
2530 B.C. Hansen et al. / Vision Research 48 (2008) 2523–2536
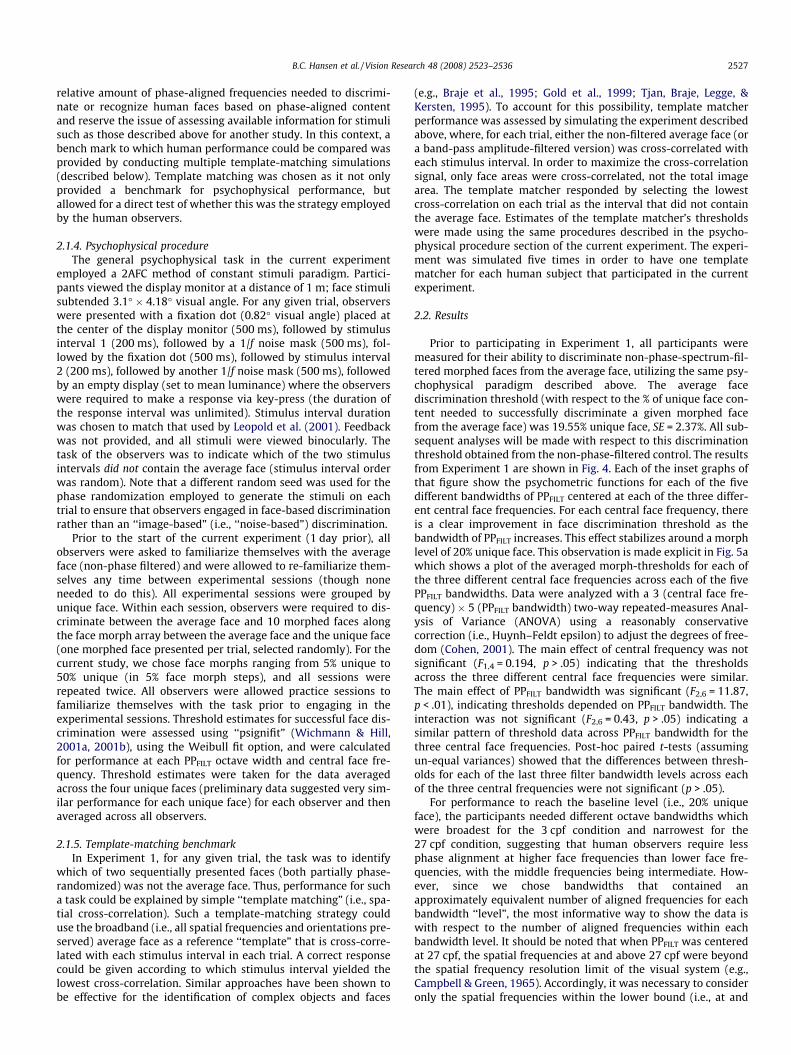
the reduction in performance observed in Experiment 1 was due tothe presence of noise in the form of ‘‘misaligned phase compo-nents”. In order to differentiate between those two possibilities,we repeated Experiment 1 using band-pass filtered face stimuli.Accordingly the amplitude spectra of the face morph arrays were fil-tered with a log-Gaussian filter fixed at three different bandwidths,centered at two different central face frequencies (note that thestimuli in the current experiment were not filtered with PPFILT).
Fig. 7. Examples of some of the stimuli used in Experiment 2. Each row correspondsto the two different central face frequencies of LGAUS, and each column is thebandwidth in octaves (half-width at half-height) of LGAUS.
3.1. Methods
3.1.1. ApparatusSame as in Experiment 1.
3.1.2. ParticipantsTwo experienced psychophysical observers participated in the
current experiment. Both participants had normal (or corrected-to-normal) vision. The ages of the participants were 29 and31 years. Research Ethics Board-approved informed consent wasobtained.
3.1.3. Stimulus constructionStimuli for the current experiment were constructed from the
same face image set used in Experiment 1. However, here weband-pass filtered the amplitude spectra of those images using asmooth spatial frequency filter in the Fourier domain. Ideally,one would use a Gaussian filter (Gaussian along the frequency axesin polar coordinates) with a given bandwidth centered at a givenspatial frequency. Unfortunately, the Gaussian function tends tooverlap (i.e., is cropped) at the DC component of the amplitudespectrum when centered on lower spatial frequencies. A reason-able solution to this issue is to use a log-Gaussian function, whichwill always approach zero near the DC component. In the Fourierdomain, the log-Gaussian filter can be expressed as:
LGAUSðf ; hÞ ¼ e�log R fi; hj
� �=Fpeak
� �2
2 log r1=Fpeak� �2
" #ð3Þ
where fi and hj represent any given position in polar coordinates, Rrepresents a given radius vector (i.e., the spatial frequency dimen-sion) taken from IAMP(f,h), Fpeak is the central spatial frequency ofthe log-Gaussian function, r1 is the spatial frequency bandwidthof the log-Gaussian function.
Using the same discrete Fourier functions mentioned in Section2.1, each face image was, in turn, Fourier transformed and its ampli-tude spectrum filtered with LGAUS centered at either 6 or 18 cpf. Itwas not practical to center LGAUS on extreme lower and upper facefrequencies (i.e., 3 and 27 cpf) due to sampling limitations in theFourier domain at those frequencies. Since the aim of the currentexperiment was simply to evaluate whether phase-aligned contentpresent in the smallest bandwidth was too weak by itself to drivereliable performance, specific central frequency was not important.For each central face frequency tested here, three different band-widths of LGAUS were implemented. When LGAUS was centered on6 cpf, the bandwidths included 0.38, 0.53, and 0.80 octaves (full-width at half-height), and when it was centered on 18 cpf, the band-widths included 0.27, 0.42, and 0.81 octaves (full-width at half-height). Unfortunately, due to LGAUS becoming extremely peaked(and hence less smooth, i.e., resembling a delta function) for verynarrow bandwidths, we were limited as to how narrow we couldmake LGAUS. Once each amplitude spectrum had been filtered, itwas inverse discrete Fourier transformed with its respective phasespectrum back to the spatial domain. In the spatial domain, eachimage was assigned the same mean luminance and rms. contrastused in Experiment 1. Thus, for each central face frequency, there
were three sets of face stimuli (see Fig. 7 for examples), resultingin six different experimental sessions. The stimuli generated herediffered from Experiment 1 in that they did not contain any of thenoise created by randomizing phases outside of pass-band of the fil-ter—they did possess similar relative phase alignments, but filteredout the contrast energy for alignments outside the filter bandwidth.The experimental paradigm itself was identical to that used inExperiment 1 (that is, for each given trial, observers were requiredto discriminate between the average face and one of the unique facemorphs, where both the average and unique morph were identicallyfiltered).
3.2. Results
The results for both observers are shown in Fig. 8. Both observ-ers were able to discriminate between morphed faces and the aver-age face with discrimination thresholds near those obtained withthe non-filtered face image set with very limited LGAUS bandwidthsindicating that, for a fixed suprathreshold rms contrast of 0.09,human observers can discriminate between faces possessing extre-mely narrow ranges of amplitude coefficients which is quite differ-ent from what was reported in Experiment 1. The results from bothparticipants were not in total agreement however. There was areduction in performance by BH at .38 octave (6 cpf) and both BHand RF at .27 octave (18 cpf) as compared to the other two octavewidths for both conditions. However,as shown in Fig. 7, faces fil-tered at the narrowest filter widths hardly resemble faces, and thusperformance may have been dictated by a mechanism other thanface discrimination such as pattern discrimination. Alternativelythe reduction in performance may be due to putative ‘‘expert” facesystems being unable to effectively process these specific stimuli.The broadest bandwidths used in the current experiment are likelyto have engaged the normal face discrimination mechanisms, eventhough the bandwidths used were mostly narrower than any of thebandwidths used in Experiment 1. The current results suggest thatthe critical factor impairing performance in Experiment 1 was notsimply the reduction in the number of phase-aligned frequencies,but also the presence of noise in the form of misaligned phase com-ponents. Thus it appears that one factor limiting performance inExperiment 1 was the presence of misaligned face frequencies ina given targeted channel.
4. Experiment 3
The performance reductions found in Experiments 1 and 2 maybe due to (1) a global signal-to-noise reduction that occurs when
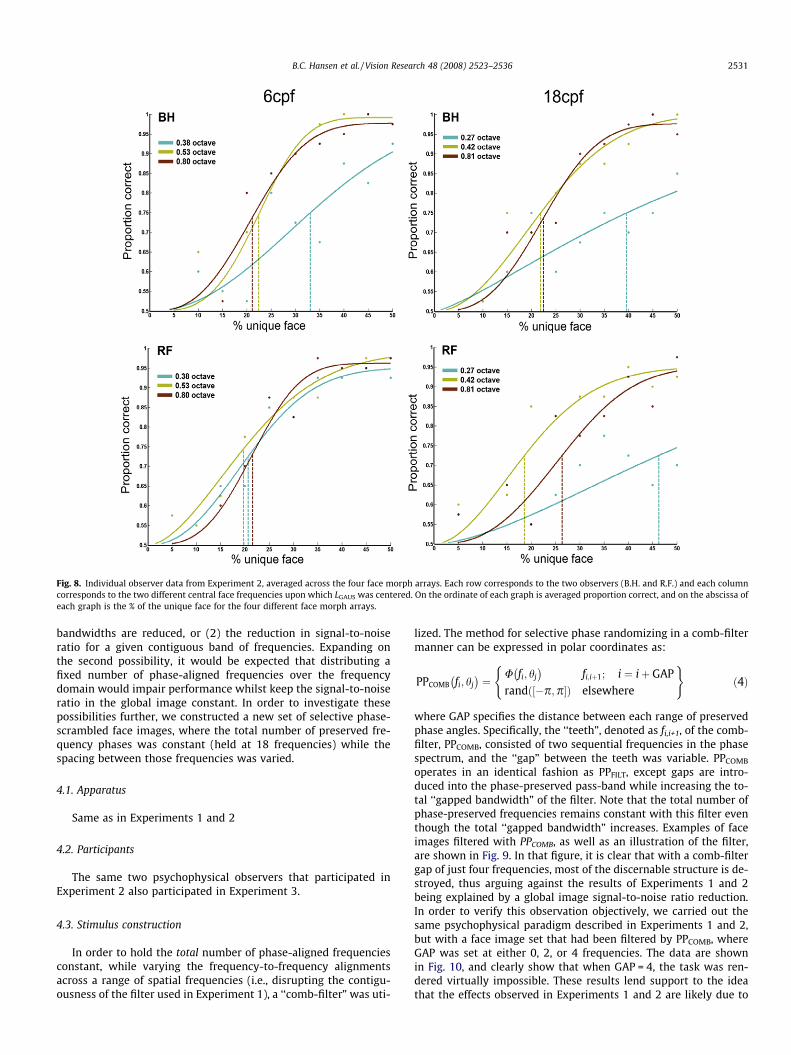
Fig. 8. Individual observer data from Experiment 2, averaged across the four face morph arrays. Each row corresponds to the two observers (B.H. and R.F.) and each columncorresponds to the two different central face frequencies upon which LGAUS was centered. On the ordinate of each graph is averaged proportion correct, and on the abscissa ofeach graph is the % of the unique face for the four different face morph arrays.
B.C. Hansen et al. / Vision Research 48 (2008) 2523–2536 2531
bandwidths are reduced, or (2) the reduction in signal-to-noiseratio for a given contiguous band of frequencies. Expanding onthe second possibility, it would be expected that distributing afixed number of phase-aligned frequencies over the frequencydomain would impair performance whilst keep the signal-to-noiseratio in the global image constant. In order to investigate thesepossibilities further, we constructed a new set of selective phase-scrambled face images, where the total number of preserved fre-quency phases was constant (held at 18 frequencies) while thespacing between those frequencies was varied.
4.1. Apparatus
Same as in Experiments 1 and 2
4.2. Participants
The same two psychophysical observers that participated inExperiment 2 also participated in Experiment 3.
4.3. Stimulus construction
In order to hold the total number of phase-aligned frequenciesconstant, while varying the frequency-to-frequency alignmentsacross a range of spatial frequencies (i.e., disrupting the contigu-ousness of the filter used in Experiment 1), a ‘‘comb-filter” was uti-
lized. The method for selective phase randomizing in a comb-filtermanner can be expressed in polar coordinates as:
PPCOMB fi; hj� �
¼ U fi; hj� �
fi;iþ1; i ¼ iþ GAPrandð½�p;p�Þ elsewhere
( )ð4Þ
where GAP specifies the distance between each range of preservedphase angles. Specifically, the ‘‘teeth”, denoted as fi,i+1, of the comb-filter, PPCOMB, consisted of two sequential frequencies in the phasespectrum, and the ‘‘gap” between the teeth was variable. PPCOMB
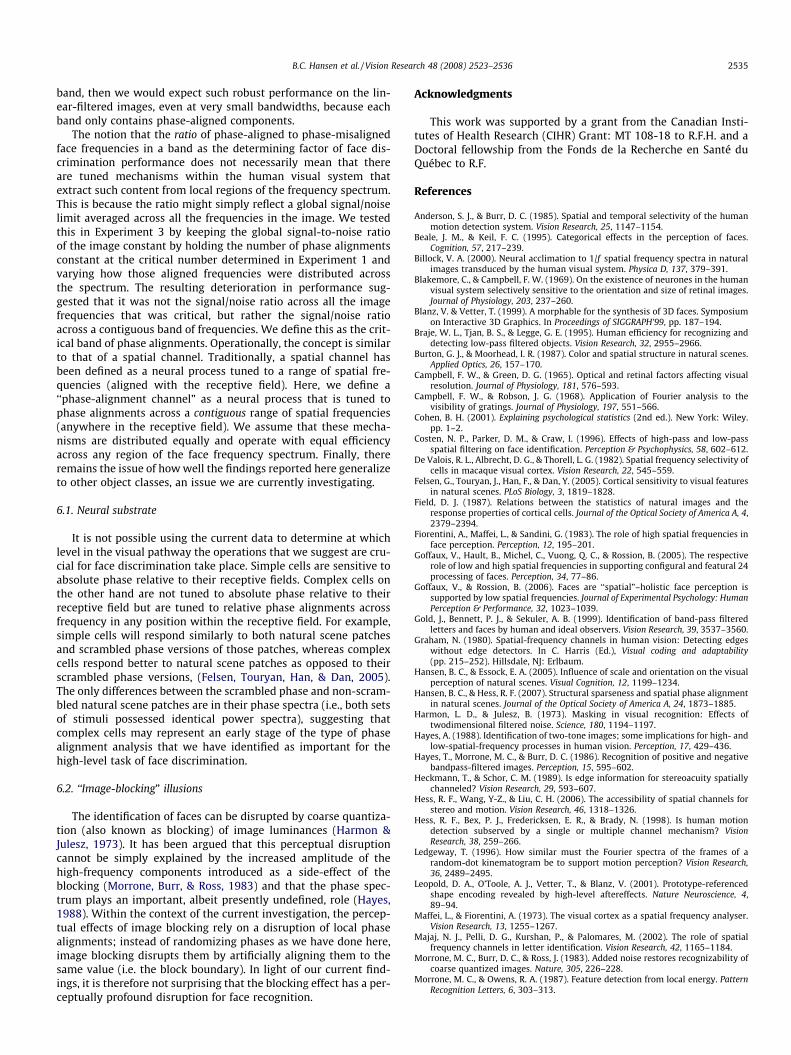
operates in an identical fashion as PPFILT, except gaps are intro-duced into the phase-preserved pass-band while increasing the to-tal ‘‘gapped bandwidth” of the filter. Note that the total number ofphase-preserved frequencies remains constant with this filter eventhough the total ‘‘gapped bandwidth” increases. Examples of faceimages filtered with PPCOMB, as well as an illustration of the filter,are shown in Fig. 9. In that figure, it is clear that with a comb-filtergap of just four frequencies, most of the discernable structure is de-stroyed, thus arguing against the results of Experiments 1 and 2being explained by a global image signal-to-noise ratio reduction.In order to verify this observation objectively, we carried out thesame psychophysical paradigm described in Experiments 1 and 2,but with a face image set that had been filtered by PPCOMB, whereGAP was set at either 0, 2, or 4 frequencies. The data are shownin Fig. 10, and clearly show that when GAP = 4, the task was ren-dered virtually impossible. These results lend support to the ideathat the effects observed in Experiments 1 and 2 are likely due to
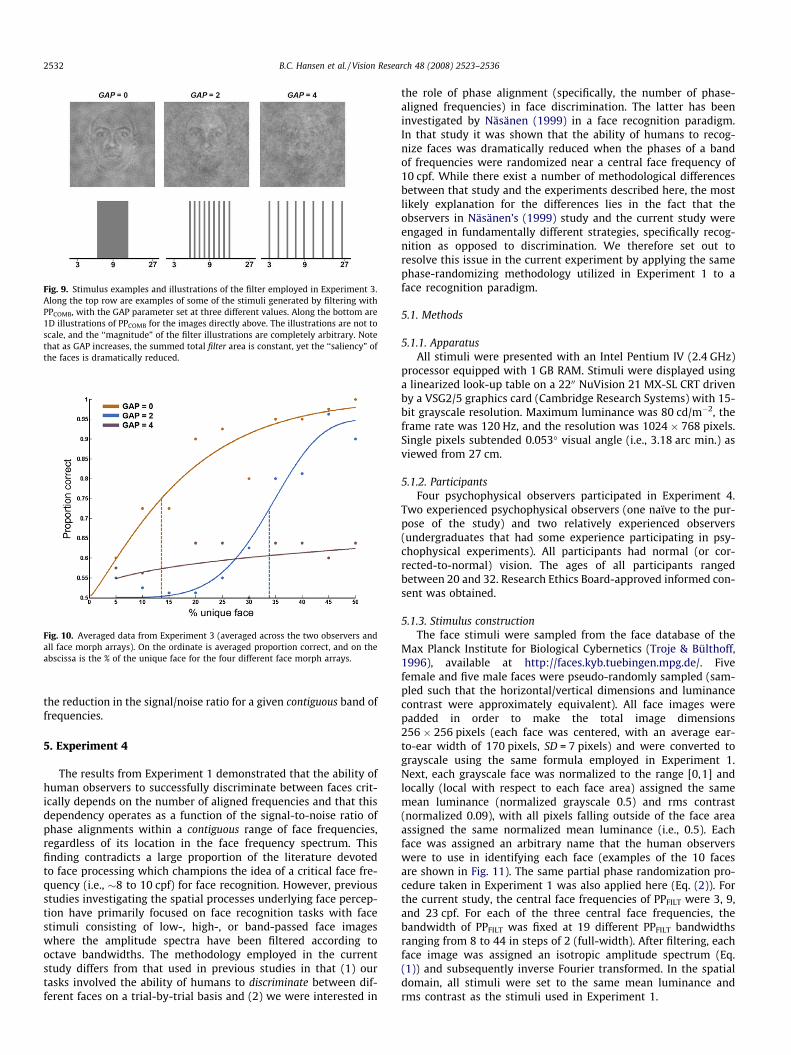
Fig. 9. Stimulus examples and illustrations of the filter employed in Experiment 3.Along the top row are examples of some of the stimuli generated by filtering withPPCOMB, with the GAP parameter set at three different values. Along the bottom are1D illustrations of PPCOMB for the images directly above. The illustrations are not toscale, and the ‘‘magnitude” of the filter illustrations are completely arbitrary. Notethat as GAP increases, the summed total filter area is constant, yet the ‘‘saliency” ofthe faces is dramatically reduced.
Fig. 10. Averaged data from Experiment 3 (averaged across the two observers andall face morph arrays). On the ordinate is averaged proportion correct, and on theabscissa is the % of the unique face for the four different face morph arrays.
2532 B.C. Hansen et al. / Vision Research 48 (2008) 2523–2536
the reduction in the signal/noise ratio for a given contiguous band offrequencies.
5. Experiment 4
The results from Experiment 1 demonstrated that the ability ofhuman observers to successfully discriminate between faces crit-ically depends on the number of aligned frequencies and that thisdependency operates as a function of the signal-to-noise ratio ofphase alignments within a contiguous range of face frequencies,regardless of its location in the face frequency spectrum. Thisfinding contradicts a large proportion of the literature devotedto face processing which champions the idea of a critical face fre-quency (i.e., �8 to 10 cpf) for face recognition. However, previousstudies investigating the spatial processes underlying face percep-tion have primarily focused on face recognition tasks with facestimuli consisting of low-, high-, or band-passed face imageswhere the amplitude spectra have been filtered according tooctave bandwidths. The methodology employed in the currentstudy differs from that used in previous studies in that (1) ourtasks involved the ability of humans to discriminate between dif-ferent faces on a trial-by-trial basis and (2) we were interested in
the role of phase alignment (specifically, the number of phase-aligned frequencies) in face discrimination. The latter has beeninvestigated by Näsänen (1999) in a face recognition paradigm.In that study it was shown that the ability of humans to recog-nize faces was dramatically reduced when the phases of a bandof frequencies were randomized near a central face frequency of10 cpf. While there exist a number of methodological differencesbetween that study and the experiments described here, the mostlikely explanation for the differences lies in the fact that theobservers in Näsänen’s (1999) study and the current study wereengaged in fundamentally different strategies, specifically recog-nition as opposed to discrimination. We therefore set out toresolve this issue in the current experiment by applying the samephase-randomizing methodology utilized in Experiment 1 to aface recognition paradigm.
5.1. Methods
5.1.1. ApparatusAll stimuli were presented with an Intel Pentium IV (2.4 GHz)
processor equipped with 1 GB RAM. Stimuli were displayed usinga linearized look-up table on a 2200 NuVision 21 MX-SL CRT drivenby a VSG2/5 graphics card (Cambridge Research Systems) with 15-bit grayscale resolution. Maximum luminance was 80 cd/m�2, theframe rate was 120 Hz, and the resolution was 1024 � 768 pixels.Single pixels subtended 0.053� visual angle (i.e., 3.18 arc min.) asviewed from 27 cm.
5.1.2. ParticipantsFour psychophysical observers participated in Experiment 4.
Two experienced psychophysical observers (one naïve to the pur-pose of the study) and two relatively experienced observers(undergraduates that had some experience participating in psy-chophysical experiments). All participants had normal (or cor-rected-to-normal) vision. The ages of all participants rangedbetween 20 and 32. Research Ethics Board-approved informed con-sent was obtained.
5.1.3. Stimulus constructionThe face stimuli were sampled from the face database of the
Max Planck Institute for Biological Cybernetics (Troje & Bülthoff,1996), available at http://faces.kyb.tuebingen.mpg.de/. Fivefemale and five male faces were pseudo-randomly sampled (sam-pled such that the horizontal/vertical dimensions and luminancecontrast were approximately equivalent). All face images werepadded in order to make the total image dimensions256 � 256 pixels (each face was centered, with an average ear-to-ear width of 170 pixels, SD = 7 pixels) and were converted tograyscale using the same formula employed in Experiment 1.Next, each grayscale face was normalized to the range [0,1] andlocally (local with respect to each face area) assigned the samemean luminance (normalized grayscale 0.5) and rms contrast(normalized 0.09), with all pixels falling outside of the face areaassigned the same normalized mean luminance (i.e., 0.5). Eachface was assigned an arbitrary name that the human observerswere to use in identifying each face (examples of the 10 facesare shown in Fig. 11). The same partial phase randomization pro-cedure taken in Experiment 1 was also applied here (Eq. (2)). Forthe current study, the central face frequencies of PPFILT were 3, 9,and 23 cpf. For each of the three central face frequencies, thebandwidth of PPFILT was fixed at 19 different PPFILT bandwidthsranging from 8 to 44 in steps of 2 (full-width). After filtering, eachface image was assigned an isotropic amplitude spectrum (Eq.(1)) and subsequently inverse Fourier transformed. In the spatialdomain, all stimuli were set to the same mean luminance andrms contrast as the stimuli used in Experiment 1.

Fig. 11. Examples of the 10 unique faces (5 female; 5 male) selected for Experiment 4 along with the name assigned to each face.
B.C. Hansen et al. / Vision Research 48 (2008) 2523–2536 2533
5.1.4. Psychophysical procedure5.1.4.1. Face training sessions. Before running the current experi-ment, participants were trained to recognize each of the 10 faces.This procedure involved two phases: (1) a study phase and (2) atest phase. Each study phase was immediately followed by a testphase. In the study phase, participants were randomly presentedwith one of the 10 faces with the associated name displayed belowit. Each face and name was displayed until the participant felt thatit had been properly ‘‘studied”, at which time the participant indi-cated (via mouse click) readiness for the next face. This processwas repeated five times for each of the 10 faces (i.e., 50 study tri-als). For the test phase, one of the 10 faces was randomly presentedwithout the name label for 1000 ms, followed by a list of the 10names which were displayed until the participant selected (viamouse click) the name thought to be associated with the presentedface. This process was repeated five times for each of the 10 faces(i.e., 50 test trials). Stimulus duration was chosen according to thatused by Näsänen (1999). Following completion of each study andtest phase, participants were presented with the % correct for thatsession along with the number of errors (if any) for each individualface. For participants to successfully ‘‘pass” the test phase, they hadto receive a score of 98% (which allowed for just one ‘‘click error”).The study and test phases were repeated until each participantreceived a recognition score of 98% or higher a minimum of threesuccessive times. The study and test phases were spread out acrossmultiple days.
5.1.5. Experiment sessionsBefore the start of each experimental session, observers were
run through a shortened study and test phase (one repetition ofthe study phase, followed by three repetitions of the test phase)in order to ensure that the observers could recognize the faces atthe same level of accuracy as obtained in the initial face trainingsessions. If a participant had ‘‘failed” the pre-experiment studyan test session, the experiment would have aborted and that par-ticipant would have been trained further on the face set (whichnever occurred for our participants).
If a given observer ‘‘passed” the pre-experiment (shortened)study and test session, the actual experimental session began.The general psychophysical task employed a 10AFC method of con-stant stimuli paradigm. Participants viewed the display at a dis-tance of 27 cm in order to equate the visual angle of the faces tothat of Experiments 1–3. For any given trial, observers were pre-sented with a single stimulus interval (1000 ms) containing one
of the PPFILT-filtered faces (selected randomly), followed by a whitenoise mask (500 ms), followed by a response interval where the listof names from which the observers were to indicate (via mouseclick) the name of the face preceding the white noise mask (theduration of the response interval was unlimited) was presented.Feedback was not provided, and all stimuli were viewed binocu-larly. All experimental sessions were grouped by central frequencyof PPFILT. All observers were allowed practice sessions to familiarizethemselves with the task prior to engaging in the experimentalsessions. Each session was repeated 4–6 times, with 150 trialsper session (1800–2700 total trials). Threshold estimates for suc-cessful face recognition were assessed using ‘‘psignifit” (Wich-mann & Hill, 2001a, 2001b), and were calculated for performanceacross PPFILT bandwidth, for central face frequency. Threshold esti-mates were taken for the data averaged across the 10 faces for eachobserver.
5.1.6. Template-matching benchmarkFor any given trial, the task of the psychophysical observers was
to recognize a given PPFILT-filtered face from a set of 10 possiblenon-PPFILT-filtered faces. As in Experiment 1, performance couldpotentially be explained by a template-matching strategy. A cor-rect response would be given according to which ‘‘internal” tem-plate face yielded the highest cross-correlation. Thus, templatematcher performance was assessed by simulating the experimentdescribed above, where, for each trial, each non-filtered templateface was cross-correlated with each stimulus interval. The tem-plate matcher responded by selecting the highest cross-correlationbetween the ‘‘internal” templates and the particular PPFILT-filteredface. Estimates of the template matcher’s thresholds were madeusing the same procedures described in the psychophysical proce-dure section of the current experiment. The experiment was simu-lated four times in order to have one template matcher for eachhuman observer that participated in the current experiment.
5.2. Results
The results from Experiment 4 are shown in Fig. 12. Since thefour observers varied in their PPFILT bandwidth thresholds, eachobserver’s data are plotted individually. While the four observer’sthresholds differed, there was a bias in favor of 9 cpf, with nar-rower PPFILT bandwidths obtained when PPFILT was centered on9 cpf (with the exception of observer S.A. who showed this bias,but also had a low threshold for 3 cpf). On average, observers

Fig. 12. Data from Experiment 4. On the ordinate is averaged number of alignedfrequency threshold (i.e., PPFILT bandwidth). On the abscissa is averaged data fromeach of the four subjects along with the averaged thresholds across all four subjectsas well as the averaged ideal observer data. Each bar for each subject corresponds toa given central face frequency condition. Error bars are +1SEM, averaged acrosssessions for each observer. Refer to text for further details.
2534 B.C. Hansen et al. / Vision Research 48 (2008) 2523–2536
required a fewer number of phase alignments when PPFILT was cen-tered on 9 cpf when compared to 3 or 23 cpf. This observation wasverified with a paired samples t-test assuming un-equal variancesbetween the 9-cpf thresholds and the averaged thresholds for 3and 23 cpf, t(3) = 4.77, p < .05. This finding lends further supportto the concept of a critical frequency for face recognition and pro-vides a reasonable explanation for the differences observed inExperiment 1 of the current study and the phase randomizationconditions in Näsänen’s (1999) face recognition paradigm. It is alsoworth noting that the overall phase alignment thresholds werehigher for face recognition (i.e., the current experiment), with anaverage of 30 phase-aligned frequencies, when compared to facediscrimination (i.e., Experiment 1), with an average of 17 phase-aligned frequencies. Regarding the template matcher thresholds,Fig. 12 shows that equivalent PPFILT bandwidth thresholds wereproduced when PPFILT was centered on 3 or 9 cpf, with higher PPFILT
thresholds when PPFILT was centered on 23 cpf. Here, the humanobservers performed the task less effectively than the templatematcher as well as yielding a bias in favor a central face frequencyof 9 cpf, a trend that was not observed with the template matcher,suggesting that when relying on phase alignment for face recogni-tion, the template-matching strategy is likely not employed byhuman observers.
6. General discussion and conclusions
In Experiment 1 we observed a reduction in performance as afunction of number of aligned frequencies, and not as a functionof central frequency or octave bandwidth when compared withnon-phase-randomized control data. In addition, the psychophysi-cal discrimination thresholds showed that human performancedemonstrated a more effective utilization of aligned frequenciesthan simple template matching would predict. Data from the sec-ond experiment suggested that the reduction in performance waslikely due to the presence of non-aligned phases that interferedwith the available phase-aligned components. In the third experi-ment, we demonstrated that the interference observed is likely tobe band-limited as while the signal-to-noise ratio remained con-stant for the image, the task was rendered virtually impossiblewith increased spacing between the phase-aligned components.Taken together, the results from Experiments 1–3 stress the impor-tance of contiguous critical bands for phase-aligned structure for
discrimination between an average and unique faces, and likelyobserved regardless of where they are located within the face fre-quency spectrum. On the other hand, the final experiment,designed to test whether the trend in PPFILT thresholds for face dis-crimination would be obtained in a face recognition paradigm,showed that (1) on average, more phase alignment was requiredto successfully recognize faces and (2) the central frequency atwhich PPFILT was centered was critical. Specifically, human observ-ers required less phase alignment when PPFILT was centered at9 cpf when compared to 3 or 23 cpf, providing further supportfor a critical frequency for face recognition. Additionally, humanobservers were found to be much less effective at making use offrequency alignment for face recognition, contrary to what wasshown in Experiment 1 where face discrimination was investi-gated. Template-matching simulations were used to provide a rea-sonable benchmark for comparison to the behavioral data. Theresults for Experiments 1 and 4 argue that humans did not seemto employ such a strategy in our task. An alternative benchmarkmight have been to measure the identity strength of a face as afunction of its distance from a mean face in a multidimensionalface space (Leopold et al., 2001; Valentine, 1991) where the faceat the origin of this space would approximate an average face(i.e., the prototypical face) and unique faces would be located alongtrajectories extending out from the prototype, with ‘‘uniqueness”increasing with distance from the prototype. The observers inour study had to discriminate identity from the prototype, thus amodel which made use of the face space structure to make assess-ments might provide a more accurate benchmark for futurestudies.
The results from Experiments 1 and 4 clearly demonstrate sub-stantial differences between the processes sub-serving face dis-crimination and those involved in face recognition. Specifically,face discrimination seems to require a fixed band of contiguousaligned phases, regardless of the central face frequency at whichPPFILT was centered, whereas face recognition, on average, requiredmore phase alignment, with a narrower PPFILT bandwidth centeredat 9 cpf compared to 3 and 23 cpf.
The performance difference observed between face recognitionand discrimination may speak to the nature of the stored represen-tation of face. Given that the 9 cpf resulted in lower PPFILT band-width thresholds (compared to 3 and 23 cpf in the samecondition) suggests that a closer match is needed between thestored representation of the learned faces and their partiallyphase-randomized counterparts in order to name specific identi-ties. In contrast, the absence of such a difference in the discrimina-tion task suggests that the system may have been able to functionwithout the bottleneck brought about by limits of multiple storedrepresentations (i.e., no specific identity needed to be named on atrial-by-trial basis). In other words, face recognition may not belimited by perception, but perhaps by comparison to stored repre-sentations. Whether it is the stored representations themselvesthat are biased toward 9 cpf or the comparative process where thisbias arises will be the subject of a future study.
The performance reduction observed in Experiment 1 was afunction of the contiguous number of phase-aligned frequencies.We found no difference in performance between the three centralfrequencies we evaluated. Considered within our proposed frame-work, 16–18 contiguous frequencies define the minimum band ofphase-aligned frequencies needed to adequately perform the facediscrimination task. Yet, in Experiment 2 we found reliable perfor-mance with much smaller frequency bandwidths, once the phase-misaligned content outside the preserved band was removed. If thecritical factor for performance in this task is the absolute numberof phase-aligned frequencies, then it seems that our estimate fromExperiment 1 is exaggerated. But if the critical factor is rather theratio of phase-aligned to phase-misaligned content falling within a
B.C. Hansen et al. / Vision Research 48 (2008) 2523–2536 2535
band, then we would expect such robust performance on the lin-ear-filtered images, even at very small bandwidths, because eachband only contains phase-aligned components.
The notion that the ratio of phase-aligned to phase-misalignedface frequencies in a band as the determining factor of face dis-crimination performance does not necessarily mean that thereare tuned mechanisms within the human visual system thatextract such content from local regions of the frequency spectrum.This is because the ratio might simply reflect a global signal/noiselimit averaged across all the frequencies in the image. We testedthis in Experiment 3 by keeping the global signal-to-noise ratioof the image constant by holding the number of phase alignmentsconstant at the critical number determined in Experiment 1 andvarying how those aligned frequencies were distributed acrossthe spectrum. The resulting deterioration in performance sug-gested that it was not the signal/noise ratio across all the imagefrequencies that was critical, but rather the signal/noise ratioacross a contiguous band of frequencies. We define this as the crit-ical band of phase alignments. Operationally, the concept is similarto that of a spatial channel. Traditionally, a spatial channel hasbeen defined as a neural process tuned to a range of spatial fre-quencies (aligned with the receptive field). Here, we define a‘‘phase-alignment channel” as a neural process that is tuned tophase alignments across a contiguous range of spatial frequencies(anywhere in the receptive field). We assume that these mecha-nisms are distributed equally and operate with equal efficiencyacross any region of the face frequency spectrum. Finally, thereremains the issue of how well the findings reported here generalizeto other object classes, an issue we are currently investigating.
6.1. Neural substrate
It is not possible using the current data to determine at whichlevel in the visual pathway the operations that we suggest are cru-cial for face discrimination take place. Simple cells are sensitive toabsolute phase relative to their receptive fields. Complex cells onthe other hand are not tuned to absolute phase relative to theirreceptive field but are tuned to relative phase alignments acrossfrequency in any position within the receptive field. For example,simple cells will respond similarly to both natural scene patchesand scrambled phase versions of those patches, whereas complexcells respond better to natural scene patches as opposed to theirscrambled phase versions, (Felsen, Touryan, Han, & Dan, 2005).The only differences between the scrambled phase and non-scram-bled natural scene patches are in their phase spectra (i.e., both setsof stimuli possessed identical power spectra), suggesting thatcomplex cells may represent an early stage of the type of phasealignment analysis that we have identified as important for thehigh-level task of face discrimination.
6.2. ‘‘Image-blocking” illusions
The identification of faces can be disrupted by coarse quantiza-tion (also known as blocking) of image luminances (Harmon &Julesz, 1973). It has been argued that this perceptual disruptioncannot be simply explained by the increased amplitude of thehigh-frequency components introduced as a side-effect of theblocking (Morrone, Burr, & Ross, 1983) and that the phase spec-trum plays an important, albeit presently undefined, role (Hayes,1988). Within the context of the current investigation, the percep-tual effects of image blocking rely on a disruption of local phasealignments; instead of randomizing phases as we have done here,image blocking disrupts them by artificially aligning them to thesame value (i.e. the block boundary). In light of our current find-ings, it is therefore not surprising that the blocking effect has a per-ceptually profound disruption for face recognition.
Acknowledgments
This work was supported by a grant from the Canadian Insti-tutes of Health Research (CIHR) Grant: MT 108-18 to R.F.H. and aDoctoral fellowship from the Fonds de la Recherche en Santé duQuébec to R.F.
References
Anderson, S. J., & Burr, D. C. (1985). Spatial and temporal selectivity of the humanmotion detection system. Vision Research, 25, 1147–1154.
Beale, J. M., & Keil, F. C. (1995). Categorical effects in the perception of faces.Cognition, 57, 217–239.
Billock, V. A. (2000). Neural acclimation to 1/f spatial frequency spectra in naturalimages transduced by the human visual system. Physica D, 137, 379–391.
Blakemore, C., & Campbell, F. W. (1969). On the existence of neurones in the humanvisual system selectively sensitive to the orientation and size of retinal images.Journal of Physiology, 203, 237–260.
Blanz, V. & Vetter, T. (1999). A morphable for the synthesis of 3D faces. Symposiumon Interactive 3D Graphics. In Proceedings of SIGGRAPH’99, pp. 187–194.
Braje, W. L., Tjan, B. S., & Legge, G. E. (1995). Human efficiency for recognizing anddetecting low-pass filtered objects. Vision Research, 32, 2955–2966.
Burton, G. J., & Moorhead, I. R. (1987). Color and spatial structure in natural scenes.Applied Optics, 26, 157–170.
Campbell, F. W., & Green, D. G. (1965). Optical and retinal factors affecting visualresolution. Journal of Physiology, 181, 576–593.
Campbell, F. W., & Robson, J. G. (1968). Application of Fourier analysis to thevisibility of gratings. Journal of Physiology, 197, 551–566.
Cohen, B. H. (2001). Explaining psychological statistics (2nd ed.). New York: Wiley.pp. 1–2.
Costen, N. P., Parker, D. M., & Craw, I. (1996). Effects of high-pass and low-passspatial filtering on face identification. Perception & Psychophysics, 58, 602–612.
De Valois, R. L., Albrecht, D. G., & Thorell, L. G. (1982). Spatial frequency selectivity ofcells in macaque visual cortex. Vision Research, 22, 545–559.
Felsen, G., Touryan, J., Han, F., & Dan, Y. (2005). Cortical sensitivity to visual featuresin natural scenes. PLoS Biology, 3, 1819–1828.
Field, D. J. (1987). Relations between the statistics of natural images and theresponse properties of cortical cells. Journal of the Optical Society of America A, 4,2379–2394.
Fiorentini, A., Maffei, L., & Sandini, G. (1983). The role of high spatial frequencies inface perception. Perception, 12, 195–201.
Goffaux, V., Hault, B., Michel, C., Vuong, Q. C., & Rossion, B. (2005). The respectiverole of low and high spatial frequencies in supporting configural and featural 24processing of faces. Perception, 34, 77–86.
Goffaux, V., & Rossion, B. (2006). Faces are ‘‘spatial”–holistic face perception issupported by low spatial frequencies. Journal of Experimental Psychology: HumanPerception & Performance, 32, 1023–1039.
Gold, J., Bennett, P. J., & Sekuler, A. B. (1999). Identification of band-pass filteredletters and faces by human and ideal observers. Vision Research, 39, 3537–3560.
Graham, N. (1980). Spatial-frequency channels in human vision: Detecting edgeswithout edge detectors. In C. Harris (Ed.), Visual coding and adaptability(pp. 215–252). Hillsdale, NJ: Erlbaum.
Hansen, B. C., & Essock, E. A. (2005). Influence of scale and orientation on the visualperception of natural scenes. Visual Cognition, 12, 1199–1234.
Hansen, B. C., & Hess, R. F. (2007). Structural sparseness and spatial phase alignmentin natural scenes. Journal of the Optical Society of America A, 24, 1873–1885.
Harmon, L. D., & Julesz, B. (1973). Masking in visual recognition: Effects oftwodimensional filtered noise. Science, 180, 1194–1197.
Hayes, A. (1988). Identification of two-tone images; some implications for high- andlow-spatial-frequency processes in human vision. Perception, 17, 429–436.
Hayes, T., Morrone, M. C., & Burr, D. C. (1986). Recognition of positive and negativebandpass-filtered images. Perception, 15, 595–602.
Heckmann, T., & Schor, C. M. (1989). Is edge information for stereoacuity spatiallychanneled? Vision Research, 29, 593–607.
Hess, R. F., Wang, Y-Z., & Liu, C. H. (2006). The accessibility of spatial channels forstereo and motion. Vision Research, 46, 1318–1326.
Hess, R. F., Bex, P. J., Fredericksen, E. R., & Brady, N. (1998). Is human motiondetection subserved by a single or multiple channel mechanism? VisionResearch, 38, 259–266.
Ledgeway, T. (1996). How similar must the Fourier spectra of the frames of arandom-dot kinematogram be to support motion perception? Vision Research,36, 2489–2495.
Leopold, D. A., O’Toole, A. J., Vetter, T., & Blanz, V. (2001). Prototype-referencedshape encoding revealed by high-level aftereffects. Nature Neuroscience, 4,89–94.
Maffei, L., & Fiorentini, A. (1973). The visual cortex as a spatial frequency analyser.Vision Research, 13, 1255–1267.
Majaj, N. J., Pelli, D. G., Kurshan, P., & Palomares, M. (2002). The role of spatialfrequency channels in letter identification. Vision Research, 42, 1165–1184.
Morrone, M. C., Burr, D. C., & Ross, J. (1983). Added noise restores recognizability ofcoarse quantized images. Nature, 305, 226–228.
Morrone, M. C., & Owens, R. A. (1987). Feature detection from local energy. PatternRecognition Letters, 6, 303–313.
2536 B.C. Hansen et al. / Vision Research 48 (2008) 2523–2536
Morrone, M. C. & Burr, D. C. (1988). Feature detection in human vision: A phasedependent energy model. Proceedings of the Royal Society, London, B, 235, 221–245.
Näsänen, R. (1999). Spatial frequency bandwidth used in the recognition of facialimages. Vision Research, 39, 3824–3833.
Olzak, L. A., & Wickens, T. D. (1997). Discrimination of complex patterns:Orientation 25 information is integrated across spatial scale; spatialfrequency and contrast information are not. Perception, 26, 1101–1120.
Owsley, C., Sekuler, R., & Boldt, C. (1981). Aging and low-contrast vision–faceperception. Investigative Ophthalmology & Visual Science, 21, 362–365.
Phillips, G. C., & Wilson, H. R. (1984). Orientation bandwidths of spatial mechanismsmeasured by masking. Journal of the Optical Society of America A, 1, 226–232.
Rotshtein, P., Henson, R. N. A., Treves, A., Driver, J., & Dolan, R. J. (2005). Morphingmarilyn into maggie dissociates physical and identity face representations inthe brain. Nature Neuroscience, 8, 107–113.
Ruderman, D. L., & Bialek, W. (1994). Statistics of natural images: Scaling in thewoods. Physical Review Letters, 73, 814–817.
Schiltz, C., & Rossion, B. (2006). Faces are represented holistically in the humanoccipito-temporal cortex. NeuroImage, 32, 1385–1394.
Sergent, J. (1984). An investigation into component and configural processesunderlying face perception. British Journal of Psychology, 75, 221–242.
Solomon, J. A., & Pelli, D. G. (1994). The visual filter mediating letter identification.Nature, 369, 395–397.
Tanaka, J. W., & Farah, M. J. (1993). Parts and wholes in face recognition. QuarterlyJournal of Experimental Psychology A, 46, 225–245.
Tieger, T., & Ganz, L. (1979). Recognition of faces in the presence of two-dimensionalsinusoidal masks. Perception & Psychophysics, 26, 163–167.
Tjan, B. S., Braje, W. L., Legge, G. E., & Kersten, D. (1995). Human efficiencyfor recognizing 3D objects in luminance noise. Vision Research, 35,3053–3069.
Tolhurst, D. J., Tadmor, Y., & Chao, Tang (1992). Amplitude spectra of naturalimages. Ophthalmic and Physiological Optics, 12, 229–232.
Troje, N., & Bülthoff, H. H. (1996). Face recognition under varying poses: The role oftexture and shape. Vision Research, 36, 1761–1771.
Valentine, T. (1991). A unified account of the effects of distinctiveness, inversion,and race in face recognition. Quarterly Journal of Experimental Psychology A, 43,161–204.
van der Schaaf, A., & van Hateren, J. H. (1996). Modeling the power spectra ofnatural images: Statistics and Information. Vision Research, 36, 2759–2770.
White, M., & Li, J. (2006). Matching faces and expressions in pixelated and blurredphotos. American Journal of Psychology, 119, 21–28.
Wichmann, F. A., & Hill, N. J. (2001a). The psychometric function. I: Fitting,sampling, and goodness of fit. Perception and Psychophysics, 63,1293–1313.
Wichmann, F. A., & Hill, N. J. (2001b). The psychometric function. II: Bootstrap-based confidence intervals and sampling. Perception and Psychophysics, 63,1314–1329.
Wilson, H. R., & Bergen, J. R. (1979). A four mechanism model for threshold spatialvision. Vision Research, 19, 19–32.
Wilson, H. R., McFarlane, D. K., & Phillips, G. C. (1983). Spatial frequency tuning oforientation selective units estimated by oblique masking. Vision Research, 23,873–882.
Young, A. W., Hellawell, D., & Hay, D. C. (1987). Configurational information in faceperception. Perception, 16, 747–759.