a critical look at the electric resistance oven' · · 2011-11-30a critical look at the...
TRANSCRIPT

A Critical Look at the Electric Resistance Oven'
H. HE2'3 and R. C. HOSENEY2
ABSTRACT Cereal Chem. 68(2):151-155
An electric resistance oven (ERO) was used to study the properties of dough without yeast. To obtain a fully baked loaf, input power neededand electric resistance of dough at increasing temperatures. In this study, to be sufficient to raise the dough temperature to 1000 C and to compensatea modified ERO was used to improve the flow of CO2 released from for the heat loss to the atmosphere. Baking with the ERO at room tem-the dough to the detector. The results showed that heating methods not perature resulted in temperature gradients from the center to the outeronly determined the profile of dough temperature but also affected the layer of the dough, with the greatest gradient near the top of the dough.expansion, CO2 release patterns, and electrical resistance of dough. The This probably was caused by dissipation of heat to the environment andresistance of dough containing yeast was three times higher than that by the lack of electrical heating in the crown area of the dough.
Bread is traditionally baked in a conventional oven, in whichdough is heated progressively from the outside toward the center.Marston and Wannan (1983) found that the rise in temperaturebelow the surface of dough goes through a three-phase sequence.It begins with a slow increase up to 500C, increases sharply from50 to 850C, and then gradually increases to 1000C. However,no two zones within dough undergo the same conditions at thesame time (Baker and Mize, 1939a). This causes difficulties inthe study of dough properties during baking. For example, ithas been impossible to determine the temperature at which doughstops expanding by observing baking in a conventional oven.
Baker (1939) developed an electric resistance oven (ERO) inwhich heat is generated internally by using dough as a conductorwith high resistivity between electrodes carrying an alternatingcurrent. Therefore, all of the dough theoretically heats uniformly.This baking method provides a useful tool for studying how doughchanges with temperature during baking.
Different dough temperatures as a result of baking in an EROhave been reported in the literature. Baker and Mize (1939a)baked dough to 1000C to study the effect of temperature ondough properties. Junge and Hoseney (1981) used an updatedmodel of an ERO to investigate the effect of shortening andsurfactant on dough properties. They raised the dough temper-ature to 880C; Moore and Hoseney (1986) raised it to about860 C.
Because temperature governs the physical, chemical, and bio-logical changes in breadmaking, different heating methods mightchange the baking properties of dough. However, the factorsaffecting dough baking properties have not been thoroughlystudied. The objectives of this work were to study the effect ofheating methods and conditions on dough-baking properties andthe change in electrical resistance of dough during baking in anERO.
method. The panning procedure consisted of molding the doughin the usual manner and then cutting it longitudinally on thetop side (i.e., the side opposite the seam) to a depth of abouthalf the diameter of the dough, so that a flat surface of doughwas obtained to ensure better contact with the plates of the ERO.The dough was then placed cut-side-up on the bottom of theERO (which was placed in a proofing cabinet) and was proofedfor 55 min before baking.
Resistance BakingThe ERO used in our study is illustrated in Figure 1. Compared
with the ERO presented by Junge and Hoseney (1981), somemajor modifications were made. Two strips (3-mm wide) wereexcised along the sides on each electrode plate. The gas inletwas moved to the top of the ERO and the outlets to the lowerpart of both side walls, 10 mm above the bottom. This EROallowed nitrogen, as a carrier, to flow over the surface of thedough and carry the CO2 away immediately, as it was releasedfrom dough.
Dough was placed between the two plates of the ERO, whichwere connected to the output of a variable transformer. The heat-ing rate and dough temperature were controlled by adjusting theoutput of the variable transformer. Dough temperature was moni-tored by a thermocouple inserted directly into the dough througha small hole 10 mm above the bottom of the oven. The midpointbetween the highest and lowest points of the dough surface wastaken as dough height.
Quantification of CO2CO2 was measured by a Beckman model 865 Infrared Analyzer
with Range 1, which could detect a CO2 concentration of 0-500ppm. The flow diagram for measuring the rate of CO2 released
MATERIALS AND METHODS
Preparation of Dough for BakingA commercial bread flour containing 11.5% protein and 0.48%
ash was used. The preparation of dough generally followed theAACC Method 10-lOB (AACC 1983). Nonfat dry milk (4.0%)(Gallaway West, Fond du Lac, WI), instant dry yeast (0.75%)(Gist-Brocades, Charlotte, NC), and 10 ppm of KBrO3 were addedto the formula. Fermentation time was 180 min. Some doughsalso were made without yeast.
The baking procedure before panning followed the standard
'Contribution 90-364J. Kansas Agricultural Experiment Station, Manhattan, KS66506.
2Graduate research assistant and professor, Department of Grain Science andIndustry, Kansas State University, Manhattan, KS 66506.
3Present address: Anheuser-Busch Companies, Inc., St. Louis, MO 63118-1852.
© 1991 American Association of Cereal Chemists, Inc.
END VIEWFig. 1. Electric resistance oven.
SIDE VIEW
Vol. 68, No. 2,1991 151

from the dough is shown in Figure 2. Nitrogen, as a carrier,flowed into the ERO at a rate of 4,500 cm3/ min. The gases comingout of the ERO were dried by three flasks of concentrated sulfuricacid, in series, to remove water and minimize its interferencewith infrared analysis of CO2. Silica gel was used to check thedryness of the gas. The gas was then split into a smaller flowsuitable for the detector. The magnitude of CO2 released fromdough during baking was recorded. A baseline was establishedwith nitrogen as a blank gas.
The CO2 detection of the infrared detector was linear withinthe range of 0-70 units on the scale, with a slope of 3.6 ppmof CO 2/unit, which corresponds to the upper limit of 252 ppmof CO2. The maximum rate of CO2 released from bread doughduring baking is about 1,150 ppm/min. Therefore, only one fifthof the gas roduced entered the infrared detector at a flow rateof 900 cm min. Standard gas contained 306 ppm of CO2 innitrogen. Therefore, the instrument was calibrated to indicate17 units (306 ppm of CO2 divided by 3.6 ppm of CO2 per unitdivided by 5) on the scale with the standard gas. Each unit onthe chart represents the flow rate of CO2 at 25°C:
3.6 ppm X 900 cm3/min
2.4451 X cm3/mol
The maximum rate of CO2 that could be detected in the linearrange was 46.4 X 10⁻⁶ mol/min.
Measurement of Dough ResistanceA Simpson 462 Autoranging Digital Multimeter (Simpson Elec-
tric Co., Elgin, IL) was connected in series with the ERO tomeasure the AC current passing through the dough. Accordingto Ohm's law, V = R X I, where V is the voltage (volts) appliedto dough, R is the resistance (ohms) of dough, and I is the current(amps). Thus, the resistance of the dough can be calculated bythe known voltage divided by the measured AC current.
of dough (32.5, 22.5, 12.5, and 2.5 mm, Fig. 3, also top view B).From each dough, temperature measurements were taken of
only one dimension depth, length, or width. Duplicate temper-ature measurements were made in each dimension.
To examine the effects of various heating methods on bakingproperties, different voltage potentials, obtained by adjusting theoutput of a variable transformer, were applied to the ERO tobake dough. Temperatures were measured periodically at thecenter of the dough 10 mm above the bottom and were plottedagainst time. Methods A and B used constant potentials of 75and 120 V, respectively. Method C used variable voltage potentialsduring different periods of baking: 50 V (0-8 min), 90 V (9-10min), 100 V (11- 12 min), and 120 V (13-22 min).
RESULTS AND DISCUSSION
Dough TemperatureThree temperature-time profiles are shown in Figure 4. When
a constant 75-V potential was applied (method A), dough temper-ature increased linearly to 660C. Above 66°C, it rose at a de-creasing rate to 86°C. When dough was baked with a constant120-V potential (method B), the heating rate was so fast thatdough temperature reached 1000C in only about 5 min.
With method C, dough temperature slowly reached 500 C
DEPTH
Measurement of Dough Temperature GradientDuring baking in the ERO, dough temperature was monitored
with a thermocouple. When the dough at the center of the loaf10 mm above the bottom (Fig. 3, side view A) reached 70, 80,or 90°C, voltage was reduced to maintain the temperature for30 sec. During this holding period, additional temperature mea-surements were taken at various points from the center on thetop of dough, as follows: 1) at increasing depths within the doughmass (2.5, 12.5, 22.5, 42.5, and 62.5 mm, Fig. 3, side view A),2) from the end of the dough (i.e., the oven wall) (62.5, 42.5,22.5, 12.5, and 2.5 mm, Fig. 3, top view B), or 3) from the side
I o- - l/ ~~~A2~
A ,4
A5'
AT*
SIDE VIEW A
LENGTH _..WIDTH
FLOW ME-M H2so4 H20
Fig. 2. Electrie resistance oven system to detect rate of C0 2 loss.
152 CEREAL CHEMISTRY
TOP VIEW BFig. 3. Positions at which temperatures were recorded in bread doughbaked in the electric resistance oven. In side view A, AT is the positionwhere the thermocouple was located at the center, 10 mm above thebottom of the dough. Al, A2 , A3, A4, and A5 are positions in the centerof the dough at depths of 2.5, 12.5, 22.5, 42.5, and 62.5 mm from thetop, respectively. In top view B, B1, B2 , B3, and Bc are positions 2.5,12.5, 22.5, and 32.5 mm from the side of the dough toward the center,at a depth of 22.5 mm. B11, B12, B1 3, B14, and Bc were 2.5, 12.5, 22.5,42.5, and 62.5 mm, respectively, from the end of the dough (the ovenwall) toward the center, at a depth of 22.5 mm.
OB,
* B2
*B3
B11B12B13 B14
RECORDER
(within 8 min) and then greatly increased from 50 to 850C, witha maximum dough temperature of 1000C. Method C gave theclosest profile to that reported by Marston and Wannan (1983)of temperature versus time for the center of dough baked in aconventional oven.
Dough PropertiesHeating methods affected final loaf height (Fig. 5). When baked
by method C, dough did not stop expanding until the temperaturereached about 970C, whereas with method A, because doughtemperature reached only 860C, dough stopped expanding at860C. As a result, method C resulted in a loaf about 15 mmgreater in height.
Heating methods also affected the profiles of CO2 release duringbaking (Fig. 6). In the early stages of baking, the rate of CO2loss was about 5 ,umol/ min from the doughs baked with methodsA and C. Also, both doughs started to lose more CO2 at about720C. However, with method A, the rate of CO2 loss graduallyincreased, with rather large fluctuation, to about 25 MAmol/minat the end of baking. With method C, the rate of CO2 loss sharplyincreased to a maximum of 43 jimol/min at 88 0C and then de-creased slowly before a sharp decrease occurred at about 970C.The total amount of CO2 released from the dough was con-siderably more with method C than with method A during 22min of baking time.
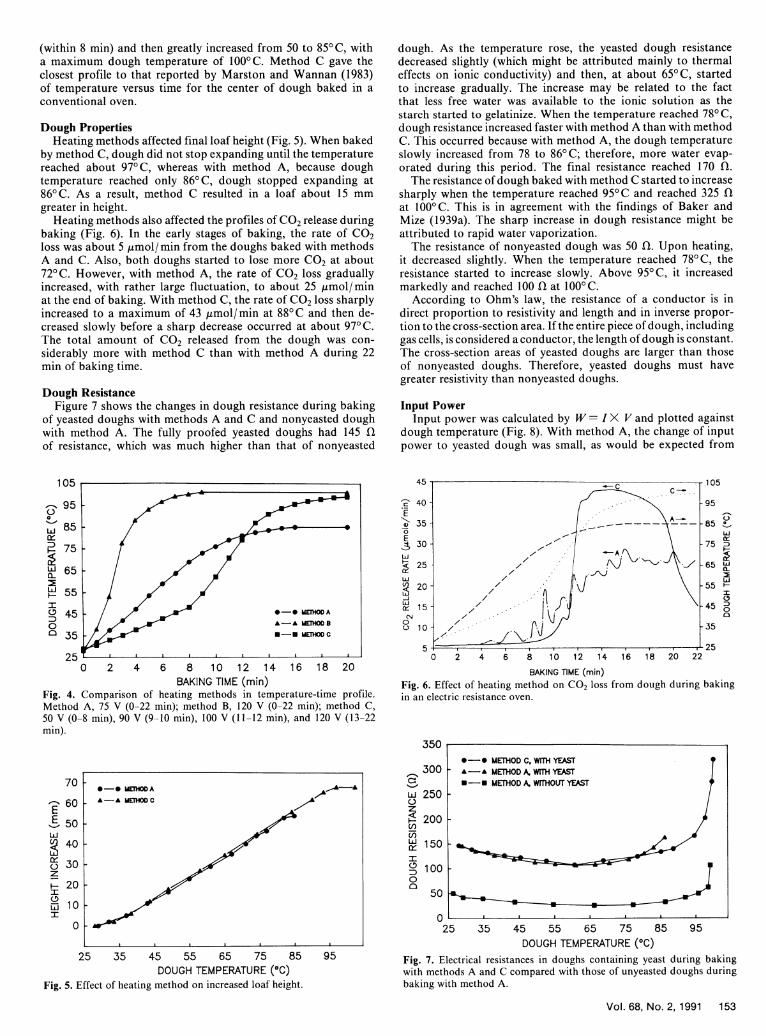
Dough ResistanceFigure 7 shows the changes in dough resistance during baking
of yeasted doughs with methods A and C and nonyeasted doughwith method A. The fully proofed yeasted doughs had 145 flof resistance, which was much higher than that of nonyeasted
105
- 95
85
75 7
65 -6a.
H55-
0 450
0 2 4 6 8 10 12 14 16 18 20BAKING TIME (min)
Fig. 4. Comparison of heating methods in temperature-time profile.Method A, 75 V (0-22 min); method B, 120 V (0-22 min); method C,50 V (0-8 min), 90 V (9-10 min), 100 V (11-12 min), and 120 V (13-22min).
70 - 0 -0 MM=HOA
60 -*A-A MEnsHM C
50 -
40 -
o) 30-zH 20
I0Fli 10I
0
25 35 45 55 65 75 85 95DOUGH TEMPERATURE (0C)
Fig. 5. Effect of heating method on increased loaf height.
dough. As the temperature rose, the yeasted dough resistancedecreased slightly (which might be attributed mainly to thermaleffects on ionic conductivity) and then, at about 650C, startedto increase gradually. The increase may be related to the factthat less free water was available to the ionic solution as thestarch started to gelatinize. When the temperature reached 780C,dough resistance increased faster with method A than with methodC. This occurred because with method A, the dough temperatureslowly increased from 78 to 860C; therefore, more water evap-orated during this period. The final resistance reached 170 Q1.
The resistance of dough baked with method C started to increasesharply when the temperature reached 95 0C and reached 325 flat 1000C. This is in agreement with the findings of Baker andMize (1939a). The sharp increase in dough resistance might beattributed to rapid water vaporization.
The resistance of nonyeasted dough was 50 fQ. Upon heating,it decreased slightly. When the temperature reached 780 C, theresistance started to increase slowly. Above 950 C, it increasedmarkedly and reached 100 fl at 1000C.
According to Ohm's law, the resistance of a conductor is indirect proportion to resistivity and length and in inverse propor-tion to the cross-section area. If the entire piece of dough, includinggas cells, is considered a conductor, the length of dough is constant.The cross-section areas of yeasted doughs are larger than thoseof nonyeasted doughs. Therefore, yeasted doughs must havegreater resistivity than nonyeasted doughs.
Input PowerInput power was calculated by W = I X V and plotted against
dough temperature (Fig. 8). With method A, the change of inputpower to yeasted dough was small, as would be expected from
a,
E
(0
E
iic(n
c'J
0C)
0
010A
Of
BAKING TIME (min)
Fig. 6. Effect of heating method on CO 2 loss from dough during bakingin an electric resistance oven.
350
300
a)
LLi
Cl)L ia:
I0CD
:D00
250 ~
200
150
100
50
0 .I I I I I .
25 35 45 55 65 75 85 95
DOUGH TEMPERATURE (0C)Fig. 7. Electrical resistances in doughs containing yeast during bakingwith methods A and C compared with those of unyeasted doughs duringbaking with method A.
Vol. 68, No. 2,1991 153
0-* METHOD C. WITH YEAST* A-A METHODA. WITH YEAST
U-*U METHOD A, WITHOUT YEAST

the change in dough resistance. As the input power decreasedto a minimum, it just compensated for the heat lost to the environ-ment; therefore, the dough temperature stopped rising. Thisexplains why the maximum temperature of yeasted dough bakedwith method A only reached about 86° C. Method C, by increasingvoltage potentials, provided sufficient input power to overcomeheat dissipation and raise the dough temperature to 1000C.
Temperature GradientIn the ERO, heat is generated internally by using the dough
as the resistance between electrodes carrying an alternating cur-rent. With this method, the temperature within the entire massof dough theoretically should be the same at any time. To examinethe uniformity in temperature within the dough baked in theERO, temperature was measured from the top center of the loafto various depths (Fig. 3) when the dough at the center of theloaf 10 mm above the bottom reached 70, 80, and 90'C. Thetemperatures at the depth of 62.5 mm (about the center of thebaked loaf) were 72, 81, and 920C, respectively. Figure 9 showsthat the dough temperature decreased with an increase in distancefrom the center of the loaf. A large temperature gradient wasnoted near the top of dough. The difference in temperaturebetween the center of the dough and at a depth of 2.5 mm wasabout 330C.
Figure 10 shows dough temperature 22.5 mm from the topof the dough along its length and width (Fig. 3). Temperatureswere also taken when the center of the dough at 10 mm abovethe bottom reached 70, 80, and 901C. Dough temperatures de-creased slightly from the center of dough to its side, which con-tacted the oven wall or electrode plate. However, the temperaturegradients along the length and width of dough were much smallerthan those in the depth of dough. The difference in temperaturebetween the center of the dough and at 2.5 mm from the sidewas about 100C.
C,)
4ii
i-jH)
0~
z
120
100
80
60 F
40 k
20 k
25 35 45 55 65 75 E
DOUGH TEMPERATURE (0C)Fig. 8. Input power with methods A and C.
85 95
Therefore, our data clearly show that the temperature withinthe dough baked in the ERO was not uniform. A possible ex-planation is that the baking was not conducted under conditionsof heat insulation, but rather at 230C, 55% RH. Under suchconditions, heat was transported or dissipated to the environmentthrough the electrode plates, oven walls, and top of the dough.The large temperature gradient near the top of the dough wasprobably caused by two factors: heat dissipation (mainly by vapor)and no electricity flowing through the crown at the top of thedough.
The mechanism of heat transport in dough mainly follows theprinciple of Watt; i.e., water vapor flows and condenses at rela-tively colder surfaces. In a conventional oven, water vapor isgenerated near the crust layer and condenses at the center ofthe loaf (Sluimer and Krist-Spit 1987). Therefore, the moistureof the loaf increases from the outside toward the center. Mea-surements showed that the moisture of the crust was about 11%and of the center crumb about 47%, while moisture in the doughbefore baking was about 43%. However, when dough is bakedin an ERO, water vapor from the center of the loaf condensesat the outer surfaces, resulting in a wet surface and water dis-tribution opposite to that of a conventional loaf. The moistureat the sides and top of the loaf baked in the ERO was about43%, considerably higher than at the center of the loaf (about35%).
Problems Associated with the EROBecause of the large temperature gradient in the loaf baked
in the ERO, observations on dough expansion and CO2 releasedfrom dough as a function of temperature may be misleading.The profile of gas loss from dough baked with method C (Fig.6) shows not only that a broad temperature range was presentfrom the start of increasing CO2 loss to the start of the decreasein gas, but also that some CO2 was left in the ERO loaf. Atthe end of baking, the rate of CO2 loss was about 15 prmol/
95
CD01
0/
Lli
H
:D
IM,00
85
75
65
55
45 [
35) 10 20 30 40 50 60
DISTANCE FROM END ( mm)
95
O 85
uii
D 75
A:cL65
I55
°D
0
35 )0 10 20 30 40 50 60
DEPTH (mm)Fig. 9. Temperature gradients at different depths of dough, when thetemperature at the bottom of the dough reached 70, 80, and 900C.
154 CEREAL CHEMISTRY
95
01%C)
01
LLI
I
D0
85
75
65
55
45 1
350 5 10 15 20 25 30 35
DISTANCE FROM SIDE (mm)Fig. 10. Temperature gradients along the length and width of doughat a depth of 22.5 mm, when the temperature at the dough 10 mm abovethe bottom reached 70, 80, and 900C.
0-0 METHWOD CA-A METHOD A
80-C
_70*C i
90iC
80*C
i 70^C
I - a - I I I a
. . . . .
I . --- . a I
I
o _ _
I
