a critique on the structural analysis of lignins and
TRANSCRIPT

HAL Id: hal-01886313https://hal.archives-ouvertes.fr/hal-01886313
Submitted on 2 Oct 2018
HAL is a multi-disciplinary open accessarchive for the deposit and dissemination of sci-entific research documents, whether they are pub-lished or not. The documents may come fromteaching and research institutions in France orabroad, or from public or private research centers.
L’archive ouverte pluridisciplinaire HAL, estdestinée au dépôt et à la diffusion de documentsscientifiques de niveau recherche, publiés ou non,émanant des établissements d’enseignement et derecherche français ou étrangers, des laboratoirespublics ou privés.
A critique on the structural analysis of lignins andapplication of novel tandem mass spectrometric
strategies to determine lignin sequencingJoseph H. Banoub, Guo-Hua Delmas, Nicolas Joly, Grahame Mackenzie,
Nadja Cachet, Bouchra Benjelloun-Mlayah, Michel Delmas
To cite this version:Joseph H. Banoub, Guo-Hua Delmas, Nicolas Joly, Grahame Mackenzie, Nadja Cachet, et al.. Acritique on the structural analysis of lignins and application of novel tandem mass spectrometricstrategies to determine lignin sequencing. Journal of Mass Spectrometry, Wiley-Blackwell, 2015, 50(1), pp.5-48. �10.1002/jms.3541�. �hal-01886313�

OATAO is an open access repository that collects the work of Toulouse researchers and makes it freely available over the web where possible
Any correspondence concerning this service should be sent to the repository administrator: [email protected]
This is an author’s version published in: http://oatao.univ-toulouse.fr/20620
To cite this version:
Banoub, Joseph H. and Delmas, Guo-Hua and Joly, Nicolas and Mackenzie, Grahame and Cachet, Nadja and Benjelloun-Mlayah, Bouchra and Delmas, Michel A critique on the structural analysis of lignins and application of novel tandem mass spectrometric strategies to determine lignin sequencing. (2015) Journal of Mass Spectrometry, 50 (1). 5-48. ISSN 1076-5174
Official URL: https://doi.org/10.1002/jms.3541

DOI 10.1002/jms.3541
A critique on the structural analysis of ligninsand application of novel tandem massspectrometric strategies to determinelignin sequencingJoseph Banoub,a,b* Guo-Hua Delmas Jr.,c Nicolas Joly,d Grahame Mackenzie,e
Nadja Cachet,c Bouchra Benjelloun-Mlayahc and Michel Delmasc,f*
This review is devoted to the application of MS using soft ionization methods with a special emphasis on electrospray ionization, atmospheric pressure photoionization and matrix-assisted laser desorption/ionization MS and tandem MS (MS/MS) for the eluci-
dation of the chemical structure of native and modified lignins. We describe and critically evaluate how these soft ionization methods have contributed to the present-day knowledge of the structure of lignins.Herein, we will introduce new nomenclature concerning the chemical state of lignins, namely, virgin released lignins (VRLs) and processed modified lignins (PML). VRLs are obtained by liberation of lignins through degradation of vegetable matter by either chemical hydrolysis and/or enzymatic hydrolysis. PMLs are produced by subjecting the VRL to a series of further chemical trans-formations and purifications that are likely to alter their original chemical structures.
We are proposing that native lignin polymers, present in the lignocellulosic biomass, are not made of macromolecules linked to cellulose fibres as has been frequently reported. Instead, we propose that the lignins are composed of vast series of linear related oligomers, having different lengths that are covalently linked in a criss-cross pattern to cellulose and hemicellulose fibres forming the network of vegetal matter. Consequently, structural elucidation of VRLs, which presumably have not been purified and proc-essed by any other type of additional chemical treatment and purification, may reflect the structure of the native lignin.
In this review, we present an introduction to a MS/MS top–down concept of lignin sequencing and how this technique may be used to address the challenge of characterizing the structure of VRLs.
Finally, we offer the case that although lignins have been reported to have very high or high molecular weights, they might not exist on the basis that such polymers have never been identified by the mild ionizing techniques used in modern MS.
Keywords: lignins; GC-MS; APPI; ESI; MALDI-MS
* Correspondence to: Joseph Banoub, Department of Chemistry, MemorialUniversity of Newfoundland, St John’s, Newfoundland, A1C 5X1, Canada. E-mail:[email protected]
* Correspondence to: Michel Delmas, Compagnie Industrielle de la MatièreVégétale (CIMV), 109 Rue Jean Bart – Diapason A, 31670 Labège, France. E-mail: [email protected]
a Department of Chemistry, Memorial University of Newfoundland, St John’s,Newfoundland, A1C 5X1, Canada
b Science Branch, Special Projects, Fisheries and Oceans Canada, St John’s, NL, A1C5X1, Canada
c Compagnie Industrielle de la Matière Végétale (CIMV), 109 Rue Jean Bart –
Diapason A, 31670, Labège, France
d Centre Technologique des Agroressources, IUT de Béthune, Université d’Artois,1230 rue de l’Université, BP 819, 62408, Béthune Cedex, France
e Department of Chemistry, University of Hull, Hull HU6 7RX, UK
f Inp-Ensiacet, Laboratoire de Génie Chimique, Université de Toulouse, 4 allée EmileMonso, 31432, Toulouse Cedex 4, France
Introduction
The plant cell wall (CW) of all vascular plants and woods is com-posed of cellulose, hemicelluloses and lignins, which are formedin large quantities by means of solar energy. The CW structure iscomposed of primary and secondary CW parts. Both parts are com-posed of cellulosemicrofibrils (9–25%) and an interpenetratingma-trix of hemicelluloses (25–50%), pectins (10–35%) and proteins(10%).[1] Cellulose is themain constituent of all skeletal constituentsin plants[2] and forms the framework of the CWs, whereas hemicel-luloses cross-link non-cellulosic and cellulosic polymers.[3,4] Cellu-lose is composed of approximately 8× 10³ D-glucopyranoseresidues linked by β-D-(1→4)-glycosidic bonds.[5] Hydrogen bondshold about 40 of these glycan chains together to form a cellulosemicrofibril. The cellulose microfibril arrangements in the primarywall are random. Cellulose microfibrils are linked to hemicellulosicpolysaccharides that are mainly composed of xylans, mannans,galactans or combinations thereof, which are attached to the cellu-lose fibres by hydrogen and covalent bonding.[3,5]
In general, secondary walls are derived from the primary walls bythickening and inclusion of lignin into the CW matrices. The

secondary plant CW contains hemicelluloses (10–40%) that are em-bedded in lignin (25%). Historically, this type of arrangement hasbeen compared with steel rods embedded in concrete to formprestressed concrete.[6] Cellulose and hemicelluloses appear to bemore structurally organized in the secondary CW than in that ofthe primary CW. Lignin occurs widely in the middle lamellae andsecondary CWs of higher plants and plays a key role in constructivetissues as a building material, giving it its strength and rigidity andresistance to environmental factors.[1] The diverse and complex na-ture of lignin monomers and hemicellulosic moieties inlignohemicellulosic complexes make stereotypical conceptualiza-tion of secondary wall structures for all plants extremely difficult.[3,5]
History of lignin
Lignin was discovered by Anselme Payen (1839) and was first de-scribed as the encrusting material in wood. Researchers werepuzzled by the nature of this very abundant material.[7] Althoughlignin was found to have higher carbon content than carbohy-drates, the chemical nature remained obscure for a long time.Accordingly, for almost the last century, the structure of ligninwas described as a complex polymer composed of irregularbranched units. After cellulose, lignin is the second most abun-dant biopolymer on Earth. It is found in all vascular plants, mostlybetween the cells, as well as within the cells and in the CWs. Theterm lignin is derived from the Latin word for wood: lignum. Thepolyphenolic structure of lignin is well known for its role inwoody biomass to give resistance to biological and chemicaldegradation. This is due to their hydrophobic nature and insolu-bility in aqueous systems preventing access of degradingchemicals and organisms.It is well accepted in our era that lignin is a very promising mas-
sive renewable organic resource. The worldwide annual productionof lignin, as a side product of wood processing industries, exceeds50 million tons.[8]
Lignins in the CWs of vascular plants are intimately mixed withthe carbohydrate components and form a complex glycolignin net-work. In recent years, it was shown that the chemical structure ofthe various lignin biomolecules depends on the botanical originand chemical composition of the vegetal fibres.[9] It has also beenproposed that the several different chemical, enzymatic and me-chanical extraction methods are accountable for the major struc-tural divergence that occurs after extraction and isolation. As aresult, it appears that the only logic step to determine the naturalstructure of lignin is to isolate it from the vegetal matrix, withoutcausing any structural change.[10] Therefore, preparing pure sam-ples of unchanged lignin is not an easy endeavour with the conse-quence that structural determination of lignin is perhaps morechallenging than with other biopolymers.[11–13]
Figure 1. Monomeric structures of lignin. Reproduced with permissionfrom W.O. S. Doherty et al. (2011). Copyright 2011 by Elsevier Ltd. Allrights reserved.
Proposed structure of lignin
During the last century, it was proposed that lignin existed as across-linked amorphous macromolecular material composed ofphenylpropanoid monomers known as lignols. Lignin is relativelyhydrophobic and aromatic in nature and consists of several typesof substructures, which possess the same phenylpropanoid skele-ton, but differ in the degree of oxygen substitution on the phenylring. The monolignol H-structure consists of a 4-hydroxyphenylring. The monolignol guaiacyl G-structure contains one hydroxyland one methoxyl group, whereas the monolignol syringyl S-
structure contains two methoxyl groups and one hydroxyl group(Fig. 1).[8]
The H, G and S constituent units are linked covalently, formingether, ester and carbon–carbon bonds, which repeat in anapparently random manner and provide great complexity.[14] Ingeneral, the site of attachment of the covalent linkages can varybetween two lignols. It is generally accepted that lignins arecomposed of H, G and S units attached by β–O–4′, β–5′, β–β′, β–1′,5–5′ and 5–O–4′ linkages that are relatively resistant towardsdegradation. These are designated according to the atomic cen-tres in the radicals that are coupled together during the finalstep of lignin biosynthesis.[15] The equivalent substructures inthe presumed overall structure of the biopolymer consist ofalkyl–aryl ethers, phenylcoumarans, resinols, dibenzodioxocins,biphenyls, tetrahydrofuran-spiro-cyclohexadienones and diarylethers (Fig. 2).[16]
In softwood lignin, the G structure is dominant. Hardwood ligninnormally contains a mixture of S and G lignols, with S being in themajority. The H lignols predominate in lignin found in grasses.[17]
It has been shown that during lignin extraction, the β–O–4′dilignol linkage was the most commonly and easily cleaved bond,whereas other dilignol linkages were more chemically recalcitrant.In addition, it is believed that the relative proportion of monomersdictates the relative abundance of interunit linkages present. Forexample, lignins rich in G units contains more recalcitrant β–5′,β–β′ and β–O–4′ linkages, whereas lignins enriched with S unitsare less cross-linked and less recalcitrant to extraction. For this rea-son, lignin composition is classically described by the relative abun-dance and ratio of H, G and S units.[18–20] As a result, our knowledgeof lignin chemical structure is less precise than our knowledge ofother natural and synthetic polymers.
The typical molecular mass of isolated lignin has been estimatedto be in the range 1000–20 000 u.[8] There have been many reportsin the literature suggesting that the degree of polymerization innatural lignin is difficult to measure because it is assumed that it in-variably fragments during extraction.[8]
It was speculated that lignin may exist as one single molecule inits native environment and that its structure may never cease togrow.[21] As a result, the chemical structure of lignin was describedas a highly cross-linked and three-dimensional biopolymer(Fig. 3).[22]
In contrast, it was proposed that isolated lignin has cross-linkingfrequencies of less than 1 in 19 monomer units.[23] In addition, itwas anticipated that isolated lignin could exist as lamella-like

Figure 3. Proposed structural model of spruce lignin by K. Freudenberg. Reproduced with permission from L. B. Davin et al. (2005). Copyright 2005 byElsevier Ltd. All rights reserved.
Figure 2. Main linkages in native lignins (R = H in p-hydroxyphenyl units or OCH3 in guaiacyl and syringyl units). Reproduced with permission from C.Lapierre (2010). Copyright 2010 by Taylor and Francis Group, LLC. All rights reserved.
sheets, which lacked cross-linking.[24,25] Yet, it was also suggestedthat the in situ molecular structure of lignin in the species of Japa-nese cedar (Cryptomeria japonica), camellia (Camellia japonica)and ginkgo (Ginkgo biloba) behaved much as if it was made up oflinear macromolecules.[26] These newest views have been reportedby many researchers (Fig. 4).[11,27–29]
Lignans and neolignans
The lignans encompass a newly classified group of natural plantproducts that are related biochemically to phenylalanine metabo-lism and composed of two phenylpropanoid units.[30] They arecharacterized by the two phenylpropanoid units (C-9) being linkedto each other via the C-8 to C-8′ bonds (refer to Fig. 5 for

Figure 4. Schematic representation of softwoodmilled wood lignin. The structures reported are indicative of the occurrence of each interunit bonding anddo not strictly reflect the statistical frequency. β–O–4′ is labelled in black, β–5′ pink, DBDO purple, 5–5′ amaranth, β–β′ azure, β–O–5′ orange, terminal aliphaticchains blue, and terminal phenolic OH red. Reproduced with permission from C. Crestini et al. (2011). Copyright 2011 American Chemical Society. All rightsreserved.
Figure 5. Basic chemical structure of lignans and neolignans. Reproducedwith permission from G. P. Moss (2000). Copyright 2000 by IUPACInternational. All rights reserved.
8
numbering).[31] According to IUPAC nomenclature, in the absenceof the C-8 to C-8′ bonds between the two phenylpropanoid units,the dimers formed are known as neolignans.[31]As a result of their wide distribution in the plant kingdom, lignanshave attracted a great interest for their pharmacological properties.They exhibit anti-platelet, antiviral, anti-tumour, anti-depressantand pesticidal activities (Fig. 5).[32–36]
Within the neolignans, three subgroups are distinguished: theoxyneolignans, the sesquineolignans and the dineolignans. Theoxyneolignans have their C-9 units linked via an ether bond.The sesquineolignans are composed of three C-9 units and thedineolignans of four C-9 units.[31] Lignans have been identifiedin many plants,[37] whereas neolignans are thought to be lessabundant and mainly present in coniferous trees.[38] Lignanshave been found almost exclusively in edible plant sources.[39,40]
The unsolvable paradigms of lignin
Two types of lignin analyses are recognized. Usually, non-destructive analytical methods employing topochemical explora-tion are used to assess the presence and distribution of lignin inthe plants.[41] In contrast, chemical structural analysis of the ligninpolymer is mostly performed by destructive analysis methods. Inthese methods, the isolated lignin is depolymerized to producesmall fragments that provide partial structural information of theoriginal native structure.[42]
More than a century of lignin research has produced an enor-mous amount of experimental results that were, to a large extent,dissimilar and difficult to reproduce. The probable reason for theseirregularities between the several experimental results may well bedue to the different extraction methods used in attempts to isolatean identical lignin product each time form the same plant.
From the chemical point of view, it is well recognized that the iso-lation of lignin in its unaltered form is highly unlikely because of therelatively harsh extraction conditions used. However, there is stillmuch debate on whether any lignin extract adequately representsthe native lignin structure. Therefore, the harsh extraction conditionrequired to release lignin from lignocellulosic cellular material re-sults in the degradation of the lignin polymeric structure itself. Forexample, acid and alkaline depolymerization of lignin causes cleav-age of ester bonds and some ether bonds; however, the reactivityof the released fragments may lead to more complex rearrangedcondensed polymeric structures as shown in Fig. 6.[43]

Figure 6. Acid catalysed depolymerization of lignin causing the cleavage of ester bonds and ether bonds (route 1) and reassociation to form complexrearranged condensed polymeric structures (route2). Reproduced with permission from R. J. A. Gosselink (2011). Copyright 2011 by WageningenUniversiteit, The Netherlands. All rights reserved.
Moreover, the continued use of inadequate and outdated analyt-ical methodology to characterize both lignin and lignin-like poly-mers further exacerbates this situation.[43] Needless to say, therewere some opinionated claims that implied that structural analysisof lignin should be based on pure samples.[43]
Other notable enigmas concerning the lignin biosynthesis wor-thy of mention are as follows. The mechanism by which the biosyn-thetic formed monolignols migrate to the CW is not known.[44]
Although, all steps of lignin biosynthesis have been identified, littleis known about the number of genes encoding each enzymaticstep.[45]
The most established biosynthetic polymerization route knownas the combinatory process postulates that the oxidizing enzymesthat produce the lignol radicals, which combine to form dilignols,trilignols and oligolignols, depend on nothing except the chemicalcontrol that dictates the coupling and by association all the resultedpolymeric structures.[14,46,47] This polymerization is initiated by theoxidative radical ionization of phenols, followed by combinatorialradical coupling. Decades of research are consistent with thismodel.[48–51]
Yet, a conflict exists between this traditional biochemical po-lymerization of lignin,[1,15,46,48–50,52–55] with another so far un-confirmed model that declares that the polymerization thatforms lignin must be controlled by proteins (dirigentproteins).[22] Replication of the primary lignin chain by templatepolymerization implies that lignins may have a regular repeatingunit.[52–54]
Nevertheless, this postulate of template polymerization waschided by the following statement: it will be astronomically im-probable to find chemically ordered region in the lignins, andthe search for regularity is futile.[44] In addition, it was suggestedthat because lignin polymerization is combinatorial, the se-quencing of lignin is meaningless, except for individualmolecules.[44] Nevertheless, understanding the propensity ofhow monolignols couple will afford insight into the factors thatdetermine lignin structure.[44]
In general, we can conclude that the structural analysis of lig-nin is a very tedious task, especially as lignins are heterogeneousmixture of oligomers. In reality, structural analysis permit gener-ally to estimate the average frequency of the main units and themain bond types in the polymer, from a conglomerate of oligo-mers simply of the whole plant or in crudely fractionated majortissues.
Aims of this review
The present review is devoted to the application of MS to theelucidation of the chemical structure of lignin. Of importance,we have chosen pertinent examples to highlight the key roleof the state-of-the-art MS methods that employ softer ionizationmodes to analyse the structure of native and modified types oflignin.
We provide an overview and critique of the current understand-ing of lignin structure taking in account of the various extractionmethodologies that have been employed (refer to the supplemen-tary data). In addition, we emphasize how these various aspectshave contributed to the current knowledge of the structure oflignins.
Despite the many workers being engaged in the study of ligninsover the years,[18,56] the many aspects of the chemistry, biosynthe-sis and molecular biology have remained not fullyelucidated.[1,15,46,48–55] It is noteworthy that lignins contain a rangeof chemical functional groups, many of which may be the direct re-sult of the extractionmethod. Themain functional groups of ligninsare hydroxyl (aromatic and aliphatic), methoxyl, carbonyl and car-boxyl. Furthermore, the solubility of the lignins is affected by therelative proportions of such functional groups. In addition, most lig-nins are quite soluble in alkaline solution as a result of the ionizationof phenolic and carboxyl functional groups.
In this review, we have introduced a new nomenclatureconcerning the chemical state of the lignin, namely, the virgin re-leased lignins (VRLs) and the processed modified lignins (PML).The VRLs are obtained by liberation of lignins by denaturing vege-table matter using chemical hydrolysis and enzymatic hydrolysismethods. Furthermore, we present the case that only the structuresof the VRL types represent a close reflection of the unique nativestructural features present in the covalently attached glycoligninnetwork. This is explained by the fact that the VRL types are not fur-ther transformed into other PML types by any other type of addi-tional extraction (e.g. alkali) or purification procedure. It should beunderstood that when we use the term lignins in plural, it is mainlybecause we have presumed that these oligomers are released indifferent sizes and molecular weights.
Recently, a new term lignome has been introduced in the litera-ture, which is used to include lignin structures biosynthesized andthose obtained following extraction.[57] The term lignome was de-fined by K. Morreel et al. as the ensemble of all phenolics for which

the biosynthesis is co-regulated by lignin polymerization and in-cludes the oligolignol (small lignin polymers) pool.[57]
We wish to advise the reader that the field is too extensive for asingle comprehensive review; hence, we apologize in advance forthe omissions.
Main momentum for lignin research in the 21st century
The development of methods for the conversion of biomass intobiofuels and other high value organic molecules is becoming in-creasingly important because of the efforts to find renewable alter-natives to fossil fuels.[58–60] Because lignins are mainly composed ofaromatic rings, they have the potential to serve as an alternativesource of aromaticmaterials to those derived frompetroleum.[58–60]
Recently, various controlled degradation methods were exploredto convert lignins into smaller molecules, and new catalytic path-ways were sought to remove oxygen excess from these moleculesto increase their energy density and synthetic value.[61] However, amajor challenge that remains is the structural elucidation of thesehigh volume molecules.
Note: Additional information to support this review
Supplementary information pertaining to the methods of extrac-tion of lignins, for the determination of their molecular weightsand for their standard degradations, is available free of charge viathe Internet at http://pubs.jms.org.
Lignin structure determination by conven-tional MS methods using ionization sourcesunder reduced vacuum
Mass spectrometry offers advantages in terms of speed, specificityand sensitivity and has been demonstrated to be a very powerfultechnique in the structural elucidation of lignin. Electron ionizationMS and chemical ionization MS (CI-MS) have been used for thestudy and characterization of derivatized lignol monomer constitu-ents, obtained by either reductive cleavage or by pyrolysis. In thiscase, only the monomeric and, to a small extent, dimeric productshave been identified by comparison of gas chromatographic reten-tion times and mass spectra using authentic samples.[62–65]
In the last few decades, hardly any reviews have been publisheddealing with the application of MS to the structural elucidation ofchemically degraded lignins. These MS methods have dealt withthermal degradation of lignins including the well-known pyrolysismethod, which continues to be a method of choice for many prac-ticing lignin chemists.[66]
Reale et al. have described the use ofMS, equippedwith differentionization sources, for the study of lignin degradation products andthe authors have also attempted to characterize the whole ligninmacromolecule.[47] The different ionization methods described intheir review article cover the following methods: CI-MS; photoioni-zation MS, single-photon ionization MS, molecular beam MS, fast-atom bombardment MS and resonance-enhanced multiphotonionization MS. For this reason, these methods will not be discussedhere, and readers are encouraged to read their article to obtain acomprehensive literature survey on these subjects.[47]
Likewise, the recent development of new ionization techniquessuch as atmospheric pressure ionization, which includeselectrospray ionization (ESI), atmospheric pressure chemical ioniza-tion (APCI) and atmospheric pressure photoionization (APPI)
together with matrix-assisted laser desorption/ionization (MALDI)MS, has provided newpossibilities to analyse lignin oligomers (LOs).
Atmospheric pressure ionization MS methodsas powerful tools for the identification of syn-thetic and degraded lignins
The following section is devoted to the application of MS using softionization methods with a special emphasis on ESI-MS, APCI-MSand APPI-MS and tandem MS (MS/MS) for the elucidation of thechemical structure of synthetic, native (VRL) and modified lignins(PML).
The continued development of liquid chromatography (LC) MStechniques has made possible the analysis of trace amounts ofanalytes from complicated matrices. With LC, the analytes of inter-est can be separated from each other and reliably identified due tothe sensitivity and specificity of MS. Thus, LC-MS has become an ex-ceptional tool for many applications, to include the analysis of pro-teins, pharmaceuticals in biological fluids and toxic substances inenvironmental samples.[67] ESI and APCI have thus far been themost popular interfaces for the coupling of LC with MS.[68] ESI is se-lective for species that exist as ions in solution and species withacidic or basic functionalities capable of donating or stabilizing ex-cess electrolytes (e.g. H+, Na+, Cl�).[68] It has been found that ionabundances can be determined by a competition of solutes forcharge at the surface of an electrospray droplet,[69] resulting inion abundances (peak height) that are not simply a function ofthe analyte concentration. This is the reason why minor constitu-ents with high charge affinity can dominate the ion current. Suchinterferences are known as matrix effects and make it impossibleto calibrate peak height as a function of the dissolved analyte con-centration by ESI-MS.[70] For that reason, quantitative evaluation ofESI-MS data for unknownmixtures such as dissolved organic matterin natural waters is extremely difficult.[71] Another well-known flawof ESI is its high susceptibility to ion suppressions, leading to datainaccuracies, elevated method detection limits, required matrix-matched calibration standards and tedious sample cleanupprocedures.[70,72]
In APCI, the liquid sample is first evaporated and then ionizationof the analytes takes place with a charged plasma formed by usinga corona discharge.[70] APCI may be used to analyse less polaranalytes rather than with ESI; however, completely non-polaranalytes cannot be ionized by either of the two ionizationmethods.
A newer ionization technique, namely the APPI, has been devel-oped, which is complementary to ESI. Definitely, APPI is a very softphotoionization process, which does not cause extensive fragmen-tation of covalent bonds. The ionization process in APPI is insti-gated by a krypton discharge lamp emitting 10-eV photons.These photons ionize compounds, which have ionization energiesbelow 10 eV. Compounds appropriate for this technique can in-clude largermolecules; however, gases and solvents are not ionizedby APPI, which greatly minimize the background interference.Moreover, in contrast to ESI and APCI, APPI ionization of theanalytes depends on the ionization energy rather than their protonaffinity, which results in the ionization of molecules of lowpolarity.[73]
As a result, APPI extends the analytical window for the simulta-neous analysis of nonpolar and polar species.[74] Yet, APPI hasproved to be the one of the best API source for LC-MS analysis ofsmall molecules. Moreover, APPI is much less susceptible to matrixeffects than ESI[75,76] and offers four to five orders of dynamic linear

ranges.[3,4] In addition, APPI requires simplified sample cleanup pro-cedures, less dilution and reanalysis for high-level analytes. Also, itproduces more accurate results and lessens or prevents the needto use matrix-matched calibration standards for quantitativeanalysis.[76,77] When using APPI, it was established that there wasno ion suppression due to charge competition among solutes be-cause both solvents and salts are not ionized. Accordingly, elimina-tion of chemical noise is successful. This latter feature was shown byHockaday et al. to be important in FT-ICR-MS analysis, in which thespace-charge effects greatly influence the sensitivity andresolution.[71] Finally, the APPI ionization source is virtually field-freeresulting in the improvement of the efficiency of ion transport tothe MS inlet.
Atmospheric pressure photoionization MS can be used toanalyse a multitude of different classes of compounds, whichinclude the following: aliphatic lipids,[72,78] isoprenoid lipids,[79]
condensed tannins,[80] hydrophobic peptides, polycyclic aromatichydrocarbons,[77,81–84] pesticides,[85,86] mycotoxins,[85] crude oilfractions[83,87] and lignins.[88–90]
APCI-MS/MS-based sequencing of oligolignols
Recently, a series of VRL oligomers (i.e. dilignols, trilignols andtetralignols) were detected in poplar (Populus spp.), which were ex-tracted with methanol catalyst, and in the PML degraded productsof tobacco (Nicotiana tabacum) xylem, which was extracted by theBjorkman method with 1,4-dioxane :water (96 : 4) (refer to the sup-plementarymaterial), using LC coupled to APCI quadrupole ion trap(QIT) MS.[91–93] Their structures were resolved using mass spectralinformation followed by further authentication by chemicalsynthesis.
To help the systematic characterization of poplar (Populus spp.)lignome, Morreel and coworkers studied the gas-phase fragmenta-tion behaviour of the major dilignol, trilignol and oligolignols con-taining different bonding types using APCI-MS/MS in the negativeion mode with a QIT instrument.[94] They also used high-resolutionESI-FT-ICR-MS (� ion mode) for confirmation of the empirical for-mulae of identified ions. With such advances, the authors were ableto devise a method that allows the sequencing of individual LOsand detection of new units and linkages. Morreel and coworkersidentified 134 oligolignols present in the xylem of poplar (Populustremula and Populus tremuloides), ranging from dimers up tohexamers, and more than half oligomers possessed unknown link-ages types.
The authors described the characteristic collision-induced disso-ciation (CID) MS/MS gas-phase fragmentations of the precursordeprotonated molecules obtained from various LOs containingeach of the main linkage units (i.e. β–O–4′, β–5′ and β–β′) (Fig. 7).
It was observed that the ESI-MS analysis of lignin prefers the neg-ative ion mode, which promotes the formation of an easilydeprotonated molecule. Similarly, CID-MS/MS of the deprotonatedmolecule allows the study of the different gas-phase fragmentationroutes of the precursor ions, which allows the establishing of itschemical structure. Likewise, it is generally accepted that the CID-MS/MS of the protonated molecules obeys the even-electron frag-mentation rules and the dissociation that can occur via either het-erolytic or homolytic cleavage and might involve ion-neutralcomplexes.[95]
Application of MS/MS to the precursor of deprotonatedphenylcoumaran anions obtained from the β-aryl ether [G(t8–O–4′)G] afforded the product ion [M–H–H2O]
�which eliminatedwater
(18 u). This latter product ion loses formaldehyde (48u) to affordthe product ion [M–H–H2O–CH2O]
�.Upon CID-MS/MS of the precursor of deprotonated phenyl-
coumaran anions derived from [G(8–5′)G], elimination of formalde-hyde loss (30u) afforded the product ion assigned as [M–H–H2O–CH2O]
�. This latter product ion lost a water molecule to afford the[M–H–H2O]
� product ion, which was attributed to the primary alco-hol function. An additional loss of formaldehyde (loss of 30u) wasnoted to generate the [M–H–CH2O]
� product ion. It should benoted that as no primary hydroxyl group is present in the case of[G(8–8′)G] resinols, no water loss was observed, although a formal-dehyde loss [M–H–CH2O]
� (�30u) is always present.[96]
Finally, it was shown that the CID-spectra of the precursor anionsisolated from the β-aryl ethers and benzodioxanes were distin-guished by loss of water (18 u) and formaldehyde (30u) and insome cases by the consecutive elimination of both formaldehydeand water (48 u). It should be noted that the authors describedthe first product ion corresponding to the 48-u loss as a major peakin the spectra of β-aryl ethers, but such a peak was hardly visible inspectra of benzodioxanes. In addition, the CID-spectra of resinolsshowed peaks corresponding to the loss of a methyl radical(�15u) and formic acid (46 u).[94]
Furthermore, beside the extremely complex CID-mechanismsdescribed, it is interesting to note that the authors have used nu-clear magnetic resonance (NMR) terminology in attempt to explaintheir MS/MS fragmentations, notably for the presence of a β–5′ link-age unit as evidenced by the presence of a characteristicm/z tripletin the CID-spectrum, whereas any oligomers containing the β–β′linkage unit would be characterized by the resinol m/z quartet. Ina very similar study, the same research group described fully theCID-fragmentations of all the synthetic standard structures thatwere employed.[97]
Nevertheless, when the authors studied the CID-MS/MS of thedeprotonated dimers, they found that the charge-remote fragmen-tations were more widespread than in the positive ionizationmode.[20] Consequently, the authors studied specifically the CIDgas-phase fragmentation pathways of the β–O–4′, β–5′ and β–β′deprotonated dimers as they represented themajor bonding struc-tures encountered in the lignome.[95–99]
It has been well documented in the literature that the charge-driven CID fragmentations are initiated from the most acidic siteof the precursor ion,[98] whereas the charge-remote reactions areactually responsible for the fragmentations, yet the former type willoccur whenever possible.[98,99] As a result, a charge-remote frag-mentation is to be considered only when no charge-driven path-way is possible. Accordingly, Morrell and coworkers presumedthat all of their CID-MS/MS dissociations were initiated by charge-driven mechanisms. These were started by the conversion of thephenoxide anion to a quinone methide, with the simultaneouselimination of the remaining seven-position linked portion.[94] Thislast moiety was eliminated as a neutral fragment, via ananion/neutral complex-mediated proton abstraction, promotingwater loss from the β-aryl ether linkage unit. As well, Morrell and co-workers proposed that phenoxide anions could also trigger a sec-ondary CID pathway, which could be mediated by ananion/neutral complex by a charge remote fragmentation mecha-nism (Fig. 8).[94]
As well, the authors studied also the MS/MS analyses of a largeseries of the following oligolignols, G(tβ–O–4′)G(tβ–O–4′)G, G(tβ–O–4′)S(β–5′)G, S(tβ–O–4′)S(β–5′)G, S(tβ–O–4′)G(β–5′)G, G(tβ–O–4)S(β–5′)G, G(eβ–O–4′)S(β–5′)G, G(tβ–O–4′)S(β–β′)G, G(tβ–O–4′)S(β–β′)S, G(eβ–O–4′)S(β–β′)S and S(tβ–O–4′)S(β–β′)S.[91,94]

Figure 8. CID pathways. Phenoxide anion/quinone methide conversion with charge migration that was shown to induce all charge driven fragmentationpathways of the lignin linkage types A new β-aryl ether-associated pathway II fragmentation was observed upon CID of X(β–β)X-containing trilignols,leading to the formation of the C2 ion at m/z 373. Reproduced with permission from K. Morreel et al. (2010). Copyright 2010 by American Society of PlantBiologists. All rights reserved.
Figure 7. Radical–radical coupling during lignin polymerization. Reproduced with permission from K. Morreel et al. (2010). Copyright 2010 by AmericanSociety of Plant Biologists. All rights reserved.

Figure 9. Dimers of G units showing the three main links. Their characteristic fragmentation patterns are indicated by red lines. (I) The β–O–4′, β-aryl etherlink yields fragment ions A – (m/z 195) and B – (m/z 179). (II) The β–5′, phenylcoumaran link yields fragment ion B – (m/z 221). (III)The β–β′, resinol link yieldsfragment ion A – (m/z 151). Reproduced with permission from E. Kiyota et al. (2012). Copyright 2012 by American Chemical Society. All rights reserved.
It should be noted that the fragmentation schemes describedwere modelled on the MS/MS nomenclature fragmentation ofproteins, oligonucleotides and carbohydrate polymers.[100–105]
However, it is imperative to mention that the product ions identifi-cation system will only work when the analysed lignin derivativepossesses an eight-end aromatic residue and the other terminuspossesses an aliphatic four-end aromatic residue. Unfortunately,this is not the case with the majority of all isolated technical lignins,which have both the eight-end and four-end terminated with aro-matic groups.
As a final point, it is noteworthy to mention that these authorsconjured that they were the first to use MS/MS for lignin sequenc-ing. However, it is of note that APCI-MS, ESI-MS and APPI-MS in con-junctionwith CID-MS/MS for the sequencing and establishing ligninstructures were reported earlier.[9,64,88,106,107]
Ultrahigh-performance liquid chromatography ESI-MS andMS/MS analysis of sugar cane soluble lignin
Kiyota et al. synthesized in vitro the LOs starting from the individualmonomers by a procedure described by de Angelis et al. using twodifferent peroxidase enzymes and three different reactiontimes.[65,108] The reaction conditions were tested to determinewhich would produce the longest chains and greatest variety ofoligomers. Twenty-five compounds were identified, which weremostly dimers, trimers and one tetramer. The retention times ofthese series of compounds were also determined. The resultingcompounds were analysed by ultrahigh-performance liquid chro-matography (UPLC) ESI-MS and CID-MS/MS (negative ion mode).Their work resulted in the structures of 25 identified compoundsbeing determined and used to build a LO data library.[108]
The authors compared the CID-fragmentation pattern of thedeprotonated isobaric dimers G(β–5′)G and G(β–β′)G (m/z 357),and G(β–O–4′)G (m/z 375), to data obtained from the literature.[94]
The CID-MS/MS of the deprotonated molecules of G(β–5′)Glinked dimer afforded a product ion atm/z 221, which is character-istic of the four-aliphatic end (B). The CID-MS/MS of the isobaric
deprotonated G(β–β′)G dimer afforded the product ion of m/z151, which is characteristic of the eight-phenolic end (A).
Obviously, the mass of the G(β–O–4′)G linked dimer increases by18u because the incorporation of a molecule of water and the CID-MS/MS of the deprotonated G(β–O–4′)G molecules gives two diag-nostic product ions at m/z 179 (B) for the four-aliphatic end and atm/z 195 for the eight-phenolic end (A) (Fig. 9).
In contrast, the CID-MS/MS of the S–G dimer deprotonated an-ions followed parallel gas-phase fragmentation comparable to theG–G dimers, except that we notice that the formed product ionshad a difference of 30 u between S and G monomers, which ofcourse was due to the presence of one additional methoxy groupin the S monomer. Therefore, MS/MS of the deprotonated S(β–5′)G linked dimer afforded the product ion at m/z 221, which wascharacteristic for G residue present on the four-aliphatic end. Theprecursor ion scan of the S(β–O–4′)G dimer deprotonated moleculeat m/z 405 afforded the product ion at m/z 225, which indicatedthat the S unit was on the eight-phenolic end.
It is of noteworthy to mention that the deprotonated S(β–β′)S atm/z 417 possesses an 8–8 link, whereas, the S(β–O–4′)S dimer con-tains 18 u more than the S(β–β′)S dimer due to water incorporation.Subsequently, the MS/MS of the deprotonated S(β–β′)S dimer mol-ecule at m/z 435 afforded the product ions at m/z 225 and 209,which were characteristic for this structure.
Kiyota et al. also identified the following deprotonatedmoleculesby comparison of their MS/MS data with those obtained from theliterature: G(β–O–4′)G(β–O–4′)G at m/z 571, G(β–O–4′)S(β–5′)G atm/z 583, S(β–O–4′)G(β–5′)G at m/z 583, S(β–O–4′)S(β–5′)G at m/z613, G(β–O–4′)S(β–β′)S at m/z 613 and S(β–O–4′)S(β–β′)S at m/z643. Consequently, the CID-MS/MS spectra of the trimers affordedproduct ions that were characteristic of the monomers composedof the aromatic part A, whereas the BC product ionswere character-istic of the remaining dimer ions, allowing the elucidation of thecomplete structure. The following are examples of characterizationof trimers performed using MS/MS analysis (Fig. 10).[108]
It is interesting to note that these authors chose not to use thecomplex CID nomenclature proposed byMorreel et al. described insection APCI-MS/MS-based Sequencing of Oligolignols,[94] but

Figure 10. The general structures of the trimers identified by UPLC-MS (R1 = CH3, R2 = H or CH3). The (β–O–4) link present in these structures results infragment ions A monomer plus a molecule of water and the BC dimer. The deprotonated fragment ion BC� mass has the same m/z as the dimerscomposed of S and G. Structure with C fragmentation can only have two β–5 links as there is no increase in the mass of the monomers and fragment ionC is typical of the phenylcoumaran link. Reproduced with permission from E. Kiyota et al. (2012). Copyright 2012 by American Chemical Society. All rightsreserved.
rather, a very simple and comprehensible system. The work ofKiyota et al.[108] illustrated the simplicity of the CID-MS/MS process.
ESI-MS/MS and APCI-MS/MS characterization of lignans iso-lated from sesame seeds
During acidic extraction of glucosylated lignans (sesaminol gluco-sides), hydrolysis occurs to release the aglycones sesamin andsesamolin, which are found in either the oil fraction and/or in thedefatted fraction of sesame seeds.[109–111] It has been demon-strated that the exact lignan composition of sesame seeds changeswith the developmental stage of the seeds.[112–117]
Struijs has shown that the extracted sesaminol glucosides fromthe defatted sesame meal, when purified by chromatography,yielded a series of well-resolved peaks.[118] The identities of this se-ries of separated compounds were confirmed by ESI-MS, APCI-MSand CID-MS/MS.[119]
The ESI-MS (+ ion mode) of sesaminol produced only traces ofthe [M+H]+ protonated molecule. However, when the ESI-MS wasmeasured in the negative ion mode, it afforded appropriately thedeprotonated molecule at m/z 369.1. However, in contrast to thatshown by ESI-MS (+ ion mode), APCI-MS (+ ion mode) affordedthe major protonated molecule [M+H]+ at m/z 371.1 and the frag-ment ions [M+H–H2O]
+ at m/z 353.1.On the other hand, it is interesting to note that when APCI-MS
was used in the negative ion mode, it afforded the abundantdeprotonated molecule [M–H]� at m/z 369.1 identical to that ob-tained by ESI-MS. For this reason, APCI permitted the characteriza-tion of the dibenzylbutadiene lignans containing the hydroxylgroups.[110,111] Similarly, it was shown that the CID-MS/MS fragmen-tations of the precursor deprotonated molecule isolated fromsesaminol were similar when using either APCI-MS or ESI-MS inthe negative ion mode.Moreover, APCI-CID-MS/MS (+ ion mode) of the protonated
molecules [M+H]+ at m/z 371.1 gave the product ions at m/z353.1, 335.1, 323.1, 305.1 and 135.0. On the other hand, CID-MS/MS (� ion mode) of the deprotonated molecules at m/z
369 afforded a series of product ions at m/z, 339.1, 219.1, 191.0and 150.0.[120] The tentative fragmentation pathways forsesaminol in the negative and positive ionization modes are pre-sented in Fig. 11.[105,121,122]
Finally, by using the same methodology, it was alsoestablished that the protonated sesamolin contained themethylenedioxy-bridged furanofuran structure and lacked phe-nolic hydroxyl groups.
APCI-MS/MS and ESI-MS/MS characterization of PML andmodel lignin compounds
Haupert et al. was able to identify the most suitable atmosphericpressure ionization method(s) for the tandem mass spectrometriccharacterization of complex mixtures related to PML degradationproducts. They used a set of lignin-degraded products as modelcompounds, which were subjected to positive and negative ionmode APCI and ESI under traditional as well as novel conditionsusing LQIT-MS.[123] They found that when using APCI-MS (+ ionmode) only guaiacol and eugenol formed an abundance of proton-ated molecules.
However, in contrast, it was found that vanillyl alcohol andconiferyl alcohol formed exclusively the [M +H–H2O]
+ frag-ment ions. The loss of water from these protonated moleculeswas facilitated by virtue of their presence near to allylic andbenzylic hydroxyl locations. This was also rationalized by thefact that after protonation, the precursor protonated moleculeloses water to generate the resonance-stabilized carbocations(Table 1).
Obviously, guaiacol and eugenol do not contain these func-tionalities; however, the dimer, guaiacylglycerol-β-guaiacylether,contains a benzylic hydroxyl group. Consequently, this dimereasily loses water to form the [M+H–H2O]
+ ion. Nevertheless,when using APCI-MS, the two most abundant fragment ionsare [M+H–2H2O]
+ and/or [M+H–H2O–CH2O]+ from formalde-
hyde (Table 1).When the model compounds were studied by traditional neg-
ative mode APCI ionization (methanol and water as solvents),

Figure 11. Proposed fragmentation of sesaminol in the negative ionization mode and in the positive mode. Reproduced with permission from K. Struijs(2008). Copyright 2008 by Wageningen Universiteit, The Netherlands. All rights reserved.
they gave ions with poor abundances. The lack in sensitivity andthe weak observed fragmentation make this a poor ionizationmethod for the characterization of lignin degradationproducts.[123]
Using the model compounds, Haupert et al. have shown that itwas possible to use ESI-MS (+ion mode) doped with sodium chlo-ride, to generate abundant [M+Na]+ sodiated molecules withoutany fragmentation. This approach allowed the direct determinationof the molecular weights of the lignin degradation products inmixtures.[123] However, as expected, no structural information couldbe obtained by examining the CID-MS/MS of the sodiated mole-cules using either triple quadrupole or QIT tandem mass spectro-metric instruments because the sodiated molecules are knownnot to fragment during MS/MS analysis.
When Haupert et al. used ESI-MS (� ion mode) with the dopantsodium hydroxide, they obtained abundant deprotonated mole-cules [M-H]� without any fragmentation. The ESI-MS (� ion mode)of a synthetic mixture is showed in Fig. 12.
The CID-MSn analysis of this series of precursor deprotonatedmolecules established the connectivities between precursor andproduct ions; these were obtained by measuring multiple consecu-tive ion isolation and CID-MSn (up to MS7). This methodology hassince been found to improve significantly the information thatcan be obtained by mass spectrometric analysis for lignin degrada-tion products and lignome (Table 2).[123]
CharacterizationofVRLdegradationproductsbyHPLC-ESI-MSn
Owen et al. developed a high-performance liquid chroma-tography/multiple-stage MS/MS method with a commercial linearQIT/Fourier-transform ion cyclotron resonance mass spectrometer(HPLC-ESI-LQIT-FT-ICR-MSn) as a tool for the analysis of complexmixtures obtained from PML degradation products.[124] In theirstudy, the HPLC separation method of the lignin degradation prod-ucts was followed by ESI-MS analysis doped with NaOH (�ionmode). This methodwas established by Hauper et al. to be themostappropriate for the identification of lignin-related modelcompounds.[123]
Owen et al. showed that for the analysis of artificial and realmixtures, data-dependent scans allow the instrument to selectautomatically the most abundant three ions from the ionsource.[124] This allowed the authors to acquire separate MS ac-quisitions simultaneously for the same ions with two differentmass analysers. Thus, the LQIT-FT-ICR spectrometer operated inthe higher duty-cycle LQIT when performing tandemmass spec-tral acquisitions for precursor ion selection, whereas the lowerduty-cycle FT-ICR carried out the high-resolution measurementsfor elemental composition determination for the same ions.[124]
Accordingly, the most abundant product ion formed in the MS2
experiments, was subjected to a further stage of ion isolationand MS3 fragmentation.[124]

Table1.
Symbols,retentiontim
es,characteristic
massfrag
men
tsandlim
itsof
detectio
nforC
uOoxidationproducts.Rep
roduced
with
permission
from
K.Kaiseretal.(2012).Cop
yright2
012byAmerican
Che
m-
icalSo
ciety.Allrig
htsreserved
Com
pou
nd(M
W)
APC
I(+)(m
/z)
APC
I(�)
(m/z)
ESI(+)(m
/z)
ESI(�)
(m/z)
Relativeab
undan
ceRe
lativeab
undance
Relativeab
undan
ceRelativeab
undance
Guaiacol(124)
[M+H]+(125)100%
Poor
signal
[M+H]+(125)100%
Poor
signal
[M–H]�
(123)100%
[M–H]�
(123)1
00%
Van
illylalcohol
(154)
[M+H–H2O]+(137)100%
Poor
signal
[M+H–H2O]+(137)100%
[M–H]�
(153)1
00%
[M–H]�
(153)100%
Eugen
ol(164)
[M+H]+(125)100%
Poor
signal
NoSignal
Poor
signal
[M–H]�
(163)100%
[M–H]�
(163)1
00%
[M–H–CH3]�
(148)15%
Con
iferylalcoh
ol(180)
[M+H–H2O]+(163)100%
Poor
signal
[M+H–H2O]+(163)100%
[M–H]�
(179)1
00%
[M–H–H2O–H]�
(160)41%
[M–H–H2O]�
(161)31%
[M–H]�
(179)100%
Guaiacylglycerol-β
-guaiacylether
(320)
[M+H–H2O]+(303)40%
Poor
signal
[2M+Na]+(663)15%
Poor
signal
[M+H–2H
2O]+(285)95%
[M–H]�
(319)100%
[M+Na]+(343)100%
[2M–H]�
(639)2
7%
[M+H–H2O–CH2O]+(273)97%
[M–H–H2O–CH2O]�
(271)47%
[M–H]�
(319)1
00%
m/z285-C6H3OCH3(m
/z179)
20%
m/z285-HOC6H2OCH3(m
/z163)
25%
m/z285-HOC6H4OCH3(m
/z161)
20%
m/z273-HOC6H4OCH3(m
/z149)
30%
m/z285-HOC6H3(OCH3)CCH(m
/z137)
16%

Figure 12. Negative mode ESI mass spectrum obtained for an equimolar mixture of guaiacol (MW 124 u), 2-methoxy-4-methylphenol (MW=138 u), vanillin(MW=152 u), vanillyl alcohol (MW= 154 u), eugenol (MW= 164 u), isoeugenol (MW=164 u), 2-methoxy-4-propylphenol (MW=166 u), coniferyl alcohol(MW=180 u), sinapyl alcohol (MW=210 u), guaiacylglycerol-β-guaiacylether (MW=320 u) and guaiacylglycerol-β-syringylether (MW=350 u) dissolved in50/50 (v/v) methanol/water and doped with sodium hydroxide. Reproduced with permission from L. J. Haupert et al. (2012). Copyright 2012 by Elsevier.All rights reserved.
The authors used degradation products, pure standard solutionsas well as a mixture of 12 model compounds of lignin degradationproducts (Table 3), which were separated by reversed-phase HPLCusing an acetonitrile and water gradient elution followed by high-resolution MS3 analysis. The authors used three different HPLC col-umns to separate a mixture of 12 lignin-related model compounds.Usingwater and acetonitrile gradient bufferedwith ammonium for-mate, full baseline separation was attained for all components ofthe mixture using both the Zorbax SB-C18 and Zorbax SB-Phenylcolumns. It was noted that a poorer separation was attained usingKinetex PFP column.[124]
All of themodel compounds studied exclusively by ESI-MS (� ionmode) gave the abundant deprotonated ion [M–H]�. Furthermore,the authors have shown that MS/MS analysis of all model com-pounds containing methoxyl groups attached to the aromatic ringwere initiated via a homolytic cleavage, by the loss of a methyl rad-ical. Additionally, all ions containing allylic or benzylic hydroxylgroups (vanillyl alcohol, coniferyl alcohol, and sinapyl alcohol)fragmented primarily by loss of a water radical.[124] In addition,the authors indicated that the deprotonated guaiacylglycerol-β-guaiacyl ether was shown to mainly lose water followed by loss offormaldehyde.[96]
To explore whether additional structural information could beobtained, the authors performed CID-MS3 experiments on themostabundant product ion formed in the MS2 experiment. For someions that lack a weakly bound group, no further fragmentationwereobserved. However, most of the secondary product ionsfragmented to yield structurally informative product ions in theMS2 experiments, demonstrating that multiple-stage MS/MS is use-ful in the structural characterization of unknown lignin degradationproducts.
Owen et al. showed that the deprotonated sinapyl alcohol con-taining two methoxyl groups could lose sequentially one methylradical in the MS2 experiment followed by another methyl radicalin the MS3 experiment. These losses permitted the counting of
the methoxyl substituents in the analyte. In the MS2 experimentof the deprotonated 2-methoxyl-4-propylphenol, the product ionformed by loss of the methyl radical was further subjected toMS3. Very interestingly, this product ion fragmented by eliminatingan ethyl radical by homolytic cleavage of the benzylic bond, to re-veal the presence of a propyl substituent.[124] An analogous ben-zylic bond cleavage was also observed for deprotonated eugenol.The MS2 of deprotonated eugenol afforded a product ion by lossof the methyl radical. MS3 of this product ion was subjected tothe consecutive cleavage of the benzylic carbon–hydrogen bondand loss of a hydrogen atom. In contrast, MS2 of the deprotonatedisoeugenol lost a methyl radical to afford a product ion that, whensubjected to an MS3 experiment, did not fragment any further be-cause it lacked a weakly bound substituent. This difference in thesetwo MS3 fragmentations allowed the differentiation between thesestructural isomers.[124]
In addition, the authors successfully separated by HPLC, the dia-stereomeric pair (RS/SR and RR/SS) of guaiacylglycerol-β-syringylethers. These were shown to yield the same CID-fragmentationproduct ions from the deprotonated diastereomeric pairs.
To assess the ability of this method to identify unknown compo-nents, a VRL organosolv oak lignin extract was analysed by HPLC-ESI-MS. Though the organosolv lignin sample is a very complexmix-ture, the HPLC was able to separate many analytes, including iso-baric and isomeric molecules.[124]
ESI-MS study of PML Kraft black liquor
Pinto et al. attempted to characterize the lignin structural changesduring Kraft pulping (PML), using 1H-NMR and 13C-NMR techniquesand to estimate the changes in the lignin molecular weight usingESI-MS and gel permeation chromatography (GPC).[125,126] The au-thors used four Kraft cooking processes that were designated asrepresentative of the different delignification phases as follows: ini-tial cooking (19.0% delignification), initial-to-bulk transition cooking

Table
2.CID-M
Snan
alysisforsomeof
theneg
ativeionslistedin
Fig.25.Reproduced
with
permission
from
L.J.Haupertet
al.(2012).Cop
yright2012
byElsevier.A
llrig
htsreserved
Com
pou
nd(m
/zof
[M–H]�)
MS2
frag
men
tatio
ns
(productions’m/z)
relativeab
undan
ce
MS3
frag
men
tatio
ns(productions’m/z)
relativeab
undan
ce
MS4
frag
men
tatio
ns
(productions’m/z)
relativeab
undance
MS5
frag
men
tatio
ns
(productions’m/z)
relativeab
undan
ce
MS6
frag
men
tatio
ns(productions’m/z)
relativeab
undan
ce
MS7
frag
men
tatio
ns
(productions’m/z)
relativeab
undan
ce
Van
illylalcoho
l(153)
153�CH3(138)52%
138�H2O(120)100%
120+H2O(138)20%
Nofurther
fragmen
tatio
nob
served
153�H2O(135)100%
135�CH3(120)100%
120�CO(92)
100%
120�CO(92)
100%
Eugen
ol(163)
163�CH3(148)100%
148�H(147)100%
Nofurther
fragmen
tatio
nob
served
Isoe
ugen
ol(163)
163�CH3(148)100%
Nofurther
frag
men
tatio
nob
served
Sinap
ylalcohol
(209)
209�CH3(194)100%
194�CH3(179)100%
179�CO(151)100%
151�H2O(133)100%
209�H2O(191)35%
191�CH3(176)100%
176�CH3(161)100%
151�CH2O(121)100%
121�CO(93)
100%
105�CO(77)
100%
209�H2O–CH3(176)12%
176�CH3(161)100%
161�CO(133)100%
161�CO(133)100%
133�CO(105)100%
161–2C
O(105)75%
133�CO(105)100%
133�2C
O(77)
47%
133�2C
O(77)
19%
105�CO(77)
100%

Table 3. Twelve model compounds of lignin degradation products. Reproduced with the permission of B. C. Owen et al. (2012) Copyright 2012 byAmerican Chemical Society. All rights reserved
Model compound (m/z of [M–H]+ ; determined elemental composition) Measured exact m/z (error in ±mTh from the expected exact mass)
[A] Guaiacol (123; C7H7O2) 123.0458 (1.2)
[B] 2-Methoxy-4-methylphenol (137;C8H9O2) 137.0615 (1.3)
[C] Vanillin (151; C8H7O3) 151.0408 (1.3)
[D] Vanillyl alcohol (153; C8H9O3) 153.0564 (1.2)
[E] Eugenol (163; C10H11O2) 163.0771 (1.2)
[F] Isoeugenol (163; C10H11O2) 163.0771 (1.2)
[G] 2-Methoxy-4-propylphenol (165; C10H13O2) 165.0927 (1.2)
[H] Coniferyl alcohol (179; C10H11O3) 179.0717 (0.9)
[I] Sinapyl alcohol (209; C11H13O4) 209.0819 (0.5)
[J] Guaiacylglycerol-β-guaicylether (319; C17H19O6) 319.1186 (0.4)
[K + L] Guaiacylglycerol-β-syringylether stereoisomers (349; C18H21O7) 349.1292 (0.5)
Figure 13. Negative mode ESI-MS spectrum of BL (A), BLp (B) and BLs (C)isolated from black liquor after 94.4% delignification of eucalypt wood.Reproduced with the permission of P. C. Pinto et al. (2002). Copyright 2002by Marcel Dekker, Inc. All rights reserved.
(40.0% delignification), bulk cooking (76.0% delignification) and re-sidual phases cooking (94.4% delignification). The dioxane ligninisolated from E. globulus (referred as EDL) represented the ligninin the starting wood material (0% delignification).[125,126]
Accordingly, Pinto et al. reported the ESI-MS spectrum of Kraftblack liquor lignin (BL) obtained from the residual phase ofdelignification and showed the presence of both lower and higherm/z ions, which were attributed to lignin oligomeric substructureions containing fragments bounded by oligosaccharides.[126]
To estimate the molecular weights of components in the cookedKraft BL, the obtained residue was purified by selective precipita-tion in dioxane to yield two fractions: BLp (about 70% yield, sugarscontent 1.5%) and BLs (about 30% yield, sugars content 18.9%). TheBLp fraction showed an ESI-MS containing lower ions around m/z800, whereas the BLs fraction showed anMSwith a highermass dis-tribution at m/z 1100. Such a difference is probably due to the BLfraction containing lignin residues attached to oligosaccharides(Fig. 13).
The expansion of the MS of BL showed series of fragment ionscorresponding to LOs having m/z differences of 202–206u, whichis the approximate molecular mass of the phenylpropane unit (C-9) (Fig. 14). In addition, Pinto et al. observed that the additionalion at m/z 339 was assigned respectively to a disaccharide com-posed of 4-O-methyl-D-glucuronic acid and D-xylose residues(GlcpA→Xylp). This disaccharide was previously detected in thecomposition of E. globulus xylan.[125]
Nonetheless, it is noteworthy that the authors actually deduced alowmass distribution value for such a complex ESI-MS. The absenceof higher masses was a consequence of the presence of the lignindegradation products formed by this complex mixture of LOs.
Elucidation of the PML Eucalyptus globulus Labill lignins byESI-MS
Evtuguin et al. studied the chemical structure of PML isolated fromEucalyptus globulus Labill.[106,127]
The authors found that the Eucalyptus globulus lignins fractionwas mainly composed of S/G lignols with an extremely high pro-portion of syringyl (S) units (82–86mol %) and a minor proportionof p-hydrophenyl propane (H) units (roughly 2–3mol %). They alsodescribed the presence of unknown C-6 substituted and β–O–5′type syringyl substructures representing about 65% of lignin con-densed structures. ESI-MS analysis revealed a wide molecularweight distribution within the lignin with a mass distributionaround 2500u.[106]
In a different study, Evtuguin and Amado attempted to study thestructures of PML E. globulus lignins and its low molecular weightfraction (EDLF), by ESI-MS and CID-MS/MS using a quadrupoletime-of-flight (QTOF) MS instrument.[107] In this study each of thelignin components were isolated by means of GPC as describedpreviously by the same group.[106] In addition, for the qualitative
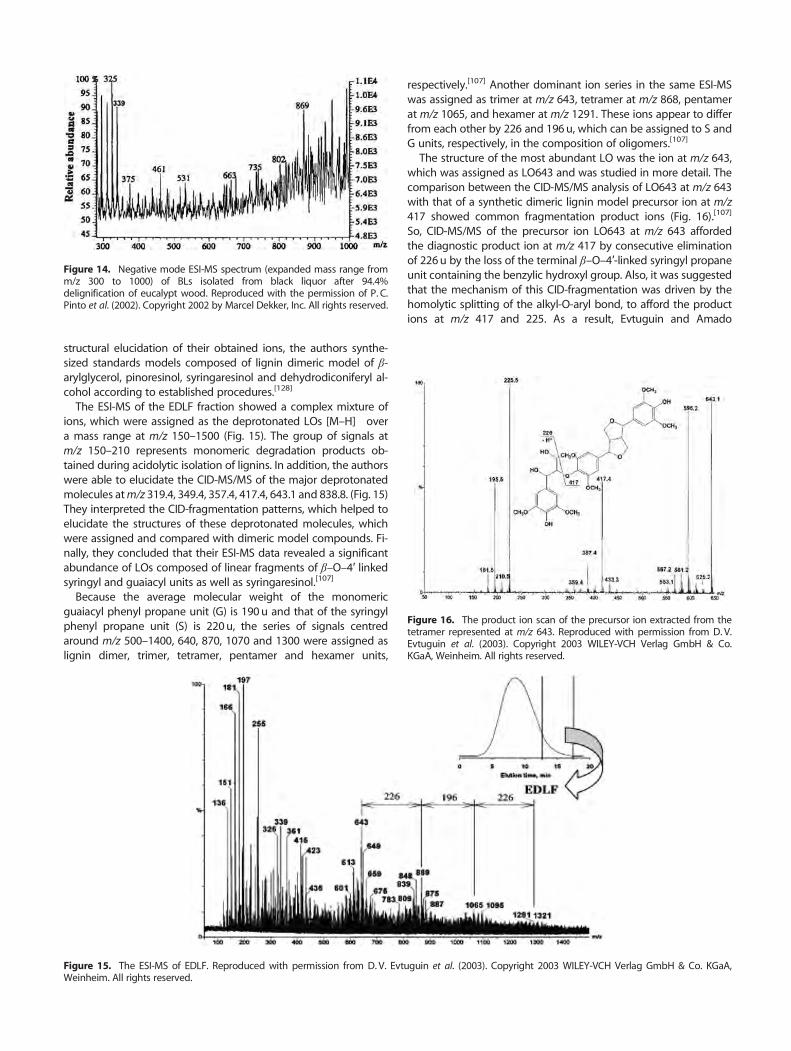
Figure 14. Negative mode ESI-MS spectrum (expanded mass range fromm/z 300 to 1000) of BLs isolated from black liquor after 94.4%delignification of eucalypt wood. Reproduced with the permission of P. C.Pinto et al. (2002). Copyright 2002 by Marcel Dekker, Inc. All rights reserved.
Figure 16. The product ion scan of the precursor ion extracted from thetetramer represented at m/z 643. Reproduced with permission from D. V.Evtuguin et al. (2003). Copyright 2003 WILEY-VCH Verlag GmbH & Co.KGaA, Weinheim. All rights reserved.
structural elucidation of their obtained ions, the authors synthe-sized standards models composed of lignin dimeric model of β-arylglycerol, pinoresinol, syringaresinol and dehydrodiconiferyl al-cohol according to established procedures.[128]
The ESI-MS of the EDLF fraction showed a complex mixture ofions, which were assigned as the deprotonated LOs [M–H]� overa mass range at m/z 150–1500 (Fig. 15). The group of signals atm/z 150–210 represents monomeric degradation products ob-tained during acidolytic isolation of lignins. In addition, the authorswere able to elucidate the CID-MS/MS of the major deprotonatedmolecules atm/z 319.4, 349.4, 357.4, 417.4, 643.1 and 838.8. (Fig. 15)They interpreted the CID-fragmentation patterns, which helped toelucidate the structures of these deprotonated molecules, whichwere assigned and compared with dimeric model compounds. Fi-nally, they concluded that their ESI-MS data revealed a significantabundance of LOs composed of linear fragments of β–O–4′ linkedsyringyl and guaiacyl units as well as syringaresinol.[107]
Because the average molecular weight of the monomericguaiacyl phenyl propane unit (G) is 190u and that of the syringylphenyl propane unit (S) is 220u, the series of signals centredaround m/z 500–1400, 640, 870, 1070 and 1300 were assigned aslignin dimer, trimer, tetramer, pentamer and hexamer units,
Figure 15. The ESI-MS of EDLF. Reproduced with permission from D. V. EvtWeinheim. All rights reserved.
respectively.[107] Another dominant ion series in the same ESI-MSwas assigned as trimer at m/z 643, tetramer at m/z 868, pentamerat m/z 1065, and hexamer at m/z 1291. These ions appear to differfrom each other by 226 and 196u, which can be assigned to S andG units, respectively, in the composition of oligomers.[107]
The structure of the most abundant LO was the ion at m/z 643,which was assigned as LO643 and was studied in more detail. Thecomparison between the CID-MS/MS analysis of LO643 at m/z 643with that of a synthetic dimeric lignin model precursor ion at m/z417 showed common fragmentation product ions (Fig. 16).[107]
So, CID-MS/MS of the precursor ion LO643 at m/z 643 affordedthe diagnostic product ion at m/z 417 by consecutive eliminationof 226u by the loss of the terminal β–O–4′-linked syringyl propaneunit containing the benzylic hydroxyl group. Also, it was suggestedthat the mechanism of this CID-fragmentation was driven by thehomolytic splitting of the alkyl-O-aryl bond, to afford the productions at m/z 417 and 225. As a result, Evtuguin and Amado
uguin et al. (2003). Copyright 2003 WILEY-VCH Verlag GmbH & Co. KGaA,

concluded that the structure of LO643 was a trimer β–O–4-linked Sunit with syringaresinol [S–(β–O–4′)–S–(β–β′)–S] (Fig. 16).[107]
The same approach was used to elucidate the ion at m/z 839,which was attributed to mixture of isobaric tetramer composed ofG–(β–O–4′)–S–(β–O–4′)–S–(β–β′)–S and S–(β–O–4′)–S–(β–O–4′)–S–(β–β′)–G. The CID-MS/MS of the precursor deprotonated moleculeat m/z 839 showed the presence of two product ions at m/z 643and m/z 613, and the authors concluded that such an assignmentconfirmed both structures assigned to this isobaric ion at m/z 839(Fig. 17).[107]
Similarly, CID-MS/MS of the ion at m/z 1065 was tentativelyassigned to two alternative structures: S–(β–O–4′)–S–(β–O–4′)–S–
Figure 17. The product ion scan of the precursor ion extracted from thetetramer represented at m/z 839. Reproduced with permission from D. V.Evtuguin et al. (2003). Copyright 2003 WILEY-VCH Verlag GmbH & Co.KGaA, Weinheim. All rights reserved.
Figure 18. The CID-fragmentation pattern of the thioacidolysed acetylated pin(2003). Copyright 2003 by Walter de Gruyter GmbH & Co. KG. All rights reserved
(β–β′)–S–(β–O–4′)–G and G–(β–O–4′)–S–(β–O–4′)–S–(β–O–4′)–S–(β–β′)–S.
In addition, the authors have shown that CID-MS/MS analysis ofthe ions obtained from lignin dimers (particularly 8–O–4′, 8–8′ and8–5′ linked), formed diagnostic product ions from which the spe-cific gas-phase fragmentation patterns can be deduced.
In conclusion, the authors proposed that CID-MS/MS frag-mentation of the precursor ion of LOs occured predominantlyby the cleavage of ether linkages. They also proposed thatsuch fundamental information about lignin primary structurewould form a sound basis to enable new structure elucidationstudies to be made more reliably and rapidly by employingESI-MS.
ESI-FT-ICR-MSn structural analysis of PML thioacidolysisdegradation lignin products
Onnerud et al. investigated the structures of the pinoresinolthioacidolysis degradation products by ESI-FT-ICR-MSn from ligninmodel compounds and PML wood lignin.[129]
The authors used the thioacidolytsis (BF3/C2H5SH) treatment forthe degradation of pinoresinol and PML, which resulted in the con-version of uncondensed monomeric units in lignin into simple dia-stereomeric mixtures of 1,2,3-trithioethane phenylpropanoidmonomers.[130]
The authors mentioned that two major peaks were detected forthioacidolysed MWL, and these were identical when comparedwith the thioacidolysed pinoresinol and acetylated pinoresinol.Thioacidolysis is known to produce a large fraction of the mono-meric C-6–C-3′ adduct containing three thioethyl groups in the sidechain as the major component.[130]
The authors used ESI in both positive and negative ionizationmodes for the identification of the obtained products. In
oresinol atm/z 531.19. Reproduced with permission from H. Onnerud et al..

Figure 19. The CID-fragmentation pattern of thioacidolysed pinoresinol 1 without acetylation. Reproduced with permission from H. Onnerud et al. (2003).Copyright 2003 by Walter de Gruyter GmbH & Co. KG. All rights reserved.
Figure 20. ESI-FT-ICR-MS (+ ion mode) of the total thioacidolysis extract ofMWL. Reproduced with permission from H. Onnerud et al. (2003). Copyright2003 by Walter de Gruyter GmbH & Co. KG. All rights reserved.
addition, they used tandem MSn to elucidate the structure ofthioacidolysed pinoresinol before and after acetylating theproducts.The ESI-MS (+ ion mode) of the thioacidolysed acetylated
pinoresinol and the thioacidolysed pinoresinol did not afford theexpected protonated molecules but instead produced thepseudo-molecular ions obtained by elimination of the ethane thiolCH3CH2SH (�62u) assigned as the acetylated dithioether [MAc–
SCH2CH3]+ and the non-acetylated dithioether [M–SCH2CH3]
+, re-spectively, at m/z 531.19 and m/z 447.17.[129]
The acetylated dithioether [MAc–SCH2CH3]+ precursor ion at m/z
531.19 was analysed by CID-MS/MS, which showed two majorproduct ions atm/z 469.17 and 427.17 that were attributed respec-tively to the loss of the second CH3CH2SH group and a molecule ofketene. Consequently, these two product ions were assigned as[MAc–CH3CH2S–CH3CH2SH]
+ at m/z 469.17 and [MAc–SCH2CH3–
CH2CO]+ at m/z 427.17, respectively. The latter product ion at m/z
427.16 also eliminated individually a molecule of formaldehydeand thioethanol to afford respectively the ions at m/z 385.15 and365.14 (Fig. 18).In contrast, MS/MS of the non-acetylated thioacidolysed precur-
sor ion atm/z 447.17 afforded only two product ions [M–SCH2CH3]+
and [M–SCH2CH3–HSCH2CH3]+, respectively, at m/z 385.15 and
323.13 (Fig. 19).[129]
On the other hand, it is important to note that the overall perfor-mance of the ESI-FT-ICR-MS of lignin did not provide unambiguousinformation about the detailed structure of the milled wood ligningiven that many of the expected degradation products could notbe identified.[129]
In reality, when Onnerud et al. used FT-ICR-MS (+ ion mode) toanalyse the total thioacidolysis extract of PML wood lignin, they ob-tained a very heterogeneous MS composed of a multitude of ligninions up to about 1500 u, including a high abundance ion at m/z791.28. The authors suggested that the assignment of this seriesof specific ions was complex. In addition, they indicated that theion atm/z 791.28 was the most abundant ion (base peak) and diffi-cult to assign. Indeed, CID-MS/MS analysis of this precursor ion didnot yield any product ions under any CID conditions used. The au-thors indicated that this CID-MS/MS resilience of the precursor ionat m/z 791.28 was due to its very stable structure. Nevertheless,the authors indicated that the position of the thioethyl groups
found in this precursor ion was most probably different to that ob-tained from the thioacidolysed pinoresinol.[129]
From the relative abundances of the different isotope peaks,Onnerud et al. calculated that the second isotopic peak (third peak)containing 34S, [M–
34SCH2CH3]+, atm/z 793.28 was 0.278 compared
with the base peak, the monoisotopic [M–32SCH2CH3]
+ at m/z791.28. (Fig. 20) This value was compared with a theoretical valueof the isotopic ion distribution measured using computer software,and it provided the number of sulfur atoms in the compound. Forthat reason, the molecular formula was calculated to beC43H51O8S3. The authors also calculated the double-bond equiva-lent (DBE) value for this molecular formula, which was found tobe 18.5. This DBE value corresponded to a tetrameric structure con-taining four aromatic rings (that is 16 DBE), two double bonds (2DBE) and the + charge (0.5 DBE). Accordingly, the authors calcu-lated that the theoreticalm/z would be 791.27. Onnerud et al. con-cluded that the non-acetylated thioacidolysed PML C43H51O8S3 atm/z 791.28 was a tetramer consisting of two coniferyl alcohol units,connected through a β–O–4′ bond, with further links through a β–β′and β–1′ structure (Fig. 20).[129]

Figure 21. SRFA, positive-ion ESI-FTICR broadband mass spectrum,calibrated from a PEG 600 internal standard (1500 coadds). Reproducedwith permission from A. C. Stenson et al. (2003). Copyright 2003 byAmerican Chemical Society. All rights reserved.
ESI-FT-ICR-MS analysis of the degradation lignin products fromfulvic acids
Dissolved organic matter is a class of compounds composed ofdegradation and condensation products of naturally occurring bio-molecules such as humic acids, fulvic acids and industrial degradedmodified lignin.[89] The complexity and diversity of the variousproduct mixtures in dissolved organic matter do not allow separa-tion of a single component molecule by liquid-phase separationtechniques.[115] Nevertheless, Kujawinski et al. have shown that itwas possible to volatilize humics with soft ionization techniquessuch as MALDI and ESI.[90]
Stenson, Marshall and Cooper assigned the molecular formulasfor 4626 individual Suwannee River fulvic acids. The described as-signments were based on accurate mass measurements from ionsgenerated by ultrahigh-resolution ESI-FT-ICR-MS.[89,90] The formulaassignments were made possible based on the mass accuracy ofFT-ICR-MS at high field (9.4 T) and the regular mass spacing patternsfound in fulvic acid mixtures.[89,90] The authors sorted their ob-served 4626 ions individually according to the Kendrickmass defect
Figure 22. Schematic representation of common lignin biodegradation pathw2003 by American Chemical Society. All rights reserved.
and the nominal mass series (z* score), which permitted that allcould be assigned to 1 of 266 distinct homologous series that differin oxygen content and double-bond equivalence.[90,131]
As well, Stenson, Marshall and Cooper performed MS/MSusing infrared multiphoton dissociation for the identification ofthe fulvic acid molecules. Accordingly, these chemical formulasprovided plausible structures to be proposed that were consis-tent with degraded lignin as a source of Suwannee River fulvicacids.[89,90]
The lignin-based character of Suwannee river fulvic acids was fur-ther corroborated by the identification of predicted lignin degrada-tion products.[89,90] It is important to note that the authorsconcluded that QTOF-MS (moderate resolution) and double-focusing mass spectrometers are not able to fully resolve individualhumic ions.[90,132] They also indicated that it was the virtual absenceof nitrogen in humic/fulvic acids that until now has preventedmass-based identification of these constituents.[89,90]
To indicate the complexity and difficulties inmeasuring ESI-MS ofdegraded lignin (PML), the positive-ion ESI-FT-ICR broadband massspectrum of Suwannee river fulvic acids showed that it containedmore than 9800 peaks (Fig. 21).
With the use of ESI-MS, it was also found that all ions were singlycharged, on the basis of the absence of peaks at intervals of(1.0034/z) higher in mass than the monoisotopic ion.[90,132,133] Veryimportantly, Stenson, Marshall and Cooper specified that the de-graded lignin was the major constituents of Suwannee river fulvicacids. Accordingly, the assigned formulas and observed mass pat-terns obtained by ESI-MS were therefore assessed for uniformitywith the expected formula for the degraded lignin.[89] The mostcommon lignin degradation pathways include depolymerization,demethylation, side-chain oxidation and aromatic ring cleavage(Fig. 22).
The authors showed that for any starting material, the degradedlignins was a complex mixture of molecules, consisting of C, H andO that differ in degrees of saturation. Also, it was proposed that dif-ferent lignin degraded products could possess differences in bond-ing patterns, types of degradation pathways, number of CH2 groupsand O atoms.[90,132]
ays. Reproduced with permission from A. C. Stenson et al. (2003). Copyright

Finally, the lignin-based character of Suwannee river fulvicacids was corroborated by detecting the expected lignin degra-dation products. It was also found that lignin degradation usu-ally involves ring cleavage, resulting from the concurrentaddition of two oxygen atoms to the chemical formula. There-fore, formulas differing by O2 (e.g. one aromatic ring cleavage)and CH4 versus O2 (e.g. one aromatic ring cleavage after one de-methylation and one side-chain oxidation) should be presentamong the assigned formulas.
LC-ESI-QIT-MSn and FT-ICR-MSn analyses of medicinal lignans
Huang and coworkers presented the ESI-MS analyses of a series oflignans known as schisandrin, schisantherin A, deoxyschisandrinand schisandrin B lignan and other reference compounds by LC-ESI-QIT-MSn and high mass resolution MS experiments performedwith an 7.0 T FT-ICR-MSn (+ ion mode). The chemical structuresschisandrin, schisantherin A, deoxyschisandrin and schisandrin Blignan are shown in Fig. 23.[134] Huang et al. compared the retentiontime, UV spectra and ESI-MSn data of the analysed compounds, withdata obtained by the reference compounds and the literature. Inthe study, a total of 16 lignan constituents were unambiguouslyidentified and characterized.The precise masses measured by FT-ICR-MS of the protonated
molecules of schisandrin at m/z 400.18922, schisantherin at m/z371.14988, deoxyschisandrin at m/z 402.29431 and schisandrin B
Table 4. Lignan compounds in S. chinensis (Turcz.) Baill. fruits. Reproduced wSons, Inc. All rights reserved
Name Proposed formula Observed mass (Da) Calc
Schisandrin C23H28O6+ 400.18922
C23H28O5+· 384.19411
C21H25O6+ 373.16563
C20H23O6+ 359.14997
Schisantherin A C21H23O6+ 371.14998
C23H25O6+ 397.16573
C22H25O6+ 385.16568
C20H21O7+ 373.12931
C19H23O6+ 347.14945
C18H20O5+· 316.13102
Deoxyschisandrin C23H30O6+· 402.20431
C22H26O5+ 370.17805
C23H30O5+· 386.20938
C18H19O6+ 331.11809
C17H16O5+· 300.09968
Schisandrin B C22H26O6+· 386.17295
C22H27O5+ 371.18579
C22H26O5+· 370.17798
Figure 23. Lignan compounds in S. chinensis (Turcz.) Baill. Fruits. Reproduced wSons, Inc. All rights reserved.
at m/z 386.17295 and all other associated lignans are shown inTable 4. Such were used to identify lignan constituents isolatedfrom a methanol extract of the S. chinensis (Turcz.) Baill.[134]
The ESI-QIT-MS of schisandrin afforded the protonated moleculeat m/z 433.2 and only one fragment ion assigned as [M+H–H2O]+
at m/z 415.1.For simplicity purposes, only the multistage CID-MSn fragmenta-
tion routes are shown of the protonated molecule of schisandrin[M+H]+ at m/z 415.1, which can be used as as a general modelfor the identification of unkown lignans. The various multistageCID-MSn fragmentation routes are self-explanatory and are indi-cated in Scheme 1. This strategy formed the basis for the authorsto successfully identify a series of 16 lignan compounds in themethanol extract of S. Chinensis (Turcz.).[134]
De novo lignomics
In lignomics research, no explicit sequencing methods exist to es-tablish the primary structure of complex and simple oligomers. Re-searchers are required to synthesize authentic compounds asstandards to enable verification and comparison with the MS/MSscheme obtained by an unknown compound. It is well acknowl-edged that lignin polymer and/or oligomer are one of the last bio-polymers to defy attempts to determine their full sequences andstructures. Nevertheless, shorter oligomers of lignin can be ex-tremely useful in providing the blueprints on how the full lignin
ith permission from X. Huang et al. (2007). Copyright 2007 by John Wiley &
ulated mass (Da) DBE Error (ppm) Proposed neutral loss
400.18804 10.0 2.9 CH3
384.19313 10.0 2.6 CH3O
373.16457 9.5 2.8 C3H6
359.14892 9.5 2.9 C4H8
371.14892 10.5 2.9 C2H4O
397.16457 11.5 2.9 H2O
385.16457 10.5 2.9 CH2O
373.12818 10.5 3.0 C3H6
347.14892 8.5 1.5 C5H10
316.13053 9.0 1.5 C6H13O
402.20369 9.0 1.5 CH3
370.17748 9.5 1.5 C2H7O
386.20878 9.0 1.6 CH3O
331.11762 9.5 1.4 C5H10
300.09923 10.0 1.5 C6H13O
386.17239 10.0 1.5 CH3
371.18530 9.5 1.3 CH2O
370.17748 10.0 1.4 CH3O
ith permission from X. Huang et al. (2007). Copyright 2007 by John Wiley &

Scheme 1. ProposedMSn fragmentation pathway of schisantherin A. Reproduced with permission fromX. Huang et al. (2007). Copyright 2007 by JohnWiley& Sons, Inc. All rights reserved.
polymer is constructed. Limited structure elucidation of oligomershave been obtained following dehydrogenative polymerizationstudies.[135] However, such experiments fall short of being able todeduce the structure of lignin because it can vary among cell typesand individual CW layers.[136]
On the basis of the limited information from traditional methodsand the complexity of lignin, new sequencing methods are likely toreveal novel oligolignol structures that do not concur with the currentknowledge of lignin structures.[52,53] Clearly, there is need for develop-ing new and reliable sequencing methods for tackling the significantchallenge of lignin structure determination. For this reason, the pow-erful technique of tandem mass spectrometric analysis has been ex-plored for both VRL and PML. Indeed, MS/MS has been efficientlyused to sequence native VRL, PML and the lignome.[9,88,94,108,123,124]
Contrary to lignomics, proteomics has had the advantage of theavailability of gene and genome sequence databases. In additionMS-based proteomicswas initiated as a result of the technical and con-ceptual advances of protein ionization methods such as ESI-MS andMALDI-MS, which led to the 2002 Nobel Prize in chemistry.[137–139] Incomparison, the use of MS/MS in the lignomics field is a relativelynew field, which will very likely surpass the conventional and rou-tine use of Py-GC-MS. Therefore, until recent times, the study oflignomics has lacked versatile MS/MS sequencing approaches.
In this review, by analogy with proteomics, a new concept oftop–down lignomic strategy employing MS/MS will be introduced.Herein, the top–down lignomic strategy is described as the identi-fication byMS of the native extracted lignins (VRL) obtained directlyfrom the destructuring of the vegetable matter. Therefore, thestructural characterization, identification and the sequence of thelignin will be performed by MS/MS experiments. This will hopefullypermit the identification of all the components of the intact non-modified virgin lignins (VRL) being analysed. Moreover, the top–down approach enables direct measurement of the intact mass of
the heterogeneous LOs, as well as fragment ions information relat-ing to the original oligomer lignin sequences.
Regrettably and in contrast, the bottom up lignomic strategyconcept is not possible because the resulting lignins are already de-graded, without any further chemical manipulations because oftheir excessive chemical handlings in an attempt to purify them.For example, if an extracted lignin was treated with alkali, heatedfor a long time and then modified by chemical manipulations, it isobvious that some crucial structural information will be lost.
Accordingly, using the bottom–up lignomic strategy will result inthe identification and sequencing of degraded products alone,which do not represent native VRL. Nevertheless, there is a large se-ries of synthetic standards that exist to enable MS/MS comparisonwith most of the common types of PML (modified degraded) lignincomponents.[91,94,96]
Lastly, it is important to note that contrary to Py-GC-EI-MS, theMS analyses of VRL by ESI-MS, APCI-MS and APPI-MS afford a largenumber of ions that usually lead to complex spectra that are chal-lenging to interpret. This will be discussed in the following sections.
De novo top–down sequencing of VRL wheat straw lignin byAPPI-QqTOF-MS/MS
Atmospheric pressure photoionization MS has proven to be a pow-erful analytical tool capable of ionizing small to large LOs. The APPImass spectra of the wheat straw lignin dissolved in a mixture ofchloroform-methanol (3 : 1) extracted by the CompagnieIndustrielle de la Matière Végétale (CIMV) process were recordedin the positive and negative ion modes with a QqTOF-MS/MS hy-brid instrument, using toluene as a dopant.[88] It is important tomention that very significantly, ESI-MS and APPI-QqTOF-MS mea-surements of the wheat straw afforded identical spectra.

Figure 24. APPI-QqTOF-MS of thewheat straw ligninswere recorded in the positive ionmodewith scan ranges ofm/z 300–700with a DP = 60 V (A) and a DPof 100 V (B).
Banoub and Delmas have investigated the de novo sequencingof the VRL wheat straw lignin using the top–down approach.APPI-MS of technical wheat straw lignin was recorded in the positiveionmode with scan ranges ofm/z 300–700 andm/z 500–900, with aDP=60V (A) and a declustering potential (DP) of 100V (B) (Fig. 24).
Scheme 2. Tentative breakdown processes in the MS/MS of the protonated phpermission of J. H. Banoub et al. (2007) Copyright 2007 by John Wiley & Sons, L
Interestingly, the positive ion mode APPI-MS allowed us to tenta-tively propose structures for the 39 specific oligomeric ions,whereas negative ion APPI-MS allowed the identification of an ad-ditional presence of at least 18 specific oligomeric ions.[88] Yet, itwas noted that some oligomeric ion species photoionized in both
enylcoumaran derivative 4 [C19H19O6]+ atm/z 343.08. Reproduced with the
td. All rights reserved.

Figure 25. ESI-CID-MS/MS of the isobaric protonated molecules atm/z 331recorded with a QqTOF-MS/MS hybrid instrument.
the positive and negative ion modes thus forming the respectiveprotonated and deprotonated molecules. These observations aresignificant in revealing a high number of chemically distinct ions, in-dicating that the VRL oligomer was a very complex heterogeneousmixture. Of particular note, the use of APPI-QqTOF-MS has permit-ted the discovery of novel oligolignol structures that do not concurwith the current knowledge of lignin structures. Most notably thisseries of oligomers was related and consistent with containing a re-peating phenylcoumaran unit.
Low-energy CID-MS/MS analyses have been performed with aQqTOF-MS/MS hybrid instrument and provided unique dissociationpatterns of the complete series of novel precursor ions. They alsoprovided diagnostic product ions that enabled the tentative determi-nation of structures and arrangement of the selected 57 different re-lated ionic species. Similar MS/MS characterizations were carried outby Morreel and coworkers during their elucidation of the structuresof large series oligomers possessing unknown linkages types presentin Populus spp. and in the PML degraded products of Nicotianatabacum (APCI-MS/MS-based Sequencing of Oligolignols).
In the APPI-CID-MS/MS study, the structure of the protonatedmolecule of the phenylcoumaran derivative C18H19O6 [M+H]+ atm/z 331.10 was unambiguously assigned as the protonated 4-car-boxyl–coniferyl-(β–5′)-(3-methoxylbenzene) unit, which forms thecyclic ether dimer constituent unit of all the phenylcoumaran deriv-atives. Unfortunately, in this study, it was not possible to make acomparison for the MS/MS dissociation behaviour of this series ofthe unknown ions with the either the MS/MS of synthesized stan-dards and/or any reported structures of biologically isolated lignincompounds.[88]
One example of CID-MS/MS data is discussed in the following. Theproduct ion scan of [C19H19O6]
+ atm/z 343.09 afforded the production atm/z 327.05 by elimination of a molecule of methane. The pre-cursor ion also lost a molecule of carbon dioxide to afford the prod-uct ion atm/z 299.06. The latter can lose amolecule of formaldehydeto produce the secondary product ion at m/z 269.06. Also, the pre-cursor ion can lose simultaneously carbon monoxide and formalde-hyde to from the product ion atm/z 285.05. The radical product ionat m/z 282.06 is created from the precursor ion by the consecutivelosses of formaldehyde and amethoxyl radical. The secondary prod-uct ion atm/z 269.01 is formed from the ion atm/z 299.01 by loss offormaldehyde. The product ion at m/z 165.02 is produced from theprecursor ion following the consecutive cleavages of the C-7–C-8covalent bond of the coniferyl aldehyde, and the ether link formedbetween C-7 and the oxygen atom located on C-4′ of the secondconiferyl unit. (Scheme 2)
Recently, Del Río et al. in a repeated attempt to partially elucidatethe structure of PML straw lignins reported that the flavone tricin wasincorporated into lignin.[66] According to del Rio et al., tricin can formflavonolignan derivatives composed of a tricin skeleton linked to aphenylpropanoid (p-hydroxyphenyl or guaiacyl) moiety through aβ–O–4′ bond. For clarification purpose, tricin is 5,7-dihydroxy-2-(4-hy-droxy-3,5-dimethoxyphenyl)-4H-chromen-4-one (C17H14O7, MWt330u), and it is the aglycone moiety in the series of O-methylatedflavone glycosides of the β-D-glucopyranoside-(1→4)-O-tricintype.[66,140–144] It is important to prompt that del Rio et al. used aPML described by the authors as purified lignin. This PML wasobtained by the classical Björkman method,[145] which is knownto result in 50% loss of the total lignin content.[146] Likewise, itwould be reasonable to expect that this PML does not bear anyresemblance to the CIMV VRL wheat straw lignin.[66]
It is needless to say that the protonated molecule of tricin[C17H14O7 +H]+, which appeared at m/z 331.10, has a different
molecular formulae and is isobaric to the ion reported byBanoub and Delmas for the phenylcoumaran derivative at[C18H18O6 +H]+ at m/z 331.10, obtained by APCI-QqTOF-MS,ESI-QqTOF-MS and APPI-QqTOF-MS analysis (+ ion mode) instudy of the CIMV wheat straw lignin.[88] Therefore, to clarify thisposition and avoid any ambiguity, we have analysed and com-pared the low-energy CID of the protonated precursor ion ob-tained from pure tricin and an extracted phenylcoumaran ionby ESI, APPI-QqTOF-MS in both ionization modes.
A quick perusal of the low-energy ESI-CID-MS/MS of both precur-sor protonated molecules at m/z 331 shown in Fig. 25 (inset m/z290–307) reveals different intensities of product ions between thetwo isobaric precursor protonated molecules, which gas-phasefragment by different mechanisms.
Finally, the most essential element in this comparative study isthat there is an unmistakable difference between the relative abun-dances of the isotopic profiles of the two isobaric protonated mol-ecules obtained from tricin [C17H14O7 +H]
+ and from the wheatstraw [C18H18O6+H]
+ at m/z 331.10.
APPI-QqTOF-MS and ESI-QqTOF-MS of the extracted oak andpine (VRL) lignins
Recently, Delmas Jr., Delmas and Banoubmeasured the ESI-MS andthe APPI-MSwith a QqTOF-MS hybrid instrument of the VRL oak lig-nin extracted by the CIMV process (Fig. 26).[147–149] It can be ob-served that there are differences between the two spectra, which

were recorded in the same mass range atm/z 100–700. Inessentialto point out that, both the ESI-MS and APPI-MS contain a horde ofions that may look like background noise.[150]
The ESI-MS and APPI-MS spectra VRL oak lignins show veryclearly the complexity created by the huge number ofmonolignols,dilignols, trilignols and oligolignols present in the VRL. Additionally,it also shows clearly that for the same VRLs, there is a preferentialspecific ionization trend for the different oligomeric lignin analytes.However, this ionization trend was not noticed in the case of theVRL wheat straw, which gave almost identical spectra when re-corded with both ESI and APPI ionizations.Similar results were obtained by ESI-QqTOF-MS and APPI-QqTOF-
MS of pine VRLs. The spectra obtained showed a multitude of over-lapping ions in the mass range m/z 200–800, which showed ap-proximately 600 signal ions (MS not shown). It is important toremember that ESI depends upon the electrostatic spraying of a so-lution containing ions, which is passed through a needle held athigh voltage (kV) relative to a counter electrode and the formationof the spray is assisted by nebulization. Consequently, ESI is not anion formation technique; rather, it is a technique for extracting ions
Figure 26. APPI-MS and ESI-MS of the CIMV extracted oak lignin recorded wit
from the solution-phase into the gas-phase free of solvent for massspectral analysis. On the other hand, APPI create ions that resultfrom the light energy excitation, which favours the ionmolecule re-action between the dopant and the analyte to pass on the charge.
Henceforth, a new challenge has emerged, as explained byHockaday et al. in their elegant work on the ESI-MS and APPI-FT-ICR-MS for the characterization of organic matter in natural waters:‘If the composition of a complexmixture is unknown, how does oneevaluate the performance of the spectroscopy used to characterizethe unknown?’[71]
Desorption/ionization MS of extracted andsynthetic intact lignins
Whendealing with VRLs and PMLs, which are non-volatile and prac-tically insoluble, other softer ionization methods beside ESI, APCIand APPI can be used. This is where, desorption/ionization (DI)and particle-induced desorption MS shines, and these involve
h a QqTOF-MS hybrid instrument.

fast-atom bombardment, LSI-MS, plasma desorption and photon-induced desorption such as MALDI.[151]
In the DImethods, the unifying aspect is the quick addition of en-ergy into a condensed-phase sample, which results in the genera-tion and release of gas-phase ions into the mass analyser.[151]
Instrumental details of the implementation of these ionizationmethods are not reviewed in this critique. However, some of themost recent and interesting applications reported on the structuralanalysis of lignin are included in this review.
MALDI-MS versus NALDI-MS analysis of isolated and syntheticlignins
Yoshioka et al. prepared synthetic lignin (DHP) by polymerization ofconiferyl alcohol with horseradish peroxidase, according to theZutropfverfahren method (drop-wise addition method), whichfavours end-wise polymerization. This polymerization system isknown to produce larger numbers of β–O–4′ bonds and moresignificantly represses condensation of the β–β′ coupling reactionIf the β–β′ coupling reaction was desired, it could be preparedby introducing coniferyl alcohol immediately into the dehydro-polymerizing enzyme solution (Zulaufverfahren DHP).[152] Theauthors compared nano-assisted laser desorption/ionization time-of-flight MS (NALDI-TOF-MS) and MALDI-TOF-MS, to obtain thedetailed structure of lignin. NALDI-MS is a novel innovativematrix-free approach, which eliminates the appearance of matrixpeaks. NALDI-MS uses disposable nano-structured target plateson which the anaylte is spotted. The nano-material on the targetabsorbs the laser energy and conveys it to the analyte for the DIprocess. As a result of the absence of the matrix, mass spectrapresent very low chemical background and increased sensitivity.Themethod is fast and reproducible andmay be applicable to smallmolecular weight molecules.[152]
When using MALDI-MS, the authors examined the matrices 2,5-dihydroxybenzoic acid (DHB), sinapinic acid and α-cyano-4-hydroxycinnamic acid, and they selected DHB matrix as the best.Because the matrix was immiscible with the sample solution, thesample was sandwiched between matrix layers.[152]
The NALDI-TOF-MS data obtained for the synthetic lignin pro-duced by the dehydrogenative polymerization of coniferyl alcohol
Figure 27. NALDI-TOF-MS of synthetic lignin obtained by dehydrogenative polpositive ion mode. Reproduced with permission of K. Yoshiyoka et al. (2011). Co
are shown in Fig. 27 in both the linear-positive and reflector-positive ion modes.
Henceforth, the authors observed characteristic ionmasses of theZutropfverfahren DHP when measured in the linear and reflectormodes of NALDI-TOF-MS,mainly at intervals of 178 and 196u, whichcorrespond to the mass number of the monomeric unit of DHP andits Hydroxyl (HO) adduct. This means that the DHP from coniferyl al-cohol polymerized with peroxidases, which proceed by oxidativeradical couplings and a hydrogen atom, which was removed fromthe lignin monomer, to yield a mass increment of 178u.[152]
Accordingly, a dimer produced by oxidative radical coupling ofconiferyl alcohols with a molecular weight of 358.4u. This mass in-crement of 178.2 u corresponds to the formation of either β–β′and/or β–5′ covalent bonds. Furthermore, a mass increment of196u indicated the existence of a β–O–4′ bond, which is producedvia the quinone methide intermediate followed by the addition ofH2O (Fig. 28).[152]
When NALDI-TOF-MS was compared with the MALDI-TOF-MS ofthe DHP, it became apparent that the peak intensities of the ions inthe high molecular mass range were higher than those of MALDI-TOF MS, but the spectral patterns were similar.
Similarly, Yoshioka et al. observed close similarity between thespectra of PML wood lignin from P. densiflora and DHP fromconiferyl alcohol. Thus, a comparison between the NALDI-TOF-MSand MALDI-TOF-MS indicated sharp distinct differences in the lowmolecular mass regions between m/z 500 and 800 (Fig. 29).[152]
Yoshioka et al. concluded that NALDI-TOF-MS of synthetic andPMLs, measured between the m/z 500 and 800 range, gave moreintense specific ions than those obtained byMALDI-TOF-MS. Finally,they indicated that the detailed analysis of interunit linkages of lig-nin by the NALDI-TOF-MSmethod was an excellent means to clarifythe structure of lignin.[152]
MALDI-TOF-MS of PML and synthetic lignins
Bocchini and coworkers reported the MALDI-TOF-MS experimentalconditions for the characterization of different types of PMLs andone type of synthetic lignin. Bocchini et al. measured the MALDI-TOF-MS of PML alkali extracted lignins from wheat straw, which isshown in Fig. 30 The authors described the data obtained for the
ymerization of coniferyl alcohol: (a) linear-positive ionmode and (b) reflector-pyright 2011 John Wiley & Sons, Ltd. All rights reserved.

Figure 28. Formation of lignin substructures by dehydrogenation of coniferyl alcohol via radical intermediates. Reproduced with permission of K. Yoshiyokaet al. (2011). Copyright 2011 John Wiley & Sons, Ltd. All rights reserved.
molecular weight distribution of oligomers in the PMLs and alsopresented information on the monomeric constituents of differenttypes of lignin.[153]
The MALDI-TOF-MS showed a series of ions in the range of m/z200 tom/z 3000. The authors assigned the structures of the ions ob-tained containing various oligomers, from monomers withm/z 200to heptamers withm/z 1700: these are presented in Scheme 3. Theyalso indicated that when the average molecular weight of the ma-jor fragment ion signals was divided by the degree of
Figure 29. Mass spectra of isolated lignin obtained from Pinus densiflora (lineaMS. Reproduced with permission of K. Yoshiyoka et al. (2011). Copyright 2011 J
oligomerization, the average molecular weight for the monomericbuilding units was found to be in the range ofm/z 232–252. The au-thors noticed that the average monomeric molecular weight washigher than expected and attributed it to the presence of sodiatedmolecules.
Furthermore, Bocchini et al. measured the MALDI-TOF-MS of asynthetic G-type lignin obtained through oxidative polymerizationof coniferyl alcohol.[153] TheMALDI-MS showed a series of ions, withbetter resolved fine structure than that of the PML alkali extracted
r-positive ion mode). Measurement by (a) MALDI-TOF MS and (b) NALDI-TOFohn Wiley & Sons, Ltd. All rights reserved.

Figure 30. MALDI-TOF-MS of alkali lignin from wheat straw. Reproducedwith permission from P. Bocchini et al. (1996). Copyright 1996 by JohnWiley & Sons, Inc. All rights reserved.
lignin from wheat straw. The authors concluded that the syntheticlignin had a structure very similar to that of G-type natural lignin.Thus, it was found that MALDI-TOF-MS provided constructive infor-mation on the oligomeric distribution of different types oflignin.[153]
Structural determination of β–O–4′ synthetic lignin modelpolymer using MALDI-TOF-MS
Liu and co-workers synthesized hydroxyphenyl (H-type) andguaiacyl (G-type) lignin model polymers composed of the β–O–4′
Scheme 3. Some proposed dimeric structures consistent with the MALDI-TOFCopyright 1996 by John Wiley & Sons, Inc. All rights reserved.
structure, which do not contain the γ-hydroxymethyl groups.[154]
The chemical structures of the H-type and G-type lignin modelswere characterized by 1H-NMR and 13C-NMR, as well as MALDI-TOF-MS. The synthetic oligomers included exclusively the β–O–4′linkage, as assumed to be present in natural lignin. Accordingly,Liu et al. used the procedure described by Kishimoto et al., whichconsisted of reacting the acetophenone derivative with CuBr2 anda small amount of ethanol to prepare the correspondingbromides.[155] Following addition of K2CO3 as the catalyst, the bro-mides were polymerized to yield the synthetic oligomeric lignin. Fi-nally, the oligomer obtained was reduced with NaBH4 in DMSO toobtain the H-type and G-type lignin model polymers containingonly the β–O–4′ linkage.[155] The synthetic routes are depicted inFig. 31.
The authors measured the molecular weight distributionsby GPC in tetrahydrofuran. The GPC chromatogram indicatedthat for oligomers having an averaged molecular weight of8285 u, 4832 u should be assigned to H-type and G-type ligninmodels.
Liu et al. analysed the H-type LO model by MALDI-TOF-MS andshowed it to have a linear structure. Consequently, the molecularmasses were found to be characterized by the factor [136.16n+2], in which n is the degree of polymerization. This indicated thatthe oligomers had regular structures and that reduction of carbonylgroups at the α-positionwas successfully conducted under the con-ditions used (Fig. 32).[153]
MALDI-TOF-MS structural determination of laccase polymer-ized lignin
To study the efficiency of laccase-catalysed oxidation of lignin inthe absence of mediators, Mattinen et al. characterized three differ-ent types of isolated lignin model compounds possessing high mo-lecular weights by MALDI-TOF-MS.
-MS of sample 2. Reproduced with permission from P. Bocchini et al. (1996).

Figure 31. Synthetic route for H-type and G-type lignin models (R = H or OCH3). Reproduced with permission from J. Y. Liu et al. (2011). Copyright 2011 byNorth Carolina State University Department of Wood and Paper Sciences. All rights reserved.
Figure 32. MALDI-TOF/MS of H-type lignin model polymer. Reproduced with permission from J. Y. Liu et al. (2011). Copyright 2011 by North Carolina StateUniversity Department of Wood and Paper Sciences. All rights reserved.
The tested model compounds of lignin originated from differentbotanical origins, that is, flax, softwood and hardwood.[156] Accord-ingly, the authors used themethod of Guerra et al. to isolate flax lig-nin from soda pulping black liquor andwood lignin from Eucalyptusglobulus and Norway spruce pulp.[146,157] Mattinen et al. postulatedthat the isolated lignin had the same morphology as the native lig-nin present in the CWs.The authors used Trametes hirsuta laccase (ThL) for lignin activa-
tion and studyingmolecular weight distribution.[156] After ThL treat-ments of all the lignins obtained from sources described in theaforementioned paragraph, the reaction mixtures were split intotwo parts. In the first part, the ThL activity was terminated with so-dium azide, and the fraction was designed as liquid lignin. In thesecond part, the pH of the solution was acidified, and the precipi-tated lignin was centrifuged and washed with water. The productsof each part were freeze dried and designated as solid lignin. Theseries of the lignin products obtained were studied by two differentalkaline GPC methods.[156]
Yet, it is important to note that when the GPC chromatogramswere compared with the corresponding reference samples, theywere surprisingly similar to each other. Clearly, the sensitivity ofGPCwas not high enough to be able to detect changes in the struc-ture of ThL treated LOs.[156]
Mattinen et al. also measured the MALDI-TOF-MS of the series ofliquid and solid types of lignin obtained: theMS are shown in Fig. 33.In general, the MALDI-MS were louche, broad, had poor abun-dances andwere noisy. They noted broad bands detected betweenm/z 30 000 and m/z 50 000 in all samples measured. The ratherpoorly louche resolved MS were presumably caused by the ligninsamples not being fully ionized.[156]
Molecular weight determination of PMLs by GPC andMALDI-TOF-MS
As shown throughout this review, the determination of the abso-lute molecular weight of lignin by GPC is an extremely tedious pro-cess. This is mainly due to the problems linked to the limitedsolubility, the presence of impurities and the interaction betweenlignin molecules. To further complicate matters, it is well known
that lignin can interact with the stationary phases in the chromato-graphic systems. In general, GPC can only be applied for relative es-timation of the molecular mass of an identical class of lignin.
Jacobs and Dahlman showed that the PML Kraft lignin (IndulinAT) (PML) required to be better purified to obtain well definedand narrow dispersed fractions.[158] For this reason, Indulin ATwas fractionated by GPC for the accurate molar mass MALDI-TOF-MS to be determined. The MS obtained on the PML Kraft ligninsample (Indulin AT) showed a broad signal with the maximum in-tensity of around 700u.[158]
Gosselink fractionated the VRL by purification on an organic GPCcolumn in THF.[159] He obtained 12 GPC fractions (F1–F12), evenlydistributed over the GPC chromatogram. The 12 fractions wereanalysed by MALDI-TOF-MS to give the broad signals (reflectorand+ ion mode) as shown in Fig. 34. Gosselink also indicated thatthe highest molar mass fraction F12, not shown in Fig. 34, couldnot be analysed by MALDI-TOF-MS.[159]
Furthermore, Gosselink showed that there was a correlation be-tween the molar mass of the highest peak in the MALDI-MS andthe retention time in the organic GPC analysis.
In conclusion, Gosselink showed that the MALDI-TOF-MS of aseries of unfractionated PMLs in alkaline solvent (DHB used asmatrix) could be measured. Furthermore, he showed that theuse of alkaline solvent did not interfere with the rather broadpolidisperity of the MALDI-MS measurements.[159] He also men-tioned that addition of Ag-salts did not improve the MALDIresults.
MALDI-TOF-MS of PML pyrolytic lignins
Bayerbach et al. used MALDI-TOF-MS, laser desorption/ionizationtime-of-flightMS (LDI-TOF-MS) and temperature-resolved analyticalpyrolysis field ionization MS (Py-FIMS) for measuring the molecularmasses of two extracts of pyrolytic lignin (PL).[160] The PL was ob-tained from beech pyrolysis oil. The oil was produced in a fluidizedbed reactor at a temperature of 470 °C. The oil was treated with icecool demineralized water to give two PL fractions, which precipi-tated as powder-like brown product. The first one was precipitated

Figure 33. MALDI-TOF-MS of ThL-treated and untreated lignins. (A) ‘liquid’ and (D) ‘solid’ flax soda lignin; (B) ‘liquid’ and (E) ‘solid’ spruce EMAL lignin; (C)‘liquid’ and (F) ‘solid’ Eucalyptus dioxane lignin. Pink= ThL-treated lignin, blue = the corresponding reference lignin and black = untreated lignin. The greyspectra in (A) and (D) were measured from the pure matrix. Reproduced with permission from M. L. Mattinen et al. (2008). Copyright 2008 by NorthCarolina State University Department of Wood and Paper Sciences. All rights reserved.
2h after the oil was produced (PL-2h), and the second one (PL-2m)was precipitated 2months later. The MALDI-TOF-MS of the PL-2hand PL-2m fractions showed ions that had a wide molar massdistribution.[160]
Additionally, for comparison sake, the MALDI-TOF-MS and theGPC chromatograms were measured and are superimposed inFig. 35. Hence, a smooth trend line can be seen on the MALDI-TOF-MS for the GPC data. The molecular masses of the PL fractions,measured by bothmethods, showed similar shapes, but theMALDI-TOF-MS showedmore detail than theGPC chromatogram. In Fig. 35,the MALDI-TOF-MS of PL-2m shows high abundance ions at m/z570, 750, 950, 1130, 1320 and 1500. With the GPC technique, onlytwo maxima are located around 550 and 800u. The MALDI-TOF-MS of PL-2h fraction shows less abundant ions at m/z 510 and680. The GPC chromatogram shows only one maximum at 520 u
Figure 34. Positive reflective MALDI-TOF-MS spectra of fractionated Alcelllignin in THF (DHB used as matrix). Reproduced with permission from R. J.A. Gosselink (2011). Copyright 2011 by Wageningen Universiteit, TheNetherlands. All rights reserved.
Figure 35. MMD of PL-2m and PL-2h, determined by MALDI-TOF-MS andSEC. For better comparison a trend line was added to the MALDI-TOF-MSsignals. Reproduced with permission from R. Bayerbach et al. (2006).Copyright 2006 Elsevier. All rights reserved.
and a shoulder at 750u. It was assumed that these masses couldbe assigned to PL-oligomers with different degrees ofpolymerization.
The intervals between the maxima determined by MALDI-TOF-MS (170–200u) differ from the GPC values (230–250 u), and theseintervals could represent the average absolute molar mass of PL-monomers.
Accordingly, the authors showed that the GPC mass distributionvalues of the PL-fractions differ from the visually interpolatedMALDI-TOF-MS measurements by 20%.
Bayerbach et al. indicated that when they measured LDI-TOF-MSfor the PL fractions, they obtained clearer spectra than when theywere recorded with MALDI-TOF-MS. The authors noted that the in-tervals between main signals were mostly 14–16 u apart. In thespectra of different PL-fractions, the corresponding main signals

can vary between 2 and 4u. These mass differences indicate varia-tions in the aliphatic region of the PL molecules.[160] Accordingly,they reported that the average molecular weight of the examinedPL was between 560 and 840u, with a maximal deviation of 20%,depending on the age of the oil. In addition, the authors showedthat themasses of PL-dimerswere between 270 and 400uwhereas,the PL monomers were between 130 and 200u.As expected, the Py-FIMS spectra contained ions of fragmented
monomers and dimers in all samples investigated. The monomersdetected corresponded to known lignin derived compounds ob-tained from bio-oil, and the dimers detected had similarities tophenylcoumaran structures. PL from aged bio-oil showed an in-creased content of higher oligomers and had a higher average mo-lecular weight.[160]
Bayerbach et al. concluded that the combination of various dif-ferent methods for the molecular weight characterization, contrib-uted to an understanding of the lignin structures, which would beextremely difficult to achieve by a single method.[160]
SIMS-TOF-MS analysis of pine PML and syntheticdehydrogenated lignin oligomers
Secondary Ion Mass Spectrometry (SIMS-TOF-MS) has the advan-tages of rapid spectral acquisition, high spatial and mass resolu-tions, reasonable count rates and low damage offered by pulsed
Figure 36. Common interunit linkages in lignin and positive TOF-SIMS spectrtentative structures of the main secondary ions, each of which has a guaiacyl (with dioxane-containing water (96 : 4). Pine (softwood) and beech (hardwoorespectively. Reproduced with permission from K. Saito et al. (2008). Copyright
liquid metal cluster primary ion sources.[161,162] Saito and coworkershave shown that SIMS-TOF-MS with Ga primary ion bombardmentwas an excellent method for the structural analysis of different PMLtypes of lignin because it was efficient in detecting the characteris-tic ions having a substituted guaiacyl aromatic ring.[161,162]
The authors revealed that the SIMS-TOF-MS of the pine PML, con-taining the guaiacyl residues showed an ion atm/z 137, which wasassigned as the [C8H9O2]
+ ion composed of the C-7 benzylic ion ofthe guaiacyl unit G. In addition, the authors showed that the ions atm/z 151 were attributed to a pair of unresolved isobaric ions,namely, the C-7 benzoyl ion assigned as [C8H7O3]
+ at m/z151.0394 and the C-7–CβH2–CγH2
+ ion assigned as [C9H11O2]+ at
m/z 151.0758, the latter ion being formed by the cleavage of theC-8–C-9 chain. The authors proposed that the fragment ions at m/z 137 and 151 were formed by rupture of common interunit link-ages, such as the β–O–4′, β–1′, β–β′ and β–5′. Neither of these ionscould have been formed from the 5–5′ interunit linkages(Fig. 36).[161,162]
Also, both G and S types of lignin from beech woodwere studiedby SIMS-TOF-MS of PML (Fig. 36B). Analysis of this SIMS-TOF-MSshowed that the ion at m/z 151 was derived from the G type andthat the ions at m/z 167 and 181 were derived from the S type. Asin the earlier studies, the ion at m/z 181 was an isobaric mixtureof [C8H9O4]
+ (the C-7 benzoyl ion) and the [R–CβH2–CγH2]+; both
ions are derived from the S unit (Fig. 36).[161,162]
a of (a) pine, and (b) beech milled wood lignin (MWL). The figure shows theG) or syringyl (S) ring. MWL is lignin isolated by extracting ball milled woodd) MWL are composed of guaiacyl (G) and guaiacyl–syringyl (GS) lignins,2008 by Elsevier B. V. All rights reserved.

Saito et al. suggested that the best lignin models were obtainedfrom the dehydrogenation polymers DHPs (G type), which are usu-ally synthesized from in vitro enzyme-catalysed polymerization ofphenylpropanoid monomers.
The authors synthesized DHP from coniferyl alcohol aided by aperoxidase-H2O system. The authors then used high-resolutionSIMS-TOF-MS with Au+ primary ion for the ionization of DHP. TheSIMS-TOF-MS of DHP showed two major ions: one at m/z 137 de-rived from G and the other at m/z 151. Once more, the isobaricion at m/ z 151 was presumed to be formed by the C-7 benzoylion assigned as [C8H7O3]
+ at m/z 151.0394 and as the ion [R–CβH2–CγH2]
+ at m/z 151.0758. Both of the ions were derived fromthe guaiacyl unit G and neither could be resolved (Fig. 36).[161,162]
As depicted in Fig. 37A, the authors measured the SIMS-TOF-MS(+ ionmode) of the G(8–O–4′)/C-7(CO) dimer, which gave themajorion at m/z 151 assigned as the C-7 benzoyl ion of G. They alsoshowed in Fig. 37B that the SIMS-TOF-MS of the synthetic dimercomposed of the 4-OMe-G(8–O–4′)G produced ions at m/z 165,which was also assigned as the C-7 benzoyl ions.
When the authors measured the SIMS-TOF-MS of G(8–1′/C8–CH2OH), they were able to resolve the isobaric ions atm/z 151 intothe C-7 benzoyl ion assigned as [C8H7O3]
+ atm/z 151.0394 and theion [R–CβH2–CγH2]
+ atm/z 151.0758 (Fig. 37C). The SIMS-TOF-MS ofthe of the G and S dimers showed that the [R–CβH2–CγH2]
+ ion wasmore intense than the C-7 benzoyl ion.
Finally, the authors measured the SIMS-TOF-MS of G(8–1′/C8–CH3) having a C-8 side chain, and it appeared that ion at m/z 151was mainly the major ion assigned as [R–CβH2–CγH2]
+ ion at m/z151.0758, which existedwith a small proportion of the C-6–C-1 ben-zoyl ion. Such an observation is indicative of a favoured cleavagebetween C-8 and C-9 being enhanced when the primary �CH2OHgroup is replaced by a methyl group (Fig. 37D).[161,162]
Figure 37. Positive TOF-SIMS spectra of lignin model dimers representing 8–Reproduced with permission from K. Saito et al. (2005). Copyright 2005 by Ame
In conclusion, Saito et al. demonstrated that SIMS-TOF-MS usingAu+ as the primary ion bombardment a new tool can be offered forthe direct analysis of the fragments of lignin polymers.[161,162]
Distinguishing between intact lignin and polysaccharides inSIMS-TOF-MS analysis of wood
As discussed earlier, Saito et al.were the first to use SIMS-TOF-MS asan analytical method for the evaluation of wood samples and forevaluating the distribution of the different molecular componentsof individual wood samples and different species.[163] These analyt-ical studies facilitated the characterization of engineered wood fi-bre and the impact of pre-treatment processes.
Recently, SIMS-TOF-MS imaging of wood surfaces has been usedto show the location of the various types of inorganic ions.[163]
Tokareva and coworkers were able to measure SIMS-TOF-MS im-ages of the different localization of the H-lignin subunits usingthe characteristic ions at m/z 107 and 121. They also measuredthe characteristic ions at m/z 137 and m/z 151 of the G-lignin sub-units present in the transverse and longitudinal sections of aspenand spruce.[164] As well, they also used SIMS-TOF-MS for imagingcarbohydrates, using the characteristic ions atm/z 115 for hemicel-luloses and the ions atm/z 127 and 145 for cellulose. Unfortunately,the lateral resolution of the ion images was insufficient to resolveboth the carbohydrate and lignin constituents in the particularCW layers.[164]
Similarly, Koljonen et al. described the structural changes in lig-nin and measured the lignin content on wood fibre surfaces bySIMS-TOF-MS imaging of the extractives and lignins on the pulpsurfaces, using the ions atm/z 137 andm/z 151, which are diagnos-tic for the guaiacyl lignin residues, and the ion at m/z 77, which ischaracteristic of the phenyl ring (C6H5).
[165] Fardim and Duran
O–4′/C7–C–O (compounds A and B), (C) 8–1′/C8–CH2OH, (D) 8–1′/C8–CH3.rican Chemical Society. All rights reserved.

supplied lists of ions for extractives and ion assignments for the fol-lowing: xylan (hemicellulose) at m/z 115 and 133; cellulose at m/z127 and 145; and lignin at m/z 137, 151, 167 and 181.[166] Bermanet al. used SIMS-TOF-MS of the same series of ions to identify cellu-lose and xylan.[167]
Goacher et al. used two different approaches to distinguishthe ions in the SIMS-TOF-MS arising from the lignin and polysac-charide biopolymers in softwood.[168] The first approach was toanalyse samples with different relative proportions of lignin, cel-lulose and hemicellulose. The cellulose fraction samples wereprepared by delignifying the extracted pine sawdust toholocellulose and removing both hemicellulose and the remain-ing lignin.[168] The second approach was to generate high-resolution SIMS-TOF-MS images of solid pine cross-sections todetermine the concentration variations between lignin andpolysaccharide across CWs. This work formed the basis uponwhich Goacher et al. elucidated the main sources of variationamong wood constituents using principal component analysisto highlight the differences between the spectra.[168] Theseidentifications were performed through combination of highmass resolution analyses of the pine fractions and the high lat-eral resolution image analyses to distinguish between thelignin-rich middle lamella and the secondary CW layers in solidwood cross-sections. Consequently, Goacher et al. was able tocollect and compile ions from both high and nominal mass res-olution spectra to extend the library of characteristic lignin andpolysaccharide secondary ions in wood. It is important to appre-ciate that this library did not contain any ions that would createuncertainty between wood components.[168]
Goacher et al. found that he could generate improved imagesusing low-mass ions for the SIMS-TOF-MS imaging. Both the clarityand S/N improvements were attributed to the selective use of thelow-mass diagnostic ions for polysaccharides and lignin, whichare at higher intensities.Finally, the lack of mass interferences from the ions identified by
the present analysis was clearly demonstrated by the ability to ob-tain informative images of polysaccharide and lignin distributionsusing simple sum and division methods.[168]
It is important to mention that in all the reported SIMS-TOF-MSimaging presented herein, no accounts were found of MS/MS anal-yses and resulting gas-phase fragmentations. It is needless to saythat MS/MS analyses would have provided unequivocal and betteridentification of the lignin analytes.
Study of the removal of the lignin from cellulose and hemicel-lulose by imaging with direct matrix-assisted laserdesorption/ionization tandem mass spectrometry
Lunsford, Peter and Yost reported that there is a variety of tech-niques used to image lignocellulosic materials.[169] These methodsinclude optical and fluorescence microscopies,[170] magnetic reso-nance imaging,[171] micro X-ray computed tomography,[172] confo-cal Raman microscopy,[173,174] and scanning electron andtransmission electron microscopy. Although useful, these methodsare disadvantaged by providing limited molecular specificity andstructural information.In contrast, Lunsford et al. showed that SIMS-TOF-MS and
MALDI-TOF-MS were capable to provide much of the molecularspecificity information that was unavailable by the othertechniques.[175–179] Nonetheless, even though SIMS-TOF-MS im-aging can provide direct surface analysis and high spatial resolu-tion of a lignocellulosic biomass, it is prone to extensive non-
specific fragmentations of the analyte, which limits its chemicalspecificity.[180,181] This is attributed to the nature of the plantCW composition, which is made of complex building block car-bohydrates such as glucose (C6H12O6), xylose (C5H10O5), glucu-ronic acid (C6H10O7) and methyl glucuronic acid (C7H12O7). As aresult, SIMS ionization of these complex units yields complexfragmentations that are difficult to interpret.[170]
To further complicatematters, themolecular mass similarities be-tween the various sugars and the monolignols, which compose thelignocellulosic tissues, can produce isobaric ions. However, MS/MSanalyses can overcome this complexity, by dissociating precursorions and forming diagnostic product ions, which allow the isobaricions to be distinguished and thereby allow an increase in the de-gree of confidence of ion identification.[179,182]
For these reasons, Lunsford, Peter and Yost studied the direct im-aging of cellulose and hemicellulose in intact wood tissue using athermo MALDI-LTQ-MSn XL tandem mass spectrometer equippedwith a novel linear ion trap.[169]
It is well known that microcrystalline cellulose contains semi-crystalline polymers of β-D-(1→ 4)-D-Glc linked monomers (Glc,C6H10O5). Understandably, the molecular weight of cellulose canbe determined by multiplying the mass of the glucose repeatingunit, 162u, by the number of glucose monomers and adding 18uto account for the �OH and �H terminal groups.[169]
Lunsford, Peter and Yost showed that the MALDI-LTQ-MS of mi-crocrystalline cellulose of Populus wood tissue recorded betweenm/z 500–2000 formed ions that were separated by 162u apart.They identified these signals as sodiated, dehydrated (singlycharged) ions, differing by the number of glucose monomers,expressed as [Glcn–H2O+Na]+ where n=3–12. It is important topoint out that the MALDI-LTQ-MS analysis of microcrystalline cellu-lose from Populus wood tissue, when coated with DHB matrix,showed very strong intensity ions throughout the range m/z 500–2000, which were not attributed to background noise. These ionswere interpreted as arising from the ionization of various oligomersof lignin.[169]
As mentioned earlier lignin is a complex polymer of polyphenolcompounds found primarily in secondary CWs of gymnosperms,woody angiosperms and grasses and is abundant in the secondaryxylem (wood) of the Populus tissue section.[183] Therefore, to elimi-nate the complex series of the oligomeric lignin ion signals from in-tact tissue, the lignin was removed from the Populuswood sectionsusing sodium hypochlorite extraction, by a procedure that leavesbehind the delignified wood or holocellulose (composed of cellu-lose and hemicelluloses).[146]
The delignified sections of the Populus tissue section wereanalysed by MALDI-LTQ-MS.[169] Lunsford, Peter and Yost obtainedspectra by averaging data from 50MS scans recorded betweenm/z500 and 2000 for untreated and delignified wood from serial sec-tions, which were coated with DHB (Fig. 38). The authors noticedthat the Total Ion Chromatogram (TIC) was reduced by more than50% (from 3.08×10⁸ to 1.26× 10⁸) and that the intensity of the cel-lulose analyte ion signal remained relatively unchanged (2.84× 10⁵
compared with 2.55×10⁵). This suggests that the ionization of theLOs results in abundant background ion signal in wood tissue; thus,the signal-to-background can be improved by removing ligninfrom wood tissue.[169]
Regrettably, the authors showed that despite the removal of theLOs, however, which improved the signal-to-background ratio, theobtained wood tissue had an altered wood structure that compro-mised both spatial and chemical information. This was explained bythe presence of the remaining trace of lignin oligomeric ions

Figure 38. Comparison of MALDI-MS spectra of intact wood tissue (a) andholocellulose (b). Ions labelled were identified as singly charged, sodiated,dehydrated cellulose ions. Removing the lignin from the wood tissueremoves much of the background ion signal (leaving behind thecellulose), illustrating that many of the ions observed in wood tissue aredue to the ionization of lignin. Reproduced with the permission of K. A.Lunsford et al. Copyright 2011 by American Chemical Society All rightsreserved.
complicating and downgrading the demand for more detail in theimage dimension (spatial resolution) and in the spectral dimension(mass resolution and accuracy).
As an alternative means to solve this problem, the intrinsicallyhigh lignin ion signal can be effectively eradicated by usingMS/MS.[169] Hence, the MS2 spectra for the precursor ion at m/z1319 assigned as [Glc7–H2O+Na]+ was recorded for the micro-crystalline cellulose standard (a) and the intact wood tissue (b).This MS2 analysis of the precursor ion at m/z 1319 affords abun-dant product ions, arising from successive neutral losses (NLs) of162 u resulting from glycosidic bond cleavages. The wood tissuespectrum shows additional product ions at m/z 1301 and 1275,(NLs of 18 and 44 u) resulting from loss of water and an acetyl
Figure 39. MS2 spectra fromMCC standard (a) and intact wood tissue (b) ofm/zions, arising from successive NLs of 162 resulting from cleavages along the glycos1301 and 1275, (NLs of 18 and 44) resulting from loss of water and an acetyl grwood tissue at m/z 1319. Tandem MS decreases the background compound ioReproduced with the permission of K. A. Lunsford et al. Copyright 2011 by Ame
group, respectively. Additionaly, this MS/MS result seems to indi-cate the existence of two isobaric ions obtained from wood tis-sue at m/z 1319.
Nevertheless when comparing the MS with the MS/MS results, aserious decrease in the lignins background ion signals comparedwith MS, and improves the signal-to-background ratio without re-moving the lignins (Fig. 39).[169]
Similarly, the authors measured the MS2 analysis of the precur-sor ion at m/z 1079 derived from Birch xylan extract and Populuswood tissue. In the xylan standard, the authors noticed the se-quential NLs of 132 are observed in the MS2 of m/z 1079assigned as [Xyl8–H2O+Na]+ which resulted from glycosidicbond cleavages between xylose monomers. Furthermore, theCID-MS/MS analysis of the precursor ion m/z 1079 derived fromthe Populus tissue showed product ions resulting from NLs atm/z 917 (NL of 162 u) at m/z 875 (NL of 204 u) and at m/z 847(NL of 132 u). The authors indicated that as these product ionswere not observed in the standard, at least two isobaric ionsare likely to be present for the precursor ion atm/z 1079. Furtherstages of MS (MS3 and MS4) determined that, in addition to thelinear xylan, the isobaric precursor ion at m/z 1079 was assignedas [(162)4 × (204)2 + Na]+ and was tentatively identified as an O-acetylgalactoglucomannan (Fig. 40).
In addition, the authors have shown a comparison betweenmea-sured MALDI-LIT-MS with an average of 25 spectra averages in fourdifferent regions of wood tissue, inner pith, around the pith, sec-ondary xylem and secondary phloem. The ions above the back-ground were consistent with the m/z values of MCC and wereobserved in the spectra of the centre pith and secondary xylem.Nevertheless, it is important to realize that the intense ligninions at nearly every m/z value are observed for the pith periph-ery and secondary phloem spectra. The differences in thesespectra are consistent with the lignin composition of the regions:centre pith and secondary xylem are composed of mostly deadcells (more lignins and no polysaccharides), whereas the pith pe-riphery and secondary phloem are composed of mostly livingcells (Fig. 41).
1319, identified as [Glc7–H2O+Na]+. Both spectra show abundant fragmentidic bonds. Thewood tissue spectrum shows additional fragment ions atm/zoup, respectively. This suggests at least two isobaric ions are observed fromn signal improving the signal-to-background ratio without removing lignin.rican Chemical Society All rights reserved.

Figure 40. MS2 spectra from Birch Xylan standard (a) and intact wood tissue (b) ofm/z 1079, identified as a linear xylan, [Xyl7 H2O+Na]+. Bothspectra showabundant fragment ions atm/z 1019 and 947, due to cross ring and glycosidic bond cleavages, respectively. The spectrum from wood tissuealso showsabundant fragment ions at m/z 917 and 875 (NLs of 162 and 204), corresponding to a glucose and glucuronic acid residue, suggesting at leasttwoisobaric species at the m/z value 1079. Reproduced with the permission of K.A. Lunsford et al. Copyright 2011 by American Chemical Society All rightsreserved.
Moreover, the authors measured the intact wood tissue on aquarter section of the Populus stem byMALD-LTQ-MS imaging. Thiswas achieved to ensure that all tissue types were examined in thequarter section. The MS image of the whole tissue shows the ionsignal [Glc7–H2O+Na]+ ion at m/z 1319.In addition, the optical image of the transverse section of young
Populus stem is also shown. Please note, that the white dotted linein the optical images illustrates the region ofMS analysis. The pith ispositioned in the centre of the stem and is composed of thin non-
Figure 41. Comparison of an average of 25 spectra averages in four differeandsecondary phloem. Ions above the background, consistent with m/z valuxylem.Intense ions at nearly every m/z value are observed in the pith periphewith thecomposition of the regions: centre pith and secondary xylem are comarecomposed of mostly living cells. Reproduced with the permission of K. A. Lun
lignified, primary-walled cells. The secondary xylem extends fromthe pith to the vascular cambium and is composed of living ray pa-renchyma, nonliving lignified fibre and vessel cells with thickenedsecondary walls. The vascular cambium is a thin layer (~50μm) ofliving tissue between the secondary xylem and secondary phloem.The secondary phloem is composed of living primary walled paren-chyma and companion cells as well as dead sieve and fibre cellswith thickened secondary walls. In contrast to the sieve cells, the fi-bre walls are lignified (Fig. 42).[169]
nt regions of wood tissue, inner pith, around the pith, secondary xylem,es of MCC, are observed in the spectra of the centre pith and secondaryry and secondary phloem spectra. The differences in spectra are consistentposed of mostly dead cells, and the pith periphery and secondary phloemsford et al. Copyright 2011 by American Chemical Society All rights reserved.

Figure 42. (a) Optical image of Populus wood tissue showing the pith (1), secondary xylem (2), vascular cambium (3), and secondary phloem (4). The whiteoutline shows the area of MS andMS2 analyses. (b) MS image ofm/z 1319 ([Glc7–H2O+Na]+) shows ion signal over the whole tissue. (c) TheMS2 image ofm/z1319→ 1275 (NL of 44) displays more abundant ion signal in the region around the pith and the secondary phloem, which is consistent with tissuecompositions. (d) MS2 image of m/z 1319→ 995, resulting from two NLs of 162, shows localization in the secondary xylem, closest to the pith, andreduced ion signal in the centre of the pith, vascular cambium and secondary phloem. Reproduced with the permission of K. A. Lunsford et al. Copyright2011 by American Chemical Society All rights reserved.
The MS2 image of m/z 1319→ 1275 (�44u) exhibits a moreabundant ion signal in the region around the pith and the second-ary phloem, which is consistent with tissue compositions. The MS2
image of m/z 1319→ 995, resulting from two NLs of 162 u, exhibitlocalization in the secondary xylem, closest to the pith, and reducedion signal in the centre of the pith, vascular cambium and second-ary phloem.[169]
Although a complete chemical composition analysis of all the re-gions of wood tissue was not attempted by these authors, their ex-periments showed the viability of MALDI-MSn for the imaging oflignocellulosic tissue. They concluded that MS alone was incapableof providing accurate spatial distributions of different ions at a sin-gle m/z. Instead, the necessity and advantages of MS/MS analysesof wood tissue were evident after comparing MS2 images withthe MS images.[169]
MALDI-LTQ-MSI imaging a rapid and facile method for quickdetermination of the composition of intact lignin in Eucalyptus
Recently, Araújo et al. have used MALDI imaging MS (IMS) to studythe native lignin composition of Eucalyptus.[184] The authors usedhand-cut sections of stems of two Eucalyptus species that were cov-ered with silica and analysed by MALDI-IMS. In these experiments,the authors used imaging data and the MALDI spectra were
acquired with a linear trap quadrupole-XL (MALDI-LTQ-XL) linkedto a solid imaging camera.[184]
The MADLI-LTQ-IMS results reported by Araújo et al. and thoseobtained by UPLC-ESI-MS and MS/MS as described by Kiyota et al.were in agreement with each other in characterizing the main sol-uble lignin monomers and oligomer structures that were presentin the sugar cane.[108]
Accordingly, the authors were able to trace lignin monomer, di-mers and trimers distribution in the Eucalyptus sections by meansof CID-MS/MS through the measurements of multiple-reactionmonitoring scans mode of the transitions of the m/z precursorions→m/z product ions and comparing the results with theirMS/MS library data.[91,95,108] In addition, by availing of modern soft-ware imaging technique, the authors completed a relative quantifi-cation of the lignin components (Fig. 43).[184]
With such advances, Araújo et al. used MALDI-LTQ-MSn to im-age 22 out of the 24 compounds described by Kiyota et al., whichembodied the main soluble lignin monomers and dimers and trim-mers in cane sugar.[108] In addition, these analyses allowed the de-termination of their localization in the cross sections. (Table 5)
It is of note that the authors obtained their images for each of thecompounds identified in each stemcuts, using ImageJ software (Na-tional Institutes of Health, USA – Open Source) on grey scaleimages.[185] The quantifying software that assigned the different

Figure 43. Phloroglucinol staining andmapping of sinapyl (m/z 209), coniferyl (m/z 179), and p-coumaroyl (m/z 149) alcohols in freshly hand-cut sections ofEucalyptus stems. Different colours were selected for each unit for illustrative reasons. For relative quantification, the figures were convertedto grey images.Reproduced with permission from P. Araújo et al. Copyright by 2014 American Chemical Society.
multiple-reaction monitoring values for each compound image re-sulted from the sumof the intensity of each pixel. This sumwas thendivided by the sum of the all values, which corresponded to all theother compounds obtained in the same cut. Therefore, this elegantanalysis allowed a relative novel quantification method for eachcompound in each cut.[185] This once more points to the importantfact that we can find small LOs in the intact stem of eucalyptus.
Table 5. Relative pixel quantification of oligomers in E. globulus and E. grandet al. Copyright by 2014 American Chemical Society
Parent ion (m/z) Product ions (m/z) Struct
149 131, 103 p-coumaryl alc
179 164, 161 coniferyl alcoh
209 191, 176, 161 sinapyl alcoho
297 279, 191, 121 H(8–5)H
267, 149, 121 H(8–8)H
327 313, 309, 191 G(8–5)H
357 339, 221, 191 G(8–5)G
341, 151 G(8–8)G
375 327, 195, 179 G(8–O–4)G
387 369, 221, 191 S(8–5)G
357, 203, 181 S(8–8)G
405 375, 225, 179 S(8–O–4)G
417 181, 166 S(8–8)S
435 225, 209, 195 S(8–O–4)S
493 313, 297, 191 H(8–5)H(8–O–4
535 517, 505, 221 G(8–5)G(8–5)G
553 357, 339, 195 G(8–O–4)G(8–5
571 391, 375, 179 G(8–O–4)G(8–O
583 387, 369, 195 G(8–O–4)S(8–5
357, 339, 225 S(8–O–4)G(8–5
601 583, 209, 195 G(8–O–4)G(8–O
613 387, 369, 225 S(8–O–4)S(8–5
417, 195, 181 G(8–O–4)S(8–8
631 435, 421, 209 S(8–O–4)G(8–O
643 417, 225, 181 S(8–O–4)S(8–8
661 435, 225, 209 S(8–O–4)S(8–O
851 627, 433, 417 S(8–O–4)S(8–8
A striking point made by the authors was that neither coniferylnor sinapyl aldehydes could be detected. However, Araújo et al. in-dicated that the presence of the 8–O–4′ (or β–O–4′) linkages werepredominant in the lignin structure (Table 5). The authors also indi-cated the presence of a higher amount of S atm/z 209 residues overthose samples attributed to G at m/z 179 and H at m/z 149.[184] Al-though the authors indicated that the H unit imagewas less intense
is using the ImageJ Software. Reproduced with permission from P. Araújo
ure E. globulus E. grandis
ohol (H) 0.024 ± 0.010 0.010 ± 0.000
ol (G) 0.068 ± 0.010 0.079 ± 0.010
l (S) 0.088 ± 0.020 0.064 ± 0.010
0.066 ± 0.020 0.029 ± 0.000
0.056 ± 0.020 0.042 ± 0.000
0.048 ± 0.010 0.075 ± 0.010
0.042 ± 0.010 0.050 ± 0.010
0.065 ± 0.010 0.098 ± 0.010
0.048 ± 0.020 0.046 ± 0.000
0.064 ± 0.000 0.100 ± 0.010
0.060 ± 0.000 0.037 ± 0.010
)G 0.090 ± 0.020 0.106 ± 0.010
0.034 ± 0.000 0.054 ± 0.000
)G 0.046 ± 0.010 0.060 ± 0.000
–4)G 0.025 ± 0.010 0.032 ± 0.010
)G 0.044 ± 0.030 0.054 ± 0.010
)G
–4)S 0.028 ± 0.000 0.033 ± 0.000
)G 0.025 ± 0.000 0.035 ± 0.000
)S
–4)S 0.025 ± 0.000 0.033 ± 0.010
)S 0.015 ± 0.000 0.030 ± 0.000
–4)S 0.026 ± 0.010 0.042 ± 0.000
)S(8–O–4)S 0.014 ± 0.020 0.045 ± 0.000

Figure 44. Reflector positive ionmodeMALDI-TOF-MS spectrum of FAL107
than what were observed for the S and G unit images, they alsoshowed that the trimer H(8–5′)H(8–O–4′)G gave one of the highestrelative intensity images (Table 5).
In addition, the authors were able to show that the normalizeddata of the S/G ratio obtained for E. globulus (1.37± 0.05) was higherthan that observed for E. grandis (1.16± 0.13).[184]
Nevertheless, a very important point worthy of mention is thatwhen a comparison is made between the quantitative results to de-termine the S/G ratio obtained by the Py-GC/MS and nitrobenzeneoxidation methods of similar Eucalyptus spp., data from hybrids in-dicated a huge overestimation of the S/G ratio when comparedwith the MALDI-LTQ-MSn imaging method.[184]
It is significant that the authors indicated that normal matrixesroutinely used in MALDI-imaging analysis were found to be unsat-isfactory for the analysis of plant materials; however, they indicatedthat these could be efficiently substituted by thin-layer chromatog-raphy grade silica.
In conclusion, the authors indicated that the convenience ofsample preparation required for and efficiency of MALDI-LTQ-MSIimaging offer advantages over the complex and laborious MSmethods that have been used in studies of lignin composition.[184]
with DHB (A), CHCA (B) and α–CD/CHCA (C) [monomers (denoted [M]),dimers ([2M]) and trimers ([3M])]. Reproduced with the permission of A.Richel et al. (2012). Copyright 2012 by Libertas Academica Ltd. All rightsreserved.
Second-generation types of VRLs analysed by MALDI-TOF-MSRichel and coworkers evaluated MALDI-TOF-MS (+ ion mode) forthe structural elucidation and molecular weight assessment ofsome extracted herbaceous types of lignin derived fromMiscanthus (Miscanths x giganteus) and Switchgrass (PanicumVirgatum L.).[186] Three selected lignin fractions (FAL107, FAL80and AL) were extracted from Miscanthus x giganteus under alkalior acid conditions according to a previously published protocol.[187]
Lignin isolated after a formic acid/acetic acid pretreatment at 107 °C(FAL107) contained mainly β–5′ linkages as evidenced by NMR. TheAL lignin fraction obtained after aqueous ammonia soakingcontained mainly β–O–4′ and residual phenylcoumaran (β–5′) sub-structures. FAL80 was obtained using a milder formic/acetic acidprotocol at 80 °C and contained both β–O–4′ and β–5′ moieties.The lignin fractions SG-107 and SG-AL were extracted from Switch-grass feedstock under formic acid/acetic acid pretreatment (107 °Cfor 3 h) and aqueous ammonia conditions (60 °C for 6 h),respectively.[187]
The authors showed MALDI-TOF-MS (+ ion mode) to be best re-corded using α-cyano-4-hydroxycinnamic acid (CHCA), in combina-tion with α-cyclodextrin. This permitted the efficient ionization ofthe poorly soluble lignin materials and suppressed the matrix-related background ions. Effectively, Richel and coworkers wereable to analyse low-mass fragments ions in the mass range at m/z100–600. The MS data obtained were considered as a diagnosticfingerprint of the starting VRLs and allowed quantitative identifica-tion of the oligomers containing principal interunit linkages be-tween phenylpropanoid units. The authors were also able toprovide useful information on the oligomeric distribution of differ-ent types of herbaceous types of lignin containing mainly guaiacyland syringyl moieties.
The MALDI-TOF-MS of FAL 107 lignin, which was isolatedfrom Miscanthus after a formic acid/acetic acid pretreatmentat 107 °C (FAL107), was obtained using either 2,5-DHB in com-bination with NaCl (Fig. 44A) or CHCA in 30% aq. acetonitrilewith 0.1% TFA (Fig. 44B). (Matrix cluster signals appeared inthis low mass range and probably interfered with the ligninfingerprints.)[187]
In experiments designed to extend the range of applicabilityof MALDI-TOF-MS for FAL107, it was found that CHCA encapsu-lated in a cyclodextrin cavity enabled improvements of theaforementioned conditions by giving a cleaner spectrum withless interference from matrix fragments (Fig. 44C). In Fig. 44,[M] was assigned to the monomer, [2M] to dimers and [3M] totrimers.
The authors observed that the hyperfine structure of thisdimeric distribution, within the mass range m/z 250 to 400,offered special diagnostic information concerning the occur-rence of specific linkages between two phenylpropane units.It is noteworthy that the elucidation of the dimeric structureof FAL107 corroborated the work of Banoub and Delmasusing APCI-MS and APPI-MS of acid-extracted lignin fromwheat straw.[9,88] The authors also found a main ion at m/z331, which had a well-resolved isotopic distribution that re-lated to the product ion at m/z 315. This was assigned tothe protonated [C18H19O6]
+ dimer, constructed of two G unitslinked through a β–5′ moiety. This observation allowed theauthors to propose that β–5′ linkages predominate in dilignolsof Miscanthus pretreated with acid. Richel and coworkers wereable to use this technique to discriminate between the sam-ples extracted using ammonia soaking and those extractedby formic/acetic acid conditions. In agreement with earlierstudies, the authors showed that there were discrepancies be-tween molar masses, above 1000 u, when they were estimatedusing on-line high-performance size-exclusion chromatographycoupled to differential refractometry (HPSEC-RI) in conjunctionwith GPC.[187]
MALDI-TOF-MSanalysis of thePMLalfa grass (Stipa tenacissimaL.)lignins
This study was chosen to exemplify the type of chemical manipula-tion that the lignin can be submitted to, prior of initiation of struc-tural elucidation.[188] The authors treated the alfa grass lignin (VRL)

Figure 45. MALDI-QqTOF-MS of the CIMV extracted alfa grass lignin.
obtained by the CIMV process,[147–149] by a complicated series ofdissolution/precipitation and alkaline hydrolysis manipulations,which were accomplished as follows. The following is included tounderscore the tedious process of converting VRL into an alteredPML. The VRL was suspended in 1,4-dioxane; the insoluble fractionwas removed by filtration and the solvent removed by evaporation.The residuewas then dissolved in diethylether to separate insolublelignin from soluble low molar mass compounds. Finally, the precip-itate was filtered and dried to yield purified lignin Lp. In addition, theauthors hydrolysed the VRL in aqueous 3N NaOH for 4 h at 80 °Cfollowed by precipitation in acidic aqueous medium to afford, thehydrolysed lignin (Lh). The samples were preliminarily analysed bysize exclusion chromatography to determine their molar masses.VRL and Lh could not be analysed without further treatment be-cause of their low solubility in THF. For this reason, the correspond-ing acetylated samples (VRL-Ac, Lp-Ac and Lh-Ac) were prepared.Following conventional analytical analysis of these samples usingFTIR, 1H NMR, 13C-1H 2D-HSQC NMR and 31P-NMR spectroscopies,the authors concluded that their alfa purified lignin was of theSGH type with low H content (ca. 12%) and contained β–O–4′ etherbonds as the major interunit linkage. These results are very similarto those of del Rio et al. for wheat straw lignin.[66] According tothese authors, the structures obtained for these different fractionswere analogous to those of the native polymer in the plant.[189]
Delmas Jr., Delmas and Banoub have analysed the same alfagrass lignin (VRL) described earlier (of which the only modificationwas to wash extensively in water) by ESI-QqTOF-MS, APPI-QqTOF-MS and MALDI-QqTOF-MS (+ ion mode) and CID-MS/MS. These se-ries of spectra obtained were comparable with the MS and MS/MSspectra of the obtained from wheat straw (VRL).[150] However, theywere not identical because the plant origin was different. In addi-tion, the MS/MS analyses of some of the major ions formed gaveCID fragmentations that were identical to some fragment ions ofthe wheat straw lignin (VRL). This finding seems to indicate thatthe VRL alfa grass lignins may be composed preferentially by series
of repeating oligomeric phenylcoumaran units, as is the case withthe wheat straw lignin.
Interestingly, MALDI-QqTOF-MS (+ ion mode) of the VRL alfagrass lignin (Stipa tenacissima L.) obtained by the CIMV process in-dicated the complete absence of protonated molecules of syringylaldehyde at m/z 209 and syringyl alcohol at m/z 211 and any de-rived dimers or trimers and derived units (Fig. 45).
These results seem to confirm that additional chemical manipu-lations of the VRL alfa grass lignin give specious results. The resultspresented in this section seem in general to make a distinction be-tween VRL and PML analytes obtained by series of different analyt-ical methods.
Conclusion
In this review article, we have introduced two new terms to distin-guish lignins in accordance with the processes used to extract themfrom crops. Accordingly, we have named VRLs as those that havebeen released from the lignocellulosic cellular material by a simpleone-step hydrolysis process. They could be considered as unmodi-fied lignins with structures similar to native lignins present in theglycolignin network. The term PMLs is used for lignins obtainedby other chemical or mechanical means followed by other steps in-cluding purification. Such multiple steps of extraction and purifica-tion appear to substantially affect the structure and properties ofthe lignins obtained.
Forthrightly, it would be over simplistic at this juncture to specu-late if the structure of the oligomers composing the VRL could be atrue representation of the natural lignin.
Analytical data currently available obtained from samples ex-tracted by established methods are likely to be insufficient to beconfident in assuring that the structure elucidated for VRL repre-sents the actual structure present in the glycolignin network thanfor PML. However, the structures determined for VRL samples

obtained directly from vegetable matter, after several simple stepssuch as washing with water and drying, should represent LOs withthe closest resemblance to native lignin biomolecules.[66,189]
To appreciate the enormous heterogeneity and complexity ofthe ionization of native lignin, the reader should consult the workof Lunsford, Peter and Yost[170] (refer to section Study of the Re-moval of the Lignin from Cellulose and Hemicellulose by Imagingwith Direct Matrix-assisted Laser Desorption/Ionization TandemMass Spectrometry). They used direct imaging by MALDI-TOF-MSof cellulose and hemicellulose in intact wood tissue, in the presenceof assorted LOs to show that there is a multitude of real oligomericsignal ions, which cannot be assigned as background noise, but re-sults from the presence of a pack of different LOs. Evidently, thesedo not represent one and/or various linear and/or branched ligninpolymers. If that were to have been the case, then it would havebeen logical to expect fewer ions for such intact hypothetical ligninpolymer chain to have been present between the cellulose poly-mers as viewed by MALDI-TOF-MS direct imaging. Even after basetreatment of the analysed tissue, when the oligomeric signals hadbeen removed from the wood tissue, their presence was stilldetected.
Similar presence of a multitude of oligomeric ions was also ob-served for APPI-QqTOF-MS, ESI-QqTOF-MS and MALDI-TOF/TOF-MS analyses of various VRL extracted from pine and oak lignins.Therefore, the presence of such complex series of oligomeric ionsprovide excellent evidence to support the similarity between VRLand the complex series of oligomeric ions observed by direct imag-ing using MALDI-TOF-MS, of cellulose and hemicellulose in intactwood tissue.
In addition, Araújo et al. have usedMALDI-IMS to study the nativelignin composition of Eucalyptus.[184] The authors were capable toimage 22 out of the 24 compounds described by Kiyota et al., whichembodied the main soluble lignin monomers and dimers and tri-mers in cane sugar.[108,184] This indicated that the native ligninsoligomers are indeed present as an enormous conglomerate ofsimple monomer, dimer, trimer and oligomers.[108,184]
Accordingly, on the basis of the results of Lunsford et al., Araújoet al.[169,184] and our ESI-MS and APPI-MS of the CIMV straw, oakand pine lignins, we propose a new paradigm. Intact natural ligninspresent in the lignocellulosic biomass are not actually either oneand/or series of similar biomolecules, like an individual cellulose fi-bre; instead, they are composed of a series of different length linearrelated biosynthesized oligomers. These oligomers may well beformed either from homoligomers repeating units and/or couldbe heteroligomers formed by mixed units. These have never beencompletely described in their natural unprocessed form. In addi-tion, it is proposed that lignins present in the lignocellulosic bio-mass are attached covalently in a criss-cross manner to bothcellulose and hemicellulose fibres, forming a glycolignin network.
Because of the complementary nature of APPI and ESI, whenanalysing VRL and PML byMS, it is recommended that both sourcesshould be used to obtain best structural indices for lignin structuresand compositions. In addition, the use of either ESI, APPI and/orMALDI ionizations with either a high-field FT-ICR-MS and/or anorbitrap analysers is advised as it should provide unprecedentedresolution and should enable the allocation of more precise struc-tural information on the lignin molecules.[71]
We propose that obtaining purified lignin by any process thatis outlined in the supplementary part of this review isunachievable, especially when using GPC as a tool for purifica-tion. It is the view of the authors that a purified lignin has neverbeen isolated. On the other hand, what lignin researchers most
probably have meant, when they attribute a lignin as being pure,is that they have obtained a fractionated heterogeneous mixtureof LOs. Such were obtained by chemical modifications of the na-tive lignin material.
In the 21st century and in the age of lignomics, the authors feelthat lignin scientists should not be afraid to seek solutions awayfrom their modus operandi established protocols. Yet, the fieldshould rely more on adapting the state-of-the-art new technologiesfor the better structural elucidation of VRL rather than PML.
It is particular significance in this field to note that no highmolec-ular weight lignins between 10 000 to 100000Da have not yet beenreported using variousmass spectrometric analyses including APPI-MS, ESI-MS and MALDI-MS. This is not due to any limitations of themass ranges of thesemodernMS instruments but to the probabilitythat such large lignin molecules have either not been isolated andor do not exist.
In this review, the new concept of top–down lignomic strategyemploying MS/MS is introduced. The de novo top–downlignomic strategy is described as the identification by MS ofthe VRL-type lignins. Moreover, the top–down approach enablesdirect measurement of the intact mass of the heterogeneousLOs, as well as fragment ion information relating to the originaloligomer lignin sequences. The structural characterization andsequence of the various oligomers present in VRL are performedby MS/MS. This strategy allows the identification of all the com-ponents of the intact non-modified virgin lignins (VRL) beinganalysed, which can also be considered as crude lignin. In addi-tion to our VRL sequencing of the CIMV wheat straw, it is note-worthy that the following authors, Moreel et al. (APCI-MS/MS-based Sequencing of Oligolignols), Kyota et al. (Ultrahigh-perfor-mance Liquid Chromatography ESI-MS and MS/MS Analysis ofSugar Cane Soluble Lignin), Hauper et al. (APCI-MS/MS and ESI-MS/MS Characterization of PML and Model Lignin Compounds)and Owen et al. (Characterization of VRL Degradation Productsby HPLC-ESI-MSn) have already studied de novo top–downlignomic approach but without naming it as such.
We sincerely hope that the reader can comprehend the intri-cacy of the different types of lignin and the convolutionresulting from the chemistry directed towards their structuralelucidation.
In summary, the complexity of the structural determination of lig-nins has been described, and the search for the native structure of apure lignin will continue. We do hope that the reader of this reviewis able to capture the excitement of recent achievements in MS-based lignomics and how they might play a role towards a moreprofound understand of the intrigues of lignin structureelucidation.
Acknowledgements
The authors would like to acknowledge an anonymous refereefor his courage editing our draft and who was extremely gen-erous with his constructive comments and corrections thathave contributed to this new edition of this review. Theauthors would like to thank the Editors of JMS ProfessorsRichard Caprioli and Pierre Chaurand for their resilient supportand encouragement.
References[1] J. Bidlack, M. Malone, R. Benson. Molecular structure and component
integration of secondary cell walls in plants. Proc. Oklahoma Acad. Sci.1992, 72, 51.

[2] R. D. Perlack, L. L. Wright, A. F. Turhollow, R. L. Graham, B. J. Stokes,D. C. Erbach. Biomass as a feedstock for a bioenergy andbioproducts industry: the technical feasibility of a billion tonannual supply. The US Department of Agriculture (USDA) andEnergy (DOE) report, 2005. http://www1.eere.energy.gov/biomass/pdfs/final_billionton_vision_report2.pdf (accessed on April 2005).
[3] K. Esau. Cell Wall. In Plant anatomy, Wiley-Blackwell (ed). John Wileyand Sons: New York, 1977, 43–60.
[4] K. Keegstra, K. W. Talmadge, W. D. Bauer, P. Albersheim. The structureof plant cell walls. III. A model of the walls of suspension-culturedsycamore cells based on the interconnections of themacromolecular components. Plant Physiol. 1973, 51, 188.
[5] (a) D. W. Jones. Cellulose and Cellulose Derivatives, vol. 5, part 4, HighPolymers, M. N. Bikales, L. Segal (Eds). Wiley Interscience: New York,1971, 117–121; (b) O. Ellefsen, B. A. Tonnesen. Cellulose and CelluloseDerivatives, M. N. Bikales, L. Segal (Eds). Wiley Interscience: New York,1971, 151–180; (c) B. A. Tonnesen, O. Ellefsen. Cellulose and CelluloseDerivatives, M. N. Bikales, L. Segal (Eds). Wiley Interscience: New York,1971, 265–304; (d) R. H. Atalla. Adv. Chem. Ser. 1979, 181, 55.
[6] R. D. Preston. Polysaccharides conformation and cell wall function.Ann. Rev. Plant. Physiol. 1979, 30, 55.
[7] K. V. Sarkanen, C. H. Ludwig. Lignin: Occurrence, Formation, Structureand Reactions, K. V. Sarkanen, C. H. Ludwig (Eds). Wiley-Interscience:New York, 1971, 916–931.
[8] W. O. S. Doherty, P. Mousavioun, C. M. Fellows. Value-adding tocellulosic ethanol: lignin polymers. Ind. Crop Prod. 2011, 33(2), 259.
[9] J. H. Banoub, M. Delmas. Structural elucidation of the wheat strawlignin polymer by atmospheric pressure chemical ionization tandemmass spectrometry and matrix-assisted laser desorption/ionizationtime-of-flight mass spectrometry. J. Mass Spectrom. 2003, 38, 900and references therein.
[10] W. D. Bauer, K. W. Talmadge, K. Keegstra, P. Albersheim. The structureof plant cell walls. II. The hemicellulose of the walls of suspension-cultured Sycamore cells. Plant Physiol. 1973, 51, 174.
[11] G. Brunow. Methods to reveal the structure of lignin. In Lignin, HumicSubstances and Coal, Biopolymers, Vol. 1, M. Hofrichter, A. Steinbüchel(Eds). Wiley Blackwell: Michigan, USA, 2001, 89–116.
[12] A. Caño-Delgado, S. Penfield, C. Smith, M. Catley, M. Bevan. Reducedcellulose synthesis invokes lignifications and defense responses inArabidopsis thalina. Plant J. 2003, 34(3), 351.
[13] M. Tronchet, C. Balagué, T. Kroj, L. Jouanin, D. Roby. Cinnamyl alcoholdehydrogenases-C and D, key enzymes in lignin biosynthesis, play anessential role in disease resistance in Arabidopsis. Mol. Plant Pathol.2010, 11, 83.
[14] (a) K. Freudenberg. Biosynthesis and constitution of lignin. Nature1959, 183, 1152; (b) K. Freudenberg, H. Hess. Liebigs Ann. Chem.1926, 448, 126; (c) K. Freudenberg, H. Richtzenhain. Liebigs Ann.Chem. 1942, 552, 126.
[15] Y.-R. Chen, S. Sarkanen. Macromolecule replication during ligninbiosynthesis. Phytochemistry 2010, 71, 453.
[16] C. Lapierre. Chap 2. Determining lignin structure by chemicaldegradations. In Lignin and Lignans: Advances in Chemistry, C.Heitner, D. Dimmel, J. Schmidt (Eds). CRC Press: Boca radon , Florida,2010, 13–48 and references cited therein.
[17] H. Wang, P. de Vries Frits, Y. Jin. A win–win technique of stabilizingsand dune and purifying paper mill black-liquor. J. Environ. Sci.2009, 21, 488.
[18] W. Boerjan, J. Ralph, M. Baucher. Lignin Biosynthesis. Annu. Rev. PlantBiol. 2003, 54, 519.
[19] D. Harris, S. DeBolt. Synthesis, regulation and utilization oflignocellulosic biomass. Plant Biotechnol. J. 2010, 8, 244.
[20] M. M. Campbell, R. R. Sederoff. Variation in lignin content andcomposition. Mechanisms of control and implications for geneticimprovement of plants. Plant Physiol. 1996, 110, 3.
[21] W. G. Glasser. Lignin. In Pulp and Paper. Chemistry and ChemicalTechnology, Vol. 1, 3rd ed, J. P. Casey (Ed.). John Wiley & Sons: NewYork, 1980, 39–111.
[22] L. B. Davin, N. G. Lewis. Lignin primary structures and dirigent sites.Curr. Opin. Biotechnol. 2005, 16, 407 and references therein.
[23] M. Dolk, F. Pla, J. F. Yan, J. L. McCarthy. Lignin. 22. Macromolecularcharacteristics of alkali lignin from western hemlock wood.Macromolecules 1986, 19, 1464.
[24] J. Mlynar, S. Sarkanen. Renaissance in ultracentrifugal sedimentationequilibrium calibrations of size exclusion chromatographic elutionprofiles. In Strategies in Size Exclusion Chromatography, Vol. 635, M.
Potschka, P. L. Dubin (Eds). ACS Symposium Series, AmericanChemical Society: Washington, 1996, 379–400.
[25] K. Ruel, F. Barnoud, D. A. I. Goring. Lamellation in the S2-layer ofsoftwood tracheids as demonstrated by scanning transmissionelectron microscopy. Wood Sci. Technol. 1978, 12, 287.
[26] T. Hatakeyama, T. Yoshida, H. Hatakeyama. Thermal and viscoelasticproperties of in situ lignin. Tenth International Symposium on Woodand Pulping Chemistry, Vol. 1, 1999, 478.
[27] C. Crestini, F. Melone, M. Sette, R. Saladino. Milled Wood Lignin: Alinear oligomer. Biomacromolecules 2011, 12, 3928.
[28] L. B. Davin,M. Jourdes, A.M. Patten, K.-W. Kim,D. G. Vassão, N. G. Lewis.Dissection of lignin macromolecular configuration and assembly:comparison to related biochemical processes in allyl/propenylphenol and lignan biosynthesis. Nat. Prod. Rep. 2008, 25, 1015.
[29] L. B. Davin, A. M. Patten, M. Jourdes, N. G. Lewis. Lignins: a twenty-firstcentury challenge. In Biomass Recalcitrance – Deconstructing the PlantCell Wall for Bioenergy, M. E. Himmel (Ed.). Blackwell: Oxford, 2008,213–305.
[30] N. G. Lewis, L. B. Davin, S. Sarkanen. Lignin and lignan biosynthesis:distinctions and reconciliations. ACS Symposium Series, Vol. 697,1998, 1.
[31] G. P. Moss. Nomenclature of lignans and neolignans (IUPACRecommendations 2000). Pure Appl. Chem. 2000, 72, 1493.
[32] J. R. Weng, H. H. Ko, T. L. Yeh, H. C. Lin, C. N. Lin. Two newarylnaphthalide lignans and anti-platelet, constituents fromJusticia procumbens. Arch. Pharm. Pharm. Med. Chem. 2004, 337,207.
[33] H. Y. Hsu. Treating Cancer with Chinese Herbs. Oriental Healing ArtsInstitute: Los Angeles, 1982, 238–250.
[34] C. C. Chen, W. C. Hsin, F. N. Ko, Y. L. Huang, J. C. Ou, C. M. Teng.Antiplatelet arylnaphthalide lignans from Justicia procumbens. J. Nat.Prod. 1996, 59, 1149.
[35] C. C. Chen, W. C. Hsin, Y. L. Huang. Six new diarylbutane lignans fromJusticia procumbens. J. Nat. Prod. 1998, 61, 227.
[36] N. Fukamiya, K. H. Lee. Antitumor agents, 81. Justicidin-A andDiphyllin, two cytotoxic principles from Justicia procumbens. J. Nat.Prod. 1986, 49, 348.
[37] T. Umezawa. Phylogenetic distribution of lignan producing plants.Wood Res. 2003, 90, 27.
[38] S. Suzuki, T. Umezawa. Biosynthesis of lignans and norlignans. J. WoodSci. 2007, 53, 273.
[39] I. E. J. Milder, I. C. W. Arts, B. van de Putte, D. P. Venema,P. C. H. Hollman. Lignan contents of Dutch plant foods: a databaseincluding lariciresinol, pinoresinol, secoisolariciresinol andmatairesinol. Br. J. Nutr. 2005, 93, 393.
[40] A. I. Smeds, P. C. Eklund, R. E. Sjoholm, S. M. Willfor, S. Nishibe,T. Deyama, B. R. Holmbom. Quantification of a broad spectrum oflignans in cereals, oilseeds, and nuts. J. Agric. Food Chem. 2007, 55,1337.
[41] C. Frankenstein, U. Schmitt, G. Koch. Topochemical studies onmodified lignin distribution in the xylem of poplar (Populus spp.)after wounding. Ann. Bot. 2006, 97(2), 195.
[42] A. George, K. Tran, T. J. Morgan, P. I. Benke, C. Berrueco, E. Lorente,B. C. Wu, J. D. Keasling, S. Blake, B. M. Holmes. The effect of ionicliquid cation and anion combinations on the macromolecularstructure of lignins. Green Chem. 2011, 1, 3375.
[43] R. J. A. Gosselink. Lignin as a renewable aromatic resource for thechemical industry. PhD Thesis, Wageningen University, Wageningen,NL, 2011.
[44] R. Vanholme, B. Demedts, K. Morreel, J. Ralph, W. Boerjan. Update onlignin biosynthesis and structure lignin biosynthesis and structure.Plant Physiol. 2010, 153, 895.
[45] Y. Barriere, C. Riboulet, V. Mechin, S. Maltese, M. Pichon, A. Cardinal,C. Lapierre, T. Lubberstedt, J. P. Martinat. Genetics and genomics oflignification in grass cell walls based on maize as a model soecies.Genes, Genomes Genomics 2007, 1(2), 133.
[46] T. I. Eglinton, M. A. Goni, J. J. Boon, E. R. E. Van der Hage,N. Terashima, Y. Xie. Incorporation of 13C-labeled coniferyl alcoholinto developing Ginkgo biloba L. lignin revealed by analyticalpyrolysis and CuO oxidation in combination with isotope ratiomonitoring – Gas chromatography–mass spectrometry.Holzforschung 2000, 54, 39.
[47] S. Reale, A. Di Tullio, N. Spreti, F. De Angelis. Mass spectrometry in thebiosynthetic and structural investigation of lignins. Mass Spectrom.Rev. 2004, 23, 87.

[48] K. V. Sarkanen, A. Islam, C. D. Anderson. Ozonation. In Methods inLignin Chemistry, S. Y. Lin, C. W. Dence (Eds). Springer-Verlag: Berlin,1992, 387 and reference therein.
[49] K. V. Sarkanen. Lignin precursors and their polymerization. In Lignins:Occurrence, Formation and Reactions, K. V. Sarkanen, C. W. Ludwig(Eds). Wiley Interscience: New York, 1971, 95.
[50] S. Reale, A. Di Tullio, N. Spreti, F. De Angelis. Mass spectrometry in thebiosynthetic and structural investigation of lignins. Mass Spectrom.Rev. 2004, 23, 87.
[51] K. Syrjanen, G. Brunow. Oxidative cross coupling of p-hydroxycinnamic alcohols with dimeric arylglycerol β-aryl etherlignin model compounds. The effect of oxidation potentials.J. Chem. Soc. Perkin Trans. 1998, 1(20), 3425.
[52] L. B. Davin, N. G. Lewis. Dirigent proteins and dirigent sites explain themystery of specificity of radical precursor coupling in lignan and ligninbiosynthesis. Plant Physiol. 2000, 123, 453.
[53] D. R. Gang, M. A. Costa, M. Fujita, A. T. Dinkova-Kostova, H.-B. Wang,V. Burlat, W. Martin, S. Sarkanen, L. B. Davin, N. G. Lewis.Regiochemical control of monolignol radical coupling: a newparadigm for lignin and lignan biosynthesis. Chem. Biol. 1999, 6, 143.
[54] V. Burlat, M. Kwon, L. B. Davin, N. G. Lewis. Dirigent proteins anddirigent sites in lignifying tissues. Phytochemistry 2001, 57, 883.
[55] A. Maureen Rouhi. Only facts will end the lignin war. Chem. Eng. News2001, 79, 52.
[56] J. Ralph, G. Brunow, W. Boerjan. Lignins. John Wiley & Sons, Ltd:Hoboken, New Jersey, 2007.
[57] K. Morreel, H. Kim, F. Lu, O. Dima, T. Akiyama, R. Vanholme, C. Niculaes,G. Goeminne, D. Inzé, E. Messens, J. Ralph, W. Boerjan. Massspectrometry-based fragmentation as an identification tool inlignomics. Anal. Chem. 2010, 82, 8095.
[58] J. H. Lora, W. G. Glasser. Recent industrial applications of lignin: asustainable alternative to non-renewable materials. J. Polym. Environ.2002, 10, 39.
[59] D. Stewart. Lignin as a base material for materials applications:chemistry, application and economics. Ind. Crops Prod. 2008, 27, 202.
[60] R. T. Marthers. How well can renewable resources mimic commoditymonomers and polymers? J. Polym. Sci. Part A. 2012, 50(1), 1.
[61] J. Zakzeski, P. C. A. Bruijnincx, A. L. Jongerius, B. M. Weckhuysen. Thecatalytic valorization of lignin for the production of renewablechemicals. Chem. Rev. 2010, 110, 3552.
[62] J. MacKay, D. R. Dimmel, J. J. Boon. Pyrolysis mass spectralcharacterization of wood from CAD-deficient pine. J. Wood Chem.Tech. 2001, 21, 19.
[63] I. Fachuang, J. Ralph. Derivatization followed by reductive cleavage(DFRC Method), a new method for lignin analysis: protocol foranalysis of DFRC monomers. J. Agric. Food Chem. 1997, 45, 2590.
[64] J. O. Metzger, C. Bicke, O. Faix, W. Tuszynski, R. Angermann, M. Karas,K. Strupat. Matrix-assisted laser desorption mass spectrometry oflignins. Angew. Chem. Int. Ed. Engl. 1992, 31, 762.
[65] F. de Angelis, R. Nicoletti, N. Spreti, F. Verì. A new in vitro model oflignin biosynthesis. Angew. Chem. Int. Ed. Engl. 1999, 38, 1283.
[66] J. C. del Rio, J. Rencoret, P. Prinsen, A. T. Martinez, J. Ralph, A. Gutierrez.Structure characterization of wheat straw lignin as revealed byanalytical pyrolysis, 2D-NMR, and reductive cleavage methods.J. Agric. Food Chem. 2012, 60, 5922.
[67] R. Seraglia, L. Molin, I. Isak, P. Traldi. Investigation on the role ofpneumatic aspects in electrospray, desorption electrospray surfaceionization and surface activated chemical ionization. Eur. J. MassSpectrom. (Chichester, Eng) 2012, 18(2), 195.
[68] T. J. Kauppila, T. Kotiaho, R. Kostiainen, A. P. Bruins. Negative ionatmospheric pressure photoionization-mass spectrometry. J. Am.Soc. Mass Spectrom. 2004, 15(2), 203.
[69] P. Kebarle, M. Pesche. On the mechanism by which the chargeddroplets produced by electrospray lead to gas phase ions. Anal.Chim. Acta 2000, 406, 11 and references therein.
[70] T. J. Kauppila, R. Kostiainen, A. P. Bruins. Anisole, a new dopant foratmospheric pressure photoionization-mass spectrometry of lowproton affinity, low ionization energy compounds. Rapid Commun.Mass Spectrom. 2004, 18, 808.
[71] W. C. Hockaday, J. M. Purcell, A. G. Marshall, J. A. Baldock, P. G. Hatcher.Electrospray and photoionization mass spectrometry for thecharacterization of organic matter in natural waters: a qualitativeassessment.Limnol.Oceanogr.Meth.2009,7, 81andreferencestherein.
[72] S. S. Cai, J. A. Syage. Comparison of atmospheric pressurephotoionization, atmospheric pressure chemical ionization, and
electrospray ionization mass spectrometry for analysis of lipids. Anal.Chem. 2006, 78(4), 1191.
[73] J. Ralph, K. Lundquist, G. Brunow, F. Lu, H. Kim, P. Schatz, J. Marita,R. Hatfield, S. Ralph, J. Christensen, W. Boerjan. Lignins: naturalpolymers from oxidative coupling of 4-hydroxyphenyl propanoids.Phytochemistry Rev. 2004, 3, 29.
[74] D. B. Robb, M. W. Blades. State of the art in APPI for LC/MS. Anal. Chim.Acta 2008, 627(1), 34.
[75] M. Takino, K. Yamaguchi, T. Nakahara. Determination of carbamatepesticide residues in vegetables and fruits by liquidchromatography-atmospheric pressure photoionization-massspectrometry and atmospheric pressure chemical ionization-massspectrometry. J. Agric. Food Chem. 2004, 52(4), 727.
[76] N. Yoshioka, Y. Akiyama, T. Matsuoka, T. Mitsuhashi. Rapiddetermination of five post-harvest fungicides and metabolite incitrus fruits by liquid chromatography/time-of-flight massspectrometry with atmospheric pressure photoionization. FoodControl 2010, 21(2), 212.
[77] S. S. Cai, J. A. Syage, K. A. Hanold, M. P. Balogh. Ultra performanceliquid chromatography-atmospheric pressure photoionization-tandem mass spectrometry for high-sensitivity and high-throughputanalysis of US Environmental Protection Agency 16 PriorityPollutants Polynuclear Aromatic Hydrocarbons. Anal. Chem. 2009,81(6), 2123.
[78] S. Roy, A. Delobel, K. Gaudin, D. Touboul, D. P. Germain, A. Baillet,P. Progron, O. Laprévote, P. Chaminade. Liquid chromatography onporous graphitic carbon with atmospheric pressure photoionizationand tandem mass spectrometry for the analysis ofglycosphingolipids. J. Chromatogr. A 2006, 1117(2), 154.
[79] Y. X. Cai, D. Kingery, O. McConnell, A. C. Bach. Advantages ofatmospheric pressure photoionization mass spectrometry insupport of drug discovery. Rapid Commun. Mass Spectrom. 2005,19, 1717.
[80] J. L. Gomez-Ariza, T. Garcia-Barrera, F. Lorenzo. Anthocyanins profile asfingerprint of wines using atmospheric pressure photoionisationcoupled to quadrupole time-of-flight mass spectrometry. Anal.Chim. Acta 2006, 570, 101.
[81] M. Hiroshi, I. Miho, Y. Shisaku, M. Hidezaku, A. Jean-Francois.Determination of polycyclic aromatic hydrocarbons in sediment byliquid chromatography atmospheric pressure photoionization massspectrometry. Anal. Sci. 2004, 20, 375.
[82] E. A. Straube, W. Dekant, W. Volkel. Comparison of electrosprayionization, atmospheric pressure chemical ionization, andatmospheric pressure photoionization for the analysis ofdinitropyrene and aminonitropyrene LC-MS/MS. J. Am. Soc. MassSpectrom. 2004, 15, 1853.
[83] J. M. Purcell, C. L. Hendrickson, R. P. Rodgers, A. G. Marshall.Atmospheric pressure photoionization Fourier transform ioncyclotron resonance mass spectrometry for complex mixtureanalysis. Anal. Chem. 2006, 78, 5906.
[84] J. Zheng, S. A. Shamsi. Capillary electrochromatography coupled toatmospheric pressure photoionization mass spectrometry formethylated benzo[α]pyrene isomers. Anal. Chem. 2006, 78(19), 6921.
[85] M. Takino, S. Daishima, T. Nakahara. Determination ofchloramphenicol residues in fish meats by liquid chromatography-atmospheric pressure photoionization mass spectrometry.J. Chromatogr. A 2003, 1011, 67.
[86] N. Yoshioka, Y. Akiyama, K. Teranishi. Rapid simultaneousdetermination of o-phenylphenol, diphenyl, thiabendazole, imazaliland its major metabolite in citrus fruits by liquid chromatography-mass spectrometry using atmospheric pressure photoionization.J. Chromatogr. A 2004, 1022, 145.
[87] J. M. Purcell. Atmospheric pressure photoionization proton transferfor complex organic mixtures investigated by Fourier transform ioncyclotron resonance mass spectrometry. J. Am. Soc. Mass Spectrom.2007, 18, 1682.
[88] J. H. Banoub, B. Benjelloun-Mlayah, F. Ziarelli, N. Joly, M. Delmas.Elucidation of the complex molecular structure of wheat strawlignin polymer by atmospheric pressure photoionization quadrupoletime-of-flight tandem mass spectrometry. Rapid Commun. MassSpectrom. 2007, 21, 2867.
[89] A. C. Stenson, A. G. Marshall, W. T. Cooper. Exact masses and chemicalformulas of individual Suwannee River fulvic acids from ultrahighresolution electrospray ionization fourier transform ion cyclotronresonance mass spectra. Anal. Chem. 2003, 75, 1275.

[90] E. B. Kujawinski, P. G. Hatcher, M. A. Freitas. High-resolution Fouriertransform ion cyclotron resonance mass spectrometry of humic andfulvic acids: improvements and comparisons. Anal. Chem. 2002, 74, 413.
[91] K. Morreel, J. Ralph, H. Kim, F. Lu, G. Goeminne, S. Ralph,E. Messens, W. Boerjan. Profiling of oligolignols revealsmonolignol coupling conditions in lignifying poplar xylem. PlantPhysiol. 2004, 136, 3537.
[92] I. Damiani, K. Morreel, S. Danoun, G. Goeminne, N. Yahiaoui,C. Marque, J. Kopka, E. Messens, D. Goffner, W. Boerjan,A. M. Boudet, S. Rochange. Metabolite profiling reveals a role foratypical cinnamyl alcohol dehydrogenase CAD1 in the synthesis ofconiferyl alcohol in tobacco xylem. Plant Mol. Biol. 2005, 59, 753.
[93] J. C. Leplé, R. Dauwe, K. Morreel, V. Storme, C. Lapierre, B. Pollet,A. Naumann, K. Y. Kang, H. Kim, K. Ruel, J.-C. Leplé, R. Dauwe,K. Morreel, V. Storme, C. Lapierre, B. Pollet, A. Naumann, K.-Y. Kang,H. Kim, K. Ruel, A. Lefèbvre, J.-P. Joseleau, J. Grima-Pettenati,R. De Rycke, S. Andersson-Gunnerås, A. Erban, I. Fehrle, M. Petit-Conil,J. Kopka, A. Polle, E. Messens, B. Sundberg, S. D. Mansfield, J. Ralph,G. Pilate, W. Boerjan. Downregulation of cinnamoylcoenzyme Areductase in poplar: multiple-level phenotyping reveals effects oncell wall polymer metabolism and structure. Plant Cell 2007, 19, 3669.
[94] K. Morreel, O. Dima, H. Kim, F. Lu, C. Niculaes, R. Vanhome, R. Dauwe,G. Goeminne, D. Inzé, E. Messens, J. Ralph, W. Boerjan. Massspectrometry-based sequencing of lignin oligomers. Plant Physiol.2010, 153, 1464.
[95] J. H. Bowie. The fragmentations of even-electron organic negativeions. Mass Spectrom. Rev. 1990, 9, 349.
[96] K. Morreel, H. Kim, F. Lu, O. Dima, T. Akiyama, R. Vanholme, C. Niculaes,G. Goeminne, D. Inzé, E. Messens, J. Ralph, W. Boerjan. Massspectrometry-based fragmentation as an identification tool inlignomics. Anal. Chem. 2010, 82, 8095.
[97] R. Huis, K. Morreel, O. Fliniaux, A. Lucau-Danila, S. Fénart,S. Grec, G. Neutelings, B. Chabbert, F. Mesnard, W. Boerjan,S. Hawkins. Natural Hypolignification is associated withextensive oligolignol accumulation in flax stems. Plant Physiol.2012, 158(4), 1893.
[98] M. Thevis, W. Schanzer, H. Schmickler. Effect of the location ofhydrogen abstraction on the fragmentation of diuretics in negativeelectrospray ionization mass spectrometry. J. Am. Soc. MassSpectrom. 2003, 4, 658.
[99] C. Cheng, M. L. Gross. Applications andmechanisms of charge-remotefragmentation. Mass Spectrom. Rev. 2000, 19, 398.
[100] C. E. Costello, J. M. Contado-Miller, J. F. Cipollo. A glycomics platformfor the analysis of permethylated oligosaccharide alditols. J. Am. Soc.Mass Spectrom. 2007, 18, 1799.
[101] B. Domon, C. E. Costello. Structure elucidation of glycosphingolipidsand gangliosides using high-performance tandem massspectrometry. Biochemistry 1988, 27, 1534.
[102] B. Domon, C. E. Costello. A systematic nomenclature for carbohydratefragmentationsin FAB-MS/MS spectra of glycoconjugates.Glycoconj. J.1988, 5, 397.
[103] S. A. McLuckey, G. J. Van Berkel, G. L. Glish. Tandem mass-spectrometry of small multiply charged oligonucleotides. J. Am. Soc.Mass Spectrom. 1992, 3, 60.
[104] P. Roepstorff, J. Fohlman. Proposal for a common nomenclature forsequence ions in mass spectra of peptides. Biol. Mass Spectrom.1984, 11, 601.
[105] R. S. Johnson, S. A. Martin, K. Biemann, J. T. Stults, J. T. Watson. Novelfragmentation process of peptides by collision-induceddecomposition in a tandem mass spectrometer: differentiation ofleucine and isoleucine. Anal. Chem. 1987, 59, 2621.
[106] D. V. Evtuguin, C. P. Neto, F. M. L. Amado, A. M. S. Silva, D. Robert,P. M. Domingues, O. Faix. Comprehensive study on the chemicalstructure of dioxane lignin from plantation eucalyptus globuluswood. J. Agric. Food Chem. 2001, 49, 4252.
[107] D. V. Evtuguin, F. M. L. Amado. Application of ESI-MS to the elucidationof the primary structure of lignin. Macromol. Biosci. 2003, 3, 339.
[108] E. Kiyota, P. Mazzafera, A. C. Sawaya. Analysis of soluble lignin insugarcane by ultrahigh performance liquid chromatography-tandem mass spectrometry with a do-it-yourself oligomer database.Anal. Chem. 2012, 84(16), 7015.
[109] M. Dachtler, F. H. M. van de Put, F. von Stijn, C. M. Beindorff, J. Fritsche.On-line LC-NMR-MS characterization of sesame oil extracts andassessment of their antioxidant activity. Eur. J. Lipid Sci. Tech. 2003,105, 488.
[110] A. Kamal-Eldin, L. A. Appelqvist, G. Yousif. Lignan analysis in seed oilsfrom four Sesamum species: comparison of differentchromatographic methods. J. Am. Oil Chem. Soc. 1994, 71, 141.
[111] A. Kamal-Eldin, L. A. Appelqvist. Variations in the composition ofsterols, tocopherols and lignans in seed oils from four Sesamumspecies. J. Am. Oil Chem. Soc. 1994, 71, 149.
[112] Y. S. Shyu, L. S. Hwang. Antioxidative activity of the crude extract oflignin glycosides from unroasted Burma black sesame meal. FoodRes. Int. 2002, 35, 357.
[113] A. A. Moazzami, R. E. Andersson, A. Kamal-Eldin. Characterization andanalysis of sesamolinol diglucoside in sesame seeds. Biosci. Biotechnol.Biochem. 2006, 70, 1478.
[114] A. A. Moazzami, R. E. Andersson, A. Kamal-Eldin. HPLC analysis ofsesaminol glucosides in sesame seeds. J. Agric. Food Chem. 2006, 54,633.
[115] K. P. Suja, A. Jayalekshmy, C. Arumughan. Free radical scavengingbehavior of antioxidant compounds of sesame (Sesamum indicumL.) in DPPH center dot system. J. Agric. Food Chem. 2004, 52, 912.
[116] Y. Jiao, L. B. Davin, N. G. Lewis. Furanofuran lignan metabolism as afunction of seed maturation in Sesamum indicum: methylenedioxybridge formation. Phytochemistry 1998, 49, 387.
[117] E. Ono, M. Nakai, Y. Fukui, N. Tomimori, M. Fukuchi-Mizutani, M. Saito,H. Satake, T. Tanaka, M. Katsuta, T. Umezawa, Y. Tanaka. Formation oftwo methylenedioxy bridges by a Sesamum CYP81Q protein yieldinga furofuran lignan, (+)-sesamin. Proc. Natl. Acad. Sci. U. S. A. 2006, 103,10116.
[118] K. Struijs, J.-P. Vincken, H. Gruppen. Comparison of atmosphericpressure chemical ionization and electrospray ionization massspectrometry for the detection of lignans from sesame seeds. RapidCommun. Mass Spectrom. 2008, 22(22), 3615.
[119] M. Nagata, T. Osawa, M. Namiki, Y. Fukuda, T. Ozaki. Stereochemicalstructures of antioxidative bisepoxylignans, sesaminol and itsisomers, transformed from sesamolin. Agric. Biol. Chem. 1987, 51, 1285.
[120] P. C. Eklund, M. J. Backman, L. A. Kronberg, A. I. Smeds,R. E. Sjoholm. Identification of lignans by liquid chromatography-electrospray ionization ion-trap mass spectrometry. J. MassSpectrom. 2008, 43, 97.
[121] M. Ye, Y. N. Yan, D. A. Guo. Characterization of phenolic compounds inthe Chinese herbal drug Tu–Si–Zi by liquid chromatography coupledto electrospray ionization mass spectrometry. Rapid Commun. MassSpectrom. 2005, 19, 1469.
[122] G. Q. Yan, Q. R. Li, H. R. Tan, T. F. Ge. Electrospray ionization ion-traptime-offlight tandem mass spectrometry of two furofurans: sesaminand gmelinol. Rapid Commun. Mass Spectrom. 2007, 21, 3613.
[123] L. J. Haupert, B. C. Owen, C. L. Marcum, T. M. Jarrell, C. J. Pulliam,L. M. Amundson, P. Narra, M. S. Aqueel, T. H. Parsell, M. M. Abu-Omar,H. I. Kenttamaa. Characterization of model compounds of processedlignin and the lignome by using atmospheric pressure ionizationtandem mass spectrometry. Fuel 2012, 95, 634.
[124] B. C. Owen, L. J. Haupert, T. M. Jarrell, C. L. Marcum, T. H. Parsell,M. M. Abu-Omar, J. J. Bozell, K. Black, H. Kenttämaa. High-performance liquid chromatography/high-resolution multiple stagetandem mass spectrometry using negative-ion-mode hydroxide-doped electrospray ionization for the characterization of lignindegradation products. Anal. Chem. 2012, 84, 6000.
[125] P. C. Pinto, D. V. Evtuguin, C. P. Neto, A. J. D. Silvestre, F. M. L. Amado.Behavior of Eucalyptus globulus lignin Kraft, NMR, ESI-MS, and GPC.J. Wood Chem. Tech. 2002, 22(2–3), 109.
[126] A. A. Shatalov, D. V. Evtuguin, C. Pascoal Neto. (2-O-α-D-Galactopyranosyl-4-O-methyl-α-D glucurono)-D-xylan from Eucalyptusglobulus labill. Carbohydr. Res. 1999, 320, 93.
[127] B. L. Browning. Methods in Wood Chemistry, Vol. II. IntersciencePublishers: New York, 1967, 732–734.
[128] G. F. Zakis. Synthesis of Lignin Model Compounds, Zinatne, Riga, 1980.[129] H. Onnerud, M. Palmblad, G. Gellerstedt. Investigation of lignin
oligomers using electrospray ionisation mass spectrometry.Holzforschung 2003, 57, 37.
[130] C. Rolando, B. Monties, C. Lapierre. Thioacidolysis. Springer Series inWood Science, Springer Verlag: Berlin, 1992, 334–349.
[131] E. Kendrick. A mass scale based on CH, = 14.0000 for high resolutionmass spectrometry oforganic compounds.Anal. Chem.1963, 35, 2146.
[132] E. B. Kujawinski,M. A. Freitas, X. Zang, P. G. Hatcher, K. B. Green-Church,R. B. Jone. The application of electrospray ionization massspectrometry (ESI-MS) to the structural characterization of naturalorganic matter.Org. Geochem. 2002, 33, 171.

[133] K. D. Henry, F. W. McLafferty. Electrospray ionization with Fourier-transform mass spectrometry. Charge state assignment fromresolved isotopic peaks. Org. Mass Spectrom. 1990, 25, 490.
[134] X. Huang, F. Song, Z. Liu, S. Liu. Studies on lignan constituents fromSchisandra chinensis (Turcz.) Baill. Fruits using high-performanceliquid chromatography/electrospray ionization multiple-stagetandem MS. J. Mass Spectrom. 2007, 42(9), 1148.
[135] R. Vanholme, B. Demedts, K. Morreel, J. Ralph, W. Boerjan. Ligninbiosynthesis and structure. Plant Physiol. 2010, 153(3), 895.
[136] K. Ruel, J. Berrio-Sierra, M. Mir Derikvand, B. Pollet, J. Thévenin,C. Lapierre, L. Jouanin, J.-P. Joseleau. Impact of CCR1 silencing onthe assembly of lignified secondary walls in Arabidopsis thaliana.New Phytol. 2009, 184(1), 99.
[137] J. B. Fenn, M. Mann, C. K. Meng, S. F. Wong, C. M. Whitehouse.Electrospray ionization for mass spectrometry of large biomolecules.Science 1989, 246(4926), 64.
[138] K. Tanaka. The origin of macromolecule ionization by laser irradiation(Nobel Lecture). Angew. Chem. Int. Ed. 2003, 42(33), 3860.
[139] K. Wüthrich. Nuclear magnetic resonance spectroscopy fordetermining the three-dimensional structure of biologicalmacromolecules in solution. Nobel Lecture, 2002, 235.
[140] J. M. Zhou, R. K. Ibrahim. Tricin – a potential multifunctionalnutraceutical. Phytochem. Rev. 2010, 9, 413.
[141] D. H. Kim, B. G. Kim, Y. S. Lee, Y. R. Ji, Y. H. Lim, H. G. Hur, J. H. Ahn.Regiospecific methylation of naringenin to ponciretin by soybean O-methyltransferase expressed in Escherichia coli. J. Biotechnol. 2005,119(2), 155.
[142] G. Schrödera, E. Wehinger, R. Luka, F. Wellmann, W. Seefelder,W. Schwab, J. Schröder. Flavonoid methylation: a novel 4′-O-methyltransferase from Catharanthus roseus, and evidence thatpartially methylated flavanones are substrates of four differentflavonoid dioxygenases. Phytochemistry 2004, 65(8), 1085.
[143] B. G. Kim, Y. S. Lee, H. G. Hur, Y. H. Lima, J. H. Ahn. Flavonoid 3′-O-methyltransferase from rice: cDNA cloning, characterization andfunctional expression. Phytochemistry 2006, 67(4), 387.
[144] H. Cai, W. P. Steward, A. J. Gescher. Determination of the putativecancer chemopreventive flavone tricin in plasma and tissues ofmice by HPLC with UV-visible detection. Biomed. Chromatogr. 2005,19, 518.
[145] A. Björkman. Studies on finely divided wood. Part I. Extraction of ligninwith neutral solvents. Sven. Papperstidn 1956, 13, 477.
[146] A. Guerra, I. Filpponen, L. A. Lucia, C. Saquing, S. Baumberger,D. S. Argyropoulos. Toward a better understanding of thelignin isolation process from wood. J. Agric. Food Chem. 2006,54, 5939.
[147] B. Benjelloun-Mlayah, G. Avignon, M. Delmas. Installation forimplementing a method for producing paper pulp, lignins andsugars and production method using such an installation. Patent n°WO 2006117295 A1, 2006.
[148] M. Delmas. Vegetal Refining and Agrochemistry. Chem. Eng. Technol.2008, 31(5), 792.
[149] G.-H. Delmas, B. Benjelloun-Mlayah, Y. Le Bigot, M. Delmas.Functionality of wheat straw lignin extracted in organic acid media.J. App. Sci. 2011, 121(1), 191.
[150] J. H. Banoub, G.-H. Delmas, N. Cachet, B. Benjelloun-Mlayah,M. Delmas, unpublished results.
[151] K. L. Busch. Special feature: Tutorial. Desorption ionization massspectrometry. J. Mass Spectrom. 1995, 30, 233.
[152] K. Yoshioka, D. Ando, T. Watanabe. A comparative study of matrix andnano LDI-TOF-MS of isolated and synthetic lignin. Phytochem. Anal.2011, 23, 248.
[153] P. Bocchini, G. C. Galletti, R. Seraglia, P. Traldi, S. Camarero,A. T. Martinez. Matrix-assisted laser desorption/ionization massspectrometry of natural and synthetic lignin. Rapid Commun. MassSpectrom. 1996, 10, 1144.
[154] J.-Y. Liu, S.-B. Wu, R. Lou. Chemical structure and pyrolysis response ofβ–O–4 lignin model polymer. BioResources 2011, 6(2), 1079.
[155] T. Kishimoto, Y. Uraki, M. Ubukata. Synthesis of bromoacetophenonederivatives as starting monomers for β–O–4 type artificial ligninpolymers. J. Wood Chem. Tech. 2008, 28, 97.
[156] M.-L. Mattinen, T. Suortti, R. Gosselink, D. S. Argyropoulos, D. Evtuguin,A. Suurnakki, E. de Jong, T. Tamminen. Polymerization of differentlignins by laccase. BioResources 2008, 3(2), 549.
[157] A. Guerra, L. A. Lucia, D. S. Argyropoulos. Isolation and characterizationof lignins from Eucalyptus grandis Hill ex Maiden and Eucalyptus
globulus Labill. by enzymatic mild acidolysis (EMAL). Holzforschung2008, 62, 24.
[158] A. Jacobs, O. Dahlman. Absolute molar mass of lignins by sizeexclusion chromatography and MALDI-TOF mass spectrometry.Nord. Pulp Pap. Res. J. 2000, 15(2), 120.
[159] R. J. A. Gosselink. Lignin as a renewable aromatic resource for thechemical industry. Ph.D. Thesis, Wageningen University,Wageningen, NL, 2011.
[160] R. Bayerbach, V. D. Nguyen, U. Schurr, D. Meier. Characterization of thewater-insoluble fraction from fast pyrolysis liquids (pyrolytic lignin).Part III. Molar mass characteristics by SEC, MALDI-TOF-MS, LDI-TOF-MS and Py-FIMS. J. Anal. Appl. Pyrolysis 2006, 77, 95.
[161] K. Saito, T. Kato, Y. Tsuji, K. Fukushima. Identifying the characteristicsecondary ions of lignin polymer using SIMS-TOF.Biomacromolecules 2005, 6, 678.
[162] K. Saito, T. Kato, H. Takamori, T. Kishimoto, A. Yamamoto,K. Fukushima. A new analysis of the depolymerized fragments oflignin. Appl. Surf. Sci. 2006, 252(9), 6734.
[163] K. Saito, T. Mitsutani, T. Imai, Y. Matsushita, A. Yamamoto,K. Fukushima. Chemical differences between sapwood andheartwood of Chamaecyparis obtusa detected by SIMS-TOF. Appl.Surf. Sci. 2008, 255, 1088.
[164] E. N. Tokareva, A. V. Pranovich, P. Fardim, G. Daniel, B. Holmbom.Analysis of wood tissues by time-of-flight secondary ion massspectrometry. Holzforschung 2007, 61, 647.
[165] K. Koljonen, M. Oesterberg, M. Kleen, A. Fuhrmann, P. Stenius.Precipitation of lignin and extractives on kraft pulp: effect onsurface chemistry, surface morphology and paper strength. Cellulose(Dordrecht, Neth.) 2004, 11, 209.
[166] P. Fardim, N. Duran. Modification of fibre surfaces during pulping andrefining as analysed by SEM, XPS and ToFSIMS. Colloids Surf. A 2003,223, 263.
[167] E. S. F. Berman, K. S. Kulp, M. G. Knize, L. Wu, E. J. Nelson, D. O. Nelson,K. J. Wu. Distinguishing monosaccharide stereo- and structuralisomers with SIMS-TOF and multivariate statistical analysis. Anal.Chem. 2006, 78, 6497.
[168] R. E. Goacher, D. Jeremic, E. R. Master. Expanding the library ofsecondary ions that distinguish lignin and polysaccharides in time-of-flight secondary ion mass spectrometry analysis of wood. Anal.Chem. 2011, 83, 804.
[169] K. A. Lunsford, G. F. Peter, R. A. Yost. Direct matrix-assisted laserdesorption/ionization mass spectrometric imaging of cellulose andhemicellulose in Populus tissue. Anal. Chem. 2011, 83(17), 6722.
[170] S. Ding, Q. Xu, M. K. Ali, J. O. Baker, E. A. Bayer, Y. Barak, R. Lamed,J. Sugiyama, G. Rumbles, M. E. Himmel. Versatile derivatives ofcarbohydrate-binding modules for imaging of complexcarbohydrates approaching the molecular level of resolution.Biotechniques 2006, 41, 435.
[171] N. Ishida, M. Koizumi, H. Kano. The NMR microscope: a unique andpromising tool for plant science. Ann. Bot. 2000, 86, 259.
[172] J. V. D. Bulcke, B. Masschaele, M. Dierick, J. V. Acker, M. Stevens,L. V. Hoorebeke. Three-dimensional imaging and analysis of infestedcoated wood with X-ray submicron CT. Int. Biodeterior. Biodegrad.2008, 61, 278.
[173] U. P. Agarwal. Raman imaging to investigate ultrastructure andcomposition of plant cell walls: distribution of lignin and cellulose inblack spruce wood (Picea mariana). Planta 2006, 224, 1141.
[174] N. Gierlinger, M. Schwanninger. Chemical imaging of poplar wood cellwalls by confocal Raman microscopy. Plant Physiol. 2006, 140, 1246.
[175] A. M. Belu, D. J. Graham, D. G. Castner. Time-of-Flight secondary ionmass spectrometry: techniques and applications for thecharacterization of biomaterial surfaces. Biomaterials 2003, 24, 3635.
[176] R. N. S. Sodhi. Time-of-flight secondary ion mass spectrometry (SIMS-TOF): versatility in chemical and imaging surface analysis. Analyst2004, 129, 483.
[177] M. Karas, F. Hillenkamp. Laser desorption ionization of proteins withmolecular masses exceeding 10,000 daltons. Anal. Chem. 1988, 60,2299.
[178] R. M. Caprioli, T. B. Farmer, J. Gile. Molecular imaging of biologicalsamples: localization of peptides and proteins using MALDI-TOF MS.Anal. Chem. 1997, 69(23), 4751.
[179] T. J. Garrett, M. Prieto-Conaway, V. Kovtoun, H. Bui, N. Izgarian,G. Stafford, R. A. Yost. Imaging of small molecules in tissue sectionswith a new intermediate-pressure MALDI linear ion trap massspectrometer. Int. J. Mass Spectrom. 2007, 260, 166.

[180] L. A. McDonnell, R. M. A. Heeren. Imaging mass spectrometry. MassSpectrom. Rev. 2007, 26, 606.
[181] K. Kato, K. Endo, D. Matsumoto, T. Ida, K. Saito, K. Fukushima, N. Kato.Simulation of SIMS for monomer and dimer of lignin under theassumption of thermal decomposition using QMD method. Appl.Surf. Sci. 2008, 255(4), 1040.
[182] R. R. Landgraf, M. C. P. Conaway, T. J. Garrett, P. W. Stacpoole,R. A. Yost. Imaging of lipids in spinal cord using intermediatepressure matrix-assisted laser desorption-linear ion trap/OrbitrapMS. Anal. Chem. 2009, 81, 8488.
[183] R. F. Evert. Esau’s Plant Anatomy: Meristems, Cells, and Tissues of thePlant Body: Their Structure, Function and Development, 3rd ed. JohnWiley & Sons: Hoboken, NJ, 2006.
[184] P. Araújo, M. S. Ferreira, D. N. de Oliveira, L. Pereira, A. C. Sawaya,R. R. Catharino, P. Mazzafera. Mass spectrometry imaging: anexpeditious and powerful technique for fast in situ ligninassessment in eucalyptus. Anal. Chem. 2014, 86(7), 3415.
[185] D. N. de Oliveira, S. de Bona Sartor, M. S. Ferreira, R. R. Catharino.Cosmetic analysis using matrix-assisted laser desorption/ionizationmass spectrometry imaging (MALDI-MSI). Materials 2013, 6, 1000.
[186] A. Richel, C. Vanderghem, M. Simon, B. Wathelet, M. Paquot.Evaluation of MADLI-TOF-MS for second-generation lignin analysis.Anal. Chem. Insights 2012, 7, 79.
[187] C. Vanderghem, A. Richel, N. Jacquet, C. Blecker, M. Paquot. Impact offormic/acetic acid and ammonia pre-treatments on chemicalstructure and physico-chemical properties of Miscanthus x giganteuslignins. Polym. Degrad. Stab. 2011, 96, 1761.
[188] F. Abdelkafi, H. Ammar, B. Rousseau, M. Tessier, R. El Gharbi, A. Fradet.Structural analysis of Alfa grass (Stipa tenacissima L.) lignin obtained byacetic/formic acid delignification. Biomacromolecules 2011, 12, 3895.
[189] L. B. Davin, D. L. Bedgar, T. Katayama, N. G. Lewis. On thestereoselective synthesis of (1)-pinoresinol in Forsythia suspensafrom its achiral precursor, coniferyl alcohol. Phytochemistry 1992, 31,3869.
Supporting informationAdditional supporting information may be found in the online ver-sion of this article at the publisher’s web site.