a curriculum management audit - fayetteville public school · a curriculum management audit of the...
TRANSCRIPT

A Curriculum Management Auditof the
Fayetteville Public Schools
Fayetteville, Arkansas
Vandegriff students are using computers to do collaborative research
International Curriculum Management Audit CenterPhi Delta Kappa International
Eighth and UnionBloomington, Indiana 47404
February 2010

Fayetteville Public Schools Audit Report Page iii
A Curriculum Management Auditof the
FAYETTEVILLE PUBLIC SCHOOLS
Fayetteville, Arkansas
Conducted Under the Auspices ofInternational Curriculum Management Audit Center
Phi Delta Kappa InternationalP. O. Box 789
Bloomington, IN 47404-0789(Copyright use authorization obtained from
Curriculum Management Systems, Inc.P. O. Box 857, Johnston, IA 50131)
Date Audit Presented: March 2010
Members of the Fayetteville Public Schools Audit Team:
Senior Lead AuditorAudrey A. Hains, Ph.D.
AuditorsBetty Bates, M.S.Jim Ferrell, Ed. D.Larry Hunt, CAS

Fayetteville Public Schools Audit Report Page v
Table of Contents
I. INTRODUCTION ...........................................................................................................................................1
Background .................................................................................................................................................1
Audit Background and Scope of Work ..........................................................................................................7
System Purpose for Conducting the Audit ..............................................................................................8
Approach of the Audit .............................................................................................................................8
II. METHODOLOGY ..........................................................................................................................................9
The Model for the Curriculum Management Audit .......................................................................................9
A Schematic View of Curricular Quality Control .........................................................................................9
Standards for the Auditors ...........................................................................................................................10
Technical Expertise ...............................................................................................................................10
The Principle of Independence .............................................................................................................10
The Principle of Objectivity .................................................................................................................10
The Principle of Consistency ................................................................................................................10
The Principle of Materiality ..................................................................................................................11
The Principle of Full Disclosure ...........................................................................................................11
Data Sources of the Curriculum Management Audit ..................................................................................12
Standards for the Curriculum Audit ............................................................................................................12
III. FINDINGS ...................................................................................................................................................15
STANDARD 1: The School District Demonstrates Its Control of Resources, Programs, and Personnel. ........15
What the Auditors Expected to Find in the Fayetteville Public Schools: ...................................................15
Overview of What the Auditors Found in the Fayetteville Public Schools:................................................15
Finding 1.1: A scarcity of directives and specifi c board policies pertaining to curriculum and instruction does not provide for quality control of the curriculum. ......................................................16
Finding 1.2: Planning practices and plans did not provide quality direction for the design, deployment, and delivery of the district’s vision and goals. .................................................................31
Finding 1.3: The organization chart is inadequate to provide sound general management of the school district. Job descriptions do not adequately provide clear specifi cations of responsibilities for, relationship to, and linkage to curriculum. ...........................................................................................41
STANDARD 2: The School District Has Established Clear and Valid Objectives for Students. ......................49
What the Auditors Expected to Find in the Fayetteville Public Schools: ...................................................49
Overview of What the Auditors Found in the Fayetteville Public Schools:................................................49
Finding 2.1: Recent professional development initiatives are attempting to provide training that will lead to increased student achievement; however, suffi cient in-depth in-service and support for implementation in the classroom that is focused and coordinated district-wide has not been implemented. .........................................................................................................................................50
Fayetteville Public Schools Audit Report Page vi
Finding 2.2: The scope of the written curriculum is adequate in grades K-7, but inadequate in junior high and high school grades to provide direction for teachers in planning classroom instruction. ......55
Finding 2.3: The district curriculum guides are of insuffi cient quality to direct instruction and improve student achievement. ..............................................................................................................60
Finding 2.4: Professional development is inadequately planned, coordinated, monitored, and evaluated system-wide and does not consistently provide suffi cient in-depth training and support for successful implementation in the classroom leading to increased student achievement. .....................70
STANDARD 3: The School District Demonstrates Internal Consistency and Rational Equity in Its Program Development and Implementation. ....................................................................................................................79
What the Auditors Expected to Find in the Fayetteville Public Schools: ...................................................79
Overview of What the Auditors Found in the Fayetteville Public Schools:................................................79
Finding 3.1: Observed classroom instructional practices do not refl ect the district’s expectation for 21st Century student learning. ...............................................................................................................80
Finding 3.2: While the district is rich in technology equipment, the planning and staff development for the implementation and use of technology is inadequate to provide for integration of technology with instruction. ....................................................................................................................................89
STANDARD 4: The School District Uses the Results from System-Designed and/or -Adopted Assessments to Adjust, Improve, or Terminate Ineffective Practices or Programs. ....................................................................99
What the Auditors Expected to Find in the Fayetteville Public Schools: ...................................................99
Overview of What the Auditors Found in the Fayetteville Public Schools ...............................................100
Finding 4.1: Student assessment planning lacks a written plan and structured approach for evaluating curriculum and programs effectively. .................................................................................................100
Finding 4.2: The scope of assessment is inadequate to monitor and evaluate student progress and achievement in all areas of the curriculum and at all grade levels. ....................................................106
Finding 4.3: There are achievement gaps among subgroups of students that are increasing over time; student groups are not experiencing equal success. ............................................................................114
Finding 4.4: Use of data for curricular decision making is an emerging practice that has not yet become institutionalized system-wide. There is no systemic use of data for program evaluation. ...134
STANDARD 5: The School District Has Improved Productivity. ..................................................................145
What the Auditors Expected to Find in the Fayetteville Public Schools: .................................................145
Overview of What the Auditors Found in the Fayetteville Public Schools:..............................................145
Finding 5.1: The district’s budget development and decision making are not aligned to its mission, curricular goals, and strategic priorities, nor are cost-benefi t analyses being utilized to assure maximum productivity. .....................................................................................................................146
Finding 5.2: A process for identifying and addressing student achievement needs is addressed through the three-tier approach to interventions focused on frequent assessment data with emphasis on the grouping and re-grouping of students for instruction. .............................................................150
Finding 5.3: Long-range facility planning addresses the educational needs of the district; facilities provide sound educational settings for learning. ................................................................................154
Fayetteville Public Schools Audit Report Page vii
IV. RECOMMENDATIONS OF THE PDK-CMSi CURRICULUM MANAGEMENT AUDIT TEAM FOR THE IMPROVEMENT OF THE FAYETTEVILLE PUBLIC SCHOOLS .....................................................159
Recommendation 1: Develop and adopt board policies accompanied with Administrative Regulations approved by the superintendent that provide alignment of curriculum, instruction, and assessment with all district processes to provide local control of curriculum management. ................................159
Recommendation 2: Refocus all planning efforts to provide clear direction, coordination, prioritization, and sequencing of all initiatives at all levels and departments of the system. Require consistent monitoring and reporting of progress on all planning to key stakeholders to promote accountability, consistency, and alignment to district goals. ..............................................................161
Recommendation 3: Formalize, clarify, communicate, and document district expectations for curriculum management through board policies and a curriculum management process to provide district-wide direction for the design, delivery, monitoring, and evaluation of quality aligned curriculum for all subjects taught. ......................................................................................................163
Recommendation 4: Establish and implement comprehensive assessment and evaluation planning processes built on the skillful use of appropriate categories of data for monitoring the effectiveness of the district’s work at all levels, from the academic progress of individual students to the long-term effectiveness of district-wide programs. .............................................................................................165
Recommendation 5: Revise or design curriculum guides for all courses offered in the district based on a vertically articulated K-12 scope and sequence of local learner objectives aligned with the Arkansas Frameworks. Refi ne curriculum delivery strategies so that classroom activities are at an appropriate level of rigor and the classroom environment provides a focus for learning. .................167
Recommendation 6: Develop a goal-focused district staff development plan that incorporates emphasis on growth in curriculum implementation, effective instructional strategies, technology, and skilled data use for instructional and curricular decision making. Monitor district and school follow-through with intended training and establish methods to activate ongoing support in implementing and refi ning the skills learned. ............................................................................................................171
Recommendation 7: Incorporate technology into prioritized district-wide planning that will provide teachers with effective teaching strategies to enhance learning for all students. ..............................173
Recommendation 8: Develop and implement a budgeting process that aligns district and building-level resources to prioritized curricular goals. Include systematic cost-benefi t analyses using assessment data to assure that expenditures are producing desired results and are directed to the areas of greatest need. ..................................................................................................................................174
Recommendation 9: Develop and adopt an organization chart with corresponding written job descriptions and appraisals that will provide sound management with focus on the design and delivery of quality curriculum that will assist in attaining higher achievement for all students. .....................176
V. SUMMARY .................................................................................................................................................181
VI. APPENDICES ...........................................................................................................................................183
Appendix A: Auditors’ Biographical Data .........................................................................................185
Appendix B: List of Documents Reviewed .......................................................................................187
Appendix C: Elementary Rating, Language Arts Rating, Math Rating, Science Rating, Social Studies Rating, Foreign Language Rating, and Non-Core Subjects Rating ......................... 191

Fayetteville Public Schools Audit Report Page viii
Fayetteville Public Schools Audit Report Page ix
Table of Exhibits
Exhibit 0.1 Historical and Projected Enrollment ...............................................................................2
Exhibit 0.2 Ethnicity of Student Population .......................................................................................2
Exhibit 0.3 Mobility of Student Population by Schools .....................................................................3
Exhibit 0.4 Fayetteville Board of Education Members .......................................................................4
Exhibit 0.5 Superintendents ................................................................................................................5
Exhibit 0.6 District Vision, Mission, Core Purpose, Core Values, and Strategic Goals .....................6
Exhibit 1.1.1 Curriculum-Related Board Policies Reviewed by the Audit Team ................................17
Exhibit 1.1.2 Auditors’ Analysis of Board Policy and Administrative Regulation Audit Standard One to Determine Quality and Degree of Adequacy .............................................................18
Exhibit 1.1.3 Auditors’ Analysis of Board Policy and Administrative Regulation Audit Standard Two to Determine Quality and Degree of Adequacy .............................................................20
Exhibit 1.1.4 Auditors’ Analysis of Board Policy and Administrative Regulation Audit Standard Three to Determine Quality and Degree of Adequacy ...................................................22
Exhibit 1.1.5 Auditors’ Analysis of Board Policy and Administrative Regulation Audit Standard Four to Determine Quality and Degree of Adequacy .............................................................25
Exhibit 1.1.6 Auditors’ Analysis of Board Policy and Administrative Regulation Audit Standard Five to Determine Quality and Degree of Adequacy .............................................................26
Exhibit 1.1.7 Summary Ratings of the Auditors’ Analysis of Board Policy and Administrative Regulation To Determine Quality and Degree of Adequacy ..........................................29
Exhibit 1.2.1 Planning Documents Reviewed .....................................................................................31
Exhibit 1.2.2 Auditors’ Rating of CMA Characteristics of Quality Planning Design and Delivery ....32
Exhibit 1.2.3 CMA Characteristics of District-wide Plan Quality for Design, Deployment, and Delivery ..........................................................................................................................35
Exhibit 1.2.4 Department and School Improvement Plans for Design, Deployment, and Delivery ...38
Exhibit 1.3.1 Principles of Sound Organizational Management ..........................................................41
Exhibit 1.3.2 Primary Organization Chart ...........................................................................................42
Exhibit 1.3.3 Curriculum Audit Criteria for Rating Job Descriptions .................................................44
Exhibit 1.3.4 Quality of Job Descriptions Reviewed ...........................................................................45
Exhibit 2.1.1 Components of a Comprehensive Curriculum Development Plan ................................51
Exhibit 2.2.1 Scope of Curriculum Documents by Subject Area Course Offerings in Kindergarten Through Grade 7 ............................................................................................................56
Exhibit 2.2.2 Scope of Curriculum Documents by Subject Area Course Offerings in Grades 8-9 .....57
Exhibit 2.2.3 Scope of Curriculum Documents by Subject Area Course Offering in Grades 10-12 ...58
Exhibit 2.2.4 Summary of Scope of Curriculum Documents by Level ...............................................59
Exhibit 2.3.1 Curriculum Guide Audit Rubric for Assessing the Quality of Curriculum Guides CMA Curriculum “Guide” Analysis ........................................................................................61
Fayetteville Public Schools Audit Report Page x
Exhibit 2.3.2 Summary of Auditors’ Rating of K-12 Language Arts/English Curriculum Documents ......................................................................................................................62
Exhibit 2.3.3 Summary of Auditors’ Rating of K-12 Mathematics Guides .........................................63
Exhibit 2.3.4 Summary of Auditors’ Rating of K-12 Science Curriculum Documents .......................64
Exhibit 2.3.5 Auditors’ Rating of K-12 Social Studies Curriculum Documents .................................65
Exhibit 2.3.6 Auditors’ Rating of Foreign Language Curriculum Documents ....................................66
Exhibit 2.3.7 Auditors’ Rating of Non-Core Curriculum Documents .................................................67
Exhibit 2.3.8 Summary of Curriculum Document Quality by Criterion and Content Area ................68
Exhibit 2.4.1 Relevant Staff Development Documents Reviewed ......................................................71
Exhibit 2.4.2 Characteristics of a Comprehensive Professional Development Program and Auditors’ Assessment of District Approach ...................................................................................72
Exhibit 2.4.3 District Professional Development Offerings by Category ............................................74
Exhibit 3.1.1 Instructional Activity Classifi cation ...............................................................................81
Exhibit 3.1.2 Table of Frequency and Percentage of Observed Classroom Teacher Activities ...........82
Exhibit 3.1.3 Percentage of Major Classroom Teacher Activities .......................................................83
Exhibit 3.1.4 Table of Frequency and Percentage of Observed Classroom Student Activities ...........84
Exhibit 3.1.5 Percentage of Observed Classroom Student Activities ..................................................85
Exhibit 3.1.6 District Expectations with Observational Data ..............................................................86
Exhibit 3.1.7 Bloom’s Cognitive Types of Objectives .........................................................................87
Exhibit 3.1.8 Percent of Objectives Noted in Brief Classroom Visits Categorized by Cognitive Type ................................................................................................................................87
Exhibit 3.1.9 Analysis of Student Artifacts for Types of Cognition Required Using Bloom’s Taxonomy of Cognitive Domains ..................................................................................88
Exhibit 3.2.1 Technology Plan Quality Criteria and Auditors’ Assessment ........................................91
Exhibit 3.2.2 Use of Technology observed in the Classrooms ............................................................94
Exhibit 3.2.3 Ratio of Students to Computers at the Building Level ...................................................95
Exhibit 3.2.4 Teacher Laptop Survey, 2005 .........................................................................................96
Exhibit 4.1.1 Program Evaluation and Student Assessment Documents Reviewed ..........................101
Exhibit 4.1.2 Characteristics of a Comprehensive Approach to Student Assessment and Program Evaluation Planning and Auditors’ Assessment of the District’s Approach .................102
Exhibit 4.2.1 Formal Assessments of Student Performance ..............................................................107
Exhibit 4.2.2 Formal Assessments by Grade Level and Curriculum Area ........................................109
Exhibit 4.2.3 Scope of Elementary and Middle School Courses Formally Assessed ........................111
Exhibit 4.2.4 Scope of Junior High School Courses Formally Assessed ...........................................112
Exhibit 4.2.5 Scope of High School Courses Formally Assessed ......................................................113
Exhibit 4.2.6 Summary of Scope of Assessment with Auditors’ Ratings of Adequacy .....................114
Exhibit 4.3.1 Total District Enrollment ..............................................................................................115
Fayetteville Public Schools Audit Report Page xi
Exhibit 4.3.2 Enrollment by Ethnicity ...............................................................................................116
Exhibit 4.3.3 Enrollment Trends for non-White Students .................................................................116
Exhibit 4.3.4 State Literacy Exam Results Over Three Years Fayetteville Percent at Levels 3 and 4 Compared to State-wide Results ..................................................................................117
Exhibit 4.3.5 State Mathematics Exam Results Over Three Years Fayetteville Percent at Levels 3 and 4 Compared to State-wide Results ...............................................................................118
Exhibit 4.3.Cohort 1 State Literacy Exam Results for Three-Year Cohorts Fayetteville Percent at Levels 3 and 4 Compared to State-wide Results ........................................................................119
Exhibit 4.3.Cohort 2 State Mathematics Exam Results for Three-Year Cohorts Fayetteville Percent at Levels 3 and 4 Compared to State-wide Results .....................................................................119
Exhibit 4.3.6 State Literacy Exams Over Three Years Fayetteville Percent at Level 1 Compared to State-wide Results ........................................................................................................120
Exhibit 4.3.7 State Mathematics Exams Over Three Years Fayetteville Percent at Level 1 Compared to State-wide Results ....................................................................................................120
Exhibit 4.3.8 State Literacy Exams Over Three Years Percent Over/Under Arkansas State Average 121
Exhibit 4.3.9 State Math Exams Over Three Years Percent Over/Under Arkansas State Average ....122
Exhibit 4.3.10 Augmented Literacy Benchmark Scores for Grades 3–5 Percent at Levels 3 and 4 Combined Students ......................................................................................................123
Exhibit 4.3.11 Augmented Literacy Benchmark Scores for Grades 3–5 Percent at Levels 3 and 4 FRPL Participants ...................................................................................................................123
Exhibit 4.3.12 Augmented Literacy Benchmark Scores for Grades 3–5 Percent at Level 1 Combined Students ........................................................................................................................124
Exhibit 4.3.13 Augmented Literacy Benchmark Scores for Grades 3–5 Percent at Level 1 FRPL Participants ...................................................................................................................125
Exhibit 4.3.14 Augmented Literacy Benchmark Scores for Grades 3–5 Percent at Levels 3 and 4 Combined Students ......................................................................................................125
Exhibit 4.3.15 Augmented Literacy Benchmark Scores for Grades 3–5 Percent at Levels 3 and 4 FRPL Participants ...................................................................................................................126
Exhibit 4.3.16 Effect Size of Differences in Literacy Scores African American Students compared to White Students .............................................................................................................127
Exhibit 4.3.17 Effect Size of Differences in Math Scores African American Students compared to White Students .............................................................................................................127
Exhibit 4.3.18 Effect Size of Differences in Literacy Scores FRPL Participants compared to non-FRPL Participants ...................................................................................................................128
Exhibit 4.3.19 Effect Size of Differences in Math Scores FRPL Participants compared to non-FRPL Students ........................................................................................................................128
Exhibit 4.3.20 Effect Size of Differences in Literacy Scores Mobile Students compared to non-Mobile Students ........................................................................................................................129
Exhibit 4.3.21 Effect Size of Differences in Math Scores Mobile Students compared to non-Mobile Students ........................................................................................................................129
Exhibit 4.3.22 Effect Size of Differences in Literacy Scores Male Students compared to Female Students ........................................................................................................................130
Fayetteville Public Schools Audit Report Page xii
Exhibit 4.3.23 Effect Size of Differences in Math Scores Male Students compared to Female Students ........................................................................................................................130
Exhibit 4.3.24 Linear Projection of Years to Parity for Literacy Scores ..............................................131
Exhibit 4.3.25 Linear Projection of Years to Parity for Math Scores ..................................................132
Exhibit 4.3.26 Summary of Linear Projection of Years to Parity Number of Subgroup Comparisons in Each Category ..............................................................................................................133
Exhibit 4.4.1 Presence of Minimal Components of Formative Assessment With Auditor’s Rating .135
Exhibit 4.4.2 Characteristics of an Adequate Instructional Approach to Formative Student Assessment Data Use and Auditors’ Rating of District Approach ...................................................137
Exhibit 4.4.3 Summary of Program Evaluation Documents Reviewed .............................................140
Exhibit 4.4.4 Characteristics of a Comprehensive Program Evaluation Report/Document and Auditors’ Assessment ...................................................................................................140
Exhibit 4.4.5 Characteristics of a Comprehensive Program Evaluation Report/Document and Auditors’ Assessment ...................................................................................................142
Exhibit 5.1.1 Components of a Curriculum-driven Budget And the Auditors’ Rating on Audit Criteria ..........................................................................................................................147
Exhibit 5.1.2 Budget Increases from 2007-08 Through 2009-10 ......................................................149
Exhibit 5.2.1 Criteria for Initiating and Implementing Interventions And Auditors’ Rating .............152
Exhibit 5.3.1 Components of Comprehensive Long-Range Facilities Plan and Auditors’ Assessment of Facilities Planning Efforts ........................................................................................155
Exhibit R.9.1 Suggested Table of Organization ..................................................................................178
Fayetteville Public Schools Audit Report Page xiii
Table of Photographs
Vandegriff students are using computers to do collaborative research ................................................................ i
In their weekly meeting, fi rst grade teachers at Asbell Elementary are discussing skills students need prior to regrouping for intervention. ...............................................................................................................................39
The attributes of 21st Century Learning are posted in the offi ce at Owl Creek School. ....................................81
A teacher at McNair Middle School is using the document camera to check workbook answers. ...................83
Fayetteville High School students are evaluating a previous presentation in a Language Arts class. ...............85
A “COW” of laptop computers is available for student use at Asbell Elementary. ...........................................90
An Honors Geometry teacher is using an ELMO at Woodland Junior High—a common observation across the district. ...............................................................................................................................................................93
A list of skills that students are to master is being examined by teachers at Leverett Elementary. .................105
The “War Room” at Happy Hollow is the setting for intervention planning at Happy Hollow Elementary with the principal explaining the process. ................................................................................................................138
Team Time Intervention with a third grade group of students is in session at Owl Creek School. .................153
An Intervention volunteer is working with a student at Asbell Elementary. ...................................................153
A Tier III Intervention group is working in Read 180 at Holt Middle School. ................................................154
Hot lunch freezers are crammed into a storage area at Leverett Elementary. ..................................................157

Fayetteville Public Schools Audit Report Page xiv

Fayetteville Public Schools Audit Report Page 1
A CURRICULUM MANAGEMENT AUDIT
of the
Fayetteville Public Schools
Fayetteville, Arkansas
I. INTRODUCTIONThis document constitutes the fi nal report of a Curriculum Management Audit of the Fayetteville Public Schools. The audit was commissioned by the Fayetteville Public Schools Board of Education/Governing Authority within the scope of its policy-making authority. It was conducted during the time period of November 18-20, 2009. Document analysis was performed off site, as was the detailed analysis of fi ndings and site visit data.
A curriculum audit is designed to reveal the extent to which offi cials and professional staff of a school district have developed and implemented a sound, valid, and operational system of curriculum management. Such a system, set within the framework of adopted board policies, enables the school district to make maximum use of its human and fi nancial resources in the education of its students. When such a system is fully operational, it assures the district taxpayers that their fi scal support is optimized under the conditions in which the school district functions.
Background
Nestled in the Ozark Mountains, Fayetteville is located in the south part of the Northwest Arkansas metropolitan area. The Fayetteville district became the fi rst chartered public school district in the state in 1871. This area is the fastest growing area in the state. The city of Fayetteville has a total area of 44.5 square miles with a population of 72,208, by a 2007 estimate the third largest city in Arkansas. It is the home of the University of Arkansas, the Razorbacks. A few of the world’s largest and most well known companies—including Wal-Mart, Tyson Foods, and J.B. Hunt Transportation—have their corporate headquarters in the Fayetteville metro area. Many Wal-Mart suppliers like Proctor and Gamble also maintain corporate offi ces located in Fayetteville. Fayetteville was the fi rst home of President Bill Clinton and his wife, Hillary, as they both taught at the University of Arkansas Law School. Their home is now known as the Clinton House Museum. Forbes Magazine, Kipplng.com, Builder Magazine, and Business Week have all ranked Fayetteville as one of the 10 best towns in which to live.
Currently, the district has an enrollment of 8,566 students and operates 15 campuses which include eight elementary schools of Kindergarten through grade 5; two middle schools for students in grades 6 and 7; one school for students Kindergarten through grade 7; two junior high schools for students in grade 8 and 9; one high school for grades 10-12; and one alternative learning school for grades 9-12.
The Fayetteville Public Schools leadership has begun a project to create a 21st Century learning system with the help of Dr. Tony Wagner and the Change Leadership Group from Harvard University. The intent is to better address the gap between how students are educated and the knowledge and skills they need to be successful in college, career, and life. This curriculum goal is concurrent with the design of a 21st century high school based on small learning communities.
Fayetteville Public Schools Audit Report Page 2
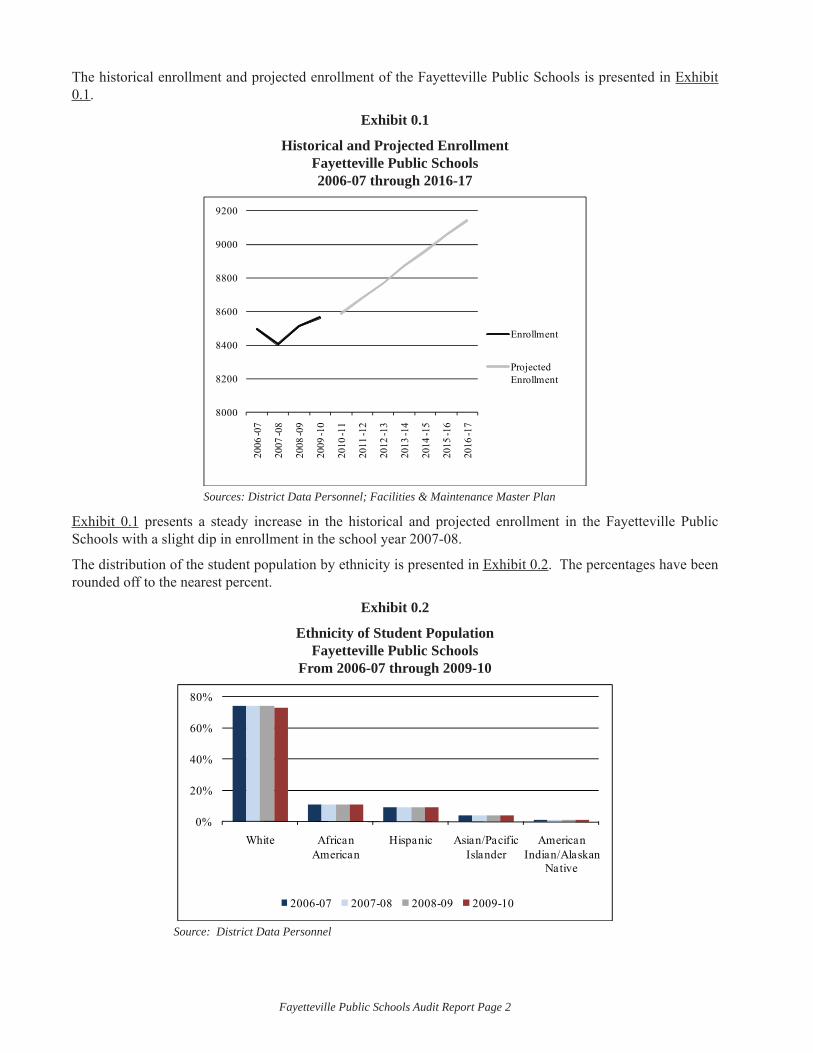
The historical enrollment and projected enrollment of the Fayetteville Public Schools is presented in Exhibit 0.1.
Exhibit 0.1
Historical and Projected Enrollment Fayetteville Public Schools2006-07 through 2016-17
8000
8200
8400
8600
8800
9000
9200
2006
-07
2007
-08
2008
-09
2009
-10
2010
-11
2011
-12
2012
-13
2013
-14
2014
-15
2015
-16
2016
-17
Enrollment
Projected Enrollment
Sources: District Data Personnel; Facilities & Maintenance Master Plan
Exhibit 0.1 presents a steady increase in the historical and projected enrollment in the Fayetteville Public Schools with a slight dip in enrollment in the school year 2007-08.
The distribution of the student population by ethnicity is presented in Exhibit 0.2. The percentages have been rounded off to the nearest percent.
Exhibit 0.2
Ethnicity of Student PopulationFayetteville Public Schools
From 2006-07 through 2009-10
0%
20%
40%
60%
80%
White African American
Hispanic Asian/Pacific Islander
American Indian/Alaskan
Native
2006-07 2007-08 2008-09 2009-10
Source: District Data Personnel
Fayetteville Public Schools Audit Report Page 3
As shown in Exhibit 0.2, the percentages of students by ethnicity have remained constant for the past four years.
In the 2007-08 School Report Card, the percentage of students eligible for free/reduced meals was reported to be 34.3 percent.
The Accreditation Status Report for 2008-09 stated that 10 of the schools met accreditation, but two elementary schools, one junior high, and the one high school were cited for not making accreditation. No schools were on the state reported probationary list.
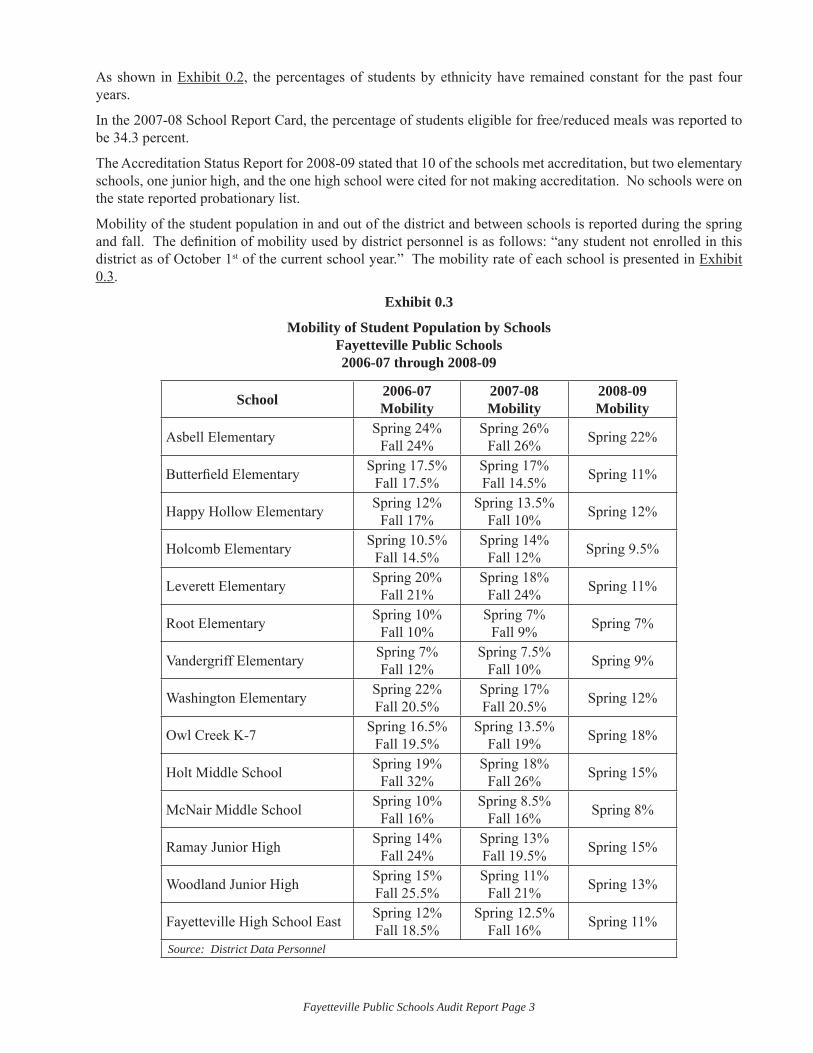
Mobility of the student population in and out of the district and between schools is reported during the spring and fall. The defi nition of mobility used by district personnel is as follows: “any student not enrolled in this district as of October 1st of the current school year.” The mobility rate of each school is presented in Exhibit 0.3.
Exhibit 0.3
Mobility of Student Population by SchoolsFayetteville Public Schools2006-07 through 2008-09
School 2006-07 Mobility
2007-08 Mobility
2008-09 Mobility
Asbell Elementary Spring 24%Fall 24%
Spring 26%Fall 26% Spring 22%
Butterfi eld Elementary Spring 17.5%Fall 17.5%
Spring 17%Fall 14.5% Spring 11%
Happy Hollow Elementary Spring 12%Fall 17%
Spring 13.5%Fall 10% Spring 12%
Holcomb Elementary Spring 10.5%Fall 14.5%
Spring 14%Fall 12% Spring 9.5%
Leverett Elementary Spring 20%Fall 21%
Spring 18%Fall 24% Spring 11%
Root Elementary Spring 10%Fall 10%
Spring 7%Fall 9% Spring 7%
Vandergriff Elementary Spring 7%Fall 12%
Spring 7.5%Fall 10% Spring 9%
Washington Elementary Spring 22%Fall 20.5%
Spring 17%Fall 20.5% Spring 12%
Owl Creek K-7 Spring 16.5%Fall 19.5%
Spring 13.5%Fall 19% Spring 18%
Holt Middle School Spring 19%Fall 32%
Spring 18%Fall 26% Spring 15%
McNair Middle School Spring 10%Fall 16%
Spring 8.5%Fall 16% Spring 8%
Ramay Junior High Spring 14%Fall 24%
Spring 13%Fall 19.5% Spring 15%
Woodland Junior High Spring 15%Fall 25.5%
Spring 11%Fall 21% Spring 13%
Fayetteville High School East Spring 12%Fall 18.5%
Spring 12.5%Fall 16% Spring 11%
Source: District Data Personnel
Fayetteville Public Schools Audit Report Page 4
Exhibit 0.3 shows the following:
The mobility rate of student population varies by school and varies between spring and fall.•
The highest mobility rate (32 percent) was at Holt Middle School at the fall reporting period.•
The highest mobility rate of student population (over 22 percent) for all three years was found at Asbell • Elementary.
The lowest mobility rate of student population (10 percent or lower) for all three years was found at • Root Elementary.
Governance Structure
The School Board is comprised of seven members, two elected at large and fi ve representing zones to a term of fi ve years. The current School Board members are:
Susan Heil, President elected At-Large, Position 2•
Tim Hudson, Vice President, representing Zone 5•
Tim Kring, Secretary-Treasurer, representing Zone 3•
Jim Halsell, Member elected At-Large, Position 1•
Howard Hamilton, Member, representing Zone 2•
Steve Percival, Member, representing Zone 1•
Becky Purcell, Member, representing Zone 4•
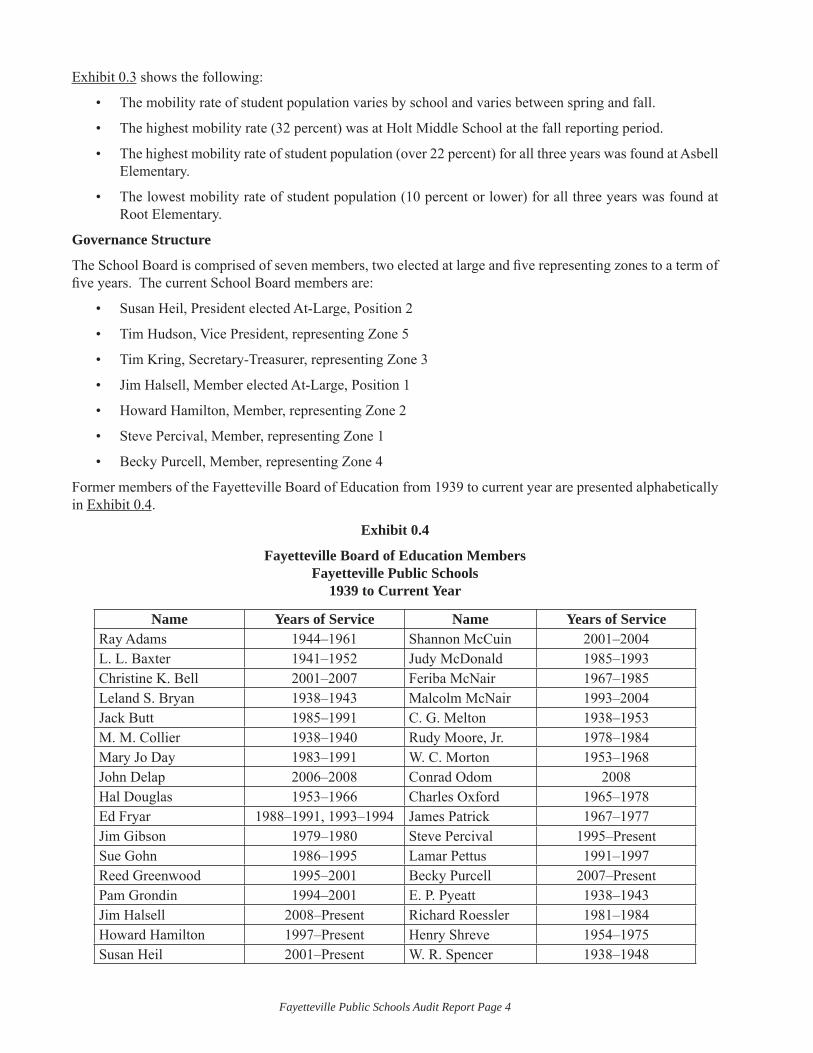
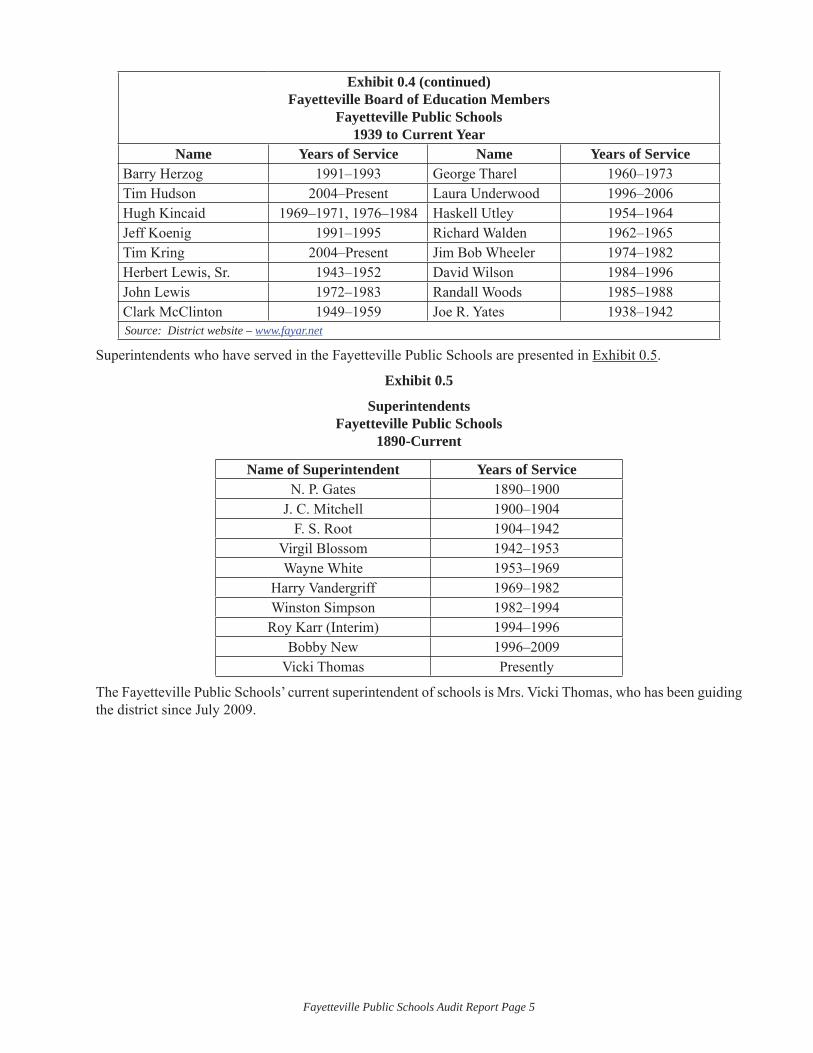
Former members of the Fayetteville Board of Education from 1939 to current year are presented alphabetically in Exhibit 0.4.
Exhibit 0.4
Fayetteville Board of Education MembersFayetteville Public Schools
1939 to Current Year
Name Years of Service Name Years of ServiceRay Adams 1944–1961 Shannon McCuin 2001–2004L. L. Baxter 1941–1952 Judy McDonald 1985–1993Christine K. Bell 2001–2007 Feriba McNair 1967–1985Leland S. Bryan 1938–1943 Malcolm McNair 1993–2004Jack Butt 1985–1991 C. G. Melton 1938–1953M. M. Collier 1938–1940 Rudy Moore, Jr. 1978–1984Mary Jo Day 1983–1991 W. C. Morton 1953–1968John Delap 2006–2008 Conrad Odom 2008Hal Douglas 1953–1966 Charles Oxford 1965–1978Ed Fryar 1988–1991, 1993–1994 James Patrick 1967–1977Jim Gibson 1979–1980 Steve Percival 1995–PresentSue Gohn 1986–1995 Lamar Pettus 1991–1997Reed Greenwood 1995–2001 Becky Purcell 2007–PresentPam Grondin 1994–2001 E. P. Pyeatt 1938–1943Jim Halsell 2008–Present Richard Roessler 1981–1984Howard Hamilton 1997–Present Henry Shreve 1954–1975Susan Heil 2001–Present W. R. Spencer 1938–1948
Fayetteville Public Schools Audit Report Page 5
Exhibit 0.4 (continued)Fayetteville Board of Education Members
Fayetteville Public Schools1939 to Current Year
Name Years of Service Name Years of ServiceBarry Herzog 1991–1993 George Tharel 1960–1973Tim Hudson 2004–Present Laura Underwood 1996–2006Hugh Kincaid 1969–1971, 1976–1984 Haskell Utley 1954–1964Jeff Koenig 1991–1995 Richard Walden 1962–1965Tim Kring 2004–Present Jim Bob Wheeler 1974–1982Herbert Lewis, Sr. 1943–1952 David Wilson 1984–1996John Lewis 1972–1983 Randall Woods 1985–1988Clark McClinton 1949–1959 Joe R. Yates 1938–1942Source: District website – www.fayar.net
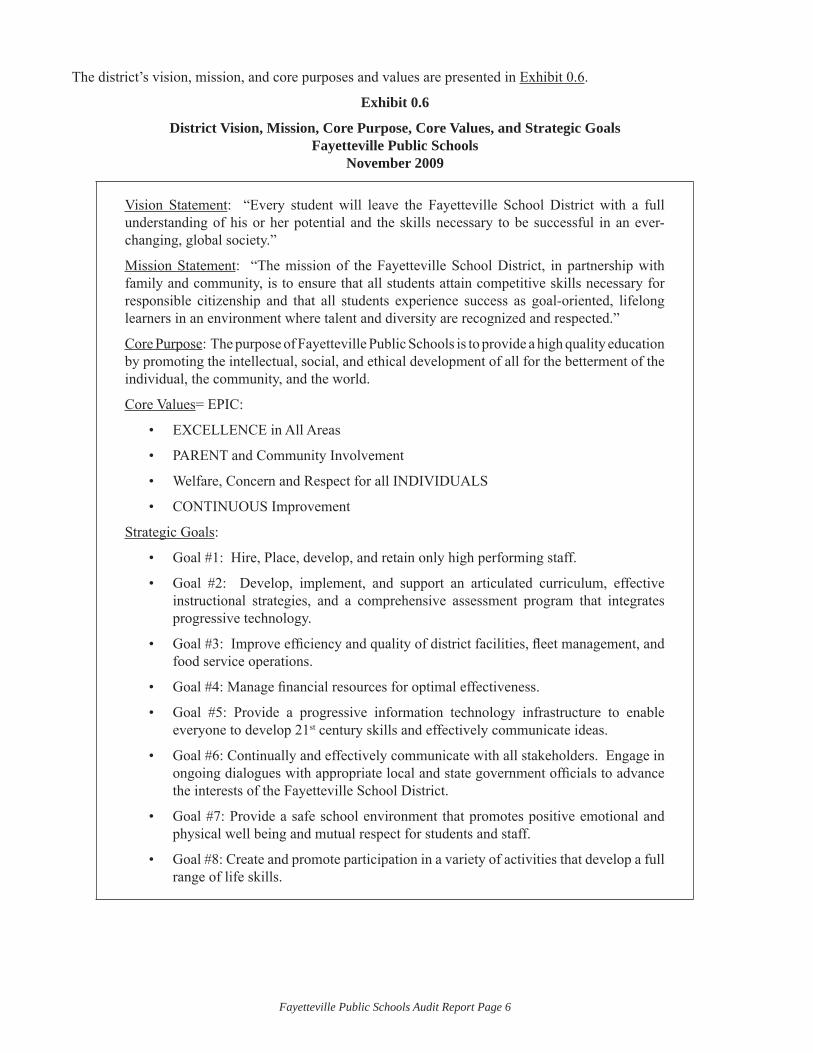
Superintendents who have served in the Fayetteville Public Schools are presented in Exhibit 0.5.
Exhibit 0.5
SuperintendentsFayetteville Public Schools
1890-Current
Name of Superintendent Years of ServiceN. P. Gates 1890–1900
J. C. Mitchell 1900–1904F. S. Root 1904–1942
Virgil Blossom 1942–1953Wayne White 1953–1969
Harry Vandergriff 1969–1982Winston Simpson 1982–1994
Roy Karr (Interim) 1994–1996Bobby New 1996–2009
Vicki Thomas Presently
The Fayetteville Public Schools’ current superintendent of schools is Mrs. Vicki Thomas, who has been guiding the district since July 2009.
Fayetteville Public Schools Audit Report Page 6
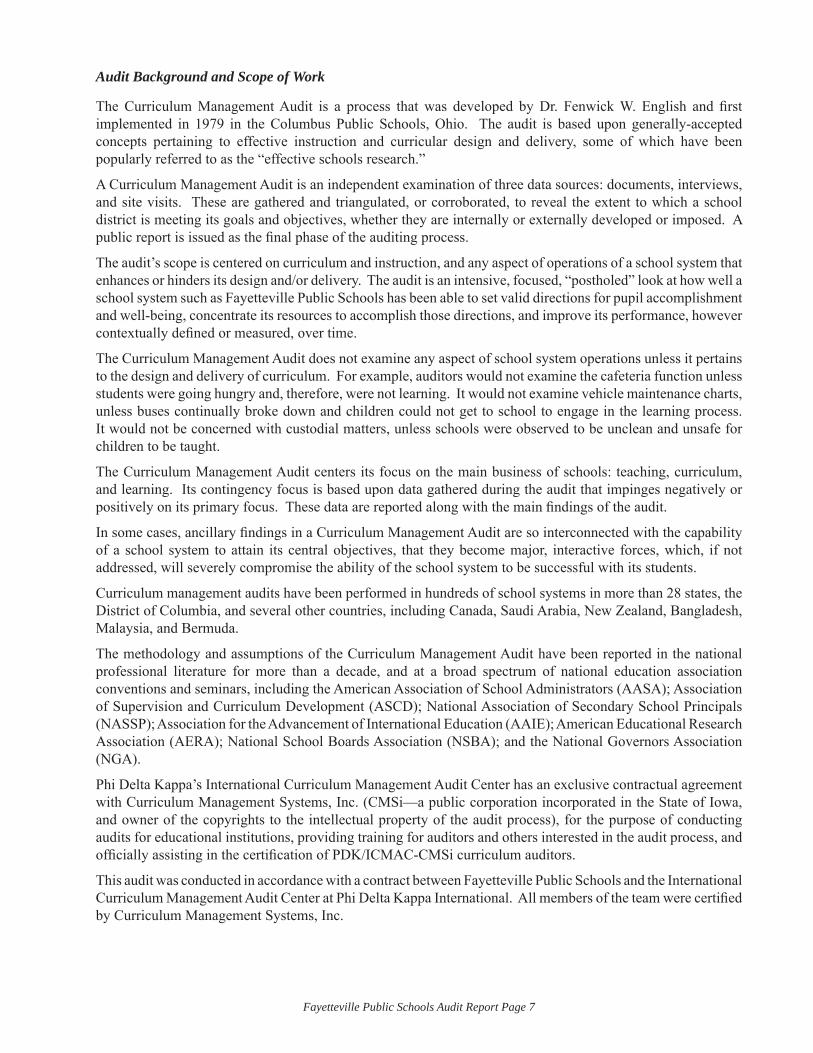
The district’s vision, mission, and core purposes and values are presented in Exhibit 0.6.
Exhibit 0.6
District Vision, Mission, Core Purpose, Core Values, and Strategic GoalsFayetteville Public Schools
November 2009
Vision Statement: “Every student will leave the Fayetteville School District with a full understanding of his or her potential and the skills necessary to be successful in an ever-changing, global society.”
Mission Statement: “The mission of the Fayetteville School District, in partnership with family and community, is to ensure that all students attain competitive skills necessary for responsible citizenship and that all students experience success as goal-oriented, lifelong learners in an environment where talent and diversity are recognized and respected.”
Core Purpose: The purpose of Fayetteville Public Schools is to provide a high quality education by promoting the intellectual, social, and ethical development of all for the betterment of the individual, the community, and the world.
Core Values= EPIC:
EXCELLENCE in All Areas•
PARENT and Community Involvement•
Welfare, Concern and Respect for all INDIVIDUALS•
CONTINUOUS Improvement•
Strategic Goals:
Goal #1: Hire, Place, develop, and retain only high performing staff.•
Goal #2: Develop, implement, and support an articulated curriculum, effective • instructional strategies, and a comprehensive assessment program that integrates progressive technology.
Goal #3: Improve effi ciency and quality of district facilities, fl eet management, and • food service operations.
Goal #4: Manage fi nancial resources for optimal effectiveness.•
Goal #5: Provide a progressive information technology infrastructure to enable • everyone to develop 21st century skills and effectively communicate ideas.
Goal #6: Continually and effectively communicate with all stakeholders. Engage in • ongoing dialogues with appropriate local and state government offi cials to advance the interests of the Fayetteville School District.
Goal #7: Provide a safe school environment that promotes positive emotional and • physical well being and mutual respect for students and staff.
Goal #8: Create and promote participation in a variety of activities that develop a full • range of life skills.
Fayetteville Public Schools Audit Report Page 7
Audit Background and Scope of Work
The Curriculum Management Audit is a process that was developed by Dr. Fenwick W. English and fi rst implemented in 1979 in the Columbus Public Schools, Ohio. The audit is based upon generally-accepted concepts pertaining to effective instruction and curricular design and delivery, some of which have been popularly referred to as the “effective schools research.”
A Curriculum Management Audit is an independent examination of three data sources: documents, interviews, and site visits. These are gathered and triangulated, or corroborated, to reveal the extent to which a school district is meeting its goals and objectives, whether they are internally or externally developed or imposed. A public report is issued as the fi nal phase of the auditing process.
The audit’s scope is centered on curriculum and instruction, and any aspect of operations of a school system that enhances or hinders its design and/or delivery. The audit is an intensive, focused, “postholed” look at how well a school system such as Fayetteville Public Schools has been able to set valid directions for pupil accomplishment and well-being, concentrate its resources to accomplish those directions, and improve its performance, however contextually defi ned or measured, over time.
The Curriculum Management Audit does not examine any aspect of school system operations unless it pertains to the design and delivery of curriculum. For example, auditors would not examine the cafeteria function unless students were going hungry and, therefore, were not learning. It would not examine vehicle maintenance charts, unless buses continually broke down and children could not get to school to engage in the learning process. It would not be concerned with custodial matters, unless schools were observed to be unclean and unsafe for children to be taught.
The Curriculum Management Audit centers its focus on the main business of schools: teaching, curriculum, and learning. Its contingency focus is based upon data gathered during the audit that impinges negatively or positively on its primary focus. These data are reported along with the main fi ndings of the audit.
In some cases, ancillary fi ndings in a Curriculum Management Audit are so interconnected with the capability of a school system to attain its central objectives, that they become major, interactive forces, which, if not addressed, will severely compromise the ability of the school system to be successful with its students.
Curriculum management audits have been performed in hundreds of school systems in more than 28 states, the District of Columbia, and several other countries, including Canada, Saudi Arabia, New Zealand, Bangladesh, Malaysia, and Bermuda.
The methodology and assumptions of the Curriculum Management Audit have been reported in the national professional literature for more than a decade, and at a broad spectrum of national education association conventions and seminars, including the American Association of School Administrators (AASA); Association of Supervision and Curriculum Development (ASCD); National Association of Secondary School Principals (NASSP); Association for the Advancement of International Education (AAIE); American Educational Research Association (AERA); National School Boards Association (NSBA); and the National Governors Association (NGA).
Phi Delta Kappa’s International Curriculum Management Audit Center has an exclusive contractual agreement with Curriculum Management Systems, Inc. (CMSi—a public corporation incorporated in the State of Iowa, and owner of the copyrights to the intellectual property of the audit process), for the purpose of conducting audits for educational institutions, providing training for auditors and others interested in the audit process, and offi cially assisting in the certifi cation of PDK/ICMAC-CMSi curriculum auditors.
This audit was conducted in accordance with a contract between Fayetteville Public Schools and the International Curriculum Management Audit Center at Phi Delta Kappa International. All members of the team were certifi ed by Curriculum Management Systems, Inc.
Fayetteville Public Schools Audit Report Page 8
The names of the curriculum auditors in this audit included the following individuals:
Audrey Hains, Ph.D., Senior Lead Auditor, Educational Consultant, Niceville, Florida•
Betty Bates, M.S., Educational Consultant, Texas and California•
James Ferrell, Ed.D., Middle School Principal, Caney Valley School in Ramona, Oklahoma•
Larry Hunt, CAS, District Data Coordinator, Onandaga-Cortland-Madison Board of Cooperative • Educational Services, Syracuse, New York
Biographical information about the auditors is found in the appendix.
System Purpose for Conducting the Audit
Following is the district leadership’s expressed purpose for conducting the audit:
“A 21st Century Leadership Committee comprised of representatives from each building and department was charged with defi ning the educational needs of 21st century students. Beginning in December of 2008, the committee examined the work of Tony Wagner through reading The Global Achievement Gap and engaging the community in a city-wide book read. As a result of this committee’s work, which built on the work of a prior secondary reform committee (R3), a focus on literacy skills was identifi ed. The priority was stated: ‘By 2012, all students will read and communicate (both orally and in writing) at or above grade level.’
A district-wide literacy committee was formed to begin the work on a comprehensive PK-12 literacy plan. During the summer of 2009, the committee met and agreed that a comprehensive curriculum audit should be completed before we could begin any meaningful work towards aligning the system to address the literacy needs of all students.
With the release of the 2009 Adequate Yearly Progress (AYP) Reports, the district has a new sense of urgency with eight of the 14 campuses falling short of the AYP requirements for one or more subpopulations in literacy. The following schools are currently on ALERT for literacy: Asbell, Holcomb, Washington, Root, McNair, and Fayetteville High School, while Owl Creek is in Year 1 of School Improvement and Holt is in Year 2 of School Improvement.
Regardless of which school within our district that a student attends, we must feel certain that he/she will be able to read, write, and communicate at the levels required for life and work. We need outside eyes to look inside our system to provide the information and recommendations so that we can align our curriculum, instruction, assessment, and resources to meet our literacy goal.
As a result of this audit, the expectation is to have a written report of our status with regard to alignment of curriculum, instruction, assessment, and resources (including technology) along with recommendations.”
Approach of the Audit
The Curriculum Management Audit has established itself as a process of integrity and candor in assessing public school districts. It has been presented as evidence in state and federal litigation concerning matters of school fi nance, general resource managerial effectiveness, and school desegregation efforts in Kansas, Kentucky, New Jersey, and South Carolina. The audit served as an important data source in state-directed takeovers of school systems in New Jersey and Kentucky. The Curriculum Management Audit has become recognized internationally as an important, viable, and valid tool for the improvement of educational institutions and for the improvement of curriculum design and delivery.
The Curriculum Management Audit represents a “systems” approach to educational improvement; that is, it considers the system as a whole rather than a collection of separate, discrete parts. The interrelationships of system components and their impact on overall quality of the organization in accomplishing its purposes are examined in order to “close the loop” in curriculum and instructional improvement.
Fayetteville Public Schools Audit Report Page 9
II. METHODOLOGY
The Model for the Curriculum Management Audit
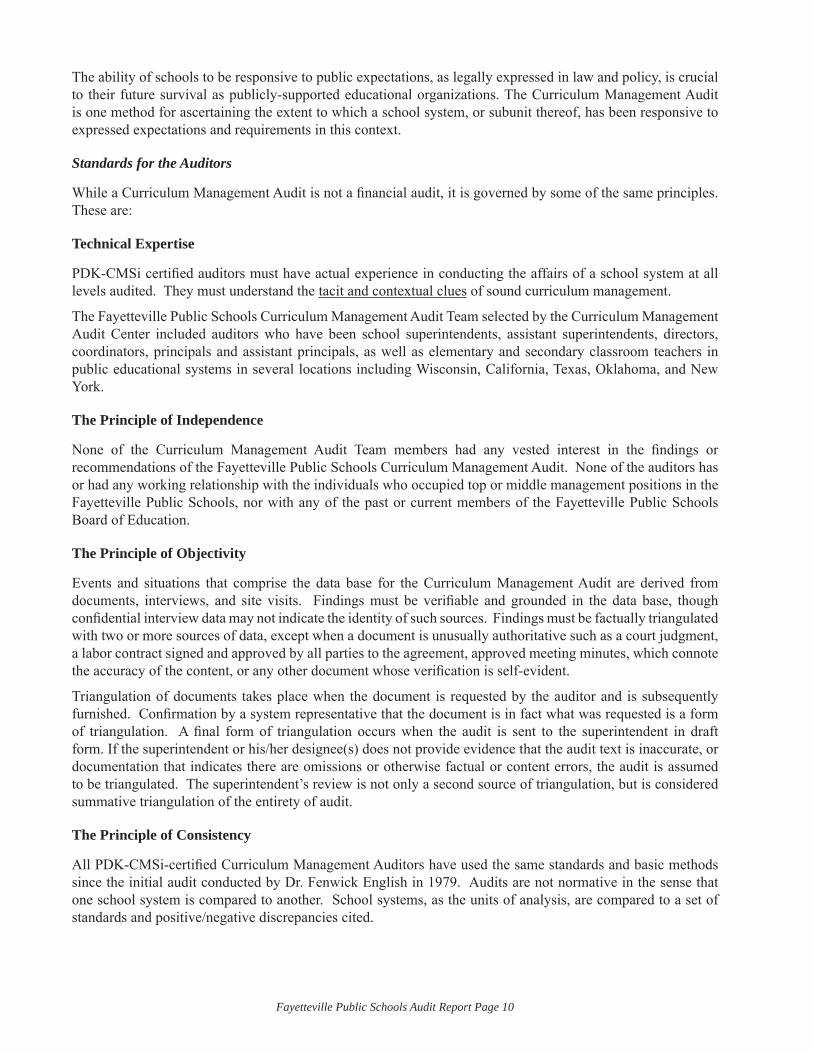
The model for the Curriculum Management Audit is shown in the schematic below. The model has been published widely in the national professional literature, recently in the best-selling book, The Curriculum Management Audit: Improving School Quality (1995, Frase, English, Poston).
A Schematic View of Curricular Quality Control
General quality control assumes that at least three elements must be present in any organizational and work-related situation for it to be functional and capable of being improved over time. These are: (1) a work standard, goal/objective, or operational mission; (2) work directed toward attaining the mission, standard, goal/objective; and (3) feedback (work measurement), which is related to or aligned with the standard, goal/objective, or mission.
When activities are repeated, there is a “learning curve,” i.e., more of the work objectives are achieved within the existing cost parameters. As a result, the organization, or a subunit of an organization, becomes more “productive” at its essential short- or long-range work tasks.
Within the context of an educational system and its governance and operational structure, curricular quality control requires: (1) a written curriculum in some clear and translatable form for application by teachers in classroom or related instructional settings, (2) a taught curriculum, which is shaped by and interactive with the written one, and (3) a tested curriculum, which includes the tasks, concepts, and skills of pupil learning and which is linked to both the taught and written curricula. This model is applicable in any kind of educational work structure typically found in mass public educational systems, and is suitable for any kind of assessment strategy, from norm-referenced standardized tests to more authentic approaches.
The Curriculum Management Audit assumes that an educational system, as one kind of human work organization, must be responsive to the context in which it functions and in which it receives support for its continuing existence. In the case of public educational systems, the support comes in the form of tax monies from three levels: local, state, and federal.
In return for such support, mass public educational systems are supposed to exhibit characteristics of rationality, i.e., being responsive to the public will as it is expressed in legally constituted bodies such as Congress, state legislatures, and locally elected/appointed boards of education.
In the case of emerging national public school reforms, more and more this responsiveness is assuming a distinctive school-based management focus, which includes parents, teachers, and, in some cases, students.
Fayetteville Public Schools Audit Report Page 10
The ability of schools to be responsive to public expectations, as legally expressed in law and policy, is crucial to their future survival as publicly-supported educational organizations. The Curriculum Management Audit is one method for ascertaining the extent to which a school system, or subunit thereof, has been responsive to expressed expectations and requirements in this context.
Standards for the Auditors
While a Curriculum Management Audit is not a fi nancial audit, it is governed by some of the same principles. These are:
Technical Expertise
PDK-CMSi certifi ed auditors must have actual experience in conducting the affairs of a school system at all levels audited. They must understand the tacit and contextual clues of sound curriculum management.
The Fayetteville Public Schools Curriculum Management Audit Team selected by the Curriculum Management Audit Center included auditors who have been school superintendents, assistant superintendents, directors, coordinators, principals and assistant principals, as well as elementary and secondary classroom teachers in public educational systems in several locations including Wisconsin, California, Texas, Oklahoma, and New York.
The Principle of Independence
None of the Curriculum Management Audit Team members had any vested interest in the fi ndings or recommendations of the Fayetteville Public Schools Curriculum Management Audit. None of the auditors has or had any working relationship with the individuals who occupied top or middle management positions in the Fayetteville Public Schools, nor with any of the past or current members of the Fayetteville Public Schools Board of Education.
The Principle of Objectivity
Events and situations that comprise the data base for the Curriculum Management Audit are derived from documents, interviews, and site visits. Findings must be verifi able and grounded in the data base, though confi dential interview data may not indicate the identity of such sources. Findings must be factually triangulated with two or more sources of data, except when a document is unusually authoritative such as a court judgment, a labor contract signed and approved by all parties to the agreement, approved meeting minutes, which connote the accuracy of the content, or any other document whose verifi cation is self-evident.
Triangulation of documents takes place when the document is requested by the auditor and is subsequently furnished. Confi rmation by a system representative that the document is in fact what was requested is a form of triangulation. A fi nal form of triangulation occurs when the audit is sent to the superintendent in draft form. If the superintendent or his/her designee(s) does not provide evidence that the audit text is inaccurate, or documentation that indicates there are omissions or otherwise factual or content errors, the audit is assumed to be triangulated. The superintendent’s review is not only a second source of triangulation, but is considered summative triangulation of the entirety of audit.
The Principle of Consistency
All PDK-CMSi-certifi ed Curriculum Management Auditors have used the same standards and basic methods since the initial audit conducted by Dr. Fenwick English in 1979. Audits are not normative in the sense that one school system is compared to another. School systems, as the units of analysis, are compared to a set of standards and positive/negative discrepancies cited.
Fayetteville Public Schools Audit Report Page 11
The Principle of Materiality
PDK-CMSi-certifi ed auditors have broad implied and discretionary power to focus on and select those fi ndings that they consider most important to describing how the curriculum management system is functioning in a school district, and how that system must improve, expand, delete, or reconfi gure various functions to attain an optimum level of performance.
The Principle of Full Disclosure
Auditors must reveal all relevant information to the users of the audit, except in cases where such disclosure would compromise the identity of employees or patrons of the system. Confi dentiality is respected in audit interviews.
In reporting data derived from site interviews, auditors may use some descriptive terms that lack a precise quantifi able defi nition. For example:
“Some school principals said that ... ”
“Many teachers expressed concern that ... ”
“There was widespread comment about ... ”
The basis for these terms is the number of persons in a group or class of persons who were interviewed, as opposed to the total potential number of persons in a category. This is a particularly salient point when not all persons within a category are interviewed. “Many teachers said that...,” represents only those interviewed by the auditors, or who may have responded to a survey, and not “many” of the total group whose views were not sampled, and, therefore, could not be disclosed during an audit.
In general these quantifi cations may be applied to the principle of full disclosure:
Descriptive Term General Quantifi cation RangeSome ... or a few ... Less than a majority of the group interviewed and less than 30 percentMany ... Less than a majority, more than 30 percent of a group or class of
people interviewedA majority ... More than 50 percent, less than 75 percentMost ... or widespread 75-89 percent of a group or class of persons interviewedNearly all ... 90-99 percent of those interviewed in a specifi c class or group of
personsAll or everyone ... 100 percent of all persons interviewed within a similar group, job, or
class
It should be noted for purposes of full disclosure that some groups within a school district are almost always interviewed in toto. The reason is that the audit is focused on management and those people who have policy and managerial responsibilities for the overall performance of the system as a system. In all audits an attempt is made to interview every member of the board of education and all top administrative offi cers, all principals, and the executive board of the teachers’ association or union. While teachers and parents are interviewed, they are considered in a status different from those who have system-wide responsibilities for a district’s operations. Students are rarely interviewed unless the system has made a specifi c request in this regard.
Interviewed Representatives of the Fayetteville Public Schools
Superintendent All Board MembersCentral Administrators Principals
Assistant Principals TeachersParents Community Members
Approximately 120 individuals were interviewed during the site visit phase of the audit.
Fayetteville Public Schools Audit Report Page 12
Data Sources of the Curriculum Management Audit
A curriculum audit uses a variety of data sources to determine if each of the three elements of curricular quality control is in place and connected one to the other. The audit process also inquires as to whether pupil learning has improved as the result of effective application of curricular quality control.
The major sources of data for the Fayetteville Public Schools Curriculum Management Audit were:
Documents
Documents included written board policies, administrative regulations, curriculum guides, memoranda, budgets, state reports, accreditation documents, and any other source of information that would reveal elements of the written, taught, and tested curricula and linkages among these elements.
Interviews
Interviews were conducted by auditors to explain contextual variables that were operating in the school system at the time of the audit. Such contextual variables may shed light on the actions of various persons or parties, reveal interrelationships, and explain existing progress, tension, harmony/disharmony within the school system. Quotations cited in the audit from interviews are used as a source of triangulation and not as summative averages or means. Some persons, because of their position, knowledge, or credibility, may be quoted more than once in the audit, but they are not counted more than once because their inclusion is not part of a quantitative/mathematical expression of interview data.
Site Visits
All building sites were toured by the PDK-CMSi audit team. Site visits reveal the actual context in which curriculum is designed and delivered in a school system. Contextual references are important as they indicate discrepancies in documents or unusual working conditions. Auditors attempted to observe briefl y all classrooms, gymnasiums, labs, playgrounds, hallways, restrooms, offi ces, and maintenance areas to properly grasp accurate perceptions of conditions, activities, safety, instructional practices, and operational contexts.
Standards for the Curriculum Audit
The PDK-CMSi Curriculum Management Audit used fi ve standards against which to compare, verify, and comment upon the Fayetteville Public Schools’s existing curricular management practices. These standards have been extrapolated from an extensive review of management principles and practices and have been applied in all previous curriculum management audits.
As a result, the standards refl ect an ideal management system, but not an unattainable one. They describe working characteristics that any complex work organization should possess in being responsive and responsible to its clients.
A school system that is using its fi nancial and human resources for the greatest benefi t of its students is one that is able to establish clear objectives, examine alternatives, select and implement alternatives, measure results as they are applied against established objectives, and adjust its efforts so that it achieves a greater share of the objectives over time.
Fayetteville Public Schools Audit Report Page 13
The fi ve standards employed in the PDK-CMSi Curriculum Management Audit in Fayetteville Public Schools were:
The school district demonstrates its control of resources, programs, and personnel.1.
The school district has established clear and valid objectives for students.2.
The school district demonstrates internal connectivity and rational equity in its program development 3. and implementation.
The school district has used the results from district-designed or -adopted assessments to adjust, 4. improve, or terminate ineffective practices or programs.
The school district has improved its productivity.5.
A fi nding within a Curriculum Management Audit is simply a description of the existing state, negative or positive, between an observed and triangulated condition or situation at the time of the PDK-CMSi audit and its comparison with one or more of the fi ve audit standards.
Findings in the negative represent discrepancies below the standard. Findings in the positive refl ect meeting or exceeding the standard. As such, audit fi ndings are recorded on nominal and ordinal indices and not ratio or interval scales. As a general rule, audits do not issue commendations, because it is expected that a school district should be meeting every standard as a way of normally doing its business. Commendations are not given for good practice. On occasion, exemplary practices may be cited.
Unlike accreditation methodologies, audits do not have to reach a forced, summative judgment regarding the status of a school district or subunit being analyzed. Audits simply report the discrepancies and formulate recommendations to ameliorate them.

Fayetteville Public Schools Audit Report Page 14
Fayetteville Public Schools Audit Report Page 15
III. FINDINGS
STANDARD 1: The School District Demonstrates Its Control of Resources, Programs, and Personnel.Quality control is the fundamental element of a well-managed educational program. It is one of the major premises of local educational control within any state’s educational system.
The critical premise involved is that, via the will of the electorate, a local board of education establishes local priorities within state laws and regulations. A school district’s accountability rests with the school board and the public.
Through the development of an effective policy framework, a local school board provides the focus for management and accountability to be established for administrative and instructional staffs, as well as for its own responsibility. It also enables the district to make meaningful assessments and use student learning data as a critical factor in determining its success.
Although educational program control and accountability are often shared among different components of a school district, ultimately fundamental control of and responsibility for a district and its operations rests with the school board and top-level administrative staff.
What the Auditors Expected to Find in the Fayetteville Public Schools:
A school system meeting PDK-CMSi Curriculum Management Audit Standard One is able to demonstrate its control of resources, programs, and personnel. Common indicators are:
A curriculum that is centrally defi ned and adopted by the board of education;•
A clear set of policies that establish an operational framework for management that permits • accountability;
A clear set of policies that refl ect state requirements and local program goals and the necessity to use • achievement data to improve school system operations;
A functional administrative structure that facilitates the design and delivery of the district’s • curriculum;
A direct, uninterrupted line of authority from school board/superintendent and other central offi ce • offi cials to principals and classroom teachers;
Organizational development efforts that are focused to improve system effectiveness;•
Documentation of school board and central offi ce planning for the attainment of goals, objectives, and • mission over time; and
A clear mechanism to defi ne and direct change and innovation within the school system to permit • maximization of its resources on priority goals, objectives, and mission.
Overview of What the Auditors Found in the Fayetteville Public Schools:
This section is an overview of the fi ndings that follow in the area of Standard One. Details follow within separate fi ndings.
The auditors found a scarcity of board policies to provide local control of the district’s curriculum design and delivery. Using the criteria of the curriculum management audit, an analysis of existing board policies found that the policies were inadequate; many criteria received a rating of 0, with 1 being the highest rating. State requirements for accreditation uphold many aspects of quality that the curriculum management audit requires. Though administration expressed a need for board policies, board members were uncertain of their role in the development of direction through board policies.
Fayetteville Public Schools Audit Report Page 16
All three levels of planning and plan analysis were rated as inadequate. While there are a number of plans being written annually, clear and specifi c direction is not provided for personnel to initiate and implement system-wide programs and strategies to achieve the vision and goals of the district. Plans and planning do not include a demonstrable evaluation process to determine progress being made. No board policies or administrative regulations direct the development of tangible plans to provide that direction. The lack of communication regarding direction and changes that are being implemented is adding to insuffi cient support for these endeavors.
In analyzing the district’s organization charts, the auditors found that only one of the audit’s six principles for sound general management was met, which is inadequate. The majority of job descriptions did not provide clear specifi cations of responsibilities, relationship, and linkage to curriculum and did not align with the current primary organization chart and differentiated charts. There is no board direction for the development and adoption of an organizational chart with corresponding written job descriptions.
Finding 1.1: A scarcity of directives and specifi c board policies pertaining to curriculum and instruction does not provide for quality control of the curriculum.
Educational policy adoption is a major responsibility of the school board. It is through its policies that the board maintains, over time, its responsibility for system control and direction. Comprehensive board policies provide foundational direction to the day-to-day operations of the school district. Policies that are effective can provide the focus and parameters for decision making by the district staff. It is also through policies that commonly understood standards are established and maintained over time for the design and delivery of all written, taught, and tested curricula.
In order for policies to provide the necessary operational framework, they must be useful in controlling and directing decision making. Policies must refl ect the expectations set by the board and focus the resources of the district towards specifi c goals. Policies drive practice. They must be specifi c, easily referenced, and the fi rst-source documents to provide individual and system guidance. Conversely, when policies are absent, outdated, vague, or ignored, there is no effective local guidance for administrators or staff. The result may be that decision making is left to state directives, individuals, or special interest discretion. In such instance, there is a lack of coherence in systems, operations, and actions. Educational outcomes may be unpredictable and/or fragmented and may not refl ect the intent of the board.
To determine the status of policy development and adoption in the Fayetteville Public Schools, the auditors reviewed all board policies as posted on the district’s website and a board binder of policies. The state’s rules governing standards for accreditation were also reviewed. Interviews with board members, administration, and building principals were held to determine the existence and use of board policies.
The auditors found that few board policies and only one administrative regulation addressed curriculum and instruction which is inadequate by curriculum audit standards. Board members stated that direction is given in the vision statement and the eight goals of the district (see Exhibit 0.6).
Fayetteville Public Schools Audit Report Page 17
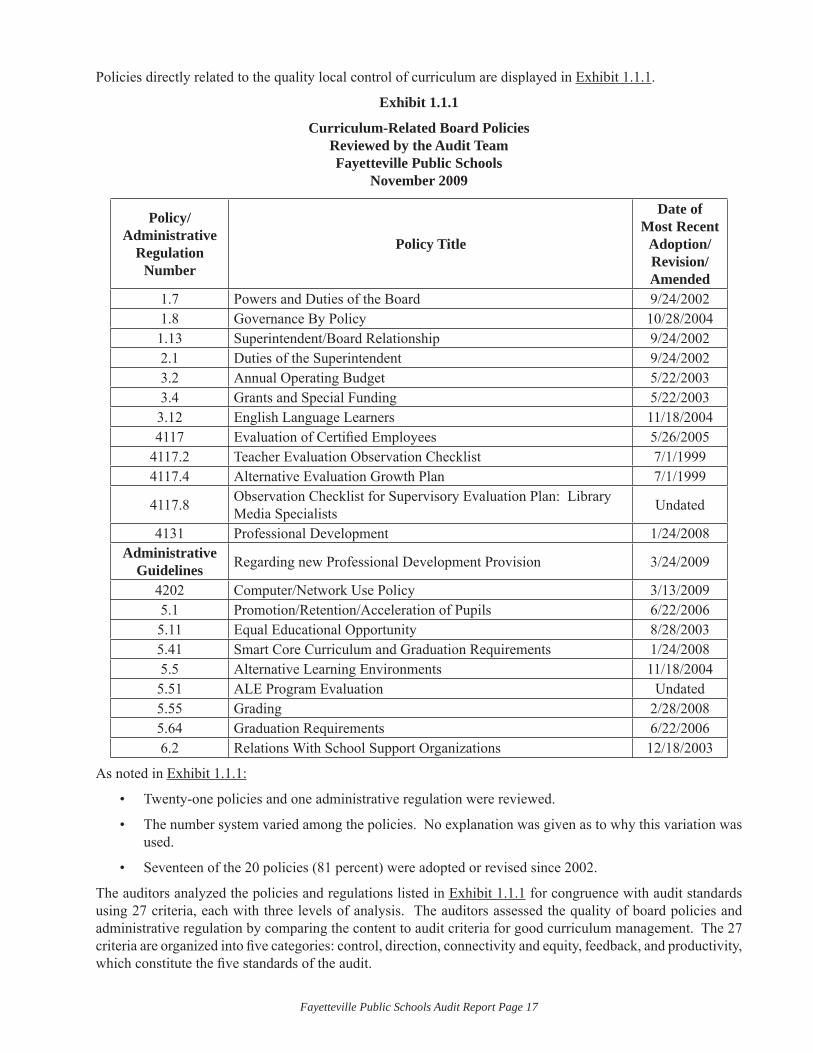
Policies directly related to the quality local control of curriculum are displayed in Exhibit 1.1.1.
Exhibit 1.1.1
Curriculum-Related Board Policies Reviewed by the Audit TeamFayetteville Public Schools
November 2009
Policy/Administrative
Regulation Number
Policy Title
Date of Most Recent
Adoption/Revision/Amended
1.7 Powers and Duties of the Board 9/24/20021.8 Governance By Policy 10/28/20041.13 Superintendent/Board Relationship 9/24/20022.1 Duties of the Superintendent 9/24/20023.2 Annual Operating Budget 5/22/20033.4 Grants and Special Funding 5/22/20033.12 English Language Learners 11/18/20044117 Evaluation of Certifi ed Employees 5/26/2005
4117.2 Teacher Evaluation Observation Checklist 7/1/19994117.4 Alternative Evaluation Growth Plan 7/1/1999
4117.8 Observation Checklist for Supervisory Evaluation Plan: Library Media Specialists Undated
4131 Professional Development 1/24/2008Administrative
Guidelines Regarding new Professional Development Provision 3/24/2009
4202 Computer/Network Use Policy 3/13/20095.1 Promotion/Retention/Acceleration of Pupils 6/22/20065.11 Equal Educational Opportunity 8/28/20035.41 Smart Core Curriculum and Graduation Requirements 1/24/20085.5 Alternative Learning Environments 11/18/20045.51 ALE Program Evaluation Undated5.55 Grading 2/28/20085.64 Graduation Requirements 6/22/20066.2 Relations With School Support Organizations 12/18/2003
As noted in Exhibit 1.1.1:
Twenty-one policies and one administrative regulation were reviewed.•
The number system varied among the policies. No explanation was given as to why this variation was • used.
Seventeen of the 20 policies (81 percent) were adopted or revised since 2002.•
The auditors analyzed the policies and regulations listed in Exhibit 1.1.1 for congruence with audit standards using 27 criteria, each with three levels of analysis. The auditors assessed the quality of board policies and administrative regulation by comparing the content to audit criteria for good curriculum management. The 27 criteria are organized into fi ve categories: control, direction, connectivity and equity, feedback, and productivity, which constitute the fi ve standards of the audit.
Fayetteville Public Schools Audit Report Page 18
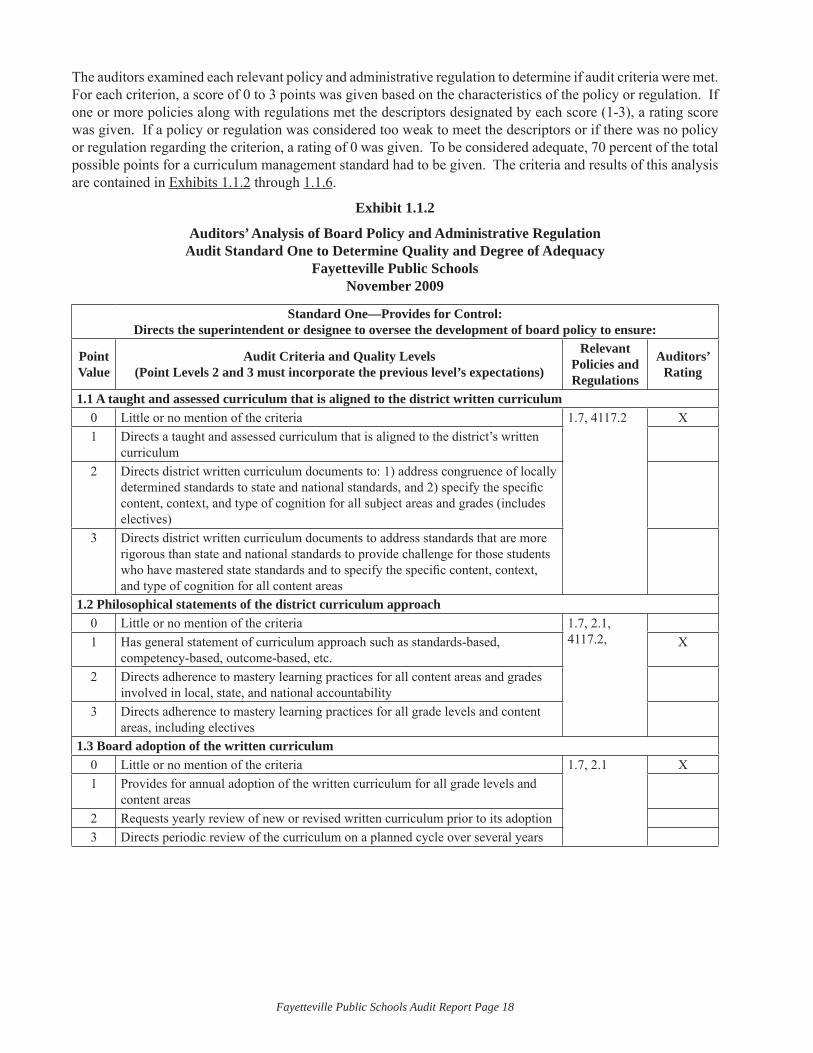
The auditors examined each relevant policy and administrative regulation to determine if audit criteria were met. For each criterion, a score of 0 to 3 points was given based on the characteristics of the policy or regulation. If one or more policies along with regulations met the descriptors designated by each score (1-3), a rating score was given. If a policy or regulation was considered too weak to meet the descriptors or if there was no policy or regulation regarding the criterion, a rating of 0 was given. To be considered adequate, 70 percent of the total possible points for a curriculum management standard had to be given. The criteria and results of this analysis are contained in Exhibits 1.1.2 through 1.1.6.
Exhibit 1.1.2
Auditors’ Analysis of Board Policy and Administrative Regulation Audit Standard One to Determine Quality and Degree of Adequacy
Fayetteville Public SchoolsNovember 2009
Standard One—Provides for Control: Directs the superintendent or designee to oversee the development of board policy to ensure:
Point Value
Audit Criteria and Quality Levels(Point Levels 2 and 3 must incorporate the previous level’s expectations)
Relevant Policies and Regulations
Auditors’ Rating
1.1 A taught and assessed curriculum that is aligned to the district written curriculum0 Little or no mention of the criteria 1.7, 4117.2 X1 Directs a taught and assessed curriculum that is aligned to the district’s written
curriculum2 Directs district written curriculum documents to: 1) address congruence of locally
determined standards to state and national standards, and 2) specify the specifi c content, context, and type of cognition for all subject areas and grades (includes electives)
3 Directs district written curriculum documents to address standards that are more rigorous than state and national standards to provide challenge for those students who have mastered state standards and to specify the specifi c content, context, and type of cognition for all content areas
1.2 Philosophical statements of the district curriculum approach0 Little or no mention of the criteria 1.7, 2.1,
4117.2,1 Has general statement of curriculum approach such as standards-based, competency-based, outcome-based, etc.
X
2 Directs adherence to mastery learning practices for all content areas and grades involved in local, state, and national accountability
3 Directs adherence to mastery learning practices for all grade levels and content areas, including electives
1.3 Board adoption of the written curriculum0 Little or no mention of the criteria 1.7, 2.1 X1 Provides for annual adoption of the written curriculum for all grade levels and
content areas2 Requests yearly review of new or revised written curriculum prior to its adoption3 Directs periodic review of the curriculum on a planned cycle over several years
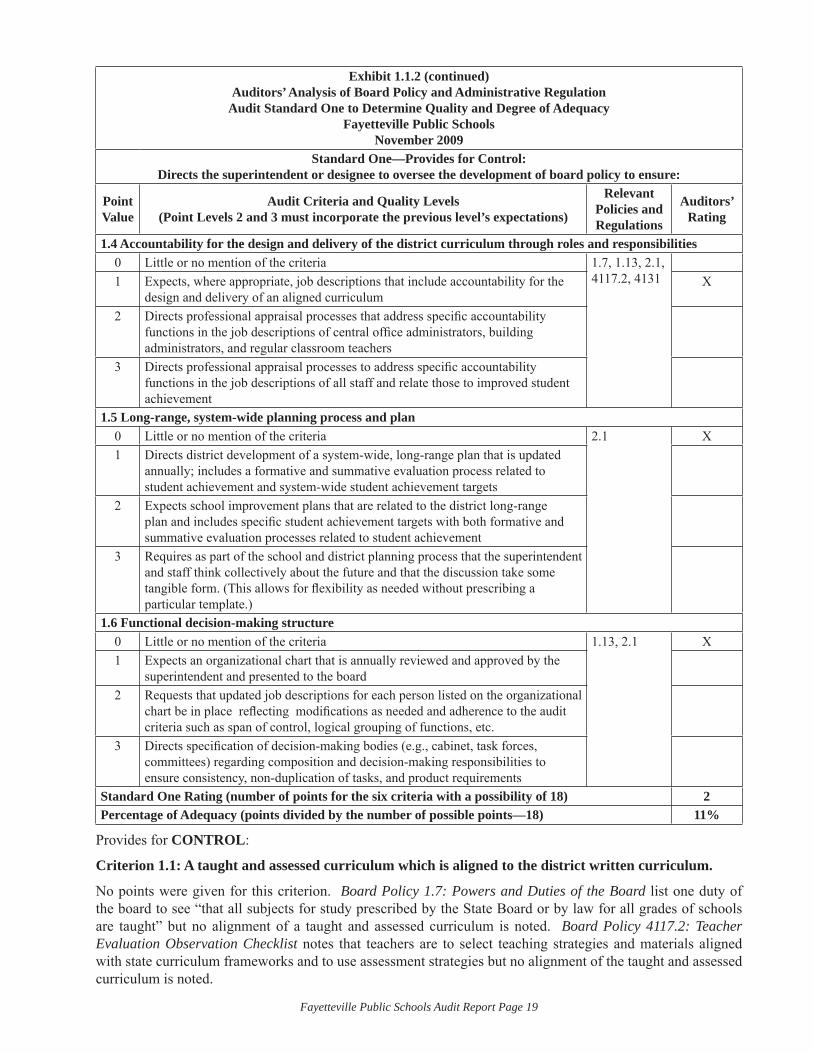
Fayetteville Public Schools Audit Report Page 19
Exhibit 1.1.2 (continued)Auditors’ Analysis of Board Policy and Administrative Regulation
Audit Standard One to Determine Quality and Degree of AdequacyFayetteville Public Schools
November 2009Standard One—Provides for Control:
Directs the superintendent or designee to oversee the development of board policy to ensure:
Point Value
Audit Criteria and Quality Levels(Point Levels 2 and 3 must incorporate the previous level’s expectations)
Relevant Policies and Regulations
Auditors’ Rating
1.4 Accountability for the design and delivery of the district curriculum through roles and responsibilities0 Little or no mention of the criteria 1.7, 1.13, 2.1,
4117.2, 41311 Expects, where appropriate, job descriptions that include accountability for the design and delivery of an aligned curriculum
X
2 Directs professional appraisal processes that address specifi c accountability functions in the job descriptions of central offi ce administrators, building administrators, and regular classroom teachers
3 Directs professional appraisal processes to address specifi c accountability functions in the job descriptions of all staff and relate those to improved student achievement
1.5 Long-range, system-wide planning process and plan0 Little or no mention of the criteria 2.1 X1 Directs district development of a system-wide, long-range plan that is updated
annually; includes a formative and summative evaluation process related to student achievement and system-wide student achievement targets
2 Expects school improvement plans that are related to the district long-range plan and includes specifi c student achievement targets with both formative and summative evaluation processes related to student achievement
3 Requires as part of the school and district planning process that the superintendent and staff think collectively about the future and that the discussion take some tangible form. (This allows for fl exibility as needed without prescribing a particular template.)
1.6 Functional decision-making structure0 Little or no mention of the criteria 1.13, 2.1 X1 Expects an organizational chart that is annually reviewed and approved by the
superintendent and presented to the board2 Requests that updated job descriptions for each person listed on the organizational
chart be in place refl ecting modifi cations as needed and adherence to the audit criteria such as span of control, logical grouping of functions, etc.
3 Directs specifi cation of decision-making bodies (e.g., cabinet, task forces, committees) regarding composition and decision-making responsibilities to ensure consistency, non-duplication of tasks, and product requirements
Standard One Rating (number of points for the six criteria with a possibility of 18) 2Percentage of Adequacy (points divided by the number of possible points—18) 11%
Provides for CONTROL:
Criterion 1.1: A taught and assessed curriculum which is aligned to the district written curriculum.
No points were given for this criterion. Board Policy 1.7: Powers and Duties of the Board list one duty of the board to see “that all subjects for study prescribed by the State Board or by law for all grades of schools are taught” but no alignment of a taught and assessed curriculum is noted. Board Policy 4117.2: Teacher Evaluation Observation Checklist notes that teachers are to select teaching strategies and materials aligned with state curriculum frameworks and to use assessment strategies but no alignment of the taught and assessed curriculum is noted.
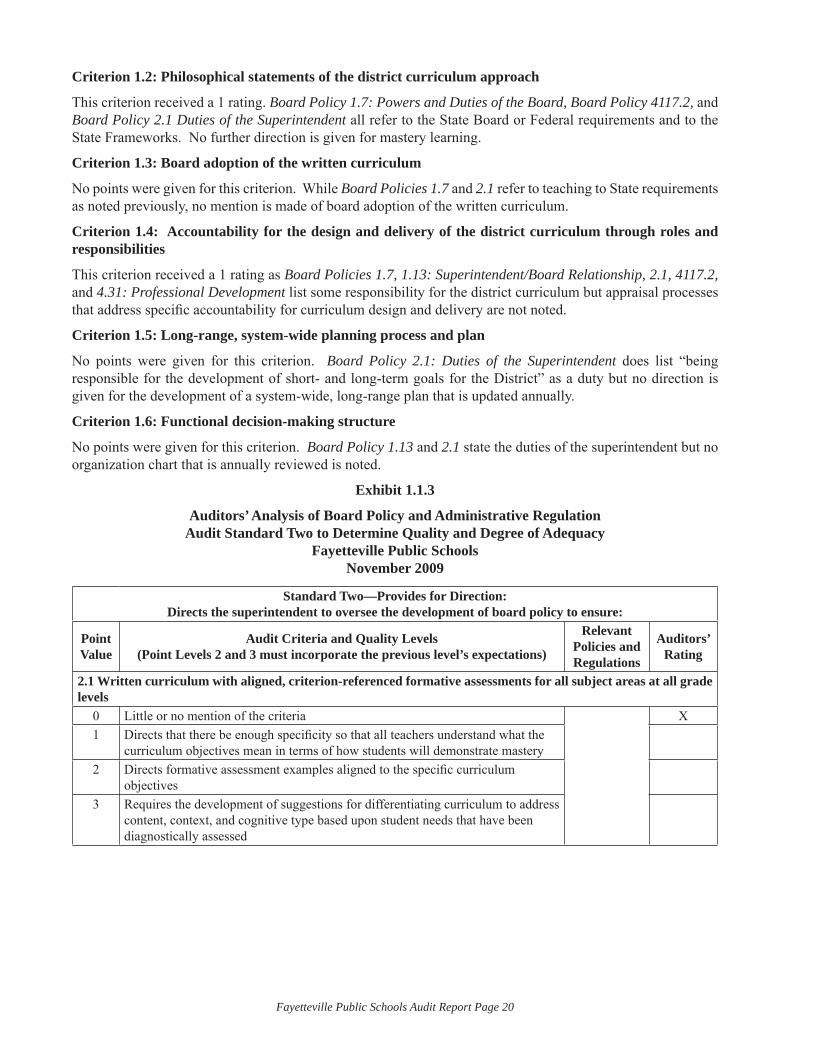
Fayetteville Public Schools Audit Report Page 20
Criterion 1.2: Philosophical statements of the district curriculum approach
This criterion received a 1 rating. Board Policy 1.7: Powers and Duties of the Board, Board Policy 4117.2, and Board Policy 2.1 Duties of the Superintendent all refer to the State Board or Federal requirements and to the State Frameworks. No further direction is given for mastery learning.
Criterion 1.3: Board adoption of the written curriculum
No points were given for this criterion. While Board Policies 1.7 and 2.1 refer to teaching to State requirements as noted previously, no mention is made of board adoption of the written curriculum.
Criterion 1.4: Accountability for the design and delivery of the district curriculum through roles and responsibilities
This criterion received a 1 rating as Board Policies 1.7, 1.13: Superintendent/Board Relationship, 2.1, 4117.2, and 4.31: Professional Development list some responsibility for the district curriculum but appraisal processes that address specifi c accountability for curriculum design and delivery are not noted.
Criterion 1.5: Long-range, system-wide planning process and plan
No points were given for this criterion. Board Policy 2.1: Duties of the Superintendent does list “being responsible for the development of short- and long-term goals for the District” as a duty but no direction is given for the development of a system-wide, long-range plan that is updated annually.
Criterion 1.6: Functional decision-making structure
No points were given for this criterion. Board Policy 1.13 and 2.1 state the duties of the superintendent but no organization chart that is annually reviewed is noted.
Exhibit 1.1.3
Auditors’ Analysis of Board Policy and Administrative Regulation Audit Standard Two to Determine Quality and Degree of Adequacy
Fayetteville Public SchoolsNovember 2009
Standard Two—Provides for Direction: Directs the superintendent to oversee the development of board policy to ensure:
Point Value
Audit Criteria and Quality Levels(Point Levels 2 and 3 must incorporate the previous level’s expectations)
Relevant Policies and Regulations
Auditors’ Rating
2.1 Written curriculum with aligned, criterion-referenced formative assessments for all subject areas at all grade levels
0 Little or no mention of the criteria X1 Directs that there be enough specifi city so that all teachers understand what the
curriculum objectives mean in terms of how students will demonstrate mastery2 Directs formative assessment examples aligned to the specifi c curriculum
objectives3 Requires the development of suggestions for differentiating curriculum to address
content, context, and cognitive type based upon student needs that have been diagnostically assessed
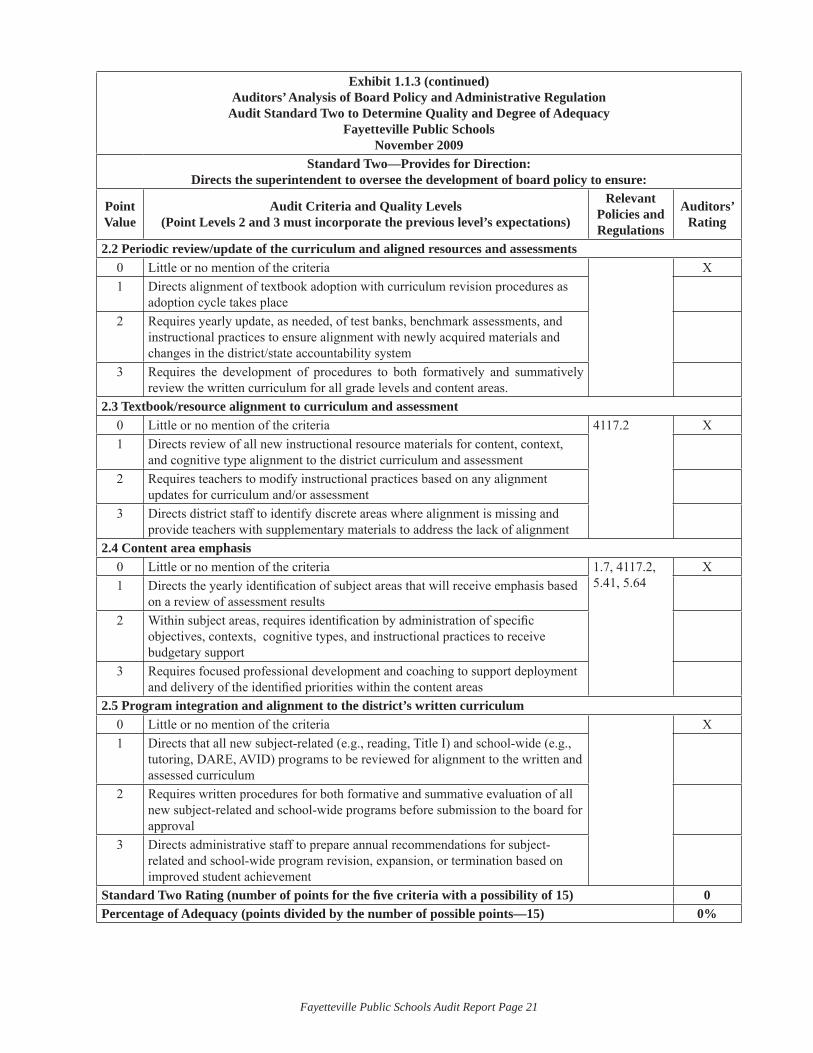
Fayetteville Public Schools Audit Report Page 21
Exhibit 1.1.3 (continued)Auditors’ Analysis of Board Policy and Administrative Regulation
Audit Standard Two to Determine Quality and Degree of AdequacyFayetteville Public Schools
November 2009Standard Two—Provides for Direction:
Directs the superintendent to oversee the development of board policy to ensure:
Point Value
Audit Criteria and Quality Levels(Point Levels 2 and 3 must incorporate the previous level’s expectations)
Relevant Policies and Regulations
Auditors’ Rating
2.2 Periodic review/update of the curriculum and aligned resources and assessments0 Little or no mention of the criteria X1 Directs alignment of textbook adoption with curriculum revision procedures as
adoption cycle takes place2 Requires yearly update, as needed, of test banks, benchmark assessments, and
instructional practices to ensure alignment with newly acquired materials and changes in the district/state accountability system
3 Requires the development of procedures to both formatively and summatively review the written curriculum for all grade levels and content areas.
2.3 Textbook/resource alignment to curriculum and assessment0 Little or no mention of the criteria 4117.2 X1 Directs review of all new instructional resource materials for content, context,
and cognitive type alignment to the district curriculum and assessment2 Requires teachers to modify instructional practices based on any alignment
updates for curriculum and/or assessment3 Directs district staff to identify discrete areas where alignment is missing and
provide teachers with supplementary materials to address the lack of alignment2.4 Content area emphasis
0 Little or no mention of the criteria 1.7, 4117.2, 5.41, 5.64
X1 Directs the yearly identifi cation of subject areas that will receive emphasis based
on a review of assessment results2 Within subject areas, requires identifi cation by administration of specifi c
objectives, contexts, cognitive types, and instructional practices to receive budgetary support
3 Requires focused professional development and coaching to support deployment and delivery of the identifi ed priorities within the content areas
2.5 Program integration and alignment to the district’s written curriculum0 Little or no mention of the criteria X1 Directs that all new subject-related (e.g., reading, Title I) and school-wide (e.g.,
tutoring, DARE, AVID) programs to be reviewed for alignment to the written and assessed curriculum
2 Requires written procedures for both formative and summative evaluation of all new subject-related and school-wide programs before submission to the board for approval
3 Directs administrative staff to prepare annual recommendations for subject-related and school-wide program revision, expansion, or termination based on improved student achievement
Standard Two Rating (number of points for the fi ve criteria with a possibility of 15) 0Percentage of Adequacy (points divided by the number of possible points—15) 0%
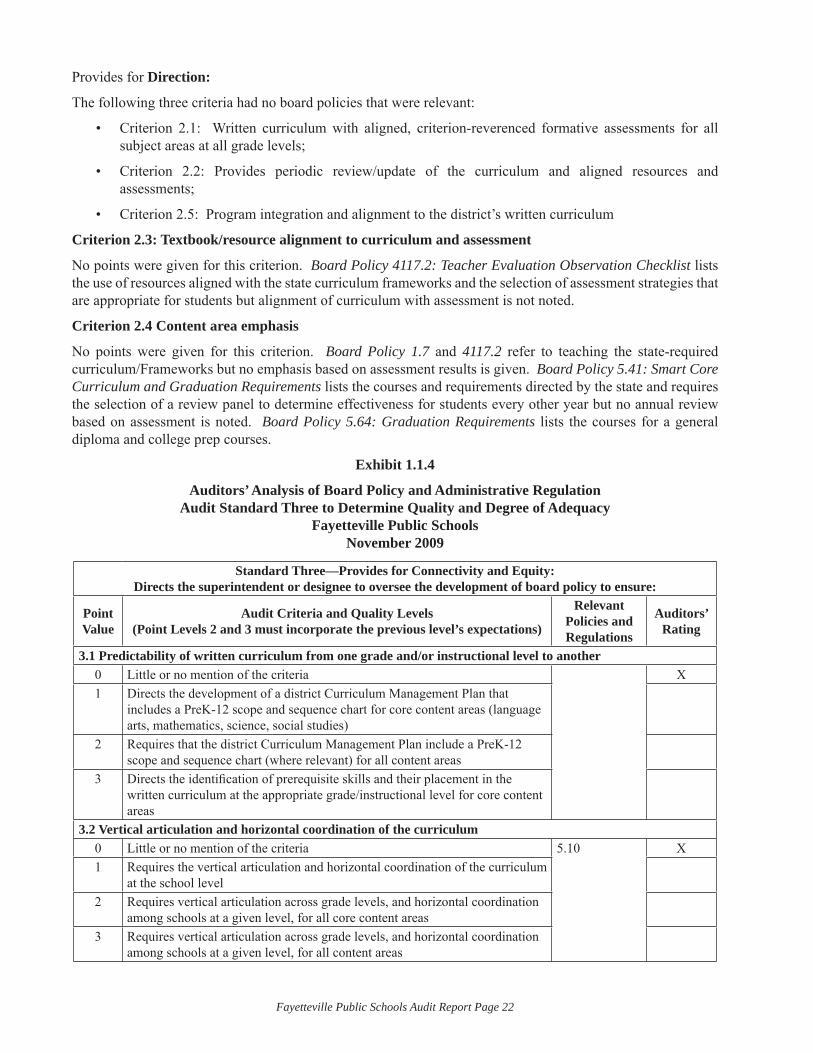
Fayetteville Public Schools Audit Report Page 22
Provides for Direction:
The following three criteria had no board policies that were relevant:
Criterion 2.1: Written curriculum with aligned, criterion-reverenced formative assessments for all • subject areas at all grade levels;
Criterion 2.2: Provides periodic review/update of the curriculum and aligned resources and • assessments;
Criterion 2.5: Program integration and alignment to the district’s written curriculum•
Criterion 2.3: Textbook/resource alignment to curriculum and assessment
No points were given for this criterion. Board Policy 4117.2: Teacher Evaluation Observation Checklist lists the use of resources aligned with the state curriculum frameworks and the selection of assessment strategies that are appropriate for students but alignment of curriculum with assessment is not noted.
Criterion 2.4 Content area emphasis
No points were given for this criterion. Board Policy 1.7 and 4117.2 refer to teaching the state-required curriculum/Frameworks but no emphasis based on assessment results is given. Board Policy 5.41: Smart Core Curriculum and Graduation Requirements lists the courses and requirements directed by the state and requires the selection of a review panel to determine effectiveness for students every other year but no annual review based on assessment is noted. Board Policy 5.64: Graduation Requirements lists the courses for a general diploma and college prep courses.
Exhibit 1.1.4
Auditors’ Analysis of Board Policy and Administrative Regulation Audit Standard Three to Determine Quality and Degree of Adequacy
Fayetteville Public SchoolsNovember 2009
Standard Three—Provides for Connectivity and Equity: Directs the superintendent or designee to oversee the development of board policy to ensure:
Point Value
Audit Criteria and Quality Levels(Point Levels 2 and 3 must incorporate the previous level’s expectations)
Relevant Policies and Regulations
Auditors’ Rating
3.1 Predictability of written curriculum from one grade and/or instructional level to another0 Little or no mention of the criteria X1 Directs the development of a district Curriculum Management Plan that
includes a PreK-12 scope and sequence chart for core content areas (language arts, mathematics, science, social studies)
2 Requires that the district Curriculum Management Plan include a PreK-12 scope and sequence chart (where relevant) for all content areas
3 Directs the identifi cation of prerequisite skills and their placement in the written curriculum at the appropriate grade/instructional level for core content areas
3.2 Vertical articulation and horizontal coordination of the curriculum0 Little or no mention of the criteria 5.10 X1 Requires the vertical articulation and horizontal coordination of the curriculum
at the school level2 Requires vertical articulation across grade levels, and horizontal coordination
among schools at a given level, for all core content areas3 Requires vertical articulation across grade levels, and horizontal coordination
among schools at a given level, for all content areas
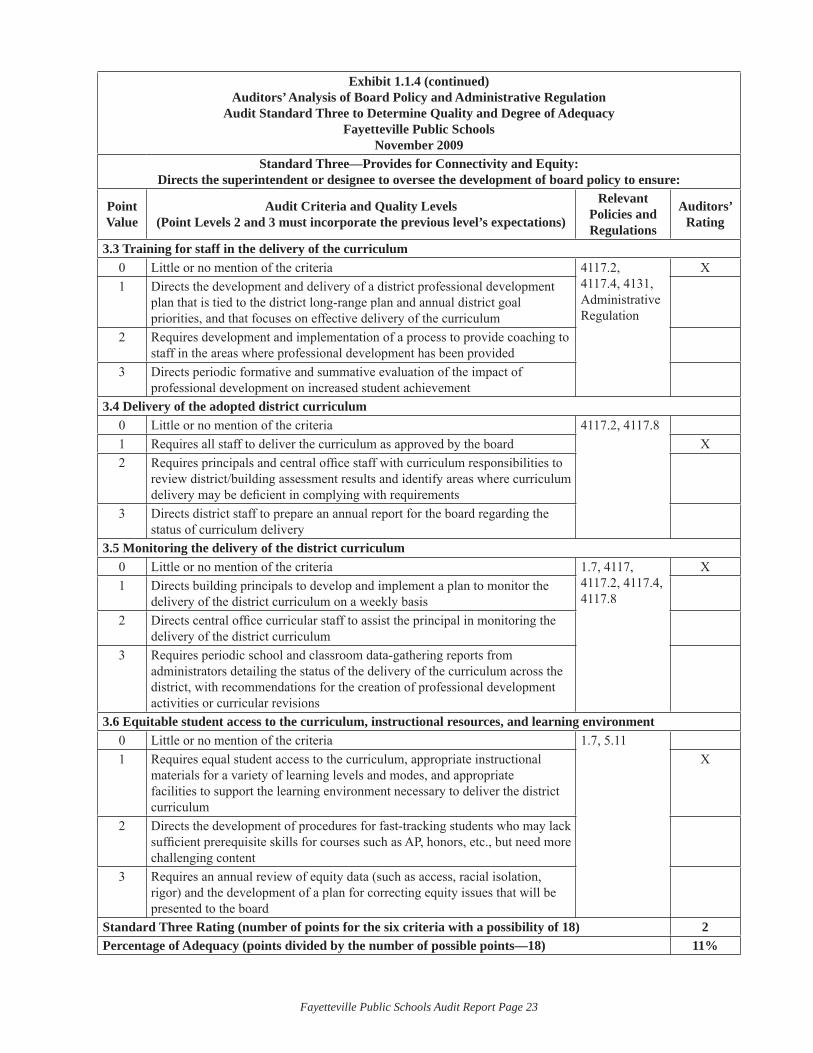
Fayetteville Public Schools Audit Report Page 23
Exhibit 1.1.4 (continued)Auditors’ Analysis of Board Policy and Administrative Regulation
Audit Standard Three to Determine Quality and Degree of AdequacyFayetteville Public Schools
November 2009Standard Three—Provides for Connectivity and Equity:
Directs the superintendent or designee to oversee the development of board policy to ensure:
Point Value
Audit Criteria and Quality Levels(Point Levels 2 and 3 must incorporate the previous level’s expectations)
Relevant Policies and Regulations
Auditors’ Rating
3.3 Training for staff in the delivery of the curriculum 0 Little or no mention of the criteria 4117.2,
4117.4, 4131, Administrative Regulation
X1 Directs the development and delivery of a district professional development
plan that is tied to the district long-range plan and annual district goal priorities, and that focuses on effective delivery of the curriculum
2 Requires development and implementation of a process to provide coaching to staff in the areas where professional development has been provided
3 Directs periodic formative and summative evaluation of the impact of professional development on increased student achievement
3.4 Delivery of the adopted district curriculum0 Little or no mention of the criteria 4117.2, 4117.81 Requires all staff to deliver the curriculum as approved by the board X2 Requires principals and central offi ce staff with curriculum responsibilities to
review district/building assessment results and identify areas where curriculum delivery may be defi cient in complying with requirements
3 Directs district staff to prepare an annual report for the board regarding the status of curriculum delivery
3.5 Monitoring the delivery of the district curriculum0 Little or no mention of the criteria 1.7, 4117,
4117.2, 4117.4, 4117.8
X1 Directs building principals to develop and implement a plan to monitor the
delivery of the district curriculum on a weekly basis2 Directs central offi ce curricular staff to assist the principal in monitoring the
delivery of the district curriculum3 Requires periodic school and classroom data-gathering reports from
administrators detailing the status of the delivery of the curriculum across the district, with recommendations for the creation of professional development activities or curricular revisions
3.6 Equitable student access to the curriculum, instructional resources, and learning environment0 Little or no mention of the criteria 1.7, 5.111 Requires equal student access to the curriculum, appropriate instructional
materials for a variety of learning levels and modes, and appropriate facilities to support the learning environment necessary to deliver the district curriculum
X
2 Directs the development of procedures for fast-tracking students who may lack suffi cient prerequisite skills for courses such as AP, honors, etc., but need more challenging content
3 Requires an annual review of equity data (such as access, racial isolation, rigor) and the development of a plan for correcting equity issues that will be presented to the board
Standard Three Rating (number of points for the six criteria with a possibility of 18) 2Percentage of Adequacy (points divided by the number of possible points—18) 11%
Fayetteville Public Schools Audit Report Page 24
Provides for Connectivity and Equity:
Criterion 3.1: Predictability of written curriculum from one grade and/or instructional level to another
No board policies or administrative regulation were found for this criterion.
Criterion 3.2: Vertical articulation and horizontal coordination of the curriculum
No points were given for this criterion. Board Policy 5.10: Promotion/Retention/Acceleration of Pupils includes the following words—“continuous progress curriculum and the continuous promotion of students.” However, this does not meet the intent of this criterion.
Criterion 3.3: Training for staff in the delivery of curriculum
No points were given for this criterion. Board Policy 4117.2 and 4117.4: Alternative Evaluation Growth Plan evaluate a teacher’s performance and a plan for improvement. Board Policy 4131 and the Administration Regulation “Administrative Guidelines Regarding new PD Provisions” address the rationale and requirement for staff development. However, no policy or administrative regulation directs the development and delivery of a district professional development plan.
Criterion 3.4: Delivery of the adopted district curriculum
This criterion received a rating of 1. Board Policy 4117.2 and 4117.8: Observation Checklist for Supervisory Evaluation Plan: Library Media Specialists include the requirement to teach the State Frameworks (teacher evaluation) and to integrate instruction with curriculum standards and classroom content (Library Media Specialists). No policy requires principals and central offi ce staff to review assessment results to identify defi ciencies in curriculum.
Criterion 3.5: Monitoring the delivery of the district curriculum
No points were given for this criterion. Board Policy 1.7, 4117: Evaluation of Certifi ed Employees, 4117.2, 4117.4, and 4117.8 require the monitoring of the delivery of the district curriculum but no development of a plan to monitor the delivery on a weekly basis.
Criterion 3.6: Equitable student access to the curriculum, instructional resources, and learning environment
This criterion received a rating of 1. Board Policy 1.7 states that a duty of the board includes “striving to assure that all students are challenged and are given an equal educational opportunity.” Board Policy 5.11: Equal Educational Opportunity provides for “assuring equality of opportunity through the elimination of discriminatory practices.” No direction was given for developing procedures for fast-tracking students with an annual review of equity data.
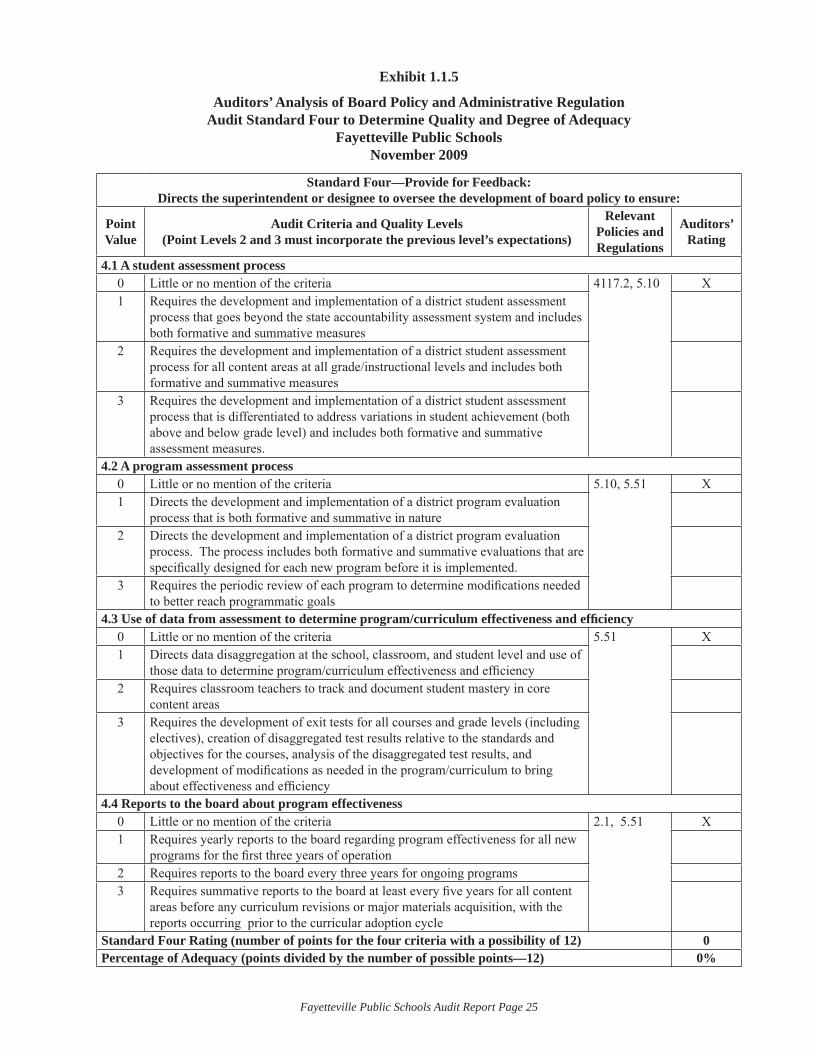
Fayetteville Public Schools Audit Report Page 25
Exhibit 1.1.5
Auditors’ Analysis of Board Policy and Administrative Regulation Audit Standard Four to Determine Quality and Degree of Adequacy
Fayetteville Public SchoolsNovember 2009
Standard Four—Provide for Feedback: Directs the superintendent or designee to oversee the development of board policy to ensure:
Point Value
Audit Criteria and Quality Levels(Point Levels 2 and 3 must incorporate the previous level’s expectations)
Relevant Policies and Regulations
Auditors’ Rating
4.1 A student assessment process0 Little or no mention of the criteria 4117.2, 5.10 X1 Requires the development and implementation of a district student assessment
process that goes beyond the state accountability assessment system and includes both formative and summative measures
2 Requires the development and implementation of a district student assessment process for all content areas at all grade/instructional levels and includes both formative and summative measures
3 Requires the development and implementation of a district student assessment process that is differentiated to address variations in student achievement (both above and below grade level) and includes both formative and summative assessment measures.
4.2 A program assessment process0 Little or no mention of the criteria 5.10, 5.51 X1 Directs the development and implementation of a district program evaluation
process that is both formative and summative in nature2 Directs the development and implementation of a district program evaluation
process. The process includes both formative and summative evaluations that are specifi cally designed for each new program before it is implemented.
3 Requires the periodic review of each program to determine modifi cations needed to better reach programmatic goals
4.3 Use of data from assessment to determine program/curriculum effectiveness and effi ciency0 Little or no mention of the criteria 5.51 X1 Directs data disaggregation at the school, classroom, and student level and use of
those data to determine program/curriculum effectiveness and effi ciency2 Requires classroom teachers to track and document student mastery in core
content areas3 Requires the development of exit tests for all courses and grade levels (including
electives), creation of disaggregated test results relative to the standards and objectives for the courses, analysis of the disaggregated test results, and development of modifi cations as needed in the program/curriculum to bring about effectiveness and effi ciency
4.4 Reports to the board about program effectiveness0 Little or no mention of the criteria 2.1, 5.51 X1 Requires yearly reports to the board regarding program effectiveness for all new
programs for the fi rst three years of operation2 Requires reports to the board every three years for ongoing programs3 Requires summative reports to the board at least every fi ve years for all content
areas before any curriculum revisions or major materials acquisition, with the reports occurring prior to the curricular adoption cycle
Standard Four Rating (number of points for the four criteria with a possibility of 12) 0Percentage of Adequacy (points divided by the number of possible points—12) 0%
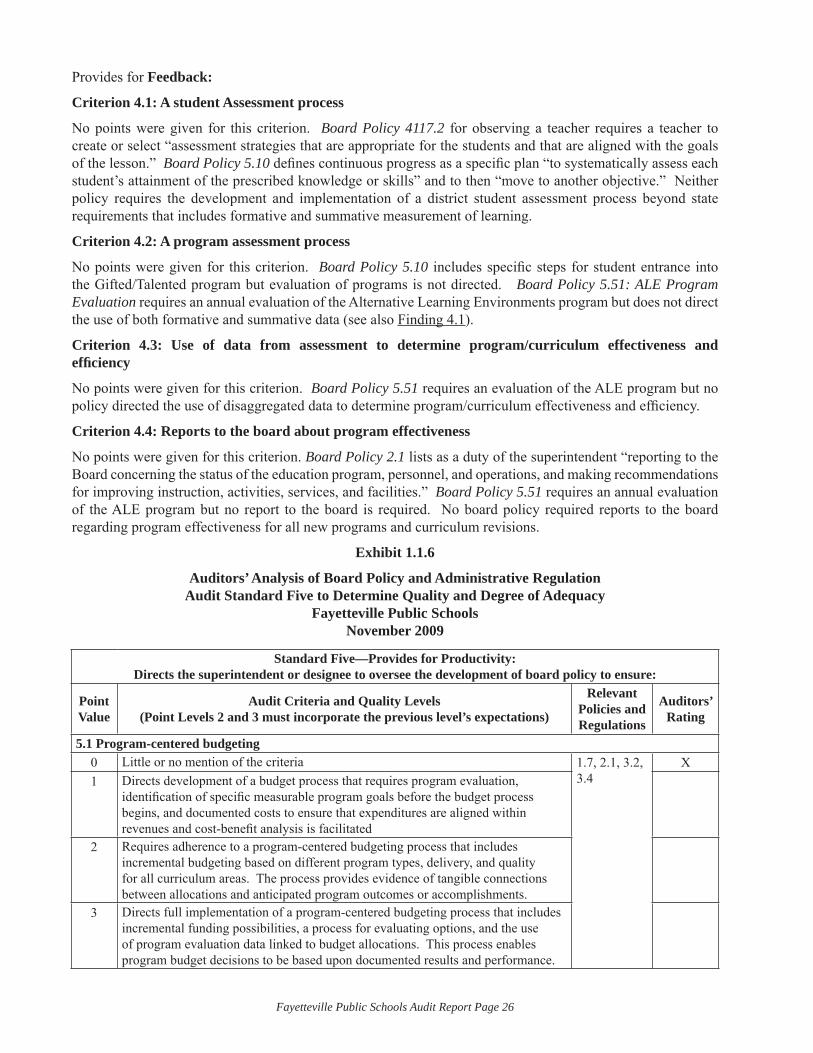
Fayetteville Public Schools Audit Report Page 26
Provides for Feedback:
Criterion 4.1: A student Assessment process
No points were given for this criterion. Board Policy 4117.2 for observing a teacher requires a teacher to create or select “assessment strategies that are appropriate for the students and that are aligned with the goals of the lesson.” Board Policy 5.10 defi nes continuous progress as a specifi c plan “to systematically assess each student’s attainment of the prescribed knowledge or skills” and to then “move to another objective.” Neither policy requires the development and implementation of a district student assessment process beyond state requirements that includes formative and summative measurement of learning.
Criterion 4.2: A program assessment process
No points were given for this criterion. Board Policy 5.10 includes specifi c steps for student entrance into the Gifted/Talented program but evaluation of programs is not directed. Board Policy 5.51: ALE Program Evaluation requires an annual evaluation of the Alternative Learning Environments program but does not direct the use of both formative and summative data (see also Finding 4.1).
Criterion 4.3: Use of data from assessment to determine program/curriculum effectiveness and effi ciency
No points were given for this criterion. Board Policy 5.51 requires an evaluation of the ALE program but no policy directed the use of disaggregated data to determine program/curriculum effectiveness and effi ciency.
Criterion 4.4: Reports to the board about program effectiveness
No points were given for this criterion. Board Policy 2.1 lists as a duty of the superintendent “reporting to the Board concerning the status of the education program, personnel, and operations, and making recommendations for improving instruction, activities, services, and facilities.” Board Policy 5.51 requires an annual evaluation of the ALE program but no report to the board is required. No board policy required reports to the board regarding program effectiveness for all new programs and curriculum revisions.
Exhibit 1.1.6
Auditors’ Analysis of Board Policy and Administrative Regulation Audit Standard Five to Determine Quality and Degree of Adequacy
Fayetteville Public SchoolsNovember 2009
Standard Five—Provides for Productivity: Directs the superintendent or designee to oversee the development of board policy to ensure:
Point Value
Audit Criteria and Quality Levels(Point Levels 2 and 3 must incorporate the previous level’s expectations)
Relevant Policies and Regulations
Auditors’ Rating
5.1 Program-centered budgeting0 Little or no mention of the criteria 1.7, 2.1, 3.2,
3.4X
1 Directs development of a budget process that requires program evaluation, identifi cation of specifi c measurable program goals before the budget process begins, and documented costs to ensure that expenditures are aligned within revenues and cost-benefi t analysis is facilitated
2 Requires adherence to a program-centered budgeting process that includes incremental budgeting based on different program types, delivery, and quality for all curriculum areas. The process provides evidence of tangible connections between allocations and anticipated program outcomes or accomplishments.
3 Directs full implementation of a program-centered budgeting process that includes incremental funding possibilities, a process for evaluating options, and the use of program evaluation data linked to budget allocations. This process enables program budget decisions to be based upon documented results and performance.
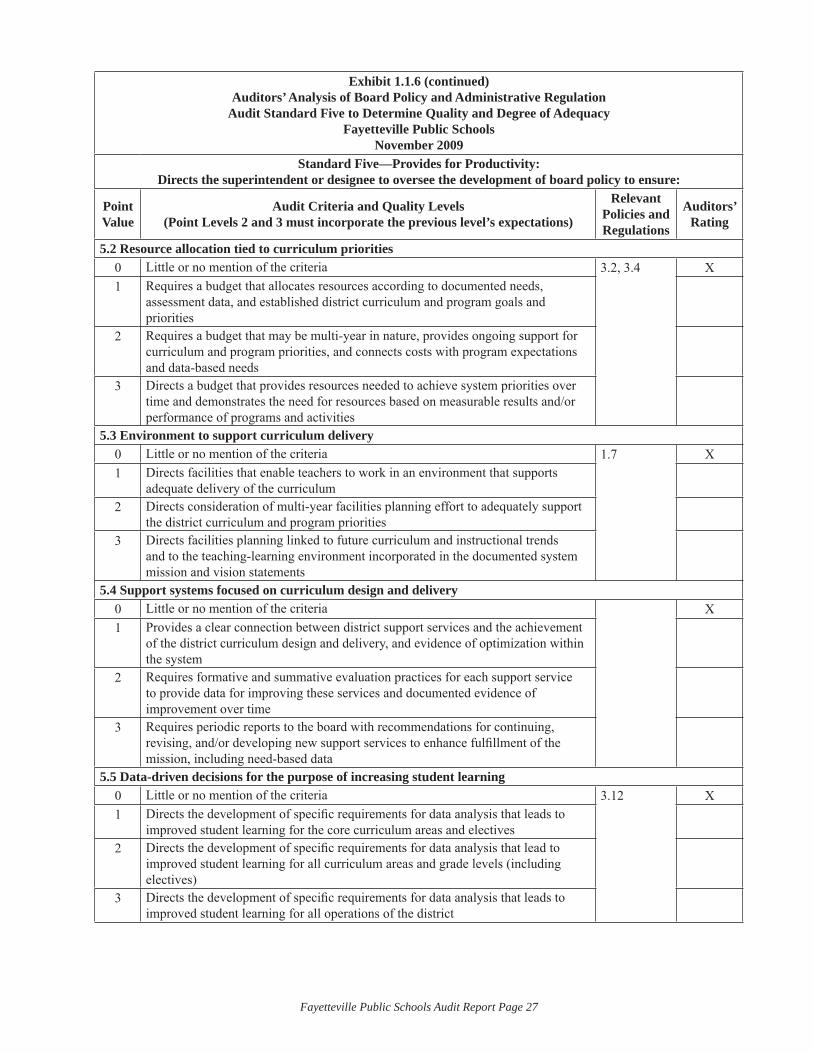
Fayetteville Public Schools Audit Report Page 27
Exhibit 1.1.6 (continued)Auditors’ Analysis of Board Policy and Administrative Regulation
Audit Standard Five to Determine Quality and Degree of AdequacyFayetteville Public Schools
November 2009Standard Five—Provides for Productivity:
Directs the superintendent or designee to oversee the development of board policy to ensure:
Point Value
Audit Criteria and Quality Levels(Point Levels 2 and 3 must incorporate the previous level’s expectations)
Relevant Policies and Regulations
Auditors’ Rating
5.2 Resource allocation tied to curriculum priorities0 Little or no mention of the criteria 3.2, 3.4 X1 Requires a budget that allocates resources according to documented needs,
assessment data, and established district curriculum and program goals and priorities
2 Requires a budget that may be multi-year in nature, provides ongoing support for curriculum and program priorities, and connects costs with program expectations and data-based needs
3 Directs a budget that provides resources needed to achieve system priorities over time and demonstrates the need for resources based on measurable results and/or performance of programs and activities
5.3 Environment to support curriculum delivery0 Little or no mention of the criteria 1.7 X1 Directs facilities that enable teachers to work in an environment that supports
adequate delivery of the curriculum 2 Directs consideration of multi-year facilities planning effort to adequately support
the district curriculum and program priorities3 Directs facilities planning linked to future curriculum and instructional trends
and to the teaching-learning environment incorporated in the documented system mission and vision statements
5.4 Support systems focused on curriculum design and delivery0 Little or no mention of the criteria X1 Provides a clear connection between district support services and the achievement
of the district curriculum design and delivery, and evidence of optimization within the system
2 Requires formative and summative evaluation practices for each support service to provide data for improving these services and documented evidence of improvement over time
3 Requires periodic reports to the board with recommendations for continuing, revising, and/or developing new support services to enhance fulfi llment of the mission, including need-based data
5.5 Data-driven decisions for the purpose of increasing student learning0 Little or no mention of the criteria 3.12 X1 Directs the development of specifi c requirements for data analysis that leads to
improved student learning for the core curriculum areas and electives2 Directs the development of specifi c requirements for data analysis that lead to
improved student learning for all curriculum areas and grade levels (including electives)
3 Directs the development of specifi c requirements for data analysis that leads to improved student learning for all operations of the district
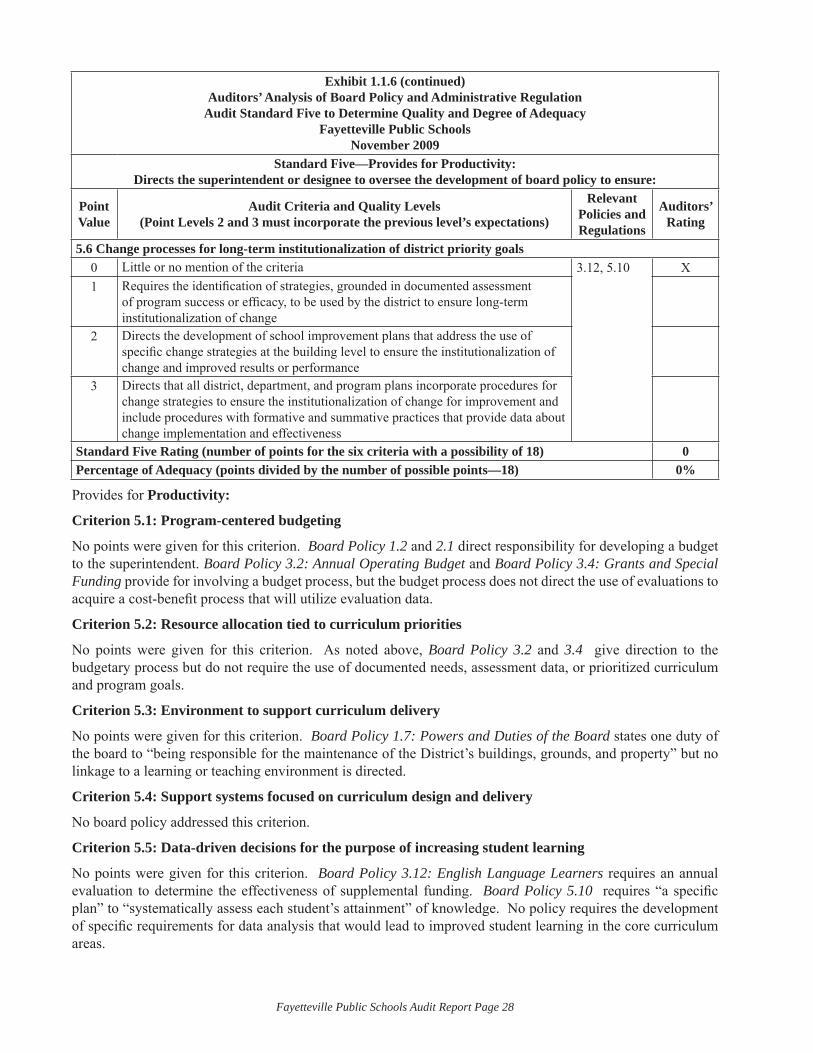
Fayetteville Public Schools Audit Report Page 28
Exhibit 1.1.6 (continued)Auditors’ Analysis of Board Policy and Administrative Regulation
Audit Standard Five to Determine Quality and Degree of AdequacyFayetteville Public Schools
November 2009Standard Five—Provides for Productivity:
Directs the superintendent or designee to oversee the development of board policy to ensure:
Point Value
Audit Criteria and Quality Levels(Point Levels 2 and 3 must incorporate the previous level’s expectations)
Relevant Policies and Regulations
Auditors’ Rating
5.6 Change processes for long-term institutionalization of district priority goals0 Little or no mention of the criteria 3.12, 5.10 X1 Requires the identifi cation of strategies, grounded in documented assessment
of program success or effi cacy, to be used by the district to ensure long-term institutionalization of change
2 Directs the development of school improvement plans that address the use of specifi c change strategies at the building level to ensure the institutionalization of change and improved results or performance
3 Directs that all district, department, and program plans incorporate procedures for change strategies to ensure the institutionalization of change for improvement and include procedures with formative and summative practices that provide data about change implementation and effectiveness
Standard Five Rating (number of points for the six criteria with a possibility of 18) 0Percentage of Adequacy (points divided by the number of possible points—18) 0%
Provides for Productivity:
Criterion 5.1: Program-centered budgeting
No points were given for this criterion. Board Policy 1.2 and 2.1 direct responsibility for developing a budget to the superintendent. Board Policy 3.2: Annual Operating Budget and Board Policy 3.4: Grants and Special Funding provide for involving a budget process, but the budget process does not direct the use of evaluations to acquire a cost-benefi t process that will utilize evaluation data.
Criterion 5.2: Resource allocation tied to curriculum priorities
No points were given for this criterion. As noted above, Board Policy 3.2 and 3.4 give direction to the budgetary process but do not require the use of documented needs, assessment data, or prioritized curriculum and program goals.
Criterion 5.3: Environment to support curriculum delivery
No points were given for this criterion. Board Policy 1.7: Powers and Duties of the Board states one duty of the board to “being responsible for the maintenance of the District’s buildings, grounds, and property” but no linkage to a learning or teaching environment is directed.
Criterion 5.4: Support systems focused on curriculum design and delivery
No board policy addressed this criterion.
Criterion 5.5: Data-driven decisions for the purpose of increasing student learning
No points were given for this criterion. Board Policy 3.12: English Language Learners requires an annual evaluation to determine the effectiveness of supplemental funding. Board Policy 5.10 requires “a specifi c plan” to “systematically assess each student’s attainment” of knowledge. No policy requires the development of specifi c requirements for data analysis that would lead to improved student learning in the core curriculum areas.
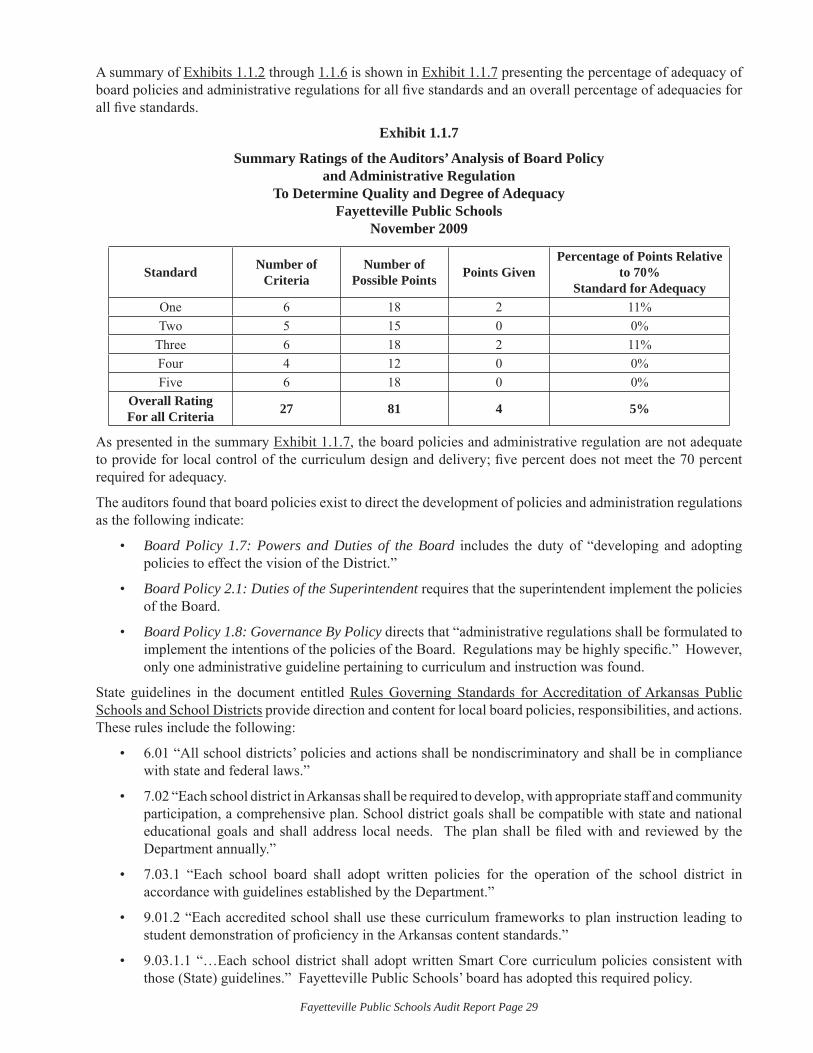
Fayetteville Public Schools Audit Report Page 29
A summary of Exhibits 1.1.2 through 1.1.6 is shown in Exhibit 1.1.7 presenting the percentage of adequacy of board policies and administrative regulations for all fi ve standards and an overall percentage of adequacies for all fi ve standards.
Exhibit 1.1.7
Summary Ratings of the Auditors’ Analysis of Board Policy and Administrative Regulation
To Determine Quality and Degree of AdequacyFayetteville Public Schools
November 2009
Standard Number of Criteria
Number of Possible Points Points Given
Percentage of Points Relative to 70%
Standard for AdequacyOne 6 18 2 11%Two 5 15 0 0%
Three 6 18 2 11%Four 4 12 0 0%Five 6 18 0 0%
Overall Rating For all Criteria 27 81 4 5%
As presented in the summary Exhibit 1.1.7, the board policies and administrative regulation are not adequate to provide for local control of the curriculum design and delivery; fi ve percent does not meet the 70 percent required for adequacy.
The auditors found that board policies exist to direct the development of policies and administration regulations as the following indicate:
Board Policy 1.7: Powers and Duties of the Board • includes the duty of “developing and adopting policies to effect the vision of the District.”
Board Policy 2.1: Duties of the Superintendent• requires that the superintendent implement the policies of the Board.
Board Policy 1.8: Governance By Policy• directs that “administrative regulations shall be formulated to implement the intentions of the policies of the Board. Regulations may be highly specifi c.” However, only one administrative guideline pertaining to curriculum and instruction was found.
State guidelines in the document entitled Rules Governing Standards for Accreditation of Arkansas Public Schools and School Districts provide direction and content for local board policies, responsibilities, and actions. These rules include the following:
6.01 “All school districts’ policies and actions shall be nondiscriminatory and shall be in compliance • with state and federal laws.”
7.02 “Each school district in Arkansas shall be required to develop, with appropriate staff and community • participation, a comprehensive plan. School district goals shall be compatible with state and national educational goals and shall address local needs. The plan shall be fi led with and reviewed by the Department annually.”
7.03.1 “Each school board shall adopt written policies for the operation of the school district in • accordance with guidelines established by the Department.”
9.01.2 “Each accredited school shall use these curriculum frameworks to plan instruction leading to • student demonstration of profi ciency in the Arkansas content standards.”
9.03.1.1 “…Each school district shall adopt written Smart Core curriculum policies consistent with • those (State) guidelines.” Fayetteville Public Schools’ board has adopted this required policy.
Fayetteville Public Schools Audit Report Page 30
9.03.1.9 “The core curriculum for grades K-8 shall encompass all types of developmentally appropriate • learning experiences and provide for differences in rates of learning among children. It shall emphasize overarching processes of reasoning and problem solving.”
10.03 “School districts shall adopt instructional materials which provide complete coverage of a subject • as described in that subject’s curriculum frameworks and which fi t the achievement levels of the students assigned to each teacher.”
10.07 “Each school district shall adopt a written policy for appropriate and meaningful homework….” • The district board has adopted this required policy.
12.01 “Schools shall be responsible for assessing each student’s progress at each grade level in acquiring • mastery of the competencies, skills, and other subjects required by law and Arkansas Comprehensive Testing, Assessment and Accountability Program (ACTAAP) regulations. Assessment data may include performance assessments, competency test scores, standardized test scores, subject matter mastery test scores, and observations of teachers and parent(s) or guardian(s).”
12.04.1 “Each local district shall adopt a written policy requiring teachers to communicate with the • parent(s) or guardian(s)….” The district board has adopted this through policy.
15.04.1 “Each school district shall have fl exibility in establishing plans for professional development • and in-service training….” The district board has adopted this through policy.
20.02 “Each (class)room shall be furnished with equipment and instructional materials necessary to • provide the environment and working conditions appropriate for subjects or activities assigned.”
Several comments were made by board members during the interviews regarding their perception of the need for board policies and regulations that validate the auditors’ ratings as the following samples demonstrate:
“I think our policy book needs to be pared down.”•
“The policy book is huge; it is available online.”•
“We have a vision statement, but that doesn’t require us to have data.”•
“Should we have a policy to govern curriculum? I don’t know; our policies seem to serve us well.”•
“Curriculum direction is administrative. We rely on them. There is no direct board action; we’re • informed of it (curriculum).”
“Our vision statement and goals are enough to guide them (instructional staff). We don’t need • policies.”
“I think policies are guidelines; they’re not marching orders. Policy can say ‘produce successful kids’ but • policies don’t tell people how to do their job. Just need to tell them what’s expected for outcomes.”
“There are still some things in policy that are administrative, such as how to deal with a school day.”•
Comments made by administrators pertaining to board policies also demonstrate the lack of and need for this direction:
“Nothing addresses curriculum and instruction.”•
“There are really good systems in place for some areas but not for curriculum and instruction. Everything • in place for curriculum and instruction has been thrown together.”
“Our policies are lacking.”•
In summary, there is a scarcity of board policies to direct local control of the design and delivery of curriculum. Using the criteria of the curriculum management audit, an analysis of existing board policies were found to be inadequate. State requirements for accreditation maintain many aspects of quality that the curriculum management audit requires. Though administration expressed a need for board policies, board members were uncertain of their role in the development of direction through board policies.
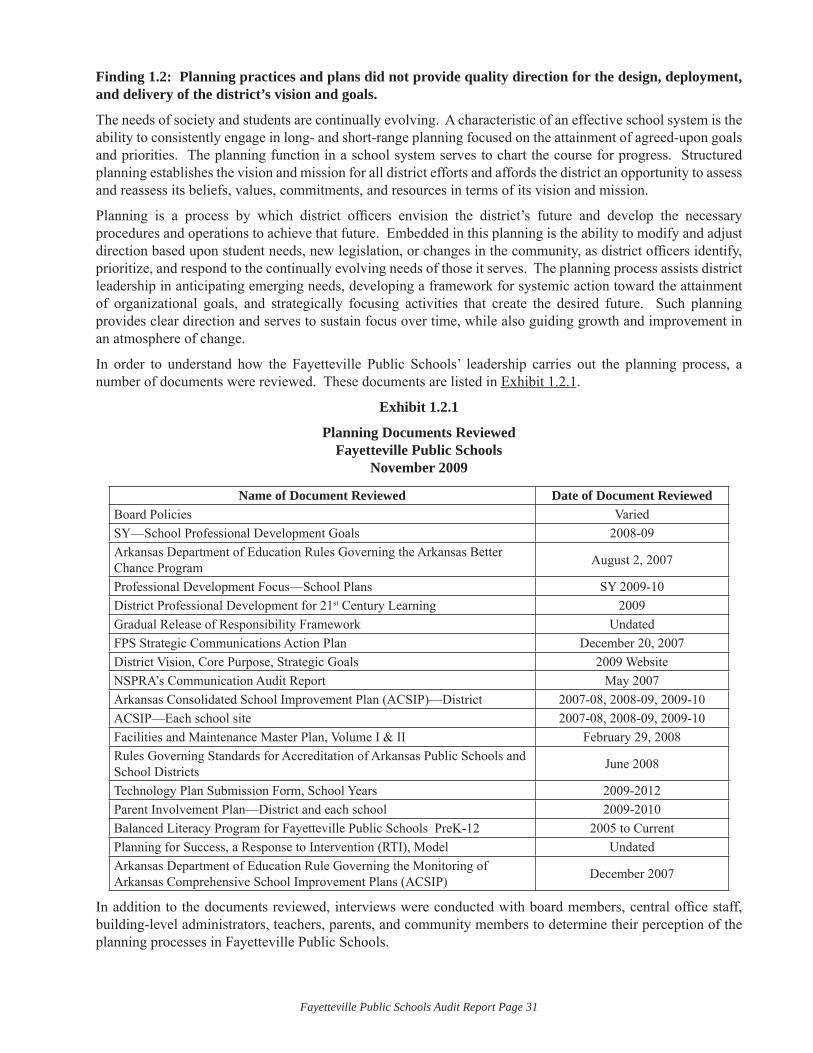
Fayetteville Public Schools Audit Report Page 31
Finding 1.2: Planning practices and plans did not provide quality direction for the design, deployment, and delivery of the district’s vision and goals.
The needs of society and students are continually evolving. A characteristic of an effective school system is the ability to consistently engage in long- and short-range planning focused on the attainment of agreed-upon goals and priorities. The planning function in a school system serves to chart the course for progress. Structured planning establishes the vision and mission for all district efforts and affords the district an opportunity to assess and reassess its beliefs, values, commitments, and resources in terms of its vision and mission.
Planning is a process by which district offi cers envision the district’s future and develop the necessary procedures and operations to achieve that future. Embedded in this planning is the ability to modify and adjust direction based upon student needs, new legislation, or changes in the community, as district offi cers identify, prioritize, and respond to the continually evolving needs of those it serves. The planning process assists district leadership in anticipating emerging needs, developing a framework for systemic action toward the attainment of organizational goals, and strategically focusing activities that create the desired future. Such planning provides clear direction and serves to sustain focus over time, while also guiding growth and improvement in an atmosphere of change.
In order to understand how the Fayetteville Public Schools’ leadership carries out the planning process, a number of documents were reviewed. These documents are listed in Exhibit 1.2.1.
Exhibit 1.2.1
Planning Documents ReviewedFayetteville Public Schools
November 2009
Name of Document Reviewed Date of Document ReviewedBoard Policies VariedSY—School Professional Development Goals 2008-09Arkansas Department of Education Rules Governing the Arkansas Better Chance Program August 2, 2007
Professional Development Focus—School Plans SY 2009-10 District Professional Development for 21st Century Learning 2009Gradual Release of Responsibility Framework UndatedFPS Strategic Communications Action Plan December 20, 2007District Vision, Core Purpose, Strategic Goals 2009 WebsiteNSPRA’s Communication Audit Report May 2007Arkansas Consolidated School Improvement Plan (ACSIP)—District 2007-08, 2008-09, 2009-10ACSIP—Each school site 2007-08, 2008-09, 2009-10Facilities and Maintenance Master Plan, Volume I & II February 29, 2008Rules Governing Standards for Accreditation of Arkansas Public Schools and School Districts June 2008
Technology Plan Submission Form, School Years 2009-2012Parent Involvement Plan—District and each school 2009-2010Balanced Literacy Program for Fayetteville Public Schools PreK-12 2005 to CurrentPlanning for Success, a Response to Intervention (RTI), Model UndatedArkansas Department of Education Rule Governing the Monitoring of Arkansas Comprehensive School Improvement Plans (ACSIP) December 2007
In addition to the documents reviewed, interviews were conducted with board members, central offi ce staff, building-level administrators, teachers, parents, and community members to determine their perception of the planning processes in Fayetteville Public Schools.

Fayetteville Public Schools Audit Report Page 32
Three different types of analyses were used by the auditors in this fi nding. The fi rst analysis dealt with the district planning process as a whole. This analysis looked at the planning function within the district and how it was carried out at various levels within the system. The second type of analysis looked at what the district considers its key strategic planning document. In this case it was the district’s vision, core purpose, and goals, in addition to the Arkansas Consolidated School Improvement Plan (ACSIP). The third type of analysis examined how various plans (including school improvement plans which addressed the Title I budgeted amounts) within the system were integrated with the strategic plan.
Overall, the auditors found that a number of plans have been written by district and school personnel, but planning is not guiding district staff as a system.
The quality of planning design, deployment, and delivery is inadequate to achieve the vision of planning
The auditors found documented evidence of planning over time. As required by state regulations, annual school improvement plans written by district and school sites must be submitted. District personnel refer to the vision statement and eight goals as the strategic plan of the district.
To determine the quality of the planning function, the auditors used the Curriculum Management Audit (CMA) characteristics of quality planning for design, deployment, and delivery. This analysis approached the planning function across the district, at the central offi ce level, across areas, and at school sites. In order for the auditors to rate the quality as adequate, at least six of the eight characteristics must receive a rating of adequate. Exhibit 1.2.2 presents the audit characteristics for examining a school district’s planning efforts and the auditors’ rating.
Exhibit 1.2.2
Auditors’ Rating of CMA Characteristics of Quality Planning Design and DeliveryFayetteville Public Schools
November 2009
Characteristics of Quality Planning Audit Criteria—Design, Deployment, and Delivery
There is evidence that…
Auditors’ Rating
Adequate Inadequate
Policy Expectations:1. The governing board has placed into policy the expectation that the superintendent and staff collectively discuss the future and that this thinking should take some tangible form without prescribing a particular template, allowing for fl exibility as needed.
X
Visionary/Direction:2. Leadership has implicit or explicit vision of the general direction for where the organization is going for improvement purposes. That vision emerges from having considered future changes in the organizational context.
X
Data-Driven:3. Data infl uence the planning and system directions/initiatives. XBudget Timing:4. Budget planning for change is done in concert with other planning, with goals and actions from those plans driving the budget planning. X
Day-to-Day Decisions:5. Leadership makes day-to-day decisions regarding the implicit or explicit direction of the system and facilitates movement toward the planned direction. X
Emergent/Fluid Planning:6. Leadership is able to adjust discrepancies between current status and desired status, facilitates movement toward the desired status, and is fl uid in planning efforts (emergent in nature).
X
Deliberate Articulated Actions:7. Staff is involved in a purposeful way through such efforts as school/unit improvement planning, professional development councils, and district task forces, which are congruent with the articulated direction of the system or system initiatives.
X
Aligned Professional Development:8. Professional development endeavors are aligned to system planning goals and initiatives. X
As presented in Exhibit 1.2.2, one of the eight characteristics was rated as adequate, with seven characteristics rated as inadequate. The following provides more information on what the auditors found with respect to each of the characteristics above.
Fayetteville Public Schools Audit Report Page 33
Characteristic One—Policy Expectations
This characteristic was rated as inadequate. Listed as one of the duties of the superintendent in Board Policy 2.1: Duties of the Superintendent is “being responsible for the development of short- and long-term goals for the District.” Board Policy 5.10: Promotion/Retention/Acceleration of Pupils speaks of a prescribed curriculum based on the following premises: 1. A specifi c plan is used to systematically assess each student’s attainment of the prescribed knowledge or skills….” No policy directs that some tangible form for this planning be done—no local direction for a written plan. During the interview process, the majority of those interviewed had no idea if a plan for the district existed; their reference to direction for the district was the vision statement and the fact that they have eight goals.
Characteristic Two—Visionary/Direction
This characteristic was rated as adequate. The vision statement of the district has a futuristic direction as follows: “Every student will leave the Fayetteville School District with a full understanding of his or her potential and the skills necessary to be successful in an ever-changing, global society.” District leadership has begun to incorporate 21st Century Learning concepts into practices across the system. In setting goals for 2012, one of the four processes to accomplish this direction listed was the “inclusion of 21st Century skills throughout the curriculum and in teacher professional development.” The main concepts of 21st Century Learning are posted at school sites and central offi ce. Goal #5 of the district’s strategic goals states “Provide a progressive information technology infrastructure to enable everyone to develop 21st century skills and effectively communicate ideas.” The Technology Plan includes in this vision statement that “our graduates will be positioned for active and productive participation in our changing world. Every graduate will have a conscious responsibility for the destiny of our community and beyond.”
Characteristic Three—Data Driven
This characteristic was rated as inadequate. Data are used for implementing the Response to Intervention (RtI) model which includes a three-tier system of addressing the lack of achievement during the school year by providing support as needed and when needed (see Findings 4.4 and 5.2.). Goal #2 of the district’s strategic goals states “Develop, implement, and support an articulated curriculum, effective instructional strategies, and a comprehensive assessment program that integrates progressive technology.” The district leadership has begun the development of a Balanced Literacy K-12 program based on the state assessment results. The district leadership has recognized the need for data analysis and has hired data personnel (see Finding 4.4). Data pertaining to achievement scores on state assessments, graduation rate, dropout rate, and attendance rate are included in the Arkansas Consolidated School Improvement Plan (ACSIP) plans with actions to be taken to address identifi ed needs. However, the process of using data in the planning and system directions/initiatives has just begun; no process for the use of data when initiating, implementing, or evaluating a program has been established (see Findings 4.1 and 4.4).
Characteristic Four—Budget Timing
This characteristic was rated as inadequate. The (ACSIP) plans, written as required by the state, notes the amount of money to be utilized for each action step. Budget planning is not aligned to the district prioritizing its planning process (see Finding 5.1).
Characteristic Five—Day-to-Day Decisions
This characteristic was rated as inadequate. Decisions are made daily based on the vision of the district, but these decisions, along with new directives from central administration, are confounding building principals as the following comments indicate:
“They need to provide a destination and not just a route. It’s like they told us to get in your car and just • start driving. At some time in the future, we’ll tell you where the destination is.”
“We start something, build enthusiasm, and then stop with no explanation.”•
Fayetteville Public Schools Audit Report Page 34
Many of those interviewed had questions about the meaning of 21st Century Learning, which is being promoted by central administration. The auditors found that changes are made and new programs are implemented before broad-based support from stakeholders is elicited. It is unclear to many how decisions link to the district vision and mission.
Characteristic Six—Emergent/Fluid Planning
This characteristic was rated as inadequate. The opportunity for emergent/fl uid planning exists within the planning process. At the building level, the continual emphasis on RtI allows for modifi cations for student grouping for instruction (see Finding 5.2). The superintendent’s cabinet meet regularly to addresses the direction of the district and actions needed to promote the “continuous improvement” that board policy directs to occur and the need to remove the AYP status of several schools. Central offi ce was described by interviewees as “silos” where departments are working independently. What is lacking are guidelines that would provide continuity and communication within and from central administration to the school site and to the community about the change actions taking place. Interviewees commented about situations in which staff members were surprised about a decision and had no knowledge that discussions were under way about the decision. With the freedom to choose actions at all levels within the system, it is easy for school-level personnel to feel overwhelmed by the volume of change impacting the classroom.
Characteristic Seven—Deliberate Articulated Actions
This characteristic was rated as inadequate. Within the buildings, school improvement plans (ACSIP) and the RtI process provide opportunities for staff to take deliberate actions aimed at success for all students. However, the fl ow of communication, as noted above, is viewed as disjointed. No board policy or regulations guide the communication process. There is little broad-based support for the initiation of new endeavors due to the lack of a perceived clear direction in the district.
Characteristic Eight—Aligned Professional Development
This characteristic was rated as inadequate. The document entitled “Professional Development Focus SY 2009-10” states that “by May 2012, the district will have 100% of students reading and communicating (oral and written) at or above grade level as determined by an annual increase of no less than 5% for the number of students scoring profi cient or above as measured by state benchmarking test scores and other district assessments.” The four processes prescribed were:
Establishment of building based collaborative teacher teams focused on student achievement;•
Response to Intervention (RtI) building plans and teams;•
Improved instruction through the Gradual Release of Responsibility model; and•
Inclusion of 21• st Century skills throughout the curriculum and in teacher professional development.
Another staff development document, “SY 08-09 School Professional Development Goals,” stated the district goals as:
Learner Centered Instruction (for example, RtI, Arts Integrated Strategies, Technology Integrated • Strategies, Project or Inquiry Based Learning, 21st Century skills, Health and Wellness, Parental Involvement, etc.);
Mathematical Profi ciency; and•
Comprehensive Literacy.•
To both of these directives, each school had to respond as to how it would address these goals.
The auditors found that while the goals of the district are being addressed through planning, in-depth systemic staff development is inadequately planned, coordinated, monitored, and evaluated to provide in-depth knowledge and implementation of the concepts being inaugurated (see Findings 2.4, and 3.2). During the interview process, the auditors were told that no long-range staff development exists; many staff members attend conferences that may or may not be aligned to the district goals and then bring back ideas for more initiatives.
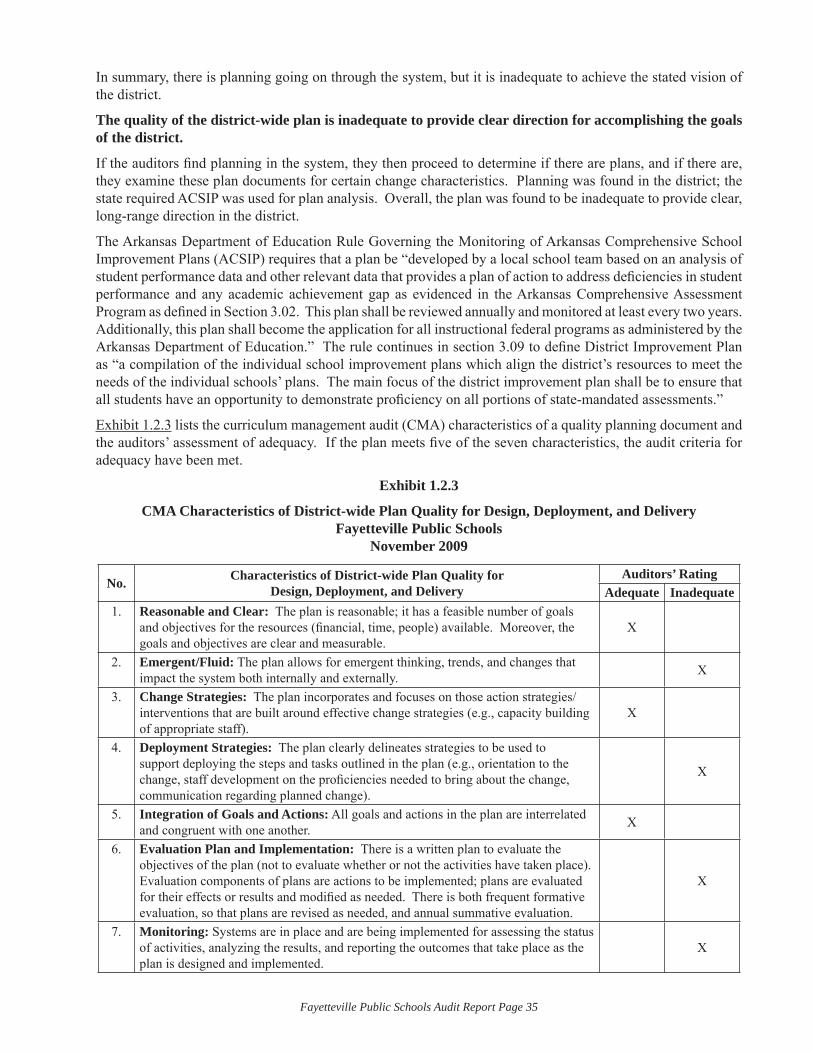
Fayetteville Public Schools Audit Report Page 35
In summary, there is planning going on through the system, but it is inadequate to achieve the stated vision of the district.
The quality of the district-wide plan is inadequate to provide clear direction for accomplishing the goals of the district.
If the auditors fi nd planning in the system, they then proceed to determine if there are plans, and if there are, they examine these plan documents for certain change characteristics. Planning was found in the district; the state required ACSIP was used for plan analysis. Overall, the plan was found to be inadequate to provide clear, long-range direction in the district.
The Arkansas Department of Education Rule Governing the Monitoring of Arkansas Comprehensive School Improvement Plans (ACSIP) requires that a plan be “developed by a local school team based on an analysis of student performance data and other relevant data that provides a plan of action to address defi ciencies in student performance and any academic achievement gap as evidenced in the Arkansas Comprehensive Assessment Program as defi ned in Section 3.02. This plan shall be reviewed annually and monitored at least every two years. Additionally, this plan shall become the application for all instructional federal programs as administered by the Arkansas Department of Education.” The rule continues in section 3.09 to defi ne District Improvement Plan as “a compilation of the individual school improvement plans which align the district’s resources to meet the needs of the individual schools’ plans. The main focus of the district improvement plan shall be to ensure that all students have an opportunity to demonstrate profi ciency on all portions of state-mandated assessments.”
Exhibit 1.2.3 lists the curriculum management audit (CMA) characteristics of a quality planning document and the auditors’ assessment of adequacy. If the plan meets fi ve of the seven characteristics, the audit criteria for adequacy have been met.
Exhibit 1.2.3
CMA Characteristics of District-wide Plan Quality for Design, Deployment, and DeliveryFayetteville Public Schools
November 2009
No. Characteristics of District-wide Plan Quality for Design, Deployment, and Delivery
Auditors’ RatingAdequate Inadequate
1. Reasonable and Clear: The plan is reasonable; it has a feasible number of goals and objectives for the resources (fi nancial, time, people) available. Moreover, the goals and objectives are clear and measurable.
X
2. Emergent/Fluid: The plan allows for emergent thinking, trends, and changes that impact the system both internally and externally. X
3. Change Strategies: The plan incorporates and focuses on those action strategies/interventions that are built around effective change strategies (e.g., capacity building of appropriate staff).
X
4. Deployment Strategies: The plan clearly delineates strategies to be used to support deploying the steps and tasks outlined in the plan (e.g., orientation to the change, staff development on the profi ciencies needed to bring about the change, communication regarding planned change).
X
5. Integration of Goals and Actions: All goals and actions in the plan are interrelated and congruent with one another. X
6. Evaluation Plan and Implementation: There is a written plan to evaluate the objectives of the plan (not to evaluate whether or not the activities have taken place). Evaluation components of plans are actions to be implemented; plans are evaluated for their effects or results and modifi ed as needed. There is both frequent formative evaluation, so that plans are revised as needed, and annual summative evaluation.
X
7. Monitoring: Systems are in place and are being implemented for assessing the status of activities, analyzing the results, and reporting the outcomes that take place as the plan is designed and implemented.
X
Fayetteville Public Schools Audit Report Page 36
As presented in Exhibit 1.2.3, two of the seven characteristics were rated as adequate; fi ve were rated as inadequate. The district ACSIP plan was determined to be inadequate to provide systemic direction for the district’s vision.
The following comments provide more information on what the auditors found with respect to each of the characteristics above.
Characteristic One—Reasonable and Clear
This characteristic was rated as inadequate. The ACSIP plans for 2007-08, 2008-09, and 2009-10 listed the district goals as:
Priority 1
Goal: All students will improve in reading, writing, and math.•
Priority 2
Goal: Decrease use of drugs (including alcohol) and incidents of violence among students in secondary • schools.
Goal: Provide adequate student access to well-trained counselors and teachers to improve their • prevention skills for students.
Goal: The students who have attended approved leadership/skill training will be increased.•
Priority 3
Goal: All ELL students will improve in reading, writing, and math.•
Priority 5
Decrease the gap between the general student population drop out rate and the special education drop • out rate.
Priority 6
The District will provide support for students in making Healthy Lifestyle Choices by implementing • systems to aid in decreasing the average BMI on routine annual student screening and increasing collaboration between all segments of the school community in support of positive lifestyle choices.
The school ACSIP plans varied the priority based on student assessment data and building needs; each followed the same format as the district plan. The auditors deemed that it was reasonable in depth and in its comprehensive nature but not measurable, which makes it inadequate.
Characteristic Two—Emergent/Fluid
This characteristic was rated as inadequate. Developing an annual plan could provide for emergent thinking, trends, and changes; however, the auditors found a repeat of planned actions for the three years. No comparison of assessment scores to demonstrate growth due to implementation of an action was noted. Rather, the action step just stated that achievement had improved. No comparative data were included in the plan regarding changing population within the school or community.
Characteristic Three—Change Strategies
This characteristic was rated as adequate. The ACSIP district plan did list staff development needs (i.e., purpose of data analysis, curriculum alignment, improvement of literacy and math instruction, differentiated instruction). However, many of the strategy changes were based on survey responses in the 2008-09 ACSIP plan.
Characteristic Four—Deployment Strategies
This characteristic was rated as inadequate. The plan delineated action steps and staff development needs. The major deployment strategy identifi ed in interviews with administrators was through the writing of the school improvement plans, the intervention plans, and the parental involvement plans. Monitoring the implementation
Fayetteville Public Schools Audit Report Page 37
of these plans was at the discretion of the building principal, which varied across the district. The auditors did observe grade-level teaching teams addressing the State Frameworks using the RtI process (see Finding 5.2). The degree of implementation and effective functioning of these plans varies widely across the system. Communication is also a problem. The auditors were told that it is not unusual for staff to express their lack of knowledge about a new program or emphasis in the district and not understanding who was involved in making the decision to proceed or the reason for its initiation.
Characteristic Five—Integration of Goals and Actions
This characteristic was rated as adequate. There was an overlapping of goals and actions within the priorities.
Characteristic Six—Evaluation Plan and Implementation
This characteristic was rated as inadequate. The evaluation of the action step was written into the step. The action step stated that through formative pre/post testing, criterion reference and norm reference assessments and local summative assessments, the action was found to be effective. No comparative data were included in the plan that supported progress being made.
Characteristic Seven—Monitoring
This characteristic was rated as inadequate. The person/position responsible for implementing the action step was identifi ed and the evaluation of the action was written into the step. However, the auditors were told that implementation is not specifi cally monitored.
In summary, the district’s plan is inadequate to provide direction for the design, deployment, and delivery of the emphasis of the district.
The quality of department and school improvement efforts from district plan documents to school/department improvement plans are inadequate to systemically implement the district’s goals.
The last type of analysis conducted by the auditors was to review department and school improvement plans. The same types of characteristics used for the district-wide plan are used in addition to the tracing of connectivity to the district-wide plan. In order for maximum impact of the planning process to be achieved, there needs to be a tight line of control that provides the necessary structure throughout the district planning efforts and still allows for creativity and fl exibility at all levels. When properly structured, this planning process reduces slack within the system. Slack occurs when connections among departments and schools are not clearly defi ned.
It is essential that functions related to curriculum management, professional development, program evaluation, and school improvement plans be guided by board policy and that they adhere to the administrative regulations that provide the backbone for these operations. Personnel assuming new responsibilities within the system should be able to consult board policies and administrative regulations for guidance in how the planning functions of the system relate to a specifi c job responsibility and for gaining an understanding of the parameters within which they should operate. In this analysis, planning efforts across all standards were reviewed (see Findings 1.3, 2.1, 2,4, 3.2, 4.1, 4.4, and 5.1).
Auditors determined that there are no board policies to guide school improvement, but state rules governing the standards for accreditation require that “each school district in Arkansas shall be required to develop, with appropriate staff and community participation, a comprehensive plan. …The plan shall be fi led with and reviewed by the Department annually.” The plans analyzed included the school ACSIP plans, Parent Involvement Plans, Intervention Plans, Technology Plan, Communications plan, Facilities and Maintenance Plan, and Staff Development plans. No curriculum management or assessment plans were presented to the auditors.
Eight characteristics of quality department and school improvement plans for design, deployment, and delivery are used to determine the adequacy of these plans. To meet the audit standard, six of the eight criteria must be determined to be adequate. Exhibit 1.2.4 presents the eight criteria and the auditors’ ratings on the various plans as a whole.
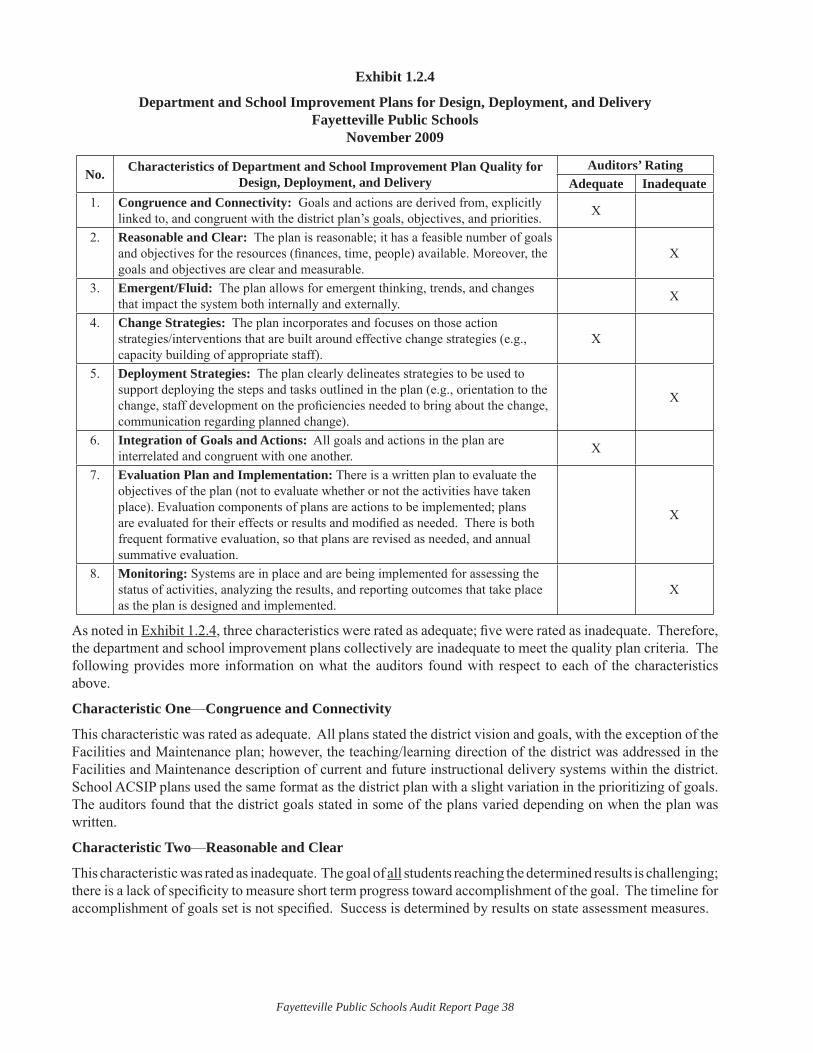
Fayetteville Public Schools Audit Report Page 38
Exhibit 1.2.4
Department and School Improvement Plans for Design, Deployment, and DeliveryFayetteville Public Schools
November 2009
No. Characteristics of Department and School Improvement Plan Quality for Design, Deployment, and Delivery
Auditors’ RatingAdequate Inadequate
1. Congruence and Connectivity: Goals and actions are derived from, explicitly linked to, and congruent with the district plan’s goals, objectives, and priorities. X
2. Reasonable and Clear: The plan is reasonable; it has a feasible number of goals and objectives for the resources (fi nances, time, people) available. Moreover, the goals and objectives are clear and measurable.
X
3. Emergent/Fluid: The plan allows for emergent thinking, trends, and changes that impact the system both internally and externally. X
4. Change Strategies: The plan incorporates and focuses on those action strategies/interventions that are built around effective change strategies (e.g., capacity building of appropriate staff).
X
5. Deployment Strategies: The plan clearly delineates strategies to be used to support deploying the steps and tasks outlined in the plan (e.g., orientation to the change, staff development on the profi ciencies needed to bring about the change, communication regarding planned change).
X
6. Integration of Goals and Actions: All goals and actions in the plan are interrelated and congruent with one another. X
7. Evaluation Plan and Implementation: There is a written plan to evaluate the objectives of the plan (not to evaluate whether or not the activities have taken place). Evaluation components of plans are actions to be implemented; plans are evaluated for their effects or results and modifi ed as needed. There is both frequent formative evaluation, so that plans are revised as needed, and annual summative evaluation.
X
8. Monitoring: Systems are in place and are being implemented for assessing the status of activities, analyzing the results, and reporting outcomes that take place as the plan is designed and implemented.
X
As noted in Exhibit 1.2.4, three characteristics were rated as adequate; fi ve were rated as inadequate. Therefore, the department and school improvement plans collectively are inadequate to meet the quality plan criteria. The following provides more information on what the auditors found with respect to each of the characteristics above.
Characteristic One—Congruence and Connectivity
This characteristic was rated as adequate. All plans stated the district vision and goals, with the exception of the Facilities and Maintenance plan; however, the teaching/learning direction of the district was addressed in the Facilities and Maintenance description of current and future instructional delivery systems within the district. School ACSIP plans used the same format as the district plan with a slight variation in the prioritizing of goals. The auditors found that the district goals stated in some of the plans varied depending on when the plan was written.
Characteristic Two—Reasonable and Clear
This characteristic was rated as inadequate. The goal of all students reaching the determined results is challenging; there is a lack of specifi city to measure short term progress toward accomplishment of the goal. The timeline for accomplishment of goals set is not specifi ed. Success is determined by results on state assessment measures.
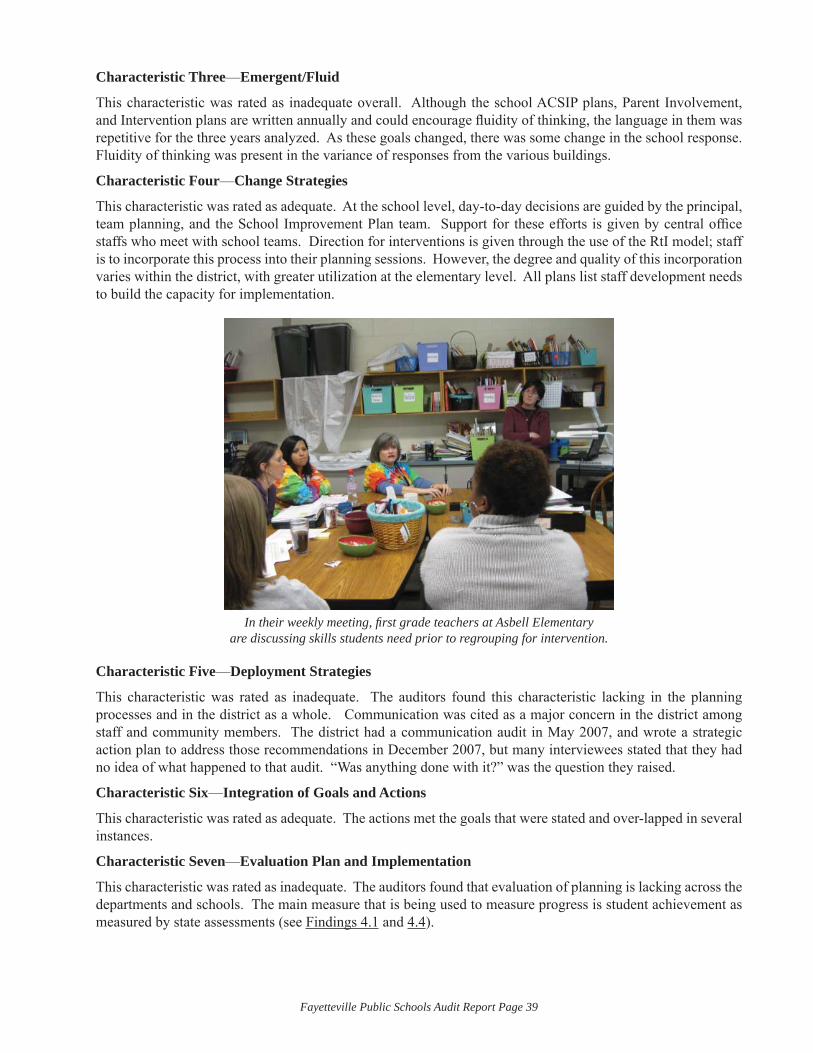
Fayetteville Public Schools Audit Report Page 39
Characteristic Three—Emergent/Fluid
This characteristic was rated as inadequate overall. Although the school ACSIP plans, Parent Involvement, and Intervention plans are written annually and could encourage fl uidity of thinking, the language in them was repetitive for the three years analyzed. As these goals changed, there was some change in the school response. Fluidity of thinking was present in the variance of responses from the various buildings.
Characteristic Four—Change Strategies
This characteristic was rated as adequate. At the school level, day-to-day decisions are guided by the principal, team planning, and the School Improvement Plan team. Support for these efforts is given by central offi ce staffs who meet with school teams. Direction for interventions is given through the use of the RtI model; staff is to incorporate this process into their planning sessions. However, the degree and quality of this incorporation varies within the district, with greater utilization at the elementary level. All plans list staff development needs to build the capacity for implementation.
In their weekly meeting, fi rst grade teachers at Asbell Elementary are discussing skills students need prior to regrouping for intervention.
Characteristic Five—Deployment Strategies
This characteristic was rated as inadequate. The auditors found this characteristic lacking in the planning processes and in the district as a whole. Communication was cited as a major concern in the district among staff and community members. The district had a communication audit in May 2007, and wrote a strategic action plan to address those recommendations in December 2007, but many interviewees stated that they had no idea of what happened to that audit. “Was anything done with it?” was the question they raised.
Characteristic Six—Integration of Goals and Actions
This characteristic was rated as adequate. The actions met the goals that were stated and over-lapped in several instances.
Characteristic Seven—Evaluation Plan and Implementation
This characteristic was rated as inadequate. The auditors found that evaluation of planning is lacking across the departments and schools. The main measure that is being used to measure progress is student achievement as measured by state assessments (see Findings 4.1 and 4.4).
Fayetteville Public Schools Audit Report Page 40
The district has the capability of generating a voluminous amount of data relative to program effectiveness and student achievement. However, there does not presently exist a systematized approach to utilize that data or to determine what data are needed for which evaluation purposes.
Characteristic Eight—Monitoring
This characteristic was rated as inadequate. The auditors found a variance in monitoring the status of activities, analyzing the results, and reporting outcomes that take place as a plan is designed and implemented. The implementation of ACSIP plans varies across the district based on principal discretion. The organization of central offi ce personnel could provide monitoring through the various job assignments, but the auditors found that monitoring is perceived to be lacking. A notation in one of the ACSIP school plans asked if a specifi c action step was actually occurring; nothing was provided to demonstrate that further follow-through occurred.
In summary, the department and school improvement plans are not well integrated beyond connecting to the district goals and the acknowledgement for the need of staff development. Communication regarding the deployment of plans and planning are a major concern for the district staff and the community.
In interviews with district staff and the community pertaining to the district planning efforts, the following comments were made by central administrators:
“We lack focus and detailed direction. Principals are all confused about priorities and how things fi t • into place.”
“Everyone is operating in their own vacuum.”•
“There is a lack of communication; the cards are held close.”•
“Stop the fl avor of the day; stick with the core focus.”•
“There needs to be more collaboration among the buildings because there are good things happening all • over and others don’t know about it.”
The following comments about district planning efforts were made by building administrators:
“We meet and plan, and then it falls off the wagon. There is no follow through. We are very confused • about 21st Century Learning. We have taken off but don’t know what we’re aiming for.”
“Curriculum and Instruction are separate; they are not connected. The district is departmentalized.”•
Parents and community members made the following comments about planning efforts and the lack of communication in the district:
“I am still trying to learn about 21• st Century Learning. Communication is not there.”
“There desperately needs to be more effective leadership, engaging the different parts of the community. • There needs to be more communication with the parents.”
Overall Summary
All three levels of planning and plan analysis were rated as inadequate. While there are a number of plans being written annually, clear and specifi c systemic direction is not provided for personnel to initiate and implement system-wide programs and strategies to achieve the vision and goals of the district. Plans and planning do not include a demonstrable evaluation process to determine progress being made. No local board policies or administrative regulations direct the development of tangible plans to provide that direction. The lack of communication regarding direction and changes that are being implemented is adding to insuffi cient support for these endeavors.
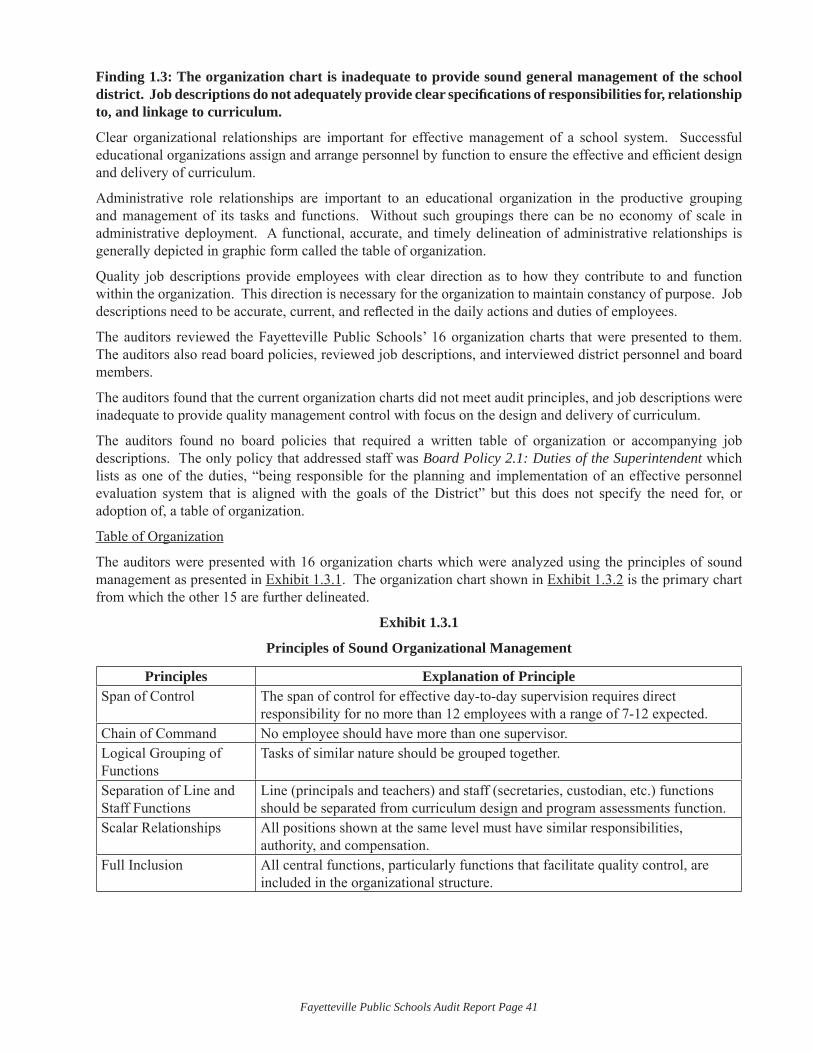
Fayetteville Public Schools Audit Report Page 41
Finding 1.3: The organization chart is inadequate to provide sound general management of the school district. Job descriptions do not adequately provide clear specifi cations of responsibilities for, relationship to, and linkage to curriculum.
Clear organizational relationships are important for effective management of a school system. Successful educational organizations assign and arrange personnel by function to ensure the effective and effi cient design and delivery of curriculum.
Administrative role relationships are important to an educational organization in the productive grouping and management of its tasks and functions. Without such groupings there can be no economy of scale in administrative deployment. A functional, accurate, and timely delineation of administrative relationships is generally depicted in graphic form called the table of organization.
Quality job descriptions provide employees with clear direction as to how they contribute to and function within the organization. This direction is necessary for the organization to maintain constancy of purpose. Job descriptions need to be accurate, current, and refl ected in the daily actions and duties of employees.
The auditors reviewed the Fayetteville Public Schools’ 16 organization charts that were presented to them. The auditors also read board policies, reviewed job descriptions, and interviewed district personnel and board members.
The auditors found that the current organization charts did not meet audit principles, and job descriptions were inadequate to provide quality management control with focus on the design and delivery of curriculum.
The auditors found no board policies that required a written table of organization or accompanying job descriptions. The only policy that addressed staff was Board Policy 2.1: Duties of the Superintendent which lists as one of the duties, “being responsible for the planning and implementation of an effective personnel evaluation system that is aligned with the goals of the District” but this does not specify the need for, or adoption of, a table of organization.
Table of Organization
The auditors were presented with 16 organization charts which were analyzed using the principles of sound management as presented in Exhibit 1.3.1. The organization chart shown in Exhibit 1.3.2 is the primary chart from which the other 15 are further delineated.
Exhibit 1.3.1
Principles of Sound Organizational Management
Principles Explanation of PrincipleSpan of Control The span of control for effective day-to-day supervision requires direct
responsibility for no more than 12 employees with a range of 7-12 expected.Chain of Command No employee should have more than one supervisor.Logical Grouping of Functions
Tasks of similar nature should be grouped together.
Separation of Line and Staff Functions
Line (principals and teachers) and staff (secretaries, custodian, etc.) functions should be separated from curriculum design and program assessments function.
Scalar Relationships All positions shown at the same level must have similar responsibilities, authority, and compensation.
Full Inclusion All central functions, particularly functions that facilitate quality control, are included in the organizational structure.
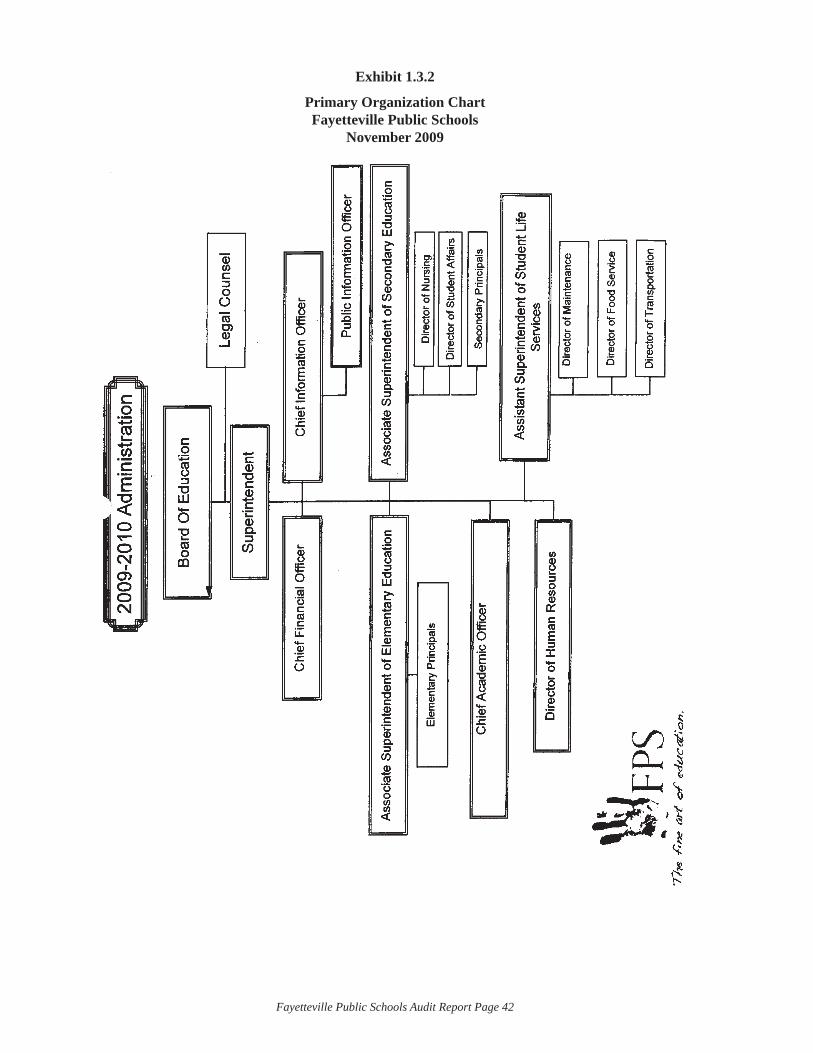
Fayetteville Public Schools Audit Report Page 42
Exhibit 1.3.2
Primary Organization ChartFayetteville Public Schools
November 2009
Fayetteville Public Schools Audit Report Page 43
The auditors’ assessment of the Fayetteville Public Schools’ primary table of organization with reference to the differentiated other 15 tables, based on the principals presented in Exhibit 1.3.1 follows:
Span of Control: 1. The superintendent has eight administrators reporting to her but with the elimination of the position Assistant Superintendent of Student Life Services, the Director of Maintenance, Food Service, and Transportation report directly to her, which increases her span of control to 11 administrators. When including the seven board members she reports to that require daily interaction, her span of control broadens to 18, which is beyond the recommended span of control. This principle was not met.
Chain of Command: 2. Due to the nature of 15 organizational charts that differentiate the primary chart, the chain of command had to be determined by searching through the various charts. The position of Environmental Study Center was included on the Associate Superintendent of Secondary Education chart but not connected to any other position. The question rose as to whom this person reports. This principle was met, but due to the lack of easy reference was diffi cult to determine.
Logical Grouping of Functions: 3. The grouping of the Director of Nursing and Director of Student Affairs with the Secondary Principals reporting to the Associate Superintendent of Secondary Education does not meet the principle of logical grouping. Under the position of Chief Information Offi cer, the grouping of K-12 Instructional Technologies with public information personnel furthers the separation of technology and instruction which is part of goal number two of the district’s strategic goals: “Develop, implement, and support an articulated curriculum effective instructional strategies, and a comprehensive assessment program that integrates progressive technology.” This principle has not been met.
Separation of Line and Staff Functions: 4. Central to an organization chart should be a clear and direct line from the superintendent through other staff to the schools themselves. This chart does not present this clear direct line so the principle has not been met.
Scalar Relationships: 5. The primary organization chart does not project scalar relationships as Chief Financial Offi cer, Chief Information Offi cer, and Chief Academic Offi cer appear at different levels on the chart. Directors are listed in various places on the chart. The Associate Superintendents are listed between the Chief positions. The scalar relationship is not presented to demonstrate similar responsibilities, authority, and compensation. This principle has not been met.
Full Inclusion: 6. The primary chart presents the positions to which other personnel report; however, the positions of school personnel (i.e., teachers, support staff) are not included in the primary chart or the differentiated chart of presenting principals. This principle has not been met.
Of the six principles of sound organizational management, fi ve principles were not met; the primary table with corresponding charts did not meet audit criteria.
With the intent of broadening communication and coordinating efforts, the Superintendent has implemented an Administrative Cabinet consisting of the Superintendent, Chief Financial Offi cer, Chief Information Offi cer, Public Information Offi cer, Associate Superintendents of Elementary and Secondary Education, Chief Academic Offi cer, and Director of Human Resources. This cabinet meets weekly and are, presently, the main determinators of the annual budget (see Finding 5.1).
Job Descriptions
Strong job descriptions are clear statements that delineate job titles; qualifi cations of persons appointed to the position; immediate links in the chain of command; and a description of functions, duties, and responsibilities of the job. Because auditors were examining an educational organization whose purpose is instructional, many functions should have connection to the design and or delivery of the curriculum. Job descriptions must also be accurate and current and those positions noted in the organizational chart of the district.
To determine the availability and quality of job descriptions, auditors reviewed all current job descriptions that included some job postings, (i.e., Federal Program Coordinator, District Literacy Coordinator) and two board
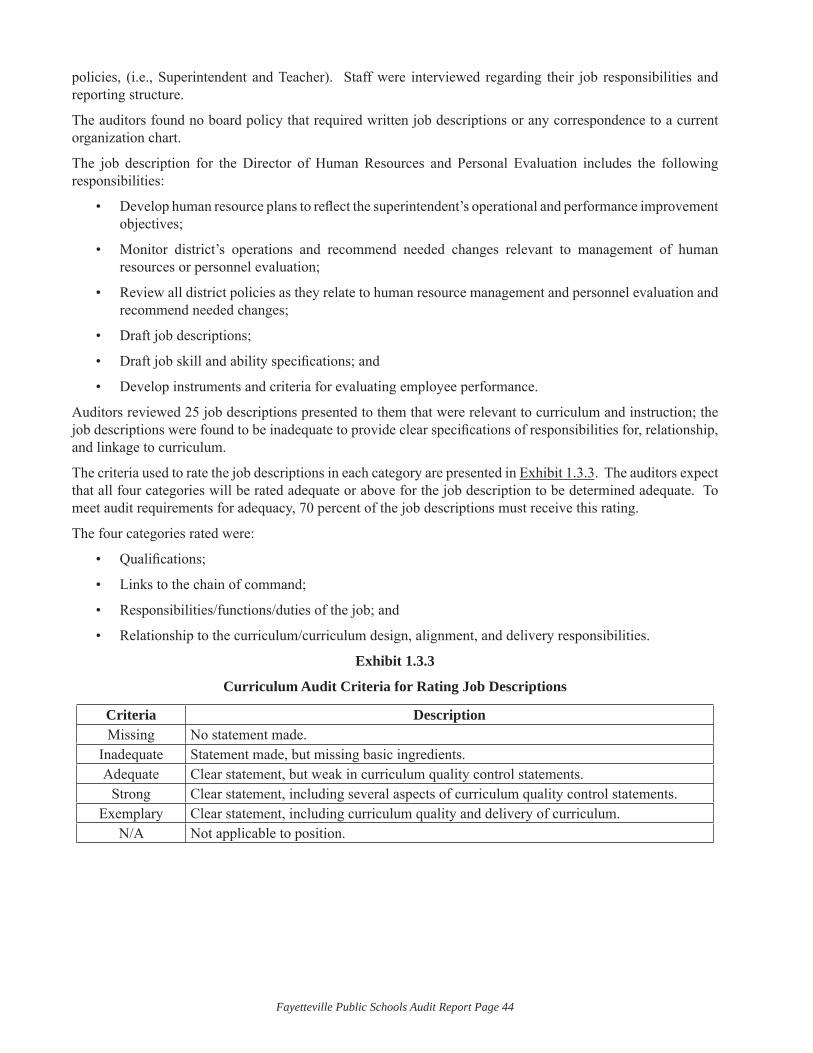
Fayetteville Public Schools Audit Report Page 44
policies, (i.e., Superintendent and Teacher). Staff were interviewed regarding their job responsibilities and reporting structure.
The auditors found no board policy that required written job descriptions or any correspondence to a current organization chart.
The job description for the Director of Human Resources and Personal Evaluation includes the following responsibilities:
Develop human resource plans to refl ect the superintendent’s operational and performance improvement • objectives;
Monitor district’s operations and recommend needed changes relevant to management of human • resources or personnel evaluation;
Review all district policies as they relate to human resource management and personnel evaluation and • recommend needed changes;
Draft job descriptions;•
Draft job skill and ability specifi cations; and•
Develop instruments and criteria for evaluating employee performance.•
Auditors reviewed 25 job descriptions presented to them that were relevant to curriculum and instruction; the job descriptions were found to be inadequate to provide clear specifi cations of responsibilities for, relationship, and linkage to curriculum.
The criteria used to rate the job descriptions in each category are presented in Exhibit 1.3.3. The auditors expect that all four categories will be rated adequate or above for the job description to be determined adequate. To meet audit requirements for adequacy, 70 percent of the job descriptions must receive this rating.
The four categories rated were:
Qualifi cations;•
Links to the chain of command;•
Responsibilities/functions/duties of the job; and•
Relationship to the curriculum/curriculum design, alignment, and delivery responsibilities.•
Exhibit 1.3.3
Curriculum Audit Criteria for Rating Job Descriptions
Criteria DescriptionMissing No statement made.
Inadequate Statement made, but missing basic ingredients.Adequate Clear statement, but weak in curriculum quality control statements.
Strong Clear statement, including several aspects of curriculum quality control statements.Exemplary Clear statement, including curriculum quality and delivery of curriculum.
N/A Not applicable to position.
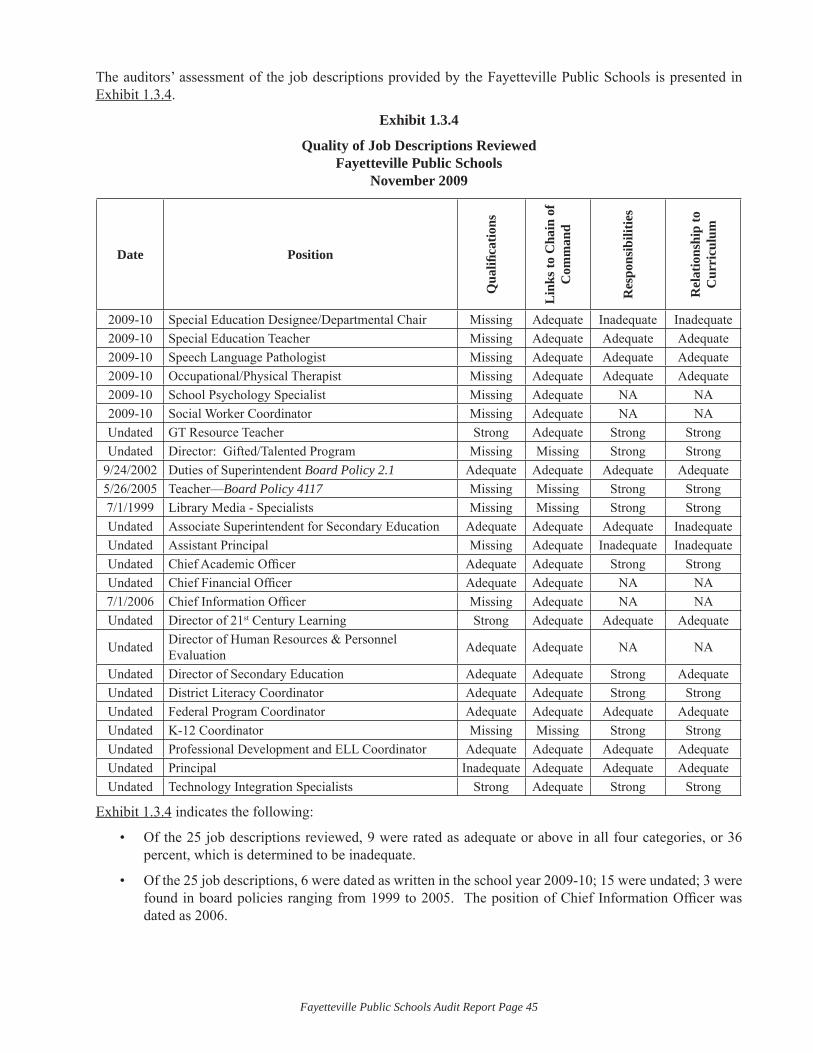
Fayetteville Public Schools Audit Report Page 45
The auditors’ assessment of the job descriptions provided by the Fayetteville Public Schools is presented in Exhibit 1.3.4.
Exhibit 1.3.4
Quality of Job Descriptions ReviewedFayetteville Public Schools
November 2009
Date Position
Qua
lifi c
atio
ns
Lin
ks to
Cha
in o
f C
omm
and
Res
pons
ibili
ties
Rel
atio
nshi
p to
C
urri
culu
m
2009-10 Special Education Designee/Departmental Chair Missing Adequate Inadequate Inadequate2009-10 Special Education Teacher Missing Adequate Adequate Adequate2009-10 Speech Language Pathologist Missing Adequate Adequate Adequate2009-10 Occupational/Physical Therapist Missing Adequate Adequate Adequate2009-10 School Psychology Specialist Missing Adequate NA NA2009-10 Social Worker Coordinator Missing Adequate NA NAUndated GT Resource Teacher Strong Adequate Strong StrongUndated Director: Gifted/Talented Program Missing Missing Strong Strong
9/24/2002 Duties of Superintendent Board Policy 2.1 Adequate Adequate Adequate Adequate5/26/2005 Teacher—Board Policy 4117 Missing Missing Strong Strong7/1/1999 Library Media - Specialists Missing Missing Strong StrongUndated Associate Superintendent for Secondary Education Adequate Adequate Adequate InadequateUndated Assistant Principal Missing Adequate Inadequate InadequateUndated Chief Academic Offi cer Adequate Adequate Strong StrongUndated Chief Financial Offi cer Adequate Adequate NA NA7/1/2006 Chief Information Offi cer Missing Adequate NA NAUndated Director of 21st Century Learning Strong Adequate Adequate Adequate
Undated Director of Human Resources & Personnel Evaluation Adequate Adequate NA NA
Undated Director of Secondary Education Adequate Adequate Strong AdequateUndated District Literacy Coordinator Adequate Adequate Strong StrongUndated Federal Program Coordinator Adequate Adequate Adequate AdequateUndated K-12 Coordinator Missing Missing Strong StrongUndated Professional Development and ELL Coordinator Adequate Adequate Adequate AdequateUndated Principal Inadequate Adequate Adequate AdequateUndated Technology Integration Specialists Strong Adequate Strong Strong
Exhibit 1.3.4 indicates the following:
Of the 25 job descriptions reviewed, 9 were rated as adequate or above in all four categories, or 36 • percent, which is determined to be inadequate.
Of the 25 job descriptions, 6 were dated as written in the school year 2009-10; 15 were undated; 3 were • found in board policies ranging from 1999 to 2005. The position of Chief Information Offi cer was dated as 2006.

Fayetteville Public Schools Audit Report Page 46
Further analyses of the categories follow:
Qualifi cations• : Twelve job descriptions had no qualifi cations listed; one was rated as inadequate because of a lack of connection to the design and delivery of curriculum (Principal). The job descriptions for Gifted/Talented Resource Teacher, Director of 21st Century Learning, and Technology Integration Specialists were rated strong due to statements referring to curriculum quality control statements. Exemplary qualifi cations should include knowledge of curriculum quality and delivery of curriculum plus experience and knowledge preferred for this position.
Links to the Chain of Command• : This criterion requires that a person/position be responsible to only one position/person so that clear direction is given and there is no confl ict of roles. Four job descriptions did not refer to any person/position while the remaining 21 job descriptions were rated as adequate.
Responsibilities/Functions/Duties of the Job• : The responsibilities pertaining to curriculum quality control were clearly stated in nine of the job descriptions, namely Gifted/Talented Resource Teacher, Director Gifted/Talented Program, Teacher, Library Media Specialists, Chief Academic Offi cer, Director of Secondary Education, District Literacy Coordinator, K-12 Coordinator, and Technology Integration Specialists. Personnel in these positions would know their responsibilities toward curriculum. The job descriptions for Special Education Designee/Departmental Chair and Assistant Principal did not provide direction for this responsibility. Five positions were determined to be not applicable for the responsibility of curriculum quality control, namely, School Psychology Specialist, Social Worker Coordinator, Chief Financial Offi cer, Chief Information Offi cer, and Director of Human Resources and Personnel Evaluation.
Relationship to the curriculum/curriculum design, alignment, and delivery responsibilities• : Eight of the job descriptions were rated strong in their relationship to curriculum design, alignment, and delivery, namely Gifted/Talented Resource Teacher, Director Gifted/Talented Program, Teacher, Library Media Specialists, Chief Academic Offi cer, District Literacy Coordinator, K-12 Coordinator, and Technology Integration Specialists. The job description for Director of Secondary Education was rated as adequate in this criterion, but is weak in relationship to curriculum. Three positions were rated as inadequate in the stated relationship to curriculum design, alignment, and delivery responsibilities: Special Education Designee/Departmental Chair, Associate Superintendent, and Assistant Principal.
Additionally, the auditors noted several aspects of the job descriptions reviewed. These included the following:
The duties and responsibilities of the Gifted/Talented Resources Teacher were distributed over numerous • sheets making the functions required of this position more diffi cult to determine.
The Library Media Specialists’ job description stated a strong relationship to technology.•
A number of job descriptions referred to a central evaluation form for evaluation.•
The job description for the K-12 Coordinator only stated responsibilities for technology, which makes • the position title a misnomer.
The job description for Professional Development and ELL Coordinator had no stated responsibilities • for ELL; it only stated responsibilities for Professional Development. This title is also a misnomer.
Monitoring the delivery of the curriculum was listed in the job description for Principal.•
When comparing the job descriptions that were presented against the organization charts for the district, the auditors found disparity between the two. The current positions that had no job descriptions included the Public Information Offi cer, Director of Special Services, Director of Secondary Instructional Career and Technical Education, and Director of Curriculum, Instruction, Assessment, and Accountability which has recently had a revised title. The Teacher job description is not a formal job description, but merely an evaluation form.
Fayetteville Public Schools Audit Report Page 47
The auditors found that there has been turnover in the administrative staff with some personnel being in the position only two years or less with a change in some titles as noted above. Current job descriptions do not refl ect these changes or provide direction for new hires.
District staff is aware of the unclear direction provided by the table of organization and written job descriptions, as the following comment from central administrators indicates:
“Currently job descriptions are very lacking; they have not been updated in a long time. There is no • board policy that requires job descriptions.”
In summary, the district’s 16 organization charts met one of the audit’s six principles for sound general management, which is inadequate. The majority of job descriptions did not provide clear specifi cations of responsibilities, relationship, and linkage to curriculum and did not align with the current primary organization chart and differentiated charts. There is no board direction for the development and adoption of an organizational chart with corresponding written job descriptions. The job description for Director of Human Resources and Personnel Evaluation was not being executed as required.

Fayetteville Public Schools Audit Report Page 48
Fayetteville Public Schools Audit Report Page 49
STANDARD 2: The School District Has Established Clear and Valid Objectives for Students.A school system meeting this audit standard has established a clear, valid, and measurable set of pupil standards for learning and has set the objectives into a workable framework for their attainment.
Unless objectives are clear and measurable, there cannot be a cohesive effort to improve pupil achievement in the dimensions in which measurement occurs. The lack of clarity and focus denies to a school system’s educators the ability to concentrate scarce resources on priority targets. Instead, resources may be spread too thin and be ineffective in any direction. Objectives are, therefore, essential to attaining local quality control via the school board.
What the Auditors Expected to Find in the Fayetteville Public Schools:
Common indicators the PDK-CMSi auditors expected to fi nd are:
A clearly established, board-adopted system-wide set of goals and objectives for all programs and • courses;
Demonstration that the system is contextual and responsive to national, state, and other expectations as • evidenced in local initiatives;
Operations set within a framework that carries out the system’s goals and objectives;•
Evidence of comprehensive, detailed, short- and long-range curriculum management planning;•
Knowledge, local validation, and use of current best practices and emerging curriculum trends;•
Written curriculum that addresses both current and future needs of students;•
Major programmatic initiatives designed to be cohesive;•
Provision of explicit direction for the superintendent and professional staff; and •
A framework that exists for systemic curricular change.•
Overview of What the Auditors Found in the Fayetteville Public Schools:
This section is an overview of the fi ndings that follow in the area of Standard Two. Details follow within separate fi ndings.
The auditors found some evidence of curriculum development planning, but a formalized curriculum management process in a single, comprehensive document or formalized processes were not available for the district staff to follow. While site-based efforts have been made at various campuses to develop aligned curriculum documents, there was no district planning document or formalized processes that provide the integrated, comprehensive guidance essential for sound curriculum management. Collectively, the data sources for this direction did not contain elements necessary to meet audit criteria for planned curriculum management or to provide equity to all students within the district. Curriculum management planning was determined to be inadequate.
State Curriculum Frameworks provide the written curriculum for district staff. The auditors found that the online and written curriculum documents did not meet audit criteria for the scope of the written curriculum for the district. At the elementary level, the scope of the curriculum was 83 percent, meeting the audit standard for scope of the written curriculum. At the junior high and high school levels, the scope of the written curriculum was less than the minimum curriculum audit standard of 70 percent. Overall, the scope of the written curriculum is 38.19 percent, which is considered inadequate to direct instruction across all subject areas and courses in the Fayetteville Public Schools.
The auditors found that the quality of the district’s written curriculum guides was not adequate to provide minimum direction to teachers in how to teach important curricular objectives aligned with assessment. The auditors found that the Fayetteville Public Schools’ curriculum guidance documents contained a variety
Fayetteville Public Schools Audit Report Page 50
of problems in internal consistency across all curricular areas: lack of common format, content, congruent approach to assessment, inclusion of instructional strategies, and the delineation of the type of resources used. The analysis revealed the most internal consistency or congruence in the Mathematics curriculum and the least congruence within the Social Studies and Language Arts guidance documents. A lack of internal consistency impedes the delivery of curriculum as intended.
Professional development is valued and supported by policy in the Fayetteville Public Schools, but clear direction is not given for these efforts. Procedures designed to provide a system’s view of quality control of design and delivery and evaluation based on student achievement as a result of changed practices were not evident. Most staff development remains at the awareness level with insuffi cient follow-up training; implementation is dependent on modeling and coaching in individual classrooms. Professional development activities are not clearly focused and are insuffi ciently coordinated, monitored, and evaluated system-wide.
Finding 2.1: Recent professional development initiatives are attempting to provide training that will lead to increased student achievement; however, suffi cient in-depth in-service and support for implementation in the classroom that is focused and coordinated district-wide has not been implemented.
A curriculum development process plan establishes direction for the design, delivery, communication, evaluation, and revision of a district’s curriculum. Clearly written and decisive board policies are the foundation of an effective process that sets expectations for staff members to execute and maintain the articulation and coordination of the written curriculum across all grade levels and subject matter.
Such a plan is designed to function in coordination with other major curriculum management mechanisms such as the district Annual Comprehensive School Improvement Plan, the budgeting process, staff development, assessment, and textbook adoption procedures. When all planning is integrated and committed to policy, consistency over time, at all grade levels and subject areas is more likely. This ensures that changes in personnel will not signifi cantly affect a district’s curriculum development system.
To access the status of curriculum development planning in the Fayetteville Public Schools, auditors examined documents provided by the staff, including board policies, job descriptions, and memoranda from district administrators. Auditors interviewed board members, administrative staff, and teachers about curriculum planning.
The audit team found some evidence of curriculum development planning, but a formalized curriculum management process in a single, comprehensive document in a board approved written plan was not available for the district staff to follow. While site-based efforts have been made at various campuses to develop aligned curriculum documents, there was no district planning document or set of formalized processes that provide the integrated, comprehensive guidance essential for sound curriculum management. Collectively, the data sources did not contain elements necessary to meet audit criteria for planned curriculum management or to provide equity to all students within the district.
When determining the quality of a comprehensive curriculum management process, auditors use a set of criteria that describes the characteristics of a comprehensive curriculum management planning framework. District administrators acknowledged that a comprehensive curriculum management process, or the majority of its components, did not exist. Auditors, therefore, did not attempt to make a formal evaluation of these components, but chose to instead outline the characteristics of such a plan and provide a brief analysis of available district documents. These characteristics are provided in Exhibit 2.1.1.
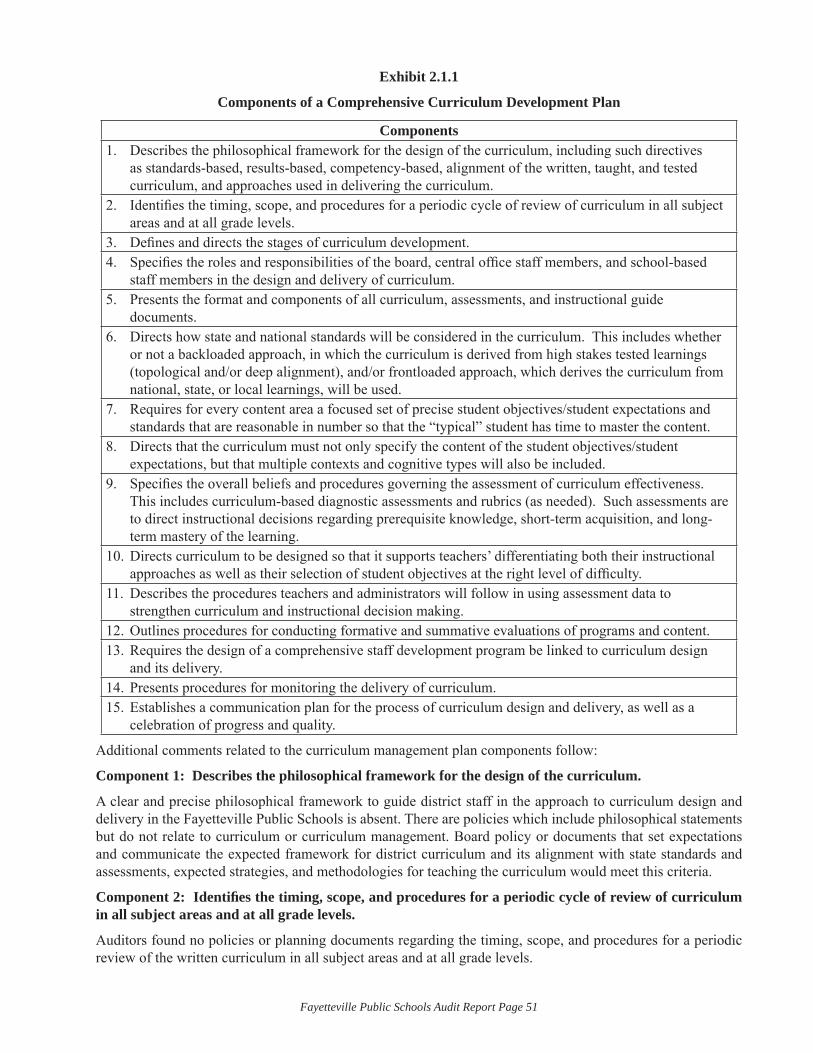
Fayetteville Public Schools Audit Report Page 51
Exhibit 2.1.1
Components of a Comprehensive Curriculum Development Plan
ComponentsDescribes the philosophical framework for the design of the curriculum, including such directives 1. as standards-based, results-based, competency-based, alignment of the written, taught, and tested curriculum, and approaches used in delivering the curriculum.Identifi es the timing, scope, and procedures for a periodic cycle of review of curriculum in all subject 2. areas and at all grade levels.Defi nes and directs the stages of curriculum development.3. Specifi es the roles and responsibilities of the board, central offi ce staff members, and school-based 4. staff members in the design and delivery of curriculum.Presents the format and components of all curriculum, assessments, and instructional guide 5. documents.Directs how state and national standards will be considered in the curriculum. This includes whether 6. or not a backloaded approach, in which the curriculum is derived from high stakes tested learnings (topological and/or deep alignment), and/or frontloaded approach, which derives the curriculum from national, state, or local learnings, will be used.Requires for every content area a focused set of precise student objectives/student expectations and 7. standards that are reasonable in number so that the “typical” student has time to master the content.Directs that the curriculum must not only specify the content of the student objectives/student 8. expectations, but that multiple contexts and cognitive types will also be included.Specifi es the overall beliefs and procedures governing the assessment of curriculum effectiveness. 9. This includes curriculum-based diagnostic assessments and rubrics (as needed). Such assessments are to direct instructional decisions regarding prerequisite knowledge, short-term acquisition, and long-term mastery of the learning.Directs curriculum to be designed so that it supports teachers’ differentiating both their instructional 10. approaches as well as their selection of student objectives at the right level of diffi culty.Describes the procedures teachers and administrators will follow in using assessment data to 11. strengthen curriculum and instructional decision making.Outlines procedures for conducting formative and summative evaluations of programs and content.12. Requires the design of a comprehensive staff development program be linked to curriculum design 13. and its delivery.Presents procedures for monitoring the delivery of curriculum.14. Establishes a communication plan for the process of curriculum design and delivery, as well as a 15. celebration of progress and quality.
Additional comments related to the curriculum management plan components follow:
Component 1: Describes the philosophical framework for the design of the curriculum.
A clear and precise philosophical framework to guide district staff in the approach to curriculum design and delivery in the Fayetteville Public Schools is absent. There are policies which include philosophical statements but do not relate to curriculum or curriculum management. Board policy or documents that set expectations and communicate the expected framework for district curriculum and its alignment with state standards and assessments, expected strategies, and methodologies for teaching the curriculum would meet this criteria.
Component 2: Identifi es the timing, scope, and procedures for a periodic cycle of review of curriculum in all subject areas and at all grade levels.
Auditors found no policies or planning documents regarding the timing, scope, and procedures for a periodic review of the written curriculum in all subject areas and at all grade levels.
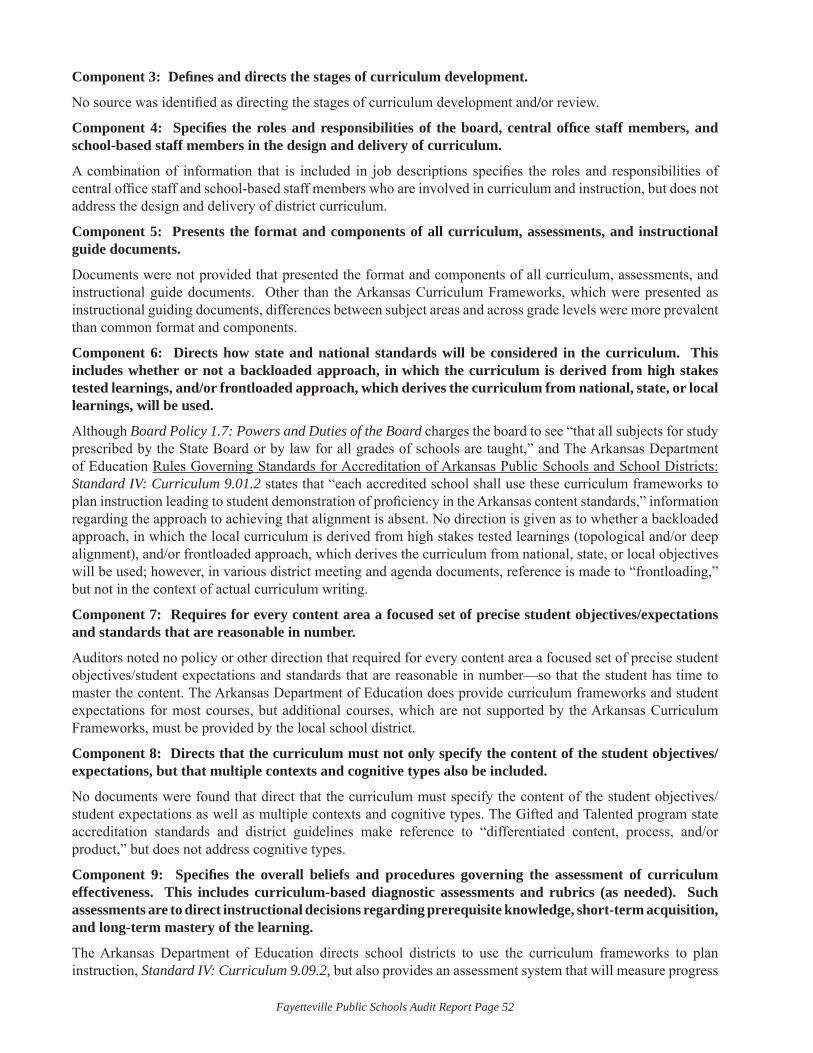
Fayetteville Public Schools Audit Report Page 52
Component 3: Defi nes and directs the stages of curriculum development.
No source was identifi ed as directing the stages of curriculum development and/or review.
Component 4: Specifi es the roles and responsibilities of the board, central offi ce staff members, and school-based staff members in the design and delivery of curriculum.
A combination of information that is included in job descriptions specifi es the roles and responsibilities of central offi ce staff and school-based staff members who are involved in curriculum and instruction, but does not address the design and delivery of district curriculum.
Component 5: Presents the format and components of all curriculum, assessments, and instructional guide documents.
Documents were not provided that presented the format and components of all curriculum, assessments, and instructional guide documents. Other than the Arkansas Curriculum Frameworks, which were presented as instructional guiding documents, differences between subject areas and across grade levels were more prevalent than common format and components.
Component 6: Directs how state and national standards will be considered in the curriculum. This includes whether or not a backloaded approach, in which the curriculum is derived from high stakes tested learnings, and/or frontloaded approach, which derives the curriculum from national, state, or local learnings, will be used.
Although Board Policy 1.7: Powers and Duties of the Board charges the board to see “that all subjects for study prescribed by the State Board or by law for all grades of schools are taught,” and The Arkansas Department of Education Rules Governing Standards for Accreditation of Arkansas Public Schools and School Districts: Standard IV: Curriculum 9.01.2 states that “each accredited school shall use these curriculum frameworks to plan instruction leading to student demonstration of profi ciency in the Arkansas content standards,” information regarding the approach to achieving that alignment is absent. No direction is given as to whether a backloaded approach, in which the local curriculum is derived from high stakes tested learnings (topological and/or deep alignment), and/or frontloaded approach, which derives the curriculum from national, state, or local objectives will be used; however, in various district meeting and agenda documents, reference is made to “frontloading,” but not in the context of actual curriculum writing.
Component 7: Requires for every content area a focused set of precise student objectives/expectations and standards that are reasonable in number.
Auditors noted no policy or other direction that required for every content area a focused set of precise student objectives/student expectations and standards that are reasonable in number—so that the student has time to master the content. The Arkansas Department of Education does provide curriculum frameworks and student expectations for most courses, but additional courses, which are not supported by the Arkansas Curriculum Frameworks, must be provided by the local school district.
Component 8: Directs that the curriculum must not only specify the content of the student objectives/expectations, but that multiple contexts and cognitive types also be included.
No documents were found that direct that the curriculum must specify the content of the student objectives/student expectations as well as multiple contexts and cognitive types. The Gifted and Talented program state accreditation standards and district guidelines make reference to “differentiated content, process, and/or product,” but does not address cognitive types.
Component 9: Specifi es the overall beliefs and procedures governing the assessment of curriculum effectiveness. This includes curriculum-based diagnostic assessments and rubrics (as needed). Such assessments are to direct instructional decisions regarding prerequisite knowledge, short-term acquisition, and long-term mastery of the learning.
The Arkansas Department of Education directs school districts to use the curriculum frameworks to plan instruction, Standard IV: Curriculum 9.09.2, but also provides an assessment system that will measure progress
Fayetteville Public Schools Audit Report Page 53
toward meeting the content of those standards in the curriculum frameworks, Standard IV: Curriculum 9.09.3. Board policies with adequate expectations for improving the design and delivery of programs in the district for all courses via assessment is lacking.
Component 10: Directs curriculum to be designed so that it supports teachers’ differentiating both their instructional approaches as well as their selection of student objectives at the right level of diffi culty.
Auditors noted no policy or other direction that required the design of a curriculum. However, auditors noted that several documents including Response to Intervention, the Arkansas Comprehensive School Improvement Plan, and professional development offerings support teachers’ differentiating their instructional approaches and the teaching of students at the right level of diffi culty. Further, instructional coaches are provided at various campuses to assist and support teachers in differentiation to meet the needs of students.
Component 11: Describes the procedures teachers and administrators will follow in using assessment data to strengthen curriculum and instructional decision making.
Although some district documents include elements of expectations for using assessment data to strengthen instructional decision making, no specifi c procedures were observed. Professional Learning Communities at the schools, staff development offerings in data analysis, and assistance by district staff were clearly identifi ed by auditors as the avenues for this work; however, auditors observed no specifi c procedures for those activities. School Improvement Plans contained information referring to the use of assessment data, and auditors’ interviews revealed this as a common practice at certain campuses but with no specifi c procedures mentioned to be implemented district-wide.
Component 12: Outlines procedures for conducting formative and summative evaluations of programs and content.
The auditors did not fi nd a written outline of district-wide assessment procedures for conducting periodic formative and summative evaluations. However, formative and summative evaluations were part of several campus School Improvement Plans
Component 13: Requires the design of a comprehensive staff development program to be linked to curriculum design and its delivery.
No policy or other documented direction requires the design of a comprehensive staff development program to be linked to curriculum design and its delivery. However, Board Policy No. 4131: Professional Development—Requirements and Responsibilities allows “professional development credit for the time required at the beginning of each school year to plan and prepare a curriculum and other instructional materials for their assigned classes.” No linkage is evident for the designing or delivery of the curriculum.
Component 14: Presents procedures for monitoring the delivery of curriculum.
Learning Walks are mentioned in numerous district documents, but no documented information or board policy presented to auditors included specifi c directives for monitoring the delivery of curriculum. Various classroom visitation techniques used by district and school administrators were reported to include some monitoring of curriculum delivery, but no formalized and commonly used procedures were evident. Implementation of monitoring was found to be inconsistent throughout the district. Principals are required to visit classrooms for the formal teacher evaluation, but many principals and teachers reported classroom visits were not regular and varied in frequency.
Component 15: Establishes a communication plan for the process of curriculum design and delivery, as well as a celebration of progress and quality.
No formal documented plan for communicating the process of curriculum design and delivery was provided, although celebration of progress and accomplishments is evident in school board and principal meeting minutes.
Fayetteville Public Schools Audit Report Page 54
During interviews with administrators and teachers, auditors heard several relevant comments relating to the lack of system-wide curriculum development planning. Comments from administrators and board members included the following:
“… no systemic plan on how instruction is being delivered.”•
“Planning is very scattered, [it] lacks focus and direction. We have principals confused about priorities • and direction.”
“Nothing addresses curriculum.”•
“Strategic Goal 2 calls for a curriculum that is district aligned with technology integration.”•
“…have to have baseline objectives on which we can build a consistent plan across the district. Need • to have a solid base to build from…because we are slipping…around 500 kids, K-2, are reading below grade level.”
“There’s no system in place for professional development to support curriculum, instruction, and • assessments.”
“There has been no leadership to move curriculum and instruction to the forefront. We have great • systems, except in curriculum and instruction.”
“At the district level there is disconnect. Primary goal is for everyone to have the same curriculum, • literacy fi rst, then math, science, and social studies…we want to develop model for doing and putting curriculum in place.”
“We really need a curriculum in place for all the content areas.”•
“We do have pockets of alignment, but not district-wide or systematic.”•
Interviews with teachers and staff revealed the following information about curriculum planning and development in the school district:
“We need some type of vertical alignment…I wish there was an effective way to teach the same concepts • at different levels of diffi culty and actually coordinate it so concepts are built upon.”
“State frameworks are minimal.”•
“If we had a plan, teachers would be willing to follow it. We do not have vertical and horizontal • alignment in place. When I came, I had no idea of what was going on.”
“Students can be taking the same course but with different teachers and are taught entirely different • concepts.”
“We need time to collaborate with each other on a regular basis. We need strategy instructions…• instructional leadership and follow-ups.”
“There is talk of walk-throughs, but it isn’t happening.”•
“We do not have a well articulated curriculum, but we need one.”•
In summary, the audit team found that Fayetteville Public Schools lack a comprehensive curriculum management process to provide for the design, delivery, and evaluation of the curriculum. Board policies, district plans, and curriculum documents do not provide a mandate or direction for providing quality written curriculum documents in an organized, consistent manner to all district teachers. While board policies and documents presented to the audit team contained various components of curriculum management planning, there was no single planning document or formalized processes that provided the integrated, comprehensive guidance necessary for sound management. Current documents do not meet audit criteria for planned curriculum management.
Fayetteville Public Schools Audit Report Page 55
Finding 2.2: The scope of the written curriculum is adequate in grades K-7, but inadequate in junior high and high school grades to provide direction for teachers in planning classroom instruction.
Curriculum documents are the written guidelines that provide direction for teachers in planning classroom instruction. These documents should include information about standards and objectives for students, prerequisite skills, instructional resources, classroom strategies, and methods of assessment. When curriculum documents are absent for a subject or content area, teachers may have to rely on other resources for planning and delivering instruction. These resources may or may not be aligned with the district’s intended curriculum. In addition, they may not provide for consistency, focus, and equity across schools, grades, and courses.
Written curriculum is needed for every course and subject taught in the school district. The existence of these documents is considered the scope of the written curriculum and is a key component of a district’s quality control of the educational program. To determine the scope of curriculum coverage, auditors reviewed state curriculum frameworks, policies, and written and online curriculum documents being used by the district. Auditors also interviewed teachers, administrators, and staff responsible for curriculum development and supervision.
The auditors expect to fi nd written curriculum for all subjects and courses offered at every grade level. If 70 percent or more of courses offered in a system have written curriculum documents, auditors determine that the scope, or coverage, of the written curriculum is adequate to provide quality control of the system’s curriculum. However, 100 percent of the core subjects must have written curriculum. Auditors noted that Pre-Kindergarten was offered at only four of the nine elementary schools, and therefore did not include Pre-Kindergarten courses as part of the district scope of the written curriculum, scope of assessment (see Finding 4.2), or quality of curriculum guidance documents. This fi nding addresses only the scope of the written curriculum. The quality of the written curriculum is addressed in Finding 2.3.
Auditors found that 38 percent of the subjects and courses offered in the district schools have written curriculum documents for planning and guiding instruction; thus, the scope of the written curriculum is considered inadequate. The written curriculum used in the district is the State Frameworks.
Overall, the auditors found that the elementary level had written documents intended to guide instruction in 83 percent of all courses and subject areas. At the junior and high school levels, less than 70 percent of the courses or subject areas had curriculum documents to guide instruction or address the details of curriculum implementation.
Auditors examined board policies to determine curriculum requirements in the Fayetteville Public Schools. No board policies or district documents refer to the scope of the written curriculum. The following board policies refer to the district’s curriculum expectations:
Board Policy 1.7: Powers and Duties of the Board• delegates duties that include, “seeing that all subjects for study prescribed by the State Board or by law for all grades of schools are taught.”
Board Policy 2.1: Duties of the Superintendent• states that the superintendent’s duties include “maintaining a current knowledge of developments in curriculum and instruction” and “reporting to the Board concerning the status of the educational program…and making recommendations for improving instruction.”
In researching the availability of curriculum guides for all subject areas and course offerings, certain special areas were found to have course offerings that depend on the regular Arkansas Curriculum Frameworks for direction or have a specialized curriculum with specifi c goals and unique learning objectives. These programs and courses fall under the categories of English Language Learners in academic core areas other than English and all courses in special education. Courses falling within these categories have not been included in the scope of exhibits. Auditors noted that Pre-Kindergarten was offered at only four of the nine elementary schools, and therefore did not include Pre-Kindergarten courses as part of the district scope of the written curriculum, scope of assessment (see Finding 4.2), or quality of curriculum guidance documents.
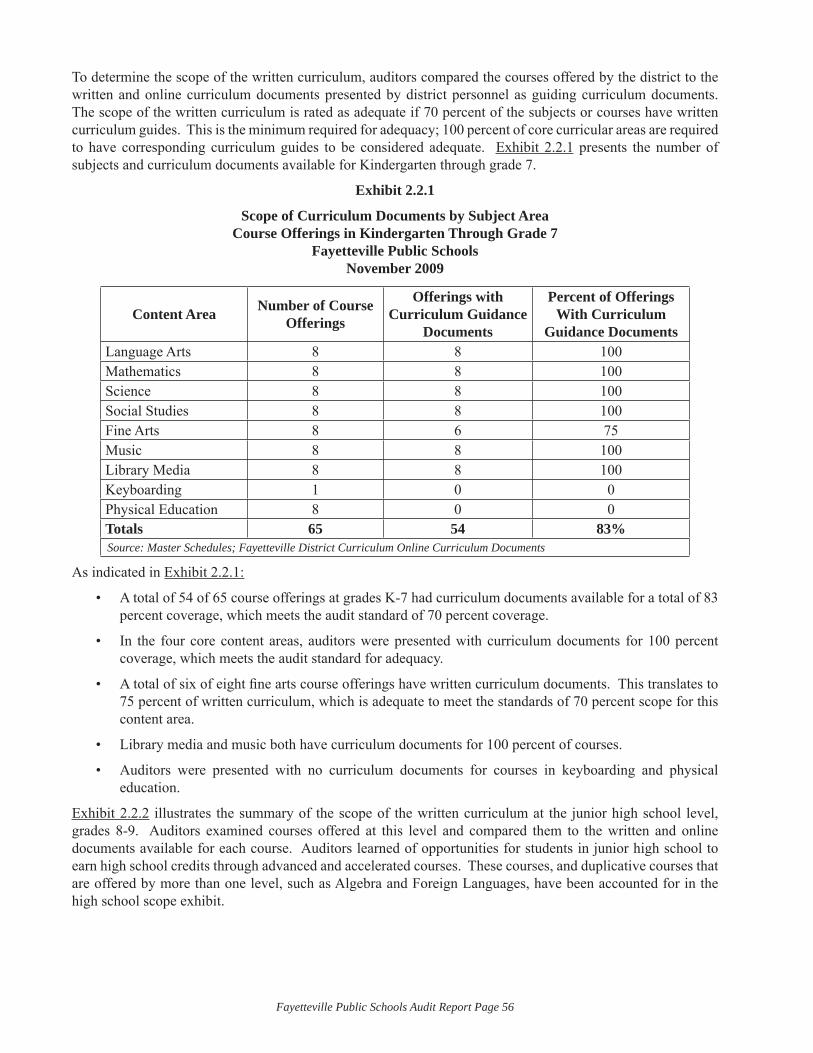
Fayetteville Public Schools Audit Report Page 56
To determine the scope of the written curriculum, auditors compared the courses offered by the district to the written and online curriculum documents presented by district personnel as guiding curriculum documents. The scope of the written curriculum is rated as adequate if 70 percent of the subjects or courses have written curriculum guides. This is the minimum required for adequacy; 100 percent of core curricular areas are required to have corresponding curriculum guides to be considered adequate. Exhibit 2.2.1 presents the number of subjects and curriculum documents available for Kindergarten through grade 7.
Exhibit 2.2.1
Scope of Curriculum Documents by Subject Area Course Offerings in Kindergarten Through Grade 7
Fayetteville Public SchoolsNovember 2009
Content Area Number of Course Offerings
Offerings with Curriculum Guidance
Documents
Percent of Offerings With Curriculum
Guidance DocumentsLanguage Arts 8 8 100Mathematics 8 8 100Science 8 8 100Social Studies 8 8 100Fine Arts 8 6 75Music 8 8 100Library Media 8 8 100Keyboarding 1 0 0Physical Education 8 0 0Totals 65 54 83%Source: Master Schedules; Fayetteville District Curriculum Online Curriculum Documents
As indicated in Exhibit 2.2.1:
A total of 54 of 65 course offerings at grades K-7 had curriculum documents available for a total of 83 • percent coverage, which meets the audit standard of 70 percent coverage.
In the four core content areas, auditors were presented with curriculum documents for 100 percent • coverage, which meets the audit standard for adequacy.
A total of six of eight fi ne arts course offerings have written curriculum documents. This translates to • 75 percent of written curriculum, which is adequate to meet the standards of 70 percent scope for this content area.
Library media and music both have curriculum documents for 100 percent of courses.•
Auditors were presented with no curriculum documents for courses in keyboarding and physical • education.
Exhibit 2.2.2 illustrates the summary of the scope of the written curriculum at the junior high school level, grades 8-9. Auditors examined courses offered at this level and compared them to the written and online documents available for each course. Auditors learned of opportunities for students in junior high school to earn high school credits through advanced and accelerated courses. These courses, and duplicative courses that are offered by more than one level, such as Algebra and Foreign Languages, have been accounted for in the high school scope exhibit.
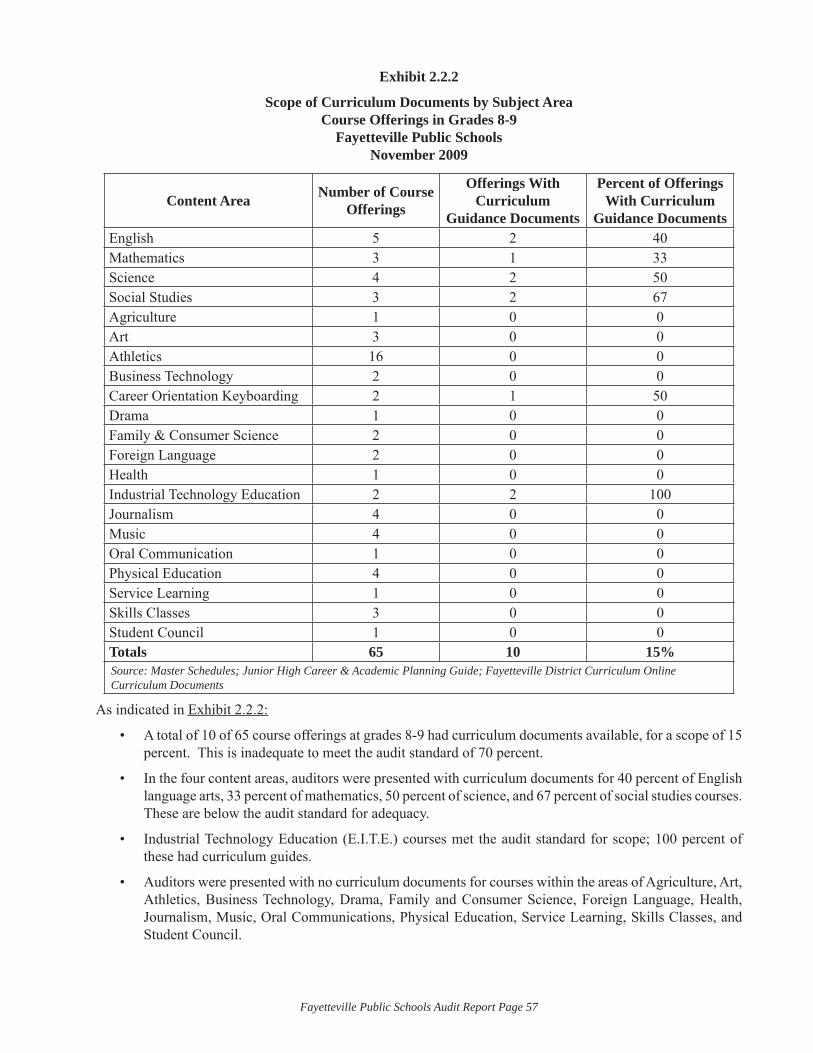
Fayetteville Public Schools Audit Report Page 57
Exhibit 2.2.2
Scope of Curriculum Documents by Subject Area Course Offerings in Grades 8-9
Fayetteville Public SchoolsNovember 2009
Content Area Number of Course Offerings
Offerings With Curriculum
Guidance Documents
Percent of Offerings With Curriculum
Guidance DocumentsEnglish 5 2 40Mathematics 3 1 33Science 4 2 50Social Studies 3 2 67Agriculture 1 0 0Art 3 0 0Athletics 16 0 0Business Technology 2 0 0Career Orientation Keyboarding 2 1 50Drama 1 0 0Family & Consumer Science 2 0 0Foreign Language 2 0 0Health 1 0 0Industrial Technology Education 2 2 100Journalism 4 0 0Music 4 0 0Oral Communication 1 0 0Physical Education 4 0 0Service Learning 1 0 0Skills Classes 3 0 0Student Council 1 0 0Totals 65 10 15%Source: Master Schedules; Junior High Career & Academic Planning Guide; Fayetteville District Curriculum Online Curriculum Documents
As indicated in Exhibit 2.2.2:
A total of 10 of 65 course offerings at grades 8-9 had curriculum documents available, for a scope of 15 • percent. This is inadequate to meet the audit standard of 70 percent.
In the four content areas, auditors were presented with curriculum documents for 40 percent of English • language arts, 33 percent of mathematics, 50 percent of science, and 67 percent of social studies courses. These are below the audit standard for adequacy.
Industrial Technology Education (E.I.T.E.) courses met the audit standard for scope; 100 percent of • these had curriculum guides.
Auditors were presented with no curriculum documents for courses within the areas of Agriculture, Art, • Athletics, Business Technology, Drama, Family and Consumer Science, Foreign Language, Health, Journalism, Music, Oral Communications, Physical Education, Service Learning, Skills Classes, and Student Council.
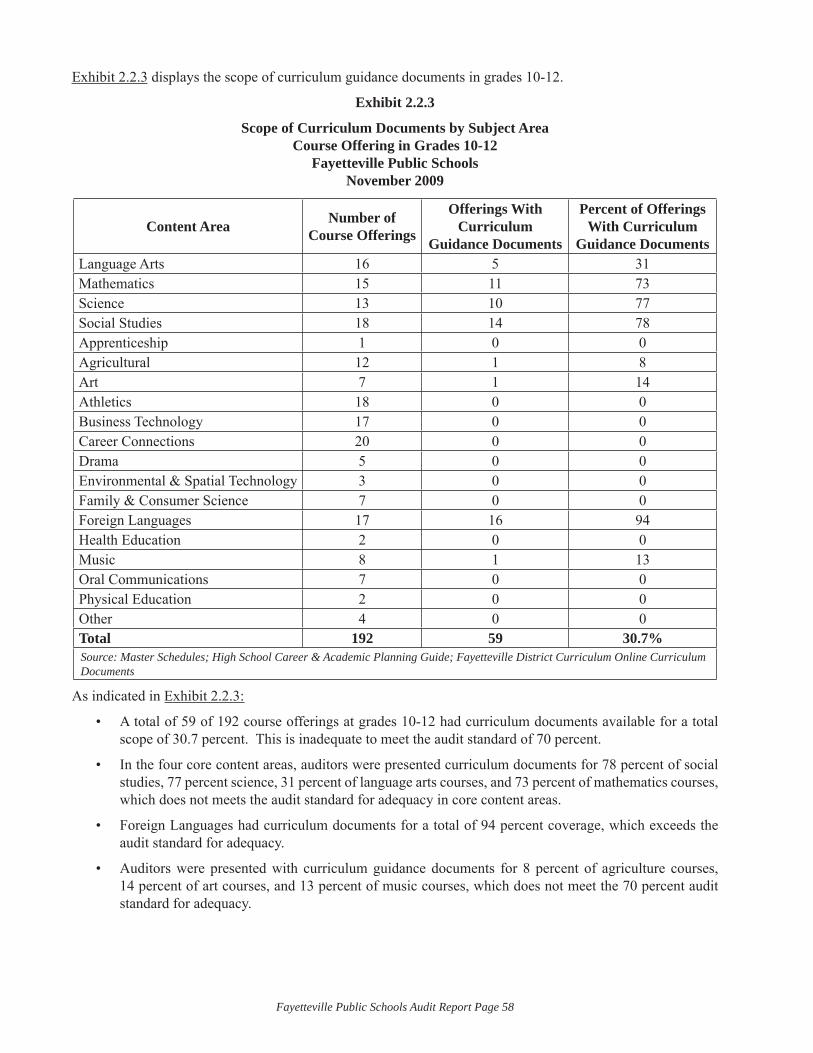
Fayetteville Public Schools Audit Report Page 58
Exhibit 2.2.3 displays the scope of curriculum guidance documents in grades 10-12.
Exhibit 2.2.3
Scope of Curriculum Documents by Subject Area Course Offering in Grades 10-12
Fayetteville Public SchoolsNovember 2009
Content Area Number of Course Offerings
Offerings With Curriculum
Guidance Documents
Percent of Offerings With Curriculum
Guidance DocumentsLanguage Arts 16 5 31Mathematics 15 11 73Science 13 10 77Social Studies 18 14 78Apprenticeship 1 0 0Agricultural 12 1 8Art 7 1 14Athletics 18 0 0Business Technology 17 0 0Career Connections 20 0 0Drama 5 0 0Environmental & Spatial Technology 3 0 0Family & Consumer Science 7 0 0Foreign Languages 17 16 94Health Education 2 0 0Music 8 1 13Oral Communications 7 0 0Physical Education 2 0 0Other 4 0 0Total 192 59 30.7%Source: Master Schedules; High School Career & Academic Planning Guide; Fayetteville District Curriculum Online Curriculum Documents
As indicated in Exhibit 2.2.3:
A total of 59 of 192 course offerings at grades 10-12 had curriculum documents available for a total • scope of 30.7 percent. This is inadequate to meet the audit standard of 70 percent.
In the four core content areas, auditors were presented curriculum documents for 78 percent of social • studies, 77 percent science, 31 percent of language arts courses, and 73 percent of mathematics courses, which does not meets the audit standard for adequacy in core content areas.
Foreign Languages had curriculum documents for a total of 94 percent coverage, which exceeds the • audit standard for adequacy.
Auditors were presented with curriculum guidance documents for 8 percent of agriculture courses, • 14 percent of art courses, and 13 percent of music courses, which does not meet the 70 percent audit standard for adequacy.
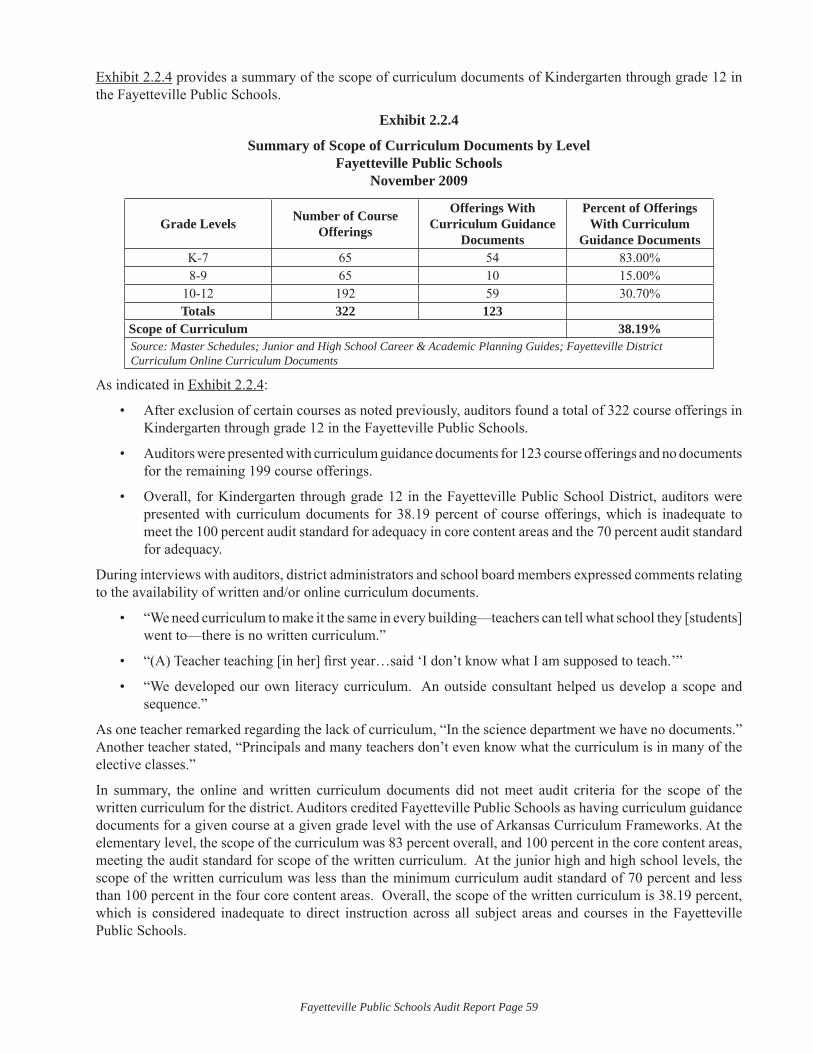
Fayetteville Public Schools Audit Report Page 59
Exhibit 2.2.4 provides a summary of the scope of curriculum documents of Kindergarten through grade 12 in the Fayetteville Public Schools.
Exhibit 2.2.4
Summary of Scope of Curriculum Documents by LevelFayetteville Public Schools
November 2009
Grade Levels Number of Course Offerings
Offerings With Curriculum Guidance
Documents
Percent of Offerings With Curriculum
Guidance DocumentsK-7 65 54 83.00%8-9 65 10 15.00%
10-12 192 59 30.70%Totals 322 123
Scope of Curriculum 38.19%Source: Master Schedules; Junior and High School Career & Academic Planning Guides; Fayetteville District Curriculum Online Curriculum Documents
As indicated in Exhibit 2.2.4:
After exclusion of certain courses as noted previously, auditors found a total of 322 course offerings in • Kindergarten through grade 12 in the Fayetteville Public Schools.
Auditors were presented with curriculum guidance documents for 123 course offerings and no documents • for the remaining 199 course offerings.
Overall, for Kindergarten through grade 12 in the Fayetteville Public School District, auditors were • presented with curriculum documents for 38.19 percent of course offerings, which is inadequate to meet the 100 percent audit standard for adequacy in core content areas and the 70 percent audit standard for adequacy.
During interviews with auditors, district administrators and school board members expressed comments relating to the availability of written and/or online curriculum documents.
“We need curriculum to make it the same in every building—teachers can tell what school they [students] • went to—there is no written curriculum.”
“(A) Teacher teaching [in her] fi rst year…said ‘I don’t know what I am supposed to teach.’”•
“We developed our own literacy curriculum. An outside consultant helped us develop a scope and • sequence.”
As one teacher remarked regarding the lack of curriculum, “In the science department we have no documents.” Another teacher stated, “Principals and many teachers don’t even know what the curriculum is in many of the elective classes.”
In summary, the online and written curriculum documents did not meet audit criteria for the scope of the written curriculum for the district. Auditors credited Fayetteville Public Schools as having curriculum guidance documents for a given course at a given grade level with the use of Arkansas Curriculum Frameworks. At the elementary level, the scope of the curriculum was 83 percent overall, and 100 percent in the core content areas, meeting the audit standard for scope of the written curriculum. At the junior high and high school levels, the scope of the written curriculum was less than the minimum curriculum audit standard of 70 percent and less than 100 percent in the four core content areas. Overall, the scope of the written curriculum is 38.19 percent, which is considered inadequate to direct instruction across all subject areas and courses in the Fayetteville Public Schools.
Fayetteville Public Schools Audit Report Page 60
Finding 2.3: The district curriculum guides are of insuffi cient quality to direct instruction and improve student achievement.
Quality instruction focused on student achievement begins with well-written curriculum of guides. Written curriculum guides are the district’s way of directing instruction and ensuring that district-wide instruction is coordinated in achieving the educational priorities of the school system. Quality guides connect the written, taught, and tested curriculum. Curriculum documents are blueprints for planning and delivering instruction to students. When guides are incomplete or nonexistent, instruction is likely to be inconsistent among teachers, thus resulting in less predictable learning among all students.
To determine the quality of curriculum in the Fayetteville Public Schools, the auditors reviewed all written and online curriculum documents provided them. Typically, these guides have been written documents developed to provide clear direction for teacher use in implementing the intended curriculum. However, most Fayetteville Public School curriculum guides presented to the audit team for review were written copies and online documents of course-specifi c Arkansas Curriculum Frameworks. Additionally, curriculum documents of advanced placement course syllabi were presented to auditors for review. The audit team also reviewed board policies and interviewed board members, administrative staff, principals, instructional staff, and parents.
Overall, the auditors found that the quality of the district’s written curriculum guides were not adequate to provide minimum direction to teachers in how to teach important curricular objectives. The auditors found that the Fayetteville Public Schools’ curriculum guidance documents contained a variety of problems in internal consistency across all curricular areas, exacerbated by the lack of common format, content, congruent approach to assessment, inclusion of instructional strategies, and the delineation of the type of resources used. The analysis revealed the most internal consistency or congruence for the Mathematics curriculum and the least congruence within the Social Studies and Language Arts guidance documents. A lack of internal consistency impedes the delivery of curriculum as intended.
Board policies were reviewed by auditors to determine expectations with regard to the design, quality, development, and use of the curriculum to be delivered by the teachers. Auditors found no policies that provide specifi c direction in regard to expected district objectives and the development and implementation of a district-wide curriculum. The following board policies refer to the district’s curriculum expectations:
Board Policy 1.7: Powers and Duties of the Board• delegates duties that include, “seeing that all subjects for study prescribed by the State Board or by law for all grades of schools are taught.”
Board Policy 2.1: Duties of the Superintendent• states that the superintendent’s duties include “maintaining a current knowledge of developments in curriculum and instruction” and “reporting to the Board concerning the status of the educational program…and making recommendations for improving instruction.”
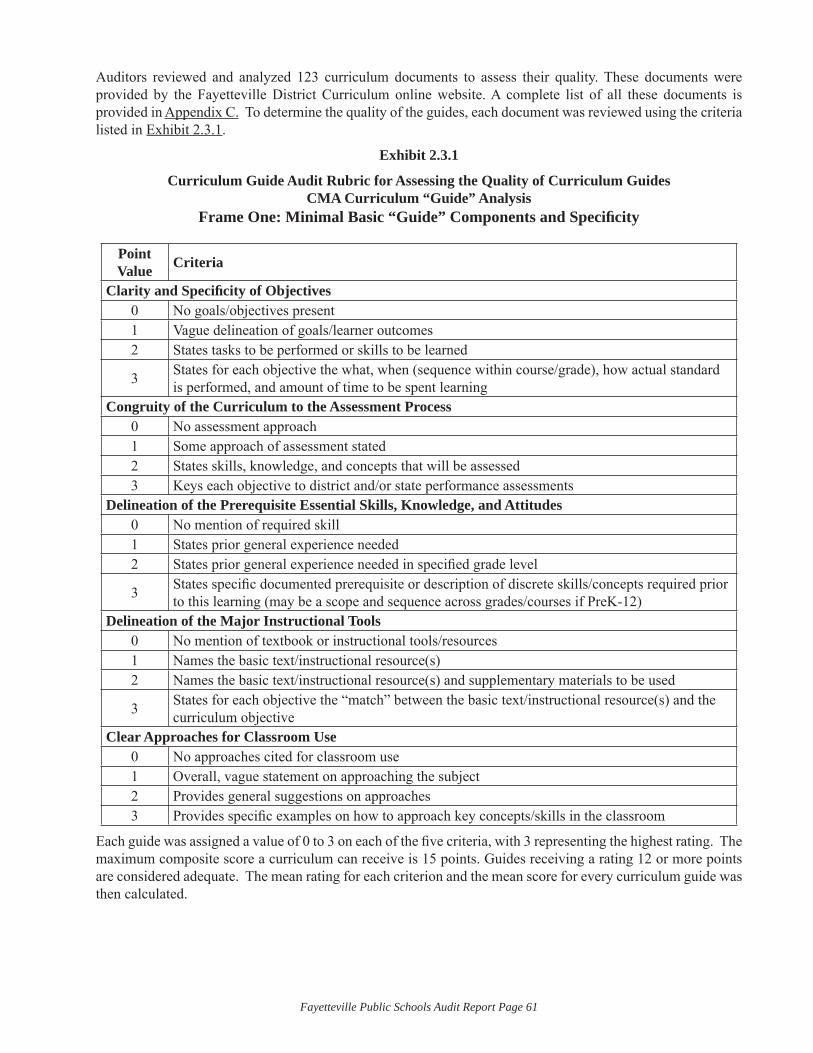
Fayetteville Public Schools Audit Report Page 61
Auditors reviewed and analyzed 123 curriculum documents to assess their quality. These documents were provided by the Fayetteville District Curriculum online website. A complete list of all these documents is provided in Appendix C. To determine the quality of the guides, each document was reviewed using the criteria listed in Exhibit 2.3.1.
Exhibit 2.3.1
Curriculum Guide Audit Rubric for Assessing the Quality of Curriculum Guides CMA Curriculum “Guide” Analysis
Frame One: Minimal Basic “Guide” Components and Specifi city
Point Value Criteria
Clarity and Specifi city of Objectives0 No goals/objectives present1 Vague delineation of goals/learner outcomes2 States tasks to be performed or skills to be learned
3 States for each objective the what, when (sequence within course/grade), how actual standard is performed, and amount of time to be spent learning
Congruity of the Curriculum to the Assessment Process0 No assessment approach1 Some approach of assessment stated2 States skills, knowledge, and concepts that will be assessed3 Keys each objective to district and/or state performance assessments
Delineation of the Prerequisite Essential Skills, Knowledge, and Attitudes 0 No mention of required skill1 States prior general experience needed2 States prior general experience needed in specifi ed grade level
3 States specifi c documented prerequisite or description of discrete skills/concepts required prior to this learning (may be a scope and sequence across grades/courses if PreK-12)
Delineation of the Major Instructional Tools0 No mention of textbook or instructional tools/resources1 Names the basic text/instructional resource(s)2 Names the basic text/instructional resource(s) and supplementary materials to be used
3 States for each objective the “match” between the basic text/instructional resource(s) and the curriculum objective
Clear Approaches for Classroom Use0 No approaches cited for classroom use1 Overall, vague statement on approaching the subject2 Provides general suggestions on approaches3 Provides specifi c examples on how to approach key concepts/skills in the classroom
Each guide was assigned a value of 0 to 3 on each of the fi ve criteria, with 3 representing the highest rating. The maximum composite score a curriculum can receive is 15 points. Guides receiving a rating 12 or more points are considered adequate. The mean rating for each criterion and the mean score for every curriculum guide was then calculated.
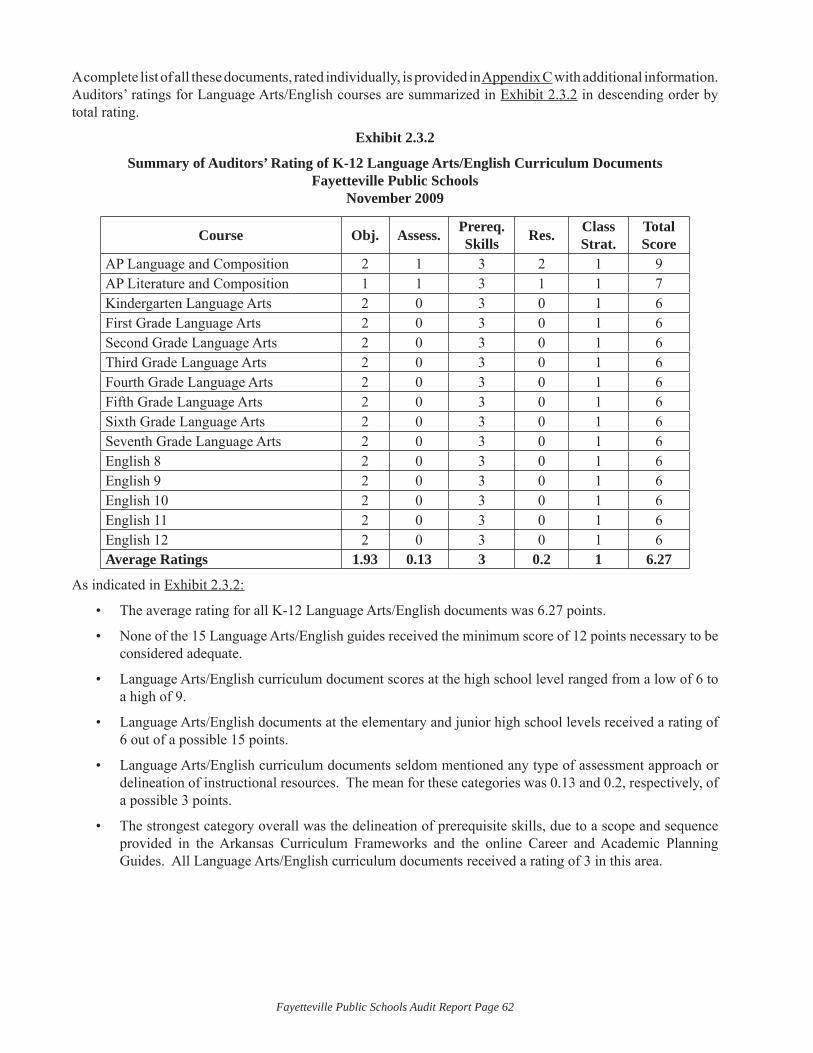
Fayetteville Public Schools Audit Report Page 62
A complete list of all these documents, rated individually, is provided in Appendix C with additional information. Auditors’ ratings for Language Arts/English courses are summarized in Exhibit 2.3.2 in descending order by total rating.
Exhibit 2.3.2
Summary of Auditors’ Rating of K-12 Language Arts/English Curriculum DocumentsFayetteville Public Schools
November 2009
Course Obj. Assess. Prereq.Skills Res. Class
Strat.TotalScore
AP Language and Composition 2 1 3 2 1 9AP Literature and Composition 1 1 3 1 1 7Kindergarten Language Arts 2 0 3 0 1 6First Grade Language Arts 2 0 3 0 1 6Second Grade Language Arts 2 0 3 0 1 6Third Grade Language Arts 2 0 3 0 1 6Fourth Grade Language Arts 2 0 3 0 1 6Fifth Grade Language Arts 2 0 3 0 1 6Sixth Grade Language Arts 2 0 3 0 1 6Seventh Grade Language Arts 2 0 3 0 1 6English 8 2 0 3 0 1 6English 9 2 0 3 0 1 6English 10 2 0 3 0 1 6English 11 2 0 3 0 1 6English 12 2 0 3 0 1 6Average Ratings 1.93 0.13 3 0.2 1 6.27
As indicated in Exhibit 2.3.2:
The average rating for all K-12 Language Arts/English documents was 6.27 points.•
None of the 15 Language Arts/English guides received the minimum score of 12 points necessary to be • considered adequate.
Language Arts/English curriculum document scores at the high school level ranged from a low of 6 to • a high of 9.
Language Arts/English documents at the elementary and junior high school levels received a rating of • 6 out of a possible 15 points.
Language Arts/English curriculum documents seldom mentioned any type of assessment approach or • delineation of instructional resources. The mean for these categories was 0.13 and 0.2, respectively, of a possible 3 points.
The strongest category overall was the delineation of prerequisite skills, due to a scope and sequence • provided in the Arkansas Curriculum Frameworks and the online Career and Academic Planning Guides. All Language Arts/English curriculum documents received a rating of 3 in this area.
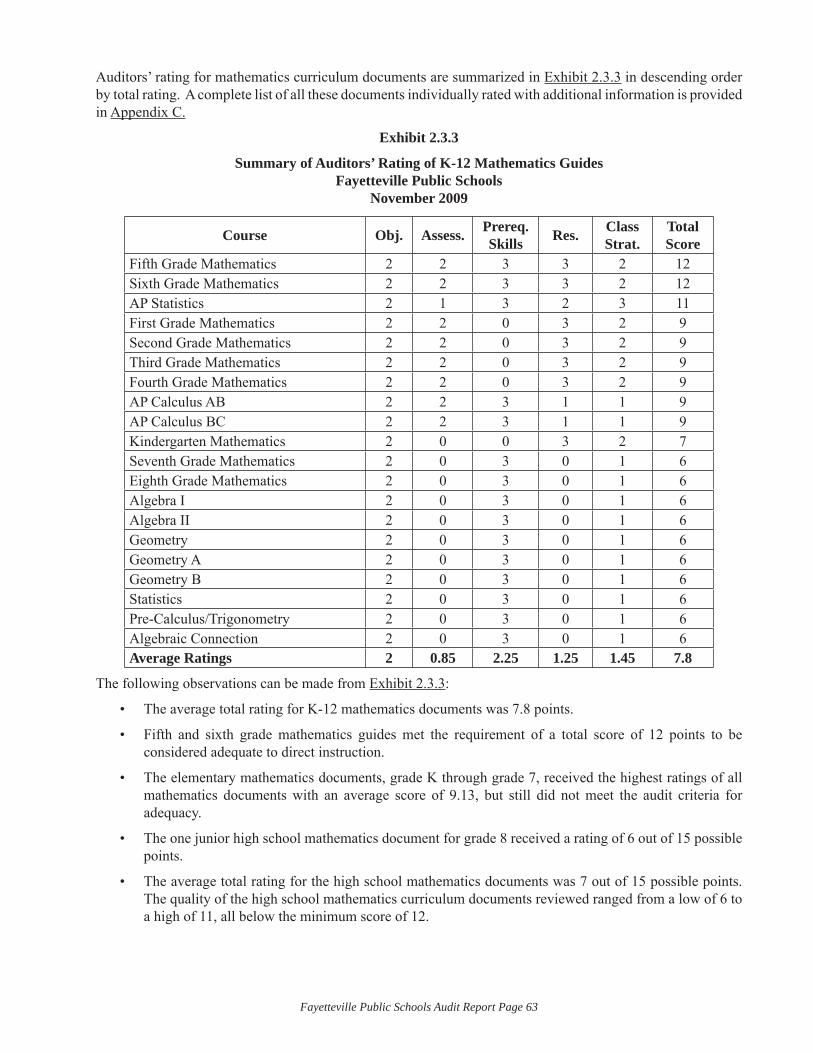
Fayetteville Public Schools Audit Report Page 63
Auditors’ rating for mathematics curriculum documents are summarized in Exhibit 2.3.3 in descending order by total rating. A complete list of all these documents individually rated with additional information is provided in Appendix C.
Exhibit 2.3.3
Summary of Auditors’ Rating of K-12 Mathematics GuidesFayetteville Public Schools
November 2009
Course Obj. Assess. Prereq.Skills Res. Class
Strat.TotalScore
Fifth Grade Mathematics 2 2 3 3 2 12Sixth Grade Mathematics 2 2 3 3 2 12AP Statistics 2 1 3 2 3 11First Grade Mathematics 2 2 0 3 2 9Second Grade Mathematics 2 2 0 3 2 9Third Grade Mathematics 2 2 0 3 2 9Fourth Grade Mathematics 2 2 0 3 2 9AP Calculus AB 2 2 3 1 1 9AP Calculus BC 2 2 3 1 1 9Kindergarten Mathematics 2 0 0 3 2 7Seventh Grade Mathematics 2 0 3 0 1 6Eighth Grade Mathematics 2 0 3 0 1 6Algebra I 2 0 3 0 1 6Algebra II 2 0 3 0 1 6Geometry 2 0 3 0 1 6Geometry A 2 0 3 0 1 6Geometry B 2 0 3 0 1 6Statistics 2 0 3 0 1 6Pre-Calculus/Trigonometry 2 0 3 0 1 6Algebraic Connection 2 0 3 0 1 6Average Ratings 2 0.85 2.25 1.25 1.45 7.8
The following observations can be made from Exhibit 2.3.3:
The average total rating for K-12 mathematics documents was 7.8 points.•
Fifth and sixth grade mathematics guides met the requirement of a total score of 12 points to be • considered adequate to direct instruction.
The elementary mathematics documents, grade K through grade 7, received the highest ratings of all • mathematics documents with an average score of 9.13, but still did not meet the audit criteria for adequacy.
The one junior high school mathematics document for grade 8 received a rating of 6 out of 15 possible • points.
The average total rating for the high school mathematics documents was 7 out of 15 possible points. • The quality of the high school mathematics curriculum documents reviewed ranged from a low of 6 to a high of 11, all below the minimum score of 12.
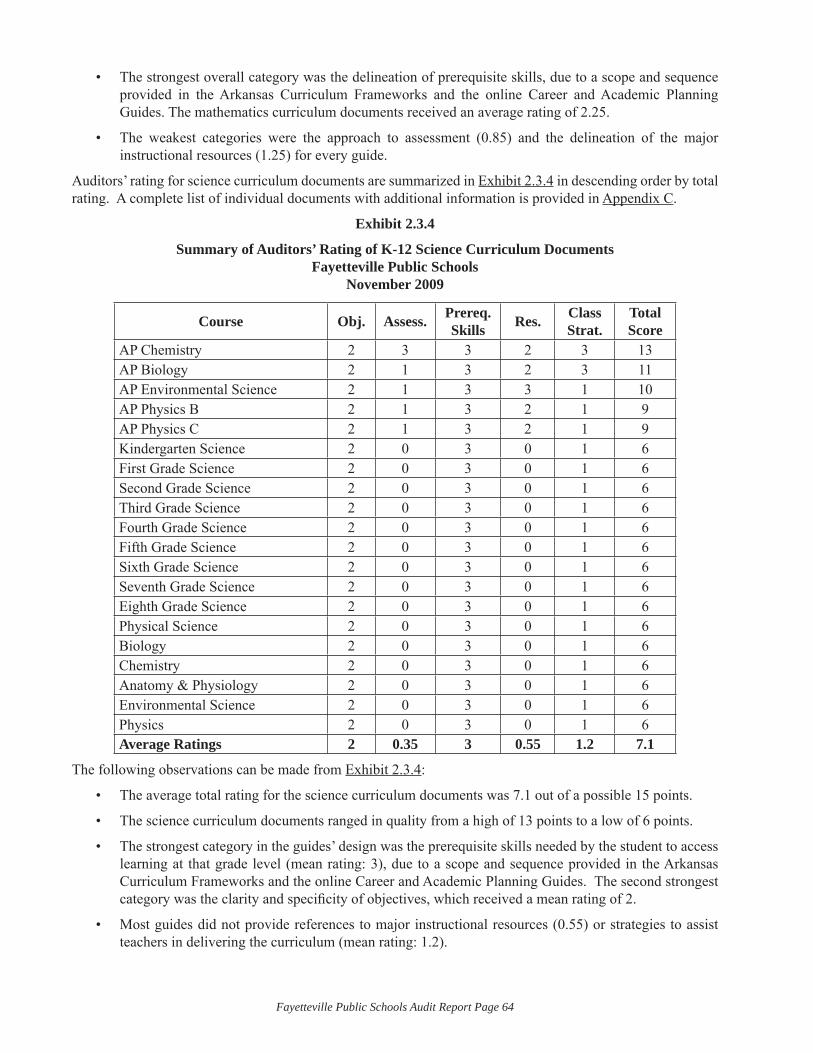
Fayetteville Public Schools Audit Report Page 64
The strongest overall category was the delineation of prerequisite skills, due to a scope and sequence • provided in the Arkansas Curriculum Frameworks and the online Career and Academic Planning Guides. The mathematics curriculum documents received an average rating of 2.25.
The weakest categories were the approach to assessment (0.85) and the delineation of the major • instructional resources (1.25) for every guide.
Auditors’ rating for science curriculum documents are summarized in Exhibit 2.3.4 in descending order by total rating. A complete list of individual documents with additional information is provided in Appendix C.
Exhibit 2.3.4
Summary of Auditors’ Rating of K-12 Science Curriculum DocumentsFayetteville Public Schools
November 2009
Course Obj. Assess. Prereq.Skills Res. Class
Strat.TotalScore
AP Chemistry 2 3 3 2 3 13AP Biology 2 1 3 2 3 11AP Environmental Science 2 1 3 3 1 10AP Physics B 2 1 3 2 1 9AP Physics C 2 1 3 2 1 9Kindergarten Science 2 0 3 0 1 6First Grade Science 2 0 3 0 1 6Second Grade Science 2 0 3 0 1 6Third Grade Science 2 0 3 0 1 6Fourth Grade Science 2 0 3 0 1 6Fifth Grade Science 2 0 3 0 1 6Sixth Grade Science 2 0 3 0 1 6Seventh Grade Science 2 0 3 0 1 6Eighth Grade Science 2 0 3 0 1 6Physical Science 2 0 3 0 1 6Biology 2 0 3 0 1 6Chemistry 2 0 3 0 1 6Anatomy & Physiology 2 0 3 0 1 6Environmental Science 2 0 3 0 1 6Physics 2 0 3 0 1 6Average Ratings 2 0.35 3 0.55 1.2 7.1
The following observations can be made from Exhibit 2.3.4:
The average total rating for the science curriculum documents was 7.1 out of a possible 15 points. •
The science curriculum documents ranged in quality from a high of 13 points to a low of 6 points.•
The strongest category in the guides’ design was the prerequisite skills needed by the student to access • learning at that grade level (mean rating: 3), due to a scope and sequence provided in the Arkansas Curriculum Frameworks and the online Career and Academic Planning Guides. The second strongest category was the clarity and specifi city of objectives, which received a mean rating of 2.
Most guides did not provide references to major instructional resources (0.55) or strategies to assist • teachers in delivering the curriculum (mean rating: 1.2).
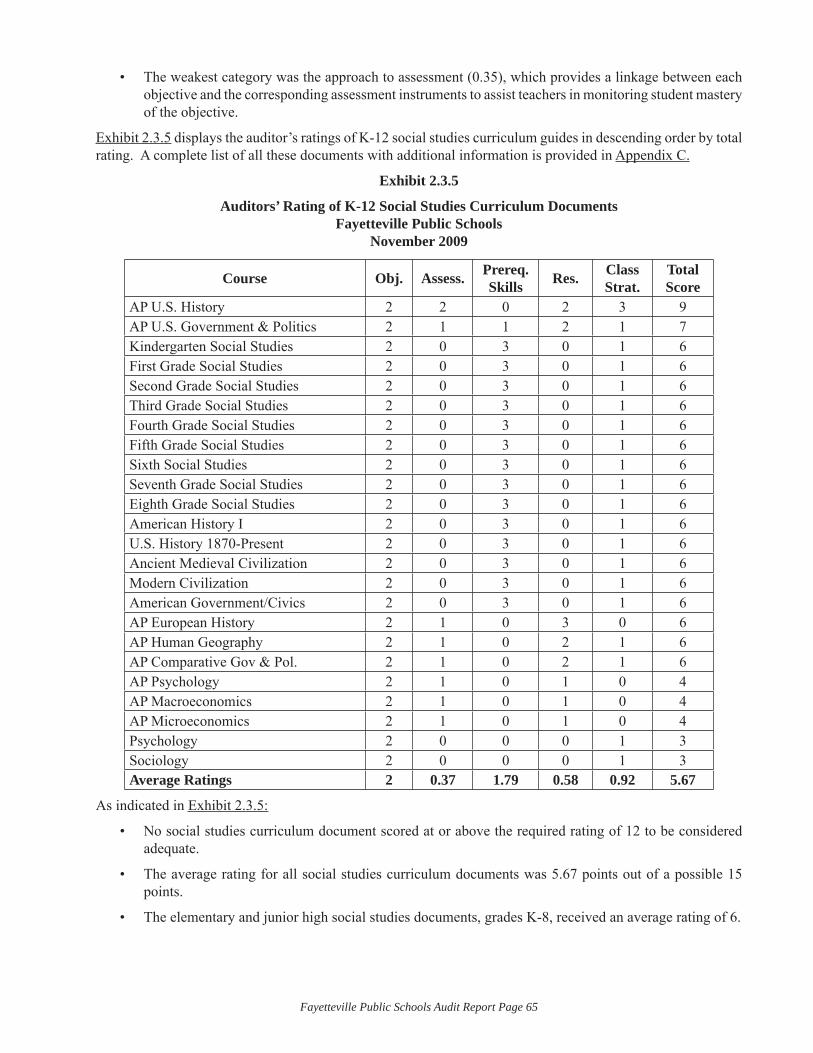
Fayetteville Public Schools Audit Report Page 65
The weakest category was the approach to assessment (0.35), which provides a linkage between each • objective and the corresponding assessment instruments to assist teachers in monitoring student mastery of the objective.
Exhibit 2.3.5 displays the auditor’s ratings of K-12 social studies curriculum guides in descending order by total rating. A complete list of all these documents with additional information is provided in Appendix C.
Exhibit 2.3.5
Auditors’ Rating of K-12 Social Studies Curriculum DocumentsFayetteville Public Schools
November 2009
Course Obj. Assess. Prereq.Skills Res. Class
Strat.TotalScore
AP U.S. History 2 2 0 2 3 9AP U.S. Government & Politics 2 1 1 2 1 7Kindergarten Social Studies 2 0 3 0 1 6First Grade Social Studies 2 0 3 0 1 6Second Grade Social Studies 2 0 3 0 1 6Third Grade Social Studies 2 0 3 0 1 6Fourth Grade Social Studies 2 0 3 0 1 6Fifth Grade Social Studies 2 0 3 0 1 6Sixth Social Studies 2 0 3 0 1 6Seventh Grade Social Studies 2 0 3 0 1 6Eighth Grade Social Studies 2 0 3 0 1 6American History I 2 0 3 0 1 6U.S. History 1870-Present 2 0 3 0 1 6Ancient Medieval Civilization 2 0 3 0 1 6Modern Civilization 2 0 3 0 1 6American Government/Civics 2 0 3 0 1 6AP European History 2 1 0 3 0 6AP Human Geography 2 1 0 2 1 6AP Comparative Gov & Pol. 2 1 0 2 1 6AP Psychology 2 1 0 1 0 4AP Macroeconomics 2 1 0 1 0 4AP Microeconomics 2 1 0 1 0 4Psychology 2 0 0 0 1 3Sociology 2 0 0 0 1 3Average Ratings 2 0.37 1.79 0.58 0.92 5.67
As indicated in Exhibit 2.3.5:
No social studies curriculum document scored at or above the required rating of 12 to be considered • adequate.
The average rating for all social studies curriculum documents was 5.67 points out of a possible 15 • points.
The elementary and junior high social studies documents, grades K-8, received an average rating of 6.•
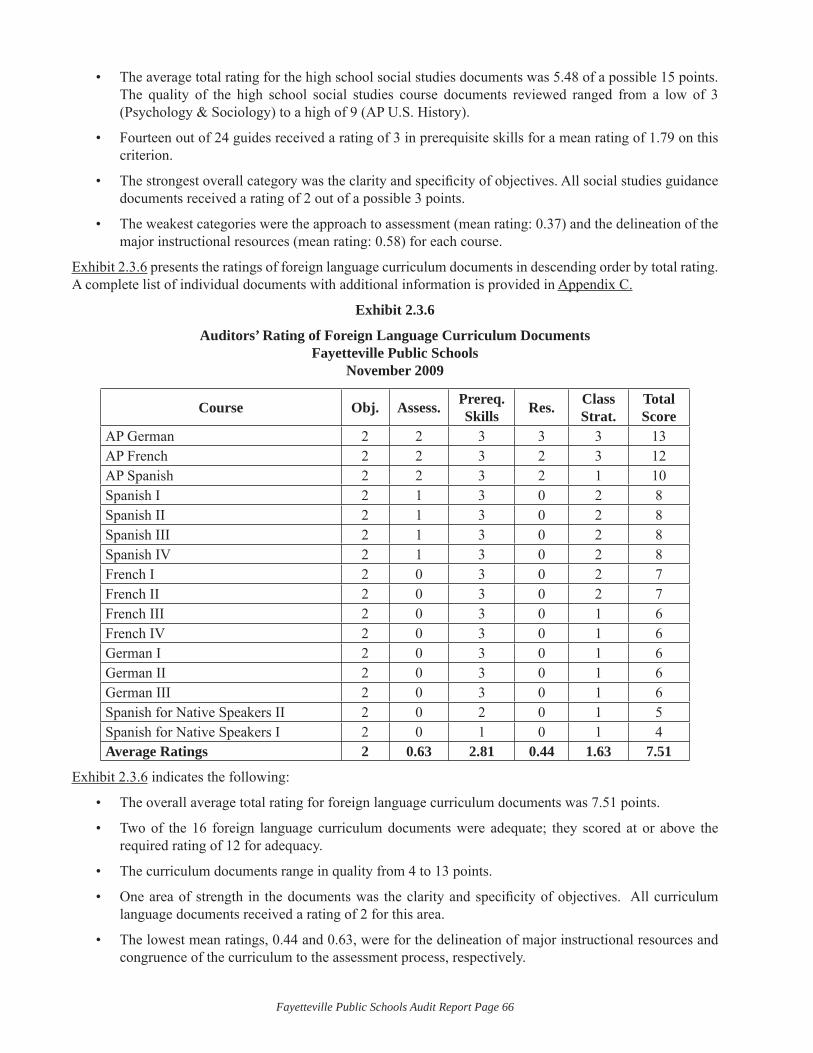
Fayetteville Public Schools Audit Report Page 66
The average total rating for the high school social studies documents was 5.48 of a possible 15 points. • The quality of the high school social studies course documents reviewed ranged from a low of 3 (Psychology & Sociology) to a high of 9 (AP U.S. History).
Fourteen out of 24 guides received a rating of 3 in prerequisite skills for a mean rating of 1.79 on this • criterion.
The strongest overall category was the clarity and specifi city of objectives. All social studies guidance • documents received a rating of 2 out of a possible 3 points.
The weakest categories were the approach to assessment (mean rating: 0.37) and the delineation of the • major instructional resources (mean rating: 0.58) for each course.
Exhibit 2.3.6 presents the ratings of foreign language curriculum documents in descending order by total rating. A complete list of individual documents with additional information is provided in Appendix C.
Exhibit 2.3.6
Auditors’ Rating of Foreign Language Curriculum DocumentsFayetteville Public Schools
November 2009
Course Obj. Assess. Prereq.Skills Res. Class
Strat.TotalScore
AP German 2 2 3 3 3 13AP French 2 2 3 2 3 12AP Spanish 2 2 3 2 1 10Spanish I 2 1 3 0 2 8Spanish II 2 1 3 0 2 8Spanish III 2 1 3 0 2 8Spanish IV 2 1 3 0 2 8French I 2 0 3 0 2 7French II 2 0 3 0 2 7French III 2 0 3 0 1 6French IV 2 0 3 0 1 6German I 2 0 3 0 1 6German II 2 0 3 0 1 6German III 2 0 3 0 1 6Spanish for Native Speakers II 2 0 2 0 1 5Spanish for Native Speakers I 2 0 1 0 1 4Average Ratings 2 0.63 2.81 0.44 1.63 7.51
Exhibit 2.3.6 indicates the following:
The overall average total rating for foreign language curriculum documents was 7.51 points.•
Two of the 16 foreign language curriculum documents were adequate; they scored at or above the • required rating of 12 for adequacy.
The curriculum documents range in quality from 4 to 13 points.•
One area of strength in the documents was the clarity and specifi city of objectives. All curriculum • language documents received a rating of 2 for this area.
The lowest mean ratings, 0.44 and 0.63, were for the delineation of major instructional resources and • congruence of the curriculum to the assessment process, respectively.
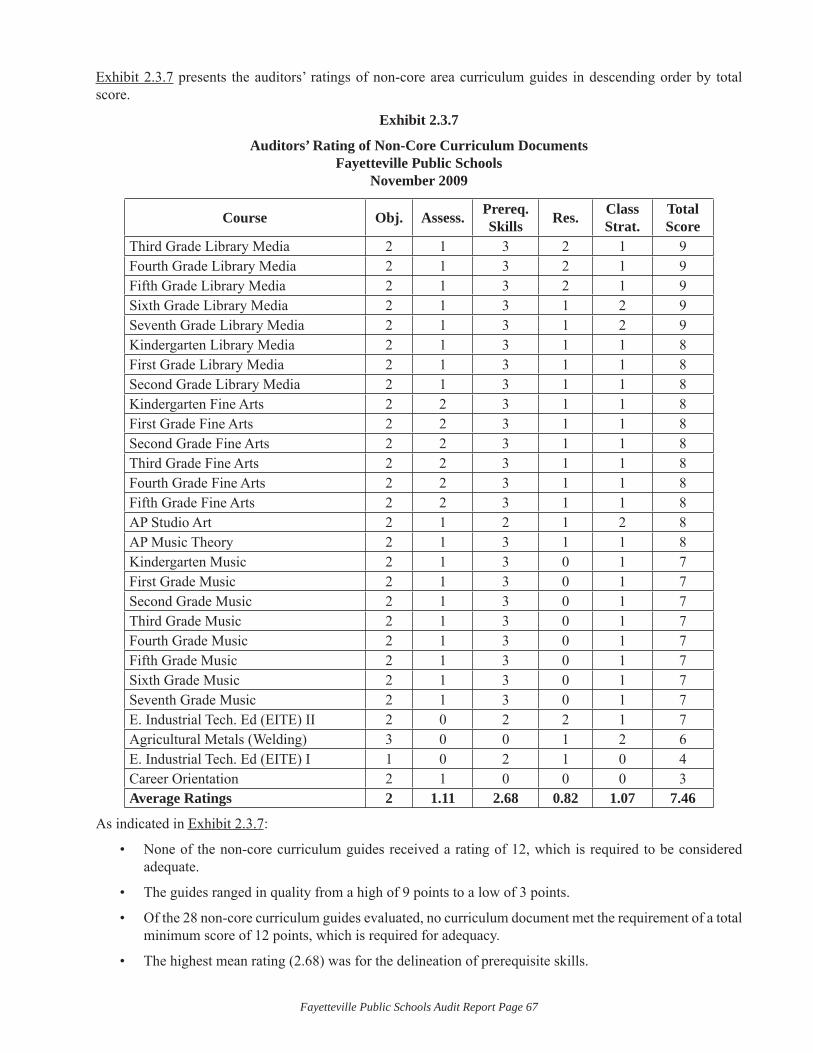
Fayetteville Public Schools Audit Report Page 67
Exhibit 2.3.7 presents the auditors’ ratings of non-core area curriculum guides in descending order by total score.
Exhibit 2.3.7
Auditors’ Rating of Non-Core Curriculum DocumentsFayetteville Public Schools
November 2009
Course Obj. Assess. Prereq.Skills Res. Class
Strat.TotalScore
Third Grade Library Media 2 1 3 2 1 9Fourth Grade Library Media 2 1 3 2 1 9Fifth Grade Library Media 2 1 3 2 1 9Sixth Grade Library Media 2 1 3 1 2 9Seventh Grade Library Media 2 1 3 1 2 9Kindergarten Library Media 2 1 3 1 1 8First Grade Library Media 2 1 3 1 1 8Second Grade Library Media 2 1 3 1 1 8Kindergarten Fine Arts 2 2 3 1 1 8First Grade Fine Arts 2 2 3 1 1 8Second Grade Fine Arts 2 2 3 1 1 8Third Grade Fine Arts 2 2 3 1 1 8Fourth Grade Fine Arts 2 2 3 1 1 8Fifth Grade Fine Arts 2 2 3 1 1 8AP Studio Art 2 1 2 1 2 8AP Music Theory 2 1 3 1 1 8Kindergarten Music 2 1 3 0 1 7First Grade Music 2 1 3 0 1 7Second Grade Music 2 1 3 0 1 7Third Grade Music 2 1 3 0 1 7Fourth Grade Music 2 1 3 0 1 7Fifth Grade Music 2 1 3 0 1 7Sixth Grade Music 2 1 3 0 1 7Seventh Grade Music 2 1 3 0 1 7E. Industrial Tech. Ed (EITE) II 2 0 2 2 1 7Agricultural Metals (Welding) 3 0 0 1 2 6E. Industrial Tech. Ed (EITE) I 1 0 2 1 0 4Career Orientation 2 1 0 0 0 3Average Ratings 2 1.11 2.68 0.82 1.07 7.46
As indicated in Exhibit 2.3.7:
None of the non-core curriculum guides received a rating of 12, which is required to be considered • adequate.
The guides ranged in quality from a high of 9 points to a low of 3 points.•
Of the 28 non-core curriculum guides evaluated, no curriculum document met the requirement of a total • minimum score of 12 points, which is required for adequacy.
The highest mean rating (2.68) was for the delineation of prerequisite skills.•
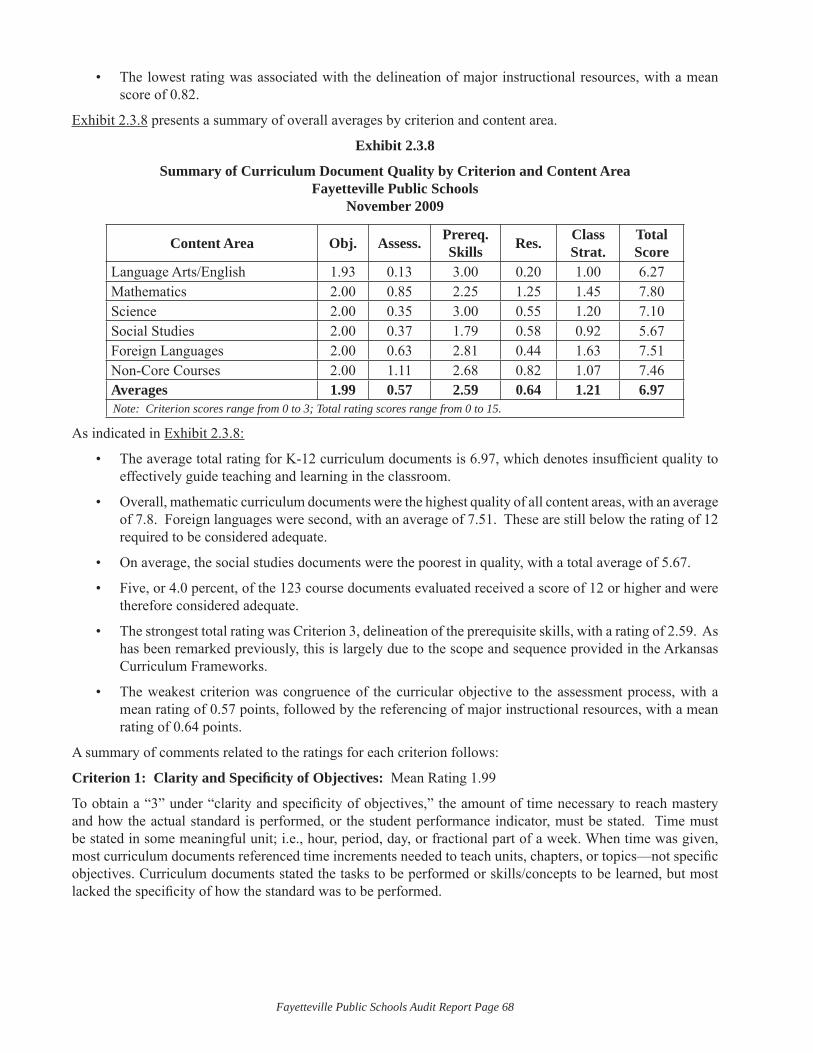
Fayetteville Public Schools Audit Report Page 68
The lowest rating was associated with the delineation of major instructional resources, with a mean • score of 0.82.
Exhibit 2.3.8 presents a summary of overall averages by criterion and content area.
Exhibit 2.3.8
Summary of Curriculum Document Quality by Criterion and Content AreaFayetteville Public Schools
November 2009
Content Area Obj. Assess. Prereq.Skills Res. Class
Strat.TotalScore
Language Arts/English 1.93 0.13 3.00 0.20 1.00 6.27Mathematics 2.00 0.85 2.25 1.25 1.45 7.80Science 2.00 0.35 3.00 0.55 1.20 7.10Social Studies 2.00 0.37 1.79 0.58 0.92 5.67Foreign Languages 2.00 0.63 2.81 0.44 1.63 7.51Non-Core Courses 2.00 1.11 2.68 0.82 1.07 7.46Averages 1.99 0.57 2.59 0.64 1.21 6.97Note: Criterion scores range from 0 to 3; Total rating scores range from 0 to 15.
As indicated in Exhibit 2.3.8:
The average total rating for K-12 curriculum documents is 6.97, which denotes insuffi cient quality to • effectively guide teaching and learning in the classroom.
Overall, mathematic curriculum documents were the highest quality of all content areas, with an average • of 7.8. Foreign languages were second, with an average of 7.51. These are still below the rating of 12 required to be considered adequate.
On average, the social studies documents were the poorest in quality, with a total average of 5.67.•
Five, or 4.0 percent, of the 123 course documents evaluated received a score of 12 or higher and were • therefore considered adequate.
The strongest total rating was Criterion 3, delineation of the prerequisite skills, with a rating of 2.59. As • has been remarked previously, this is largely due to the scope and sequence provided in the Arkansas Curriculum Frameworks.
The weakest criterion was congruence of the curricular objective to the assessment process, with a • mean rating of 0.57 points, followed by the referencing of major instructional resources, with a mean rating of 0.64 points.
A summary of comments related to the ratings for each criterion follows:
Criterion 1: Clarity and Specifi city of Objectives: Mean Rating 1.99
To obtain a “3” under “clarity and specifi city of objectives,” the amount of time necessary to reach mastery and how the actual standard is performed, or the student performance indicator, must be stated. Time must be stated in some meaningful unit; i.e., hour, period, day, or fractional part of a week. When time was given, most curriculum documents referenced time increments needed to teach units, chapters, or topics—not specifi c objectives. Curriculum documents stated the tasks to be performed or skills/concepts to be learned, but most lacked the specifi city of how the standard was to be performed.
Fayetteville Public Schools Audit Report Page 69
Criterion 2: Congruence of the Curriculum to the Assessment Process: Mean Rating 0.57
To receive a “3” on criterion two, objectives must be tied to specifi c assessment instruments, such as district and/or state performance assessments. Only one percent of district curriculum documents referenced student learning objectives to specifi c assessment instruments. Some guides included general references to assessment instruments, such as a quiz, test, or chapter test, but did not key these to a specifi c standard or objective. However, most curriculum documents did not address assessment at all. This criterion received the lowest rating.
Criterion 3: Delineation of the Prerequisite Essential Skills, Knowledge, and Attitudes: Mean Rating 2.59
The majority of documents presented to auditors as curriculum documents or guides were copies of course specifi c Arkansas Curriculum Frameworks, which provided a scope and sequence of standards and objectives for all grade levels in that content area. Online access to the district course description catalogues also provided prerequisites for most junior and high school core and advanced placement courses. In other guides, particularly non-core electives, no reference was made to prerequisite skills or knowledge.
Criterion 4: Delineation of the Major Instructional Resources: Mean Rating 0.64
To receive a “3” rating, there must be a match between the instructional resource and each objective. Most curriculum documents made vague or no reference to any instructional resources, tools, or textbooks intended to support instruction. Online staff and teacher resources included links to specifi c textbooks and instructional resource publishers. However, no linkage of a specifi c publisher or adopted textbook to a particular course or subject was provided, except for the elementary resource Everyday Math. Most instructional resources included in the curriculum documents were not clearly linked to specifi c objectives. Only 10 of the 123 curriculum documents evaluated in the district received a rating of 3 on this criterion.
Criterion 5: Clear Approaches for Classroom Use: Mean Rating 1.21
To receive a “3” rating, specifi c examples of teaching strategies or approaches intended to assure student mastery of the academic content must be stated. Most guides provided only vague or no references to instructional strategies and did not align teaching approaches to specifi c objectives or skills. Only 6, or 4.8 percent, of the 123 evaluated curriculum documents in the district received a rating of “3” for instructional strategies.
During the interview process, administrators expressed their concern about the quality of curriculum guides, as the following samples demonstrate:
“[Elementary] lessons are textbook based.”•
“The text is not our curriculum, it is the state standards. This is what they are being tested on and we • have to teach it.”
“We use state frameworks for core courses and create our own action plans.”•
“We need a more rigorous curriculum; [it is] worksheet driven; [we need a] lot of teacher direction.”•
“We have alignment issues, [we] need to develop more rigorous curriculum.”•
“[I’m] assuming that state-approved programs are aligned with state standards.”•
“[We] do not have a well articulated curriculum, but we need one and need to share dialogue.” •
Teachers and staff members also expressed concern in regard to the consistency and design of the curriculum, as the following examples demonstrate:
“We thought the way we were doing the curriculum was the same across the district. When we got • together as teachers, we found out this was not the case.”
“We need more guidance for curriculum, while maintaining the freedom we have.”•
Fayetteville Public Schools Audit Report Page 70
“Social studies do not have the same support material. Science is creating their own inquiry based • curriculum.”
“There is no real curriculum going on. There is a lack of leadership and a lack of organization.”•
“We follow the Arkansas state curriculum. The literacy is very broad and not as clear-cut as the math. • We are teaching students things they should have already known.”
“If the district person were asked to produce an alignment of literacy or math, there is none.”•
“We need some type of vertical alignment. Wish there was an effective way to teach the same concepts • at different levels of diffi culty and actually coordinate it so concepts are built upon.”
“We do not have vertical and horizontal alignment in place. When I came, I had no idea of what was • going on.”
“Students can be taking the same course but with different teachers and are taught entirely different • concepts.”
“When I fi rst came, I just made it up. It has been totally up to the teacher to decide what to teach and • nobody checks. There is no guidance or accountability.”
The audit team heard comments from parents and community members regarding concerns about the written and taught curriculum in the district, as the following represent:
“There is an imbalance in schools…the reading programs are not the same.”•
“The Everyday Math program was intended to be a resource to supplement the curriculum, not replace • it.”
“[All schools] do not have the same opportunities. There has always been a problem with the science • in the middle areas—around the ninth and tenth grade. Science is not being taught, especially at the elementary schools.”
“[Curriculum] is not consistent across the district, I want that to be the same, I want [for my children] • the same concepts that [other campuses] have.”
In summary, the quality of the curriculum documents in Fayetteville Public Schools is not adequate to provide consistent and clear direction to teachers regarding the delivery of a district-wide curriculum. All content areas were rated as inadequate in curriculum quality. Most of the district’s curriculum documents did not include important elements such as a common vocabulary and format, complete clarity and specifi city of objectives, recommended instructional resources and strategies that the teacher could use in the delivery of instruction, or the delineation of assessment items that the teacher could use to determine student mastery of the taught objectives.
Finding 2.4: Professional development is inadequately planned, coordinated, monitored, and evaluated system-wide and does not consistently provide suffi cient in-depth training and support for successful implementation in the classroom leading to increased student achievement.
A well-planned professional development program is an essential component of a district’s efforts to achieve its mission and goals and to connect curriculum design and classroom delivery. Effective professional development is guided by a comprehensive process or plan that is linked to the goals of the district’s long range planning efforts. Such a process or plan is based on identifi ed needs, offers a variety of professional development models, incorporates suffi cient follow up and support to ensure effective classroom use, and provides training for staff at all levels of the district. Staff development needs to be well-defi ned and coordinated, with a limited number of focus areas at any given time and opportunities to revisit key areas of training from one year to the next to deepen the learning and move it from awareness level into practice. In addition, an effective professional development program includes a systematic feedback process and multiple evaluation methods to evaluate effectiveness in terms of results attained.
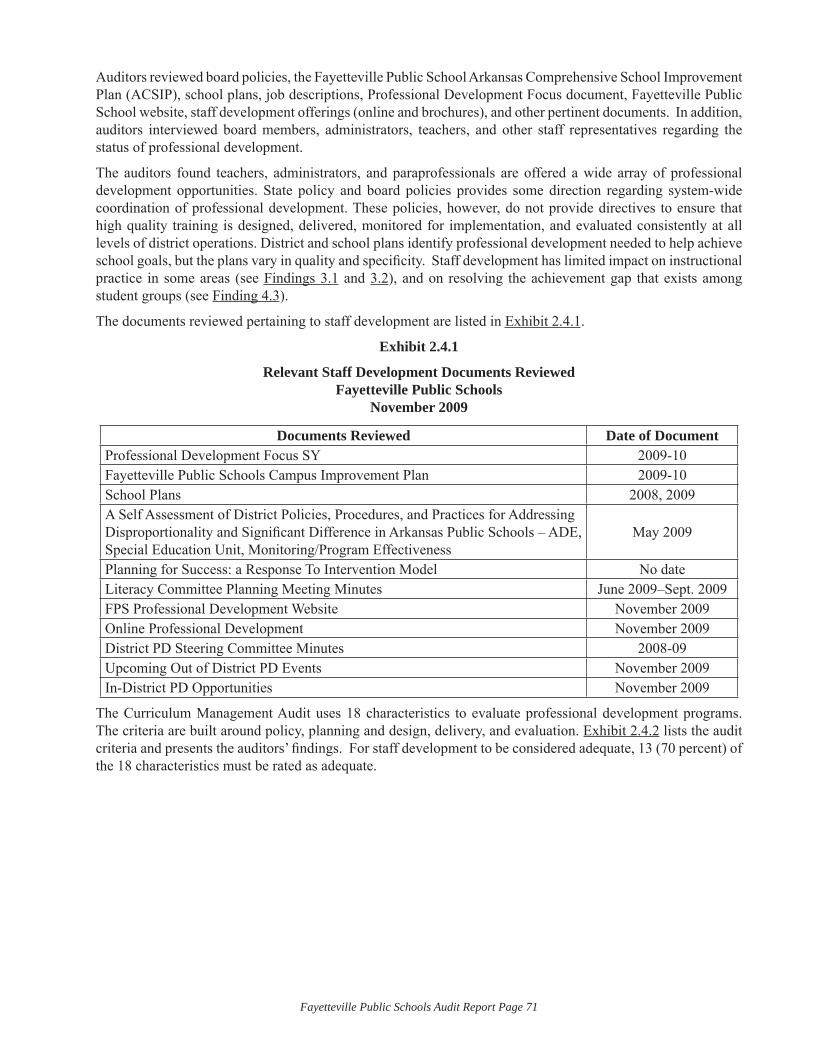
Fayetteville Public Schools Audit Report Page 71
Auditors reviewed board policies, the Fayetteville Public School Arkansas Comprehensive School Improvement Plan (ACSIP), school plans, job descriptions, Professional Development Focus document, Fayetteville Public School website, staff development offerings (online and brochures), and other pertinent documents. In addition, auditors interviewed board members, administrators, teachers, and other staff representatives regarding the status of professional development.
The auditors found teachers, administrators, and paraprofessionals are offered a wide array of professional development opportunities. State policy and board policies provides some direction regarding system-wide coordination of professional development. These policies, however, do not provide directives to ensure that high quality training is designed, delivered, monitored for implementation, and evaluated consistently at all levels of district operations. District and school plans identify professional development needed to help achieve school goals, but the plans vary in quality and specifi city. Staff development has limited impact on instructional practice in some areas (see Findings 3.1 and 3.2), and on resolving the achievement gap that exists among student groups (see Finding 4.3).
The documents reviewed pertaining to staff development are listed in Exhibit 2.4.1.
Exhibit 2.4.1
Relevant Staff Development Documents ReviewedFayetteville Public Schools
November 2009
Documents Reviewed Date of DocumentProfessional Development Focus SY 2009-10Fayetteville Public Schools Campus Improvement Plan 2009-10School Plans 2008, 2009A Self Assessment of District Policies, Procedures, and Practices for Addressing Disproportionality and Signifi cant Difference in Arkansas Public Schools – ADE, Special Education Unit, Monitoring/Program Effectiveness
May 2009
Planning for Success: a Response To Intervention Model No dateLiteracy Committee Planning Meeting Minutes June 2009–Sept. 2009FPS Professional Development Website November 2009Online Professional Development November 2009District PD Steering Committee Minutes 2008-09Upcoming Out of District PD Events November 2009In-District PD Opportunities November 2009
The Curriculum Management Audit uses 18 characteristics to evaluate professional development programs. The criteria are built around policy, planning and design, delivery, and evaluation. Exhibit 2.4.2 lists the audit criteria and presents the auditors’ fi ndings. For staff development to be considered adequate, 13 (70 percent) of the 18 characteristics must be rated as adequate.
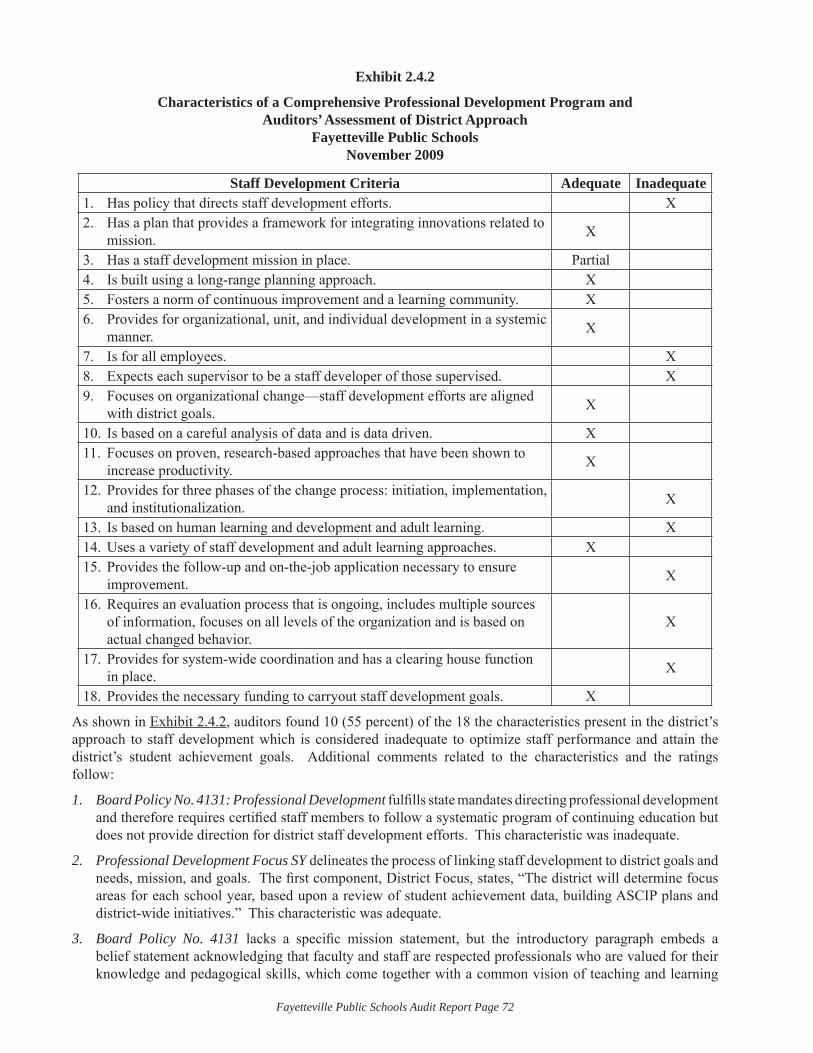
Fayetteville Public Schools Audit Report Page 72
Exhibit 2.4.2
Characteristics of a Comprehensive Professional Development Program and Auditors’ Assessment of District Approach
Fayetteville Public Schools November 2009
Staff Development Criteria Adequate InadequateHas policy that directs staff development efforts.1. XHas a plan that provides a framework for integrating innovations related to 2. mission. X
Has a staff development mission in place.3. PartialIs built using a long-range planning approach.4. XFosters a norm of continuous improvement and a learning community.5. XProvides for organizational, unit, and individual development in a systemic 6. manner. X
Is for all employees.7. XExpects each supervisor to be a staff developer of those supervised.8. XFocuses on organizational change—staff development efforts are aligned 9. with district goals. X
Is based on a careful analysis of data and is data driven.10. XFocuses on proven, research-based approaches that have been shown to 11. increase productivity. X
Provides for three phases of the change process: initiation, implementation, 12. and institutionalization. X
Is based on human learning and development and adult learning.13. XUses a variety of staff development and adult learning approaches.14. XProvides the follow-up and on-the-job application necessary to ensure 15. improvement. X
Requires an evaluation process that is ongoing, includes multiple sources 16. of information, focuses on all levels of the organization and is based on actual changed behavior.
X
Provides for system-wide coordination and has a clearing house function 17. in place. X
Provides the necessary funding to carryout staff development goals.18. X
As shown in Exhibit 2.4.2, auditors found 10 (55 percent) of the 18 the characteristics present in the district’s approach to staff development which is considered inadequate to optimize staff performance and attain the district’s student achievement goals. Additional comments related to the characteristics and the ratings follow:
Board Policy No. 4131: Professional Development1. fulfi lls state mandates directing professional development and therefore requires certifi ed staff members to follow a systematic program of continuing education but does not provide direction for district staff development efforts. This characteristic was inadequate.
Professional Development Focus SY2. delineates the process of linking staff development to district goals and needs, mission, and goals. The fi rst component, District Focus, states, “The district will determine focus areas for each school year, based upon a review of student achievement data, building ASCIP plans and district-wide initiatives.” This characteristic was adequate.
Board Policy No. 41313. lacks a specifi c mission statement, but the introductory paragraph embeds a belief statement acknowledging that faculty and staff are respected professionals who are valued for their knowledge and pedagogical skills, which come together with a common vision of teaching and learning
Fayetteville Public Schools Audit Report Page 73
to provide equitable learning opportunities and meet the needs of diverse student populations. To that end, the board believes that initial preparation is only the fi rst phase in becoming and remaining a professional staff member and therefore requires certifi ed staff members to follow a systematic program of continuing education. This characteristic was partially adequate.
Board Policy No. 41214. states that the program should be driven by...building Arkansas Comprehensive School Improvement Plans (ACSIP), district improvement plans, and the Strategic Plan of the Fayetteville Public Schools. This characteristic was adequate.
The auditors noted several documents, in addition to 5. Board Policy No. 4121, that communicated expectations of ongoing professional growth and development. Arkansas Department of Education requires 60 hours, or 10 days, of professional development a year. Of that time, 6 hours are to be in the area of educational technology, 2 hours for parental involvement, and up to 12 hours for preparation of curriculum and instructional materials. However, auditors also observed that not all professional development selections were clearly linked with teacher performance evaluations or identifi ed needs. This surfaced as a concern because many staff members reportedly choose their own professional development with no consultation of clarifi cation of rationale or linkage to needs. This characteristic was adequate.
FPS Professional Development Focus6. clearly outlines the framework that creates a systemic approach that integrates the district, school, department, and individual professional. This characteristic was adequate.
The staff development information provided to auditors focused on certifi ed staff: teachers, specialists, and 7. administrators. Auditors learned that instructional assistants and aids are included in campus trainings, although no policy or document requires the training. This characteristic was inadequate.
Most of the staff development delivery for teachers is provided by lead teachers, specialists, and coordinators 8. rather than direct supervisors of teachers. Auditors did not see expectations that all supervisors also be developers of their staff. This characteristic was inadequate.
Most information concerning staff development in the documents reviewed focuses on an intent to change 9. the results in student learning and achievement. The district improvement plans, building ACISP, and the Strategic Plan establishes the expectation that staff development will align with district and/or campus goals and enhance classroom instruction. This characteristic was adequate.
Auditors could determine clear linkage between student assessment data and staff development offerings at 10. the district level and at most schools in the plans analyzed. This characteristic was adequate.
Staff development efforts at the district and campus levels have recently focused on proven research-based 11. approaches that have been shown to increase productivity. Examples include quality questioning, use of manipulatives, inquiry based instruction, and collaborative study of data for instructional planning. This characteristic was adequate.
The staff development program does not consistently provide for all three phases of the change process: 12. initiation, implementation, and institutionalization. Even the offerings and collaborative efforts at school sites show a need for additional follow up and coaching in order to implement learned practices effectively and institutionalize their application. Strategies for revisiting training over time, incorporating deeper levels of content knowledge, modeling, and coaching are not systemic in professional development, although auditors did note evidence of some ongoing training and follow up in various math, reading, and writing programs. There is a lack of in-depth training for integrating technology with instruction (see Finding 3.2). This characteristic was inadequate.
Auditors could not determine the degree to which all staff development efforts were responsive to human 13. learning and development and adult learning. The on-site offerings at campuses that provide practice, collaboration, and coaching do refl ect attention to principles of adult learning and skill development with the use of Literacy Coaches and Instructional Technology personnel in the schools; however, in-depth training and follow up was found to be insuffi cient. This characteristic was inadequate.
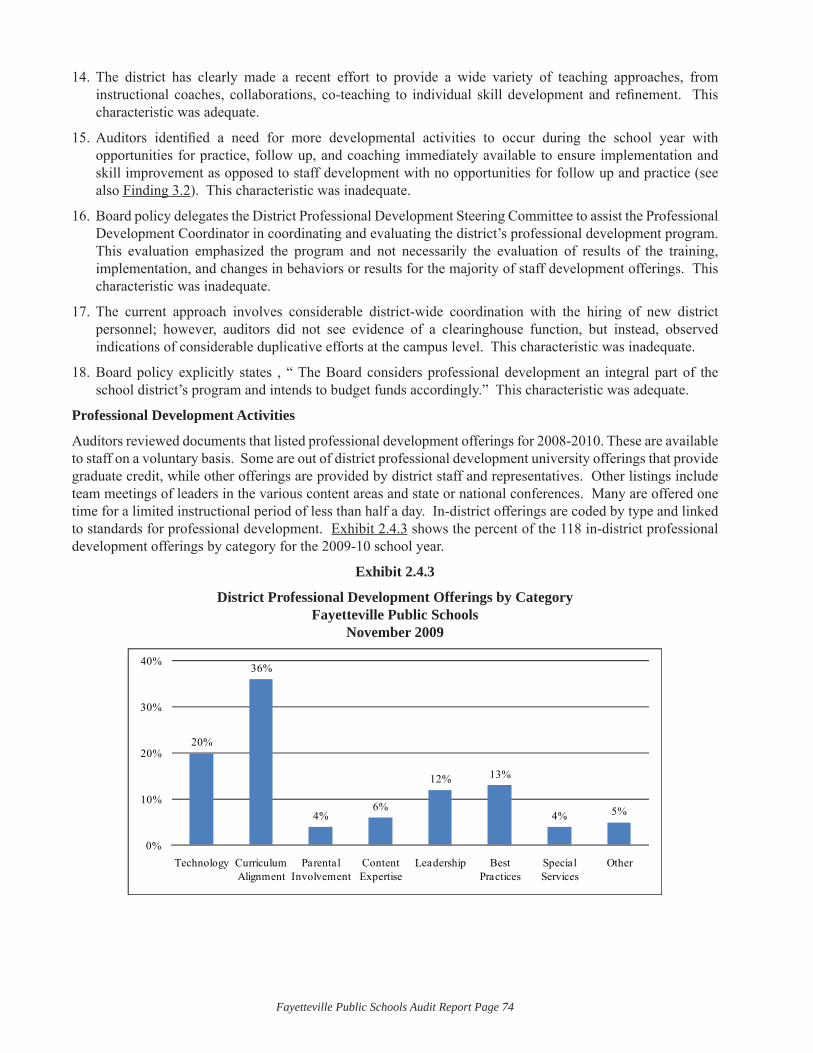
Fayetteville Public Schools Audit Report Page 74
The district has clearly made a recent effort to provide a wide variety of teaching approaches, from 14. instructional coaches, collaborations, co-teaching to individual skill development and refi nement. This characteristic was adequate.
Auditors identifi ed a need for more developmental activities to occur during the school year with 15. opportunities for practice, follow up, and coaching immediately available to ensure implementation and skill improvement as opposed to staff development with no opportunities for follow up and practice (see also Finding 3.2). This characteristic was inadequate.
Board policy delegates the District Professional Development Steering Committee to assist the Professional 16. Development Coordinator in coordinating and evaluating the district’s professional development program. This evaluation emphasized the program and not necessarily the evaluation of results of the training, implementation, and changes in behaviors or results for the majority of staff development offerings. This characteristic was inadequate.
The current approach involves considerable district-wide coordination with the hiring of new district 17. personnel; however, auditors did not see evidence of a clearinghouse function, but instead, observed indications of considerable duplicative efforts at the campus level. This characteristic was inadequate.
Board policy explicitly states , “ The Board considers professional development an integral part of the 18. school district’s program and intends to budget funds accordingly.” This characteristic was adequate.
Professional Development Activities
Auditors reviewed documents that listed professional development offerings for 2008-2010. These are available to staff on a voluntary basis. Some are out of district professional development university offerings that provide graduate credit, while other offerings are provided by district staff and representatives. Other listings include team meetings of leaders in the various content areas and state or national conferences. Many are offered one time for a limited instructional period of less than half a day. In-district offerings are coded by type and linked to standards for professional development. Exhibit 2.4.3 shows the percent of the 118 in-district professional development offerings by category for the 2009-10 school year.
Exhibit 2.4.3
District Professional Development Offerings by CategoryFayetteville Public Schools
November 2009
20%
36%
4%6%
12% 13%
4% 5%
0%
10%
20%
30%
40%
Technology Curriculum Alignment
Parental Involvement
Content Expertise
Leadership Best Practices
Special Services
Other
Fayetteville Public Schools Audit Report Page 75
As can be seen from Exhibit 2.4.3:
Most of the district offerings fell into the category of curriculum alignment. These included workshops • in foreign languages, sixth and seventh grade core courses, visual arts, collaboration teams, and professional learning teams.
Technology represented approximately one quarter of the offerings.•
Parental involvement, which is state mandated, and special services for special education and English • language learners were the smallest categories, at 4 percent.
Auditors also reviewed each in-district professional offering by category. A summary of comments related to specifi c course offerings within each category follows:
Technology
Although most of the course offerings involved the incorporation of 21st century technology in the classroom to improve teaching strategies, several sessions also met district/campus ACSIP goals by using technology to assess formative and summative data. Using technology for reading improvement in grades K-5 was also offered.
Curriculum Alignment
Auditors noted that alignment was a major concern during interviews with administrators, district staff, and teachers (see Findings 2.1 and 2.2). Vertical and horizontal alignment was addressed in various district documents, most notably district/campus school improvement plans, ACSIP, and principal meetings. However, of the 42 offerings in curriculum alignment:
Nineteen (45 percent) were in foreign languages;•
Eight (19 percent) in core courses for grades 6-7;•
Seven (17 percent) for the recording of year long participation on a 12 hour collaboration team at • individual campuses;
Five (12 percent) were opportunities for professional learning teams to discuss “a chosen topic”;•
Three (7 percent) were for visual arts, K-9.•
Other than offerings in core courses for grades 6-7, no district professional development was presented for core courses K-5 and 8-12.
Content
Of fi ve professional development offerings presented in content, three were “Adventures in Our Watershed” presented by Beaver Water District’s Water Education Programs. Lessons were described as being correlated with Arkansas State Frameworks in math, science, literacy, and social studies. These sessions were for grades 1-7. Everyday Math for Pre-K was offered at one elementary school, and one professional development session was to review new course submissions. No core course content professional development session was offered for grades K-12.
Leadership
All 14 leadership offerings were meetings for district leadership, steering committees, policy procedures, and one learning community book discussion.
Best Practices
Best practice courses ranged from the following:
Collaborative sharing of projects (one session at grades K-5 and four sessions at grade 8) ;•
National Board Support Group, K-12, to become nationally certifi ed in a specialty area through planned • lessons and classroom interaction (seven offerings);
Fayetteville Public Schools Audit Report Page 76
Phonics training for second grade (one offering);•
Gifted and Talented session on mythology statements (one offering); and•
Professional learning team discussions on a “chosen topic” (fi ve sessions).•
Specifi c innovative strategies refl ecting 21st Century Learning (see Finding 3.1), as well as strategies to enhance student achievement were not offered as part of the district professional development course offerings.
Special Services
One special education course offering for one hour was presented and three sessions of Best Practices in Closing the Achievement Gap were offered for ESL and ELL instructors.
Other
Professional development courses were offered for the following areas: one offering concerning sexual harassment, one administrative meeting, three policy procedure meetings, and two offerings concerning assessment data analysis.
In addition to district professional development offerings, campus or site-based professional development is part of the Professional Development Focus. These offerings are based on focus areas created from the district foci and the needs identifi ed by the ACSIP team in conjunction with the building principal. Using the school focus areas, department or grade level teams determine group focus areas. Through this procedure, local campuses determine the professional development offerings for each school. Often these sessions are duplicative in nature, not only to other schools, but to the district sessions as well. There is evidence of some collaboration of same grade campuses working together in providing professional development for alignment and content.
In their review of information about professional development, auditors made the following general observations:
Auditors found no guidelines on a system level for common areas of training that all teachers should • have. Although Arkansas state board policy requires that each certifi ed staff member will complete at least 60 clock hours of professional development and further mandates that six of those hours will be in technology, two hours in parental involvement, two hours in Arkansas History for those that teach the subject, and up to 12 hours in the preparation of curriculum and instructional materials, no guidelines are established for common training for the remaining 38 hours of professional development required. Staff spoke about the need for teachers to use differentiation strategies and best practices, employ a variety of ways of assessing student progress, analyze assessment data to guide instruction, incorporate 21st Century Learning in the classroom, etc.; however, there was no coordinated system-wide effort to provide this training for all teachers and follow up with suffi cient support to insure effective implementation.
Auditors found no documentation to show how professional development that certain individuals • or groups received was being used in practice, and what results had occurred. There was also no information provided to auditors to show that periodic evaluation of staff development, at a district or campus level, was being used to inform decisions regarding the district design of staff development as well as to guide campus staff in the formulation of their own staff development plans.
No plans or strategies to support new teachers in acquiring the training their colleagues received in • recent years were found. Other than an orientation at the beginning of the year and some mentor relationships, auditors did not fi nd a system-wide approach or plan to meet this challenge.
Auditors heard many comments during interviews with district administrators and central offi ce staff regarding professional development in the district. Typical comments follow:
“I would like to have a lot of our teachers trained in advanced placement strategies.”•
“We need to take the standards to make sure they are aligned. We did one [professional development • offering] last year and one two years ago.”
Fayetteville Public Schools Audit Report Page 77
“Teachers were allowed staff development days to get together for alignment but never got a product; • if it did happen, no one ever knew where it was.”
“District professional development goals are aligned around state requirements. The secondary buildings • design their own…elementary [staff development] is more aligned…but we did have some district-wide professional development.”
“Professional development is determined by data.”•
“A committee in the spring decides professional development based on overarching needs of the district. • Usually it is in technology, but there is room for individual input…also, it is usually situation-driven, but we do look at test data from the state and common formative assessments.”
“Professional development has little follow up.” •
“District staff development…I don’t know where they get the topics.”•
A number of teachers expressed frustration with poor-quality and limited opportunities for professional development:
“We need strategy instructions…instructional leadership and follow-ups.”•
“The professional development that is offered is NOT what is needed. Every year we read some book, • have someone come in and tell us what is in that book; nothing happens after that.”
“We don’t even evaluate our professional development.”•
“Teachers cannot work with who they need to; example, you had to work with teachers in your own • building…and you have only one music teacher.”
“It’s mostly English teachers that have been getting literacy training. We need it for content area • teachers.”
“Sometimes we’re given new programs without the training to implement them properly.” •
In summary, professional development is valued and supported by policy in the Fayetteville Public Schools but direction is not given for these efforts. Professional development activities are not clearly focused and insuffi ciently coordinated, monitored, and evaluated system-wide. Procedures designed to provide a system’s view of quality control of design and delivery and evaluation of impact on changed practice were not evident. Most staff development remains at the awareness level with insuffi cient follow-up training, modeling, and coaching to result in effective implementation.

Fayetteville Public Schools Audit Report Page 78
Fayetteville Public Schools Audit Report Page 79
STANDARD 3: The School District Demonstrates Internal Consistency and Rational Equity in Its Program Development and Implementation.A school system meeting this Curriculum Management Audit standard is able to show how its program has been created as the result of a systematic identifi cation of defi ciencies in the achievement and growth of its students compared to measurable standards of pupil learning.
In addition, a school system meeting this standard is able to demonstrate that it possesses a focused and coherent approach toward defi ning curriculum and that, as a whole, it is more effective than the sum of its parts, i.e., any arbitrary combinations of programs or schools do not equate to the larger school system entity.
The purpose of having a school system is to obtain the educational and economic benefi ts of a coordinated and focused program for students, both to enhance learning, which is complex and multi-year in its dimensions, and to employ economies of scale where applicable.
What the Auditors Expected to Find in the Fayetteville Public Schools:
The PDK-CMSi auditors expected to fi nd a highly-developed, articulated, and coordinated curriculum in the school system that was effectively monitored by the administrative and supervisory staffs at the central and site levels. Common indicators are:
Documents/sources that reveal internal connections at different levels in the system;•
Predictable consistency through a coherent rationale for content delineation within the curriculum;•
Equity of curriculum/course access and opportunity;•
Allocation of resource fl ow to areas of greatest need;•
A curriculum that is clearly explained to members of the teaching staff and building-level administrators • and other supervisory personnel;
Specifi c professional development programs to enhance curricular design and delivery;•
A curriculum that is monitored by central offi ce and site supervisory personnel; and•
Teacher and administrator responsiveness to school board policies, currently and over time.•
Overview of What the Auditors Found in the Fayetteville Public Schools:
This section is an overview of the fi ndings that follow in the area of Standard Three. Details follow within separate fi ndings.
Documents and verbal expectations by administrators and board members demonstrate the thrust of direction for teaching to be aimed at 21st Century Learning. However, the auditors observed that seatwork and whole group activity comprised 52 percent of student activity. These predominant behaviors are not included in the district’s expectation for 21st Century Learning. District intentions for small groups (22 percent); problem solving (3 percent); and technology use by the student, as well as for instruction; and students actively engaged at higher cognitive levels, which are 21st Century Learning expectations, are receiving less emphasis than the acquisition of facts provided through direct instruction to the whole group.
The auditors found that the district is rich in technology equipment and has been recognized nationally for these achievements. Teacher and Library Media observation standards, which are board policies, require the integration of technology with instruction. However, an inadequate technology plan to direct technology integration with instruction in the district was found. Additionally, the auditors found that there was not suffi cient in-depth staff development for faculty to implement the intent of the district leadership. The auditors found an unequal access to technology for students across the district. Classroom visitations and interviews showed there was a disconnect between what the central offi ce personnel expect to occur with use of technology in classrooms and what was actually happening.
Fayetteville Public Schools Audit Report Page 80
Finding 3.1: Observed classroom instructional practices do not refl ect the district’s expectation for 21st Century student learning.
Effective delivery of the curriculum provides the foundation for successful learning experiences for all students. Quality classroom instruction is essential to a district’s ability to positively infl uence student achievement. Teaching strategies that transcend students’ ethnicity, gender, and socioeconomic status and provide for research-based approaches that are stimulating and focused promote high levels of student achievement across all segments of the student population. A teacher’s knowledge of diverse student learning styles and use of varied teaching methods are important in promoting student learning and creating a classroom environment that provides opportunities for all learners to reach their potential.
Auditors reviewed board policies, curriculum documents, descriptions of staff development offerings, district plans, and other documents to determine expectations for teaching and learning in Fayetteville Public Schools. They also interviewed district administrators, principals, and teachers to gather information about teaching expectations and instructional practices. The auditors visited each school over a three-day period and spent a brief time in classrooms, particularly those in the core curricular areas, to obtain a visual picture of ongoing instruction.
In general, auditors found that instructional practices they observed refl ected some of the district focus and staff development emphasis. Many rooms were arranged to facilitate collaborative learning, particularly at the elementary and junior high schools, though that arrangement was not always being used when auditors were in the room. Teachers’ single predominant activity was whole-group direct instruction, but that whole-group instruction often involved demonstrations and active discussion with students. Technology use was evident in the classrooms, but primarily in the use of document readers, projectors, and white board use by teachers. Student activities in the classrooms required knowledge and comprehension more than any other type of cognition. Degrees of differentiation and types of questioning were diffi cult to ascertain in the short classroom visits. The observed classroom activities did not refl ect the expectations for 21st Century Learning.
Several documents provide general direction for the expectations regarding delivery of the curriculum. The most complete list of expectations for instructional strategies was found in documents related to Response to Intervention and 21st Century core competencies. These documents indicate that teachers are expected to foster the development of critical thinking skills using inquiry-based learning and creating a student centered classroom characterized by a rigorous curriculum that encompasses:
opportunities to develop information-processing and problem-solving skills;•
project-based learning;•
the use of teacher created materials based on student interest and real life challenges;•
opportunities to develop competencies such as information communication technology (ICT);•
students working in groups to solve problems using collaborative tools and rich media;•
opportunities for students to work with 21• st Century communication tools; and
student engagement in real-world problem solving.•
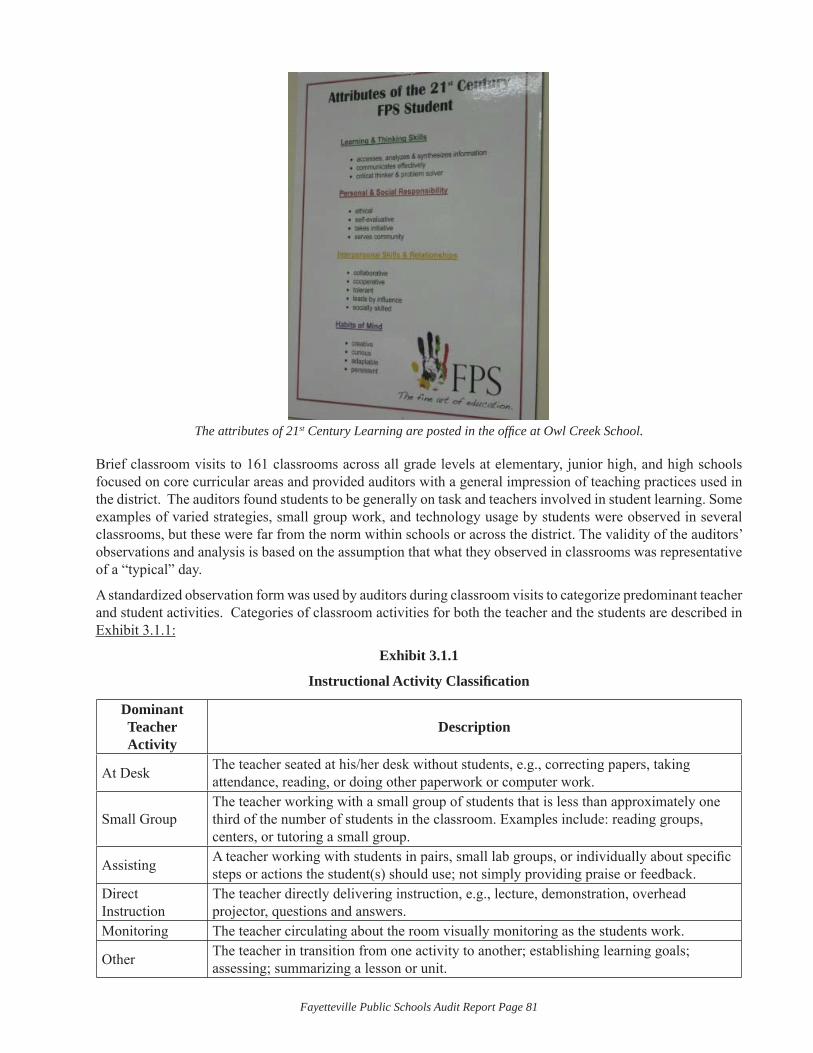
Fayetteville Public Schools Audit Report Page 81
The attributes of 21st Century Learning are posted in the offi ce at Owl Creek School.
Brief classroom visits to 161 classrooms across all grade levels at elementary, junior high, and high schools focused on core curricular areas and provided auditors with a general impression of teaching practices used in the district. The auditors found students to be generally on task and teachers involved in student learning. Some examples of varied strategies, small group work, and technology usage by students were observed in several classrooms, but these were far from the norm within schools or across the district. The validity of the auditors’ observations and analysis is based on the assumption that what they observed in classrooms was representative of a “typical” day.
A standardized observation form was used by auditors during classroom visits to categorize predominant teacher and student activities. Categories of classroom activities for both the teacher and the students are described in Exhibit 3.1.1:
Exhibit 3.1.1
Instructional Activity Classifi cation
Dominant Teacher Activity
Description
At Desk The teacher seated at his/her desk without students, e.g., correcting papers, taking attendance, reading, or doing other paperwork or computer work.
Small GroupThe teacher working with a small group of students that is less than approximately one third of the number of students in the classroom. Examples include: reading groups, centers, or tutoring a small group.
Assisting A teacher working with students in pairs, small lab groups, or individually about specifi c steps or actions the student(s) should use; not simply providing praise or feedback.
Direct Instruction
The teacher directly delivering instruction, e.g., lecture, demonstration, overhead projector, questions and answers.
Monitoring The teacher circulating about the room visually monitoring as the students work.
Other The teacher in transition from one activity to another; establishing learning goals; assessing; summarizing a lesson or unit.
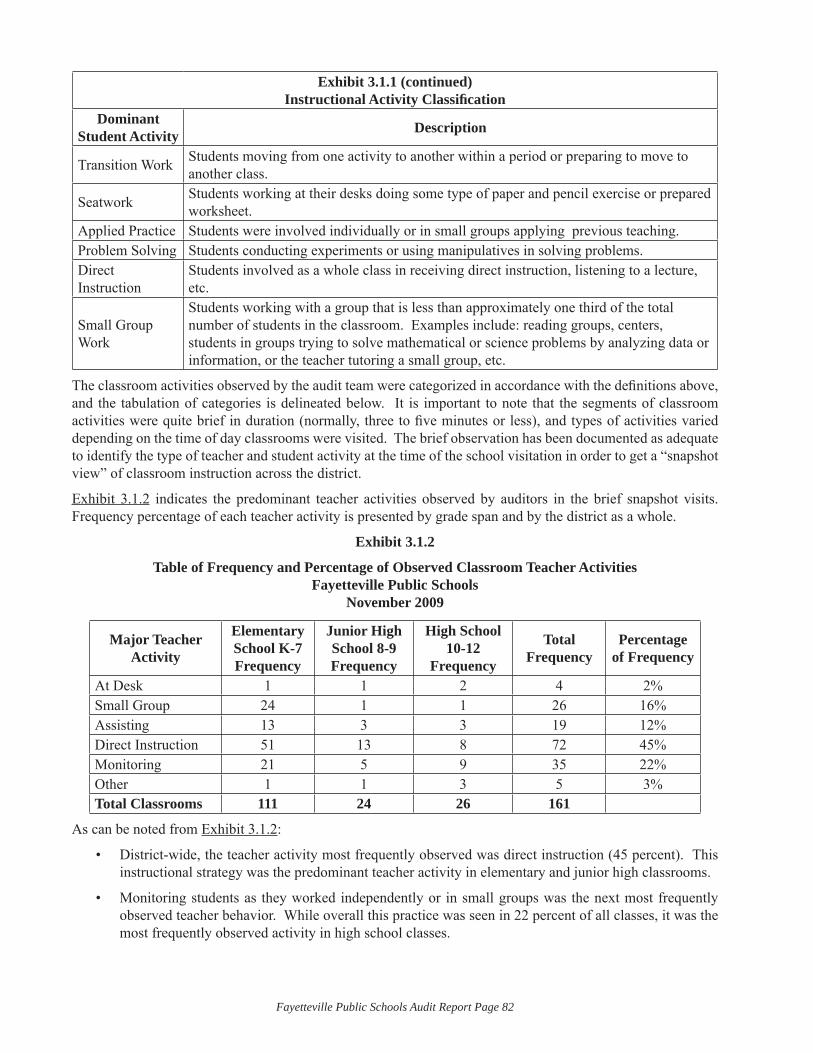
Fayetteville Public Schools Audit Report Page 82
Exhibit 3.1.1 (continued)Instructional Activity Classifi cation
Dominant Student Activity Description
Transition Work Students moving from one activity to another within a period or preparing to move to another class.
Seatwork Students working at their desks doing some type of paper and pencil exercise or prepared worksheet.
Applied Practice Students were involved individually or in small groups applying previous teaching.Problem Solving Students conducting experiments or using manipulatives in solving problems.Direct Instruction
Students involved as a whole class in receiving direct instruction, listening to a lecture, etc.
Small Group Work
Students working with a group that is less than approximately one third of the total number of students in the classroom. Examples include: reading groups, centers, students in groups trying to solve mathematical or science problems by analyzing data or information, or the teacher tutoring a small group, etc.
The classroom activities observed by the audit team were categorized in accordance with the defi nitions above, and the tabulation of categories is delineated below. It is important to note that the segments of classroom activities were quite brief in duration (normally, three to fi ve minutes or less), and types of activities varied depending on the time of day classrooms were visited. The brief observation has been documented as adequate to identify the type of teacher and student activity at the time of the school visitation in order to get a “snapshot view” of classroom instruction across the district.
Exhibit 3.1.2 indicates the predominant teacher activities observed by auditors in the brief snapshot visits. Frequency percentage of each teacher activity is presented by grade span and by the district as a whole.
Exhibit 3.1.2
Table of Frequency and Percentage of Observed Classroom Teacher ActivitiesFayetteville Public Schools
November 2009
Major Teacher Activity
Elementary School K-7 Frequency
Junior High School 8-9 Frequency
High School 10-12
Frequency
Total Frequency
Percentage of Frequency
At Desk 1 1 2 4 2%Small Group 24 1 1 26 16%Assisting 13 3 3 19 12%Direct Instruction 51 13 8 72 45%Monitoring 21 5 9 35 22%Other 1 1 3 5 3%Total Classrooms 111 24 26 161
As can be noted from Exhibit 3.1.2:
District-wide, the teacher activity most frequently observed was direct instruction (45 percent). This • instructional strategy was the predominant teacher activity in elementary and junior high classrooms.
Monitoring students as they worked independently or in small groups was the next most frequently • observed teacher behavior. While overall this practice was seen in 22 percent of all classes, it was the most frequently observed activity in high school classes.
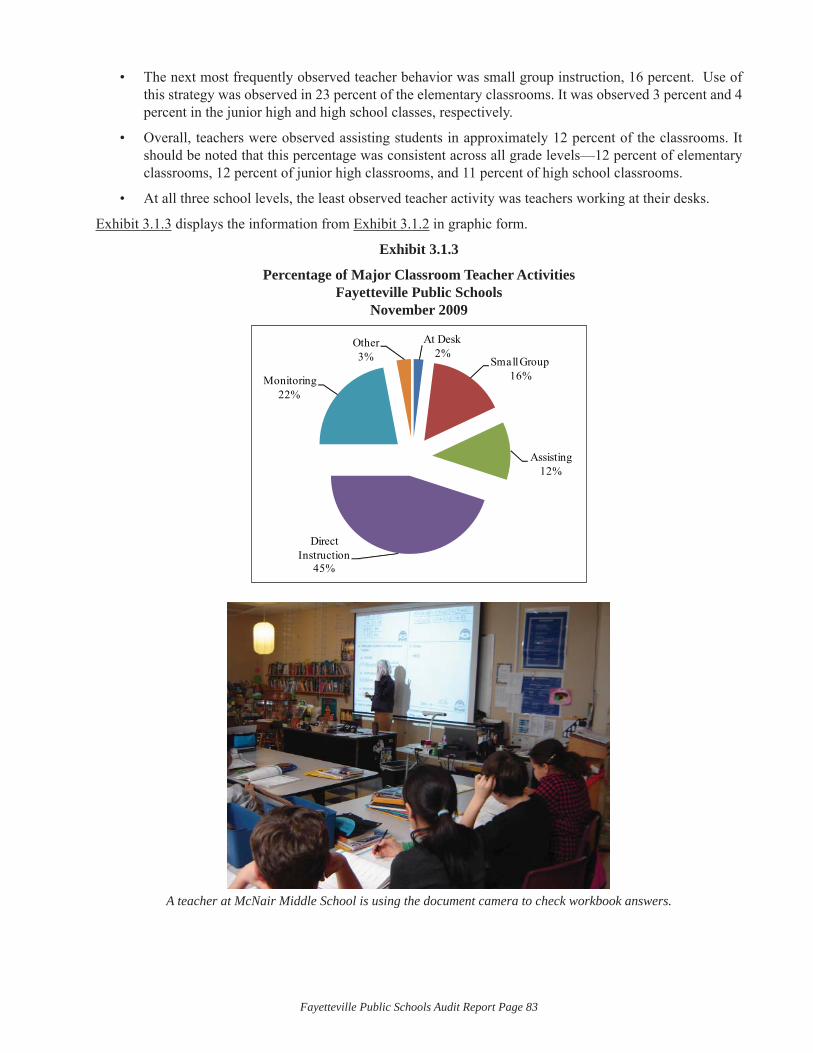
Fayetteville Public Schools Audit Report Page 83
The next most frequently observed teacher behavior was small group instruction, 16 percent. Use of • this strategy was observed in 23 percent of the elementary classrooms. It was observed 3 percent and 4 percent in the junior high and high school classes, respectively.
Overall, teachers were observed assisting students in approximately 12 percent of the classrooms. It • should be noted that this percentage was consistent across all grade levels—12 percent of elementary classrooms, 12 percent of junior high classrooms, and 11 percent of high school classrooms.
At all three school levels, the least observed teacher activity was teachers working at their desks. •
Exhibit 3.1.3 displays the information from Exhibit 3.1.2 in graphic form.
Exhibit 3.1.3
Percentage of Major Classroom Teacher ActivitiesFayetteville Public Schools
November 2009
At Desk2%
Small Group16%
Assisting12%
Direct Instruction
45%
Monitoring22%
Other3%
A teacher at McNair Middle School is using the document camera to check workbook answers.
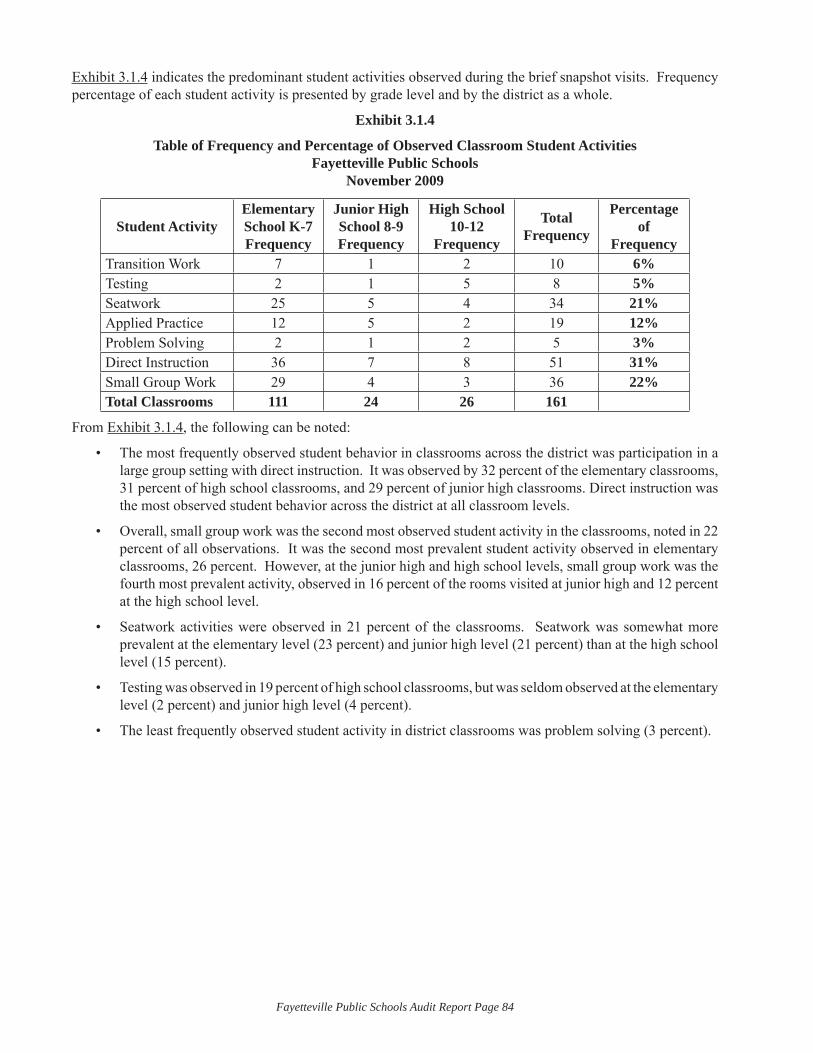
Fayetteville Public Schools Audit Report Page 84
Exhibit 3.1.4 indicates the predominant student activities observed during the brief snapshot visits. Frequency percentage of each student activity is presented by grade level and by the district as a whole.
Exhibit 3.1.4
Table of Frequency and Percentage of Observed Classroom Student ActivitiesFayetteville Public Schools
November 2009
Student ActivityElementary School K-7 Frequency
Junior High School 8-9 Frequency
High School 10-12
Frequency
Total Frequency
Percentage of
FrequencyTransition Work 7 1 2 10 6%Testing 2 1 5 8 5%Seatwork 25 5 4 34 21%Applied Practice 12 5 2 19 12%Problem Solving 2 1 2 5 3%Direct Instruction 36 7 8 51 31%Small Group Work 29 4 3 36 22%Total Classrooms 111 24 26 161
From Exhibit 3.1.4, the following can be noted:
The most frequently observed student behavior in classrooms across the district was participation in a • large group setting with direct instruction. It was observed by 32 percent of the elementary classrooms, 31 percent of high school classrooms, and 29 percent of junior high classrooms. Direct instruction was the most observed student behavior across the district at all classroom levels.
Overall, small group work was the second most observed student activity in the classrooms, noted in 22 • percent of all observations. It was the second most prevalent student activity observed in elementary classrooms, 26 percent. However, at the junior high and high school levels, small group work was the fourth most prevalent activity, observed in 16 percent of the rooms visited at junior high and 12 percent at the high school level.
Seatwork activities were observed in 21 percent of the classrooms. Seatwork was somewhat more • prevalent at the elementary level (23 percent) and junior high level (21 percent) than at the high school level (15 percent).
Testing was observed in 19 percent of high school classrooms, but was seldom observed at the elementary • level (2 percent) and junior high level (4 percent).
The least frequently observed student activity in district classrooms was problem solving (3 percent).•
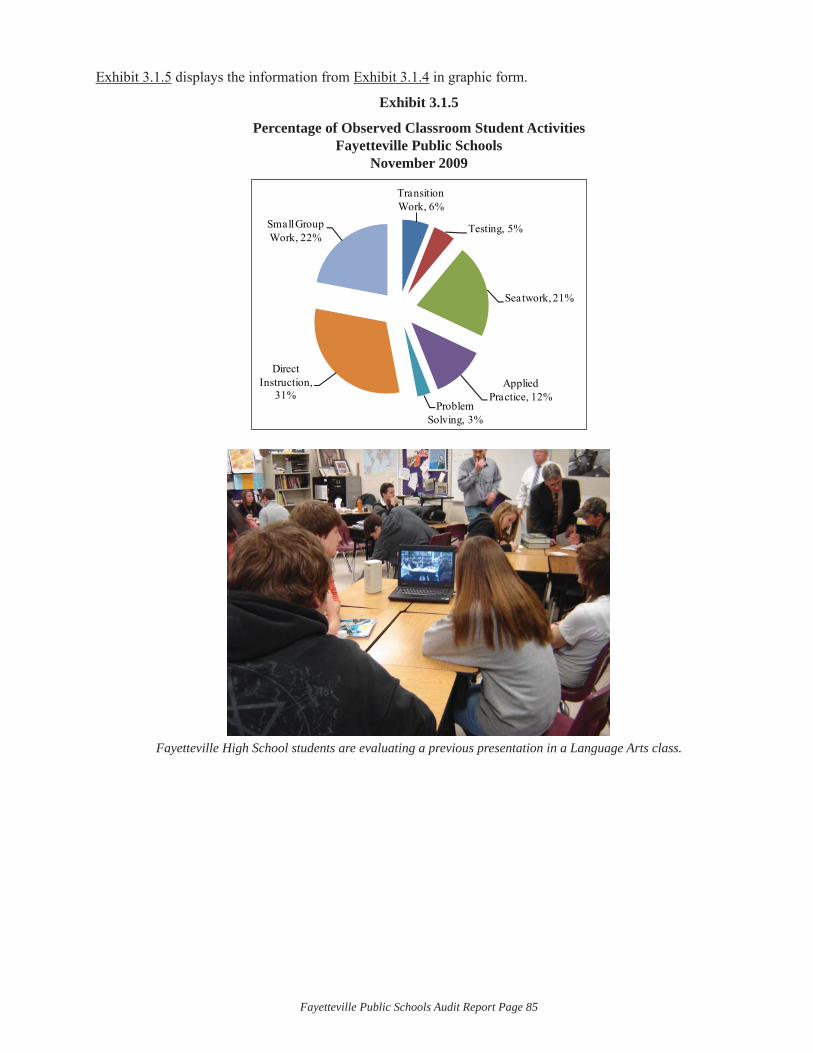
Fayetteville Public Schools Audit Report Page 85
Exhibit 3.1.5 displays the information from Exhibit 3.1.4 in graphic form.
Exhibit 3.1.5
Percentage of Observed Classroom Student ActivitiesFayetteville Public Schools
November 2009
Transition Work, 6%
Testing, 5%
Seatwork, 21%
Applied Practice, 12%
Problem Solving, 3%
Direct Instruction,
31%
Small Group Work, 22%
Fayetteville High School students are evaluating a previous presentation in a Language Arts class.
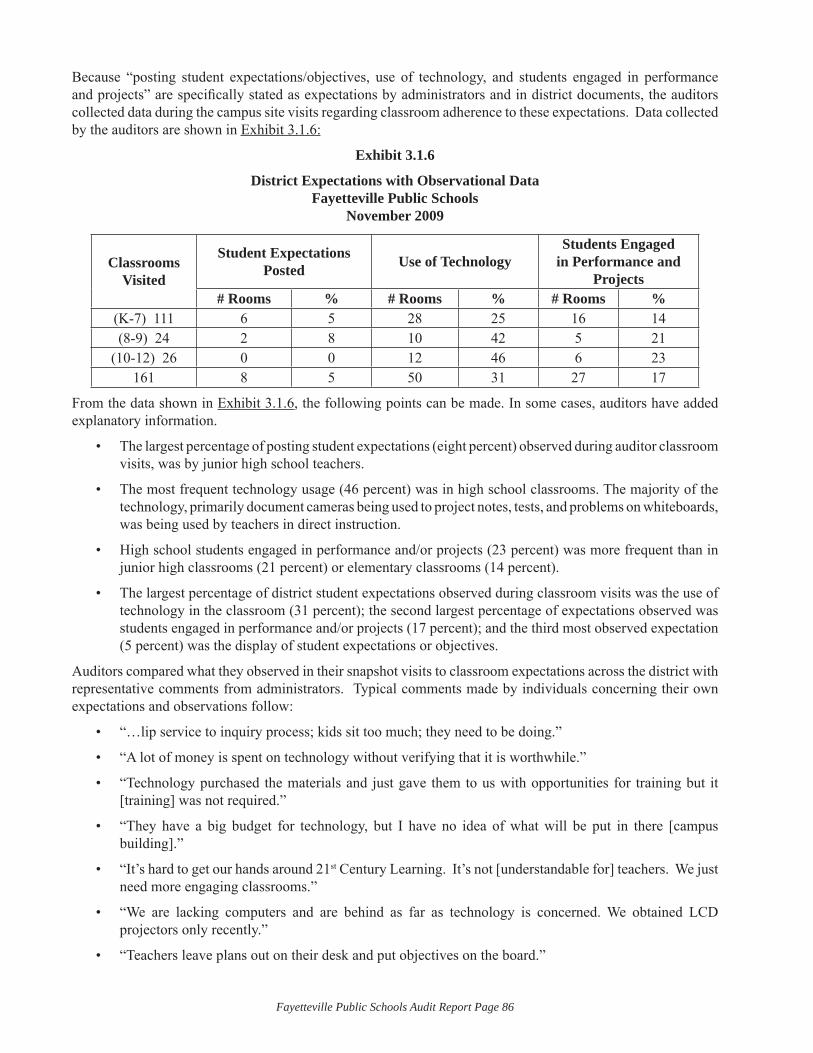
Fayetteville Public Schools Audit Report Page 86
Because “posting student expectations/objectives, use of technology, and students engaged in performance and projects” are specifi cally stated as expectations by administrators and in district documents, the auditors collected data during the campus site visits regarding classroom adherence to these expectations. Data collected by the auditors are shown in Exhibit 3.1.6:
Exhibit 3.1.6
District Expectations with Observational DataFayetteville Public Schools
November 2009
Classrooms Visited
Student Expectations Posted Use of Technology
Students Engaged in Performance and
Projects# Rooms % # Rooms % # Rooms %
(K-7) 111 6 5 28 25 16 14(8-9) 24 2 8 10 42 5 21
(10-12) 26 0 0 12 46 6 23161 8 5 50 31 27 17
From the data shown in Exhibit 3.1.6, the following points can be made. In some cases, auditors have added explanatory information.
The largest percentage of posting student expectations (eight percent) observed during auditor classroom • visits, was by junior high school teachers.
The most frequent technology usage (46 percent) was in high school classrooms. The majority of the • technology, primarily document cameras being used to project notes, tests, and problems on whiteboards, was being used by teachers in direct instruction.
High school students engaged in performance and/or projects (23 percent) was more frequent than in • junior high classrooms (21 percent) or elementary classrooms (14 percent).
The largest percentage of district student expectations observed during classroom visits was the use of • technology in the classroom (31 percent); the second largest percentage of expectations observed was students engaged in performance and/or projects (17 percent); and the third most observed expectation (5 percent) was the display of student expectations or objectives.
Auditors compared what they observed in their snapshot visits to classroom expectations across the district with representative comments from administrators. Typical comments made by individuals concerning their own expectations and observations follow:
“…lip service to inquiry process; kids sit too much; they need to be doing.”•
“A lot of money is spent on technology without verifying that it is worthwhile.”•
“Technology purchased the materials and just gave them to us with opportunities for training but it • [training] was not required.”
“They have a big budget for technology, but I have no idea of what will be put in there [campus • building].”
“It’s hard to get our hands around 21• st Century Learning. It’s not [understandable for] teachers. We just need more engaging classrooms.”
“We are lacking computers and are behind as far as technology is concerned. We obtained LCD • projectors only recently.”
“Teachers leave plans out on their desk and put objectives on the board.”•
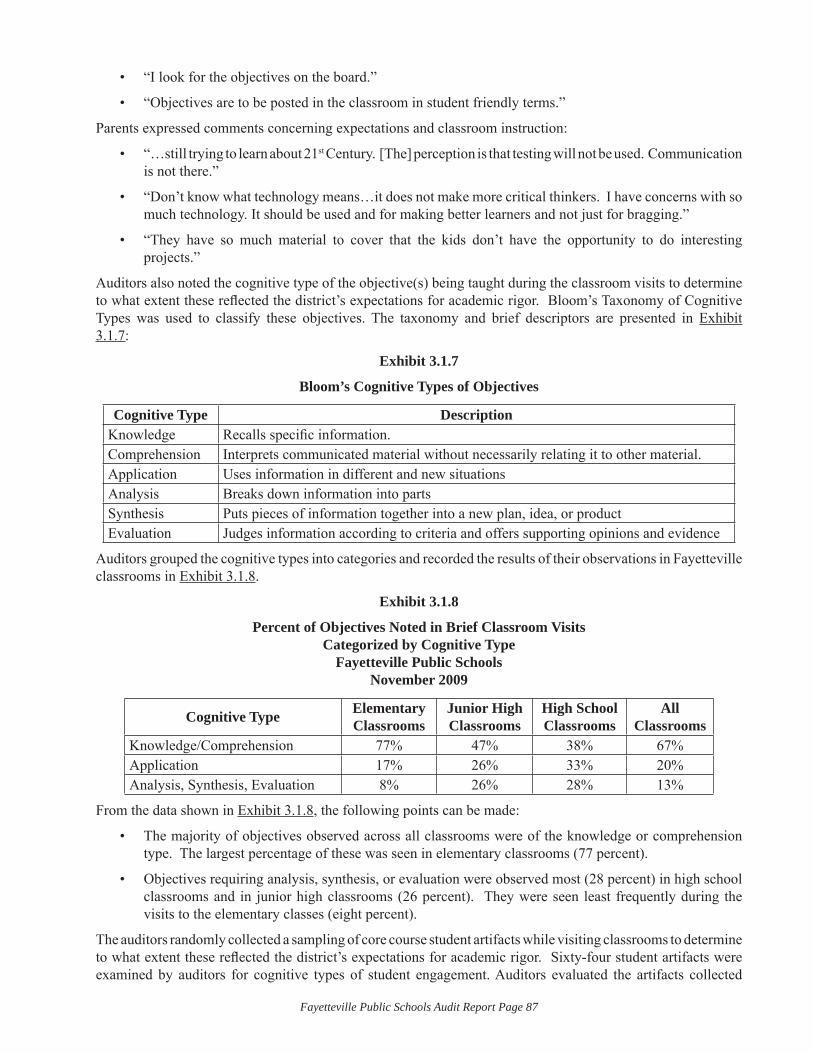
Fayetteville Public Schools Audit Report Page 87
“I look for the objectives on the board.”•
“Objectives are to be posted in the classroom in student friendly terms.”•
Parents expressed comments concerning expectations and classroom instruction:
“…still trying to learn about 21• st Century. [The] perception is that testing will not be used. Communication is not there.”
“Don’t know what technology means…it does not make more critical thinkers. I have concerns with so • much technology. It should be used and for making better learners and not just for bragging.”
“They have so much material to cover that the kids don’t have the opportunity to do interesting • projects.”
Auditors also noted the cognitive type of the objective(s) being taught during the classroom visits to determine to what extent these refl ected the district’s expectations for academic rigor. Bloom’s Taxonomy of Cognitive Types was used to classify these objectives. The taxonomy and brief descriptors are presented in Exhibit 3.1.7:
Exhibit 3.1.7
Bloom’s Cognitive Types of Objectives
Cognitive Type DescriptionKnowledge Recalls specifi c information.Comprehension Interprets communicated material without necessarily relating it to other material.Application Uses information in different and new situationsAnalysis Breaks down information into partsSynthesis Puts pieces of information together into a new plan, idea, or productEvaluation Judges information according to criteria and offers supporting opinions and evidence
Auditors grouped the cognitive types into categories and recorded the results of their observations in Fayetteville classrooms in Exhibit 3.1.8.
Exhibit 3.1.8
Percent of Objectives Noted in Brief Classroom Visits Categorized by Cognitive Type
Fayetteville Public SchoolsNovember 2009
Cognitive Type Elementary Classrooms
Junior High Classrooms
High School Classrooms
All Classrooms
Knowledge/Comprehension 77% 47% 38% 67%Application 17% 26% 33% 20%Analysis, Synthesis, Evaluation 8% 26% 28% 13%
From the data shown in Exhibit 3.1.8, the following points can be made:
The majority of objectives observed across all classrooms were of the knowledge or comprehension • type. The largest percentage of these was seen in elementary classrooms (77 percent).
Objectives requiring analysis, synthesis, or evaluation were observed most (28 percent) in high school • classrooms and in junior high classrooms (26 percent). They were seen least frequently during the visits to the elementary classes (eight percent).
The auditors randomly collected a sampling of core course student artifacts while visiting classrooms to determine to what extent these refl ected the district’s expectations for academic rigor. Sixty-four student artifacts were examined by auditors for cognitive types of student engagement. Auditors evaluated the artifacts collected

Fayetteville Public Schools Audit Report Page 88
during their classroom visits according to Bloom’s cognitive domains. When artifacts required more than one type of cognition, auditors classifi ed the cognitive domain based on the dominant activity or concepts.
Exhibit 3.1.9 summarizes the cognitive type of artifacts collected by auditors in core classrooms.
Exhibit 3.1.9
Analysis of Student Artifacts for Types of Cognition Required Using Bloom’s Taxonomy of Cognitive Domains
Fayetteville Public SchoolsNovember 2009
Grade Level Number of Artifacts
Knowledge and Comprehension Application
Analysis, Synthesis, and
EvaluationGrades K-7 34 20 9 5Grades 8-9 12 6 3 3Grades 10-12 18 9 5 4Totals 64 (100%) 35 (55%) 17 (27%) 12 (18%)Note: Because of rounding percents may not total 100 percent.Data Source: Sample of artifacts collected by auditors during classroom visits: Bloom’s Taxonomy of Cognitive Domains.
The following can be noted from Exhibit 3.1.9. In some cases, auditors have added explanatory information.
The number of artifacts collected at all grade levels was limited. In many classrooms students were • participating in whole group instruction or working in small group projects. In several classrooms, the auditors were present at the time designated for reading.
The majority of artifacts collected (55 percent) across all classroom levels were of the knowledge or • comprehension type. The largest percentage of these was seen at the elementary level (59 percent).
Student work requiring analysis, synthesis, or evaluation was seen most frequently at grades 8-9 (25 • percent) and grades 9-12 (22 percent).
At grade level and from campus to campus, many class artifacts were often entirely different in objectives • and content, refl ecting a lack of horizontal alignment across the district. However, at some campuses, grade level to grade level, many class artifacts were the same, refl ecting horizontal alignment on that particular campus.
Auditors compared what they observed in their snapshot visits to classrooms across the district with representative comments from board members and administrators. Typical of the comments made by individuals in these role groups about their own expectations and observations were the following:
“[FPS] needs more rigorous curriculum. [Curriculum] is worksheet driven [with] lots of teacher • direction.”
“We need rigor consistency—stop the fl avor of the day.”•
“We have horizontal alignment on this campus.”•
“We need strong vertical alignment—not sure what the barrier has been, but there has not been a system • established for ongoing collaboration. A lot is done informally, but not formally. When I came, I really expected alignment. [If we had it] we could move from good to great, but the curriculum needs to be aligned, rigidly aligned. It’s not about academic freedom, but student achievement.”
“Social studies is different on different sides of town.”•
“The mindset is that they [teachers] produce excellent results and they don’t need to change anything. • We have a huge pocket of students who are not engaged or motivated, but drop out.”
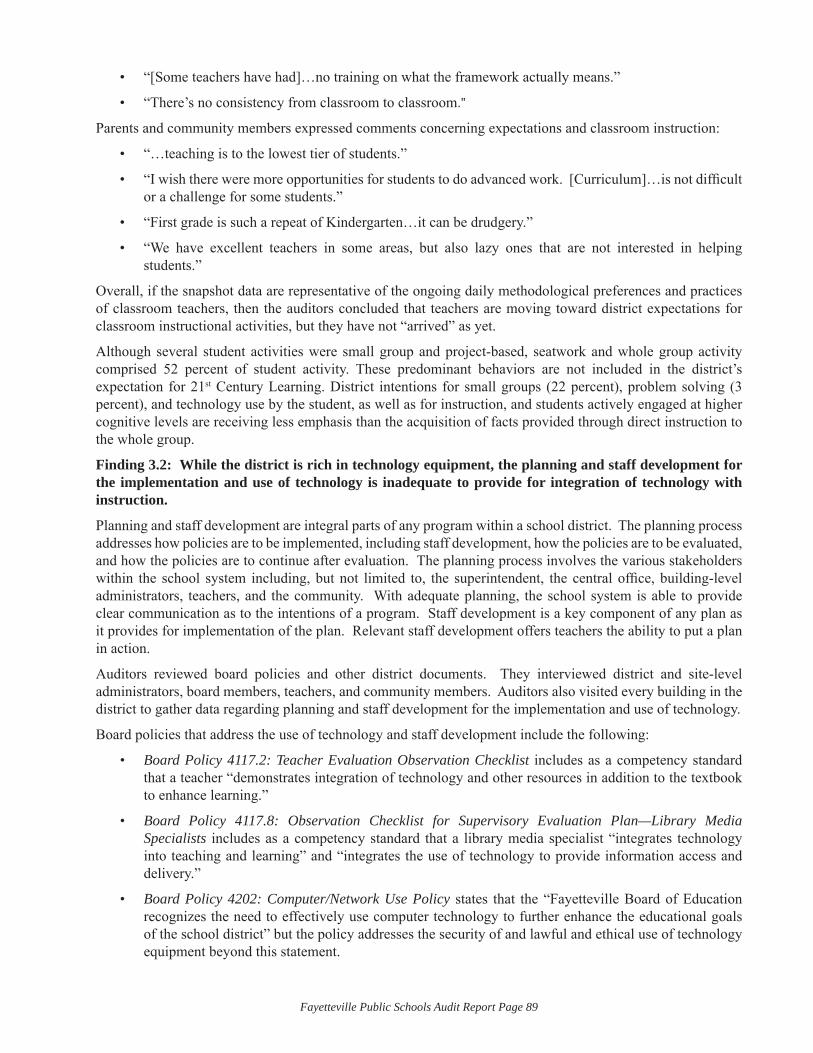
Fayetteville Public Schools Audit Report Page 89
“[Some teachers have had]…no training on what the framework actually means.”•
“There’s no consistency from classroom to classroom• .”
Parents and community members expressed comments concerning expectations and classroom instruction:
“…teaching is to the lowest tier of students.”•
“I wish there were more opportunities for students to do advanced work. [Curriculum]…is not diffi cult • or a challenge for some students.”
“First grade is such a repeat of Kindergarten…it can be drudgery.”•
“We have excellent teachers in some areas, but also lazy ones that are not interested in helping • students.”
Overall, if the snapshot data are representative of the ongoing daily methodological preferences and practices of classroom teachers, then the auditors concluded that teachers are moving toward district expectations for classroom instructional activities, but they have not “arrived” as yet.
Although several student activities were small group and project-based, seatwork and whole group activity comprised 52 percent of student activity. These predominant behaviors are not included in the district’s expectation for 21st Century Learning. District intentions for small groups (22 percent), problem solving (3 percent), and technology use by the student, as well as for instruction, and students actively engaged at higher cognitive levels are receiving less emphasis than the acquisition of facts provided through direct instruction to the whole group.
Finding 3.2: While the district is rich in technology equipment, the planning and staff development for the implementation and use of technology is inadequate to provide for integration of technology with instruction.
Planning and staff development are integral parts of any program within a school district. The planning process addresses how policies are to be implemented, including staff development, how the policies are to be evaluated, and how the policies are to continue after evaluation. The planning process involves the various stakeholders within the school system including, but not limited to, the superintendent, the central offi ce, building-level administrators, teachers, and the community. With adequate planning, the school system is able to provide clear communication as to the intentions of a program. Staff development is a key component of any plan as it provides for implementation of the plan. Relevant staff development offers teachers the ability to put a plan in action.
Auditors reviewed board policies and other district documents. They interviewed district and site-level administrators, board members, teachers, and community members. Auditors also visited every building in the district to gather data regarding planning and staff development for the implementation and use of technology.
Board policies that address the use of technology and staff development include the following:
Board Policy 4117.2: Teacher Evaluation Observation Checklist• includes as a competency standard that a teacher “demonstrates integration of technology and other resources in addition to the textbook to enhance learning.”
Board Policy 4117.8: Observation Checklist for Supervisory Evaluation Plan—Library Media • Specialists includes as a competency standard that a library media specialist “integrates technology into teaching and learning” and “integrates the use of technology to provide information access and delivery.”
Board Policy 4202: Computer/Network Use Policy• states that the “Fayetteville Board of Education recognizes the need to effectively use computer technology to further enhance the educational goals of the school district” but the policy addresses the security of and lawful and ethical use of technology equipment beyond this statement.
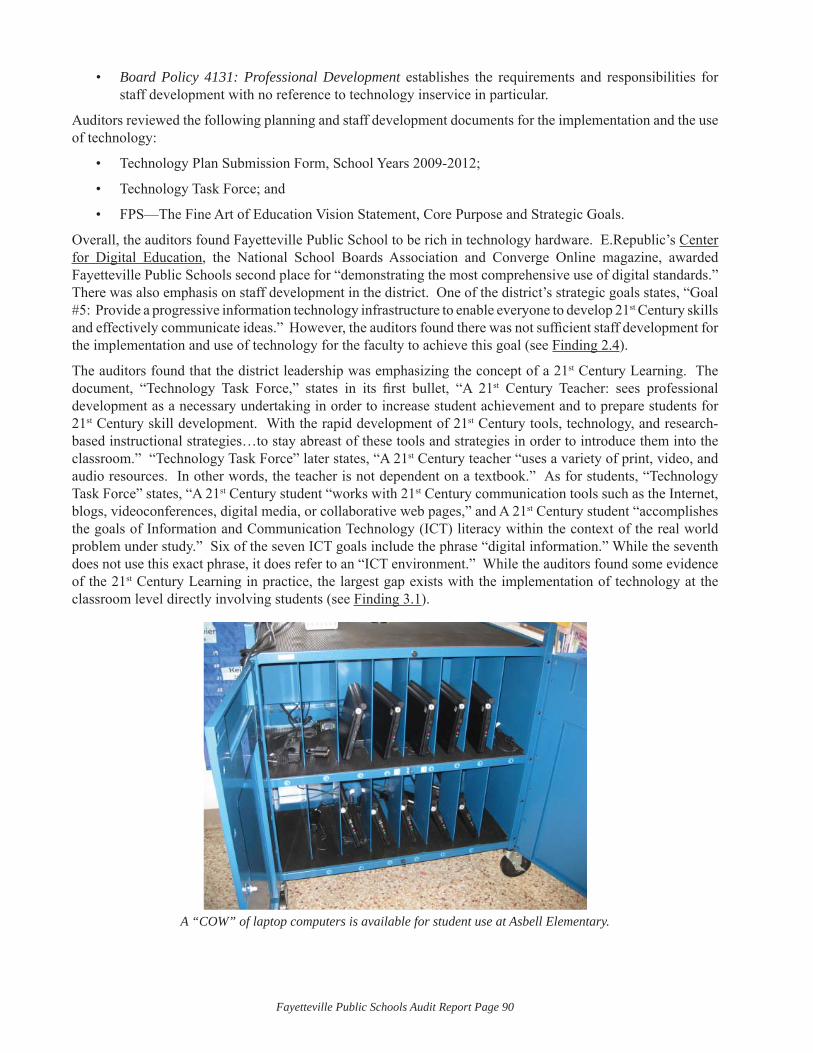
Fayetteville Public Schools Audit Report Page 90
Board Policy 4131: Professional Development• establishes the requirements and responsibilities for staff development with no reference to technology inservice in particular.
Auditors reviewed the following planning and staff development documents for the implementation and the use of technology:
Technology Plan Submission Form, School Years 2009-2012;•
Technology Task Force; and•
FPS—The Fine Art of Education Vision Statement, Core Purpose and Strategic Goals.•
Overall, the auditors found Fayetteville Public School to be rich in technology hardware. E.Republic’s Center for Digital Education, the National School Boards Association and Converge Online magazine, awarded Fayetteville Public Schools second place for “demonstrating the most comprehensive use of digital standards.” There was also emphasis on staff development in the district. One of the district’s strategic goals states, “Goal #5: Provide a progressive information technology infrastructure to enable everyone to develop 21st Century skills and effectively communicate ideas.” However, the auditors found there was not suffi cient staff development for the implementation and use of technology for the faculty to achieve this goal (see Finding 2.4).
The auditors found that the district leadership was emphasizing the concept of a 21st Century Learning. The document, “Technology Task Force,” states in its fi rst bullet, “A 21st Century Teacher: sees professional development as a necessary undertaking in order to increase student achievement and to prepare students for 21st Century skill development. With the rapid development of 21st Century tools, technology, and research-based instructional strategies…to stay abreast of these tools and strategies in order to introduce them into the classroom.” “Technology Task Force” later states, “A 21st Century teacher “uses a variety of print, video, and audio resources. In other words, the teacher is not dependent on a textbook.” As for students, “Technology Task Force” states, “A 21st Century student “works with 21st Century communication tools such as the Internet, blogs, videoconferences, digital media, or collaborative web pages,” and A 21st Century student “accomplishes the goals of Information and Communication Technology (ICT) literacy within the context of the real world problem under study.” Six of the seven ICT goals include the phrase “digital information.” While the seventh does not use this exact phrase, it does refer to an “ICT environment.” While the auditors found some evidence of the 21st Century Learning in practice, the largest gap exists with the implementation of technology at the classroom level directly involving students (see Finding 3.1).
A “COW” of laptop computers is available for student use at Asbell Elementary.
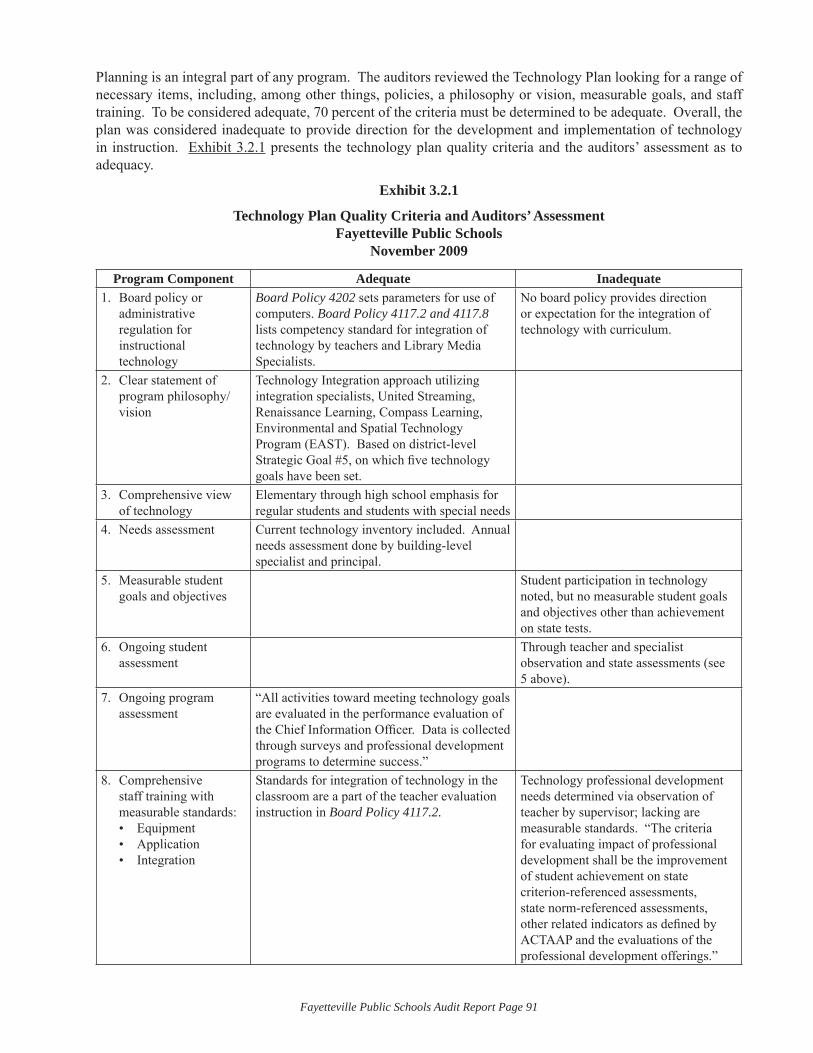
Fayetteville Public Schools Audit Report Page 91
Planning is an integral part of any program. The auditors reviewed the Technology Plan looking for a range of necessary items, including, among other things, policies, a philosophy or vision, measurable goals, and staff training. To be considered adequate, 70 percent of the criteria must be determined to be adequate. Overall, the plan was considered inadequate to provide direction for the development and implementation of technology in instruction. Exhibit 3.2.1 presents the technology plan quality criteria and the auditors’ assessment as to adequacy.
Exhibit 3.2.1
Technology Plan Quality Criteria and Auditors’ AssessmentFayetteville Public Schools
November 2009
Program Component Adequate InadequateBoard policy or 1. administrative regulation for instructional technology
Board Policy 4202 sets parameters for use of computers. Board Policy 4117.2 and 4117.8 lists competency standard for integration of technology by teachers and Library Media Specialists.
No board policy provides direction or expectation for the integration of technology with curriculum.
Clear statement of 2. program philosophy/vision
Technology Integration approach utilizing integration specialists, United Streaming, Renaissance Learning, Compass Learning, Environmental and Spatial Technology Program (EAST). Based on district-level Strategic Goal #5, on which fi ve technology goals have been set.
Comprehensive view 3. of technology
Elementary through high school emphasis for regular students and students with special needs
Needs assessment4. Current technology inventory included. Annual needs assessment done by building-level specialist and principal.
Measurable student 5. goals and objectives
Student participation in technology noted, but no measurable student goals and objectives other than achievement on state tests.
Ongoing student 6. assessment
Through teacher and specialist observation and state assessments (see 5 above).
Ongoing program 7. assessment
“All activities toward meeting technology goals are evaluated in the performance evaluation of the Chief Information Offi cer. Data is collected through surveys and professional development programs to determine success.”
Comprehensive 8. staff training with measurable standards:
Equipment• Application• Integration•
Standards for integration of technology in the classroom are a part of the teacher evaluation instruction in Board Policy 4117.2.
Technology professional development needs determined via observation of teacher by supervisor; lacking are measurable standards. “The criteria for evaluating impact of professional development shall be the improvement of student achievement on state criterion-referenced assessments, state norm-referenced assessments, other related indicators as defi ned by ACTAAP and the evaluations of the professional development offerings.”
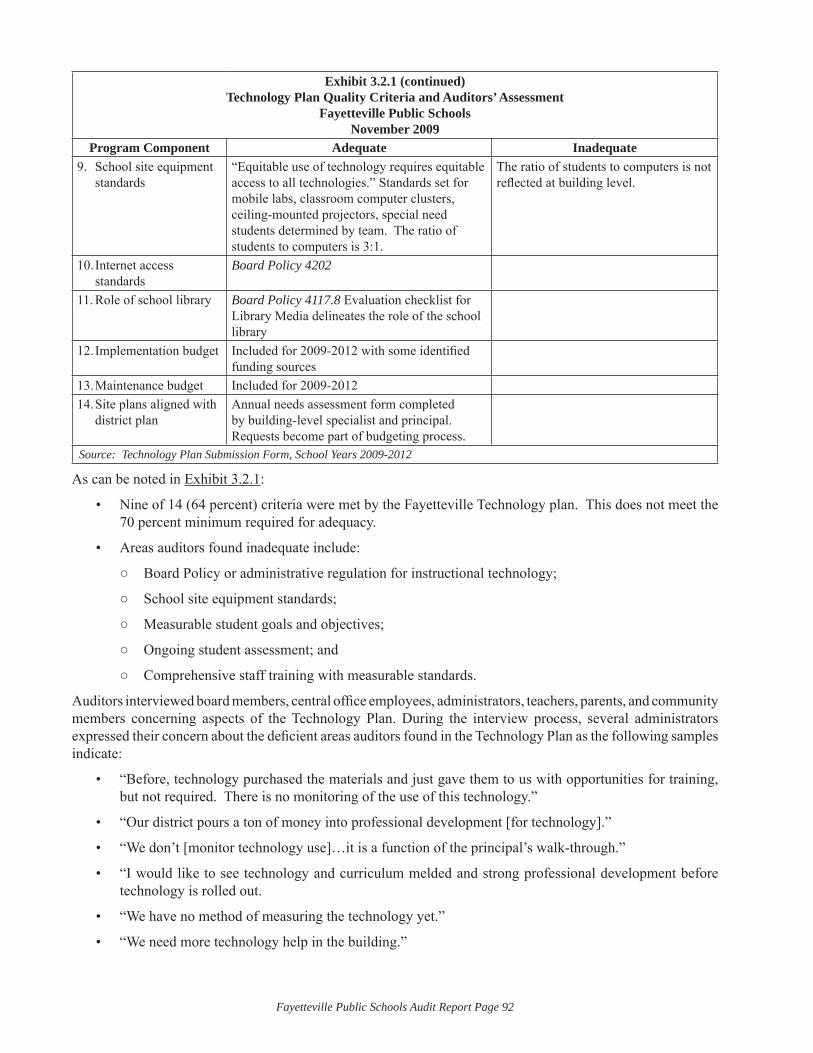
Fayetteville Public Schools Audit Report Page 92
Exhibit 3.2.1 (continued)Technology Plan Quality Criteria and Auditors’ Assessment
Fayetteville Public SchoolsNovember 2009
Program Component Adequate InadequateSchool site equipment 9. standards
“Equitable use of technology requires equitable access to all technologies.” Standards set for mobile labs, classroom computer clusters, ceiling-mounted projectors, special need students determined by team. The ratio of students to computers is 3:1.
The ratio of students to computers is not refl ected at building level.
Internet access 10. standards
Board Policy 4202
Role of school library11. Board Policy 4117.8 Evaluation checklist for Library Media delineates the role of the school library
Implementation budget12. Included for 2009-2012 with some identifi ed funding sources
Maintenance budget13. Included for 2009-2012Site plans aligned with 14. district plan
Annual needs assessment form completed by building-level specialist and principal. Requests become part of budgeting process.
Source: Technology Plan Submission Form, School Years 2009-2012
As can be noted in Exhibit 3.2.1:
Nine of 14 (64 percent) criteria were met by the Fayetteville Technology plan. This does not meet the • 70 percent minimum required for adequacy.
Areas auditors found inadequate include:•
Board Policy or administrative regulation for instructional technology; ○
School site equipment standards; ○
Measurable student goals and objectives; ○
Ongoing student assessment; and ○
Comprehensive staff training with measurable standards. ○
Auditors interviewed board members, central offi ce employees, administrators, teachers, parents, and community members concerning aspects of the Technology Plan. During the interview process, several administrators expressed their concern about the defi cient areas auditors found in the Technology Plan as the following samples indicate:
“Before, technology purchased the materials and just gave them to us with opportunities for training, • but not required. There is no monitoring of the use of this technology.”
“Our district pours a ton of money into professional development [for technology].”•
“We don’t [monitor technology use]…it is a function of the principal’s walk-through.”•
“I would like to see technology and curriculum melded and strong professional development before • technology is rolled out.
“We have no method of measuring the technology yet.”•
“We need more technology help in the building.”•

Fayetteville Public Schools Audit Report Page 93
Teachers also expressed concerns about technology planning, implementation, and assessment of its effectiveness as the following comments indicate:
“A lot of money is spent on technology without verifying that it is worthwhile; more is needed at the • high school.”
“[The] district does a good job with trying to give us technology resources, but not at the high school. • We only have two computer labs and two mobile carts for 1,900 students.”
“There is never any follow-up workshop to see how you are integrating that into the classroom. • There is never enough time to make things happen. There is no follow-through with the professional development.”
“We need more technology help in the building.”•
A community member stated he/she has “…concerns with so much technology…is it being used and making better learners and not just bragging?”
An Honors Geometry teacher is using an ELMO at Woodland Junior High—a common observation across the district.
Auditors conducted site visits to all buildings in the system to determine the extent to which technology was being implemented in the classroom. The idea that technology should be present arose from the district’s request that curriculum management audit address the use of technology in the classrooms. Several administrators expressed what auditors should expect to fi nd regarding technology use in the classrooms as the following comments indicate:
“Expect to see a projector, ELMO, computer…[it] depends on the level of teacher on what is used.”•
“[You] will see 30 percent of teachers really using technology.”•
“Top rank. It is being used and it is being used to its fullest extent. Digital projectors in every room, • clickers, fl ip cameras.”
“Kids getting access to the tools and creating what they already know how to use.”•
“SmartBoards, document cameras used daily, but may not be using to the potential of the equipment.”•
“Every teacher has their own laptop, projector and screen, and additional needs are met, too. A lot of • dollars are spent to make sure that happens.”
“Each building has tech specialists that are expected to provide tech training.”•
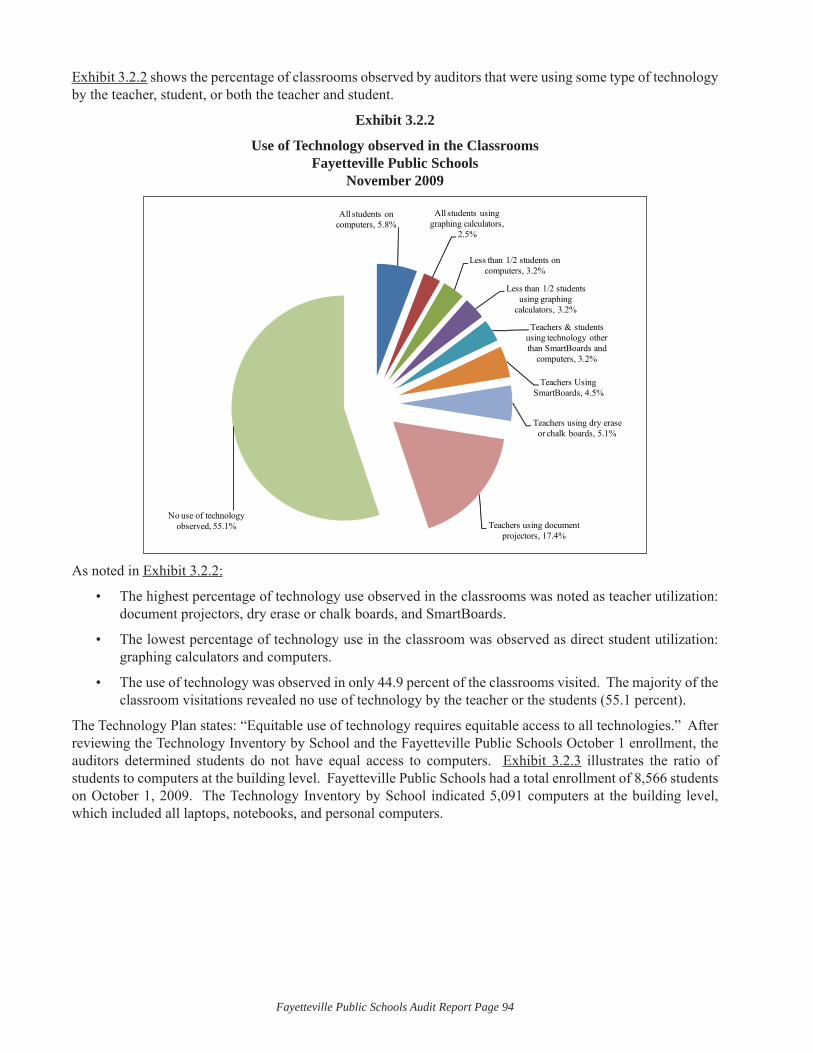
Fayetteville Public Schools Audit Report Page 94
Exhibit 3.2.2 shows the percentage of classrooms observed by auditors that were using some type of technology by the teacher, student, or both the teacher and student.
Exhibit 3.2.2
Use of Technology observed in the ClassroomsFayetteville Public Schools
November 2009
All students on computers, 5.8%
All students using graphing calculators,
2.5%
Less than 1/2 students on computers, 3.2%
Less than 1/2 students using graphing
calculators, 3.2%
Teachers & students using technology other than SmartBoards and
computers, 3.2%
Teachers Using SmartBoards, 4.5%
Teachers using dry erase or chalk boards, 5.1%
Teachers using document projectors, 17.4%
No use of technology observed, 55.1%
As noted in Exhibit 3.2.2:
The highest percentage of technology use observed in the classrooms was noted as teacher utilization: • document projectors, dry erase or chalk boards, and SmartBoards.
The lowest percentage of technology use in the classroom was observed as direct student utilization: • graphing calculators and computers.
The use of technology was observed in only 44.9 percent of the classrooms visited. The majority of the • classroom visitations revealed no use of technology by the teacher or the students (55.1 percent).
The Technology Plan states: “Equitable use of technology requires equitable access to all technologies.” After reviewing the Technology Inventory by School and the Fayetteville Public Schools October 1 enrollment, the auditors determined students do not have equal access to computers. Exhibit 3.2.3 illustrates the ratio of students to computers at the building level. Fayetteville Public Schools had a total enrollment of 8,566 students on October 1, 2009. The Technology Inventory by School indicated 5,091 computers at the building level, which included all laptops, notebooks, and personal computers.
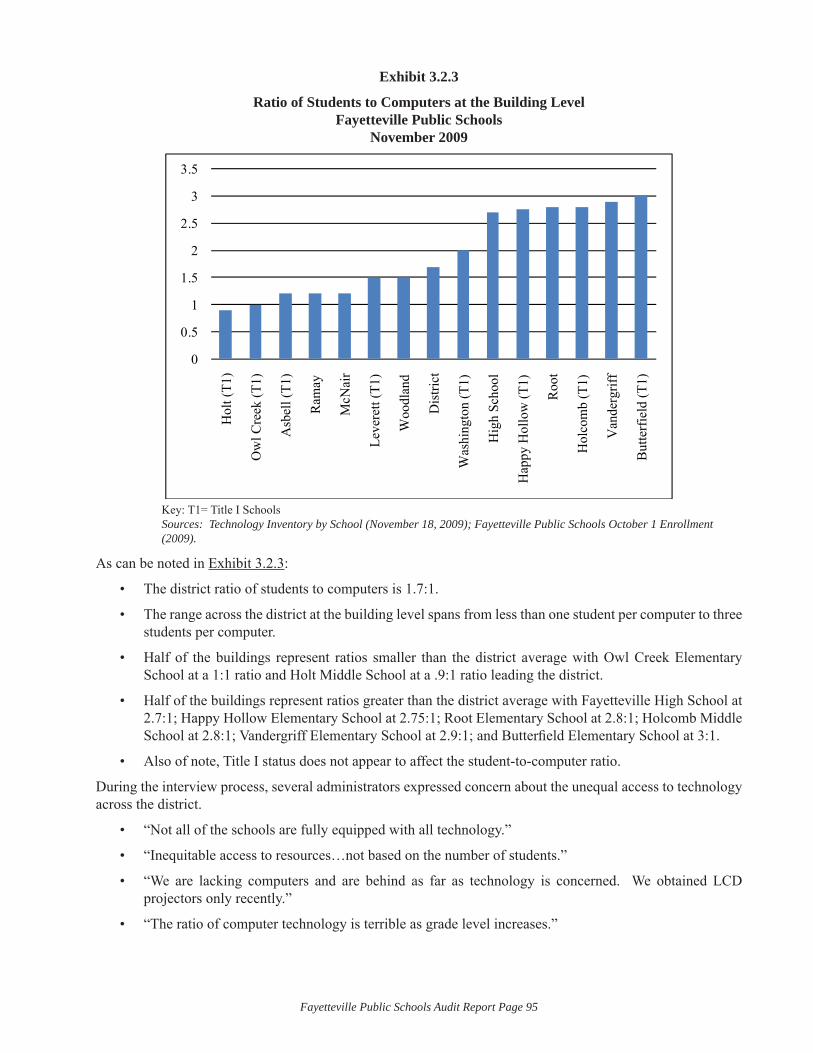
Fayetteville Public Schools Audit Report Page 95
Exhibit 3.2.3
Ratio of Students to Computers at the Building LevelFayetteville Public Schools
November 2009
0
0.5
1
1.5
2
2.5
3
3.5
Hol
t (T1
)
Ow
l Cre
ek (T
1)
Asb
ell (
T1)
Ram
ay
McN
air
Leve
rett
(T1)
Woo
dlan
d
Dis
trict
Was
hing
ton
(T1)
Hig
h Sc
hool
Hap
py H
ollo
w (T
1)
Roo
t
Hol
com
b (T
1)
Van
derg
riff
But
terf
ield
(T1)
Key: T1= Title I SchoolsSources: Technology Inventory by School (November 18, 2009); Fayetteville Public Schools October 1 Enrollment (2009).
As can be noted in Exhibit 3.2.3:
The district ratio of students to computers is 1.7:1.•
The range across the district at the building level spans from less than one student per computer to three • students per computer.
Half of the buildings represent ratios smaller than the district average with Owl Creek Elementary • School at a 1:1 ratio and Holt Middle School at a .9:1 ratio leading the district.
Half of the buildings represent ratios greater than the district average with Fayetteville High School at • 2.7:1; Happy Hollow Elementary School at 2.75:1; Root Elementary School at 2.8:1; Holcomb Middle School at 2.8:1; Vandergriff Elementary School at 2.9:1; and Butterfi eld Elementary School at 3:1.
Also of note, Title I status does not appear to affect the student-to-computer ratio.•
During the interview process, several administrators expressed concern about the unequal access to technology across the district.
“Not all of the schools are fully equipped with all technology.”•
“Inequitable access to resources…not based on the number of students.”•
“We are lacking computers and are behind as far as technology is concerned. We obtained LCD • projectors only recently.”
“The ratio of computer technology is terrible as grade level increases.”•
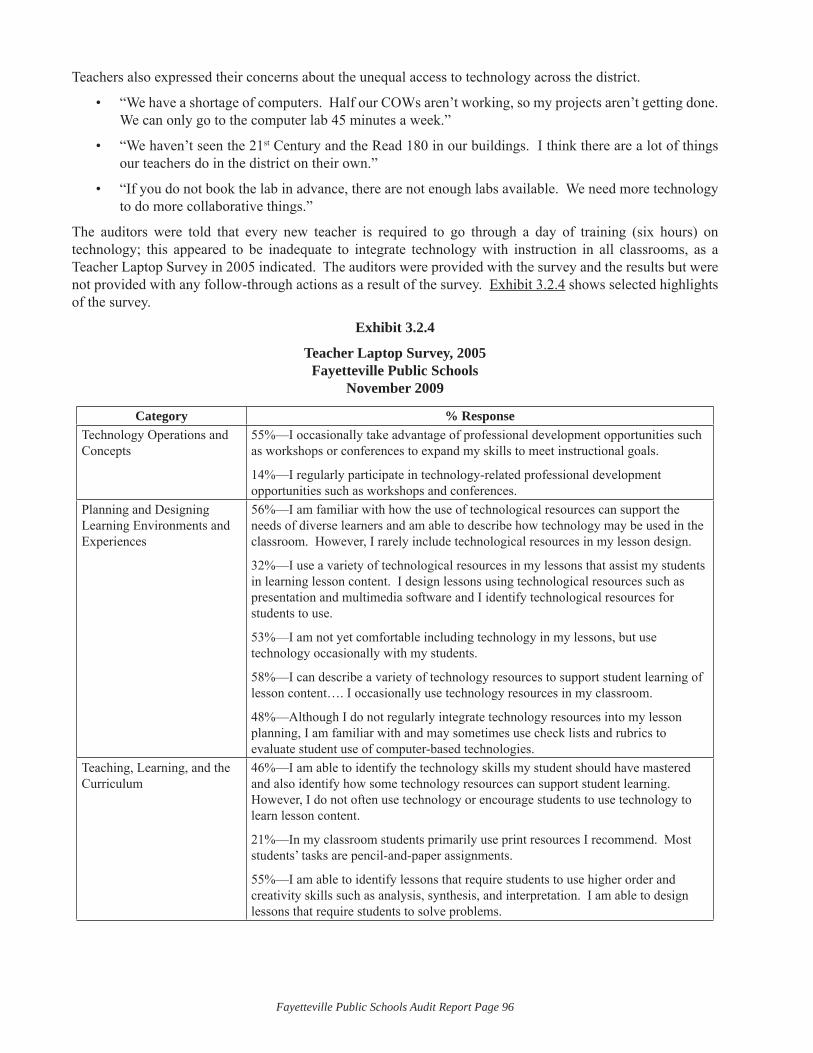
Fayetteville Public Schools Audit Report Page 96
Teachers also expressed their concerns about the unequal access to technology across the district.
“We have a shortage of computers. Half our COWs aren’t working, so my projects aren’t getting done. • We can only go to the computer lab 45 minutes a week.”
“We haven’t seen the 21• st Century and the Read 180 in our buildings. I think there are a lot of things our teachers do in the district on their own.”
“If you do not book the lab in advance, there are not enough labs available. We need more technology • to do more collaborative things.”
The auditors were told that every new teacher is required to go through a day of training (six hours) on technology; this appeared to be inadequate to integrate technology with instruction in all classrooms, as a Teacher Laptop Survey in 2005 indicated. The auditors were provided with the survey and the results but were not provided with any follow-through actions as a result of the survey. Exhibit 3.2.4 shows selected highlights of the survey.
Exhibit 3.2.4
Teacher Laptop Survey, 2005Fayetteville Public Schools
November 2009
Category % ResponseTechnology Operations and Concepts
55%—I occasionally take advantage of professional development opportunities such as workshops or conferences to expand my skills to meet instructional goals.
14%—I regularly participate in technology-related professional development opportunities such as workshops and conferences.
Planning and Designing Learning Environments and Experiences
56%—I am familiar with how the use of technological resources can support the needs of diverse learners and am able to describe how technology may be used in the classroom. However, I rarely include technological resources in my lesson design.
32%—I use a variety of technological resources in my lessons that assist my students in learning lesson content. I design lessons using technological resources such as presentation and multimedia software and I identify technological resources for students to use.
53%—I am not yet comfortable including technology in my lessons, but use technology occasionally with my students.
58%—I can describe a variety of technology resources to support student learning of lesson content…. I occasionally use technology resources in my classroom.
48%—Although I do not regularly integrate technology resources into my lesson planning, I am familiar with and may sometimes use check lists and rubrics to evaluate student use of computer-based technologies.
Teaching, Learning, and the Curriculum
46%—I am able to identify the technology skills my student should have mastered and also identify how some technology resources can support student learning. However, I do not often use technology or encourage students to use technology to learn lesson content.
21%—In my classroom students primarily use print resources I recommend. Most students’ tasks are pencil-and-paper assignments.
55%—I am able to identify lessons that require students to use higher order and creativity skills such as analysis, synthesis, and interpretation. I am able to design lessons that require students to solve problems.
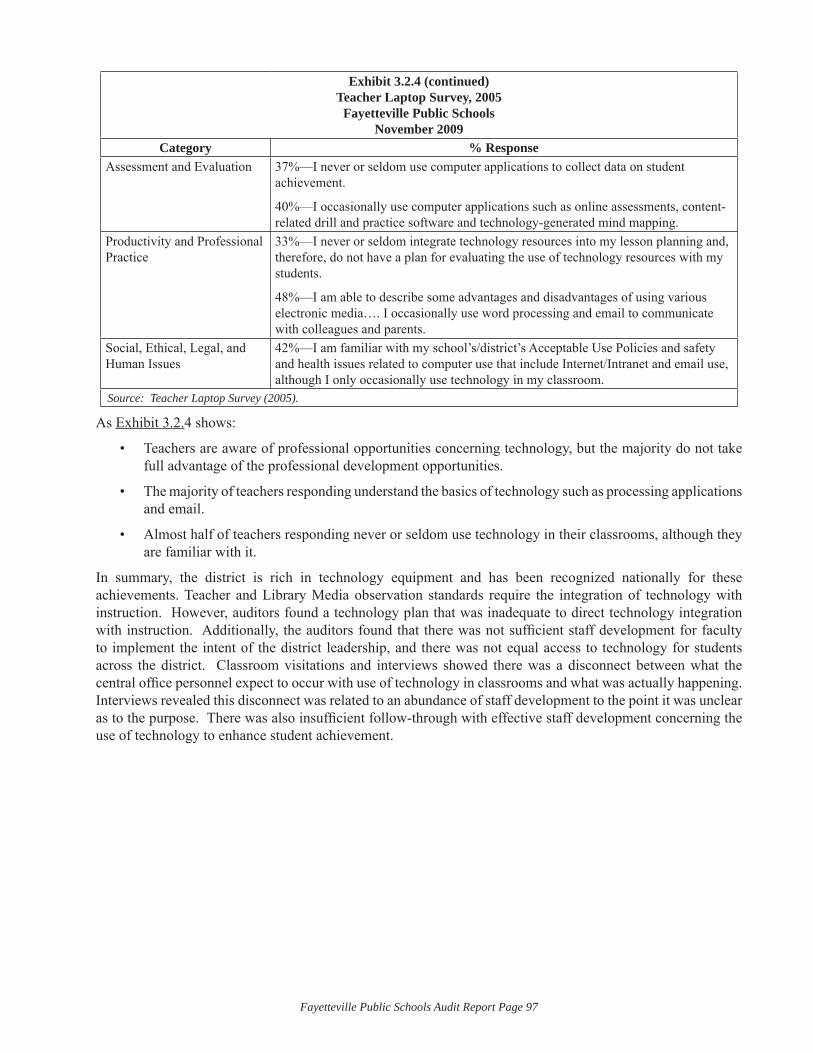
Fayetteville Public Schools Audit Report Page 97
Exhibit 3.2.4 (continued)Teacher Laptop Survey, 2005
Fayetteville Public SchoolsNovember 2009
Category % ResponseAssessment and Evaluation 37%—I never or seldom use computer applications to collect data on student
achievement.
40%—I occasionally use computer applications such as online assessments, content-related drill and practice software and technology-generated mind mapping.
Productivity and Professional Practice
33%—I never or seldom integrate technology resources into my lesson planning and, therefore, do not have a plan for evaluating the use of technology resources with my students.
48%—I am able to describe some advantages and disadvantages of using various electronic media…. I occasionally use word processing and email to communicate with colleagues and parents.
Social, Ethical, Legal, and Human Issues
42%—I am familiar with my school’s/district’s Acceptable Use Policies and safety and health issues related to computer use that include Internet/Intranet and email use, although I only occasionally use technology in my classroom.
Source: Teacher Laptop Survey (2005).
As Exhibit 3.2.4 shows:
Teachers are aware of professional opportunities concerning technology, but the majority do not take • full advantage of the professional development opportunities.
The majority of teachers responding understand the basics of technology such as processing applications • and email.
Almost half of teachers responding never or seldom use technology in their classrooms, although they • are familiar with it.
In summary, the district is rich in technology equipment and has been recognized nationally for these achievements. Teacher and Library Media observation standards require the integration of technology with instruction. However, auditors found a technology plan that was inadequate to direct technology integration with instruction. Additionally, the auditors found that there was not suffi cient staff development for faculty to implement the intent of the district leadership, and there was not equal access to technology for students across the district. Classroom visitations and interviews showed there was a disconnect between what the central offi ce personnel expect to occur with use of technology in classrooms and what was actually happening. Interviews revealed this disconnect was related to an abundance of staff development to the point it was unclear as to the purpose. There was also insuffi cient follow-through with effective staff development concerning the use of technology to enhance student achievement.

Fayetteville Public Schools Audit Report Page 98
Fayetteville Public Schools Audit Report Page 99
STANDARD 4: The School District Uses the Results from System-Designed and/or -Adopted Assessments to Adjust, Improve, or Terminate Ineffective Practices or Programs.A school system meeting this audit standard has designed a comprehensive system of assessment/testing and uses valid measurement tools that indicate how well its students are achieving designated priority learning goals and objectives. Common indicators are:
A formative and summative assessment system linked to a clear rationale in board policy;•
Knowledge, local validation, and use of current curricular and program assessment best practices;•
Use of a student and program assessment plan that provides for diverse assessment strategies for varied • purposes at all levels—district, school, and classroom;
A way to provide feedback to the teaching and administrative staffs regarding how classroom instruction • may be evaluated and subsequently improved;
A timely and relevant data base upon which to analyze important trends in student achievement;•
A vehicle to examine how well specifi c programs are actually producing desired learner outcomes or • results;
A data base to compare the strengths and weaknesses of various programs and program alternatives, as • well as to engage in equity analysis;
A data base to modify or terminate ineffective educational programs;•
A method/means to relate to a programmatic budget and enable the school system to engage in cost-• benefi t analysis; and
Organizational data gathered and used to continually improve system functions.•
A school district meeting this audit standard has a full range of formal and informal assessment tools that provide program information relevant to decision making at classroom, building (principals and school-site councils), system, and board levels.
A school system meeting this audit standard has taken steps to ensure that the full range of its programs is systematically and regularly examined. Assessment data have been matched to program objectives and are used in decision making.
What the Auditors Expected to Find in the Fayetteville Public Schools:
The auditors expected to fi nd a comprehensive assessment program for all aspects of the curriculum, pre-K through grade 12, which:
Was keyed to a valid, offi cially adopted, and comprehensive set of goals/objectives of the school • district;
Was used extensively at the site level to engage in program review, analysis, evaluation, and • improvement;
Was used by the policy-making groups in the system and the community to engage in specifi c policy • review for validity and accuracy;
Was the foci and basis of formulating short- and long-range plans for continual improvement;•
Was used to establish costs and select needed curriculum alternatives; and•
Was publicly reported on a regular basis in terms that were understood by key stakeholders in the • community.
Fayetteville Public Schools Audit Report Page 100
Overview of What the Auditors Found in the Fayetteville Public Schools
This section is an overview of the fi ndings that follow in the area of Standard Four. Details follow within separate fi ndings.
There was no comprehensive system-wide planning process for generating feedback regarding student assessment or program evaluation. However, many of the attributes of planning for feedback that auditors look for on a system-wide basis are present on a smaller scale in the elementary schools for assessment of literacy and mathematics, and teachers in the elementary schools are using test data effectively to plan literacy and math instruction. In grades 6–12, there is no district-wide guidance for assessment; decisions about using assessment data to support instructional choices are made by individual teachers or building principals.
Auditors found that only a fraction of the courses in the district is formally assessed with testing instruments that are standardized across the district and required for all students in the course or grade. Thus, the district has not provided teachers and administrators with reliable district-wide feedback on student performance. In addition, members of the wider community of Fayetteville and the state of Arkansas must make judgments about the system’s total effectiveness from feedback on only a small portion of the district’s work.
Fayetteville’s schools have a reputation for strong academic performance, and that reputation is supported by an examination of Fayetteville’s test scores as a whole district. However, different school buildings show substantial differences in their test scores, as do different demographic groups of students. Students in certain elementary schools and demographic groups have unequal opportunities to master the knowledge and skills of the curriculum than their peers in other schools or demographic groups.
The district does not have a plan for evaluating instructional programs. The use of data for systemic decision making is an emerging practice. The few program evaluations that have been conducted do not contain the elements needed to help administrators make informed decisions, and the district’s programs are operating largely without the feedback necessary for effective outcome-based management.
Finding 4.1: Student assessment planning lacks a written plan and structured approach for evaluating curriculum and programs effectively.
Effective management of a school district requires feedback about the processes and the results of the organization’s work, which is the design and delivery of curriculum. Instructional programs are the defi ning process of educational institutions, and student learning is the defi ning result. Decision making in this context requires feedback about the functioning of the instructional programs and about what students have learned. That feedback is gained through student assessment and program evaluation. Because school systems are complex and must function at several levels, maintaining a healthy system requires high-quality feedback at those various levels. The feedback about students’ learning outcomes might include everything from classroom questioning and testing to formalized state and national tests now used to meet accountability standards. Meaningful feedback about program effectiveness involves a combination of subjective survey information and analysis of results that are supported by measures of how faithfully the elements of the program were implemented.
To determine if the Fayetteville Public Schools has the planning process necessary to generate high-quality feedback, the auditors reviewed documents (policies, procedures, plans, job descriptions, curriculum documents, district website, assessment materials, and outcome data), interviewed stakeholders (board members, administrators, teachers, support staff, and community members), and visited classrooms in all of the district’s school buildings. It should be noted that this fi nding focuses on the planning and direction for assessment and program evaluation. Analysis of the district’s assessment and program evaluation practices is found in Findings 4.2 and 4.4.
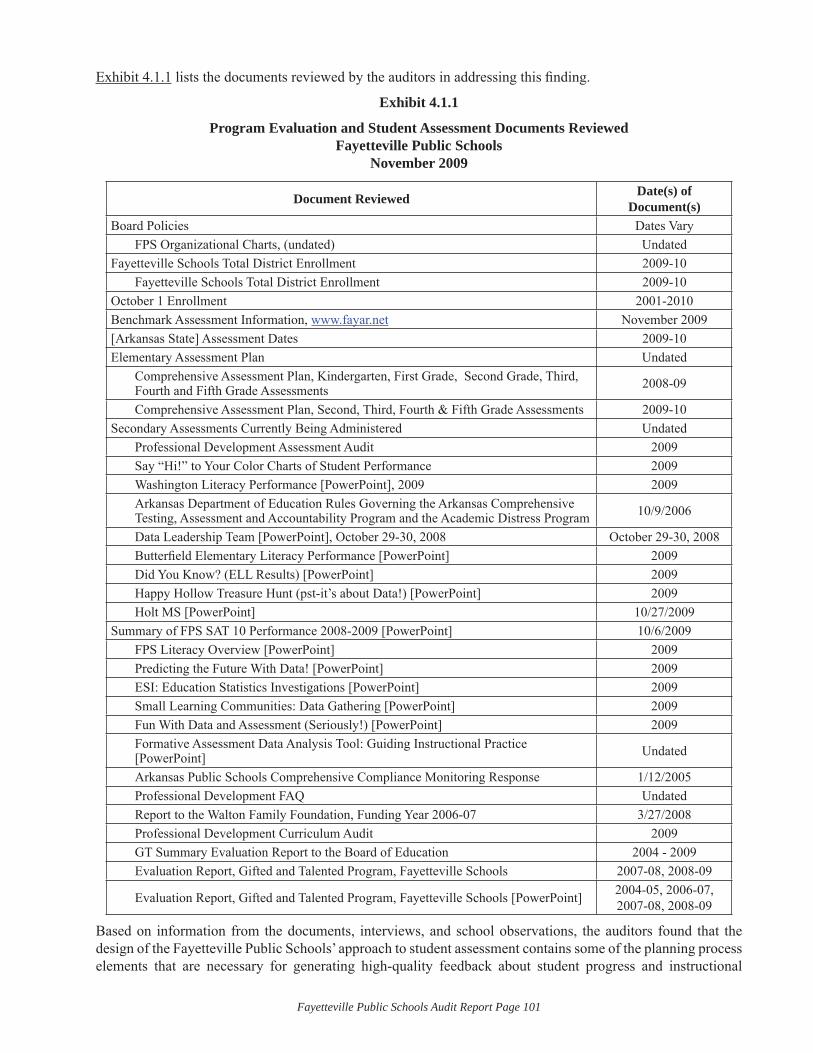
Fayetteville Public Schools Audit Report Page 101
Exhibit 4.1.1 lists the documents reviewed by the auditors in addressing this fi nding.
Exhibit 4.1.1
Program Evaluation and Student Assessment Documents ReviewedFayetteville Public Schools
November 2009
Document Reviewed Date(s) of Document(s)
Board Policies Dates VaryFPS Organizational Charts, (undated) Undated
Fayetteville Schools Total District Enrollment 2009-10Fayetteville Schools Total District Enrollment 2009-10
October 1 Enrollment 2001-2010Benchmark Assessment Information, www.fayar.net November 2009[Arkansas State] Assessment Dates 2009-10Elementary Assessment Plan Undated
Comprehensive Assessment Plan, Kindergarten, First Grade, Second Grade, Third, Fourth and Fifth Grade Assessments 2008-09
Comprehensive Assessment Plan, Second, Third, Fourth & Fifth Grade Assessments 2009-10Secondary Assessments Currently Being Administered Undated
Professional Development Assessment Audit 2009Say “Hi!” to Your Color Charts of Student Performance 2009Washington Literacy Performance [PowerPoint], 2009 2009Arkansas Department of Education Rules Governing the Arkansas Comprehensive Testing, Assessment and Accountability Program and the Academic Distress Program 10/9/2006
Data Leadership Team [PowerPoint], October 29-30, 2008 October 29-30, 2008Butterfi eld Elementary Literacy Performance [PowerPoint] 2009Did You Know? (ELL Results) [PowerPoint] 2009Happy Hollow Treasure Hunt (pst-it’s about Data!) [PowerPoint] 2009Holt MS [PowerPoint] 10/27/2009
Summary of FPS SAT 10 Performance 2008-2009 [PowerPoint] 10/6/2009FPS Literacy Overview [PowerPoint] 2009Predicting the Future With Data! [PowerPoint] 2009ESI: Education Statistics Investigations [PowerPoint] 2009Small Learning Communities: Data Gathering [PowerPoint] 2009Fun With Data and Assessment (Seriously!) [PowerPoint] 2009Formative Assessment Data Analysis Tool: Guiding Instructional Practice [PowerPoint] Undated
Arkansas Public Schools Comprehensive Compliance Monitoring Response 1/12/2005Professional Development FAQ UndatedReport to the Walton Family Foundation, Funding Year 2006-07 3/27/2008Professional Development Curriculum Audit 2009GT Summary Evaluation Report to the Board of Education 2004 - 2009Evaluation Report, Gifted and Talented Program, Fayetteville Schools 2007-08, 2008-09
Evaluation Report, Gifted and Talented Program, Fayetteville Schools [PowerPoint] 2004-05, 2006-07, 2007-08, 2008-09
Based on information from the documents, interviews, and school observations, the auditors found that the design of the Fayetteville Public Schools’ approach to student assessment contains some of the planning process elements that are necessary for generating high-quality feedback about student progress and instructional
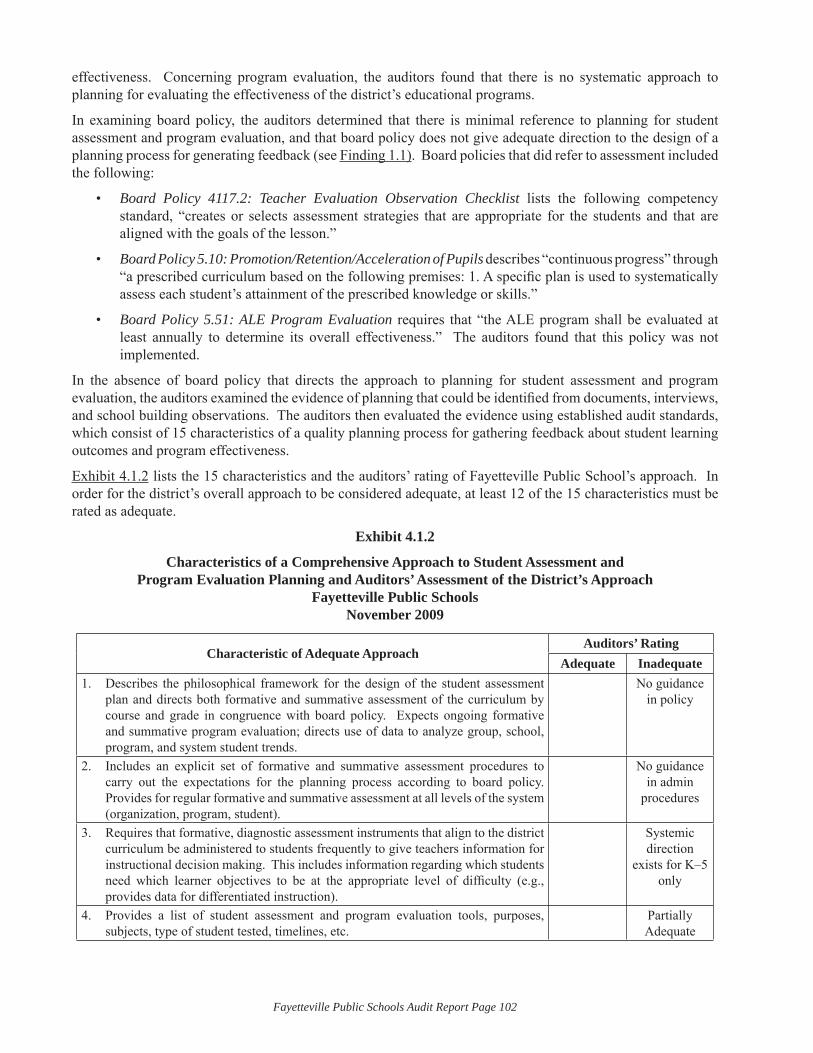
Fayetteville Public Schools Audit Report Page 102
effectiveness. Concerning program evaluation, the auditors found that there is no systematic approach to planning for evaluating the effectiveness of the district’s educational programs.
In examining board policy, the auditors determined that there is minimal reference to planning for student assessment and program evaluation, and that board policy does not give adequate direction to the design of a planning process for generating feedback (see Finding 1.1). Board policies that did refer to assessment included the following:
Board Policy 4117.2: Teacher Evaluation Observation Checklist• lists the following competency standard, “creates or selects assessment strategies that are appropriate for the students and that are aligned with the goals of the lesson.”
Board Policy 5.10: Promotion/Retention/Acceleration of Pupils• describes “continuous progress” through “a prescribed curriculum based on the following premises: 1. A specifi c plan is used to systematically assess each student’s attainment of the prescribed knowledge or skills.”
Board Policy 5.51: ALE Program Evaluation• requires that “the ALE program shall be evaluated at least annually to determine its overall effectiveness.” The auditors found that this policy was not implemented.
In the absence of board policy that directs the approach to planning for student assessment and program evaluation, the auditors examined the evidence of planning that could be identifi ed from documents, interviews, and school building observations. The auditors then evaluated the evidence using established audit standards, which consist of 15 characteristics of a quality planning process for gathering feedback about student learning outcomes and program effectiveness.
Exhibit 4.1.2 lists the 15 characteristics and the auditors’ rating of Fayetteville Public School’s approach. In order for the district’s overall approach to be considered adequate, at least 12 of the 15 characteristics must be rated as adequate.
Exhibit 4.1.2
Characteristics of a Comprehensive Approach to Student Assessment and Program Evaluation Planning and Auditors’ Assessment of the District’s Approach
Fayetteville Public SchoolsNovember 2009
Characteristic of Adequate ApproachAuditors’ Rating
Adequate InadequateDescribes the philosophical framework for the design of the student assessment 1. plan and directs both formative and summative assessment of the curriculum by course and grade in congruence with board policy. Expects ongoing formative and summative program evaluation; directs use of data to analyze group, school, program, and system student trends.
No guidance in policy
Includes an explicit set of formative and summative assessment procedures to 2. carry out the expectations for the planning process according to board policy. Provides for regular formative and summative assessment at all levels of the system (organization, program, student).
No guidance in admin
procedures
Requires that formative, diagnostic assessment instruments that align to the district 3. curriculum be administered to students frequently to give teachers information for instructional decision making. This includes information regarding which students need which learner objectives to be at the appropriate level of diffi culty (e.g., provides data for differentiated instruction).
Systemic direction
exists for K–5 only
Provides a list of student assessment and program evaluation tools, purposes, 4. subjects, type of student tested, timelines, etc.
Partially Adequate
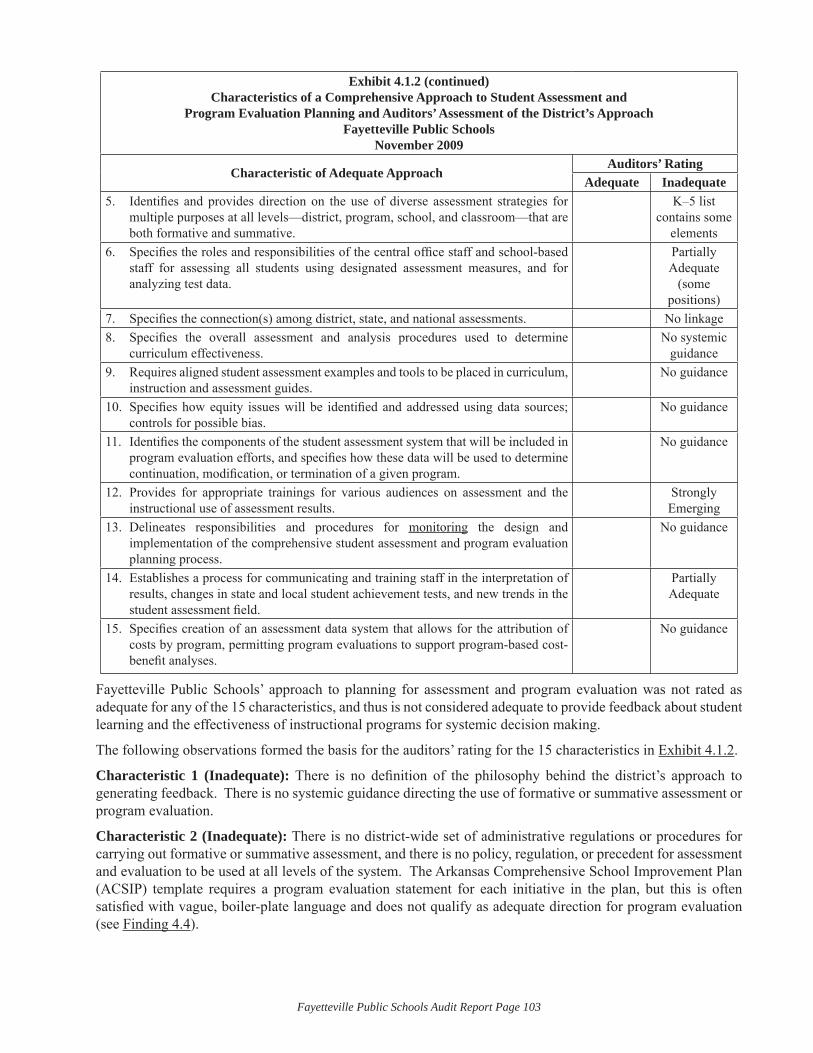
Fayetteville Public Schools Audit Report Page 103
Exhibit 4.1.2 (continued)Characteristics of a Comprehensive Approach to Student Assessment and
Program Evaluation Planning and Auditors’ Assessment of the District’s ApproachFayetteville Public Schools
November 2009
Characteristic of Adequate ApproachAuditors’ Rating
Adequate InadequateIdentifi es and provides direction on the use of diverse assessment strategies for 5. multiple purposes at all levels—district, program, school, and classroom—that are both formative and summative.
K–5 list contains some
elementsSpecifi es the roles and responsibilities of the central offi ce staff and school-based 6. staff for assessing all students using designated assessment measures, and for analyzing test data.
Partially Adequate
(some positions)
Specifi es the connection(s) among district, state, and national assessments.7. No linkage Specifi es the overall assessment and analysis procedures used to determine 8. curriculum effectiveness.
No systemic guidance
Requires aligned student assessment examples and tools to be placed in curriculum, 9. instruction and assessment guides.
No guidance
Specifi es how equity issues will be identifi ed and addressed using data sources; 10. controls for possible bias.
No guidance
Identifi es the components of the student assessment system that will be included in 11. program evaluation efforts, and specifi es how these data will be used to determine continuation, modifi cation, or termination of a given program.
No guidance
Provides for appropriate trainings for various audiences on assessment and the 12. instructional use of assessment results.
Strongly Emerging
Delineates responsibilities and procedures for 13. monitoring the design and implementation of the comprehensive student assessment and program evaluation planning process.
No guidance
Establishes a process for communicating and training staff in the interpretation of 14. results, changes in state and local student achievement tests, and new trends in the student assessment fi eld.
Partially Adequate
Specifi es creation of an assessment data system that allows for the attribution of 15. costs by program, permitting program evaluations to support program-based cost-benefi t analyses.
No guidance
Fayetteville Public Schools’ approach to planning for assessment and program evaluation was not rated as adequate for any of the 15 characteristics, and thus is not considered adequate to provide feedback about student learning and the effectiveness of instructional programs for systemic decision making.
The following observations formed the basis for the auditors’ rating for the 15 characteristics in Exhibit 4.1.2.
Characteristic 1 (Inadequate): There is no defi nition of the philosophy behind the district’s approach to generating feedback. There is no systemic guidance directing the use of formative or summative assessment or program evaluation.
Characteristic 2 (Inadequate): There is no district-wide set of administrative regulations or procedures for carrying out formative or summative assessment, and there is no policy, regulation, or precedent for assessment and evaluation to be used at all levels of the system. The Arkansas Comprehensive School Improvement Plan (ACSIP) template requires a program evaluation statement for each initiative in the plan, but this is often satisfi ed with vague, boiler-plate language and does not qualify as adequate direction for program evaluation (see Finding 4.4).
Fayetteville Public Schools Audit Report Page 104
Characteristic 3 (Inadequate): District administration has directed that a battery of formative, diagnostic tests be administered in literacy and mathematics skills in all K–5 buildings. Though alignment of these tests to the district’s curriculum is not explicit, they are established measures of foundational skills and are consistent with the district’s focus on literacy. Elementary teachers are expected to use the results of formative assessments and quarterly assessments to prescribe interventions for students. In the middle schools and junior high schools, there is evidence of building-level direction from the principals, but there is no evidence of system-wide planning in this area. There is no such direction for the high schools. In the recent past, there was an expectation for the high school teachers to administer a common literacy assessment, but that expectation was abandoned due to resistance from teachers. There is no expectation at any level for mid-course feedback to be used for modifying the delivery of programs.
Characteristic 4 (Partially Adequate): Lists of assessments were provided to the auditors for all levels of student assessment. There is a list of Arkansas state assessments, including test dates and grade levels. The list of local assessments for elementary schools includes the tests’ names, the grade levels assessed, a description of each assessment’s purpose, and, for the summative assessments, the formative assessments that can be used for progress monitoring of the same constructs. Another document lists the general content covered by each test. The list of local tests above fi fth grade covers sixth and seventh grade English and math, tenth grade English, and geometry. It provides the name of the tests, the months in which they are given, and a brief phrase acknowledging a connection to state standards. There is no list of programs that are to be evaluated.
Characteristic 5 (Inadequate): The list of elementary assessments includes a variety of assessment types that cover different purposes. The secondary list does not contain any of the elements of this audit characteristic. In all, there is no systemic, purposeful direction for the inclusion of a range of assessment types that, by design, provide differential types of feedback at all levels of the district’s work. The Curriculum page of the district’s website has a link to a document called Benchmark and Assessment Info that describes the elements of a comprehensive testing program with several different kinds of tests used appropriately for different purposes. Because the document is descriptive rather than directive, it is not taken as evidence of planning for the elements it describes.
Characteristic 6 (Partially Adequate): Job descriptions for eight positions (Superintendent, Principals, Assistant Principals, Teachers (supervisory checklist), Chief Academic Offi cer, District Literacy Coordinator, Director of Special Services, and Director of 21st Century Learning) include references to student assessment or the improvement of instruction, though the references vary in scope and specifi city. The superintendent’s job description, which is included in board policy, requires “reporting to the Board concerning the status of the educational program” and the principals’ job description includes the phrase, “Monitors the effectiveness of the instructional program.” Neither of these contains an explicit directive that reports be based on assessment data. The teachers’ supervisory checklist, also included in board policy, indicates more specifi cally that the teacher “creates or selects assessment strategies that are appropriate for the students and that are aligned with the goals of the lesson.” This characteristic is rated “Partially Adequate” because the job descriptions for the most important positions of instructional leadership in the district contain references to assessment or instructional improvement. A rating of “Adequate” would be given if all relevant job descriptions contained explicit direction for the assessment of student learning and for the analysis and use of student outcome data for improving instruction at all levels.
Characteristic 7 (Inadequate): The elementary list of assessments does not provide information relating the tests to state and national assessments. The list of secondary assessments being administered includes the phrase “linked to state standards based on local pacing” or “linked to state standards—represents sample of standards” for each of the assessments listed. No linkage to state or federal tests is provided for the content of the standards being assessed, the number and types of items designed to assess each standard, or the cognitive type(s) or contexts of the test items testing each standard.
Characteristic 8 (Inadequate): There is no comprehensive set of procedures, in writing or by precedent, for using assessment feedback to measure the attainment of the goals of the curriculum. Some programs have evaluation procedures prescribed by a funding or governmental agency—the Gifted and Talented program and Reading First are two examples—but the district does not provide procedures for program evaluation.
Fayetteville Public Schools Audit Report Page 105
Characteristic 9 (Inadequate): There is no expectation in policy, in administrative procedures, or in precedent, for assessment information to be included in curriculum guides or related documents.
Characteristic 10 (Inadequate): There is no guidance for a data-based approach to identifying or resolving equity issues. The Arkansas Department of Education provides counts of administrative and teaching staff by ethnicity and the NORMES website provides the Alert tool to measure inequalities in achievement of different student groups, but there is no direction, either locally or from the state, incorporating this information into a process for resolving equity issues. During interviews, some staff expressed an awareness of the possibility of bias in assessments, but there is no plan or procedure for determining and/or eliminating bias in assessments that are purchased or developed by the district.
Characteristic 11 (Inadequate): Program evaluation is not addressed in policy, in administrative procedures, or by example of practice. As such, there is no specifi cation for the assessment data that will be included in program evaluation or for the management decisions that will be based on program evaluations data. In interviews, several administrators and teachers expressed the need for program evaluation.
Characteristic 12 (Strongly Emerging): An audit of professional development related to assessment for the past three years shows that from 114 hours to 206 hours of professional development have been offered each year. The recently created position of Teacher on Special Assignment for Data and Assessment and the hiring of an Elementary Literacy Coordinator with state-wide experience delivering professional development in formative assessment techniques speak strongly to the district’s commitment to planning for professional development about assessment. All of the district’s principals and the teachers in several buildings have received introductory training, based on needs assessment data, in the principles of effective data use for instructional improvement. There is an administrative expectation that all K–5 teachers and administrators will become competent in administering the DIBELS assessments and the Curriculum-Based Measures for mathematics and in using the results to provide tailored interventions for individual students. At one middle school, every department has been directed by the principal to develop some form of department-wide common assessment. By contrast, however, auditors heard in several interviews that there is no direction or guidance at the secondary level for developing teachers’ assessment skills. While the teachers in a few departments at the high school have taken the initiative to learn and apply formative assessment techniques, it is not a systemic expectation. Although the situation at the secondary level indicates the lack of system-wide comprehensive expectations that would be necessary for a rating of “Adequate” on this characteristic, there is signifi cant and meaningful progress in building a planning process for professional development in assessment.
A list of skills that students are to master is being examined by teachers at Leverett Elementary.
Fayetteville Public Schools Audit Report Page 106
Characteristic 13 (Inadequate): In light of the absence of system-wide planning for assessment and program evaluation, there is no provision for systematic monitoring of the feedback process.
Characteristic 14 (Partially Inadequate): Regarding the training of staff in the interpretation of test results, see comments under Characteristic 12. Regarding the communication of test results, the elementary schools have been directed to develop data walls and to conduct data meetings by grade level as a means of communicating with one another about formative assessment results in literacy and math and jointly making instructional decisions based on those results. The commercial assessment packages the district has purchased include printouts (and, in some cases, websites) that have been designed for communicating test results to administrators and classroom teachers. The NORMES website is used for communicating the results of state Benchmark Tests. The TOSA for Data and Assessment has processed achievement data for some buildings and guided staff through its interpretation and application. These several elements indicate that much assessment data is being communicated to staff. What prevents a rating of “Adequate” on this characteristic is the lack of coordinated, system-level planning for communication processes that assure data is disseminated in purposefully designed formats that will aid in achieving the goals of the curriculum.
Characteristic 15 (Inadequate): There is no direction, expectation, or precedent for incorporating student outcome data into the budgeting process. There currently are plans to initiate zero-based budgeting (see Finding 5.1), which is a necessary step toward outcome-based budgeting.
Several comments made during interviews refl ected the differences in planning for assessment between the elementary grades and the high school. The following comments from administrators are representative:
“We have assessment issues. At elementary, we’re better off than the secondary.”•
“DIBELS is being used K–8. This is a district-wide contract to use the program.”•
“At the high school, they don’t want anything to do with that [assessment] mess.”•
In summary, Fayetteville Public Schools’ approach to generating feedback about student learning and program effectiveness lacks comprehensive, system-wide planning that defi nes the philosophy, structure, methods, content, uses, and audiences for feedback data, although more of the characteristics of adequate planning for assessment are evident in grades K–5 than in grades 6–12. As a result, Fayetteville Public Schools do not generate the feedback information they need for designing and successfully delivering the curriculum.
Finding 4.2: The scope of assessment is inadequate to monitor and evaluate student progress and achievement in all areas of the curriculum and at all grade levels.
A comprehensive student testing program provides the foundation for decisions regarding curriculum design and delivery. One aspect of the comprehensiveness of the assessment program is the extent of the curriculum that is covered by formal assessments. If only part of the curriculum is formally assessed, then decision making is based on incomplete feedback and planning for improvement may be misguided. In addition, those who have an interest in the district’s success, such as community members or funding agencies, may generalize from the formally assessed portions of the curriculum to the district as a whole.
An effective testing program requires that student achievement is formally evaluated in every course taught within the system and at every grade level. While it is desirable to have assessment for every course offered, the audit does provide a 30 percent leeway on this criterion. When the scope of assessment does not meet this standard, stakeholders will not have the evidence they need to determine student learning progress in each content area as students move through the grades.
To determine the scope of assessment in the Fayetteville Public Schools, auditors examined board policies and regulations, district and building Arkansas Comprehensive School Improvement Plans (ACSIP), local assessment plans and schedules, curriculum guides, and the testing page of Arkansas Department of Education’s website. In addition, the auditors interviewed board members and administrators about the scope of assessment in the district.
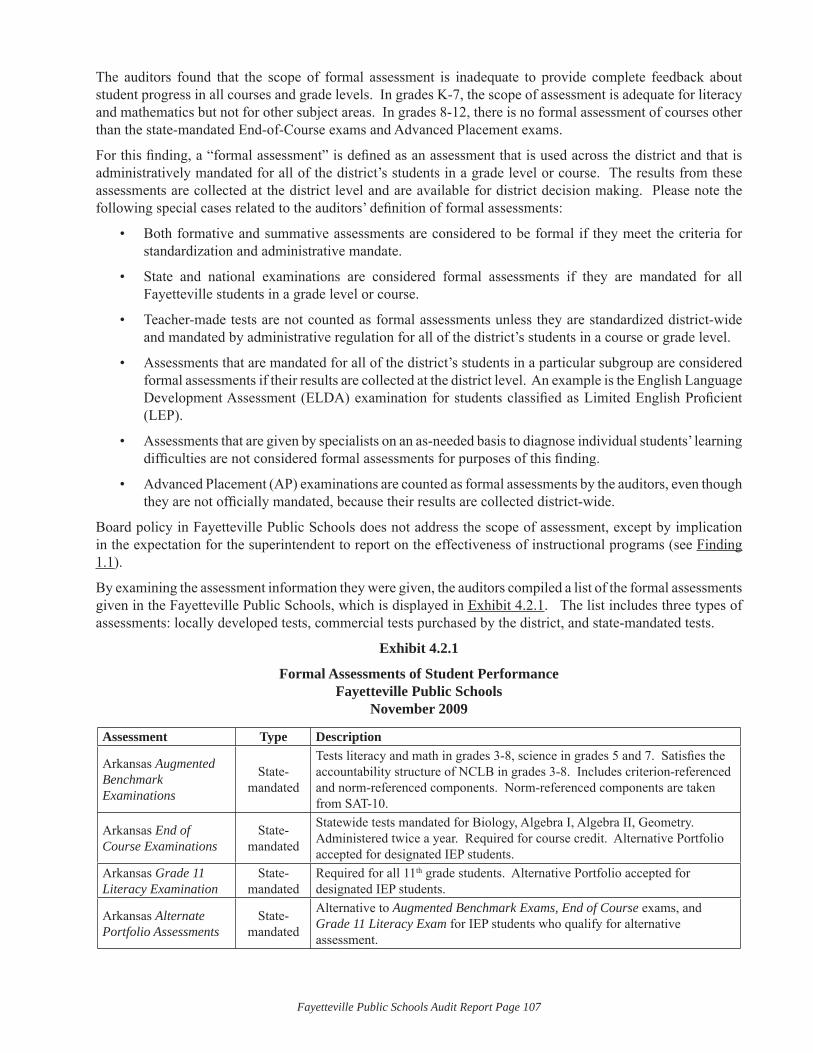
Fayetteville Public Schools Audit Report Page 107
The auditors found that the scope of formal assessment is inadequate to provide complete feedback about student progress in all courses and grade levels. In grades K-7, the scope of assessment is adequate for literacy and mathematics but not for other subject areas. In grades 8-12, there is no formal assessment of courses other than the state-mandated End-of-Course exams and Advanced Placement exams.
For this fi nding, a “formal assessment” is defi ned as an assessment that is used across the district and that is administratively mandated for all of the district’s students in a grade level or course. The results from these assessments are collected at the district level and are available for district decision making. Please note the following special cases related to the auditors’ defi nition of formal assessments:
Both formative and summative assessments are considered to be formal if they meet the criteria for • standardization and administrative mandate.
State and national examinations are considered formal assessments if they are mandated for all • Fayetteville students in a grade level or course.
Teacher-made tests are not counted as formal assessments unless they are standardized district-wide • and mandated by administrative regulation for all of the district’s students in a course or grade level.
Assessments that are mandated for all of the district’s students in a particular subgroup are considered • formal assessments if their results are collected at the district level. An example is the English Language Development Assessment (ELDA) examination for students classifi ed as Limited English Profi cient (LEP).
Assessments that are given by specialists on an as-needed basis to diagnose individual students’ learning • diffi culties are not considered formal assessments for purposes of this fi nding.
Advanced Placement (AP) examinations are counted as formal assessments by the auditors, even though • they are not offi cially mandated, because their results are collected district-wide.
Board policy in Fayetteville Public Schools does not address the scope of assessment, except by implication in the expectation for the superintendent to report on the effectiveness of instructional programs (see Finding 1.1).
By examining the assessment information they were given, the auditors compiled a list of the formal assessments given in the Fayetteville Public Schools, which is displayed in Exhibit 4.2.1. The list includes three types of assessments: locally developed tests, commercial tests purchased by the district, and state-mandated tests.
Exhibit 4.2.1
Formal Assessments of Student PerformanceFayetteville Public Schools
November 2009
Assessment Type Description
Arkansas Augmented Benchmark Examinations
State-mandated
Tests literacy and math in grades 3-8, science in grades 5 and 7. Satisfi es the accountability structure of NCLB in grades 3-8. Includes criterion-referenced and norm-referenced components. Norm-referenced components are taken from SAT-10.
Arkansas End of Course Examinations
State-mandated
Statewide tests mandated for Biology, Algebra I, Algebra II, Geometry. Administered twice a year. Required for course credit. Alternative Portfolio accepted for designated IEP students.
Arkansas Grade 11 Literacy Examination
State-mandated
Required for all 11th grade students. Alternative Portfolio accepted for designated IEP students.
Arkansas Alternate Portfolio Assessments
State-mandated
Alternative to Augmented Benchmark Exams, End of Course exams, and Grade 11 Literacy Exam for IEP students who qualify for alternative assessment.

Fayetteville Public Schools Audit Report Page 108
Exhibit 4.2.1 (continued)Formal Assessments of Student Performance
Fayetteville Public SchoolsNovember 2009
Assessment Type DescriptionArkansas English Language Development Assessment (ELDA)
State-mandated
Given annually to students who are Limited English Profi cient in all grades to measure English language acquisition.
CBM-Math Locally purchased
Curriculum-based measures for mathematics in grades K-5. Formative. Because they are reliable and sensitive to short-term instructional effects, they are used to monitor students’ progress in foundational math skills. K-3 is electronic and web-based. Grades 4 and 5 use a paper-and-pencil assessment.
Qualls Early Learning Inventory® (QELI)
Locally purchased
A measure of early learning given as a one-time placement test for student entering kindergarten or fi rst grade.
DIBELS® Locally purchased
Curriculum-based measures for literacy in grades K-5. Measures the fi ve components of reading development. Because they are reliable and sensitive to short-term instructional effects, they are used to monitor students’ progress in the components of learning to read.
Quarterly Writing Prompts
Locally developed
Locally developed assessments keyed to grade-level curriculum and given three times each year in grades K-5 to monitor students’ progress toward mastering learning objectives for writing and the expectations of the Arkansas Writing Rubric.
Quarterly Math Assessment
Locally developed
Locally developed assessments keyed to grade-level curriculum and given three times each year in grades 1-5 to monitor students’ progress toward mastering learning objectives for math. Assists in developing enrichment or intervention plans for individual students.
Developmental Reading Assessment® (DRA)
Locally purchased
Diagnostic test of reading skills based on miscue analysis. Used in grades K-5 primarily as a one-time placement test, but also as end-of-year progress monitor for some students.
DSA Locally purchased
Standardized spelling test that places a student on a spelling continuum. Used in grades 2-5.
Reading 3D® Locally purchased
Electronic diagnostic test of reading skills that is more effi cient than CAP and the DRA. Administered in grades K-5. Uses hand-held device. Training required.
MAT8® State-mandated
Given in kindergarten to measure school readiness in mathematics and literacy.
SAT10® State-mandated
Nationally normed. Assesses literacy and math. Complete battery given in grades K-2 and 9. Items from SAT10 literacy and math are included on the Augmented Benchmark Exams in grades 3-8. Science items are included in grades 5 and 7.
Advanced Placement (AP) Examinations Other
National exams developed and scored by College Board that are often used as the basis for college course credit by examination. AP course curricula are designed to prepare students for the AP examinations.
Sources: Elementary Assessment Plan, 2009-2010 Comprehensive Assessment Plan, http://arkansased.org/testing/testing.html
The information in Exhibit 4.2.1 shows that there are 16 categories of formal assessments given in the district. Seven of the categories are state-mandated tests, six categories are commercial tests purchased for use in the district, and two are locally developed instruments. Advanced Placement (AP) Exams are not classifi ed in any of the three categories.
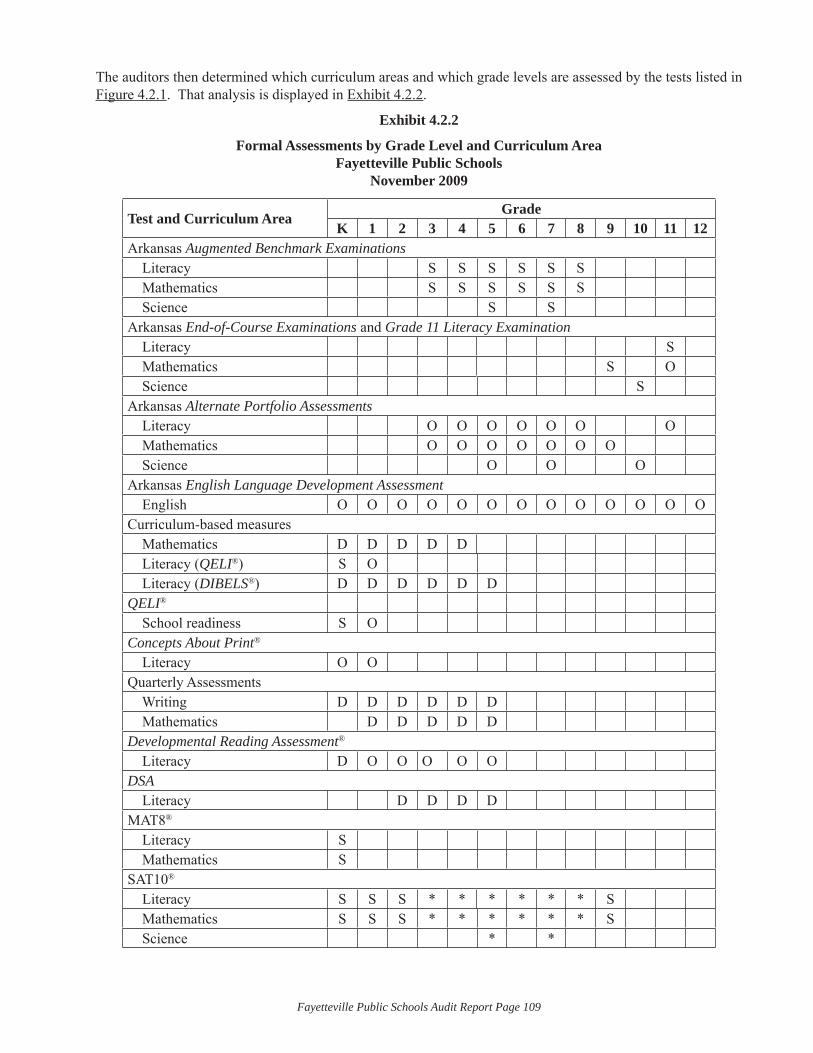
Fayetteville Public Schools Audit Report Page 109
The auditors then determined which curriculum areas and which grade levels are assessed by the tests listed in Figure 4.2.1. That analysis is displayed in Exhibit 4.2.2.
Exhibit 4.2.2
Formal Assessments by Grade Level and Curriculum AreaFayetteville Public Schools
November 2009
Test and Curriculum AreaGrade
K 1 2 3 4 5 6 7 8 9 10 11 12Arkansas Augmented Benchmark Examinations Literacy S S S S S S Mathematics S S S S S S Science S SArkansas End-of-Course Examinations and Grade 11 Literacy Examination Literacy S Mathematics S O Science SArkansas Alternate Portfolio Assessments Literacy O O O O O O O Mathematics O O O O O O O Science O O OArkansas English Language Development Assessment English O O O O O O O O O O O O OCurriculum-based measures Mathematics D D D D D Literacy (QELI®) S O Literacy (DIBELS®) D D D D D DQELI®
School readiness S OConcepts About Print®
Literacy O OQuarterly Assessments Writing D D D D D D Mathematics D D D D DDevelopmental Reading Assessment®
Literacy D O O O O ODSA Literacy D D D DMAT8®
Literacy S Mathematics SSAT10®
Literacy S S S * * * * * * S Mathematics S S S * * * * * * S Science * *
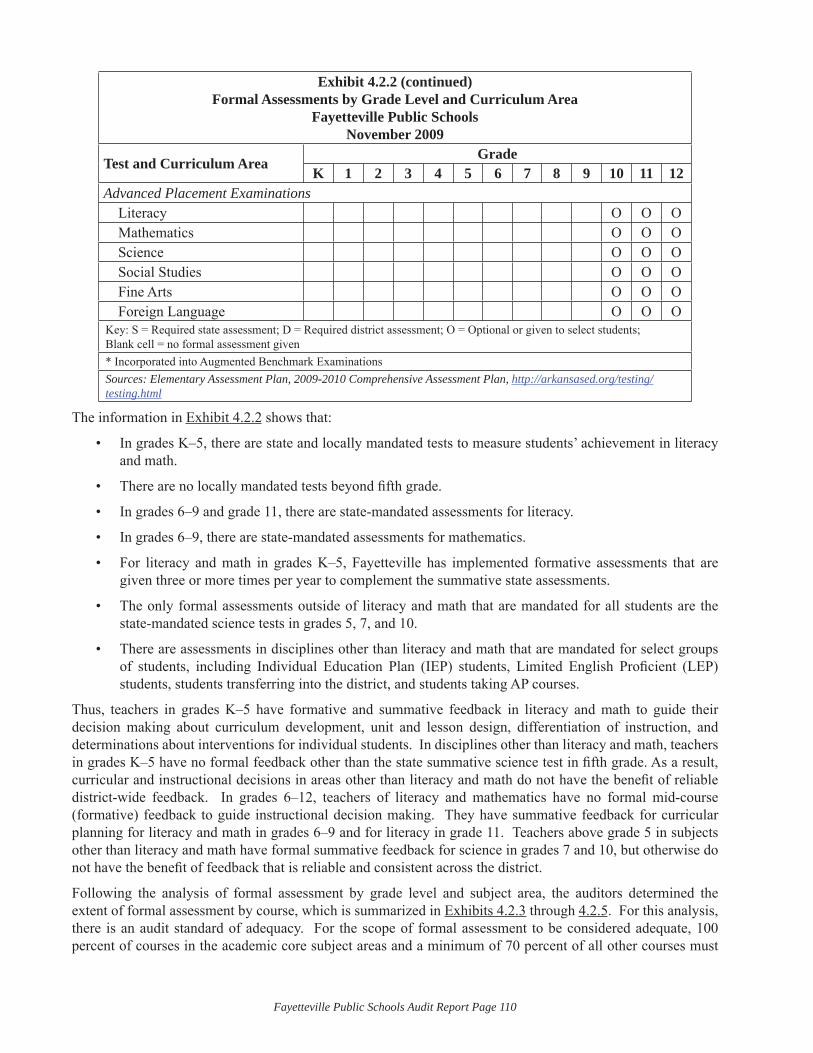
Fayetteville Public Schools Audit Report Page 110
Exhibit 4.2.2 (continued)Formal Assessments by Grade Level and Curriculum Area
Fayetteville Public SchoolsNovember 2009
Test and Curriculum AreaGrade
K 1 2 3 4 5 6 7 8 9 10 11 12Advanced Placement Examinations Literacy O O O Mathematics O O O Science O O O Social Studies O O O Fine Arts O O O Foreign Language O O OKey: S = Required state assessment; D = Required district assessment; O = Optional or given to select students; Blank cell = no formal assessment given* Incorporated into Augmented Benchmark Examinations Sources: Elementary Assessment Plan, 2009-2010 Comprehensive Assessment Plan, http://arkansased.org/testing/testing.html
The information in Exhibit 4.2.2 shows that:
In grades K–5, there are state and locally mandated tests to measure students’ achievement in literacy • and math.
There are no locally mandated tests beyond fi fth grade.•
In grades 6–9 and grade 11, there are state-mandated assessments for literacy.•
In grades 6–9, there are state-mandated assessments for mathematics.•
For literacy and math in grades K–5, Fayetteville has implemented formative assessments that are • given three or more times per year to complement the summative state assessments.
The only formal assessments outside of literacy and math that are mandated for all students are the • state-mandated science tests in grades 5, 7, and 10.
There are assessments in disciplines other than literacy and math that are mandated for select groups • of students, including Individual Education Plan (IEP) students, Limited English Profi cient (LEP) students, students transferring into the district, and students taking AP courses.
Thus, teachers in grades K–5 have formative and summative feedback in literacy and math to guide their decision making about curriculum development, unit and lesson design, differentiation of instruction, and determinations about interventions for individual students. In disciplines other than literacy and math, teachers in grades K–5 have no formal feedback other than the state summative science test in fi fth grade. As a result, curricular and instructional decisions in areas other than literacy and math do not have the benefi t of reliable district-wide feedback. In grades 6–12, teachers of literacy and mathematics have no formal mid-course (formative) feedback to guide instructional decision making. They have summative feedback for curricular planning for literacy and math in grades 6–9 and for literacy in grade 11. Teachers above grade 5 in subjects other than literacy and math have formal summative feedback for science in grades 7 and 10, but otherwise do not have the benefi t of feedback that is reliable and consistent across the district.
Following the analysis of formal assessment by grade level and subject area, the auditors determined the extent of formal assessment by course, which is summarized in Exhibits 4.2.3 through 4.2.5. For this analysis, there is an audit standard of adequacy. For the scope of formal assessment to be considered adequate, 100 percent of courses in the academic core subject areas and a minimum of 70 percent of all other courses must
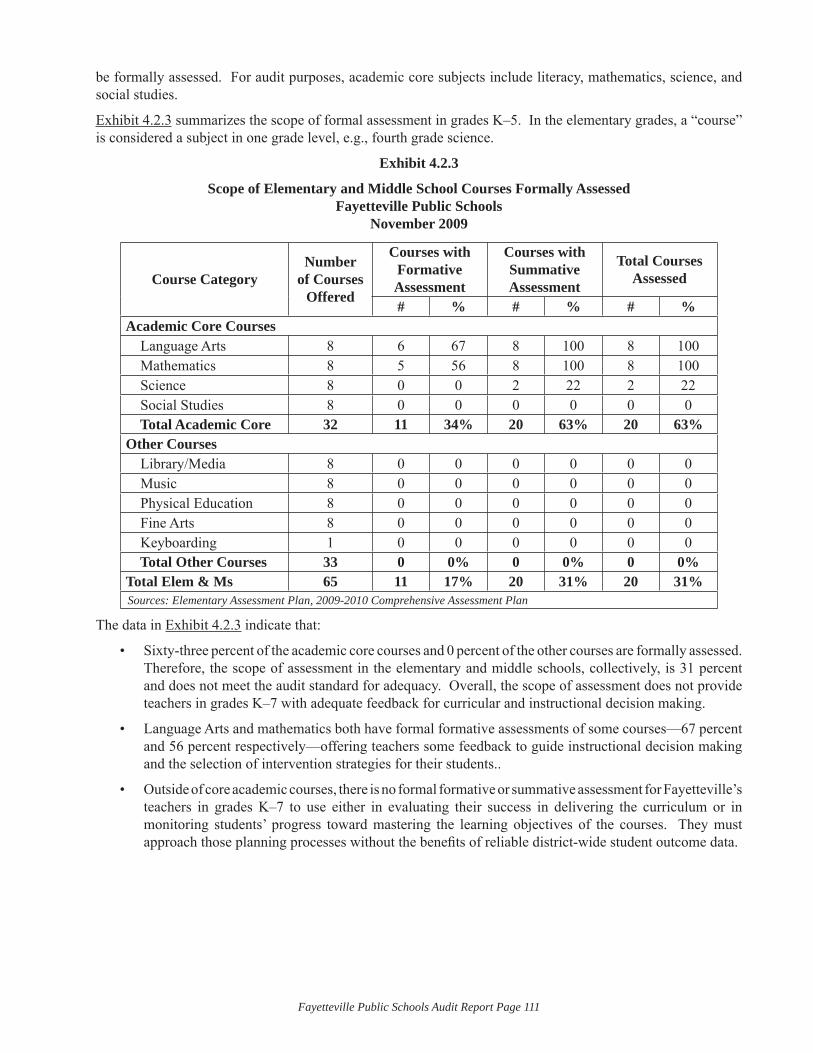
Fayetteville Public Schools Audit Report Page 111
be formally assessed. For audit purposes, academic core subjects include literacy, mathematics, science, and social studies.
Exhibit 4.2.3 summarizes the scope of formal assessment in grades K–5. In the elementary grades, a “course” is considered a subject in one grade level, e.g., fourth grade science.
Exhibit 4.2.3
Scope of Elementary and Middle School Courses Formally AssessedFayetteville Public Schools
November 2009
Course CategoryNumber
of Courses Offered
Courses with Formative Assessment
Courses with Summative Assessment
Total Courses Assessed
# % # % # %Academic Core Courses Language Arts 8 6 67 8 100 8 100 Mathematics 8 5 56 8 100 8 100 Science 8 0 0 2 22 2 22 Social Studies 8 0 0 0 0 0 0 Total Academic Core 32 11 34% 20 63% 20 63%Other Courses Library/Media 8 0 0 0 0 0 0 Music 8 0 0 0 0 0 0 Physical Education 8 0 0 0 0 0 0 Fine Arts 8 0 0 0 0 0 0 Keyboarding 1 0 0 0 0 0 0 Total Other Courses 33 0 0% 0 0% 0 0%Total Elem & Ms 65 11 17% 20 31% 20 31%Sources: Elementary Assessment Plan, 2009-2010 Comprehensive Assessment Plan
The data in Exhibit 4.2.3 indicate that:
Sixty-three percent of the academic core courses and 0 percent of the other courses are formally assessed. • Therefore, the scope of assessment in the elementary and middle schools, collectively, is 31 percent and does not meet the audit standard for adequacy. Overall, the scope of assessment does not provide teachers in grades K–7 with adequate feedback for curricular and instructional decision making.
Language Arts and mathematics both have formal formative assessments of some courses—67 percent • and 56 percent respectively—offering teachers some feedback to guide instructional decision making and the selection of intervention strategies for their students..
Outside of core academic courses, there is no formal formative or summative assessment for Fayetteville’s • teachers in grades K–7 to use either in evaluating their success in delivering the curriculum or in monitoring students’ progress toward mastering the learning objectives of the courses. They must approach those planning processes without the benefi ts of reliable district-wide student outcome data.
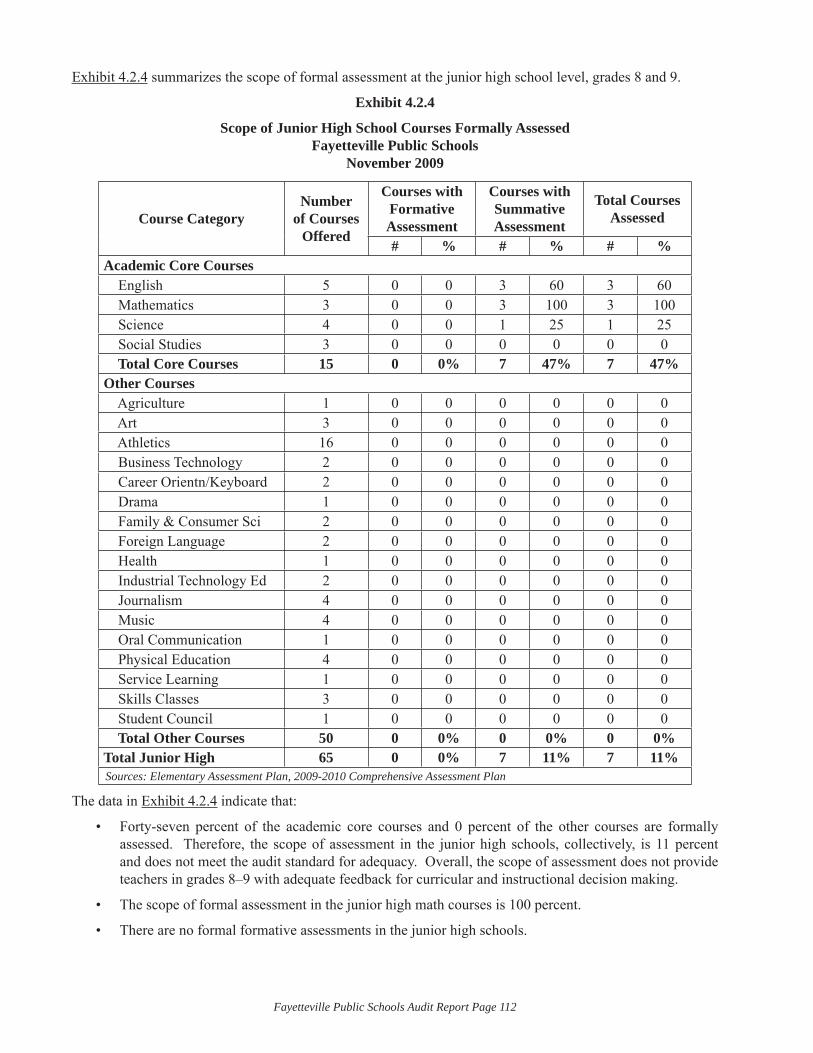
Fayetteville Public Schools Audit Report Page 112
Exhibit 4.2.4 summarizes the scope of formal assessment at the junior high school level, grades 8 and 9.
Exhibit 4.2.4
Scope of Junior High School Courses Formally AssessedFayetteville Public Schools
November 2009
Course CategoryNumber
of Courses Offered
Courses with Formative Assessment
Courses with Summative Assessment
Total Courses Assessed
# % # % # %Academic Core Courses English 5 0 0 3 60 3 60 Mathematics 3 0 0 3 100 3 100 Science 4 0 0 1 25 1 25 Social Studies 3 0 0 0 0 0 0 Total Core Courses 15 0 0% 7 47% 7 47%Other Courses Agriculture 1 0 0 0 0 0 0 Art 3 0 0 0 0 0 0 Athletics 16 0 0 0 0 0 0 Business Technology 2 0 0 0 0 0 0 Career Orientn/Keyboard 2 0 0 0 0 0 0 Drama 1 0 0 0 0 0 0 Family & Consumer Sci 2 0 0 0 0 0 0 Foreign Language 2 0 0 0 0 0 0 Health 1 0 0 0 0 0 0 Industrial Technology Ed 2 0 0 0 0 0 0 Journalism 4 0 0 0 0 0 0 Music 4 0 0 0 0 0 0 Oral Communication 1 0 0 0 0 0 0 Physical Education 4 0 0 0 0 0 0 Service Learning 1 0 0 0 0 0 0 Skills Classes 3 0 0 0 0 0 0 Student Council 1 0 0 0 0 0 0 Total Other Courses 50 0 0% 0 0% 0 0%Total Junior High 65 0 0% 7 11% 7 11%Sources: Elementary Assessment Plan, 2009-2010 Comprehensive Assessment Plan
The data in Exhibit 4.2.4 indicate that:
Forty-seven percent of the academic core courses and 0 percent of the other courses are formally • assessed. Therefore, the scope of assessment in the junior high schools, collectively, is 11 percent and does not meet the audit standard for adequacy. Overall, the scope of assessment does not provide teachers in grades 8–9 with adequate feedback for curricular and instructional decision making.
The scope of formal assessment in the junior high math courses is 100 percent.•
There are no formal formative assessments in the junior high schools.•
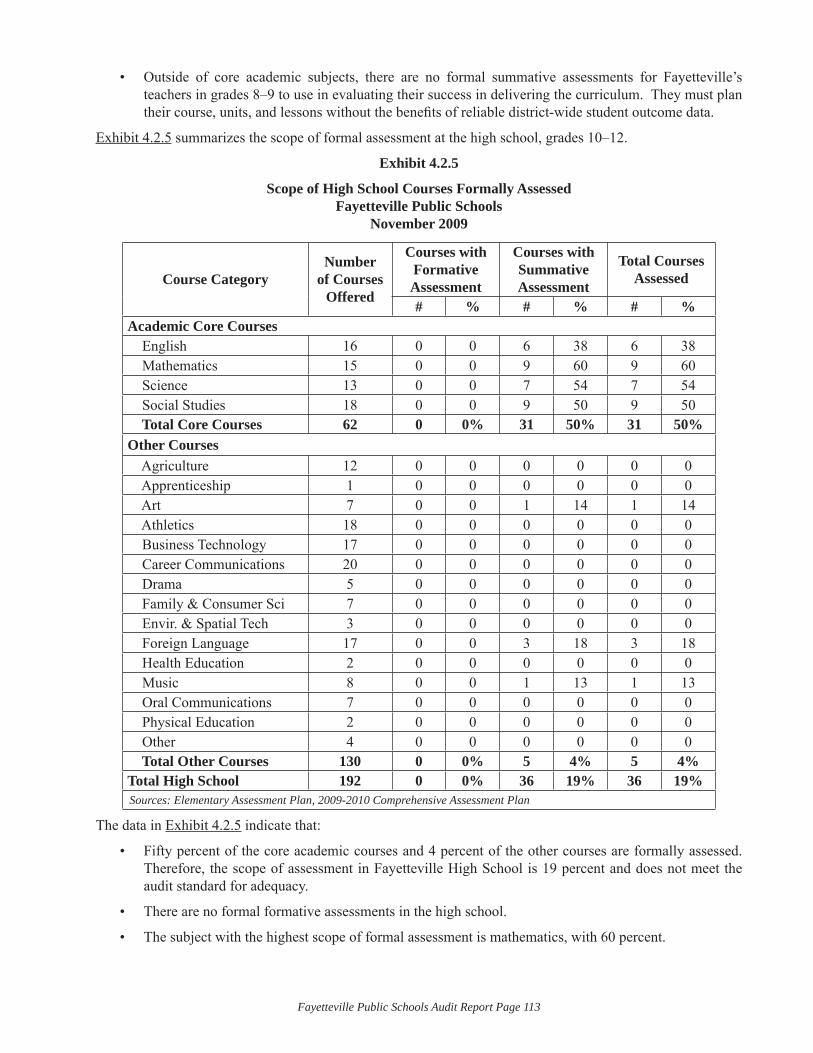
Fayetteville Public Schools Audit Report Page 113
Outside of core academic subjects, there are no formal summative assessments for Fayetteville’s • teachers in grades 8–9 to use in evaluating their success in delivering the curriculum. They must plan their course, units, and lessons without the benefi ts of reliable district-wide student outcome data.
Exhibit 4.2.5 summarizes the scope of formal assessment at the high school, grades 10–12.
Exhibit 4.2.5
Scope of High School Courses Formally AssessedFayetteville Public Schools
November 2009
Course CategoryNumber
of Courses Offered
Courses with Formative Assessment
Courses with Summative Assessment
Total Courses Assessed
# % # % # %Academic Core Courses English 16 0 0 6 38 6 38 Mathematics 15 0 0 9 60 9 60 Science 13 0 0 7 54 7 54 Social Studies 18 0 0 9 50 9 50 Total Core Courses 62 0 0% 31 50% 31 50%Other Courses Agriculture 12 0 0 0 0 0 0 Apprenticeship 1 0 0 0 0 0 0 Art 7 0 0 1 14 1 14 Athletics 18 0 0 0 0 0 0 Business Technology 17 0 0 0 0 0 0 Career Communications 20 0 0 0 0 0 0 Drama 5 0 0 0 0 0 0 Family & Consumer Sci 7 0 0 0 0 0 0 Envir. & Spatial Tech 3 0 0 0 0 0 0 Foreign Language 17 0 0 3 18 3 18 Health Education 2 0 0 0 0 0 0 Music 8 0 0 1 13 1 13 Oral Communications 7 0 0 0 0 0 0 Physical Education 2 0 0 0 0 0 0 Other 4 0 0 0 0 0 0 Total Other Courses 130 0 0% 5 4% 5 4%Total High School 192 0 0% 36 19% 36 19%Sources: Elementary Assessment Plan, 2009-2010 Comprehensive Assessment Plan
The data in Exhibit 4.2.5 indicate that:
Fifty percent of the core academic courses and 4 percent of the other courses are formally assessed. • Therefore, the scope of assessment in Fayetteville High School is 19 percent and does not meet the audit standard for adequacy.
There are no formal formative assessments in the high school.•
The subject with the highest scope of formal assessment is mathematics, with 60 percent.•
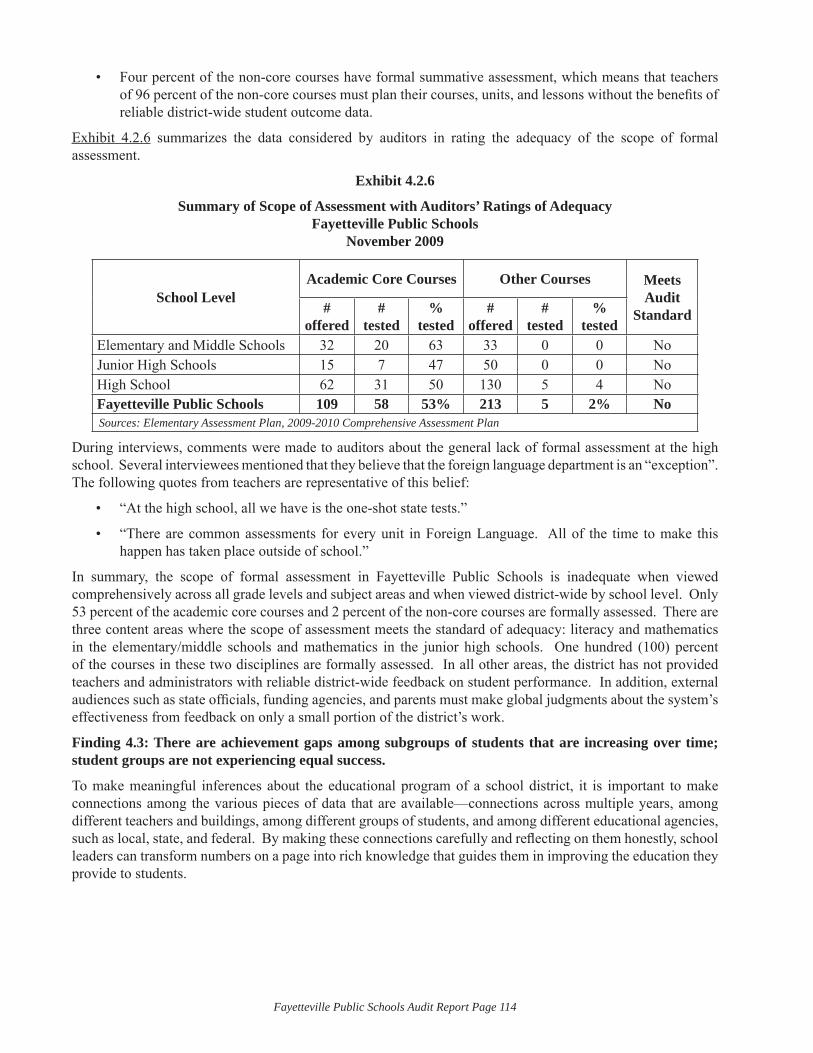
Fayetteville Public Schools Audit Report Page 114
Four percent of the non-core courses have formal summative assessment, which means that teachers • of 96 percent of the non-core courses must plan their courses, units, and lessons without the benefi ts of reliable district-wide student outcome data.
Exhibit 4.2.6 summarizes the data considered by auditors in rating the adequacy of the scope of formal assessment.
Exhibit 4.2.6
Summary of Scope of Assessment with Auditors’ Ratings of AdequacyFayetteville Public Schools
November 2009
School LevelAcademic Core Courses Other Courses Meets
Audit Standard#
offered#
tested%
tested#
offered#
tested%
testedElementary and Middle Schools 32 20 63 33 0 0 NoJunior High Schools 15 7 47 50 0 0 NoHigh School 62 31 50 130 5 4 NoFayetteville Public Schools 109 58 53% 213 5 2% NoSources: Elementary Assessment Plan, 2009-2010 Comprehensive Assessment Plan
During interviews, comments were made to auditors about the general lack of formal assessment at the high school. Several interviewees mentioned that they believe that the foreign language department is an “exception”. The following quotes from teachers are representative of this belief:
“At the high school, all we have is the one-shot state tests.”•
“There are common assessments for every unit in Foreign Language. All of the time to make this • happen has taken place outside of school.”
In summary, the scope of formal assessment in Fayetteville Public Schools is inadequate when viewed comprehensively across all grade levels and subject areas and when viewed district-wide by school level. Only 53 percent of the academic core courses and 2 percent of the non-core courses are formally assessed. There are three content areas where the scope of assessment meets the standard of adequacy: literacy and mathematics in the elementary/middle schools and mathematics in the junior high schools. One hundred (100) percent of the courses in these two disciplines are formally assessed. In all other areas, the district has not provided teachers and administrators with reliable district-wide feedback on student performance. In addition, external audiences such as state offi cials, funding agencies, and parents must make global judgments about the system’s effectiveness from feedback on only a small portion of the district’s work.
Finding 4.3: There are achievement gaps among subgroups of students that are increasing over time; student groups are not experiencing equal success.
To make meaningful inferences about the educational program of a school district, it is important to make connections among the various pieces of data that are available—connections across multiple years, among different teachers and buildings, among different groups of students, and among different educational agencies, such as local, state, and federal. By making these connections carefully and refl ecting on them honestly, school leaders can transform numbers on a page into rich knowledge that guides them in improving the education they provide to students.
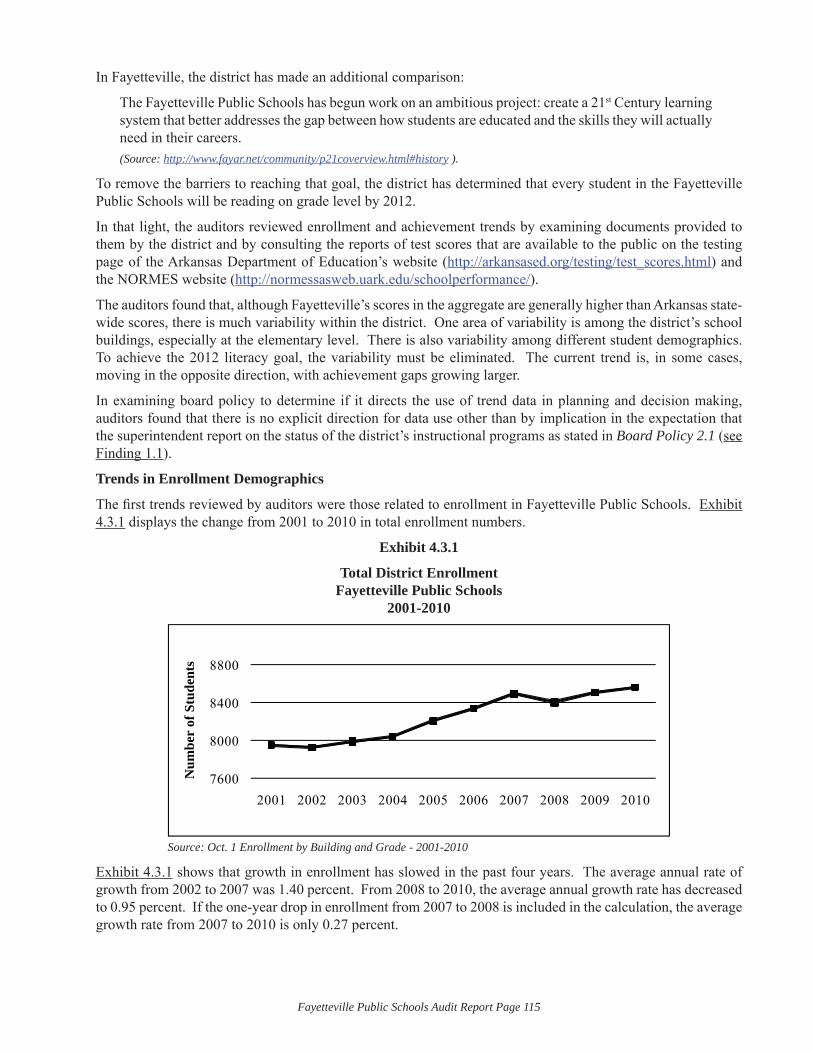
Fayetteville Public Schools Audit Report Page 115
In Fayetteville, the district has made an additional comparison:
The Fayetteville Public Schools has begun work on an ambitious project: create a 21st Century learning system that better addresses the gap between how students are educated and the skills they will actually need in their careers. (Source: http://www.fayar.net/community/p21coverview.html#history ).
To remove the barriers to reaching that goal, the district has determined that every student in the Fayetteville Public Schools will be reading on grade level by 2012.
In that light, the auditors reviewed enrollment and achievement trends by examining documents provided to them by the district and by consulting the reports of test scores that are available to the public on the testing page of the Arkansas Department of Education’s website (http://arkansased.org/testing/test_scores.html) and the NORMES website (http://normessasweb.uark.edu/schoolperformance/).
The auditors found that, although Fayetteville’s scores in the aggregate are generally higher than Arkansas state-wide scores, there is much variability within the district. One area of variability is among the district’s school buildings, especially at the elementary level. There is also variability among different student demographics. To achieve the 2012 literacy goal, the variability must be eliminated. The current trend is, in some cases, moving in the opposite direction, with achievement gaps growing larger.
In examining board policy to determine if it directs the use of trend data in planning and decision making, auditors found that there is no explicit direction for data use other than by implication in the expectation that the superintendent report on the status of the district’s instructional programs as stated in Board Policy 2.1 (see Finding 1.1).
Trends in Enrollment Demographics
The fi rst trends reviewed by auditors were those related to enrollment in Fayetteville Public Schools. Exhibit 4.3.1 displays the change from 2001 to 2010 in total enrollment numbers.
Exhibit 4.3.1
Total District EnrollmentFayetteville Public Schools
2001-2010
7600
8000
8400
8800
2001 2002 2003 2004 2005 2006 2007 2008 2009 2010
Num
ber
of S
tude
nts
Source: Oct. 1 Enrollment by Building and Grade - 2001-2010
Exhibit 4.3.1 shows that growth in enrollment has slowed in the past four years. The average annual rate of growth from 2002 to 2007 was 1.40 percent. From 2008 to 2010, the average annual growth rate has decreased to 0.95 percent. If the one-year drop in enrollment from 2007 to 2008 is included in the calculation, the average growth rate from 2007 to 2010 is only 0.27 percent.
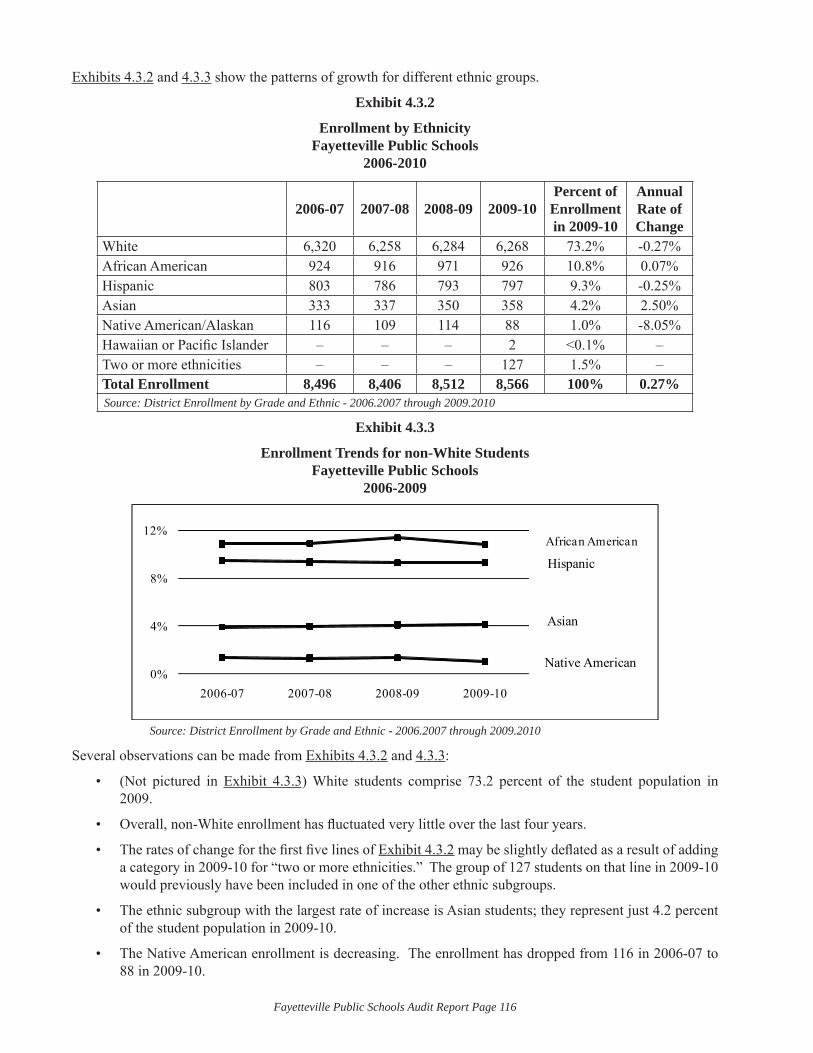
Fayetteville Public Schools Audit Report Page 116
Exhibits 4.3.2 and 4.3.3 show the patterns of growth for different ethnic groups.
Exhibit 4.3.2
Enrollment by EthnicityFayetteville Public Schools
2006-2010
2006-07 2007-08 2008-09 2009-10Percent of
Enrollment in 2009-10
Annual Rate of Change
White 6,320 6,258 6,284 6,268 73.2% -0.27%African American 924 916 971 926 10.8% 0.07%Hispanic 803 786 793 797 9.3% -0.25%Asian 333 337 350 358 4.2% 2.50%Native American/Alaskan 116 109 114 88 1.0% -8.05%Hawaiian or Pacifi c Islander – – – 2 <0.1% –Two or more ethnicities – – – 127 1.5% –Total Enrollment 8,496 8,406 8,512 8,566 100% 0.27%Source: District Enrollment by Grade and Ethnic - 2006.2007 through 2009.2010
Exhibit 4.3.3
Enrollment Trends for non-White StudentsFayetteville Public Schools
2006-2009
African American
Hispanic
Asian
Native American0%
4%
8%
12%
2006-07 2007-08 2008-09 2009-10
Source: District Enrollment by Grade and Ethnic - 2006.2007 through 2009.2010
Several observations can be made from Exhibits 4.3.2 and 4.3.3:
(Not pictured in • Exhibit 4.3.3) White students comprise 73.2 percent of the student population in 2009.
Overall, non-White enrollment has fl uctuated very little over the last four years.•
The rates of change for the fi rst fi ve lines of • Exhibit 4.3.2 may be slightly defl ated as a result of adding a category in 2009-10 for “two or more ethnicities.” The group of 127 students on that line in 2009-10 would previously have been included in one of the other ethnic subgroups.
The ethnic subgroup with the largest rate of increase is Asian students; they represent just 4.2 percent • of the student population in 2009-10.
The Native American enrollment is decreasing. The enrollment has dropped from 116 in 2006-07 to • 88 in 2009-10.
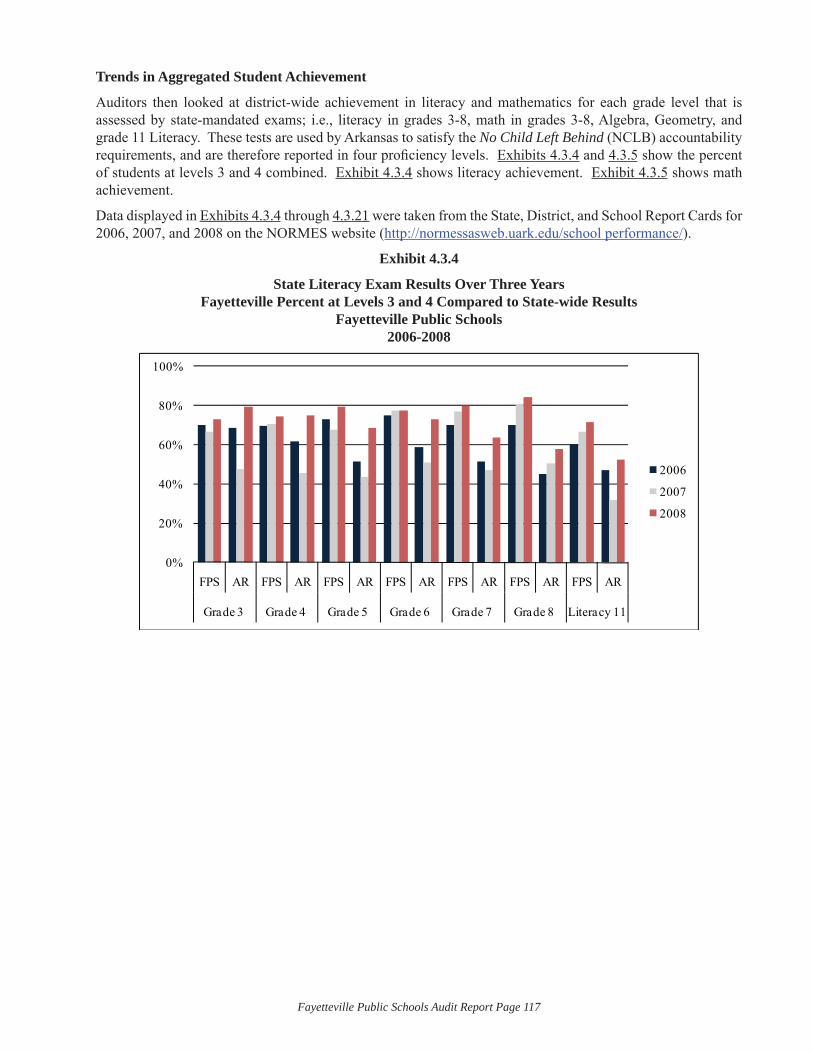
Fayetteville Public Schools Audit Report Page 117
Trends in Aggregated Student Achievement
Auditors then looked at district-wide achievement in literacy and mathematics for each grade level that is assessed by state-mandated exams; i.e., literacy in grades 3-8, math in grades 3-8, Algebra, Geometry, and grade 11 Literacy. These tests are used by Arkansas to satisfy the No Child Left Behind (NCLB) accountability requirements, and are therefore reported in four profi ciency levels. Exhibits 4.3.4 and 4.3.5 show the percent of students at levels 3 and 4 combined. Exhibit 4.3.4 shows literacy achievement. Exhibit 4.3.5 shows math achievement.
Data displayed in Exhibits 4.3.4 through 4.3.21 were taken from the State, District, and School Report Cards for 2006, 2007, and 2008 on the NORMES website (http://normessasweb.uark.edu/school performance/).
Exhibit 4.3.4
State Literacy Exam Results Over Three Years Fayetteville Percent at Levels 3 and 4 Compared to State-wide Results
Fayetteville Public Schools2006-2008
0%
20%
40%
60%
80%
100%
FPS AR FPS AR FPS AR FPS AR FPS AR FPS AR FPS AR
Grade 3 Grade 4 Grade 5 Grade 6 Grade 7 Grade 8 Literacy 11
2006
2007
2008
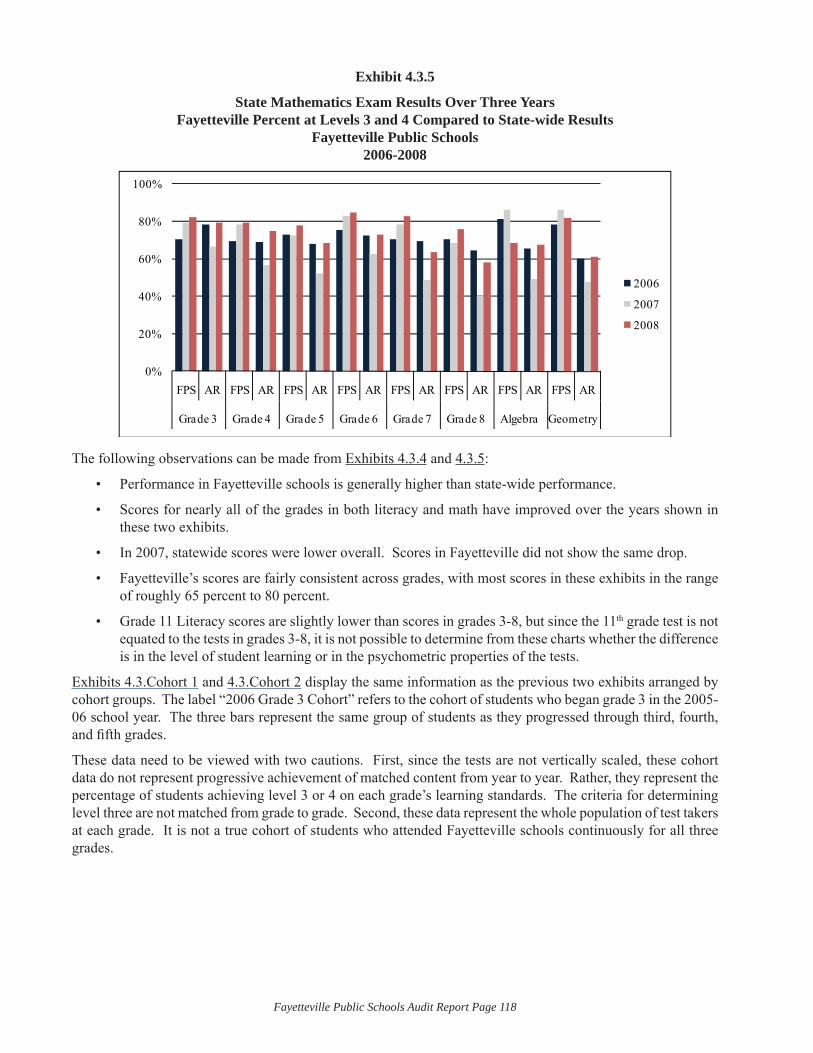
Fayetteville Public Schools Audit Report Page 118
Exhibit 4.3.5
State Mathematics Exam Results Over Three Years Fayetteville Percent at Levels 3 and 4 Compared to State-wide Results
Fayetteville Public Schools2006-2008
0%
20%
40%
60%
80%
100%
FPS AR FPS AR FPS AR FPS AR FPS AR FPS AR FPS AR FPS AR
Grade 3 Grade 4 Grade 5 Grade 6 Grade 7 Grade 8 Algebra Geometry
2006
2007
2008
The following observations can be made from Exhibits 4.3.4 and 4.3.5:
Performance in Fayetteville schools is generally higher than state-wide performance.•
Scores for nearly all of the grades in both literacy and math have improved over the years shown in • these two exhibits.
In 2007, statewide scores were lower overall. Scores in Fayetteville did not show the same drop.•
Fayetteville’s scores are fairly consistent across grades, with most scores in these exhibits in the range • of roughly 65 percent to 80 percent.
Grade 11 Literacy scores are slightly lower than scores in grades 3-8, but since the 11• th grade test is not equated to the tests in grades 3-8, it is not possible to determine from these charts whether the difference is in the level of student learning or in the psychometric properties of the tests.
Exhibits 4.3.Cohort 1 and 4.3.Cohort 2 display the same information as the previous two exhibits arranged by cohort groups. The label “2006 Grade 3 Cohort” refers to the cohort of students who began grade 3 in the 2005-06 school year. The three bars represent the same group of students as they progressed through third, fourth, and fi fth grades.
These data need to be viewed with two cautions. First, since the tests are not vertically scaled, these cohort data do not represent progressive achievement of matched content from year to year. Rather, they represent the percentage of students achieving level 3 or 4 on each grade’s learning standards. The criteria for determining level three are not matched from grade to grade. Second, these data represent the whole population of test takers at each grade. It is not a true cohort of students who attended Fayetteville schools continuously for all three grades.
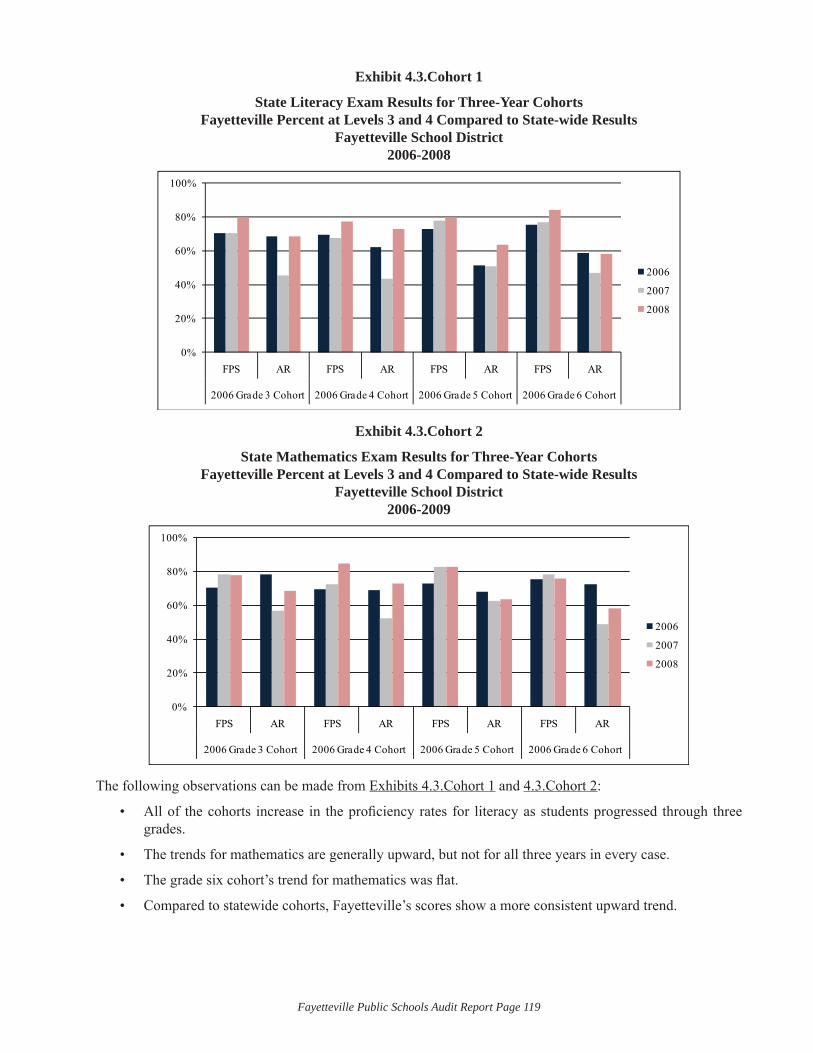
Fayetteville Public Schools Audit Report Page 119
Exhibit 4.3.Cohort 1
State Literacy Exam Results for Three-Year Cohorts Fayetteville Percent at Levels 3 and 4 Compared to State-wide Results
Fayetteville School District2006-2008
0%
20%
40%
60%
80%
100%
FPS AR FPS AR FPS AR FPS AR
2006 Grade 3 Cohort 2006 Grade 4 Cohort 2006 Grade 5 Cohort 2006 Grade 6 Cohort
2006
2007
2008
Exhibit 4.3.Cohort 2
State Mathematics Exam Results for Three-Year Cohorts Fayetteville Percent at Levels 3 and 4 Compared to State-wide Results
Fayetteville School District2006-2009
0%
20%
40%
60%
80%
100%
FPS AR FPS AR FPS AR FPS AR
2006 Grade 3 Cohort 2006 Grade 4 Cohort 2006 Grade 5 Cohort 2006 Grade 6 Cohort
2006
2007
2008
The following observations can be made from Exhibits 4.3.Cohort 1 and 4.3.Cohort 2:
All of the cohorts increase in the profi ciency rates for literacy as students progressed through three • grades.
The trends for mathematics are generally upward, but not for all three years in every case.•
The grade six cohort’s trend for mathematics was fl at.•
Compared to statewide cohorts, Fayetteville’s scores show a more consistent upward trend.•
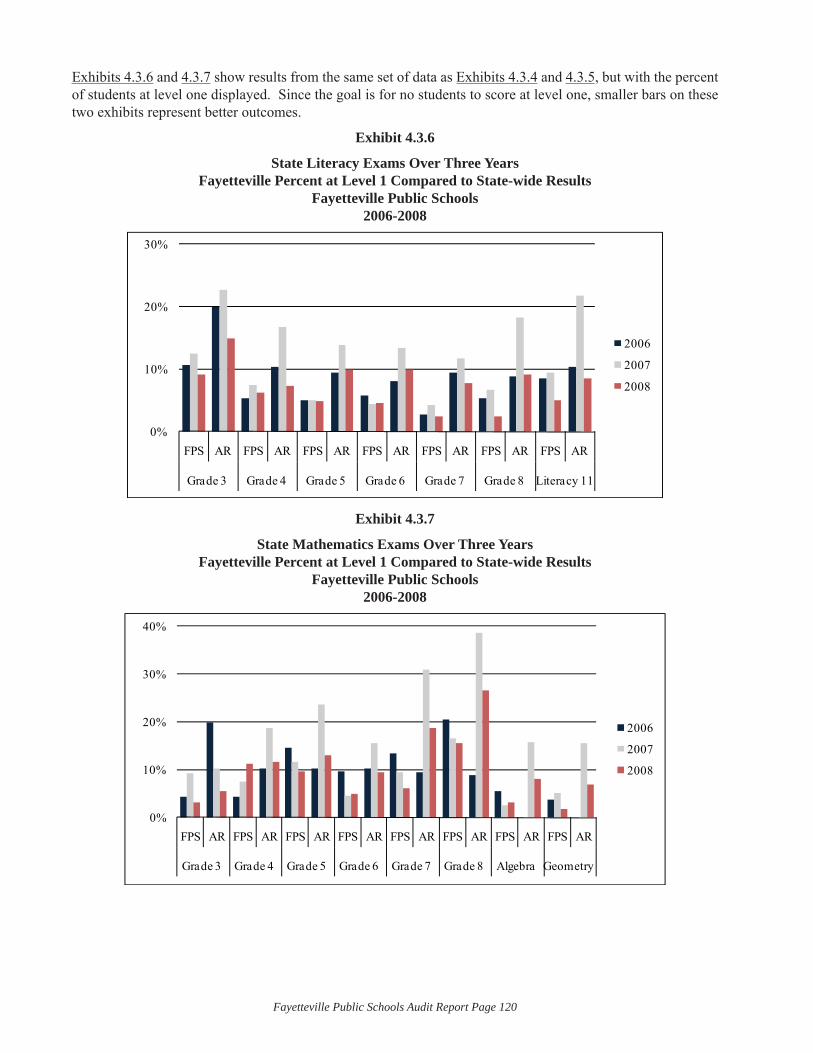
Fayetteville Public Schools Audit Report Page 120
Exhibits 4.3.6 and 4.3.7 show results from the same set of data as Exhibits 4.3.4 and 4.3.5, but with the percent of students at level one displayed. Since the goal is for no students to score at level one, smaller bars on these two exhibits represent better outcomes.
Exhibit 4.3.6
State Literacy Exams Over Three Years Fayetteville Percent at Level 1 Compared to State-wide Results
Fayetteville Public Schools2006-2008
0%
10%
20%
30%
FPS AR FPS AR FPS AR FPS AR FPS AR FPS AR FPS AR
Grade 3 Grade 4 Grade 5 Grade 6 Grade 7 Grade 8 Literacy 11
2006
2007
2008
Exhibit 4.3.7
State Mathematics Exams Over Three Years Fayetteville Percent at Level 1 Compared to State-wide Results
Fayetteville Public Schools2006-2008
0%
10%
20%
30%
40%
FPS AR FPS AR FPS AR FPS AR FPS AR FPS AR FPS AR FPS AR
Grade 3 Grade 4 Grade 5 Grade 6 Grade 7 Grade 8 Algebra Geometry
2006
2007
2008
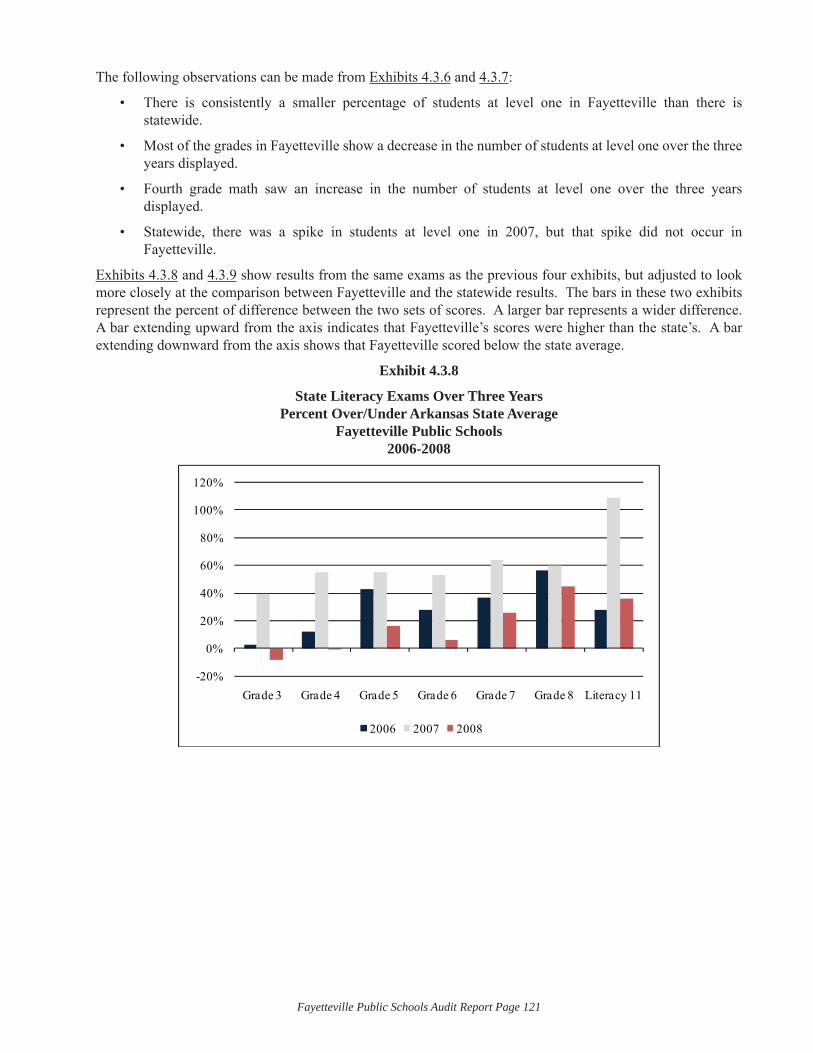
Fayetteville Public Schools Audit Report Page 121
The following observations can be made from Exhibits 4.3.6 and 4.3.7:
There is consistently a smaller percentage of students at level one in Fayetteville than there is • statewide.
Most of the grades in Fayetteville show a decrease in the number of students at level one over the three • years displayed.
Fourth grade math saw an increase in the number of students at level one over the three years • displayed.
Statewide, there was a spike in students at level one in 2007, but that spike did not occur in • Fayetteville.
Exhibits 4.3.8 and 4.3.9 show results from the same exams as the previous four exhibits, but adjusted to look more closely at the comparison between Fayetteville and the statewide results. The bars in these two exhibits represent the percent of difference between the two sets of scores. A larger bar represents a wider difference. A bar extending upward from the axis indicates that Fayetteville’s scores were higher than the state’s. A bar extending downward from the axis shows that Fayetteville scored below the state average.
Exhibit 4.3.8
State Literacy Exams Over Three Years Percent Over/Under Arkansas State Average
Fayetteville Public Schools2006-2008
-20%
0%
20%
40%
60%
80%
100%
120%
Grade 3 Grade 4 Grade 5 Grade 6 Grade 7 Grade 8 Literacy 11
2006 2007 2008
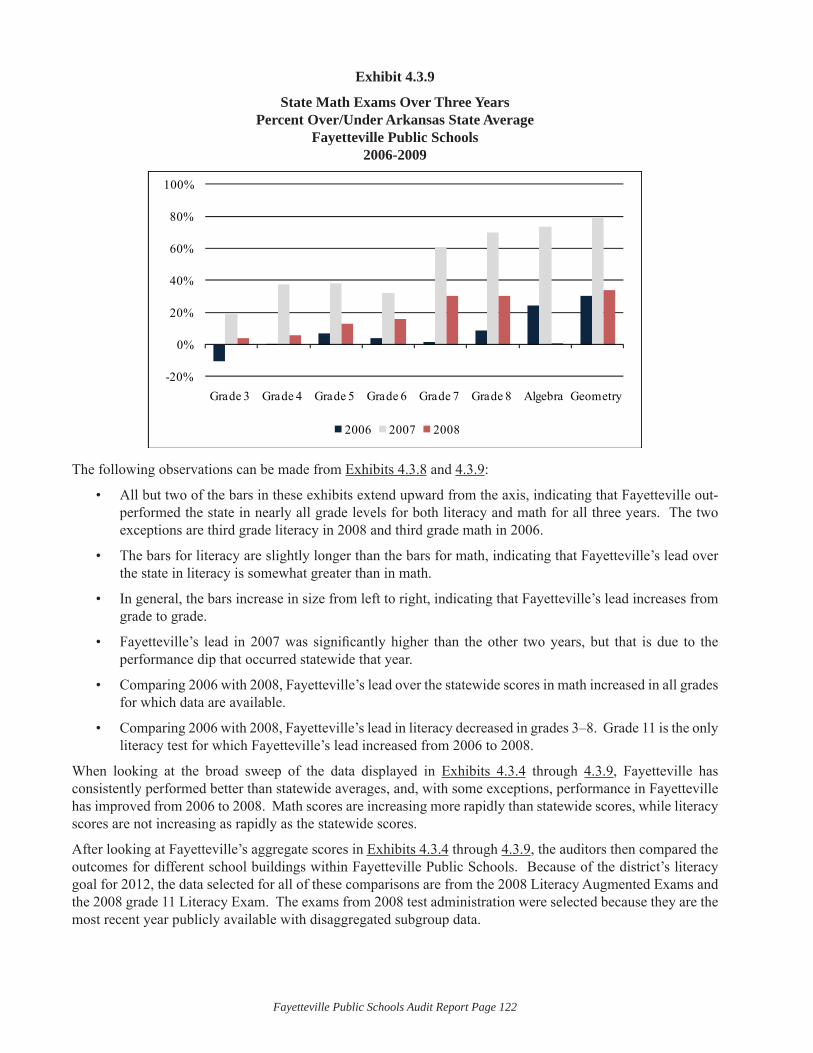
Fayetteville Public Schools Audit Report Page 122
Exhibit 4.3.9
State Math Exams Over Three Years Percent Over/Under Arkansas State Average
Fayetteville Public Schools2006-2009
-20%
0%
20%
40%
60%
80%
100%
Grade 3 Grade 4 Grade 5 Grade 6 Grade 7 Grade 8 Algebra Geometry
2006 2007 2008
The following observations can be made from Exhibits 4.3.8 and 4.3.9:
All but two of the bars in these exhibits extend upward from the axis, indicating that Fayetteville out-• performed the state in nearly all grade levels for both literacy and math for all three years. The two exceptions are third grade literacy in 2008 and third grade math in 2006.
The bars for literacy are slightly longer than the bars for math, indicating that Fayetteville’s lead over • the state in literacy is somewhat greater than in math.
In general, the bars increase in size from left to right, indicating that Fayetteville’s lead increases from • grade to grade.
Fayetteville’s lead in 2007 was signifi cantly higher than the other two years, but that is due to the • performance dip that occurred statewide that year.
Comparing 2006 with 2008, Fayetteville’s lead over the statewide scores in math increased in all grades • for which data are available.
Comparing 2006 with 2008, Fayetteville’s lead in literacy decreased in grades 3–8. Grade 11 is the only • literacy test for which Fayetteville’s lead increased from 2006 to 2008.
When looking at the broad sweep of the data displayed in Exhibits 4.3.4 through 4.3.9, Fayetteville has consistently performed better than statewide averages, and, with some exceptions, performance in Fayetteville has improved from 2006 to 2008. Math scores are increasing more rapidly than statewide scores, while literacy scores are not increasing as rapidly as the statewide scores.
After looking at Fayetteville’s aggregate scores in Exhibits 4.3.4 through 4.3.9, the auditors then compared the outcomes for different school buildings within Fayetteville Public Schools. Because of the district’s literacy goal for 2012, the data selected for all of these comparisons are from the 2008 Literacy Augmented Exams and the 2008 grade 11 Literacy Exam. The exams from 2008 test administration were selected because they are the most recent year publicly available with disaggregated subgroup data.
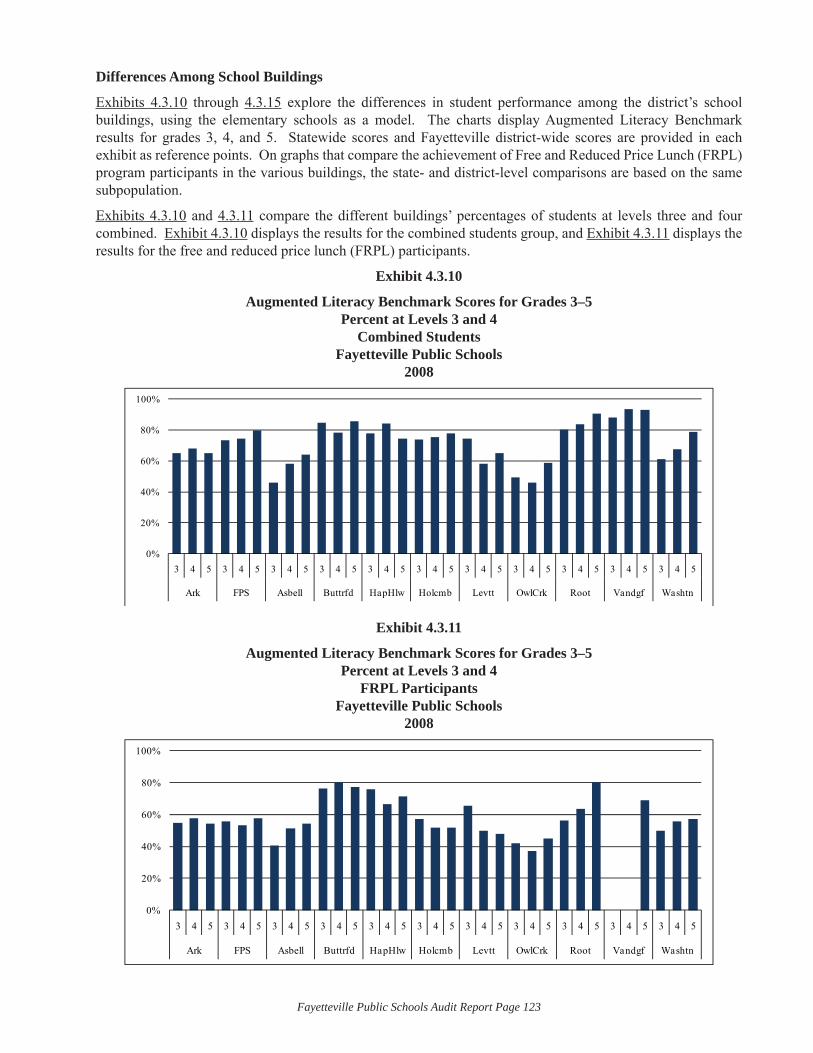
Fayetteville Public Schools Audit Report Page 123
Differences Among School Buildings
Exhibits 4.3.10 through 4.3.15 explore the differences in student performance among the district’s school buildings, using the elementary schools as a model. The charts display Augmented Literacy Benchmark results for grades 3, 4, and 5. Statewide scores and Fayetteville district-wide scores are provided in each exhibit as reference points. On graphs that compare the achievement of Free and Reduced Price Lunch (FRPL) program participants in the various buildings, the state- and district-level comparisons are based on the same subpopulation.
Exhibits 4.3.10 and 4.3.11 compare the different buildings’ percentages of students at levels three and four combined. Exhibit 4.3.10 displays the results for the combined students group, and Exhibit 4.3.11 displays the results for the free and reduced price lunch (FRPL) participants.
Exhibit 4.3.10
Augmented Literacy Benchmark Scores for Grades 3–5 Percent at Levels 3 and 4
Combined StudentsFayetteville Public Schools
2008
0%
20%
40%
60%
80%
100%
3 4 5 3 4 5 3 4 5 3 4 5 3 4 5 3 4 5 3 4 5 3 4 5 3 4 5 3 4 5 3 4 5
Ark FPS Asbell Buttrfd HapHlw Holcmb Levtt OwlCrk Root Vandgf Washtn
Exhibit 4.3.11
Augmented Literacy Benchmark Scores for Grades 3–5 Percent at Levels 3 and 4
FRPL ParticipantsFayetteville Public Schools
2008
0%
20%
40%
60%
80%
100%
3 4 5 3 4 5 3 4 5 3 4 5 3 4 5 3 4 5 3 4 5 3 4 5 3 4 5 3 4 5 3 4 5
Ark FPS Asbell Buttrfd HapHlw Holcmb Levtt OwlCrk Root Vandgf Washtn
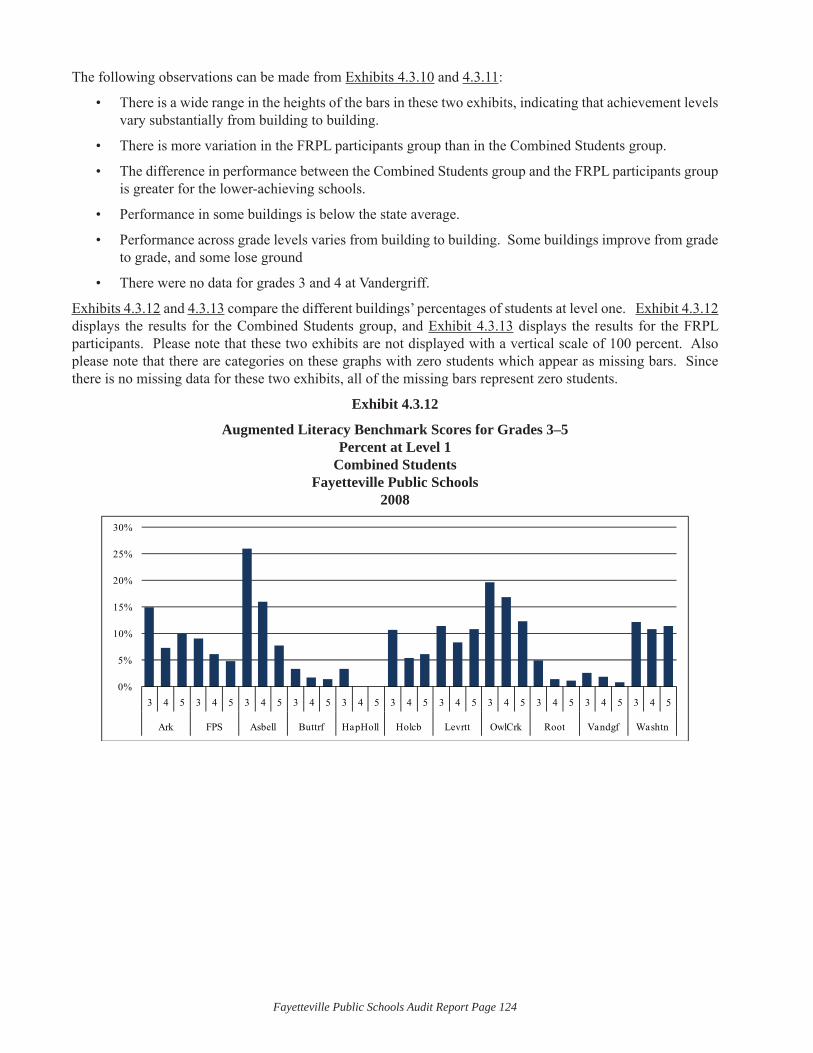
Fayetteville Public Schools Audit Report Page 124
The following observations can be made from Exhibits 4.3.10 and 4.3.11:
There is a wide range in the heights of the bars in these two exhibits, indicating that achievement levels • vary substantially from building to building.
There is more variation in the FRPL participants group than in the Combined Students group.•
The difference in performance between the Combined Students group and the FRPL participants group • is greater for the lower-achieving schools.
Performance in some buildings is below the state average.•
Performance across grade levels varies from building to building. Some buildings improve from grade • to grade, and some lose ground
There were no data for grades 3 and 4 at Vandergriff.•
Exhibits 4.3.12 and 4.3.13 compare the different buildings’ percentages of students at level one. Exhibit 4.3.12 displays the results for the Combined Students group, and Exhibit 4.3.13 displays the results for the FRPL participants. Please note that these two exhibits are not displayed with a vertical scale of 100 percent. Also please note that there are categories on these graphs with zero students which appear as missing bars. Since there is no missing data for these two exhibits, all of the missing bars represent zero students.
Exhibit 4.3.12
Augmented Literacy Benchmark Scores for Grades 3–5 Percent at Level 1
Combined StudentsFayetteville Public Schools
2008
0%
5%
10%
15%
20%
25%
30%
3 4 5 3 4 5 3 4 5 3 4 5 3 4 5 3 4 5 3 4 5 3 4 5 3 4 5 3 4 5 3 4 5
Ark FPS Asbell Buttrf HapHoll Holcb Levrtt OwlCrk Root Vandgf Washtn

Fayetteville Public Schools Audit Report Page 125
Exhibit 4.3.13
Augmented Literacy Benchmark Scores for Grades 3–5 Percent at Level 1 FRPL Participants
Fayetteville Public Schools2008
0%
5%
10%
15%
20%
25%
30%
35%
3 4 5 3 4 5 3 4 5 3 4 5 3 4 5 3 4 5 3 4 5 3 4 5 3 4 5 3 4 5 3 4 5
Ark FPS Asbell Buttrf HapHoll Holcb Levrtt OwlCrk Root Vandgf Washtn
The following observations can be made from Exhibits 4.3.12 and 4.3.13:
The grade-to-grade patterns vary distinctly among the schools. •
Three schools (Holcomb, Leverette, and Washington) show an increase in scores from grade to grade • for the combined students group. Two schools show steep increases for the FRPL participants group.
Vandergriff has fewer than 10 students in the FRPL participants group in grade 3 for 2006 and 2007. • Their scores for those cases are not reported.
Exhibits 4.3.14 and 4.3.15 compare the different buildings’ percent of students over/under the state average for students at levels three and four combined. This offers another perspective on the data in Exhibits 4.3.10 and 4.3.11. Exhibit 4.3.14 displays the results for the combined students group, and Exhibit 4.3.15 displays the results for the FRPL participants.
Exhibit 4.3.14
Augmented Literacy Benchmark Scores for Grades 3–5 Percent at Levels 3 and 4
Combined StudentsFayetteville Public Schools
2008
-40
-30
-20
-10
0
10
20
30
40
50
3 4 5 3 4 5 3 4 5 3 4 5 3 4 5 3 4 5 3 4 5 3 4 5 3 4 5 3 4 5
FPS Asbell Buttrfd HapHlw Holcmb Levtt OwlCrk Root Vandgf Washtn
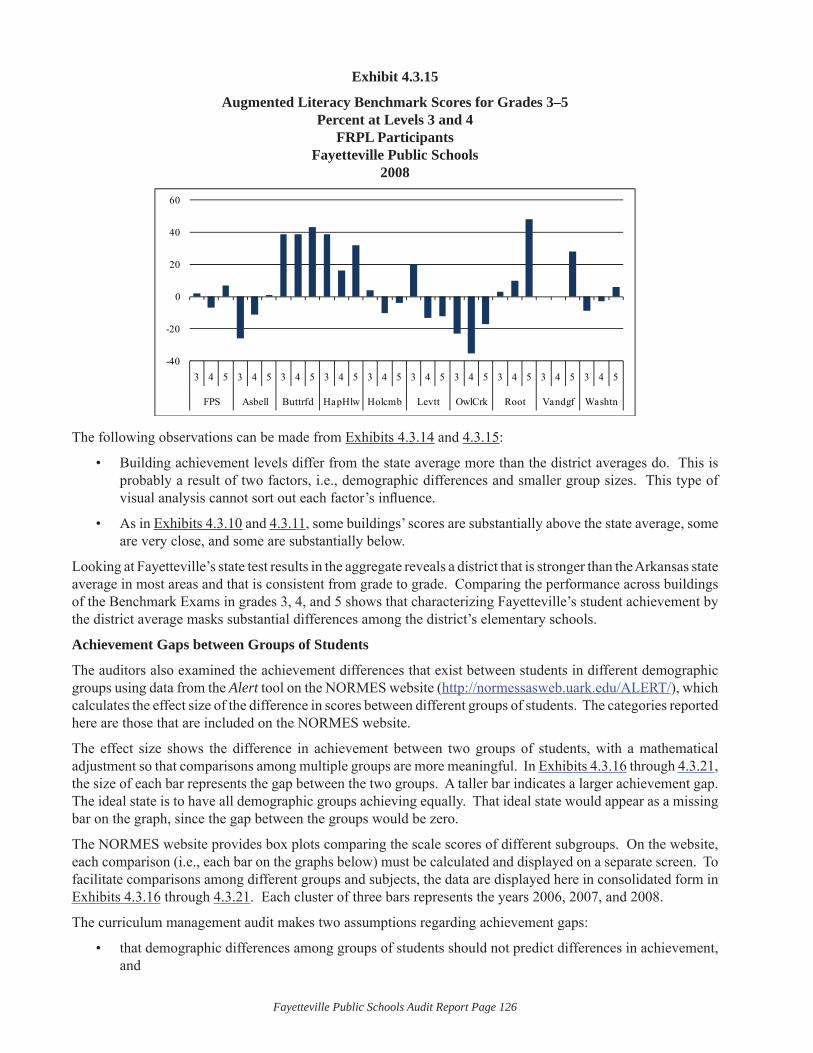
Fayetteville Public Schools Audit Report Page 126
Exhibit 4.3.15
Augmented Literacy Benchmark Scores for Grades 3–5 Percent at Levels 3 and 4
FRPL ParticipantsFayetteville Public Schools
2008
-40
-20
0
20
40
60
3 4 5 3 4 5 3 4 5 3 4 5 3 4 5 3 4 5 3 4 5 3 4 5 3 4 5 3 4 5
FPS Asbell Buttrfd HapHlw Holcmb Levtt OwlCrk Root Vandgf Washtn
The following observations can be made from Exhibits 4.3.14 and 4.3.15:
Building achievement levels differ from the state average more than the district averages do. This is • probably a result of two factors, i.e., demographic differences and smaller group sizes. This type of visual analysis cannot sort out each factor’s infl uence.
As in • Exhibits 4.3.10 and 4.3.11, some buildings’ scores are substantially above the state average, some are very close, and some are substantially below.
Looking at Fayetteville’s state test results in the aggregate reveals a district that is stronger than the Arkansas state average in most areas and that is consistent from grade to grade. Comparing the performance across buildings of the Benchmark Exams in grades 3, 4, and 5 shows that characterizing Fayetteville’s student achievement by the district average masks substantial differences among the district’s elementary schools.
Achievement Gaps between Groups of Students
The auditors also examined the achievement differences that exist between students in different demographic groups using data from the Alert tool on the NORMES website (http://normessasweb.uark.edu/ALERT/), which calculates the effect size of the difference in scores between different groups of students. The categories reported here are those that are included on the NORMES website.
The effect size shows the difference in achievement between two groups of students, with a mathematical adjustment so that comparisons among multiple groups are more meaningful. In Exhibits 4.3.16 through 4.3.21, the size of each bar represents the gap between the two groups. A taller bar indicates a larger achievement gap. The ideal state is to have all demographic groups achieving equally. That ideal state would appear as a missing bar on the graph, since the gap between the groups would be zero.
The NORMES website provides box plots comparing the scale scores of different subgroups. On the website, each comparison (i.e., each bar on the graphs below) must be calculated and displayed on a separate screen. To facilitate comparisons among different groups and subjects, the data are displayed here in consolidated form in Exhibits 4.3.16 through 4.3.21. Each cluster of three bars represents the years 2006, 2007, and 2008.
The curriculum management audit makes two assumptions regarding achievement gaps:
that demographic differences among groups of students should not predict differences in achievement, • and
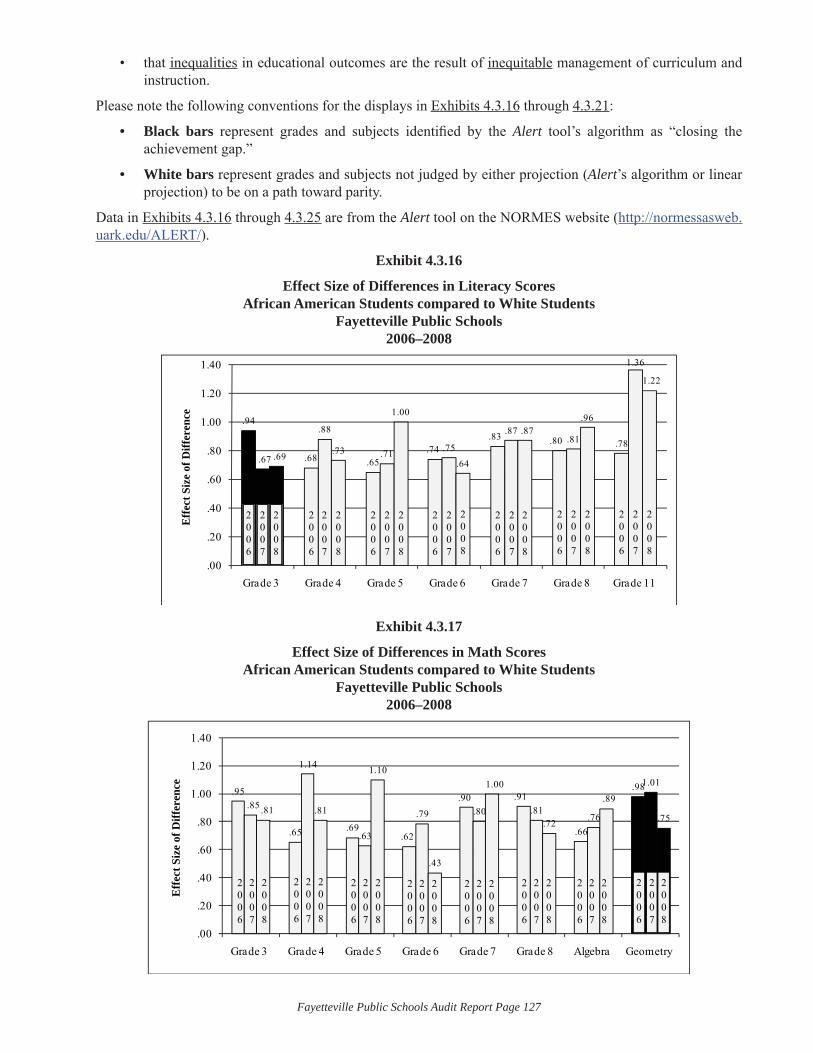
Fayetteville Public Schools Audit Report Page 127
that • inequalities in educational outcomes are the result of inequitable management of curriculum and instruction.
Please note the following conventions for the displays in Exhibits 4.3.16 through 4.3.21:
Black• bars represent grades and subjects identifi ed by the Alert tool’s algorithm as “closing the achievement gap.”
White bars• represent grades and subjects not judged by either projection (Alert’s algorithm or linear projection) to be on a path toward parity.
Data in Exhibits 4.3.16 through 4.3.25 are from the Alert tool on the NORMES website (http://normessasweb.uark.edu/ALERT/).
Exhibit 4.3.16
Effect Size of Differences in Literacy Scores African American Students compared to White Students
Fayetteville Public Schools2006–2008
.94
.68 .65.74
.83 .80 .78
.67
.88
.71 .75
.87.81
1.36
.69 .73
1.00
.64
.87.96
1.22
.00
.20
.40
.60
.80
1.00
1.20
1.40
Grade 3 Grade 4 Grade 5 Grade 6 Grade 7 Grade 8 Grade 11
Eff
ect S
ize
of D
iffer
ence
2007
2008
2006
2006
2006
2006
2006
2006
2006
2007
2008
2008
2007
2007
2008
2007
2008
2007
2008
2006
2007
2008
2006
2007
2008
2007
2008
Exhibit 4.3.17
Effect Size of Differences in Math Scores African American Students compared to White Students
Fayetteville Public Schools2006–2008
.95
.65 .69.62
.90 .91
.66
.98
.85
1.14
.63
.79 .80 .81.76
1.01
.81 .81
1.10
.43
1.00
.72
.89
.75
.00
.20
.40
.60
.80
1.00
1.20
1.40
Grade 3 Grade 4 Grade 5 Grade 6 Grade 7 Grade 8 Algebra Geometry
Eff
ect S
ize
of D
iffer
ence
2007
2008
2006
2006
2007
2008
2007
2008
2006
2007
2008
2006
2007
2008
2006
2007
2008
2006
2007
2008
2006
2007
2008
2006
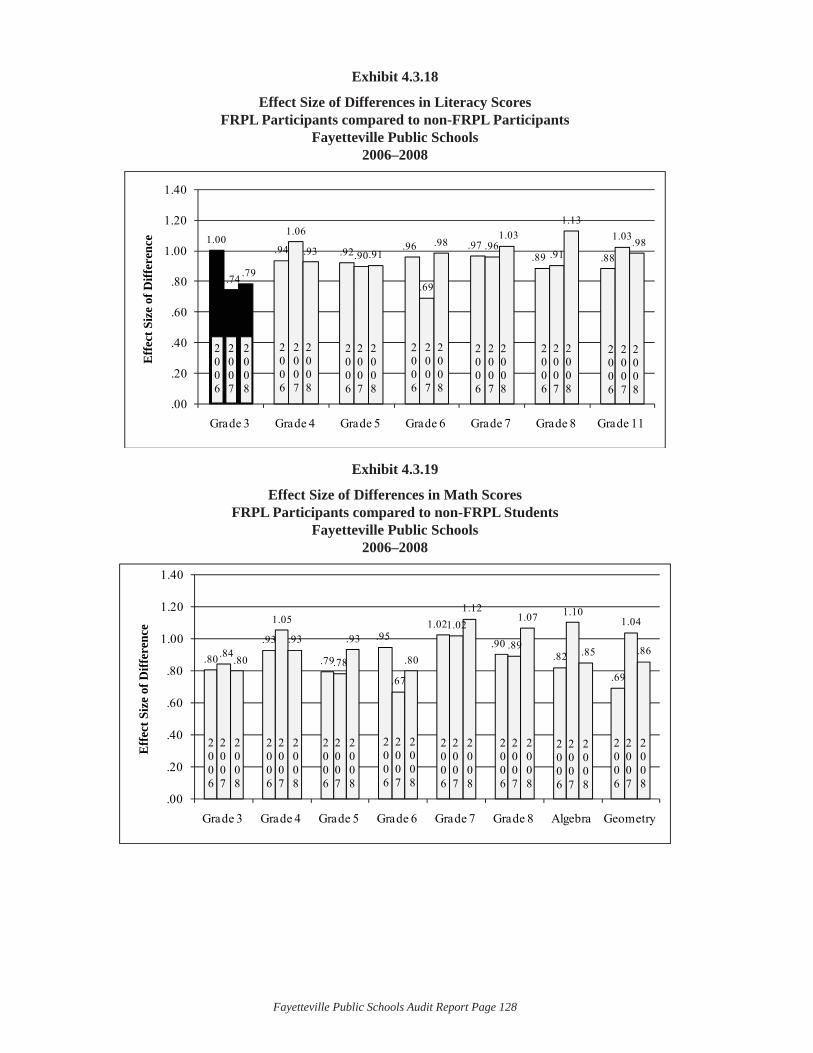
Fayetteville Public Schools Audit Report Page 128
Exhibit 4.3.18
Effect Size of Differences in Literacy Scores FRPL Participants compared to non-FRPL Participants
Fayetteville Public Schools2006–2008
1.00.94 .92 .96 .97
.89 .88
.74
1.06
.90
.69
.96.91
1.03
.79
.93 .91.98
1.031.13
.98
.00
.20
.40
.60
.80
1.00
1.20
1.40
Grade 3 Grade 4 Grade 5 Grade 6 Grade 7 Grade 8 Grade 11
Eff
ect S
ize
of D
iffer
ence
2007
2008
2006
2006
2007
2008
2007
2008
2006
2007
2008
2006
2007
2008
2006
2007
2008
2006
2007
2008
2006
Exhibit 4.3.19
Effect Size of Differences in Math Scores FRPL Participants compared to non-FRPL Students
Fayetteville Public Schools2006–2008
.80
.93
.79
.951.02
.90.82
.69
.84
1.05
.78
.67
1.02
.89
1.101.04
.80
.93 .93
.80
1.121.07
.85 .86
.00
.20
.40
.60
.80
1.00
1.20
1.40
Grade 3 Grade 4 Grade 5 Grade 6 Grade 7 Grade 8 Algebra Geometry
Eff
ect S
ize
of D
iffer
ence
2007
2008
2006
2007
2008
2006
2007
2008
2006
2007
2008
2006
2007
2008
2006
2007
2008
2006
2007
2008
2006
2007
2008
2006
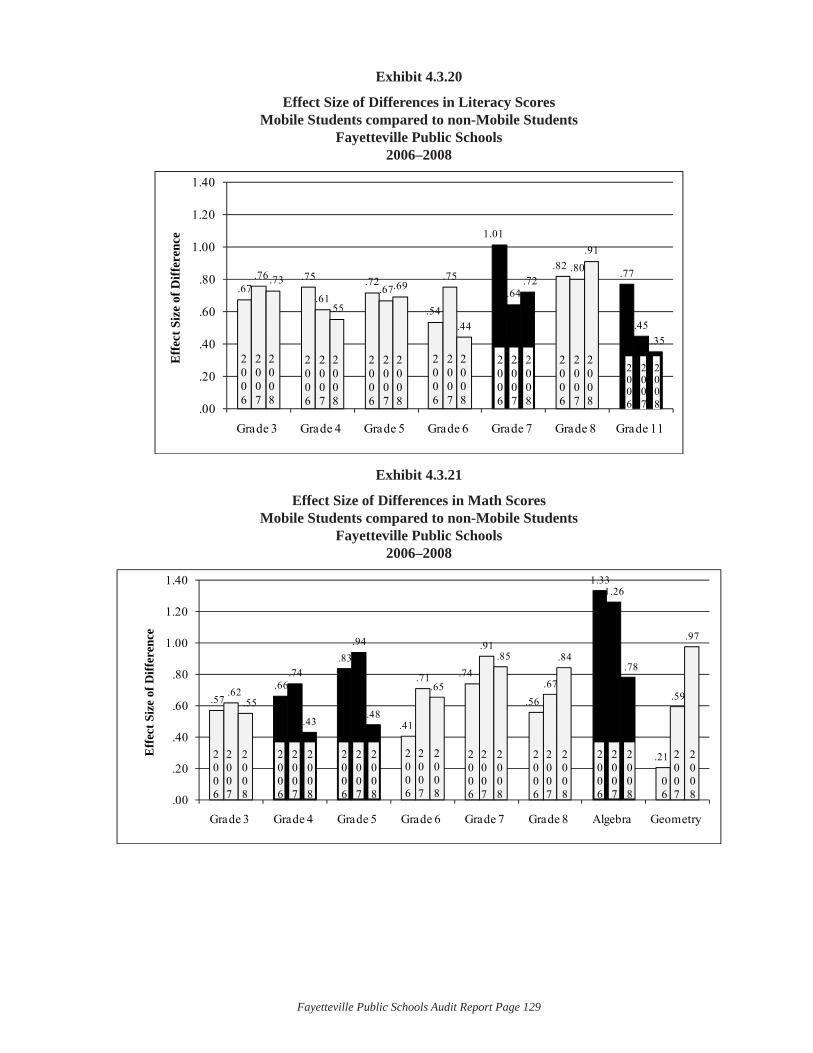
Fayetteville Public Schools Audit Report Page 129
Exhibit 4.3.20
Effect Size of Differences in Literacy Scores Mobile Students compared to non-Mobile Students
Fayetteville Public Schools2006–2008
.67.75 .72
.54
1.01
.82.77.76
.61.67
.75.64
.80
.45
.73
.55
.69
.44
.72
.91
.35
.00
.20
.40
.60
.80
1.00
1.20
1.40
Grade 3 Grade 4 Grade 5 Grade 6 Grade 7 Grade 8 Grade 11
Eff
ect S
ize
of D
iffer
ence
2007
2008
2006
2007
2008
2006
2007
2008
2006
2007
2008
2006
2007
2008
2006
2007
2008
2006
2007
2008
2006
Exhibit 4.3.21
Effect Size of Differences in Math Scores Mobile Students compared to non-Mobile Students
Fayetteville Public Schools2006–2008
.57.66
.83
.41
.74
.56
1.33
.21
.62
.74
.94
.71
.91
.67
1.26
.59.55
.43.48
.65
.85 .84.78
.97
.00
.20
.40
.60
.80
1.00
1.20
1.40
Grade 3 Grade 4 Grade 5 Grade 6 Grade 7 Grade 8 Algebra Geometry
Eff
ect S
ize
of D
iffer
ence
2007
2008
2006
2007
2008
2006
2007
2008
2006
2007
2008
2006
2007
2008
2006
2007
2008
06
2007
2008
2006
2007
2008
2006
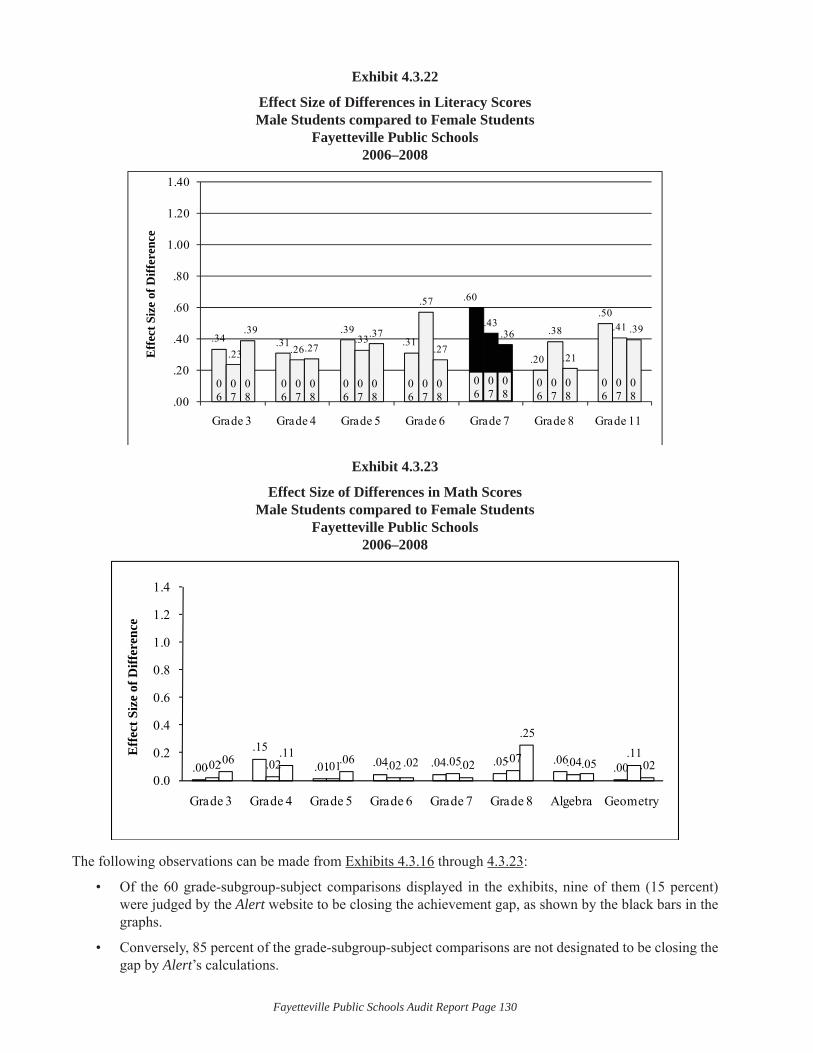
Fayetteville Public Schools Audit Report Page 130
Exhibit 4.3.22
Effect Size of Differences in Literacy Scores Male Students compared to Female Students
Fayetteville Public Schools2006–2008
.34 .31.39
.31
.60
.20
.50
.23 .26.33
.57
.43.38 .41.39
.27.37
.27.36
.21
.39
.00
.20
.40
.60
.80
1.00
1.20
1.40
Grade 3 Grade 4 Grade 5 Grade 6 Grade 7 Grade 8 Grade 11
Eff
ect S
ize
of D
iffer
ence
06
07
08
06
07
08
06
07
08
06
07
08
06
07
08
06
07
08
06
07
08
Exhibit 4.3.23
Effect Size of Differences in Math Scores Male Students compared to Female Students
Fayetteville Public Schools2006–2008
.00
.15.01 .04 .04 .05 .06 .00.02 .02 .01 .02 .05 .07 .04
.11.06 .11 .06 .02 .02
.25
.05 .020.0
0.2
0.4
0.6
0.8
1.0
1.2
1.4
Grade 3 Grade 4 Grade 5 Grade 6 Grade 7 Grade 8 Algebra Geometry
Eff
ect S
ize
of D
iffer
ence
The following observations can be made from Exhibits 4.3.16 through 4.3.23:
Of the 60 grade-subgroup-subject comparisons displayed in the exhibits, nine of them (15 percent) • were judged by the Alert website to be closing the achievement gap, as shown by the black bars in the graphs.
Conversely, 85 percent of the grade-subgroup-subject comparisons are not designated to be closing the • gap by Alert’s calculations.
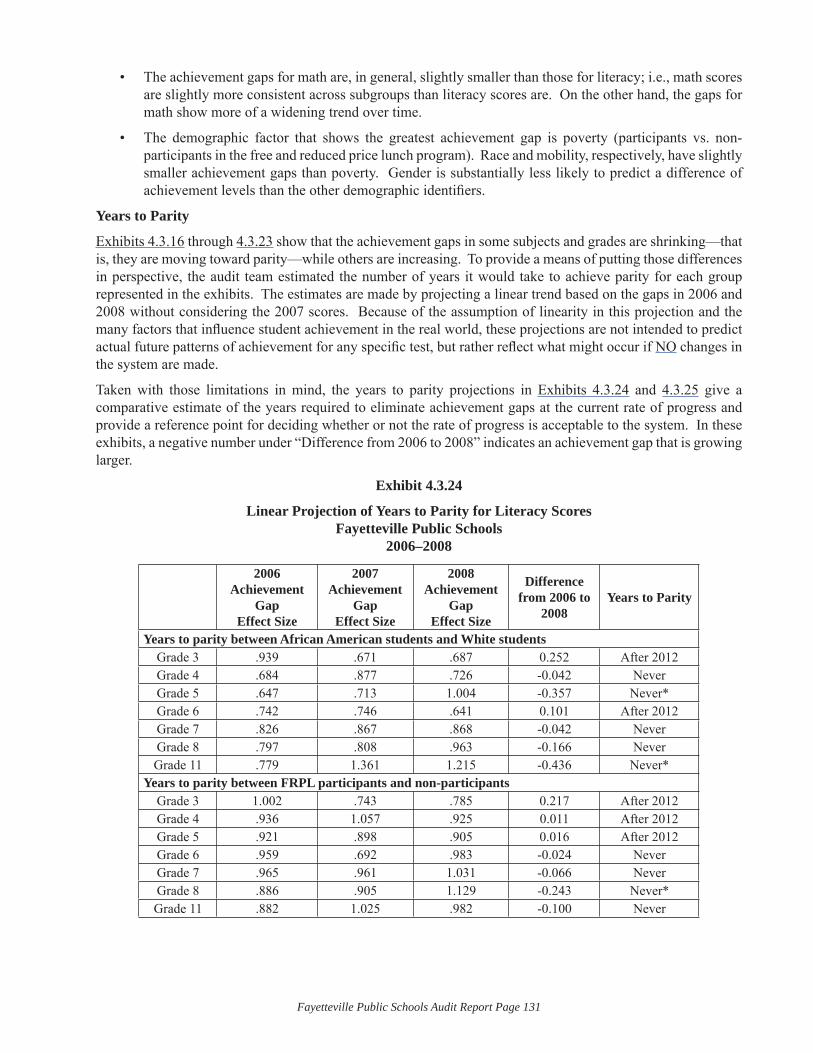
Fayetteville Public Schools Audit Report Page 131
The achievement gaps for math are, in general, slightly smaller than those for literacy; i.e., math scores • are slightly more consistent across subgroups than literacy scores are. On the other hand, the gaps for math show more of a widening trend over time.
The demographic factor that shows the greatest achievement gap is poverty (participants vs. non-• participants in the free and reduced price lunch program). Race and mobility, respectively, have slightly smaller achievement gaps than poverty. Gender is substantially less likely to predict a difference of achievement levels than the other demographic identifi ers.
Years to Parity
Exhibits 4.3.16 through 4.3.23 show that the achievement gaps in some subjects and grades are shrinking—that is, they are moving toward parity—while others are increasing. To provide a means of putting those differences in perspective, the audit team estimated the number of years it would take to achieve parity for each group represented in the exhibits. The estimates are made by projecting a linear trend based on the gaps in 2006 and 2008 without considering the 2007 scores. Because of the assumption of linearity in this projection and the many factors that infl uence student achievement in the real world, these projections are not intended to predict actual future patterns of achievement for any specifi c test, but rather refl ect what might occur if NO changes in the system are made.
Taken with those limitations in mind, the years to parity projections in Exhibits 4.3.24 and 4.3.25 give a comparative estimate of the years required to eliminate achievement gaps at the current rate of progress and provide a reference point for deciding whether or not the rate of progress is acceptable to the system. In these exhibits, a negative number under “Difference from 2006 to 2008” indicates an achievement gap that is growing larger.
Exhibit 4.3.24
Linear Projection of Years to Parity for Literacy ScoresFayetteville Public Schools
2006–2008
2006Achievement
GapEffect Size
2007 Achievement
GapEffect Size
2008 Achievement
GapEffect Size
Difference from 2006 to
2008Years to Parity
Years to parity between African American students and White studentsGrade 3 .939 .671 .687 0.252 After 2012Grade 4 .684 .877 .726 -0.042 NeverGrade 5 .647 .713 1.004 -0.357 Never*Grade 6 .742 .746 .641 0.101 After 2012Grade 7 .826 .867 .868 -0.042 NeverGrade 8 .797 .808 .963 -0.166 NeverGrade 11 .779 1.361 1.215 -0.436 Never*
Years to parity between FRPL participants and non-participantsGrade 3 1.002 .743 .785 0.217 After 2012Grade 4 .936 1.057 .925 0.011 After 2012Grade 5 .921 .898 .905 0.016 After 2012Grade 6 .959 .692 .983 -0.024 NeverGrade 7 .965 .961 1.031 -0.066 NeverGrade 8 .886 .905 1.129 -0.243 Never*Grade 11 .882 1.025 .982 -0.100 Never
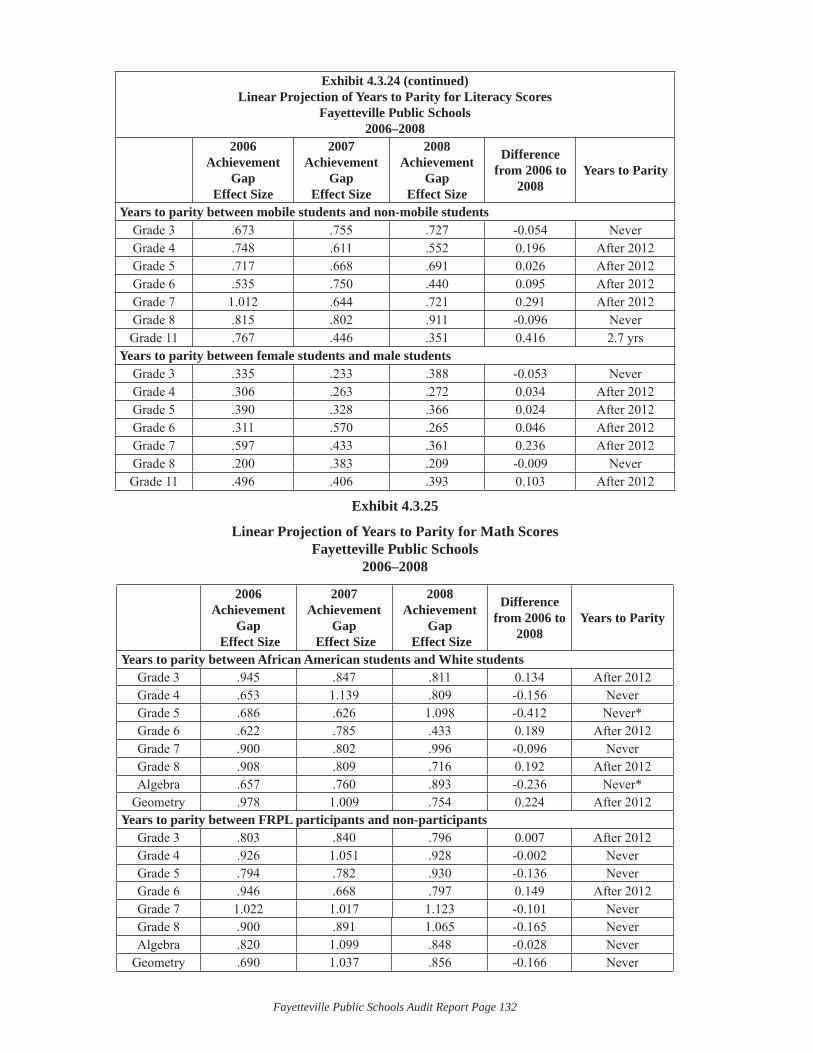
Fayetteville Public Schools Audit Report Page 132
Exhibit 4.3.24 (continued)Linear Projection of Years to Parity for Literacy Scores
Fayetteville Public Schools2006–2008
2006Achievement
GapEffect Size
2007 Achievement
GapEffect Size
2008 Achievement
GapEffect Size
Difference from 2006 to
2008Years to Parity
Years to parity between mobile students and non-mobile studentsGrade 3 .673 .755 .727 -0.054 NeverGrade 4 .748 .611 .552 0.196 After 2012Grade 5 .717 .668 .691 0.026 After 2012Grade 6 .535 .750 .440 0.095 After 2012Grade 7 1.012 .644 .721 0.291 After 2012Grade 8 .815 .802 .911 -0.096 NeverGrade 11 .767 .446 .351 0.416 2.7 yrs
Years to parity between female students and male studentsGrade 3 .335 .233 .388 -0.053 NeverGrade 4 .306 .263 .272 0.034 After 2012Grade 5 .390 .328 .366 0.024 After 2012Grade 6 .311 .570 .265 0.046 After 2012Grade 7 .597 .433 .361 0.236 After 2012Grade 8 .200 .383 .209 -0.009 NeverGrade 11 .496 .406 .393 0.103 After 2012
Exhibit 4.3.25
Linear Projection of Years to Parity for Math ScoresFayetteville Public Schools
2006–2008
2006Achievement
Gap Effect Size
2007 Achievement
Gap Effect Size
2008 Achievement
Gap Effect Size
Difference from 2006 to
2008Years to Parity
Years to parity between African American students and White studentsGrade 3 .945 .847 .811 0.134 After 2012Grade 4 .653 1.139 .809 -0.156 NeverGrade 5 .686 .626 1.098 -0.412 Never*Grade 6 .622 .785 .433 0.189 After 2012Grade 7 .900 .802 .996 -0.096 NeverGrade 8 .908 .809 .716 0.192 After 2012Algebra .657 .760 .893 -0.236 Never*
Geometry .978 1.009 .754 0.224 After 2012Years to parity between FRPL participants and non-participants
Grade 3 .803 .840 .796 0.007 After 2012Grade 4 .926 1.051 .928 -0.002 NeverGrade 5 .794 .782 .930 -0.136 NeverGrade 6 .946 .668 .797 0.149 After 2012Grade 7 1.022 1.017 1.123 -0.101 NeverGrade 8 .900 .891 1.065 -0.165 NeverAlgebra .820 1.099 .848 -0.028 Never
Geometry .690 1.037 .856 -0.166 Never
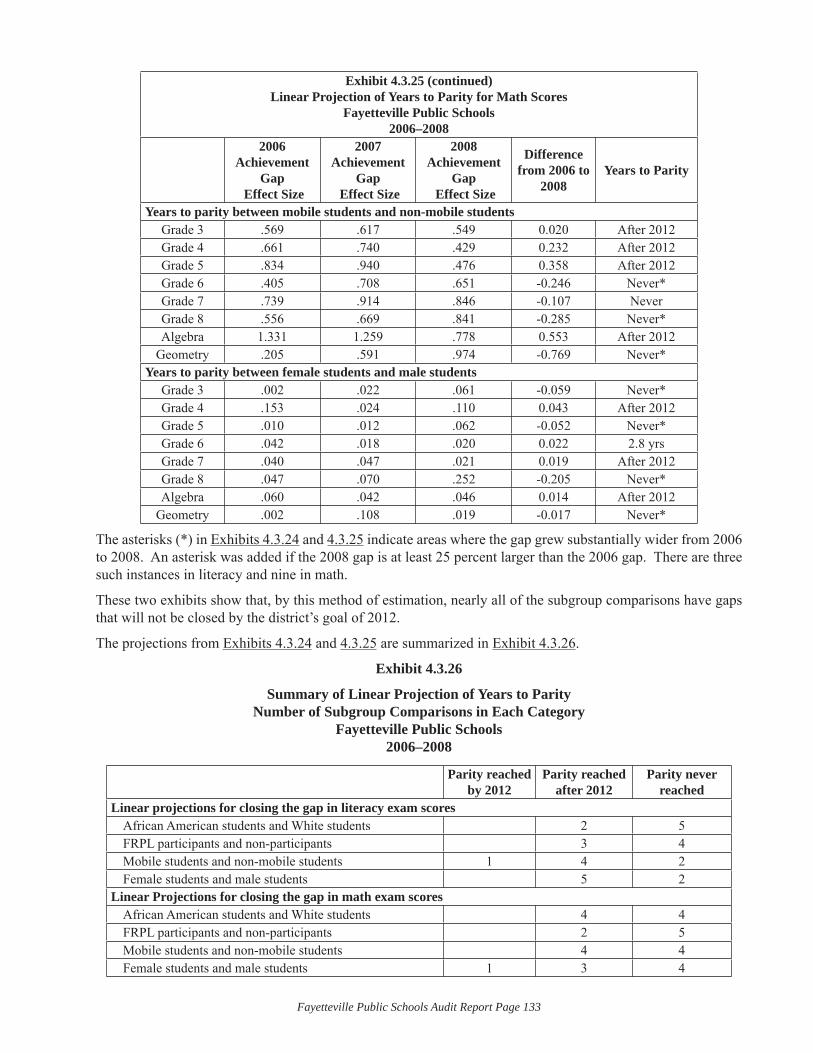
Fayetteville Public Schools Audit Report Page 133
Exhibit 4.3.25 (continued)Linear Projection of Years to Parity for Math Scores
Fayetteville Public Schools2006–2008
2006Achievement
Gap Effect Size
2007 Achievement
Gap Effect Size
2008 Achievement
Gap Effect Size
Difference from 2006 to
2008Years to Parity
Years to parity between mobile students and non-mobile studentsGrade 3 .569 .617 .549 0.020 After 2012Grade 4 .661 .740 .429 0.232 After 2012Grade 5 .834 .940 .476 0.358 After 2012Grade 6 .405 .708 .651 -0.246 Never*Grade 7 .739 .914 .846 -0.107 NeverGrade 8 .556 .669 .841 -0.285 Never*Algebra 1.331 1.259 .778 0.553 After 2012
Geometry .205 .591 .974 -0.769 Never*Years to parity between female students and male students
Grade 3 .002 .022 .061 -0.059 Never*Grade 4 .153 .024 .110 0.043 After 2012Grade 5 .010 .012 .062 -0.052 Never*Grade 6 .042 .018 .020 0.022 2.8 yrsGrade 7 .040 .047 .021 0.019 After 2012Grade 8 .047 .070 .252 -0.205 Never*Algebra .060 .042 .046 0.014 After 2012
Geometry .002 .108 .019 -0.017 Never*
The asterisks (*) in Exhibits 4.3.24 and 4.3.25 indicate areas where the gap grew substantially wider from 2006 to 2008. An asterisk was added if the 2008 gap is at least 25 percent larger than the 2006 gap. There are three such instances in literacy and nine in math.
These two exhibits show that, by this method of estimation, nearly all of the subgroup comparisons have gaps that will not be closed by the district’s goal of 2012.
The projections from Exhibits 4.3.24 and 4.3.25 are summarized in Exhibit 4.3.26.
Exhibit 4.3.26
Summary of Linear Projection of Years to Parity Number of Subgroup Comparisons in Each Category
Fayetteville Public Schools2006–2008
Parity reached by 2012
Parity reached after 2012
Parity never reached
Linear projections for closing the gap in literacy exam scoresAfrican American students and White students 2 5FRPL participants and non-participants 3 4Mobile students and non-mobile students 1 4 2Female students and male students 5 2
Linear Projections for closing the gap in math exam scoresAfrican American students and White students 4 4FRPL participants and non-participants 2 5Mobile students and non-mobile students 4 4Female students and male students 1 3 4
Fayetteville Public Schools Audit Report Page 134
Though the individual numbers in this exhibit are not intended to predict specifi c real-life trends, they provide an overall sense of the scale of the achievement gap issue in Fayetteville. There are inequalities in the education students are receiving, and those inequalities are predictable by the demographic group to which a student belongs. The goal of 100 percent literacy is not attainable unless the inequalities are addressed and eliminated. During interviews, several comments were made to auditors that refl ect a perception of inequality in the education that different students receive. The following comments are representative:
“There is a mindset that they produce excellent results and they don’t need to change anything. But we • have a huge pocket of students who are not engaged [and] drop out” (Administrator)
“Which school you went to determines whether you’ll learn to read.” (Administrator)•
“Some schools have huge gaps between different groups of students.” (Community member)•
Summary
Examining Fayetteville Public Schools’ test scores in the aggregate provides justifi cation for the pride that members of the community have in their school system. Scores are consistently higher than average scores for the state of Arkansas. The examinations of differences in levels of achievement among buildings and among different groups of students, however, reveal that not all students are given the same hope of sharing in that success. Students in certain elementary schools and students from certain demographic groups are less likely to master the knowledge and skills that are assessed by the state literacy and math examinations. In addition, the overall trend of these differences is not toward parity by the district’s target date of 2012.
Finding 4.4: Use of data for curricular decision making is an emerging practice that has not yet become institutionalized system-wide. There is no systemic use of data for program evaluation.
It is essential for a district to have policies and procedures for generating feedback about the success of its work, but the feedback system will only achieve its purpose if it is consistently and skillfully put to use. In a district that is skillfully using feedback from student assessments and program evaluations, staff demonstrate a clear understanding of the nature of tests and test data. They have rigorous procedures in place to manage the administration, scoring and handling of test materials, to assure the integrity of the results. They have structures in place for regularly applying formative assessment results to planning for classroom instruction and intervention strategies. They apply the results of annual summative assessments in planning in their courses and units to address the needs of each year’s students. They have developed comprehensible formats for communicating relevant summative test results to various audiences, within and outside of the district. District and building leaders know how to evaluate programs skillfully with a variety of feedback types to generate data that are valid, reliable and meaningful, and they use that feedback in their planning to improve student outcomes by continuing, modifying, or terminating district programs.
The audit team reviewed Arkansas Comprehensive School Improvement Plans (ACSIP), job descriptions, web-based data resources, program evaluation documents, and other documents that refl ect ways in which the district uses data. They interviewed stakeholders (board members, administrators, teachers, staff, and community members) regarding the use of data and made observations in each of the district’s school buildings.
The auditors found many examples of effective data use in the district, and many of the district’s principals and teachers were actively engaged in improving their knowledge and skills in understanding the nature of test data and using data to make curricular and instructional decisions. The strongest examples of data use, including formative assessment data, were seen in the elementary buildings (see Finding 5.2). The middle schools and junior high schools were developing building-based systems for data-based practices, but structures for their data use were not yet fully established, and their practices were not consistent across buildings. Data use at the high school was at the discretion of the teachers. There were examples of skillful data use in individual classrooms and departments and there was growing interest in the data training efforts provided by the district offi ce, but data use at the high school was inconsistent in quality and sporadic in scope.
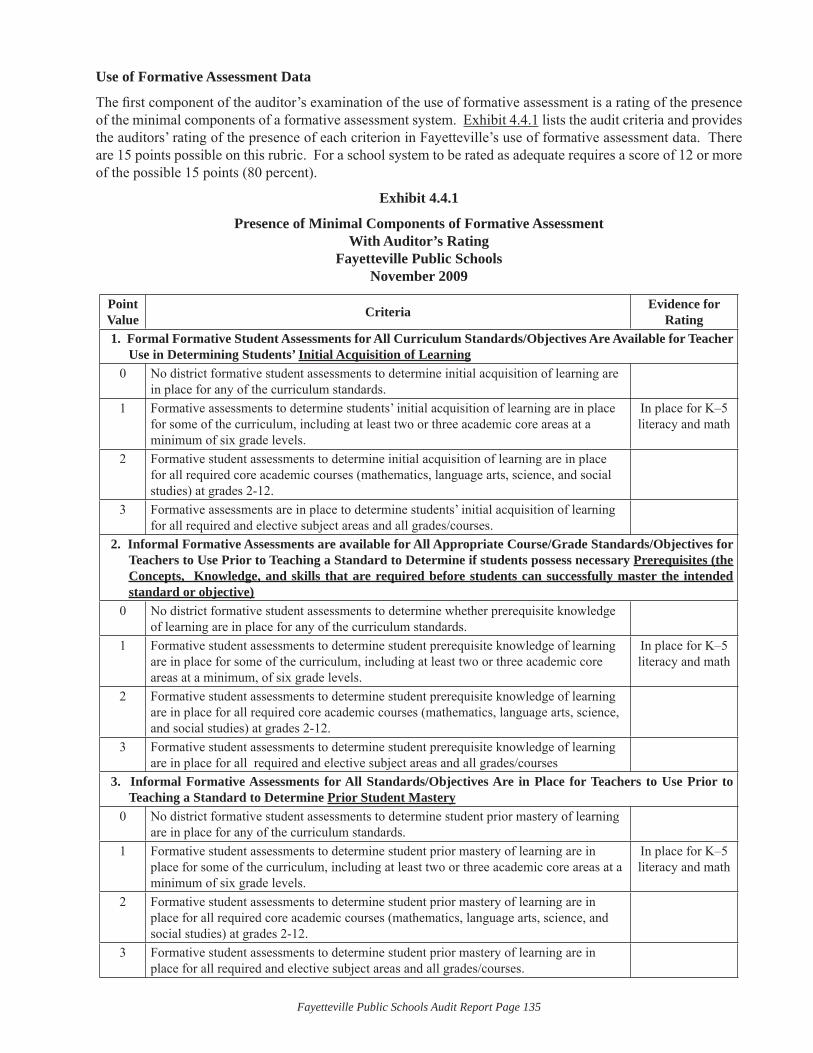
Fayetteville Public Schools Audit Report Page 135
Use of Formative Assessment Data
The fi rst component of the auditor’s examination of the use of formative assessment is a rating of the presence of the minimal components of a formative assessment system. Exhibit 4.4.1 lists the audit criteria and provides the auditors’ rating of the presence of each criterion in Fayetteville’s use of formative assessment data. There are 15 points possible on this rubric. For a school system to be rated as adequate requires a score of 12 or more of the possible 15 points (80 percent).
Exhibit 4.4.1
Presence of Minimal Components of Formative Assessment With Auditor’s Rating
Fayetteville Public SchoolsNovember 2009
Point Value Criteria Evidence for
Rating1. Formal Formative Student Assessments for All Curriculum Standards/Objectives Are Available for Teacher
Use in Determining Students’ Initial Acquisition of Learning0 No district formative student assessments to determine initial acquisition of learning are
in place for any of the curriculum standards.1 Formative assessments to determine students’ initial acquisition of learning are in place
for some of the curriculum, including at least two or three academic core areas at a minimum of six grade levels.
In place for K–5 literacy and math
2 Formative student assessments to determine initial acquisition of learning are in place for all required core academic courses (mathematics, language arts, science, and social studies) at grades 2-12.
3 Formative assessments are in place to determine students’ initial acquisition of learning for all required and elective subject areas and all grades/courses.
2. Informal Formative Assessments are available for All Appropriate Course/Grade Standards/Objectives for Teachers to Use Prior to Teaching a Standard to Determine if students possess necessary Prerequisites (the Concepts, Knowledge, and skills that are required before students can successfully master the intended standard or objective)
0 No district formative student assessments to determine whether prerequisite knowledge of learning are in place for any of the curriculum standards.
1 Formative student assessments to determine student prerequisite knowledge of learning are in place for some of the curriculum, including at least two or three academic core areas at a minimum, of six grade levels.
In place for K–5 literacy and math
2 Formative student assessments to determine student prerequisite knowledge of learning are in place for all required core academic courses (mathematics, language arts, science, and social studies) at grades 2-12.
3 Formative student assessments to determine student prerequisite knowledge of learning are in place for all required and elective subject areas and all grades/courses
3. Informal Formative Assessments for All Standards/Objectives Are in Place for Teachers to Use Prior to Teaching a Standard to Determine Prior Student Mastery
0 No district formative student assessments to determine student prior mastery of learning are in place for any of the curriculum standards.
1 Formative student assessments to determine student prior mastery of learning are in place for some of the curriculum, including at least two or three academic core areas at a minimum of six grade levels.
In place for K–5 literacy and math
2 Formative student assessments to determine student prior mastery of learning are in place for all required core academic courses (mathematics, language arts, science, and social studies) at grades 2-12.
3 Formative student assessments to determine student prior mastery of learning are in place for all required and elective subject areas and all grades/courses.
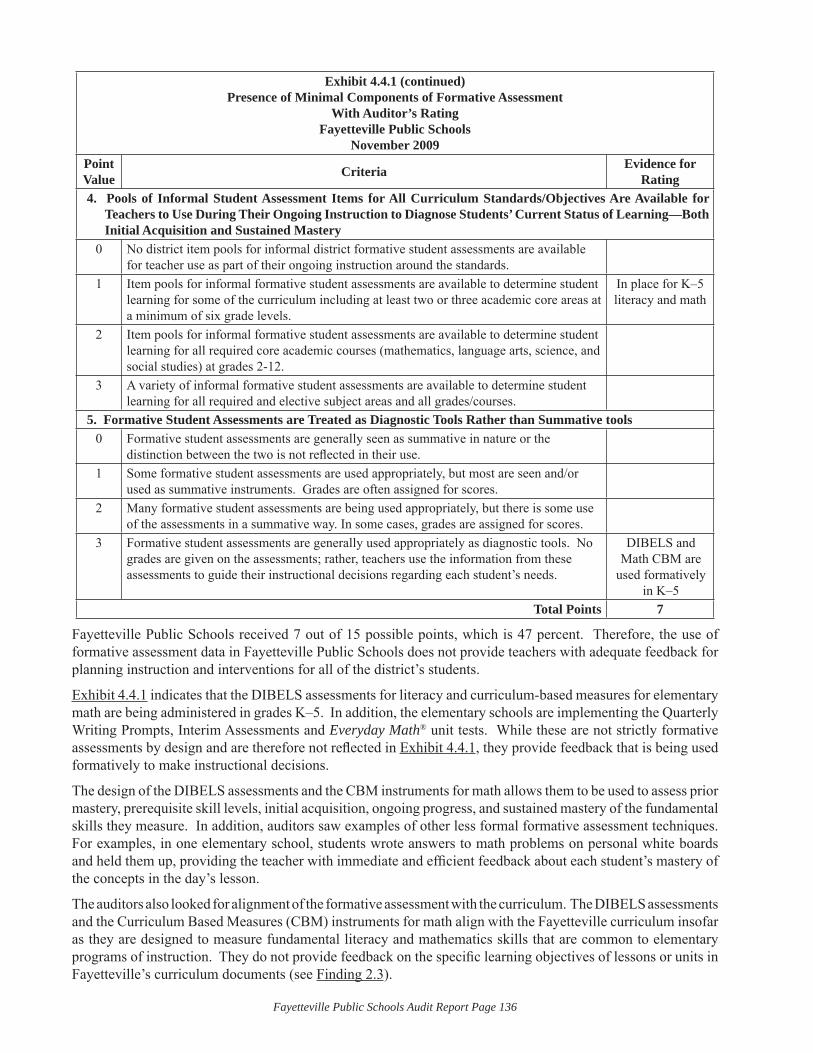
Fayetteville Public Schools Audit Report Page 136
Exhibit 4.4.1 (continued)Presence of Minimal Components of Formative Assessment
With Auditor’s RatingFayetteville Public Schools
November 2009Point Value Criteria Evidence for
Rating4. Pools of Informal Student Assessment Items for All Curriculum Standards/Objectives Are Available for
Teachers to Use During Their Ongoing Instruction to Diagnose Students’ Current Status of Learning—Both Initial Acquisition and Sustained Mastery
0 No district item pools for informal district formative student assessments are available for teacher use as part of their ongoing instruction around the standards.
1 Item pools for informal formative student assessments are available to determine student learning for some of the curriculum including at least two or three academic core areas at a minimum of six grade levels.
In place for K–5 literacy and math
2 Item pools for informal formative student assessments are available to determine student learning for all required core academic courses (mathematics, language arts, science, and social studies) at grades 2-12.
3 A variety of informal formative student assessments are available to determine student learning for all required and elective subject areas and all grades/courses.
5. Formative Student Assessments are Treated as Diagnostic Tools Rather than Summative tools0 Formative student assessments are generally seen as summative in nature or the
distinction between the two is not refl ected in their use.1 Some formative student assessments are used appropriately, but most are seen and/or
used as summative instruments. Grades are often assigned for scores.2 Many formative student assessments are being used appropriately, but there is some use
of the assessments in a summative way. In some cases, grades are assigned for scores.3 Formative student assessments are generally used appropriately as diagnostic tools. No
grades are given on the assessments; rather, teachers use the information from these assessments to guide their instructional decisions regarding each student’s needs.
DIBELS and Math CBM are
used formatively in K–5
Total Points 7
Fayetteville Public Schools received 7 out of 15 possible points, which is 47 percent. Therefore, the use of formative assessment data in Fayetteville Public Schools does not provide teachers with adequate feedback for planning instruction and interventions for all of the district’s students.
Exhibit 4.4.1 indicates that the DIBELS assessments for literacy and curriculum-based measures for elementary math are being administered in grades K–5. In addition, the elementary schools are implementing the Quarterly Writing Prompts, Interim Assessments and Everyday Math® unit tests. While these are not strictly formative assessments by design and are therefore not refl ected in Exhibit 4.4.1, they provide feedback that is being used formatively to make instructional decisions.
The design of the DIBELS assessments and the CBM instruments for math allows them to be used to assess prior mastery, prerequisite skill levels, initial acquisition, ongoing progress, and sustained mastery of the fundamental skills they measure. In addition, auditors saw examples of other less formal formative assessment techniques. For examples, in one elementary school, students wrote answers to math problems on personal white boards and held them up, providing the teacher with immediate and effi cient feedback about each student’s mastery of the concepts in the day’s lesson.
The auditors also looked for alignment of the formative assessment with the curriculum. The DIBELS assessments and the Curriculum Based Measures (CBM) instruments for math align with the Fayetteville curriculum insofar as they are designed to measure fundamental literacy and mathematics skills that are common to elementary programs of instruction. They do not provide feedback on the specifi c learning objectives of lessons or units in Fayetteville’s curriculum documents (see Finding 2.3).
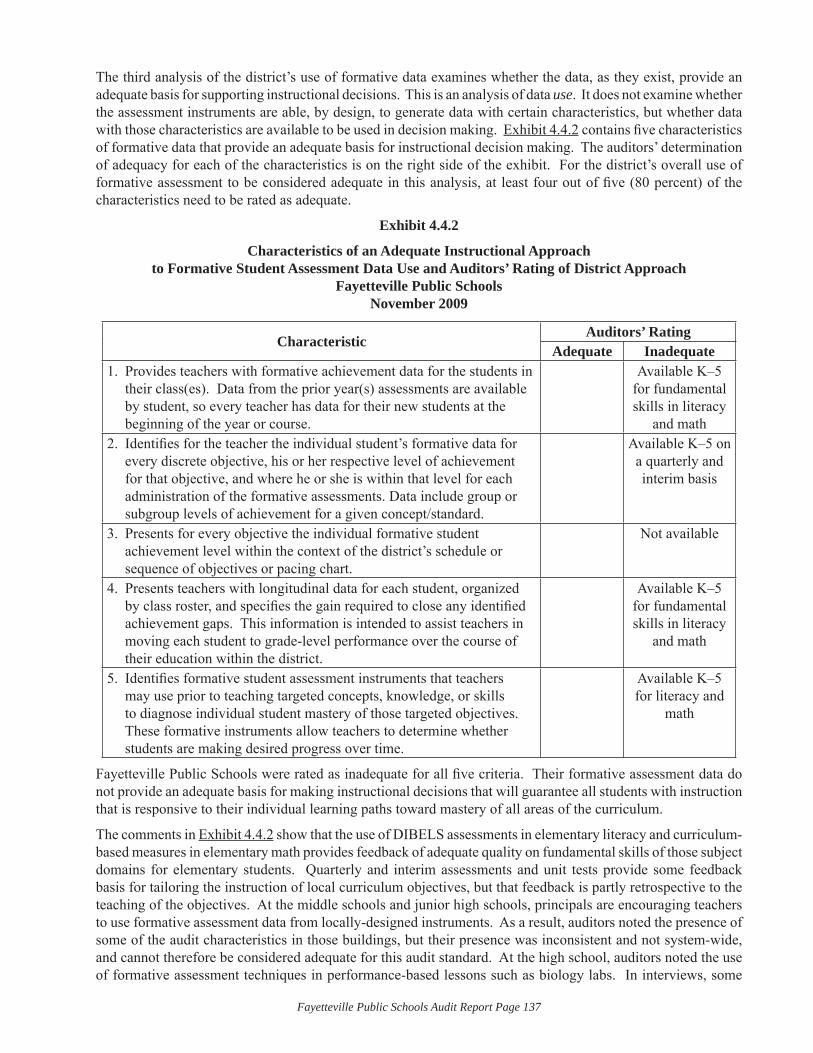
Fayetteville Public Schools Audit Report Page 137
The third analysis of the district’s use of formative data examines whether the data, as they exist, provide an adequate basis for supporting instructional decisions. This is an analysis of data use. It does not examine whether the assessment instruments are able, by design, to generate data with certain characteristics, but whether data with those characteristics are available to be used in decision making. Exhibit 4.4.2 contains fi ve characteristics of formative data that provide an adequate basis for instructional decision making. The auditors’ determination of adequacy for each of the characteristics is on the right side of the exhibit. For the district’s overall use of formative assessment to be considered adequate in this analysis, at least four out of fi ve (80 percent) of the characteristics need to be rated as adequate.
Exhibit 4.4.2
Characteristics of an Adequate Instructional Approach to Formative Student Assessment Data Use and Auditors’ Rating of District Approach
Fayetteville Public SchoolsNovember 2009
CharacteristicAuditors’ Rating
Adequate InadequateProvides teachers with formative achievement data for the students in 1. their class(es). Data from the prior year(s) assessments are available by student, so every teacher has data for their new students at the beginning of the year or course.
Available K–5 for fundamental skills in literacy
and mathIdentifi es for the teacher the individual student’s formative data for 2. every discrete objective, his or her respective level of achievement for that objective, and where he or she is within that level for each administration of the formative assessments. Data include group or subgroup levels of achievement for a given concept/standard.
Available K–5 on a quarterly and interim basis
Presents for every objective the individual formative student 3. achievement level within the context of the district’s schedule or sequence of objectives or pacing chart.
Not available
Presents teachers with longitudinal data for each student, organized 4. by class roster, and specifi es the gain required to close any identifi ed achievement gaps. This information is intended to assist teachers in moving each student to grade-level performance over the course of their education within the district.
Available K–5 for fundamental skills in literacy
and math
Identifi es formative student assessment instruments that teachers 5. may use prior to teaching targeted concepts, knowledge, or skills to diagnose individual student mastery of those targeted objectives. These formative instruments allow teachers to determine whether students are making desired progress over time.
Available K–5 for literacy and
math
Fayetteville Public Schools were rated as inadequate for all fi ve criteria. Their formative assessment data do not provide an adequate basis for making instructional decisions that will guarantee all students with instruction that is responsive to their individual learning paths toward mastery of all areas of the curriculum.
The comments in Exhibit 4.4.2 show that the use of DIBELS assessments in elementary literacy and curriculum-based measures in elementary math provides feedback of adequate quality on fundamental skills of those subject domains for elementary students. Quarterly and interim assessments and unit tests provide some feedback basis for tailoring the instruction of local curriculum objectives, but that feedback is partly retrospective to the teaching of the objectives. At the middle schools and junior high schools, principals are encouraging teachers to use formative assessment data from locally-designed instruments. As a result, auditors noted the presence of some of the audit characteristics in those buildings, but their presence was inconsistent and not system-wide, and cannot therefore be considered adequate for this audit standard. At the high school, auditors noted the use of formative assessment techniques in performance-based lessons such as biology labs. In interviews, some
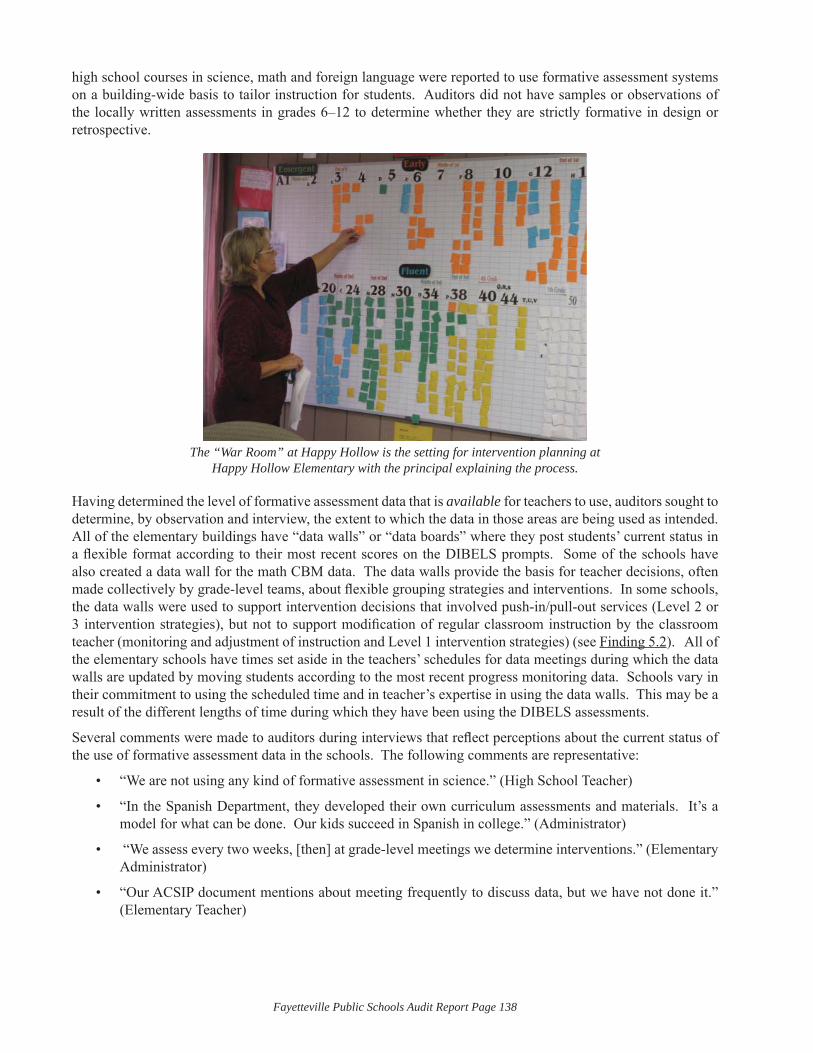
Fayetteville Public Schools Audit Report Page 138
high school courses in science, math and foreign language were reported to use formative assessment systems on a building-wide basis to tailor instruction for students. Auditors did not have samples or observations of the locally written assessments in grades 6–12 to determine whether they are strictly formative in design or retrospective.
The “War Room” at Happy Hollow is the setting for intervention planning at Happy Hollow Elementary with the principal explaining the process.
Having determined the level of formative assessment data that is available for teachers to use, auditors sought to determine, by observation and interview, the extent to which the data in those areas are being used as intended. All of the elementary buildings have “data walls” or “data boards” where they post students’ current status in a fl exible format according to their most recent scores on the DIBELS prompts. Some of the schools have also created a data wall for the math CBM data. The data walls provide the basis for teacher decisions, often made collectively by grade-level teams, about fl exible grouping strategies and interventions. In some schools, the data walls were used to support intervention decisions that involved push-in/pull-out services (Level 2 or 3 intervention strategies), but not to support modifi cation of regular classroom instruction by the classroom teacher (monitoring and adjustment of instruction and Level 1 intervention strategies) (see Finding 5.2). All of the elementary schools have times set aside in the teachers’ schedules for data meetings during which the data walls are updated by moving students according to the most recent progress monitoring data. Schools vary in their commitment to using the scheduled time and in teacher’s expertise in using the data walls. This may be a result of the different lengths of time during which they have been using the DIBELS assessments.
Several comments were made to auditors during interviews that refl ect perceptions about the current status of the use of formative assessment data in the schools. The following comments are representative:
“We are not using any kind of formative assessment in science.” (High School Teacher)•
“In the Spanish Department, they developed their own curriculum assessments and materials. It’s a • model for what can be done. Our kids succeed in Spanish in college.” (Administrator)
“We assess every two weeks, [then] at grade-level meetings we determine interventions.” (Elementary • Administrator)
“Our ACSIP document mentions about meeting frequently to discuss data, but we have not done it.” • (Elementary Teacher)
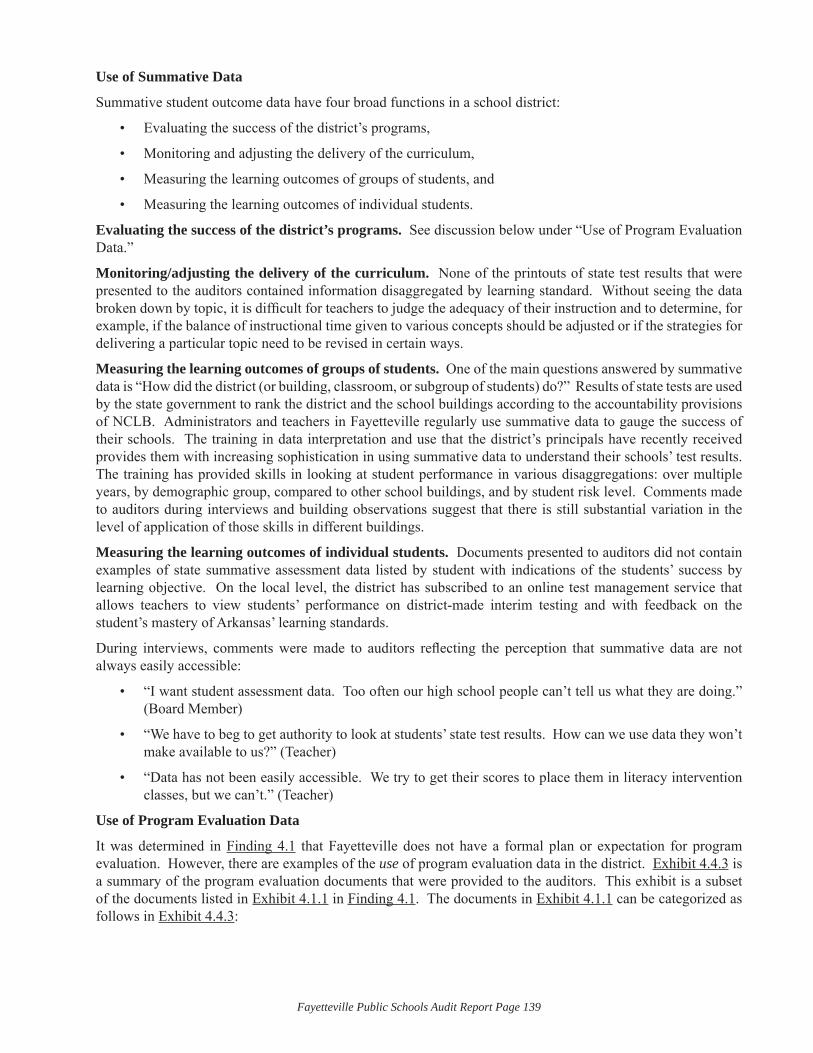
Fayetteville Public Schools Audit Report Page 139
Use of Summative Data
Summative student outcome data have four broad functions in a school district:
Evaluating the success of the district’s programs, •
Monitoring and adjusting the delivery of the curriculum, •
Measuring the learning outcomes of groups of students, and •
Measuring the learning outcomes of individual students.•
Evaluating the success of the district’s programs. See discussion below under “Use of Program Evaluation Data.”
Monitoring/adjusting the delivery of the curriculum. None of the printouts of state test results that were presented to the auditors contained information disaggregated by learning standard. Without seeing the data broken down by topic, it is diffi cult for teachers to judge the adequacy of their instruction and to determine, for example, if the balance of instructional time given to various concepts should be adjusted or if the strategies for delivering a particular topic need to be revised in certain ways.
Measuring the learning outcomes of groups of students. One of the main questions answered by summative data is “How did the district (or building, classroom, or subgroup of students) do?” Results of state tests are used by the state government to rank the district and the school buildings according to the accountability provisions of NCLB. Administrators and teachers in Fayetteville regularly use summative data to gauge the success of their schools. The training in data interpretation and use that the district’s principals have recently received provides them with increasing sophistication in using summative data to understand their schools’ test results. The training has provided skills in looking at student performance in various disaggregations: over multiple years, by demographic group, compared to other school buildings, and by student risk level. Comments made to auditors during interviews and building observations suggest that there is still substantial variation in the level of application of those skills in different buildings.
Measuring the learning outcomes of individual students. Documents presented to auditors did not contain examples of state summative assessment data listed by student with indications of the students’ success by learning objective. On the local level, the district has subscribed to an online test management service that allows teachers to view students’ performance on district-made interim testing and with feedback on the student’s mastery of Arkansas’ learning standards.
During interviews, comments were made to auditors refl ecting the perception that summative data are not always easily accessible:
“I want student assessment data. Too often our high school people can’t tell us what they are doing.” • (Board Member)
“We have to beg to get authority to look at students’ state test results. How can we use data they won’t • make available to us?” (Teacher)
“Data has not been easily accessible. We try to get their scores to place them in literacy intervention • classes, but we can’t.” (Teacher)
Use of Program Evaluation Data
It was determined in Finding 4.1 that Fayetteville does not have a formal plan or expectation for program evaluation. However, there are examples of the use of program evaluation data in the district. Exhibit 4.4.3 is a summary of the program evaluation documents that were provided to the auditors. This exhibit is a subset of the documents listed in Exhibit 4.1.1 in Finding 4.1. The documents in Exhibit 4.1.1 can be categorized as follows in Exhibit 4.4.3:
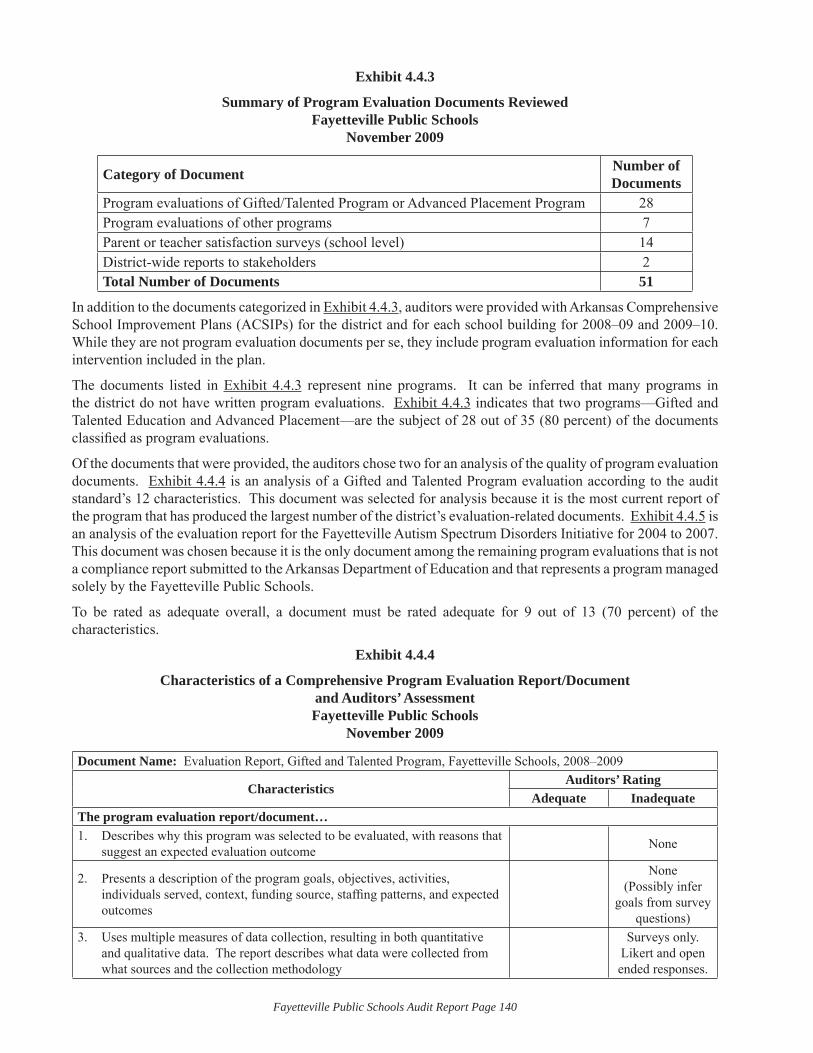
Fayetteville Public Schools Audit Report Page 140
Exhibit 4.4.3
Summary of Program Evaluation Documents ReviewedFayetteville Public Schools
November 2009
Category of Document Number of Documents
Program evaluations of Gifted/Talented Program or Advanced Placement Program 28Program evaluations of other programs 7Parent or teacher satisfaction surveys (school level) 14District-wide reports to stakeholders 2Total Number of Documents 51
In addition to the documents categorized in Exhibit 4.4.3, auditors were provided with Arkansas Comprehensive School Improvement Plans (ACSIPs) for the district and for each school building for 2008–09 and 2009–10. While they are not program evaluation documents per se, they include program evaluation information for each intervention included in the plan.
The documents listed in Exhibit 4.4.3 represent nine programs. It can be inferred that many programs in the district do not have written program evaluations. Exhibit 4.4.3 indicates that two programs—Gifted and Talented Education and Advanced Placement—are the subject of 28 out of 35 (80 percent) of the documents classifi ed as program evaluations.
Of the documents that were provided, the auditors chose two for an analysis of the quality of program evaluation documents. Exhibit 4.4.4 is an analysis of a Gifted and Talented Program evaluation according to the audit standard’s 12 characteristics. This document was selected for analysis because it is the most current report of the program that has produced the largest number of the district’s evaluation-related documents. Exhibit 4.4.5 is an analysis of the evaluation report for the Fayetteville Autism Spectrum Disorders Initiative for 2004 to 2007. This document was chosen because it is the only document among the remaining program evaluations that is not a compliance report submitted to the Arkansas Department of Education and that represents a program managed solely by the Fayetteville Public Schools.
To be rated as adequate overall, a document must be rated adequate for 9 out of 13 (70 percent) of the characteristics.
Exhibit 4.4.4
Characteristics of a Comprehensive Program Evaluation Report/Document and Auditors’ AssessmentFayetteville Public Schools
November 2009
Document Name: Evaluation Report, Gifted and Talented Program, Fayetteville Schools, 2008–2009
CharacteristicsAuditors’ Rating
Adequate InadequateThe program evaluation report/document…
Describes why this program was selected to be evaluated, with reasons that 1. suggest an expected evaluation outcome None
Presents a description of the program goals, objectives, activities, 2. individuals served, context, funding source, staffi ng patterns, and expected outcomes
None (Possibly infer
goals from survey questions)
Uses multiple measures of data collection, resulting in both quantitative 3. and qualitative data. The report describes what data were collected from what sources and the collection methodology
Surveys only. Likert and open ended responses.
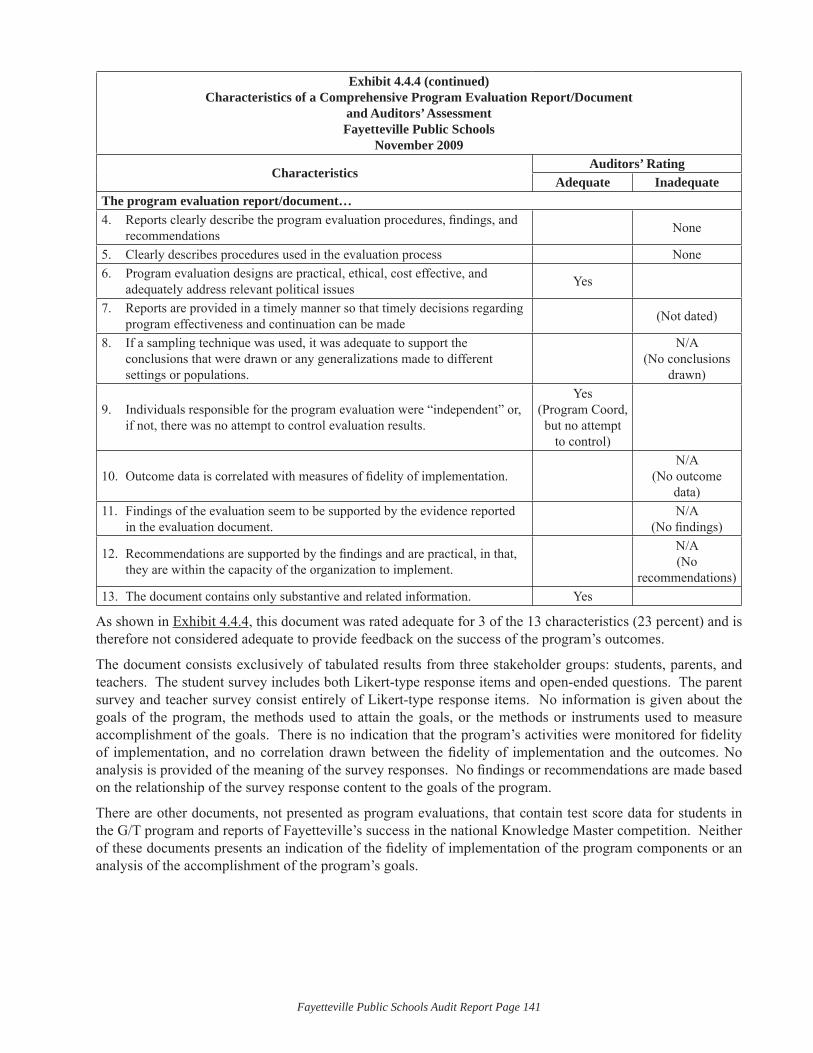
Fayetteville Public Schools Audit Report Page 141
Exhibit 4.4.4 (continued)Characteristics of a Comprehensive Program Evaluation Report/Document
and Auditors’ AssessmentFayetteville Public Schools
November 2009
CharacteristicsAuditors’ Rating
Adequate InadequateThe program evaluation report/document…
Reports clearly describe the program evaluation procedures, fi ndings, and 4. recommendations None
Clearly describes procedures used in the evaluation process 5. NoneProgram evaluation designs are practical, ethical, cost effective, and 6. adequately address relevant political issues Yes
Reports are provided in a timely manner so that timely decisions regarding 7. program effectiveness and continuation can be made (Not dated)
If a sampling technique was used, it was adequate to support the 8. conclusions that were drawn or any generalizations made to different settings or populations.
N/A(No conclusions
drawn)
Individuals responsible for the program evaluation were “independent” or, 9. if not, there was no attempt to control evaluation results.
Yes(Program Coord, but no attempt
to control)
Outcome data is correlated with measures of fi delity of implementation.10. N/A
(No outcome data)
Findings of the evaluation seem to be supported by the evidence reported 11. in the evaluation document.
N/A(No fi ndings)
Recommendations are supported by the fi ndings and are practical, in that, 12. they are within the capacity of the organization to implement.
N/A(No
recommendations)The document contains only substantive and related information.13. Yes
As shown in Exhibit 4.4.4, this document was rated adequate for 3 of the 13 characteristics (23 percent) and is therefore not considered adequate to provide feedback on the success of the program’s outcomes.
The document consists exclusively of tabulated results from three stakeholder groups: students, parents, and teachers. The student survey includes both Likert-type response items and open-ended questions. The parent survey and teacher survey consist entirely of Likert-type response items. No information is given about the goals of the program, the methods used to attain the goals, or the methods or instruments used to measure accomplishment of the goals. There is no indication that the program’s activities were monitored for fi delity of implementation, and no correlation drawn between the fi delity of implementation and the outcomes. No analysis is provided of the meaning of the survey responses. No fi ndings or recommendations are made based on the relationship of the survey response content to the goals of the program.
There are other documents, not presented as program evaluations, that contain test score data for students in the G/T program and reports of Fayetteville’s success in the national Knowledge Master competition. Neither of these documents presents an indication of the fi delity of implementation of the program components or an analysis of the accomplishment of the program’s goals.
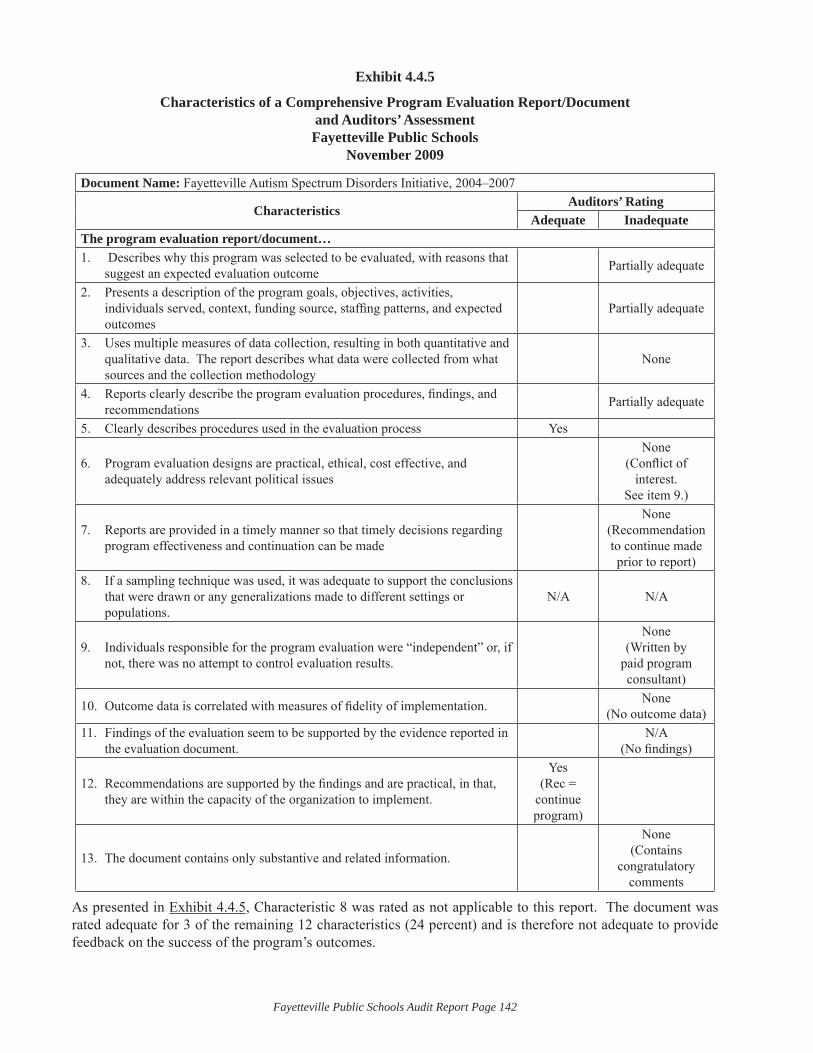
Fayetteville Public Schools Audit Report Page 142
Exhibit 4.4.5
Characteristics of a Comprehensive Program Evaluation Report/Document and Auditors’ AssessmentFayetteville Public Schools
November 2009
Document Name: Fayetteville Autism Spectrum Disorders Initiative, 2004–2007
CharacteristicsAuditors’ Rating
Adequate InadequateThe program evaluation report/document…
Describes why this program was selected to be evaluated, with reasons that 1. suggest an expected evaluation outcome Partially adequate
Presents a description of the program goals, objectives, activities, 2. individuals served, context, funding source, staffi ng patterns, and expected outcomes
Partially adequate
Uses multiple measures of data collection, resulting in both quantitative and 3. qualitative data. The report describes what data were collected from what sources and the collection methodology
None
Reports clearly describe the program evaluation procedures, fi ndings, and 4. recommendations Partially adequate
Clearly describes procedures used in the evaluation process 5. Yes
Program evaluation designs are practical, ethical, cost effective, and 6. adequately address relevant political issues
None(Confl ict of
interest. See item 9.)
Reports are provided in a timely manner so that timely decisions regarding 7. program effectiveness and continuation can be made
None (Recommendation to continue made prior to report)
If a sampling technique was used, it was adequate to support the conclusions 8. that were drawn or any generalizations made to different settings or populations.
N/A N/A
Individuals responsible for the program evaluation were “independent” or, if 9. not, there was no attempt to control evaluation results.
None (Written by
paid program consultant)
Outcome data is correlated with measures of fi delity of implementation.10. None(No outcome data)
Findings of the evaluation seem to be supported by the evidence reported in 11. the evaluation document.
N/A (No fi ndings)
Recommendations are supported by the fi ndings and are practical, in that, 12. they are within the capacity of the organization to implement.
Yes (Rec =
continue program)
The document contains only substantive and related information.13.
None(Contains
congratulatory comments
As presented in Exhibit 4.4.5, Characteristic 8 was rated as not applicable to this report. The document was rated adequate for 3 of the remaining 12 characteristics (24 percent) and is therefore not adequate to provide feedback on the success of the program’s outcomes.
Fayetteville Public Schools Audit Report Page 143
The document analyzed in Exhibit 4.4.5 presents a list of the objectives of the program and a description of the progress to-date for each objective. The objectives of the program are activities rather than outcomes, and are therefore not quantifi able. There are no standards or rubrics for judging the quality of implementation for the activities. There is no indication of intended outcomes for students, and therefore no logical connection provided between the activities and student outcomes. Most of the activities are professional development, specifying which information will be provided by the consultant to district staff members. The report was written by the consultant who was hired to design the program and oversee its implementation, and who therefore has a fi nancial stake in the continuation of the program’s activities.
In the ACSIPs, each initiative is accompanied by a program evaluation statement. In the Fayetteville district ACSIP, most of those entries are fi lled with boilerplate language linking the initiative broadly to state test results on the Augmented Benchmark Exams in literacy and math. The same scores are presented as program outcomes for several diverse initiatives with no connection provided between the components of the initiative and the outcome scores (see also Finding 5.2).
It is evident that the quality of program evaluation reports in Fayetteville Public Schools was not adequate to provide feedback for the continuation, modifi cation, or termination of the district’s programs.
Because of the inadequacy of the district’s existing program evaluation materials, the following questions cannot be addressed, but are offered as indicators of attributes of the use of program evaluation data that are not evident in the district.
Does the district follow through on fi ndings and recommendations from the program evaluations? •
Do the actions taken in response to program evaluations have the desired effects?•
Are there examples of programs that were terminated on the basis of program evaluation feedback?•
Has the district’s capacity to design and deliver the curriculum improved as a result of the changes • made in response to program evaluation feedback? Is that increased capacity evident in improved student learning or graduation outcomes?
During interviews, several people made comments to the auditors that refl ect the current status of the district’s use of program evaluation data. The following are representative:
“You have to defi ne success and how you are going to measure it.” (Board Member)•
“We get a report that shows how our students scored…related to specifi c content. We use it and discuss • it in department meetings.” (Administrator)
“An initiative gets attention for the fi rst couple of years and then it’s on to the next initiative.” • (Administrator)
“There’s no process of evaluating programs. We need that.” (Administrator)•
“I’m still really confused about [21• st Century]. There is no data for the 21st Century rooms so far. I’m not sure exactly what we’re shooting for.” (Administrator)
“They start a lot of initiatives, get you excited, and then drop it.” (Teacher)•
“We’re doing a self-eval right now. We chose to use a template to evaluate our program. It’s the fi rst • time it’s ever been done.” (Teacher)
In summary, the auditors found that the use of formative and summative assessment data to support decisions regarding the design and delivery of the district’s curriculum is an emerging practice. Many elements of adequate data use were in place in the elementary schools. In the middle schools and junior high schools, there were clear instances of effective data use, but those instances were not present systemically. In the high school, there were examples of effective data use in some classrooms and departments, but there was also signifi cant resistance to the use of assessment data. The district’s use of program evaluation data falls far short of adequacy in both scope and quality. As such, the district’s programs were found to be implemented largely without the feedback necessary for effective outcome-based management.

Fayetteville Public Schools Audit Report Page 144
Fayetteville Public Schools Audit Report Page 145
STANDARD 5: The School District Has Improved Productivity.Productivity refers to the relationship between system input and output. A school system meeting this standard of the PDK-CMSi Curriculum Management Audit is able to demonstrate consistently improved pupil outcomes, even in the face of diminishing resources. Improved productivity results when a school system is able to create a consistent level of congruence between major variables in achieving enhanced results and in controlling costs.
What the Auditors Expected to Find in the Fayetteville Public Schools:
While the attainment of improved productivity in a school system is a complex process, caused in part by the lack of a tight organizational structure (referred to as “loosely coupled”), common indicators of a school system meeting this audit standard are:
Planned and actual congruence among curricular objectives, results, and fi nancial allocations;•
A fi nancial data base and network that can track costs to results, provide suffi cient fi duciary control, and • be used as a viable data base in making policy and operational decisions;
Specifi c means that have been selected or modifi ed and implemented to attain better results in the • schools over a specifi ed time period;
A planned series of interventions that have raised pupil performance levels over time and maintained • those levels within the same cost parameters as in the past;
School facilities that are well-kept, suffi cient, safe, orderly, and conducive to effective delivery of the • instructional program; and
Support systems that function in systemic ways.•
Overview of What the Auditors Found in the Fayetteville Public Schools:
This section is an overview of the fi ndings that follow in the area of Standard Five. Details follow within separate fi ndings.
The auditors found little connection between the budgetary process and district goals and planning. Board policies provide no direction for the development of budgets aligned to the needs of curriculum. One of the strategic goals of the district addresses the management of fi nancial resources for optimal effectiveness. The auditors were told that district leadership is attempting to introduce zero-based budgeting this year in an attempt to allocate funds for renovation of the high school facility and to substantiate effective management of funds. Budgetary practices did not demonstrate fi nancial planning driven by program priorities, achievement needs, or cost-benefi t analyses of educational programs and services. Directives did not guide the utilization of funds in the schools or in central offi ce.
The auditors found that district personnel have adopted the Response to Intervention (RtI) model which establishes the procedure for interventions. This model meets the audit criteria for adequacy in initiating and implementing interventions with the exception of short-term and long-term resources being formally considered. However, no process exists for the formal evaluation of the programs used for the interventions. Implementation of the RtI model has resulted in lateral but not vertical collaboration among staff. The auditors found emphasis on Tier II interventions, which is the grouping and re-grouping of students rather than a concentration on differentiation within the classroom setting.
The master plan and planning of facilities and maintenance was determined to be adequate to provide direction for establishing an environment for teaching and learning. While board policies and strategic goals address the need for quality facilities, they do not direct alignment with curriculum and instruction goals. The auditors found the facilities to be in excellent condition with recent renovations and replacement of buildings. Planning is underway to address the facility needs of buildings that are presently in need of repair or replacement.
Fayetteville Public Schools Audit Report Page 146
Finding 5.1: The district’s budget development and decision making are not aligned to its mission, curricular goals, and strategic priorities, nor are cost-benefi t analyses being utilized to assure maximum productivity.
A school system’s productivity is improved when clear linkages exist between the curriculum and the budget. Cost benefi t analysis requires a clear delineation of costs compared to documented system gains or results obtained from allocations. Such linkages provide for a budgetary process that is driven by data-based curriculum needs, educational priorities, and planned goals. Linkages between the budget and curriculum are critical to identify how the district allocates fi scal resources to support and implement its programs to achieve desired student learning results. Thus, the written budget is the numerical expression of the district’s priorities and should refl ect program expectations.
To determine the extent to which there was clear connection between curriculum priorities and budgetary decisions, auditors reviewed policies and documents related to the budgetary process. Additionally, the auditors interviewed board members, district and school-based administrators, and other staff members to determine the budget process and the fi nancial health of the district.
The auditors found little connection between the budgetary process and district goals and planning. State-required Arkansas Comprehensive School Improvement Plans (ACSIP) were written annually with action steps, but these plans were not refl ected in changes in the allocation of funds in the budgetary process (see Finding 1.2). Board policies provide no direction for the development of budgets aligned to the needs of curriculum. The auditors were told that district leadership is attempting to introduce zero-based budgeting this year in an attempt to allocate funds for renovation of the high school facility and establish effective fi nancial management. Financial planning was not driven by program priorities, achievement needs, or cost-benefi t analyses of educational programs and services.
Strong fi nancial management policies are critical in guiding the budget planning and decision-making process. To serve as an effective guide in the budget planning process, a school district’s policy framework needs to be specifi c so decisions can be made by referencing relevant policies. The auditors reviewed the following board policies that give direction to the district’s fi nancial management system:
Board Policy 1.7: Powers and Duties of the Board• lists two of the duties of the board as “preparing and publishing the district’s budget for the ensuing year” and “being fi scally responsible to the district’s patrons and maintaining the Millage rate necessary to support the district’s budget.”
Board Policy 2.1: Duties of the Superintendent• lists two of the duties of the superintendent as “preparing and presenting an annual budget for the District to the Board for its consideration” and “administering the District’s budget and regularly reporting to the Board on the fi nancial condition of the District.”
Board Policy 3.2: Annual Operating Budget• states the responsibilities noted in the above policies and further states that “the approved budget shall provide for expenditures that are within anticipated revenues and reserves.”
Board Policy 3.4: Grants and Special Funding• allows the superintendent to “apply for grants or special funding for the District…. Any grants of special funding that require Board approval shall receive Board approval prior to the acceptance of the grant or special funding source.”
Board Policy 3.12: English Language Learners• states that “the district shall utilize the special needs funding it receives for identifi ed English Language Learners on activities, and materials listed in the ADE Rules Governing the Distribution of Student Special Needs Funding.” It further states that “the expenditures of ELL supplemental funding shall be evaluated at least annually to determine their overall effectiveness.” The auditors were not provided with any document that performs this requirement.
No board direction was noted that required fi nancial planning driven by program priorities, achievement needs, or cost-benefi t analyses of educational programs and services.
District leadership has targeted one of their eight strategic goals to address fi nances, namely: “Goal #4 Manage fi nancial resources for optimal effectiveness.”
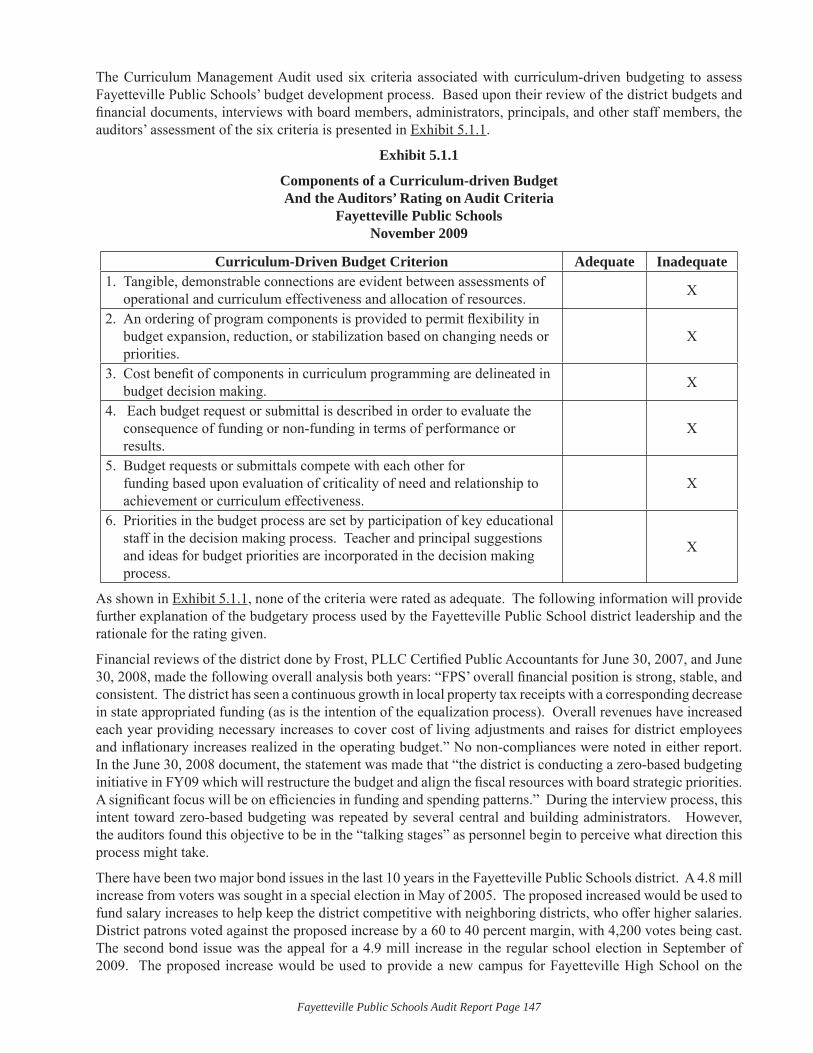
Fayetteville Public Schools Audit Report Page 147
The Curriculum Management Audit used six criteria associated with curriculum-driven budgeting to assess Fayetteville Public Schools’ budget development process. Based upon their review of the district budgets and fi nancial documents, interviews with board members, administrators, principals, and other staff members, the auditors’ assessment of the six criteria is presented in Exhibit 5.1.1.
Exhibit 5.1.1
Components of a Curriculum-driven Budget And the Auditors’ Rating on Audit Criteria
Fayetteville Public SchoolsNovember 2009
Curriculum-Driven Budget Criterion Adequate InadequateTangible, demonstrable connections are evident between assessments of 1. operational and curriculum effectiveness and allocation of resources. X
An ordering of program components is provided to permit fl exibility in 2. budget expansion, reduction, or stabilization based on changing needs or priorities.
X
Cost benefi t of components in curriculum programming are delineated in 3. budget decision making. X
Each budget request or submittal is described in order to evaluate the 4. consequence of funding or non-funding in terms of performance or results.
X
Budget requests or submittals compete with each other for 5. funding based upon evaluation of criticality of need and relationship to achievement or curriculum effectiveness.
X
Priorities in the budget process are set by participation of key educational 6. staff in the decision making process. Teacher and principal suggestions and ideas for budget priorities are incorporated in the decision making process.
X
As shown in Exhibit 5.1.1, none of the criteria were rated as adequate. The following information will provide further explanation of the budgetary process used by the Fayetteville Public School district leadership and the rationale for the rating given.
Financial reviews of the district done by Frost, PLLC Certifi ed Public Accountants for June 30, 2007, and June 30, 2008, made the following overall analysis both years: “FPS’ overall fi nancial position is strong, stable, and consistent. The district has seen a continuous growth in local property tax receipts with a corresponding decrease in state appropriated funding (as is the intention of the equalization process). Overall revenues have increased each year providing necessary increases to cover cost of living adjustments and raises for district employees and infl ationary increases realized in the operating budget.” No non-compliances were noted in either report. In the June 30, 2008 document, the statement was made that “the district is conducting a zero-based budgeting initiative in FY09 which will restructure the budget and align the fi scal resources with board strategic priorities. A signifi cant focus will be on effi ciencies in funding and spending patterns.” During the interview process, this intent toward zero-based budgeting was repeated by several central and building administrators. However, the auditors found this objective to be in the “talking stages” as personnel begin to perceive what direction this process might take.
There have been two major bond issues in the last 10 years in the Fayetteville Public Schools district. A 4.8 mill increase from voters was sought in a special election in May of 2005. The proposed increased would be used to fund salary increases to help keep the district competitive with neighboring districts, who offer higher salaries. District patrons voted against the proposed increase by a 60 to 40 percent margin, with 4,200 votes being cast. The second bond issue was the appeal for a 4.9 mill increase in the regular school election in September of 2009. The proposed increase would be used to provide a new campus for Fayetteville High School on the
Fayetteville Public Schools Audit Report Page 148
existing site at a cost of $113 million. Voters rejected the proposed increase by a 63 to 37 percent margin, with more than 10,000 votes cast, making it the largest turnout for a school election in Washington County history. The auditors were told that the issue of raising teacher salaries was realized through different avenues. The issue regarding the construction of a new high school is being addressed through funding realized through the zero-based budgeting process and reallocation of funds for remodeling of the present high school. Personnel costs are being analyzed as part of the process. Additionally, the board approved a $10 million construction bond on April 23, 2009, with the stated intent to “construct and equip school facilities as ‘constructing and equipping new school facilities, acquiring property and renovating and equipping various existing facilities.’” This will continue the 17.9 debt service mills but not increase them.
Besides the local taxpayer revenues, the district receives federal and state categorical funding. These funds for 2009-10 were identifi ed as the following:
Federal Programs Categorical Funds 2009-10:
Title I: Improving the Academic Achievement of the Disadvantaged - $2,312,598.00—Provides reading, 1. math, and language arts enrichment for grades K-7. Seven schools are designated as “Schoolwide” schools, with 40 percent or more of their students qualifying for free/reduced price lunch. Most of funding is used for salaries and benefi ts for employees (73 percent). Personnel include Title I teachers, Literacy Specialists, Math Specialist, Title I Paraprofessionals and administrative assistants, ESL coordinator and liaison, ESL translators, and Title I Coordinator.
Title IIA: Preparing, Training and Recruiting Highly Qualifi ed Teachers - $432,557.00—Funds can be 2. used to recruit teachers, provide professional development, and hire class size reduction teachers. All 14 schools receive Title IIA allocation based on building attendance. Funding distributed to building-level discretionary funds, spent on materials, supplies, purchased services, and class-size reduction teachers. This funding also pays for teachers and administrators to attend workshops and conferences.
Title III: Language Instruction for Limited English Profi cient Students - $78,902.00—Funds may be used 3. to purchase supplemental instructional materials and language acquisition software as well as provide for salaries of teachers and aides working with LEP students.
Title IVA: Safe and Drug Free Schools - $46,031.00—Funds to support character and health education 4. initiatives such as project graduation at FHS and the peer helper programs at Woodland and Ramay Junior Highs. A portion will be budgeted to purchase visitor identifi cation systems.
State Categorical Funds
Alternative Learning Environment - $468,220.00—Funds to provide ALE for those students who meet 1. eligibility criteria set forth by the Arkansas Department of Education. Funding based on number of students placed in district’s ALE the previous year. Funds are used to provide students with Agee-Lierly Life Preparation Services Center (ALLPS).
National School Lunch - $202,091.92—Funding is used for employing academic coaches, counselors, 2. nurses, employing curriculum specialists, providing early intervention programs, parent education programs and professional development. Majority of this fund is budgeted for translators, a data collection teacher, nurses, mathematics and literacy coaches, social workers, instructional facilitators, and one additional counselor.
Professional Development - $350,104.00—Funds to provide approved professional development and for 3. employing academic coaches. About half is transferred to support the ESL program; rest is budgeted to support teachers in meeting the required hours of professional development as required by law.
English Language Learning Environment (ELL) - $229,839.00—Funds to employ ELL instructors, provide 4. professional development for teaching ELL students, purchase language-appropriate instructional and supplemental materials for ELL students and purchase assessments for ELL students. Fayetteville Public Schools has ESL instructors in each school with additional instructional assistants as population of students determines. Additional funds come from Professional Development state categorical funding.
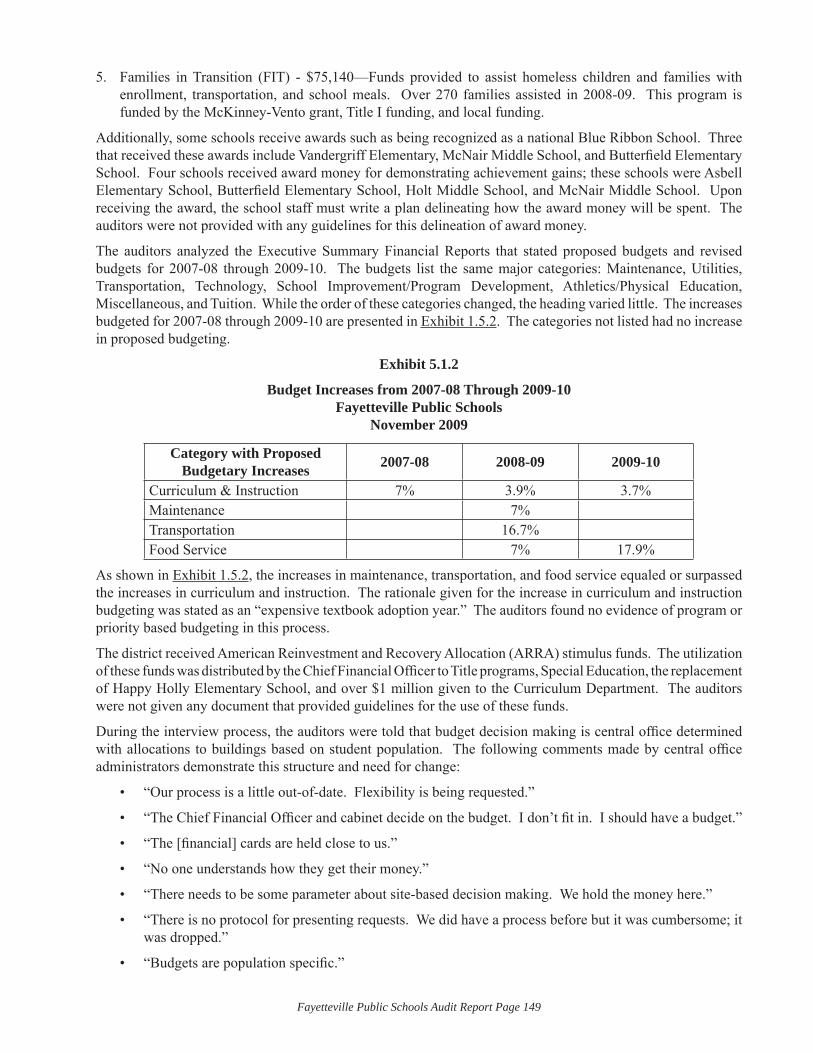
Fayetteville Public Schools Audit Report Page 149
Families in Transition (FIT) - $75,140—Funds provided to assist homeless children and families with 5. enrollment, transportation, and school meals. Over 270 families assisted in 2008-09. This program is funded by the McKinney-Vento grant, Title I funding, and local funding.
Additionally, some schools receive awards such as being recognized as a national Blue Ribbon School. Three that received these awards include Vandergriff Elementary, McNair Middle School, and Butterfi eld Elementary School. Four schools received award money for demonstrating achievement gains; these schools were Asbell Elementary School, Butterfi eld Elementary School, Holt Middle School, and McNair Middle School. Upon receiving the award, the school staff must write a plan delineating how the award money will be spent. The auditors were not provided with any guidelines for this delineation of award money.
The auditors analyzed the Executive Summary Financial Reports that stated proposed budgets and revised budgets for 2007-08 through 2009-10. The budgets list the same major categories: Maintenance, Utilities, Transportation, Technology, School Improvement/Program Development, Athletics/Physical Education, Miscellaneous, and Tuition. While the order of these categories changed, the heading varied little. The increases budgeted for 2007-08 through 2009-10 are presented in Exhibit 1.5.2. The categories not listed had no increase in proposed budgeting.
Exhibit 5.1.2
Budget Increases from 2007-08 Through 2009-10Fayetteville Public Schools
November 2009
Category with Proposed Budgetary Increases 2007-08 2008-09 2009-10
Curriculum & Instruction 7% 3.9% 3.7%Maintenance 7%Transportation 16.7%Food Service 7% 17.9%
As shown in Exhibit 1.5.2, the increases in maintenance, transportation, and food service equaled or surpassed the increases in curriculum and instruction. The rationale given for the increase in curriculum and instruction budgeting was stated as an “expensive textbook adoption year.” The auditors found no evidence of program or priority based budgeting in this process.
The district received American Reinvestment and Recovery Allocation (ARRA) stimulus funds. The utilization of these funds was distributed by the Chief Financial Offi cer to Title programs, Special Education, the replacement of Happy Holly Elementary School, and over $1 million given to the Curriculum Department. The auditors were not given any document that provided guidelines for the use of these funds.
During the interview process, the auditors were told that budget decision making is central offi ce determined with allocations to buildings based on student population. The following comments made by central offi ce administrators demonstrate this structure and need for change:
“Our process is a little out-of-date. Flexibility is being requested.”•
“The Chief Financial Offi cer and cabinet decide on the budget. I don’t fi t in. I should have a budget.”•
“The [fi nancial] cards are held close to us.”•
“No one understands how they get their money.”•
“There needs to be some parameter about site-based decision making. We hold the money here.”•
“There is no protocol for presenting requests. We did have a process before but it was cumbersome; it • was dropped.”
“Budgets are population specifi c.”•
Fayetteville Public Schools Audit Report Page 150
“Zero-based budgeting is going to be a wonderful process. We have not been aware of where our • money has been going. This is going to be benefi cial at the building level as well; benefi cial to cabinet and administration, and the public in general.”
When asked about the budgeting process, board comments included the following:
“The budget is done by the administrative staff and presented to the board with changes and how it is • funded. We are conservative.”
“We’re presented with a summary that compares revenues and expenditures for two years. I need more • information than that to answer questions that the public raises.”
Principals told the auditors that they are given a set amount of money based on their student population. The following comments demonstrate this practice:
“We are not at all involved in the district budget process. We are allotted so much money but there is a • switch this year to the building being in charge of purchasing materials. Before, Technology purchased the materials and just gave them to us with opportunities for training but not required.”
“Principals have a lot of autonomy. We determine how to handle the distribution of funds.”•
In summary, little connection between the budgetary process, district goals, and planning was found. Board policies provide no direction for the development of budgets aligned to the needs of curriculum. Program-based budgeting and cost effective analyses are not being utilized to determine the effectiveness of the distribution of fi nancial resources as one of the strategic goals directs. The auditors were told that district leadership is attempting to introduce zero-based budgeting this year in an attempt to allocate funds for renovation of the high school facility and to initiate accountability for expenditures. This objective is in the initiative stages of contemplating the possible changes that might occur across the district.
Finding 5.2: A process for identifying and addressing student achievement needs is addressed through the three-tier approach to interventions focused on frequent assessment data with emphasis on the grouping and re-grouping of students for instruction.
Interventions are actions taken by district personnel based on identifi ed needs within the system. An intervention that has a positive impact on improving students’ learning will be well planned, well funded, and fully implemented and evaluated for effectiveness. Interventions are expected to have an impact on student achievement and/or the specifi c goals of that intervention.
Auditors interviewed administrators, staff, and community members to determine the interventions that have been initiated in the district. Documents were reviewed to determine the processes used in the initiation, implementation, and evaluation of these interventions. Each school principal was asked to complete a survey listing the interventions that had been instituted in his/her respective school or district-wide. The auditors found that some interventions have been funded through grants, such as federal or state categorical grants (see Finding 5.1).
The auditors found that interventions are initiated to address subgroups of students who are not demonstrating achievement using a formalized Response to Intervention (RtI) model. This process is not used to direct systemic evaluation of programming offered through the intervention process that might lead to termination, modifi cation, or replication of programs or practices (see Findings 4.1 and 4.4). Team meetings and teacher planning were observed at the elementary level addressing the instructional strategies that might be employed in teaching a concept. Data charts were observed in teacher planning rooms that addressed the grouping and re-grouping of students based on formative data. Secondary schools have initiated courses in which students who are demonstrating underachievement are required to enroll.
The document, Rule Governing the Monitoring of Arkansas Comprehensive School Improvement Plans (ACSIP), defi nes an intervention as “research-based programs, initiatives, or strategies designed to address the student academic, behavioral and social needs identifi ed in the data analysis.”
Fayetteville Public Schools Audit Report Page 151
While no board policy spoke directly to intervention programs, the following policies provided guidance for the development of programs that address the academic needs of individual students:
Board Policy 4117.2: Teacher Evaluation Observation Checklist • includes a competency standard that states “12. Uses a variety of instructional strategies and a base of knowledge to create learning experiences that make the subject matter meaningful to students.”
Board Policy 5.10: Promotion/Retention/Acceleration of Pupils• states that “individual differences can best be addressed through a continuous progress curriculum and the continuous promotion of students. In the Fayetteville Public Schools the term “continuous progress” is used to describe the progression of students through a prescribed curriculum based on the following premises: 1) a specifi c plan is used to systematically assess each student’s attainment of the prescribed knowledge or skills; 2) when students demonstrate that they possess a particular knowledge or skill in suffi cient depth, they are given the opportunity to move to another objective….”
The Response to Intervention (RtI) model that is being implemented in the district is intended to result in a more aligned philosophy with requirements for meeting the needs of ALL students. The fi rst step is problem identifi cation: What is the problem? Why is it occurring? What are we going to do about it? and Is it working?
The core principles of the model are: We can effectively teach all children, intervene early, use a multi-dimensional model of service delivery, and use a problem-solving methodology. We can effectively use research-based, scientifi cally validated interventions/instruction; monitor student progress to inform instruction; use data to make decisions; and use assessments for three different purposes: 1) screening, 2) progress monitoring, and 3) diagnostics. The model uses a three-tier approach: Tier I, which is intended to address core class instruction; Tier II, which incorporates supplemental instruction; and Tier III, which targets students for intensive intervention such as Special Education placement.
The following percentages guide the Tier intervention that should be considered: Is this an individual student problem or a larger systemic problem? If 20 percent of the students are struggling, look at instruction/curriculum; if 5-20 percent are struggling, use small group intervention; if 5 percent are struggling, consider individual intervention.
The annual Arkansas Comprehensive School Improvement Plans (ACSIP) list interventions in the action steps. The auditors found that the reference was repeated in three years of ACSIP plans. The evidence of success was noted in the plans as growth in achievement as noted on various assessments that included Dynamic Indicators of Basic Early Literacy Skills (DIBELS) and quarterly district assessments (see Finding 4.2), but no comparative charts or information were included (see Finding 1.2) in these plans.
The curriculum management audit lists fi ve criteria for the planning, implementation, and assessment of interventions. These criteria were used to determine whether the interventions in the Fayetteville Public Schools are designed in such a way that an intervention would have success as implanted and provide improvements in productivity. The criteria for effective interventions along with the auditors’ rating of adequacy and comments are presented in Exhibit 5.2.1. To be considered adequate, four of the fi ve criteria (80 percent) of the criteria must be rated as adequate. For this analysis, the RtI model and its implementation were used, not the individual programs that were being used for its accomplishment (see Findings 4.1 and 4.4).
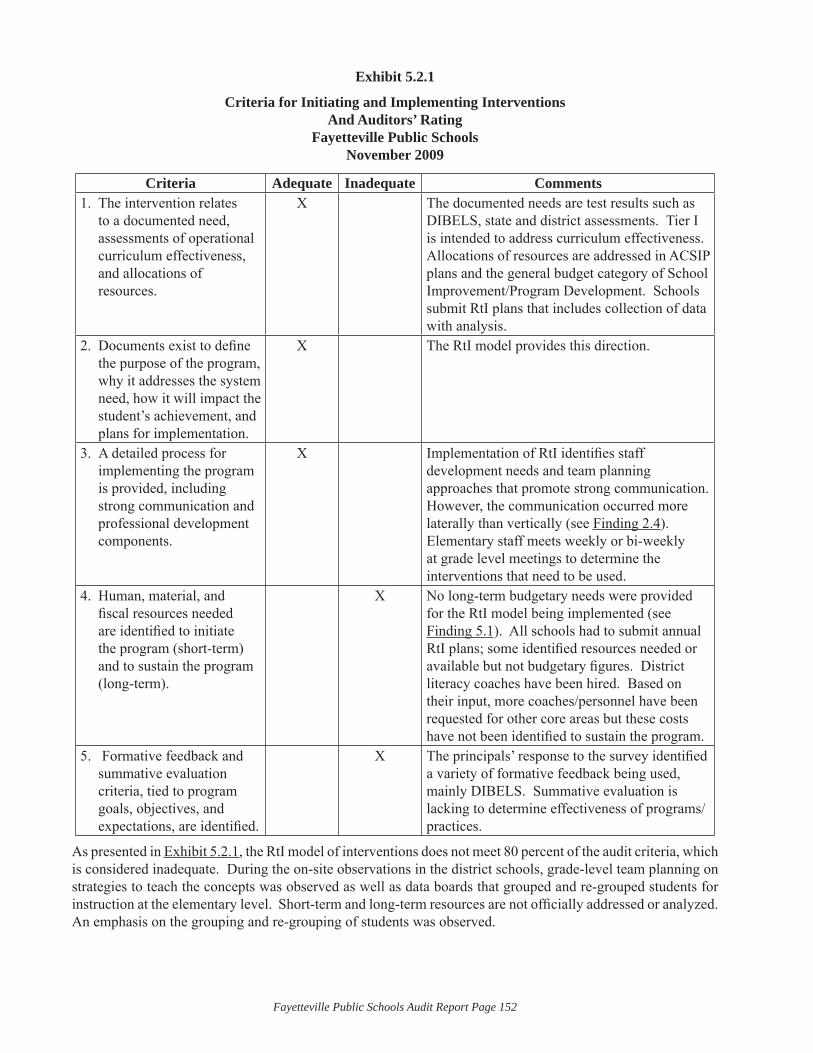
Fayetteville Public Schools Audit Report Page 152
Exhibit 5.2.1
Criteria for Initiating and Implementing Interventions And Auditors’ Rating
Fayetteville Public SchoolsNovember 2009
Criteria Adequate Inadequate CommentsThe intervention relates 1. to a documented need, assessments of operational curriculum effectiveness, and allocations of resources.
X The documented needs are test results such as DIBELS, state and district assessments. Tier I is intended to address curriculum effectiveness. Allocations of resources are addressed in ACSIP plans and the general budget category of School Improvement/Program Development. Schools submit RtI plans that includes collection of data with analysis.
Documents exist to defi ne 2. the purpose of the program, why it addresses the system need, how it will impact the student’s achievement, and plans for implementation.
X The RtI model provides this direction.
A detailed process for 3. implementing the program is provided, including strong communication and professional development components.
X Implementation of RtI identifi es staff development needs and team planning approaches that promote strong communication. However, the communication occurred more laterally than vertically (see Finding 2.4). Elementary staff meets weekly or bi-weekly at grade level meetings to determine the interventions that need to be used.
Human, material, and 4. fi scal resources needed are identifi ed to initiate the program (short-term) and to sustain the program (long-term).
X No long-term budgetary needs were provided for the RtI model being implemented (see Finding 5.1). All schools had to submit annual RtI plans; some identifi ed resources needed or available but not budgetary fi gures. District literacy coaches have been hired. Based on their input, more coaches/personnel have been requested for other core areas but these costs have not been identifi ed to sustain the program.
Formative feedback and 5. summative evaluation criteria, tied to program goals, objectives, and expectations, are identifi ed.
X The principals’ response to the survey identifi ed a variety of formative feedback being used, mainly DIBELS. Summative evaluation is lacking to determine effectiveness of programs/practices.
As presented in Exhibit 5.2.1, the RtI model of interventions does not meet 80 percent of the audit criteria, which is considered inadequate. During the on-site observations in the district schools, grade-level team planning on strategies to teach the concepts was observed as well as data boards that grouped and re-grouped students for instruction at the elementary level. Short-term and long-term resources are not offi cially addressed or analyzed. An emphasis on the grouping and re-grouping of students was observed.
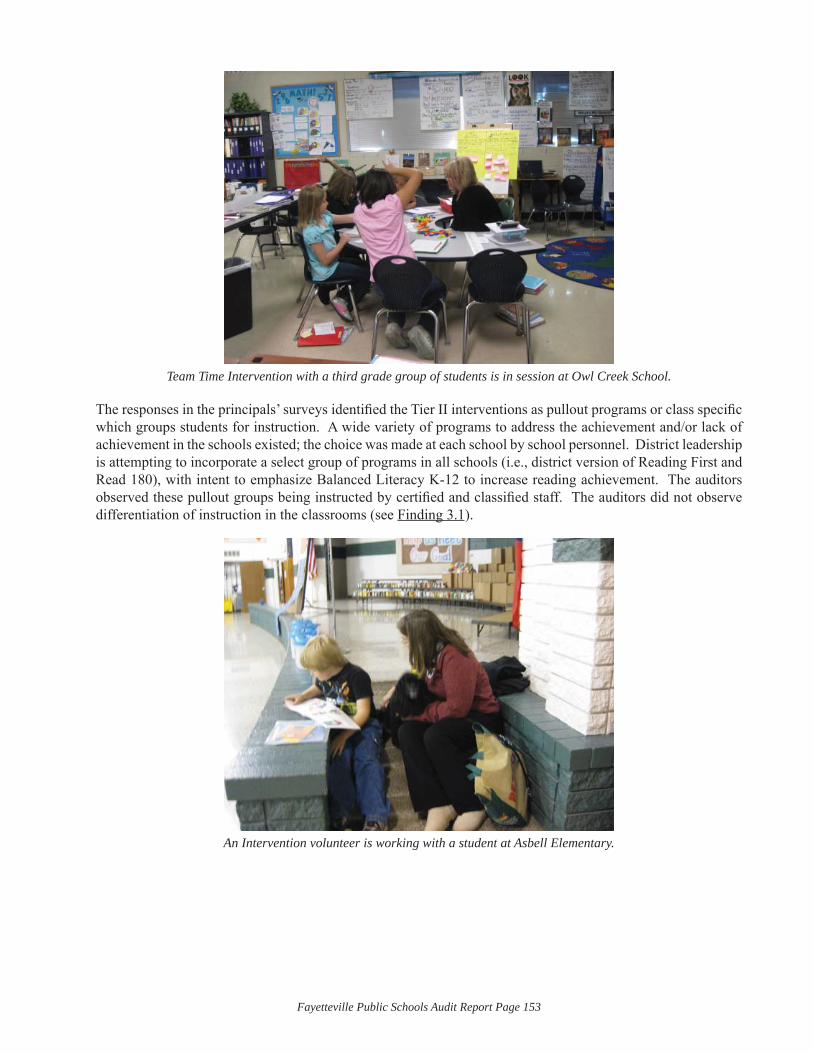
Fayetteville Public Schools Audit Report Page 153
Team Time Intervention with a third grade group of students is in session at Owl Creek School.
The responses in the principals’ surveys identifi ed the Tier II interventions as pullout programs or class specifi c which groups students for instruction. A wide variety of programs to address the achievement and/or lack of achievement in the schools existed; the choice was made at each school by school personnel. District leadership is attempting to incorporate a select group of programs in all schools (i.e., district version of Reading First and Read 180), with intent to emphasize Balanced Literacy K-12 to increase reading achievement. The auditors observed these pullout groups being instructed by certifi ed and classifi ed staff. The auditors did not observe differentiation of instruction in the classrooms (see Finding 3.1).
An Intervention volunteer is working with a student at Asbell Elementary.
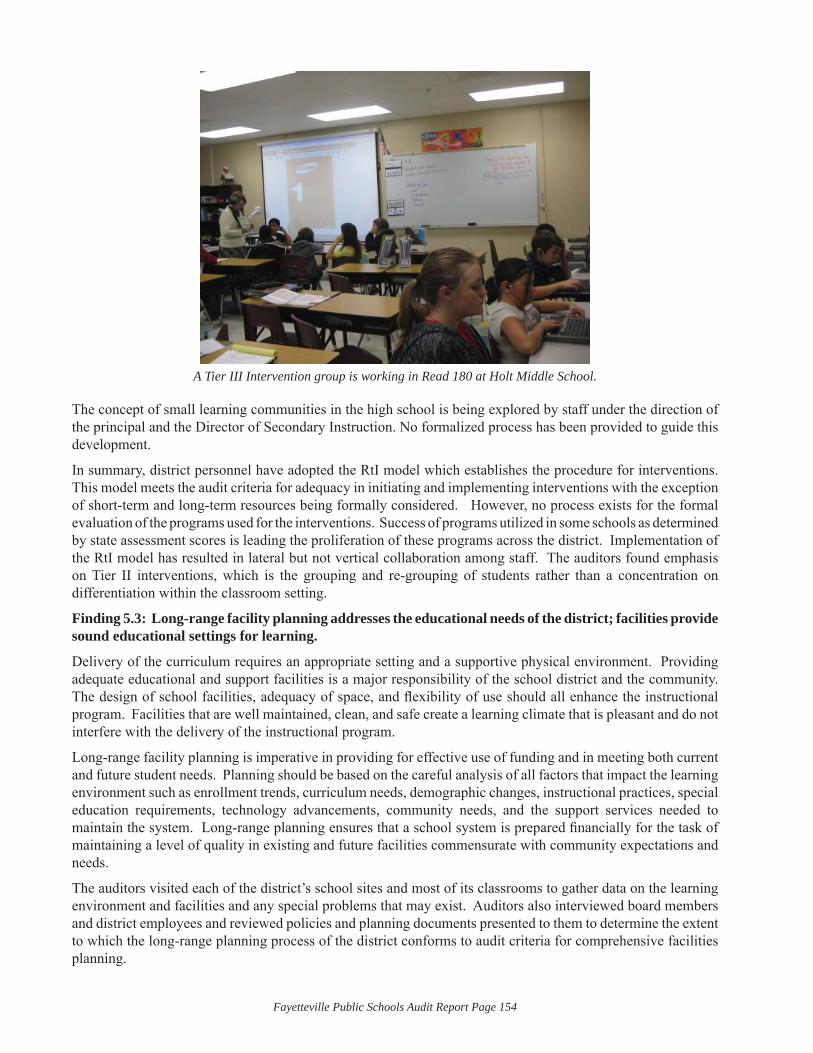
Fayetteville Public Schools Audit Report Page 154
A Tier III Intervention group is working in Read 180 at Holt Middle School.
The concept of small learning communities in the high school is being explored by staff under the direction of the principal and the Director of Secondary Instruction. No formalized process has been provided to guide this development.
In summary, district personnel have adopted the RtI model which establishes the procedure for interventions. This model meets the audit criteria for adequacy in initiating and implementing interventions with the exception of short-term and long-term resources being formally considered. However, no process exists for the formal evaluation of the programs used for the interventions. Success of programs utilized in some schools as determined by state assessment scores is leading the proliferation of these programs across the district. Implementation of the RtI model has resulted in lateral but not vertical collaboration among staff. The auditors found emphasis on Tier II interventions, which is the grouping and re-grouping of students rather than a concentration on differentiation within the classroom setting.
Finding 5.3: Long-range facility planning addresses the educational needs of the district; facilities provide sound educational settings for learning.
Delivery of the curriculum requires an appropriate setting and a supportive physical environment. Providing adequate educational and support facilities is a major responsibility of the school district and the community. The design of school facilities, adequacy of space, and fl exibility of use should all enhance the instructional program. Facilities that are well maintained, clean, and safe create a learning climate that is pleasant and do not interfere with the delivery of the instructional program.
Long-range facility planning is imperative in providing for effective use of funding and in meeting both current and future student needs. Planning should be based on the careful analysis of all factors that impact the learning environment such as enrollment trends, curriculum needs, demographic changes, instructional practices, special education requirements, technology advancements, community needs, and the support services needed to maintain the system. Long-range planning ensures that a school system is prepared fi nancially for the task of maintaining a level of quality in existing and future facilities commensurate with community expectations and needs.
The auditors visited each of the district’s school sites and most of its classrooms to gather data on the learning environment and facilities and any special problems that may exist. Auditors also interviewed board members and district employees and reviewed policies and planning documents presented to them to determine the extent to which the long-range planning process of the district conforms to audit criteria for comprehensive facilities planning.
Fayetteville Public Schools Audit Report Page 155
The auditors found that the Fayetteville Public Schools document, Facilities and Maintenance Master Plan, Volume I & II, provides adequate guidance and structure to support facilities planning and maintenance to address the needs of student enrollment and district instructional goals. Board policy and strategic goals do not direct alignment of facility planning with the curriculum and instruction goals of the district. The auditors found the facilities to be in excellent condition with recent renovations and replacement of building. Planning is underway to address the facility needs of buildings that are presently in need of repair or replacement.
Board Policy 1.7: Powers and Duties of the Board states as a duty of the board, “being responsible for the maintenance of the District’s buildings, grounds, and property,” but the policy does not direct facilities planning linked to future curriculum and instructional trends aligned with the district’s mission and vision (see Finding 1.1).
Two of the district’s strategic goals address facilities as follows:
“Goal #3: To improve effi ciency and quality of district facilities, fl eet management, and food service • operations.”
“Goal #7: Provide a safe school environment that promotes positive emotional and physical well being • and mutual respect for students and staff.”
As with the board policy, alignment of facility planning with the curriculum and instruction goals of the district is not stated.
The curriculum audit uses eight criteria to determine the adequacy of long-range facility planning. These criteria and the auditors’ assessment of facility planning efforts are presented in Exhibit 5.3.1.
Exhibit 5.3.1
Components of Comprehensive Long-Range Facilities Plan and Auditors’ Assessment of Facilities Planning Efforts
Fayetteville Public SchoolsNovember 2009
Criteria includes…. Auditors’ Rating Comments
Philosophical statements that review 1. the community aspirations and the educational mission of the district and their relationship to short- and long-range facilities goals
Adequate The community and district profi le in the master plan stated the expectation that facilities meet or exceed National norms as well as test scores and academic programs.
Enrollment projections, which take into 2. account any known circumstances that may change the pupil population
Adequate District’s enrollment projections were based on the past eight years of actual enrollment, City of Fayetteville’s 2020 Plan, projected housing starts, and Washington County growth projections.
The current organizational patterns of 3. the district and identifi cation of possible organizational changes necessary to support the educational program
Adequate Detailed description of current and future instructional delivery systems in the district were identifi ed by current organizational patterns.
Identifi cation of educational program 4. needs to be considered by designers of capital projects for renovation or addition of school facilities
Adequate Plans for the small communities concept in the high school were noted. Redesign of building that will focus on technology, arts, and vocational courses was addressed.
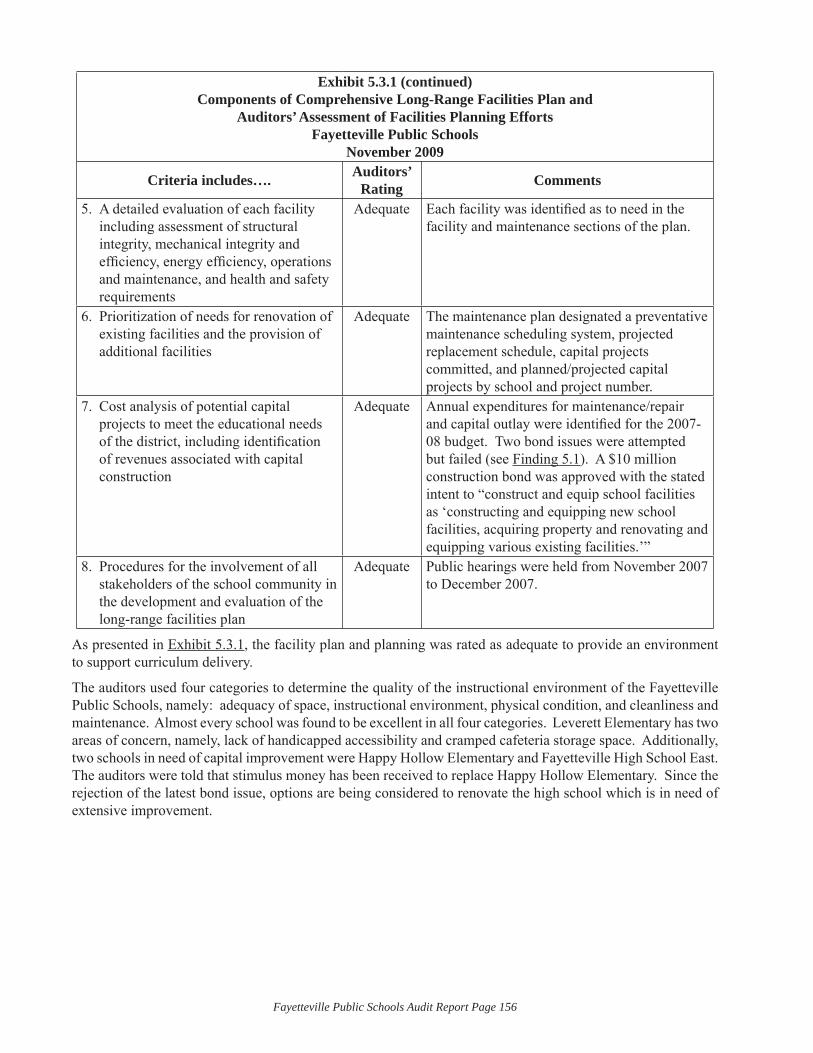
Fayetteville Public Schools Audit Report Page 156
Exhibit 5.3.1 (continued)Components of Comprehensive Long-Range Facilities Plan and
Auditors’ Assessment of Facilities Planning EffortsFayetteville Public Schools
November 2009
Criteria includes…. Auditors’ Rating Comments
A detailed evaluation of each facility 5. including assessment of structural integrity, mechanical integrity and effi ciency, energy effi ciency, operations and maintenance, and health and safety requirements
Adequate Each facility was identifi ed as to need in the facility and maintenance sections of the plan.
Prioritization of needs for renovation of 6. existing facilities and the provision of additional facilities
Adequate The maintenance plan designated a preventative maintenance scheduling system, projected replacement schedule, capital projects committed, and planned/projected capital projects by school and project number.
Cost analysis of potential capital 7. projects to meet the educational needs of the district, including identifi cation of revenues associated with capital construction
Adequate Annual expenditures for maintenance/repair and capital outlay were identifi ed for the 2007-08 budget. Two bond issues were attempted but failed (see Finding 5.1). A $10 million construction bond was approved with the stated intent to “construct and equip school facilities as ‘constructing and equipping new school facilities, acquiring property and renovating and equipping various existing facilities.’”
Procedures for the involvement of all 8. stakeholders of the school community in the development and evaluation of the long-range facilities plan
Adequate Public hearings were held from November 2007 to December 2007.
As presented in Exhibit 5.3.1, the facility plan and planning was rated as adequate to provide an environment to support curriculum delivery.
The auditors used four categories to determine the quality of the instructional environment of the Fayetteville Public Schools, namely: adequacy of space, instructional environment, physical condition, and cleanliness and maintenance. Almost every school was found to be excellent in all four categories. Leverett Elementary has two areas of concern, namely, lack of handicapped accessibility and cramped cafeteria storage space. Additionally, two schools in need of capital improvement were Happy Hollow Elementary and Fayetteville High School East. The auditors were told that stimulus money has been received to replace Happy Hollow Elementary. Since the rejection of the latest bond issue, options are being considered to renovate the high school which is in need of extensive improvement.

Fayetteville Public Schools Audit Report Page 157
Hot lunch freezers are crammed into a storage area at Leverett Elementary.
In summary, the auditors found that the master plan and planning of facilities and maintenance were adequate to provide direction for establishing an environment for teaching and learning. Board policies and strategic goals address the need for quality facilities but do not direct alignment with curriculum and instruction goals. The auditors found the facilities to be in excellent condition with recent renovations and replacement of building. Planning is underway to address the facility needs of buildings that are presently in need of repair or replacement.

Fayetteville Public Schools Audit Report Page 158
Fayetteville Public Schools Audit Report Page 159
IV. RECOMMENDATIONS OF THE PDK-CMSI CURRICULUM MANAGEMENT AUDIT TEAM FOR THE IMPROVEMENT OF THE FAYETTEVILLE PUBLIC SCHOOLSBased on the three streams of data derived from interviews, documents, and site visits, the PDK-CMSi Curriculum Management Audit Team has developed a set of recommendations to address its fi ndings shown under each of the standards of the audit.
In the case of the fi ndings, they have been triangulated, i.e., corroborated with one another. In the case of the recommendations, those put forth in this section are representative of the auditors’ best professional judgments regarding how to address the problems that surfaced in the audit.
The recommendations are presented in the order of their criticality for initiating system-wide improvements. The recommendations also recognize and differentiate between the policy and monitoring responsibilities of the board of education, and the operational and administrative duties of the superintendent of schools.
Where the PDK-CMSi audit team views a problem as wholly or partly a policy and monitoring matter, the recommendations are formulated for the board of education. Where the problem is distinctly an operational or administrative matter, the recommendations are directed to the superintendent of schools as the chief executive offi cer of the school system. In many cases, the PDK-CMSi audit team directs recommendations to both the board and the superintendent, because it is clear that policy and operations are related, and both entities are involved in a proposed change. In some cases, there are no recommendations to the superintendent when only policy is involved or none to the board when the recommendations deal only with administration.
Audit recommendations are presented as follows: The overarching goals for the board and/or the superintendent, followed by the specifi c objectives to carry out the overarching goals. The latter are designated “Governance Functions” and “Administrative Functions.”
Recommendation 1: Develop and adopt board policies accompanied with Administrative Regulations approved by the superintendent that provide alignment of curriculum, instruction, and assessment with all district processes to provide local control of curriculum management.
A comprehensive set of policies is necessary for effective curriculum management. Without defi nitive policies, the district leadership cannot ensure program focus, effectiveness, or consistency. Comprehensive board policies accompanied with administrative regulations approved by the superintendent provide clear direction for curriculum development and instructional delivery and set goals for attaining improved student achievement. Maintaining quality control of the curriculum requires the board to develop, review, and revise its policies periodically. This process may result in adding, revising, combining, or eliminating policies to address the changing needs of the school district. As the board adopts policies, it is important that changes and expectations are clearly and thoroughly communicated to all staff and the strategies for implementation of policies are communicated as well. It is critical for the Fayetteville Public Schools to attend to the development and use of policy related to curriculum management accompanied with administrative regulations approved by the superintendent that provide specifi city for implementation of those policies.
As the administration and board undertake this task, the following guidelines should be considered:
Policies with administrative regulations approved by the superintendent should establish clear direction • for the system.
Policies should provide for local initiatives to enhance the system beyond state directives.•
Policies should ensure consistency of action over time as individual members of the board and • administration change offi ce.
Policies should guide professional staff members in their individual efforts to improve direction in the • school system.
Fayetteville Public Schools Audit Report Page 160
Policies should establish the framework for the district to monitor progress in the delivery and attainment • of district learning goals.
Policies should establish historical base for the district for the purpose of voiding contradictory • actions.
Policies should establish a framework of evaluation for all employees of the district and require the • development and execution of professional development plans based on the evaluation.
Policies should delineate levels of decision-making authority.•
In Board Policy 1.7: Powers and Duties of the Board, the fi rst duty includes “developing and adopting policies to effect the vision of the District.” In Board Policy 2.1: Duties of the Superintendent, the fi rst duty includes “implementing the policies of the Board.” The auditors found an absence of board policy pertaining to curriculum management and instruction (see Finding 1.1). The few policies that addressed the criteria of the audit were rated inadequate (see Exhibit 1.1.7). While planning does exist in the district, the majority of formalized planning is state required. Board policy does not direct local long-range planning be done to provide direction for the district leadership in the areas of curriculum development and assessment (see Findings 1.2, 2.1, and 4.1). No board policy was found specifying the development and board approval of a table of organization with corresponding and updated quality job descriptions (see Finding 1.3). Training of the staff in the delivery of the written curriculum or monitoring that delivery is not required by policy (see Finding 2.4). Maximizing the use of technology is a strategic goal of the district but in-depth staff development is not provided to ensure implementation (see Finding 3.2). Board policies that referred to budgeting did not call for a program-centered budget process that includes cost-effective processes (see Finding 5.1). The board has approved a vision statement and eight strategic goals for the district but these are not a part of the board policies. The expressed expectation of the board is that these will provide the necessary guidance for administrative action, which is inadequate by audit standards.
Governance Functions: The following actions are recommended to the School Board of Fayetteville Public Schools:
G.1.1: Adopt policies that provide control, direction, connectivity and equity, feedback, and accountability for curriculum management in the district (see Exhibits 1.1.2, 1.1.3, 1.1.4, 1.1.5, and 1.1.6). Incorporate the district’s vision, core purpose, and strategic goals into these policies.
G.1.2: Through policy, require the superintendent to develop written Administrative Regulations or written formalized processes that will implement board policies pertaining to curriculum and instruction.
G.1.3: Expect that all reports to the board contain detailed information on each of the requirements/steps as specifi ed in Administrative Regulations or written processes specifi ed in G.1.2 above.
Administrative Functions: The following actions are recommended to the Fayetteville Public Schools’ Superintendent:
A.1.1: Submit draft policies as stated in G.1.1 that will provide over-arching direction to curriculum management in the district. Incorporate the district’s vision, core purpose, and strategic goals into these policies. Revise as needed and present policies for board adoption.
A.1.2: Write administrative regulations and/or processes to guide policy implementation in all areas identifi ed in this audit. Start with those needed to support current systemic direction such as planning requirements noted in Findings 1.2, 2.1, 2,4, 4.1, and 5.1. Write regulations that will meet the requirement of a rating of 3 as specifi ed in Exhibits 1.1.2 through 1.1.6). Submit these to the board for approval.
A.1.3: Use policies and written regulations/processes to monitor the implementation desired, changing as needed. Use these as a format for submitting reports to the board.
A.1.4: Support the implementation of board policies by making this function a part of the personnel appraisals for all staff.
Fayetteville Public Schools Audit Report Page 161
A.1.5: Provide ongoing staff development for all administrators and staff regarding policy intent and implementation. Address how this policy will affect everyday duties, and what the individual needs to do/change in his/her position to implement each policy.
This recommendation should be completed within six months of receiving this report.
Recommendation 2: Refocus all planning efforts to provide clear direction, coordination, prioritization, and sequencing of all initiatives at all levels and departments of the system. Require consistent monitoring and reporting of progress on all planning to key stakeholders to promote accountability, consistency, and alignment to district goals.
Effective planning is essential for focusing and organizing district resources to meet changing student needs. Long-range planning provides a systemic means to sustain constancy of purpose toward achieving goals. Planning efforts that are comprehensive and clearly focused benefi t students by increasing the probability that effective programs will be available to them. Coordination, prioritization, and sequencing of multiple plans and initiatives that emerge within a complex system are essential to insure that planning efforts support each other, and that no area of the organization or set of staff members bears an undue burden for implementing multiple initiatives at once.
The auditors found that district leadership is progressive in their approaches to attain their vision of preparing students for “an ever-changing, global society” as they initiate the integration of technology into 21st Century Learning. However, planning practices and the multiple plans being written do not provide for clear direction for the design, deployment, and delivery of that vision or district goals (see Finding 1.2). Communication regarding the rationale, initiation, implementation, or termination of planning is lacking, as rated in Exhibits 1.2.2, 1.2.3, and 1.2.4). State directives require annual school improvement district and individual school plans, but these do not provide a long-range viewpoint. District personnel have written numerous plans and received various state directives but these do not provide the coordinated effort necessary to provide local systemic direction (see Exhibit 1.2.1). No board policy directs the development of long-range planning that will provide consistency of effort (see Finding 1.1). No plans or formalized processes were found to give direction to curriculum management and assessment of student achievement and program effectiveness (see Findings 2.1, 4.1, and 5.2). The auditors found a lack of long-range systemic planning for in-depth staff development in curriculum, delivery, assessment, or integration of technology into instruction (see Findings 2.4, 3.2, and 4.4). Facility and maintenance planning was found to be aligned with district leadership’s direction (see Finding 5.3). The budgeting process was not aligned to long-range curriculum management planning (see Finding 5.1).
Governance Functions: The following actions are recommended to the School Board of Fayetteville Public Schools:
G.2.1: Adopt a board policy that requires long-term systemic planning that incorporates the vision, core purpose, and strategic goals of the district. The policy should address development, implementation, monitoring, evaluation, and relationship to the budget planning process and public reporting procedures in an ongoing manner. Direction should be given in policy or administrative regulations for coordinating, prioritizing, and sequencing all planning efforts in the district.
G.2.2: Before approving any new initiatives, programs, projects, or grant applications, hold staff accountable for demonstrating not only how the proposal links to district strategic planning, but also how it can be successfully integrated into and sequenced with ongoing efforts at the district and site level in order not to scatter the focus and overburden any individuals or groups with responsibility for implementing multiple change efforts at once.
G.2.3: Establish procedures that ensure regular, written reports to the board on the progress of all system plans, such as technology, curriculum development, staff development, and all major grant efforts. These reports should demonstrate systemic alignment to district long-range systemic planning, particularly in relation to improving student achievement. Provide this information to members of the community.
G.2.4: Through policy, revise budget procedures to align with programmatic budgeting. This will insure that planning priorities are refl ected in budgeting and spending activities (see also Recommendation 9).
Fayetteville Public Schools Audit Report Page 162
Administrative Functions: The following actions are recommended to the Fayetteville Public Schools’ Superintendent:
A.2.1: Develop for review and adoption a board policy that meets the criteria described in G.2.1 and G.2.2, stated above.
A.2.2: Develop an administrative regulation that will provide specifi city in the planning process that will include G.2.3, stated above.
A.2.3: Prior to the writing of any plan, provide training with discussions among a broad range of personnel, including all administrative and key instructional staff, pertaining to the following:
Understanding and adhering to the critical components of an effective system planning process. Use • the audit criteria in Exhibits 1.2.2, 1.2.3, and 1.2.4 as a guide.
Building staff members’ capacity to address components of the planning process as they assess school • and departmental needs.
Understanding how system planning encompasses required state plans.•
Setting realistic goals and developing target activities and specifi c measures designed to have the most • powerful impact on improving student achievement and overall system effectiveness.
Monitoring progress and reporting results in ways that clearly indicate what has/has not been • accomplished and subsequent impact.
A.2.4: Use the district’s vision, core purpose, and strategic goals as a guide to determine three or four district goals that could accomplish the intent. Determine action plans that could be accomplished within three to fi ve years and distribute these actions/strategies over this span of time. Utilize the audit criteria presented in Exhibit 1.2.3 for the development of a written long-range plan.
A.2.5: Establish discussion sessions in every school and every department as to the meaning, expectation, and measurement of this long-range systemic plan/direction. Revise as needed. Solicit acceptance of this from the staff as well as board adoption.
A.2.6: Develop procedures to promote system-wide communication, coordination, and integration of all departments and schools plans, planning efforts, and initiatives. Include a procedure for analyzing potential impact of plans or planning components on resources (personnel, time, and money) and for prioritizing and sequencing plans and action steps so that, taken as a whole, they are manageable and maintain focus in the district on the system plan/direction.
A.2.7: Develop procedures for monitoring and evaluating supporting plans/procedures, such as curriculum management, staff development, technology, assessment, and facilities, as well as plans incorporated in grants from various funding sources, to ensure that these are closely aligned with the priorities of district direction and are making progress toward these goals.
A.2.8: Prepare regular reports to the board, staff, and community regarding the rationale, implementation, and evaluation of the full range of district plans/planning projects, and initiatives and how they align with district direction.
A.2.9: Expect that all future action and decision making in the district will be clearly linked to the district’s systemic planning, well coordinated with all departments, and sequenced and prioritized in a way that allows for successful implementation given existing resources and time frame.
The fi rst step in implementing this recommendation after the drafting of a board policy and administrative regulation should be the training of personnel (A.2.3 above), which should occur within six months after receiving this report. Determining the systemic direction for the district with a written plan or processes should occur within a year after receiving this audit report. Aligning all planning and decision making to this direction should be continuous.
Fayetteville Public Schools Audit Report Page 163
Recommendation 3: Formalize, clarify, communicate, and document district expectations for curriculum management through board policies and a curriculum management process to provide district-wide direction for the design, delivery, monitoring, and evaluation of quality aligned curriculum for all subjects taught.
School districts with highly effective curriculum management have documented expectations related to processes and procedures for design, delivery, monitoring, evaluation, and review/revision of their curriculum. To respond to board expectations, these districts typically develop curriculum management planning documents to address the various components of that critical work. When procedures and timelines of the plans and processes are adhered to, school district personnel are able to be proactive in meeting local, state, and national challenges in providing a quality educational program for all students A well-defi ned curriculum development process is critical for the sound design, delivery, and evaluation of the Fayetteville Public Schools’ educational program.
The audit team found no evidence of a single comprehensive curriculum development plan or formalized process in district documents. Board policy did not provide direction for staff development efforts (see Finding 1.1). Some district documents available to the audit team did, however, contain some elements of curriculum development planning, but not all elements necessary for systematic coordination of planning efforts. The curriculum development planning information in these documents needs to be revised and merged into a comprehensive plan, directed by board policy and administrative regulation, that can be used to guide the design and delivery of the curriculum, monitoring practices, and systematic assessment of student achievement (see Finding 2.1). The following recommendations are designed to improve district curriculum development and maintenance procedures for the successful accomplishment of district goals.
Governance Functions: The following actions are recommended to the School Board of Fayetteville Public Schools:
G.3.1: Direct the Superintendent of Schools to design and implement a curriculum development policy that provides direction for development, implementation, monitoring, and evaluation of quality aligned curriculum. This board-approved policy should include the following:
A requirement that there be a curriculum development plan or formalized process that includes the • components outlined in Exhibit 2.1.1;
A philosophical framework for the design and development of the written curriculum;•
A requirement for alignment of the written, taught, and tested curriculum;•
The expectation of systematic K-12 articulation of learning goals and objectives that include measurable • student performance indicators;
The expectation that all courses offered be supported by written curriculum guides;•
A consistent format for the design of quality curriculum guides that includes the components listed in • Exhibit 2.3.1;
Expectations regarding classroom instructional practices that include differentiating instruction and the • integration of technology with the design and delivery of curriculum;
An expectation that there be systematic monitoring of curriculum delivery K-12 and assignment of • roles and responsibilities for that function to all instructional administrators;
The expectation that programs adopted by the system or individual schools align with the learning • standards or objectives of the related curriculum; and
Formal board adoption of all curricula prior to implementation.•
G.3.2: Through policy, direct the superintendent to annually review the effectiveness of the implementation of the curriculum management planning processes.
Fayetteville Public Schools Audit Report Page 164
G.3.3: Expect linkage of any school planning and school goals to the district’s curriculum management planning and long-range district planning.
G.3.4: Through policy, direct the Superintendent of Schools to require that district planning within and among departments is aligned vertically and horizontally to the curriculum management planning and those processes congruent with the district’s long-range plan.
G.3.5: Require that district policy and expectations for monitoring of curriculum across the district and within each school and program are implemented.
G.3.6: Commit adequate resources to support the curriculum development review cycle and staff development needed to assist in designing and delivering a high quality curriculum.
G.3.7: Establish through policy, direction that curriculum and assessment are system-wide decisions and the instructional method of delivery of the curriculum, supplementary resource selections, and strategies to support curriculum implementation are school-based decisions.
G.3.8: Require textbook and instructional resources to be aligned with grade level and content, district objectives, and adopted curriculum documents.
G.3.9: Require the Superintendent of Schools to submit periodic reports on the curriculum management process and assessment results, the revision of curriculum resources to improve teacher access and use of documents, and how the curriculum is being modifi ed to better attain high student achievement for all students.
Administrative Functions: The following actions are recommended to the Fayetteville Public Schools’ Superintendent:
A.3.1: In accordance with G.3.1, prepare drafts of a curriculum development policy and present to the board for review and adoption. Ensure that the policy addresses audit curriculum development plan criteria in Exhibit 2.1.1 and board directives as presented in G.3.1 through G.3.9, above. Upon adoption, distribute the policies among administrators and engage in discussion of the policies to ensure organization-wide understanding and implementation.
A.3.2: Formalize a comprehensive curriculum development plan or formalized processes that include the following elements:
Describes the philosophical framework for the design of the curriculum (standards-based, results-based, • competency-based).
Calls for a curriculum review cycle in all subject areas and at all grade levels.•
Defi nes and directs the stages of curriculum development.•
Delineates• responsibilities for curriculum-related decision making for district administrators, principals, teachers, as well as district and school committees.
Sets expectations for the format and components of all curriculum, assessments, and instructional guide • documents.
Directs how state and national standards will be included in the curriculum and type of standards • approach (backloaded or frontloaded).
Sets expectations for precise student objectives that are reasonable in number and aligned to state • standards for every content area and grade level.
Sets expectations for curriculum content as well as the use of multiple context and cognitive types.•
Sets expectations for differentiation of instructional approaches and selection of student objectives.•
Describes the approaches by which tests and assessment data will be used to strengthen curriculum and • instruction.
Outlines procedures for conducting formative and summative evaluations of programs and content.•
Fayetteville Public Schools Audit Report Page 165
Requires the design of a comprehensive staff development program to be linked to curriculum design • and its delivery.
Presents procedures for monitoring curriculum delivery.•
Establishes a communication plan for the process of curriculum design and delivery, as well as • celebration of progress and quality.
Implementation of this recommendation should start with the formalization of curriculum management processes, which could be completed within six months and should be communicated to all administrators and staff for possible additional input and revision, if necessary. This formalization/plan will enable school personnel at district and respective campuses to focus on those activities and strategies most likely to bring about improvement in student achievement.
Recommendation 4: Establish and implement comprehensive assessment and evaluation planning processes built on the skillful use of appropriate categories of data for monitoring the effectiveness of the district’s work at all levels, from the academic progress of individual students to the long-term effectiveness of district-wide programs.
With high-quality feedback about the effectiveness of a school district’s work, leaders can make decisions that assure the greatest improvements in learning for all of the district’s students. High-quality feedback is generated when the district has a well-designed and skillfully executed planning process for student assessment and program evaluation.
In the Fayetteville Public Schools, the audit team did not fi nd a systemic set of expectations for the planning of student assessment or program evaluation (see Finding 4.1). Board policy does not direct the development of formalized planning (see Finding 1.1). Curriculum guides do not provide the guidance for alignment with assessment (see Finding 2.3). There are a number of formative and summative assessment instruments in use— particularly at the elementary level—that provide high-quality feedback on students’ mastery of some of the curriculum, but there is no comprehensive written plan or cohesive set of district-wide procedures designed to assure high-quality feedback at all levels of the system for all students. District planning for program evaluation does not exist (see Findings 1.2, 4.1, 4.4 and 5.2). Few programs have formal evaluation reports, and the reports that have been produced are not able to guide future decision making to improve student outcomes. Budgetary planning does not utilize assessment data for cost-effective analysis of programs (see Finding 5.1).
Establishing a process for assuring adequate feedback is of utmost urgency for the district to achieve the goal of 100 percent profi ciency in literacy by 2012. It is an extraordinarily ambitious goal that will require extraordinary management of the district’s work. Without meaningful feedback on every aspect of the system to guide them, the district’s leaders will not be able to align all of their resources and efforts with that vision, and the goal will not realistically be achieved.
Governance Functions: The following actions are recommended to the School Board of Fayetteville Public Schools:
G.4.1: Direct the superintendent to draft a policy requiring the development of a comprehensive student assessment plan. Include in the policy a requirement that formal student assessment be included for all curricular areas at all grade levels, including formative data to inform instructional decisions and summative data to evaluate both the effectiveness of the curriculum and individual student mastery of the curriculum. Include in the policy direction for the superintendent to report annually to the board summative evidence of student mastery of the curriculum objectives for every course or subject area at every grade level.
G.4.2: Direct the superintendent to draft a policy requiring every program in the district to be evaluated at least once every three years. Include in the policy a requirement that a written report of each evaluation be submitted to the board including the immediate measurable student outcome goals of the program, analysis of data describing the degree of fi delity of implementation of the program’s elements, analysis of data describing the degree of attainment of the student outcome goals, and recommendations for future action based on the data analysis that includes cost-effective analysis for the budgeting process.

Fayetteville Public Schools Audit Report Page 166
G.4.3: Direct the superintendent to draft a policy requiring that the adoption of all programs be determined by a plan that includes goals for improving student learning outcomes and data specifi cations suffi cient for generating the evaluation report described in G.4.2, above.
G.4.4: Commit adequate resources to support the development and maintenance of a comprehensive system of student assessment and program evaluation, including suffi cient resources to assure the capacity to generate and analyze the data generated by the system.
Administrative Functions: The following actions are recommended to the Fayetteville Public Schools’ Superintendent:
A.4.1: Develop and present to the Board for adoption the policies recommended in G.4.1, G.4.2, and G.4.3, above.
A.4.2: Develop administrative regulations and procedures to support implementation of the student assessment plan described in G.4.1, above, that include the following attributes:
Describes the philosophical framework for the student assessment plan, considering factors such as • overall purposes and goals of student assessment, alignment to mission and curriculum, scope of assessment, types and uses of assessments, quality of assessment instruments, standards for professional development for assessment, management of the assessment process, and standards for analysis and dissemination of test results;
Specifi es the roles and responsibilities of central offi ce staff, building administrators, teachers, and • others for carrying out the components of the student assessment plan;
Specifi es the assessment information that will be included in curriculum guides;•
Specifi es how assessment data will be processed and the formats in which data will be displayed for the • various uses of outcome data;
Establishes expectations and procedures for administrators and teachers to use student outcome data to • improve the curriculum and the design of courses of instruction at all grade levels and in all subjects, and provides professional development to support this function;
Requires data analysis to identify bias and inequity and an action plan to eliminate them;•
Requires a written report of the fi ndings related to equity and bias and specifi es the frequency and • distribution of the report;
Specifi es how test results will be disseminated so that appropriate data are provided in usable formats • to each person who makes decisions at every level of the system (individual students, classrooms, curriculum design, programs, buildings, and district);
Establishes protocols for professional development to support all elements of the student assessment • plan;
Specifi es the procedures and personnel for managing the assessment process to assure that results are • accurate, complete, and secure, including storage of assessment instruments, distribution of testing materials, monitoring of test administrations, and gathering and scoring of answer sheets or management of computer-based response formats;
Specifi es the steps and timelines of the budget process to assure that all elements of student assessment • have adequate resources;
Specifi es the procedures by which the implementation of the student assessment plan will be • monitored;
Specifi es the frequency, content, and dissemination of reports on the progress of implementation of the • student assessment plan; and
Specifi es the procedures and timelines for reviewing and amending the student assessment plan.•
Fayetteville Public Schools Audit Report Page 167
A.4.3: Develop administrative regulations and procedures to support implementation of the program evaluation plan described in G.4.2, above, that include the following attributes:
Describes the philosophical framework for the program evaluation plan, considering factors such as • purposes and goals of program evaluation, alignment to mission and curriculum, scope and frequency of program evaluation, types and sources of data used for program evaluation, methods for data analysis, responsibility action based on program evaluations, standards for professional development for program evaluation, and content and quality of program evaluation reports;
Specifi es the roles and responsibilities of central offi ce staff, building administration, teachers, and • others for carrying out the components of the program evaluation plan;
Specifi es the professional development to be provided to staff who are responsible for components of • the program evaluation plan to assure consistent quality of execution and uniformity of process;
Specifi es which programs will be evaluated in which years;•
Specifi es the content to be included and outline to be followed for written program evaluation reports • (see Exhibit 4.4.4).
Outlines the decision-making process based on program evaluation reports, including the timelines for • making decisions, categories of decisions to be made, factors and data to consider, protocols to follow for making decisions, participants in the decision-making process, documentation of the decisions made, and dissemination of the decision;
Specifi es expected timeline, personnel responsible, and protocol for monitoring and reporting follow-• up actions based on decisions made in response to program evaluation reports;
Includes a provision for avoiding • de facto continuation of programs that are not achieving results proportional to the resources invested;
Specifi es the steps and timelines of the budget process to assure that all elements of program evaluation • have adequate resources;
Specifi es the procedures by which the implementation of the program evaluation plan will be • monitored;
Specifi es the frequency, content, and dissemination of reports on the progress of implementation of the • program evaluation plan; and
Specifi es the procedures and timelines for reviewing and amending the program evaluation plan.•
Policies and administrative regulations that will direct the development of evaluation processes should be completed within six months after receiving this report which is included in Recommendation 1. These should then be used to guide the initiation, implementation, modifi cation, and/or elimination of every practice and program. Utilize these processes to evaluate the effectiveness of current programs.
Recommendation 5: Revise or design curriculum guides for all courses offered in the district based on a vertically articulated K-12 scope and sequence of local learner objectives aligned with the Arkansas Frameworks. Refi ne curriculum delivery strategies so that classroom activities are at an appropriate level of rigor and the classroom environment provides a focus for learning.
A comprehensive curriculum development formalized process or plan, coordinated with all district and site plans, enables a district to achieve and maintain a quality, aligned curriculum. In an effective school system, the curriculum development process is directed by board policy and clearly communicates the curriculum development and maintenance process. Recommendation 3 addresses auditors’ recommendations for a comprehensive curriculum management process.
Effective teaching begins with teachers’ access to quality curriculum documents that direct planning and are aligned and coordinated across subject matter, grades, and schools. Quality curriculum documents identify
Fayetteville Public Schools Audit Report Page 168
objectives, prerequisite skills, instructional resources, teaching strategies, and are aligned with student assessments. Curriculum documents must be functional, user-friendly, and establish high expectations for students. Appropriate curriculum documents include clear goals and objectives that provide teachers with content and methods to address diverse learners including gifted, special education, ESL, and ELL populations.
Auditors found that the scope of the written curricula (the curriculum guides available for each course taught) is adequate at the elementary campus levels, but not at the junior high and high school levels (see Finding 2.2). The majority of the Fayetteville Public Schools’ curriculum guides are inadequate to give quality support to instructional implementation of the curriculum (see Finding 2.3). The auditors found that the cognitive complexity of some samples of instructional materials did not meet the levels of rigor found in the curriculum objectives and state expectations (see Finding 3.1). The integration of technology into instruction has not occurred at the level of expectation in the district (see Finding 3.2). Board policies do not require written curriculum documents to guide instruction in the classroom (see Finding 1.1).
The following recommendations are designed to improve district curriculum development and implementation for the successful accomplishment of district goals.
Governance Functions: The following actions are recommended to the School Board of Fayetteville Public Schools:
G.5.1: Direct the Superintendent of Schools to design and implement a curriculum development policy that provides direction for development, implementation, monitoring, and evaluation of quality aligned curriculum. This board-approved policy should include the functions listed in G.3.1.
Administrative Functions: The following actions are recommended to the Fayetteville Public Schools’ Superintendent:
A.5.1: Formalize and implement single-source, user-friendly curriculum guides with a common format and common vocabulary. Use of a consistent, district-wide format enhances the usefulness of guides by allowing teachers to focus on the guide contents, rather than learning new formats from one content area to another or one grade level to another. This is especially important for elementary teachers who teach multiple subjects or for teachers who change from one grade level to another. Single-source documents for primary reference especially help systems with considerable student mobility within the school system. The following steps should be addressed in this process:
Organizational preparation:1.
Select a small number of individuals from each content area to work with content coordinators; provide • those individuals with training in curriculum design, with specifi c attention to alignment of resources, assessments, and instructional strategies.
Establish a consistent, system-wide format with common vocabulary for curriculum guides that is • functional and user friendly. The following information might be included in each guide:
Front Material: Cover page, system, information, table of contents. ○
How to Use This Guide: Statement of purpose of the guide, how to use the guide, how the guide is ○organized, and glossary of terms and acronyms.
Orientation to the Curriculum: Statement of philosophy of the written curriculum, themes and ○strands, presentation of spiraling aspects of the curriculum, listing of major resources listing of formal assessments, and time allocations.
General Information: The beliefs and underlying research as well as strategies for teaching the ○discipline might be included. District focus for 21st Century Learning or elements of an effective K-12 Literacy Program would be described here, with specifi cs for implementation included throughout each curriculum guide, as appropriate.
Fayetteville Public Schools Audit Report Page 169
Scope (across levels and courses) and Sequence (from grade to grade and from one instructional ○level to the next) for all levels and course in a specifi c discipline. A vertically articulated scope and sequence document should be included in all curriculum guides. At the elementary level this might include a K-7 scope and sequence. For junior high it would be grades 8-9. Whatever the arrangement, such a document should provide teachers with easy access to what comes before and what comes after in relation to specifi c skills and concepts. It is essential that development of a vertically articulated scope and sequence be the starting place for curriculum development or revision.
Pacing guides for each course that provide a succinct overview of the learning that will take place ○each quarter or semester.
Guide pages for each learning objective. ○
Designing curriculum:2.
Review the latest research and expert thinking in the discipline.•
Assess existing curriculum’s strengths and weaknesses.•
Include all elements specifi ed in the audit criteria for high-quality curriculum guides (see • Finding 2.3 and Exhibit 2.3.1):
A clear statement of what skills/concepts should be learned, when ( the sequence), student ○performance indicator, and the amount of time given in a meaningful unit, i.e., hour, period, day, fractional part of a week, for each objective;
Linkages between each objective and district or state assessments; ○
Specifi c delineation of prerequisite skills/concepts; ○
Specifi c linkages or match of adopted textbooks or instructional materials to the objective; and ○
Specifi c examples or model lessons on how to approach the key concepts and skills in the classroom ○using a variety of instructional techniques.
Integrate instructional technology and instructional differentiation.•
Include strategies for meeting the needs of English language learners, special education, and gifted • students.
Require that a curriculum review team analyze the curriculum documents as they are drafted and • revised. In addition to teachers who teach the discipline area under review, the team should include a principal and teachers trained in technology, special education, and gifted education.
Implementation:3.
Field-test the curriculum.•
Pilot the resource material, assessments, and instructional strategies.•
Evaluate curriculum effectiveness in terms of student achievement.•
Revise fi eld-tested curriculum guides based on feedback.•
Submit curriculum for adoption by the board.•
Require the availability of written curriculum guides for all teachers teaching the designated subjects.•
A.5. 2: Include local objectives to clarify, sequence, and provide additional specifi city to Arkansas Curriculum Frameworks when state examples are broad and span several grade levels. Provide documented linkage between local objectives and state standards. Prior to the development of a written curriculum guide, initiate staff development sessions that will address articulation and coordination of instruction using State Frameworks,
Fayetteville Public Schools Audit Report Page 170
benchmarks, multiple assessments, and a variety of cognitive types outside of the classroom textbook. The following sequence and setting is recommended over a period of time:
In small groups of mixed grade levels and subject areas, select a challenging high school standard • and benchmark in one discipline area. Discuss the concept that students are to master in learning that standard. Then have each member of the group address the concept that would need to be mastered at their grade level or subject area that would lead to mastery of the high school standard along with the pre-requisite skills needed.
Determine the cognitive type necessary to master the concept and what instruction in the classroom • might look like to challenge students to this cognitive type.
Determine all assessment processes that would allow a teacher to know that the student has achieved • mastery of the concept in every grade level and course represented in the group. Write multiple choice, short answer, and expanded response test items that could allow a student to demonstrate mastery.
Discuss all the possible instructional strategies that might be employed to reach all levels of students • in the classroom to master the concept with the intent of differentiating instruction (i.e., Gifted and Talented, Special Education, ELL students).
Determine all the possible instructional resources that could be utilized in providing material for student • learning and mastery of this concept.
Determine the amount of time that would be needed to master the concept at each level and in each • course, as determined above.
Determine learnings gleaned in this process and share with other groups.•
Repeat this process with a challenging high school standard and benchmark in another discipline area • for as many times as deemed necessary for staff.
As a total group, determine what would be needed in a written curriculum guide that would assist • teachers in assisting students to mastery of the concepts in the standards and benchmarks.
A.5.3: Provide in-depth staff development on areas pertaining to curriculum and instruction over a period of time that include: cognitive types; analysis of test items by content, context, and cognition type; differentiation of instruction; formative assessment; analysis and use of multiple assessment; developing rubrics for student self assessment; instructional strategies that work for ELL students, Special Education students, Gifted and Talented students; and selection of resources for instruction.
A.5.4: Establish expectations and processes for the monitoring of curriculum implementation across the district and within each school and program.
A.5.5: Establish a process to ensure that curriculum guides, texts, instructional programs/materials for all courses, including intervention courses and programs, are presented to the board for adoption.
A.5.6: Establish criteria and processes to ensure that planning within and across departments and across schools is designed to implement the district curriculum management plan.
A.5.7: Establish and communicate clear expectations for administrators and teachers on the use of assessments for diagnostic purposes, monitoring curriculum effectiveness, and program evaluation. Monitor the implementation of expectations and take action as necessary.
Implementation of this recommendation should start with the formalization of curriculum management processes, which could be completed within six months. This formalization/plan should be communicated to all administrators and staff for possible additional input and revision, if necessary. Then proceed with the staff development recommended pertaining to the State Frameworks. After this training initiate, the development of one curriculum area, following the steps above. Since literacy work has begun on Language Arts, this would be a good starting area. Completion of one area should take a year or less. Disseminate the written curriculum document to all staff through staff development on the use of the document regardless of the area to which they
Fayetteville Public Schools Audit Report Page 171
are assigned. Then proceed with development of two other core discipline areas the next year, and follow the process annually, based on the timeline developed by district personnel.
Recommendation 6: Develop a goal-focused district staff development plan that incorporates emphasis on growth in curriculum implementation, effective instructional strategies, technology, and skilled data use for instructional and curricular decision making. Monitor district and school follow-through with intended training and establish methods to activate ongoing support in implementing and refi ning the skills learned.
A well-planned professional development program is essential to achieving a district’s mission and goals and to improving the achievement of all students. Effective staff development is guided by a comprehensive plan that is linked to the goals of the district long-range, strategic, or improvement plan. Such a plan offers a variety of staff development models, incorporates follow up and support to ensure effective curriculum delivery and instructional practices, includes all staff, and provides for follow-up support and coaching. It also contains multiple evaluation methods that are used to determine effectiveness of the program and to plan future activities. The planning is based on the needs of individual staff members, individual schools, and the district as a whole, relative to desired student achievement. It incorporates appropriate adult learning experiences and evaluates progress based on the use of the training in the classroom.
The auditors found that the Fayetteville Public Schools’ current professional development plan is inadequate. It lacks adequate planning, coordination, monitoring, and evaluation (see Findings 1.2, 2.4, 3.1, and 4.1). While many professional development activities are available, much of the professional development has limited connectivity between professional development offerings and impact on both teacher performance and student achievement. Most professional development remains at the awareness level, with insuffi cient follow-up training, modeling, and coaching to result in effect implementation (see Findings 2.4, 3.1 and 3.2).
The following recommendations are designed to provide more clear direction for planning staff development, to communicate expectations more effectively, and to improve the focus of professional training in the district.
Governance Functions: The following actions are recommended to the School Board of Fayetteville Public Schools:
G.6.1: Revise existing professional development board policies to defi ne the purpose of professional development in terms of student achievement. Align all board policies in this area with the 18 Characteristics of a Comprehensive Professional Development Program (see Finding 2.4) as well as the following characteristics:
Clarify individual, building, and organizational professional development responsibilities and • accountability procedures at all levels of the school system: board, superintendent, district administrators, site administrators, teachers, and support staff. Defi ne roles and responsibilities to centralize and coordinate professional development efforts in order to provide consistency across the system in focus and approach.
Require that professional development trainings be evaluated in terms of improved student achievement • and demonstrated teacher competence in the classroom. Link the trainings and intended outcomes to the teacher appraisal program.
Formalize the connection between the district’s written curriculum and instructional practices to • professional development and teacher appraisal.
G.6.2: Through policy, direct the Superintendent of Schools to revise and implement a comprehensive, long-range professional development plan that identifi es key areas of focus for system-wide staff development, defi nes district and site responsibilities, and is coordinated with all district and school improvement plans. Support implementation of such a plan by allocating suffi cient funds to provide training in those areas identifi ed as most critical to improving student performance.
G.6.3: Direct the Superintendent of Schools to provide regular reports at least once a year concerning the improvement of instruction in the district, including information about progress of professional development and staff appraisal efforts that have impacted that improvement.
Fayetteville Public Schools Audit Report Page 172
Administrative Functions: The following actions are recommended to the Fayetteville Public Schools’ Superintendent:
A.6.1: Recommend revisions to board policies that refl ect a comprehensive professional development program for all employees to support the design and delivery of the district curriculum. Such policy should comply with the 18 Characteristics of a Comprehensive Professional Development Program shown in Exhibit 2.4.1. Develop administrative procedures to implement the above policies when revised and adopted.
A.6.2: Assign responsibility for staff development to central offi ce staff, who will insure that the district’s professional development program is focused on district priorities, and to principals, to clarify their role in professional development implementation.
A.6.3: Align all staff training with the district curriculum, district plans, school improvement plans, and student achievement results, as well as performance evaluation data of instructional staff members.
A.6.4: Develop a long range professional development plan aligned to the district’s long range plan to support district and building-level improvement plans. This plan should accomplish the following:
Focus professional development on three to fi ve key areas over a time period of three to fi ve years. • Address those areas that need focus in order to improve student achievement for all subgroups, including differentiation, teaching for mastery, use of formative assessment for instructional improvement and student feedback, or other areas identifi ed as best practices based on a review of disaggregated student achievement data. Require that all teaching, support staff, site and district administrators with responsibilities for curriculum, instruction, and student services develop a common body of knowledge in these key areas in order to ensure successful implementation of the new strategies (see Recommendation 4).
Incorporate in all professional development plans, whether site-based or district-wide, suffi cient • provisions for in-depth training and support over time to ensure that staff development results in changes in practice.
Defi ne expectations for administrative monitoring and feedback to staff regarding implementation of • new training in the classroom. Provide suffi cient, targeted staff development for administrators to carry out this monitoring function, including training not only on the new skills teachers are learning, but also on how to observe classroom implementation of the new strategies and how to provide growth-producing feedback to improve performance.
Hold individuals accountable for attending and utilizing the training through their annual performance • evaluations.
Develop, publish, and monitor plans for the implementation, evaluation, and adjustment of professional • development outcomes. Assign compatible priorities and resources to initiatives and the professional development projects that support them.
Issue guidelines to principals clarifying how central offi ce and site-based professional development • will be integrated to support curricular, technological, organizational, and instructional initiatives.
Integrate realistically funded staff development proposals into new and continuing initiatives, using • program budgeting and strategic planning processes (see Recommendation 8).
Require, as part of the program budgeting process, visibility of the entire staff development budget, as • well as written evaluation of the effectiveness of staff development activities, to determine if they are cost effective in improving student achievement.
Include in the plan methods for determining adequacy of the staff development program; strategies • to ensure the appropriate follow-up activities are planned and implemented; and ongoing program evaluation to assess effectiveness of individual professional development activities, as well as the overall professional development function. Evaluation for the professional development function should be based primarily on changes that positively impact student achievement rather than on qualitative satisfaction surveys regarding the content and delivery of training.
Fayetteville Public Schools Audit Report Page 173
A.6.5: Present an annual report to the board concerning the impact of professional development and teacher appraisal on student achievement using the information collected above.
The revision and adoption of policies should be completed within less than six months of receiving this report. Implement this recommendation in the process of formalizing curriculum management and assessment procedures. Establish the responsibilities for staff development in the organization chart assignments and corresponding written job descriptions.
Recommendation 7: Incorporate technology into prioritized district-wide planning that will provide teachers with effective teaching strategies to enhance learning for all students.
Fayetteville Public Schools is rich with technology equipment, but the implementation and use of technology at the classroom level to enhance student learning does not currently match the goals of the district (see Finding 3.2). The district needs to make the incorporation of technology into all classrooms a priority. This incorporation will require professional development for teachers to acquire the necessary strategies to enhance learning for all students that is aligned with quality curriculum guides. Professional development allows a district to implement new programs or enhance current programs within the district. In order for professional development to have the most impact, it must be pertinent to what is needed for the district. One way for the administration to determine the effectiveness of professional development or discover a need for professional development is to gain input from teachers and administrators.
The lack of a clear, district-wide plan for the incorporation of technology was evident in the district. Curriculum guides were found to be inadequate and did not provide direction for the integration of technology with instruction (see Finding 2.3). Auditors discovered an abundance of professional development, but no clear follow-through to continue implementation, especially concerning technology (see Findings 1.2, 2.4, and 3.2). Professional development planning was driven by individual buildings (see Findings 1.2 and 3.1). The use of data to monitor student achievement and evaluate professional development was lacking (see Findings 4.4 and 5.2). Interviews conducted by auditors revealed some aggravation on the part of administrators and teachers in regard to professional development, particularly as related to technology (see Finding 3.2).
With the absence of a clear plan for streamlined professional development concerning implementation of technology, teachers were not using technology on a regular basis. Classroom observations supported this statement. Board policy does not require feedback from professional development (see Finding 1.1) as part of the planning process. Board policy is also lacking concerning the implementation and use of technology in the classroom (see Finding 1.1).
Governance Functions: The following actions are recommended to the School Board of Fayetteville Public Schools:
G.7.1: Adopt a board policy concerning technology that will require the implementation of technology that aligns with district goals and objectives. Incorporate current strategic goals #2 and #5 into the policy.
G.7.2: Adopt a strengthened board policy concerning staff development (Policy 4131) to include required feedback from participants with measurable data that demonstrate effectiveness regarding student learning. Also, strengthen this policy to be more driven from the central offi ce with input from administrators and teachers.
Administrative Functions: The following actions are recommended to the Fayetteville Public Schools’ Superintendent:
A.7.1: Assist the board as needed in creating, updating, and implementing policies concerning technology and staff development as noted in G.7.1 and G.7.2, above. Submit to the board for approval and adoption.
A.7.2: Incorporate strategies using technology into quality curriculum guides that policy will require the use of in the classroom (see Recommendation 3) so that teachers will have clear direction/suggestions for the integration of technology into the teaching/learning of the content.
Fayetteville Public Schools Audit Report Page 174
A.7.3: Build into district planning, the role and direction that technology will take to assist in the integration of technology into instruction. Budget accordingly over a span of years so that purchasing of technology equipment aligns with the direction of the district leadership.
A.7.4: Develop administrative regulations that will direct administrative staff to monitor the use of technology in the classrooms across the curriculum, particularly regarding the effectiveness as measured by student learning.
A.7.5: Direct staff to monitor feedback from professional development participants and seek follow-through professional development for effective programs and eliminate ineffective programs as measured by student achievement.
Board policies and administrative regulations should be completed within six months of receiving this report as also stated in Recommendation 1. Once written, these should guide the planning, purchasing, and implementation that includes in-depth staff development that is monitored for effective implementation.
Recommendation 8: Develop and implement a budgeting process that aligns district and building-level resources to prioritized curricular goals. Include systematic cost-benefi t analyses using assessment data to assure that expenditures are producing desired results and are directed to the areas of greatest need.
Linkages between the budgets and programs that lead to predetermined priorities, goals, and strategies for improving student achievement is critical to the district’s overall success. Intended results are lost or delayed when there is not a thorough, systemic process to ensure that the fi nancial plan represents the district’s learning priorities. To allocate resources without comprehensive evaluation of results ignores the annual opportunity to strategically establish priorities and aggressively pursue intended results with new direction. In the absence of such comprehensive budgeting practices, system-wide effectiveness is often a matter of chance rather than intentional design.
The auditors found the district’s budgeting process lacking in critical steps and elements that provide connections from data to decisions and from allocations to results (see Findings 1.1, 1.2, 2.4, 3.2, 4.1, 4.2, 5.1 and 5.2). Auditors noted many programs and interventions, but were not provided clear evidence that any given program was effective or that it was being implemented with fi delity (see Findings 4.1, 4.4, and 5.2). No board policy directed implementation of a program-based budgeting process that included incremental funding possibilities, a process for evaluating options, and the use of program evaluation data linked to budget allocations (see Finding 1.1, Exhibit 1.1.5). The district has spent a large amount of funds on the purchase and installation of technology across the district but has not provided in-depth staff development for the implementation and integration of this technology (see Finding 3.2). While building administrators have been given free-rein with their allocated funds, the budgeting process has been closely controlled by central administrators (see Finding 5.1). While facilities and maintenance have a 10-year implementation plan that includes expenditures, these plans are not incorporated into district planning (see Finding 5.3).
Governance Functions: The following actions are recommended to the School Board of Fayetteville Public Schools:
G.8.1: Through policy, direct the superintendent to prepare directives and revised related job descriptions to provide overall direction for the budgeting process using criteria noted in Exhibit 5.1.1.
G.8.2: Through policy, direct the superintendent to establish procedures and prepare documents (including the district’s systemic plan/processes), which communicates the budgeting process and goals throughout the system and requires budget and staffi ng proposals to refl ect a direct connection to established data-driven priorities.
G.8.3: Require, as part of the budget development process, a presentation from the administration to communicate how the proposed budget addresses the goals and priorities and responds to student and program evaluation data. The presentation should include an evaluation of the effectiveness of the previous year’s budget in achieving district priorities.
G.8.4: Through policy, direct the superintendent to establish a fi ve-year-plan which, when implemented, will lead to successful implementation of G.8.1 through G.8.3, stated above.
Fayetteville Public Schools Audit Report Page 175
Administrative Functions: The following actions are recommended to the Fayetteville Public Schools’ Superintendent:
A.8.1: Draft and propose the policy and revise related job descriptions identifi ed in G.8.1, stated above.
A.8.2: Establish procedures and prepare budget documents (including the district’s new systemic plan/processes) that communicate the budgeting process and goals throughout the system and require budget and staffi ng proposals to refl ect a direct connection to the established data-driven priorities (see G.8.2).
A.8.3: Determine a budget development process and timeline to ensure that the budget planning processes are focused on specifi c, time-bound, and measurable goals. Clear connections must be established between the student performance information and the basic instructional and support areas of the budget. Undertake steps similar to the following to increase the connection of programs and priorities with budgeting decisions:
Using the current construction of your budget, identify various educational activities or programs and 1. group them into broad areas of need or purpose served.
Assign a budget/program manager to each program/intervention or budget request. Direct them to 2. prepare a concise and meaningful budget package for their respective areas.
Attach a goal statement to each program area or budget request which states the program/intervention’s 3. linkage to established goals and priorities, its purpose, the criteria for identifying success, and how these will be evaluated and reported. Each budget request should be described so as to permit evaluation of the consequences of funding or non-funding in terms of performance results. Principals’ involvement in this responsibility is critical.
Compile the goal/linkage statements and budget packages and give them to appropriate staff to gather 4. data that best describe needed service levels, program outcomes, and cost-benefi ts.
Defi ne program performance expectations and accountability with the involvement of staff (including 5. principals, teachers, and support staff). Current results should be compared to desired expectations and related service level requirements. For example, to be successful a specifi c program may need to be established at 110 percent of previous spending levels. This will necessitate a comparable reduction from some other program/budget judged to be of lesser current consequence.
Prepare guidelines and recommendations and give them to budget/program managers who will then 6. combine all recommendations into a single budget proposal.
Compile past cost information, especially expenditure percentages of budget, with performance data 7. and recommendations to guide preliminary budget estimates.
Appoint a budget planning team representing the various stakeholders who will eventually bring the 8. draft budget documents to the Superintendent’s Council. This team studies the goals, priorities, and parameters inherent in the decisions being made and receives technical support from the directors and managers who developed the program budgets. Discussions of cost-benefi t information are critical at this stage. Where needed, budget plans should be extended over a minimum of fi ve years to assure consistency of effort and focus (see G.8.4, above).
The Superintendent’s Cabinet evaluates and ranks the budget packages. Budget requests need to 9. compete with each other for funding based upon data derived from evaluation of the priorities of need and level of program/intervention effectiveness.
Compile results of the evaluation and ranking and publish them in a tentative budget with programs 10. listed in priority order. Use this draft with administrators for input before a draft is prepared for use as the presentation document.
Build the capital outlay and improvement budget from a zero (or modifi ed zero) base each year with 11. multi-year planning for improvements, including life-cycle replacement and preventive maintenance. Prioritize decisions based on health and safety factors, the impact on the learning environment, and
Fayetteville Public Schools Audit Report Page 176
protection of investment. Identify and communicate documented parameters for decisions on needs that are not considered health and safety matters. Many capital needs change annually and do not reoccur once met and paid for, such as durable goods and construction costs. The budget planning process should refl ect these changes while projecting life-cycle replacement cost of buildings and systems over 5 to 15 years.
Finalize budget allocations based on revenues available, the appropriation levels to be authorized, and 12. program funding priorities and rankings. Prepare the recommended budget to be taken to the board and then to the public hearing.
Use the public hearing process to communicate broadly the fi nancial planning link with student needs, 13. program priorities, and the results sought through the actions taken. Allow time for individual comments and questions before the budget adoption meeting. Prepare the fi nal document after considering public and board comments and seek adoption by the board.
Establish fi nal program and services to be funded at the level approved by the board and set the budget 14. in place.
A.8.4: Design the budget management process to allow for an acceptable variation (such as a plus or minus three to fi ve percent) permitting program managers suffi cient stability to achieve the desire results. Budget revisions should only occur when acceptable variations have been approved; failure to do so would violate sound accounting practices, and/or place the district in fi nancial jeopardy.
A.8.5: Provide training and consultation, as needed to all affected staff members during the transition to a curriculum-driven budgeting process and format. In addition, all district and building-level personnel who have accounting or program evaluation responsibility should be required to demonstrate competency in their respective duties in order to avoid frustration and ineffi ciencies that occur when such competencies are not present.
With such an approach to budgeting, both fi nances and program effectiveness are monitored simultaneously. It is important to note that such a system cannot be implemented hastily. Needed policies and related job descriptions should be completed in the next six months. The budget package approach can be in place in one year. The evaluation component is added as the district collects and interprets meaningful student achievement data, which should improve each year (see Recommendation 4) and be fully implemented in three years. Given this approach to budgeting, changes in funding or allocation levels are based on, “How well are we doing?” instead of, “How much did we spend last year or how much do we think we may need?” The implementation of a program-based budgeting process as noted above needs a period of three to fi ve years to be fully functioning.
It cannot be emphasized enough that principals, teachers, other staff, and parents must be key stakeholders in the budget building process. Without their individual involvement, educational priorities may not be accepted and appropriately focused. All shareholders will have a more complete idea of what is funded and what is not, based upon tangible linkages between program costs and student achievement.
Recommendation 9: Develop and adopt an organization chart with corresponding written job descriptions and appraisals that will provide sound management with focus on the design and delivery of quality curriculum that will assist in attaining higher achievement for all students.
Effective school districts are organized in cost-effective ways with defi ned responsibilities, established role defi nitions, and relationships. Successful organizations have clarity of function, manageable scope in responsibility, and the organization meets generally accepted expectations for administrative organizations, including adequacy of staff to perform the required work.
A school district’s graphic depiction of roles and relationships (Organization Chart) and its written descriptions of position functions and qualifi cations (job descriptions) are expected to be designed to focus on the curriculum design and delivery for those positions directly involved in these central educational functions. These documents allow the readers to understand what functions will carry out the district’s mission, what responsibilities are assigned to leadership and management roles, and how positions relate to one another. It is expected that the
Fayetteville Public Schools Audit Report Page 177
organizational chart and job descriptions will meet the design criteria found in Exhibits 1.3.1 and 1.3.3 to communicate clearly the leadership and role functions.
The auditors found that the current organization chart did not meet audit criteria for sound general management of the district (see Finding 1.3, Exhibit 1.3.1). Job descriptions did not meet audit criteria for effective design and delivery of the curriculum (see Finding 1.3, Exhibits 1.3.3 and 1.3.4). No board policy directs the development of a table of organization to provide specifi cations for decision-making to ensure consistency, non-duplication of tasks, and product requirements. No board policy directs the development of professional appraisal processes to address specifi c accountability functions in job descriptions of all staff and relate those to improved student achievement (see Finding 1.1, Exhibit 1.1.2). Comprehensive planning for systemic curriculum management and assessment was inadequate to provide direction in decision making (see Findings 2.1 and 4.1). Planning, in general, lacks specifi city for implementation and evaluation of progress being made in the district and where needs continue to exist (see Findings 1.2, 2.1, 2.4, 3.2, 4.1, 4.4, 5.1, and 5.2).
Governance Functions: The following actions are recommended to the School Board of Fayetteville Public Schools:
G.9.1: Through policy, direct the superintendent to prepare an organizational chart that meets audit criteria for board adoption. A suggested organization chart is provided in Exhibit R.9.1.
G.9.2: Adopt policy that requires the development of a table of organization that will provide specifi cations for decision making. In this policy, require the development of job descriptions that address specifi c accountability functions to focus on the design and delivery of quality curriculum aimed at increasing student achievement.
G.9.3: Through policy, direct the superintendent to begin working toward aligning staff appraisal instruments that refl ect the revised and rewritten job descriptions. The appraisals should include the responsibility for the implementation of board policies and district systemic direction as well as the relationship of the position to teaching and learning in the district.

Fayetteville Public Schools Audit Report Page 178
Exhibit R.9.1
Suggested Table of OrganizationB
oard
of E
duca
tion
Lega
l Cou
nsel
Supe
rinte
nden
t
Acc
ount
ant
Payr
oll
Teac
hers
K-6
Inst
. Tec
hnol
ogy
Teac
hers
Supp
ort S
taff
Coo
rdin
ator
Ath
. A
ctiv
ities
Ass
ista
nt A
Cs
Ass
ista
nt D
irect
or
Ass
ist.
Prin
.
Coo
rdin
ator
sFe
dera
l Pro
gram
sFa
mili
es in
Tra
nsiti
on
Dire
ctor
Tech
nolo
gy
Prin
cipa
lsM
S, Jr
H, H
S
Dire
ctor
sH
uman
Rel
atio
nsN
ursi
ngFo
od S
ervi
ceM
aint
enan
ceTr
ansp
orta
tion
Trea
sure
r
Ass
ocia
te S
uper
inte
nden
t El
emen
tary
Chi
ef A
cade
mic
O
ffi ce
rC
hief
Fin
anci
al/
Bus
ines
s Offi
cer
Chi
ef In
form
atio
n O
ffi ce
r
Ass
ocia
te S
uper
inte
nden
t Se
cond
ary
Dire
ctor
sG
ifted
/Tal
ente
d21
st C
en. L
earn
ing
Spec
ial S
ervi
ces
CIA
A
Elem
. Prin
.
Dire
ctor
sSe
cond
ary
Inst
& C
TEA
dult
Educ
atio
n
Mat
hLi
tera
cyK
-12
Inst
ruct
iona
l Tec
hSt
aff D
evel
opm
ent
Coo
rdin
ator
Pre-
K &
Spe
cial
Pr
ogra
ms
Ass
ist.
Prin
.
Ente
rpris
e &
N
etw
ork
Sys.
Clie
nt S
erv.
HR
Spe
cial
ists
Lite
racy
Coa
ches
Teac
hers
7-12
Inst
. Tec
hnol
ogy
Teac
hers
Supp
ort S
taff
Supe
rvis
ors
Food
Ser
vice
Cus
todi
alM
aint
enan
ce
Publ
ic In
form
atio
nO
ffi ce
rPr
oduc
tion
Spec
ialis
tM
ultim
edia
Serv
ices
War
ehou
se M
anag
er
Dis
cipl
ine
Man
ager
Nur
ses
Fayetteville Public Schools Audit Report Page 179
Administrative Functions: The following actions are recommended to the Fayetteville Public Schools’ Superintendent:
A.9.1: Develop policies noted in the governance functions above for submittal to the board for approval and adoption (G.9.1 through G.9.3). Write corresponding administrative regulations as needed for specifi city.
A.9.2: Implement the following recommended positions/changes:
With the intent of demonstrating that the main function of Fayetteville Public Schools to be that of • teaching and learning, the positions of Associate Superintendents, Principals, and school staff are in the center of the chart.
With the intent of aligning operations with a Chief Offi cer rather than reporting directly to the • Superintendent and eliminating the position of Assistant Superintendent of Student Life Services, the title of Chief Financial Offi cer is changed to Chief Financial/Business Offi cer. Directors of Maintenance, Food Service, Transportation, and Human Relations along with the Treasurer and Accountants/Payroll will report to the Chief Financial/Business Offi cer.
With the intent of integrating technology with instruction, the position of K-12 Instructional Technology • has been moved under the Director of Curriculum Instruction, Assessment, and Accountability for coordination. The Technology teachers will report to the Building Principals.
With the intent of coordinating Staff Development with instruction, the title of Staff Development • Coordinator was chosen to demonstrate its importance and will report to the Director of Curriculum, Instruction, Assessment, and Accountability.
With the intent of coordinating the development of small learning communities at the secondary • level, the position of Director of Secondary Instruction & CTE will report directly to the Associate Superintendent for Secondary Schools.
With the intent of coordinating Adult Education as a possible extension of secondary education, • the position of Director of Adult Education will report directly to the Associate Superintendent for Secondary Schools.
The position of Director of Student Services was eliminated with recommendation to distribute these • duties to other personnel, (i.e., Associate Superintendents and Director of Special Services)
A.9.3: Before implementation of organizational changes, explain the signifi cance of curriculum design and delivery to all personnel so that each person realizes his/her role in the main task of the Fayetteville Public Schools.
A.9.4: Require the Director of Human Resources, as his job description requires, to revise and write job descriptions for all staff to refl ect their roles and responsibilities regarding curriculum design and delivery and their responsibilities toward accomplishing the goals of the district. Use Exhibit 1.3.3 to guide in the development of these. Require the Director of Human Resources to work with employee organizations and administrators to develop appraisal instruments that are aligned with revised job descriptions. Utilize these job descriptions for job postings.
A.9.5: Review the organizational chart and job responsibilities annually, and report to the board any anticipated changes.
It is recommended that these changes in the table of organization be completed over a period of time which would allow personnel to acquire necessary certifi cation or personnel is hired with required certifi cation. However, writing and revising of job descriptions and appraisal instruments should be completed within a year.

Fayetteville Public Schools Audit Report Page 180
Fayetteville Public Schools Audit Report Page 181
V. SUMMARYA Curriculum Management Audit is basically an “exception” report. That is, it does not give a summative, overall view of the suitability of a system. Rather, it holds the system up to scrutiny against the predetermined standards of quality, notes relevant fi ndings about the system, and cites discrepancies from audit standards. Recommendations are then provided accordingly to help the district improve its quality in the areas of noted defi ciency.
The auditors subjected the Fayetteville Public Schools to a comparison of predetermined standards and indicators of quality, and discrepancies were noted. These constitute the fi ndings of the audit. The auditors then provided recommendations to help the district ameliorate the discrepancies. The recommendations represent the auditors’ “best judgment” about how to address the discrepancies disclosed in the report. It is expected that the superintendent and his staff and the board may demur with the recommendations. However, they form the starting point for discussion of how to deal with the documented fi ndings.
Normal audit practice is that the board of education receives an audit; they do not accept it. After review of the audit report, the board requests a response from its superintendent of schools. When the superintendent’s response is received, then the board is in a position to act upon the two sets of recommendations. In this manner, the superintendent and the board are always accountable for what occurs in the school system after an audit report.
The Fayetteville Public Schools’ leadership has set ambitious goals of becoming a 21st Century Learning district with emphasis on literacy. They have set preparation of students for an ever-changing global society as the vision for educating their young. However, direction for how to attain these goals and vision is lacking; formalized systemic procedures have not been activated which has left the staff and the community a bit confused. The auditors found little direction for curriculum and instruction in board policies and administrative regulations which could provide that guidance. Rather than adopting board policies, the board has adopted a vision statement, core purpose, and strategic goals that they estimate will guide the administration in their fulfi llment. Systemic planning that might develop the goals toward attaining the district mission through focusing on collaborative efforts was found to be inadequate. Other avenues that would assist in this focus of concerted effort, such as job descriptions that aligned with the table of organization, were also found to be inadequate. District accomplishments are more dependent on individuals and individual schools than on a system.
Fayetteville Public Schools’ leadership is very forward thinking about the implementation of technology into its schools. However, without in-depth staff development on the integration of high-class technology equipment into instruction, the degree to which technology achieves the vision of the district is questionable. The lack of quality curriculum guides has led to the incorporation of textbooks as the design for teaching the State Frameworks Curriculum. Staff development provides a cursory approach to the implementation of new ideas/concepts/material. In-depth focus and follow up is needed to provide the impact on high achievement for all students, which is the goal of the district staff.
District personnel lack systemic practices regarding assessment. All personnel must begin to couple all actions and decisions with a “how can we determine this is effective” attitude and process. These practices must occur before the action/program is put into effect, while it is occurring, and in a prescribed period of time to determine effectiveness as shown by data gathered and analyzed. Presently, the district and school leadership often launch a project/program before the ramifi cations of such action are entirely thought out. Assessment must become an integral and embedded component in the delivery of instruction in every classroom across the district, with emphasis on differentiation of instruction within the classroom structure rather than grouping outside of it. Quality curriculum guides, with staff development on the use of these guides, can assist teachers in providing strategies for this differentiation of instruction.
The budgeting process must initiate this same assessment attitude in the development of a budget that is curriculum-driven and priority focused. The ability to direct resources to the areas of greatest need based on information, which includes assessment data, will allow the district leadership to do cost-benefi t analyses of results obtained. This ability is necessary for effective and effi cient budget development and cost reductions
Fayetteville Public Schools Audit Report Page 182
that can be justifi ed to the public. The intended introduction of zero-based budgeting could assist in initiating this approach.
Legal and learning challenges lie ahead for the Fayetteville Public Schools in the continued implementation of state mandates and federal laws. Pressures to improve student achievement at all schools for all students, especially as related to subpopulation achievement gaps, will continue. Staff development offerings will need to address differentiation and other strategies that are crucial to the learning and achievement of all students.
The effi cacy of the recommendations contained in this audit rests on a viable, valid, comprehensive, and focused board policy framework with administrative regulations providing specifi city for the implementation of those policies. Of all the requisite conditions necessary to put into place the components of an improved curriculum management system in the Fayetteville public Schools, this piece is fundamental. Hence, the auditors recommend that district leadership adopt board policies with accompanying administrative regulations and the suggested organization chart with corresponding job descriptions to provide local control. Provide direction through a systemic plan or formalized processes that will be adhered to in all departments and all schools. Incorporate reasonable timelines that include providing rationale for all initiatives/changes that include fi nancial expectations. Build systemic curriculum management and assessment processes into the practices of central offi ce and school personnel. Follow the recommendations in this audit as you proceed. Use the maxim “go slowly but go thoroughly” as a guide for your progress. Establish broad knowledge and common vocabulary bases for each endeavor.
The audit is based on the premise that some aspects of management are centrally held by district leadership and other aspects at the school site. Those held centrally are the ends, the mission, the standards, goals and priorities, student objectives, and student assessment. Those held at the school site are instruction, strategies, groupings, staffi ng, processes, resources, and programs, but all of these are accountable to those managed at the district level.
It is sincerely hoped by the Fayetteville Public Schools curriculum management audit team that this report will provide the stimulus for the board, the administration, teachers, and community to take stock and come together in a workable consensus. The audit team is optimistic that given proper attention to the areas requiring improvements in the Fayetteville Public Schools, as cited by the curriculum management audit, the expectation of the board and professional staff for increased student achievement for all students will accrue over time. The curriculum management audit will provide direction on how to begin developing that focus and organization that are necessary for increased student learning and work toward closing the achievement gap among students while challenging those who already demonstrate achievement.

Fayetteville Public Schools Audit Report Page 183
VI. APPENDICES

Fayetteville Public Schools Audit Report Page 184

Fayetteville Public Schools Audit Report Page 185
Appendix A
Auditors’ Biographical Data
Audrey A. Hains, Ph. D., Lead Auditor
Audrey Hains is a retired educator living in Florida and serving as a consultant. Formerly, she was a Director of Instructional Planning and Program Evaluation in the Kenosha Unifi ed School District in Kenosha, Wisconsin. Prior to that assignment, Audrey served as a principal of a junior high school, assistant principal of a senior high school, and a principal of several elementary schools in the Kenosha District. Before becoming an administrator, Dr. Hains taught all grade levels from kindergarten through a graduate reading program. She initiated the Gifted and Talented district program and has also served as an adjunct professor
in reading and assessment at Carthage College and the University of WI-Parkside. She received her B.S. in elementary education from Carthage College, M.S. in Curriculum and Instruction with Remedial Reading certifi cation from the University of WI-Milwaukee, and Ph.D. in Educational Leadership from the University of WI-Madison. Dr. Hains received her CMAC audit training in Pueblo, Colorado, in November 1993. She has been recognized in Who’s Who In American Education.
Betty Bates, M.S., Auditor
Betty Bates is an Educational Consultant for staff development and curriculum. Her professional background includes over 30 years experience in Texas public education as a teacher and curriculum facilitator. She is an experienced teacher at the high school and college level. Her experience includes conducting seminars and workshops in professional development and curriculum at the national, state, and local levels. She currently works closely with schools throughout Texas and California in science staff development and curriculum design.
Ms. Bates received a Bachelor of Science degree from Stephen F. Austin, a Master of Science degree from Texas A&M, and has completed specialized post-graduate work in science technology, curriculum development, and advanced science curriculum. She received her Curriculum Auditor training in San Antonio in 2000.
James Ferrell, Ed.D., Auditor
James Ferrell grew up in southwestern Oklahoma and has spent more than 16 years in education as a teacher and an administrator. He earned his Bachelor of Arts degree from Oklahoma City University where he studied American History and Spanish. He earned his Master of Arts degree in history from the University of Central Oklahoma. In 2008, Dr. Ferrell earned his Doctorate of Education degree in School Administration from Oklahoma State University where he studied school desegregation. He is currently working as the middle school principal at Caney Valley School in Ramona, Oklahoma.
James has worked with the College Board as a reader for the U.S. History AP exams and also with the Oklahoma State Department of Education as a reviewer for the end-of-instruction exam in United States History. He has co-authored a study guide for the criterion referenced test in American History for Oklahoma fi fth graders. Dr. Ferrell received his curriculum auditor training in Tucson in 2008.
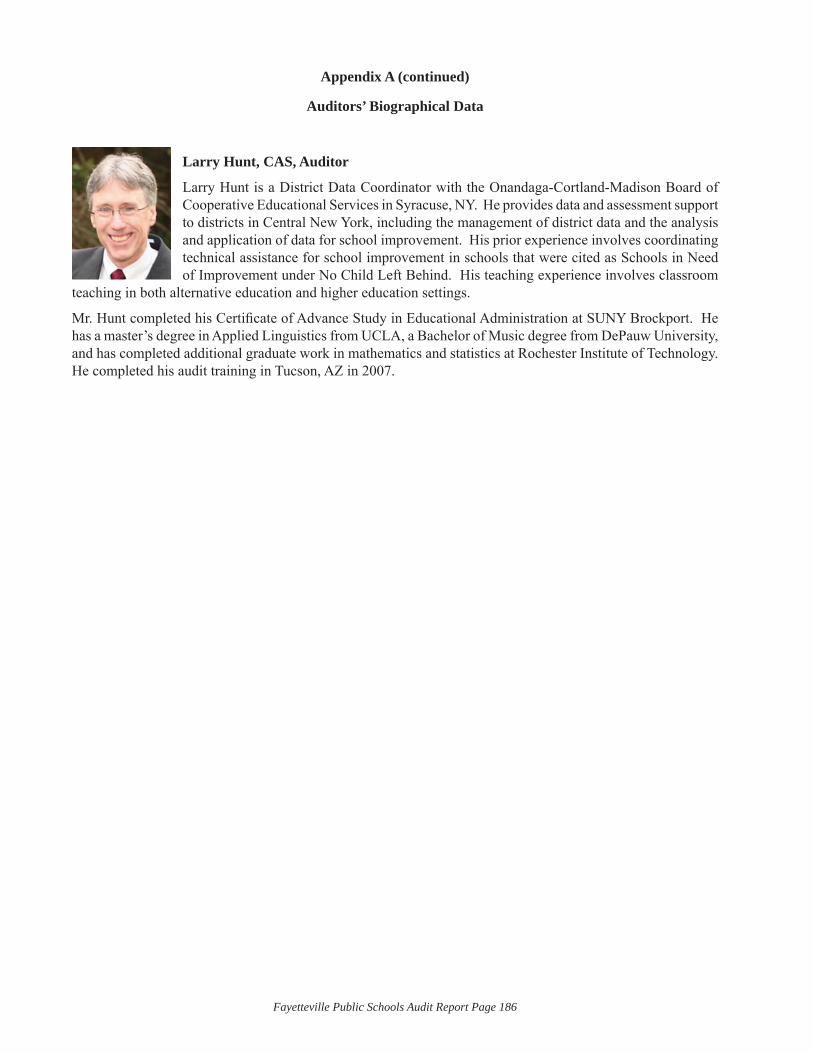
Fayetteville Public Schools Audit Report Page 186
Appendix A (continued)
Auditors’ Biographical Data
Larry Hunt, CAS, Auditor
Larry Hunt is a District Data Coordinator with the Onandaga-Cortland-Madison Board of Cooperative Educational Services in Syracuse, NY. He provides data and assessment support to districts in Central New York, including the management of district data and the analysis and application of data for school improvement. His prior experience involves coordinating technical assistance for school improvement in schools that were cited as Schools in Need of Improvement under No Child Left Behind. His teaching experience involves classroom
teaching in both alternative education and higher education settings.
Mr. Hunt completed his Certifi cate of Advance Study in Educational Administration at SUNY Brockport. He has a master’s degree in Applied Linguistics from UCLA, a Bachelor of Music degree from DePauw University, and has completed additional graduate work in mathematics and statistics at Rochester Institute of Technology. He completed his audit training in Tucson, AZ in 2007.
Fayetteville Public Schools Audit Report Page 187
Appendix B
List of Documents Reviewedby the
Fayetteville Public Schools Audit Teamwww.fayar.ne1. t website
Arkansas State Department of Education website2.
The Annual Report 2007-083.
Executive Summary Financial Report FY 2007-08, FY 2008-094.
District Report Card 20085.
216. st Century Schools Curriculum Design, www.21stcenturyschools.com
School Board – Current Members, Former Members7.
Fayetteville Public Schools: Administration, 20098.
School Summary Information, 20089.
Accreditation Status Report, 2008-0910.
Technology Plan Submission Form, School Years 2009-201211.
Parental Involvement 2009-2010 by District and each school12.
Arkansas Comprehensive School Improvement Plans (ACSIP), 2007-08; 2008-09; 2009-10 by District and each 13. school
School Program Surveys 200914.
Summary Financial Reports, FY2007-08; FY 2008-09; FY 2009-1015.
District, Asbell, and Happy Hollow Schools Calendars, 2009-1016.
District Directory, 2009-1017.
Assessment Dates, 2009-1018.
Special Services Information, 8/4/200919.
Human Relations Handout Items and Evaluation Forms, Dates vary20.
Rules Governing Nutrition and Physical Activity Standards in Arkansas Public Schools, June 9, 200821.
Rules Governing the Code of Ethics for Arkansas Educators, Fines, Guidelines, June 9, 200822.
Tables of Organization, Undated23.
Miscellaneous memos/directives/calendars, dates vary24.
Professional Development Focus, SY 2009-10 with schools’ responses25.
Swap Day Professional Development , undated26.
The ISTE National Educational Technology Standards (NETS.S) and Performance Indicators for Students, 200727.
Technology Integration Specialists Contact and Schedule Information, 8/6/0928.
Profi les for Technology (ICT) Literate Students, 200729.
Individual School Teacher Handbooks, 2009-1030.
GT Program Professional Development Presentation for New Staff and Mini-PD for Returning Staff, Undated31.
GT Connections Newsletters, Dates Vary32.
Staff Development Newsletters from GT Program to Staff Members and Parents, Dates Vary33.
Managing School Emergencies, Undated34.
Collaborative Partnerships, Curriculum, Instruction, Assessment Accountability (CIAA) Team, Undated35.
Fayetteville Public Schools Audit Report Page 188
Assistant Principal Academy notes, Dates Vary36.
Pre-K–12 Literacy Committee Planning Meetings, Dates Vary37.
Balanced Literacy Program for Fayetteville Public Schools PreK–12, 2005 to Current38.
Planning for Success, a Response to Intervention (RTI) Model, Undated39.
Future of Fayetteville High School Select Committee-II Recommendation, April 24, 2008 40.
The Future of Fayetteville High School *Select Committee*, Undated41.
McNair Middle School RTI Process, 2009-1042.
McNair Middle School, Parental Involvement, 2009-1043.
Asbell Elementary Response to Intervention Plan, Undated44.
Asbell Parent Involvement , 200945.
Asbell Elementary 146. st Grade 2009-10 Scope and Sequence
Fayetteville School District Planning for Success Response to Intervention Plan, 2008-0947.
Holt Middle School Commitment to Parental Involvement, 2009-1048.
Holt’s RTI: The Bridge to Student Success, 2009-1049.
Leverett Elementary 2009-10 Parental Involvement Notebook50.
How to Refer a Student to Student Success Team (SST), Undated51.
Ramay Junior High School 2008-09 Literacy and Math Improvement Plan52.
Staff Development Plan GT Program, Undated53.
AP/Pre-AP Departmental Increase/Decrease Data, 2009-1054.
Root Elementary School Parental Involvement Plan, 2009-1055.
Root Elementary School Academic Intervention Plan, 2009-1056.
Root Elementary School Behavior Intervention Plan, 2009-1057.
$10,000,000 Fayetteville School District No. 1 of Washington County, Arkansas, Construction Bonds, July 1, 58. 2009
Facilities and Maintenance Master Plan, February 1, 2008; Volume I & II59.
Leap Ahead video, July 13-30, 200960.
NSPRA’s Communication Audit Report, May 200761.
Special Nutrition Programs, Child & Adult Care Food Program (CACFP), October 6, 200962.
FHS Walker Foundation Grant, Science Department: Technology; Library Labs, Undated63.
Report to the Walton Family Foundation Funding Year 2006-0764.
Arkansas Department of Education Rules, Governing the Arkansas Better Chance Program, 8/2/0765.
SY 08-09 School Professional Development Goals66.
FPS Strategic Communications Action Plan, December 20, 200767.
Gradual Release of Responsibility Framework68.
Technology Inventory by School, November 18, 200969.
Teacher Laptop Survey, 200570.
An Introduction to 2171. st Century Education in Fayetteville Public Schools
U. S. School Districts Honored for Technology Performance72.
Technology Task Force, Undated73.
Benchmark Assessment Info, 74. www.fayar.net, November 2009
[Arkansas State] Assessment Dates, 2009–1075.
Fayetteville Public Schools Audit Report Page 189
Elementary Assessment Plan, (undated)76.
FPS 2008–09 Comprehensive Assessment Plan, Kindergarten Assessments77.
FPS 2008–09 Comprehensive Assessment Plan, First Grade Assessments78.
FPS 2008–09 Comprehensive Assessment Plan, Second Grade Assessments79.
FPS 2008–09 Comprehensive Assessment Plan, Third, Fourth & Fifth Grade Assessments80.
FPS 2009–10 Comprehensive Assessment Plan, Second Grade Assessments81.
FPS 2009–10 Comprehensive Assessment Plan, Third, Fourth & Fifth Grade Assessments82.
Secondary Assessments Currently Being Administered, (undated)83.
Professional Development Assessment Audit, 200984.
Say “Hi!” to Your Color Charts of Student Performance, 200985.
Washington Literacy Performance [PowerPoint], 200986.
Arkansas Department of Education Rules Governing the Arkansas Comprehensive Testing, Assessment and 87. Accountability Program and the Academic Distress Program, 10/9/2006
Data Leadership Team [PowerPoint], October 29-30, 200888.
Butterfi eld Elementary Literacy Performance [PowerPoint], 200989.
Did You Know? (ELL Results) [PowerPoint], 200990.
Happy Hollow Treasure Hunt (pst-it’s about Data!) [PowerPoint], 200991.
Holt MS [PowerPoint], 10/27/200992.
Summary of FPS SAT 10 Performance 2008-2009 [PowerPoint], 10/6/200993.
FPS Literacy Overview [PowerPoint], 200994.
Predicting the Future With Data! [PowerPoint], 200995.
ESI: Education Statistics Investigations [PowerPoint], 200996.
Small Learning Communities: Data Gathering [PowerPoint], 200997.
Fun With Data and Assessment (Seriously!) [PowerPoint], 200998.
Formative Assessment Data Analysis Tool: Guiding Instructional Practice [PowerPoint]99.
Arkansas Public Schools Comprehensive Compliance Monitoring Response, 1/12/2005100.
Professional Development FAQ, (undated)101.
Report to the Walton Family Foundation, Funding Year 0607, 3/27/2008102.
Professional Development Curriculum Audit, 2009103.
GT Summary Evaluation Report to the Board of Education 5 years, 2004-2009104.
Evaluation Report, Gifted and Talented Program, Fayetteville Schools 2007-08, 2008-09105.
Evaluation Report, Gifted and Talented Program, Fayetteville Schools [PowerPoint] 2002-02, 2004-05, 2006-07, 106. 2007-08, 2008-09
[GT] Goal Statements for 2003–2004107.
Program Accreditation Report & Governor’s Advisory Council for Gifted/Talented Education Outstanding Program: 108. 5 Awards, (various dates)
Structure of Intellect Pre/Post Test Results, 2005109.
District Test Data GT Students, 2005, 2006, 2007, 2008, 2009110.
April 2005—Geometry End of Course Exam, Gifted/Talented Students111.
Advanced Placement Exam Results, 1984–2009112.
Reported College Hours Earned by FHS Students From Their AP Exam Courses, 1986–2008113.
Fayetteville Public Schools Audit Report Page 190
Fayetteville Advanced Placement Program [PowerPoint], 2008, 2009114.
Fayetteville Advanced Placement Program, Some Interesting Information [PowerPoint], 2003, 2005, 2006115.
Balanced Literacy Program for Fayetteville Public Schools Pre-K–12, (undated) 116.
AP Course Audit (117. https://apcourseaudit.epiconline.org/school.status.php), 10/26/09
4118. th Math Interim 1 0910 (sample), 11/12/09
Special Services, 2009–2010119.
2009–2010 Reporting Requirements, APSCN Special Education Module120.
FPS Online Curriculum Documents:121.
Science Grade level Curriculum Guides, No Datesa.
Social Studies Curriculum Guides, 2002b.
Fine Arts Assessment Checklist, 2002c.
Library Skills Grade Level Guides, 2003d.
Workforce Education Grade Level Guides, 2006e.
Mathematics Curriculum, No Datesf.
Language Arts Grade Level Guides, 2004g.
FPS Refrigerator Curriculum Guides K-7—Online, No Dates122.
Arkansas Department of Education: Arkansas123.
Curriculum Frameworks, 2009-10124.
FPS High School Career & Academic Planning Guide, 2009-10125.
FPS Junior High Career & Academic Planning Guide, 2008-09126.
Elementary Parents & Student Handbook, 2009-10127.
FPS Website: Staff & Teacher Resources, 2009128.
In District Professional Development Offerings—Website, 2005-2010129.
Out-of-District Professional Development Offerings—Website, 2008-2010130.
FPS Professional Development Website, 2009131.
Campuses Master Schedules, 2009-2010132.
Every Day Math Success Stories, No Date133.
Collaboration Partnership Plan PD, No Date134.
Principal and Assistant Principal Action Agendas, 2008-09135.
ACSIP Meeting Minutes, 2008-09136.
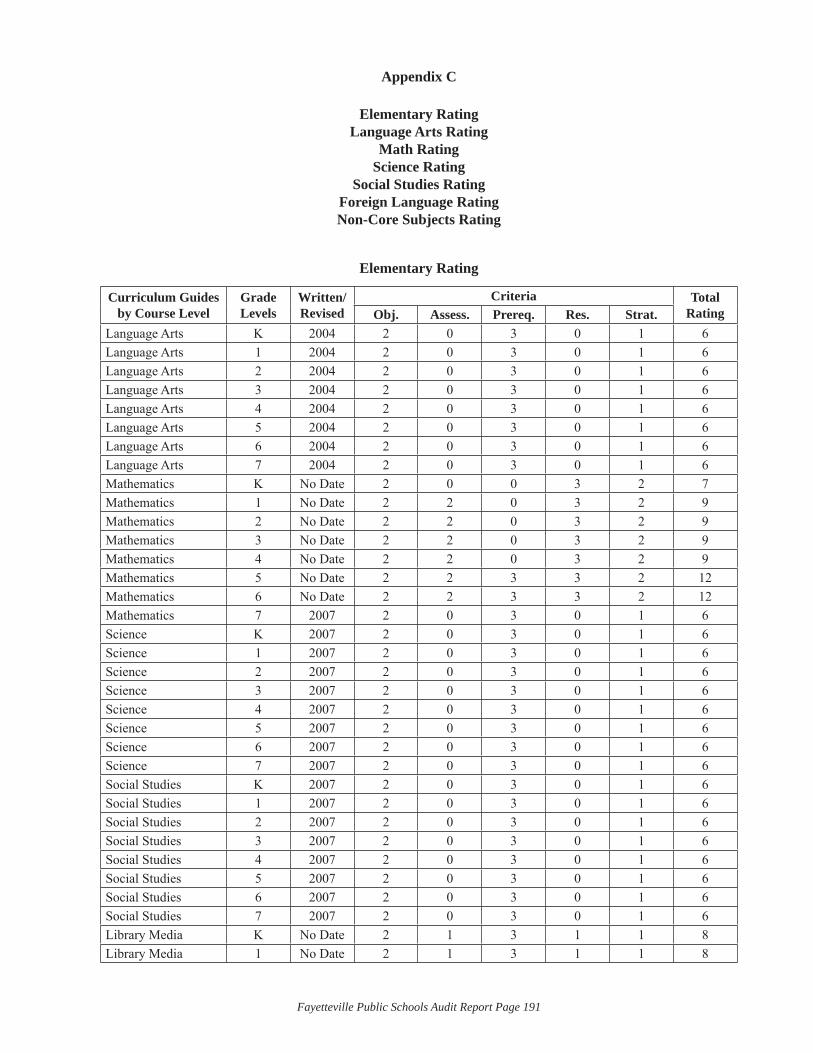
Fayetteville Public Schools Audit Report Page 191
Appendix C
Elementary RatingLanguage Arts Rating
Math RatingScience Rating
Social Studies RatingForeign Language RatingNon-Core Subjects Rating
Elementary Rating
Curriculum Guides by Course Level
Grade Levels
Written/Revised
Criteria Total RatingObj. Assess. Prereq. Res. Strat.
Language Arts K 2004 2 0 3 0 1 6Language Arts 1 2004 2 0 3 0 1 6Language Arts 2 2004 2 0 3 0 1 6Language Arts 3 2004 2 0 3 0 1 6Language Arts 4 2004 2 0 3 0 1 6Language Arts 5 2004 2 0 3 0 1 6Language Arts 6 2004 2 0 3 0 1 6Language Arts 7 2004 2 0 3 0 1 6Mathematics K No Date 2 0 0 3 2 7Mathematics 1 No Date 2 2 0 3 2 9Mathematics 2 No Date 2 2 0 3 2 9Mathematics 3 No Date 2 2 0 3 2 9Mathematics 4 No Date 2 2 0 3 2 9Mathematics 5 No Date 2 2 3 3 2 12Mathematics 6 No Date 2 2 3 3 2 12Mathematics 7 2007 2 0 3 0 1 6Science K 2007 2 0 3 0 1 6Science 1 2007 2 0 3 0 1 6Science 2 2007 2 0 3 0 1 6Science 3 2007 2 0 3 0 1 6Science 4 2007 2 0 3 0 1 6Science 5 2007 2 0 3 0 1 6Science 6 2007 2 0 3 0 1 6Science 7 2007 2 0 3 0 1 6Social Studies K 2007 2 0 3 0 1 6Social Studies 1 2007 2 0 3 0 1 6Social Studies 2 2007 2 0 3 0 1 6Social Studies 3 2007 2 0 3 0 1 6Social Studies 4 2007 2 0 3 0 1 6Social Studies 5 2007 2 0 3 0 1 6Social Studies 6 2007 2 0 3 0 1 6Social Studies 7 2007 2 0 3 0 1 6Library Media K No Date 2 1 3 1 1 8Library Media 1 No Date 2 1 3 1 1 8
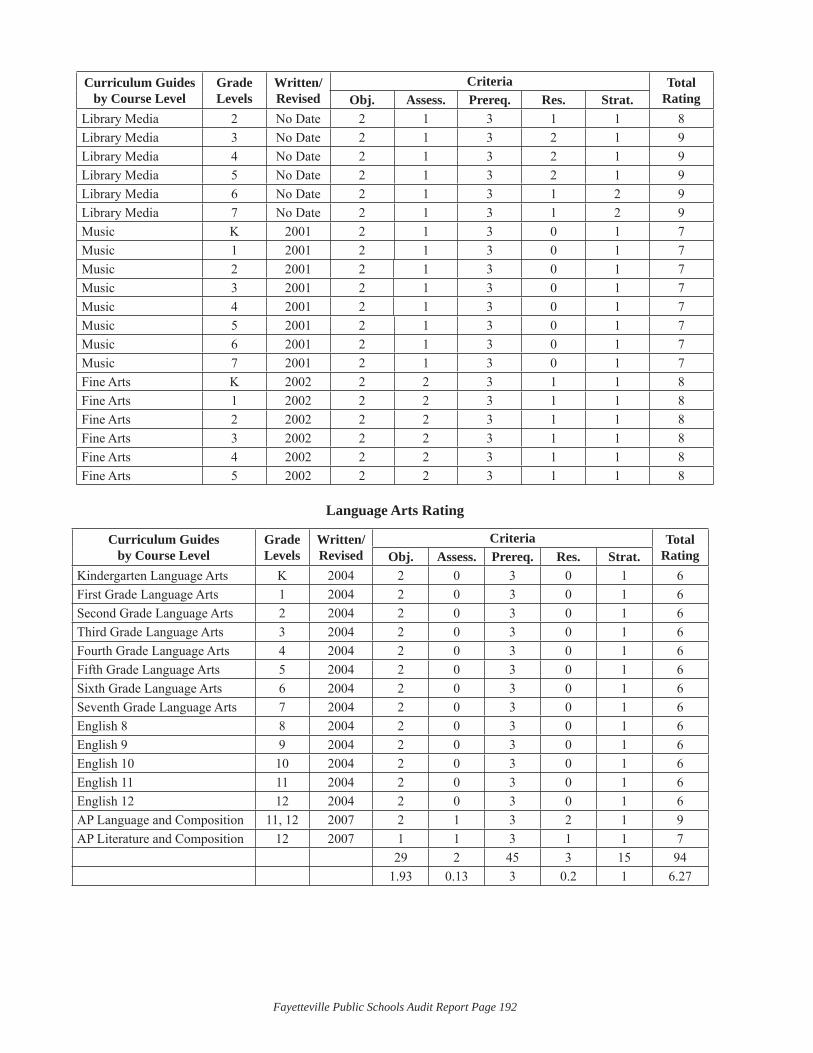
Fayetteville Public Schools Audit Report Page 192
Curriculum Guides by Course Level
Grade Levels
Written/Revised
Criteria Total RatingObj. Assess. Prereq. Res. Strat.
Library Media 2 No Date 2 1 3 1 1 8Library Media 3 No Date 2 1 3 2 1 9Library Media 4 No Date 2 1 3 2 1 9Library Media 5 No Date 2 1 3 2 1 9Library Media 6 No Date 2 1 3 1 2 9Library Media 7 No Date 2 1 3 1 2 9Music K 2001 2 1 3 0 1 7Music 1 2001 2 1 3 0 1 7Music 2 2001 2 1 3 0 1 7Music 3 2001 2 1 3 0 1 7Music 4 2001 2 1 3 0 1 7Music 5 2001 2 1 3 0 1 7Music 6 2001 2 1 3 0 1 7Music 7 2001 2 1 3 0 1 7Fine Arts K 2002 2 2 3 1 1 8Fine Arts 1 2002 2 2 3 1 1 8Fine Arts 2 2002 2 2 3 1 1 8Fine Arts 3 2002 2 2 3 1 1 8Fine Arts 4 2002 2 2 3 1 1 8Fine Arts 5 2002 2 2 3 1 1 8
Language Arts Rating
Curriculum Guides by Course Level
Grade Levels
Written/Revised
Criteria Total RatingObj. Assess. Prereq. Res. Strat.
Kindergarten Language Arts K 2004 2 0 3 0 1 6First Grade Language Arts 1 2004 2 0 3 0 1 6Second Grade Language Arts 2 2004 2 0 3 0 1 6Third Grade Language Arts 3 2004 2 0 3 0 1 6Fourth Grade Language Arts 4 2004 2 0 3 0 1 6Fifth Grade Language Arts 5 2004 2 0 3 0 1 6Sixth Grade Language Arts 6 2004 2 0 3 0 1 6Seventh Grade Language Arts 7 2004 2 0 3 0 1 6English 8 8 2004 2 0 3 0 1 6English 9 9 2004 2 0 3 0 1 6English 10 10 2004 2 0 3 0 1 6English 11 11 2004 2 0 3 0 1 6English 12 12 2004 2 0 3 0 1 6AP Language and Composition 11, 12 2007 2 1 3 2 1 9AP Literature and Composition 12 2007 1 1 3 1 1 7
29 2 45 3 15 941.93 0.13 3 0.2 1 6.27
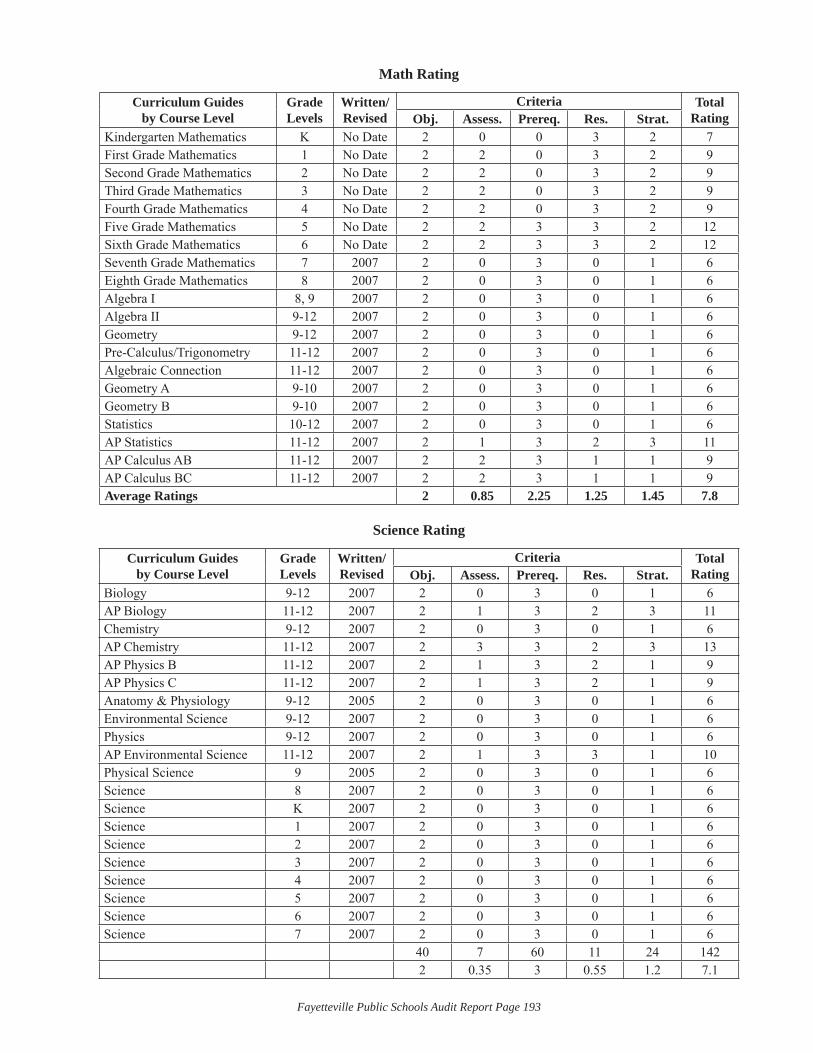
Fayetteville Public Schools Audit Report Page 193
Math Rating
Curriculum Guides by Course Level
Grade Levels
Written/Revised
Criteria Total RatingObj. Assess. Prereq. Res. Strat.
Kindergarten Mathematics K No Date 2 0 0 3 2 7First Grade Mathematics 1 No Date 2 2 0 3 2 9Second Grade Mathematics 2 No Date 2 2 0 3 2 9Third Grade Mathematics 3 No Date 2 2 0 3 2 9Fourth Grade Mathematics 4 No Date 2 2 0 3 2 9Five Grade Mathematics 5 No Date 2 2 3 3 2 12Sixth Grade Mathematics 6 No Date 2 2 3 3 2 12Seventh Grade Mathematics 7 2007 2 0 3 0 1 6Eighth Grade Mathematics 8 2007 2 0 3 0 1 6Algebra I 8, 9 2007 2 0 3 0 1 6Algebra II 9-12 2007 2 0 3 0 1 6Geometry 9-12 2007 2 0 3 0 1 6Pre-Calculus/Trigonometry 11-12 2007 2 0 3 0 1 6Algebraic Connection 11-12 2007 2 0 3 0 1 6Geometry A 9-10 2007 2 0 3 0 1 6Geometry B 9-10 2007 2 0 3 0 1 6Statistics 10-12 2007 2 0 3 0 1 6AP Statistics 11-12 2007 2 1 3 2 3 11AP Calculus AB 11-12 2007 2 2 3 1 1 9AP Calculus BC 11-12 2007 2 2 3 1 1 9Average Ratings 2 0.85 2.25 1.25 1.45 7.8
Science Rating
Curriculum Guides by Course Level
Grade Levels
Written/Revised
Criteria Total RatingObj. Assess. Prereq. Res. Strat.
Biology 9-12 2007 2 0 3 0 1 6AP Biology 11-12 2007 2 1 3 2 3 11Chemistry 9-12 2007 2 0 3 0 1 6AP Chemistry 11-12 2007 2 3 3 2 3 13AP Physics B 11-12 2007 2 1 3 2 1 9AP Physics C 11-12 2007 2 1 3 2 1 9Anatomy & Physiology 9-12 2005 2 0 3 0 1 6Environmental Science 9-12 2007 2 0 3 0 1 6Physics 9-12 2007 2 0 3 0 1 6AP Environmental Science 11-12 2007 2 1 3 3 1 10Physical Science 9 2005 2 0 3 0 1 6Science 8 2007 2 0 3 0 1 6Science K 2007 2 0 3 0 1 6Science 1 2007 2 0 3 0 1 6Science 2 2007 2 0 3 0 1 6Science 3 2007 2 0 3 0 1 6Science 4 2007 2 0 3 0 1 6Science 5 2007 2 0 3 0 1 6Science 6 2007 2 0 3 0 1 6Science 7 2007 2 0 3 0 1 6
40 7 60 11 24 1422 0.35 3 0.55 1.2 7.1
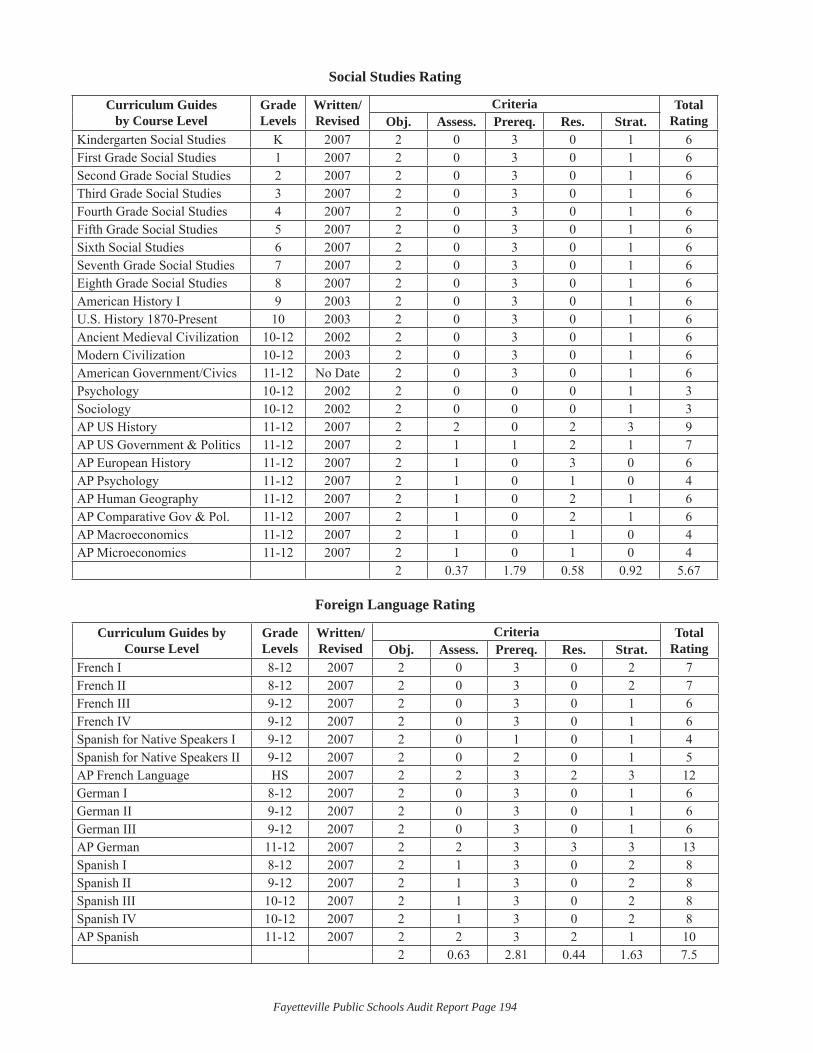
Fayetteville Public Schools Audit Report Page 194
Social Studies Rating
Curriculum Guides by Course Level
Grade Levels
Written/Revised
Criteria Total RatingObj. Assess. Prereq. Res. Strat.
Kindergarten Social Studies K 2007 2 0 3 0 1 6First Grade Social Studies 1 2007 2 0 3 0 1 6Second Grade Social Studies 2 2007 2 0 3 0 1 6Third Grade Social Studies 3 2007 2 0 3 0 1 6Fourth Grade Social Studies 4 2007 2 0 3 0 1 6Fifth Grade Social Studies 5 2007 2 0 3 0 1 6Sixth Social Studies 6 2007 2 0 3 0 1 6Seventh Grade Social Studies 7 2007 2 0 3 0 1 6Eighth Grade Social Studies 8 2007 2 0 3 0 1 6American History I 9 2003 2 0 3 0 1 6U.S. History 1870-Present 10 2003 2 0 3 0 1 6Ancient Medieval Civilization 10-12 2002 2 0 3 0 1 6Modern Civilization 10-12 2003 2 0 3 0 1 6American Government/Civics 11-12 No Date 2 0 3 0 1 6Psychology 10-12 2002 2 0 0 0 1 3Sociology 10-12 2002 2 0 0 0 1 3AP US History 11-12 2007 2 2 0 2 3 9AP US Government & Politics 11-12 2007 2 1 1 2 1 7AP European History 11-12 2007 2 1 0 3 0 6AP Psychology 11-12 2007 2 1 0 1 0 4AP Human Geography 11-12 2007 2 1 0 2 1 6AP Comparative Gov & Pol. 11-12 2007 2 1 0 2 1 6AP Macroeconomics 11-12 2007 2 1 0 1 0 4AP Microeconomics 11-12 2007 2 1 0 1 0 4
2 0.37 1.79 0.58 0.92 5.67
Foreign Language Rating
Curriculum Guides by Course Level
Grade Levels
Written/Revised
Criteria Total RatingObj. Assess. Prereq. Res. Strat.
French I 8-12 2007 2 0 3 0 2 7French II 8-12 2007 2 0 3 0 2 7French III 9-12 2007 2 0 3 0 1 6French IV 9-12 2007 2 0 3 0 1 6Spanish for Native Speakers I 9-12 2007 2 0 1 0 1 4Spanish for Native Speakers II 9-12 2007 2 0 2 0 1 5AP French Language HS 2007 2 2 3 2 3 12German I 8-12 2007 2 0 3 0 1 6German II 9-12 2007 2 0 3 0 1 6German III 9-12 2007 2 0 3 0 1 6AP German 11-12 2007 2 2 3 3 3 13Spanish I 8-12 2007 2 1 3 0 2 8Spanish II 9-12 2007 2 1 3 0 2 8Spanish III 10-12 2007 2 1 3 0 2 8Spanish IV 10-12 2007 2 1 3 0 2 8AP Spanish 11-12 2007 2 2 3 2 1 10
2 0.63 2.81 0.44 1.63 7.5
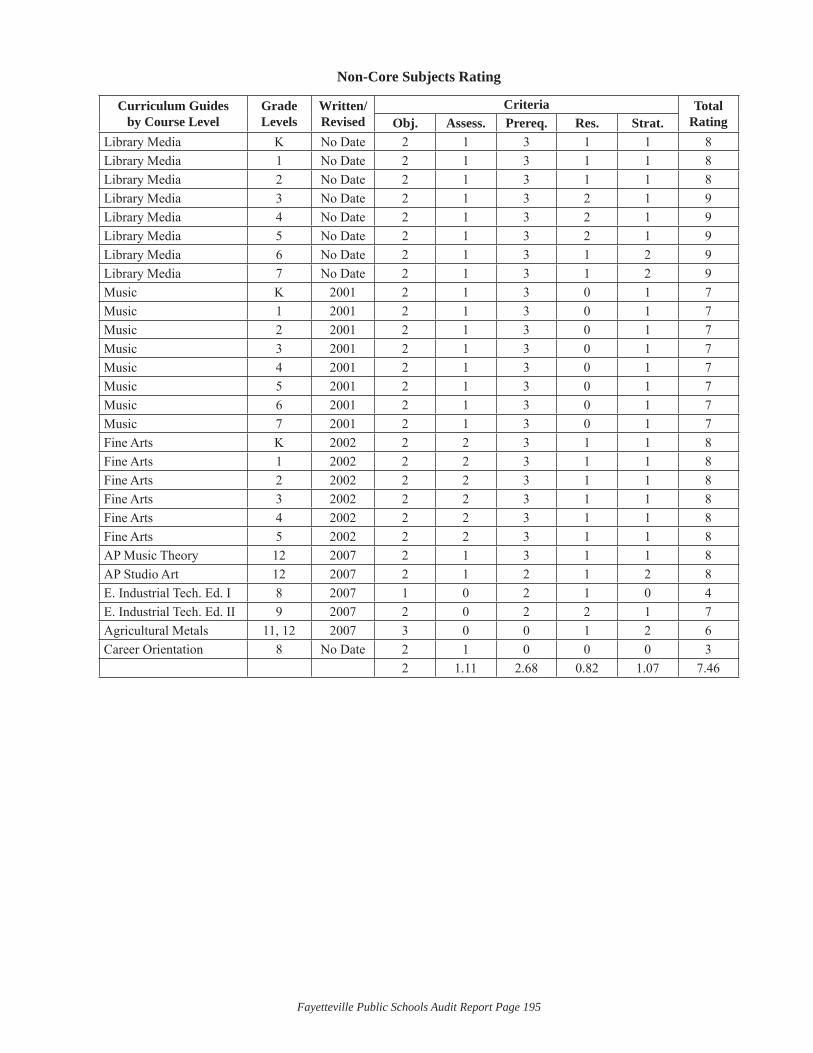
Fayetteville Public Schools Audit Report Page 195
Non-Core Subjects Rating
Curriculum Guides by Course Level
Grade Levels
Written/Revised
Criteria Total RatingObj. Assess. Prereq. Res. Strat.
Library Media K No Date 2 1 3 1 1 8Library Media 1 No Date 2 1 3 1 1 8Library Media 2 No Date 2 1 3 1 1 8Library Media 3 No Date 2 1 3 2 1 9Library Media 4 No Date 2 1 3 2 1 9Library Media 5 No Date 2 1 3 2 1 9Library Media 6 No Date 2 1 3 1 2 9Library Media 7 No Date 2 1 3 1 2 9Music K 2001 2 1 3 0 1 7Music 1 2001 2 1 3 0 1 7Music 2 2001 2 1 3 0 1 7Music 3 2001 2 1 3 0 1 7Music 4 2001 2 1 3 0 1 7Music 5 2001 2 1 3 0 1 7Music 6 2001 2 1 3 0 1 7Music 7 2001 2 1 3 0 1 7Fine Arts K 2002 2 2 3 1 1 8Fine Arts 1 2002 2 2 3 1 1 8Fine Arts 2 2002 2 2 3 1 1 8Fine Arts 3 2002 2 2 3 1 1 8Fine Arts 4 2002 2 2 3 1 1 8Fine Arts 5 2002 2 2 3 1 1 8AP Music Theory 12 2007 2 1 3 1 1 8AP Studio Art 12 2007 2 1 2 1 2 8E. Industrial Tech. Ed. I 8 2007 1 0 2 1 0 4E. Industrial Tech. Ed. II 9 2007 2 0 2 2 1 7Agricultural Metals 11, 12 2007 3 0 0 1 2 6Career Orientation 8 No Date 2 1 0 0 0 3
2 1.11 2.68 0.82 1.07 7.46